evaluating mitigation options of nitrous oxide … · evaluating mitigation options of nitrous...
TRANSCRIPT
Evaluating Mitigation Options of Nitrous Oxide Emissions in
California Cropping Systems
FINAL REPORT
California Air Resources Board, Contract No. 11-313
Principal Investigators: Martin Burger
William Horwath Johan Six
Prepared for: California Air Resources Board
Prepared by: Martin Burger and Hannah Waterhouse Dept. of Land, Air & Water Resources
University of California, Davis One Shields Avenue Davis, CA 95616 (530) 754-6029
January 7, 2016

ii
Disclaimer
The statements and conclusions in this Report are those of the contractor and not necessarily those of the California Air Resources Board. The mention of commercial
products, their source, or their use in connection with material reported herein is not to be construed as actual or implied endorsement of such products.

iii
Acknowledgements We would like to thank Marc Los Huertos, Pam Krone-Davis, Stefanie Kortman, Taryn Kennedy, Julian Herzsage, Garret Heinz, Lisa Malm, Timothy A. Doane, Alia Tsang, Mirna Albarran-Jack, Ria DeBiase, Emily Hodson, Jordon Wade, Bibiana Molinos, Brian Christopher De la Cruz, Israel Herrera, Jim Jackson, and three growers in Sacramento and San Joaquin Valleys, as well as a grower in the Salinas Valley for contributing their time, efforts, equipment, and land to make this study possible.
This Report was submitted in fulfillment of ARB Contract No. 11-313 Evaluating Mitigation Options of Nitrous Oxide Emissions in California Cropping Systems by the University of California, Davis, under the sponsorship of the California Air Resources Board. Work was completed as of April 4, 2015.

iv
Evaluating Mitigation Options of Nitrous Oxide Emissions in California Cropping Systems Table of contents
Section Page List of Figures v List of Tables vii Abstract ix Glossary x Executive Summary xii 1. Introduction 1 2. Materials and Methods 3 2.1. Tomato 3 2.1.1. Tomato field sites 3 2.1.2. Tomato field operations and N fertilizer applications 3 2.1.3 Nitrous oxide flux measurements in tomato systems 5 2.1.4. Cumulative seasonal and annual N2O emissions 7 2.1.5. Global warming potential of tomato systems 7 2.2. Corn 8 2.2.1. Corn field sites 8 2.2.2. Corn field operations and N fertilizer applications 8 2.2.3. Nitrous oxide measurements in corns systems 10 2.3. Lettuce 12 2.3.1. Lettuce field sites 12 2.3.2. Lettuce field operations and N fertilizer applications 12 2.3.3. Nitrous oxide measurements in lettuce systems 12 2.4. Environmental variables: Soil moisture, inorganic N, temperature 13 2.5. Crop yields and N use efficiencies 14 2.5.1. Tomato 14 2.5.2. Corn 14 2.6. Statistical analyses 15 3. Results and Discussion 18 3.1. Tomato 18 3.2. Corn 35 3.3. Lettuce 65 4. Summary and Conclusions 73 5. Recommendations, Economics 76 6. References 77

v
List of Figures
1. Daily N2O flux in the control treatment in subsurface drip irrigated tomato system 2012-13.
2. Daily N2O flux in the nitrification inhibitor treatment in subsurface drip irrigated tomato system 2012-13.
3. Daily N2O flux in the control and nitrification inhibitor treatments in subsurface drip irrigated tomato system 2013-14.
4. Water filled pore space in the 0-15 cm layer in the control and nitrification inhibitor treatments in subsurface drip irrigated tomato system 2012-13.
5. Water-filled pore space in the 0-30 cm layer in subsurface drip irrigated tomato system 2013-14.
6. Soil ammonium in the 0-15 cm layer in control and nitrification inhibitor treatments in subsurface drip irrigated tomato system 2012-13.
7. Soil nitrate in the 0-15 cm layer in control and nitrification inhibitor treatments in subsurface drip irrigated tomato system 2012-13.
8. Soil ammonium 0-30 cm layer in control and nitrification inhibitor treatments in subsurface drip irrigated tomato system 2013-14.
9. Soil nitrate 0-30 cm layer in control and nitrification inhibitor treatments in subsurface drip irrigated tomato system 2013-14.
10. Daily N2O flux in organically managed furrow-irrigated tomato system 2012-13.
11. Daily N2O flux in organically managed furrow-irrigated tomato system 2013-14.
12. N2O emissions during growing and post-harvest seasons and whole year in SDI tomato with and without nitrification inhibitor and in the furrow-irrigated organic system.
13. Water filled pore space in the organic tomato system 2012-13.
14. Soil ammonium and nitrate in the organic tomato system 2012-13.
15. Water filled pore space in the organic tomato system 2013-14.
16. Soil ammonium and nitrate in the 0-15 cm layer in the organic tomato system 2013-14.
17. Daily N2O flux in control, and in calcium nitrate, and urea ammonium nitrate fertilized corn systems 2012.
18. Daily N2O flux in aqua ammonia, aqua ammonia + G77 nitrification inhibitor, urea ammonium nitrate (UAN), UAN + AgrotainPlus and UAN + G77 nitrification inhibitor treatments in corn systems 2012.
19. Total cumulative N2O emissions in aqua ammonia, aqua ammonia + G77, urea ammonium nitrate (UAN), UAN + G77, UAN +AgrotainPlus, calcium nitrate, and control treatments in corn system 2012.

vi
20. Cumulative N2O emissions in the N fertilizer treatments in corn system 2012.
21. Water filled pore space in corn experiment 2012.
22. Soil ammonium and nitrate in the 0-15 cm layer of the beds in the aqua ammonia and aqua ammonia + G77 treatments in corn system 2012.
23. Soil ammonium and nitrate in the 0-15 cm layer of the beds in the urea ammonium nitrate (UAN), UAN + G77, and UAN + AgrotainPlus treatments in corn system 2012.
24. Soil ammonium and nitrate in the 0-15 cm layer of the beds in control, calcium nitrate, and UAN treatments in corn systems 2012.
25. Soil nitrate in the 0-15 cm layer in the furrows in the different fertilizer treatments in the corn experiment 2012.
26. Corn N uptake in the different fertilizer treatments in corn system 2012.
27. Daily N2O flux in control, one band, high N rate, nitrification inhibitor, 2 band, and subsurface drip irrigation treatments in corn 2013.
28. Daily post-harvest N2O flux in control, one band, high N rate, nitrification inhibitor, two band, and subsurface drip irrigation treatments in corn system in 2013-14.
29. Annual N2O emissions in control, one band, high N rate, nitrification inhibitor, two band, and subsurface drip irrigation treatments in corn systems 2013-14.
30. Daily N2O flux in one band bed, one band shoulder, two band, nitrification inhibitor, subsurface drip irrigation, and high N rate treatments in corn systems 2014.
31. Annual N2O emissions in one band bed, one band shoulder, high N rate, two band, nitrification inhibitor, and subsurface drip irrigation treatments in corn system 2014.
32. Cumulative N2O emissions in the different treatments in corn system 2013.
33. Cumulative N2O emissions in the different treatments in corn system 2014.
34. Weighted seasonal N2O emissions by chamber location in corn system 2013.
35. Water filled pore space in furrow and subsurface drip irrigated corn systems in 2013-14.
36. Soil ammonium and nitrate in the 0-15 cm layer of the beds in corn system 2013-14.
37. Soil ammonium and nitrate concentrations in the 0-15 cm layer in the furrows in corn system 2013-14.
38. Soil water filled pore space at 8 cm depth in furrow and at 15 cm depth in subsurface drip irrigated corn system 2014-15.
39. Soil ammonium in 0-15 cm layer of the beds in fertilizer placement and nitrification inhibitor treatments in corn system 2014.
vii
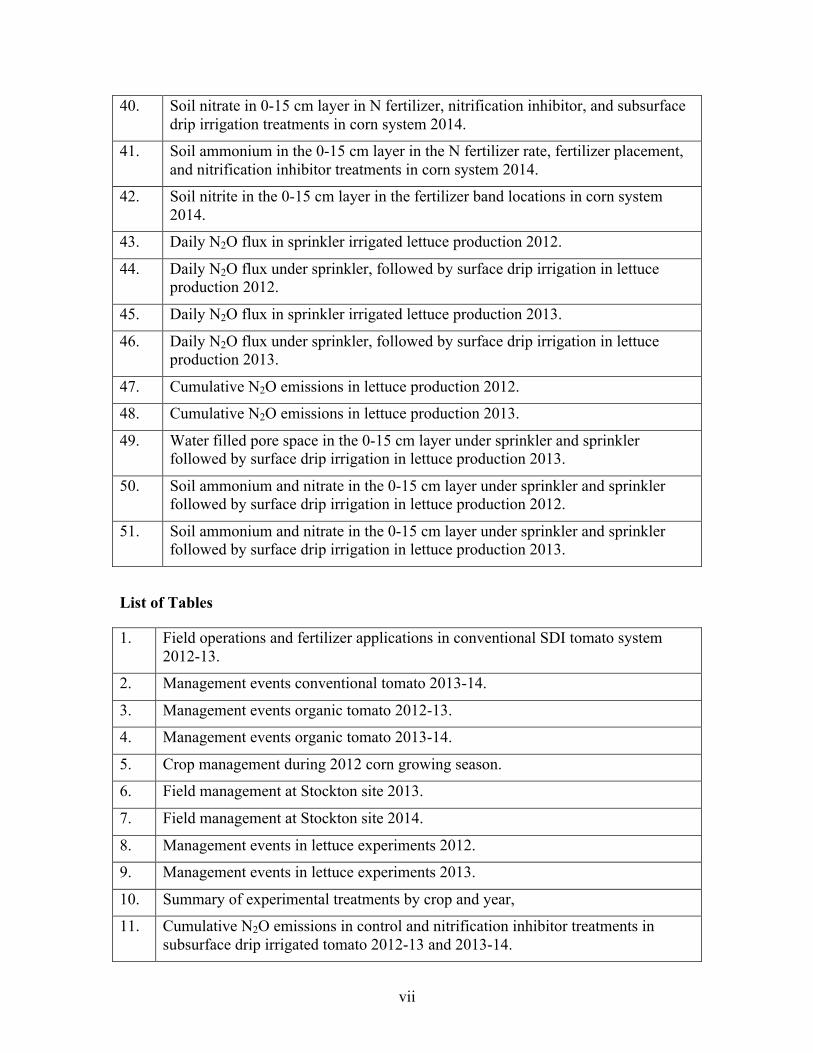
40. Soil nitrate in 0-15 cm layer in N fertilizer, nitrification inhibitor, and subsurface drip irrigation treatments in corn system 2014.
41. Soil ammonium in the 0-15 cm layer in the N fertilizer rate, fertilizer placement, and nitrification inhibitor treatments in corn system 2014.
42. Soil nitrite in the 0-15 cm layer in the fertilizer band locations in corn system 2014.
43. Daily N2O flux in sprinkler irrigated lettuce production 2012.
44. Daily N2O flux under sprinkler, followed by surface drip irrigation in lettuce production 2012.
45. Daily N2O flux in sprinkler irrigated lettuce production 2013.
46. Daily N2O flux under sprinkler, followed by surface drip irrigation in lettuce production 2013.
47. Cumulative N2O emissions in lettuce production 2012.
48. Cumulative N2O emissions in lettuce production 2013.
49. Water filled pore space in the 0-15 cm layer under sprinkler and sprinkler followed by surface drip irrigation in lettuce production 2013.
50. Soil ammonium and nitrate in the 0-15 cm layer under sprinkler and sprinkler followed by surface drip irrigation in lettuce production 2012.
51. Soil ammonium and nitrate in the 0-15 cm layer under sprinkler and sprinkler followed by surface drip irrigation in lettuce production 2013.
List of Tables
1. Field operations and fertilizer applications in conventional SDI tomato system 2012-13.
2. Management events conventional tomato 2013-14.
3. Management events organic tomato 2012-13.
4. Management events organic tomato 2013-14.
5. Crop management during 2012 corn growing season.
6. Field management at Stockton site 2013.
7. Field management at Stockton site 2014.
8. Management events in lettuce experiments 2012.
9. Management events in lettuce experiments 2013.
10. Summary of experimental treatments by crop and year,
11. Cumulative N2O emissions in control and nitrification inhibitor treatments in subsurface drip irrigated tomato 2012-13 and 2013-14.
viii
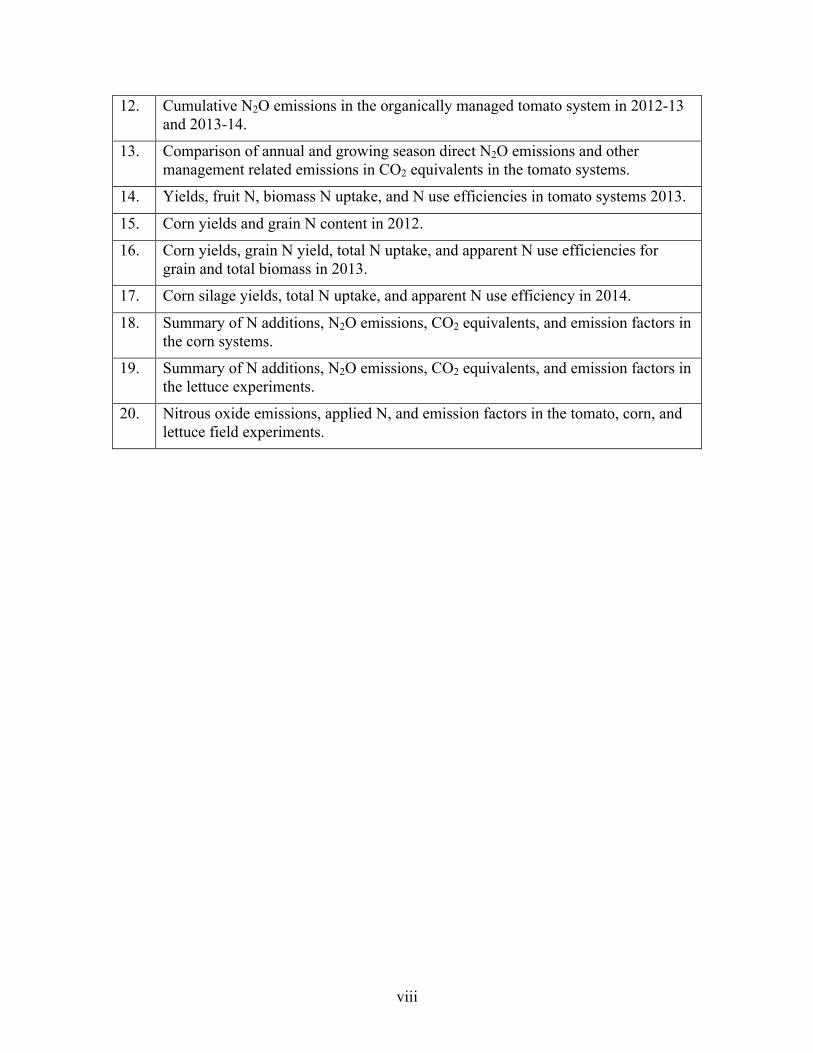
12. Cumulative N2O emissions in the organically managed tomato system in 2012-13 and 2013-14.
13. Comparison of annual and growing season direct N2O emissions and other management related emissions in CO2 equivalents in the tomato systems.
14. Yields, fruit N, biomass N uptake, and N use efficiencies in tomato systems 2013.
15. Corn yields and grain N content in 2012.
16. Corn yields, grain N yield, total N uptake, and apparent N use efficiencies for grain and total biomass in 2013.
17. Corn silage yields, total N uptake, and apparent N use efficiency in 2014.
18. Summary of N additions, N2O emissions, CO2 equivalents, and emission factors in the corn systems.
19. Summary of N additions, N2O emissions, CO2 equivalents, and emission factors in the lettuce experiments.
20. Nitrous oxide emissions, applied N, and emission factors in the tomato, corn, and lettuce field experiments.
ix
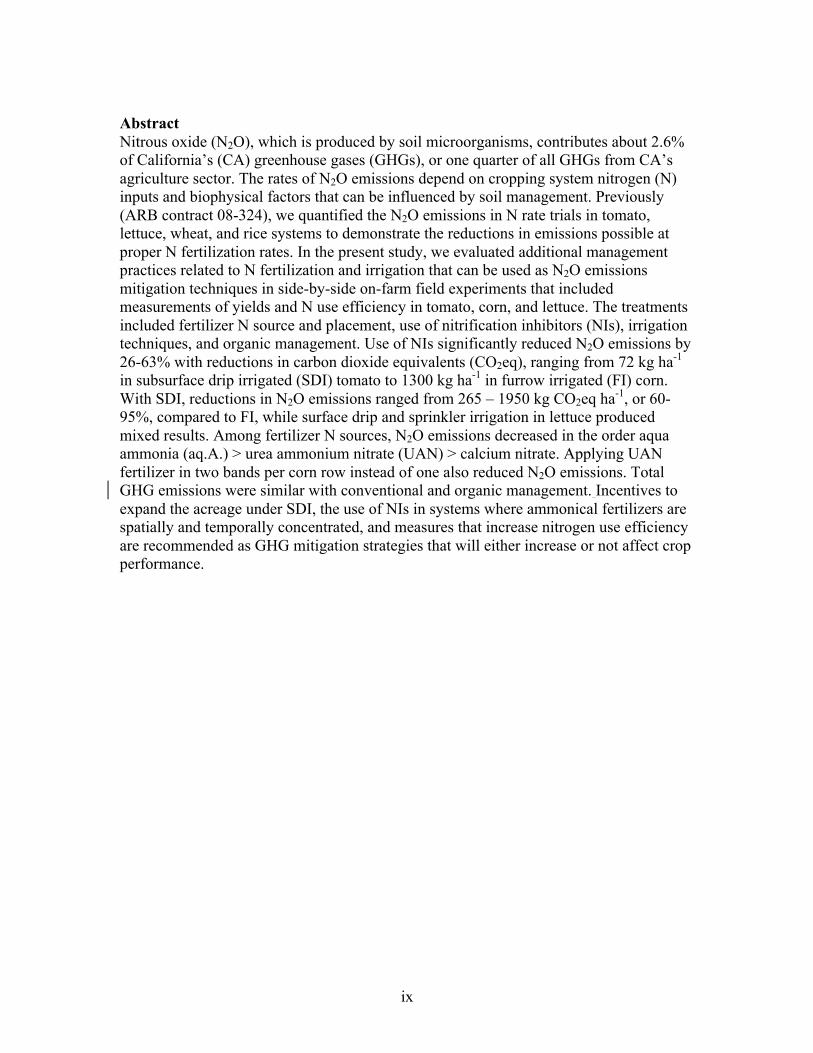
Abstract Nitrous oxide (N2O), which is produced by soil microorganisms, contributes about 2.6% of California’s (CA) greenhouse gases (GHGs), or one quarter of all GHGs from CA’s agriculture sector. The rates of N2O emissions depend on cropping system nitrogen (N) inputs and biophysical factors that can be influenced by soil management. Previously (ARB contract 08-324), we quantified the N2O emissions in N rate trials in tomato, lettuce, wheat, and rice systems to demonstrate the reductions in emissions possible at proper N fertilization rates. In the present study, we evaluated additional management practices related to N fertilization and irrigation that can be used as N2O emissions mitigation techniques in side-by-side on-farm field experiments that included measurements of yields and N use efficiency in tomato, corn, and lettuce. The treatments included fertilizer N source and placement, use of nitrification inhibitors (NIs), irrigation techniques, and organic management. Use of NIs significantly reduced N2O emissions by 26-63% with reductions in carbon dioxide equivalents (CO2eq), ranging from 72 kg ha-1 in subsurface drip irrigated (SDI) tomato to 1300 kg ha-1 in furrow irrigated (FI) corn. With SDI, reductions in N2O emissions ranged from 265 – 1950 kg CO2eq ha-1, or 60-95%, compared to FI, while surface drip and sprinkler irrigation in lettuce produced mixed results. Among fertilizer N sources, N2O emissions decreased in the order aqua ammonia (aq.A.) > urea ammonium nitrate (UAN) > calcium nitrate. Applying UAN fertilizer in two bands per corn row instead of one also reduced N2O emissions. Total GHG emissions were similar with conventional and organic management. Incentives to expand the acreage under SDI, the use of NIs in systems where ammonical fertilizers are spatially and temporally concentrated, and measures that increase nitrogen use efficiency are recommended as GHG mitigation strategies that will either increase or not affect crop performance.
x
Glossary of Terms, Abbreviations and Symbols
A area
ANOVA Analysis of variance
°C Degree(s) Celsius
CA California
CARB California Air Resources Board
CDFA California Department of Food & Agriculture
cm centimeter
CO2 Carbon dioxide
CO2eq. Carbon dioxide equivalents
d day(s)
DCD dicyandiamide
ECD Electron capture detector (in gas chromatographs)
FI Furrow irrigation
G77 Reacted dicyandiamide and N-(n-butyl)-thiophosphoric triamide
GC Gas chromatograph
GHG Greenhouse gas
GWP Global warming potential, positive radiative forcing
h hour(s)
ha hectare
IPCC Inter-governmental panel of climate change
kg kilogram
kPa kilo Pascal
m meter
Mg Megagram, 1x10⁶ grams, 1000 kilograms, metric tonne
min Minute(s)
mm millimeter
N Nitrogen
N North
n number of experimental units
Ni63 Nickel63 (radioactive)

xi
NH4+ Ammonium
NI Nitrification inhibitor
NO3- Nitrate
NO2- Nitrite
N2O Nitrous oxide
NUE Nitrogen use efficiency
O2 Oxygen
P5 Mixture of 95% argon and 5% methane used as carrier gas in gas chromatographs
PVC Poly-vinyl chloride
SDI Subsurface drip irrigation
t time
Tg Teragram, 1x10¹² gram, million metric tonne
U Urea
UAN Urea ammonium-nitrate
UK United Kingdom
USEPA United States Environmental Protection Agency
V volume
V4 Corn vegetative growth stage with four leaf collars visible
V8 Corn vegetative growth stage with eight leaf collars visible
W West
WFPS Water-filled pore space

xii
Executive Summary Background Nitrous oxide is produced by soil microorganisms or chemical processes as by-product of various nitrogen (N) transformation reactions. Emissions of N2O account for about one quarter of CA’s greenhouse gases (GHG) from agriculture or 2.6% of CA’s entire GHG budget (CARB 2014). Rates of N2O emissions depend on the quantity and forms of applied N, soil moisture, carbon, and oxygen levels and other biophysical factors. Therefore, soil N and irrigation management can potentially lower N2O emissions, and thus, the GHG impact of agriculture. During the past 5 years, estimates of N2O emissions from 10 major CA cropping systems have been obtained (Garland et al., 2011; Schellenberg et al., 2012; Burger et al., 2013; Kennedy et al., 2013; Garland et al., 2014; Verhoeven and Six, 2014). These studies included N rate trials in tomato, lettuce, wheat, and rice (Burger and Horwath, 2012; Zhu-Barker et al., 2015), comparisons between subsurface drip irrigated (SDI) and furrow irrigated (FI) systems (Kallenbach et al., 2010; Kennedy et al., 2013) and fertilizer N sources (Schellenberg et al., 2012). The present research built on the previous CA studies as well as recent insights on N2O production pathways and results of field studies in the U.S. and elsewhere, with the goal of identifying adoptable management practices that reduce N2O emissions. The results can potentially be used to calibrate and validate biogeochemical models in order to estimate the N2O mitigation potential of specific practices in a variety of cropping systems. The present research also represents a step towards identifying N2O emission mitigating practices that can be incentivized to spur adoption by growers. Methods In tomato, we compared N2O emissions in SDI fields that received either a nitrification inhibitor along with N fertilizer or only the fertilizer during two years. Simultaneously, N2O emissions were monitored in an organically managed FI field. The effect of nitrification inhibitors on N2O emissions were also tested during one corn growing season at a FI UC Davis site and for two years in FI commercial fields near Stockton. At the UCD site, we also compared N2O emissions with different N sources including aqua ammonia, urea ammonium nitrate (UAN), calcium nitrate. At the Stockton site, the effects of injecting UAN fertilizer on either side or both sides of each corn row on N2O emissions were studied, and furthermore, N2O emissions with SDI and FI were compared. The effects of sprinkler irrigation and a combination of sprinkler & surface drip irrigation on N2O emissions were assessed in lettuce fields near Soledad, CA.
Nitrous oxide emissions were intensively measured for several days following management events, such as fertilization and irrigation, and less frequently under dry conditions. The measurements were made by placing a vented chamber on the soil surface and sampling headspace at regular, timed intervals. The air samples were analyzed by gas chromatography and the flux of N2O was calculated from the change in N2O concentration over time. The seasonal and annual N2O emissions were calculated by converting the measured fluxes to daily fluxes and interpolating between daily fluxes. Yields and tissue N values were used to calculate N uptake. To compare total GHG emissions in the organic and conventional tomato production systems, the N2O emissions and energy expended for crop management were converted to CO2 equivalents using a factor of 298 (IPCC, 2007).

xiii
Results During three corn growing seasons, use of the nitrification inhibitor (NI) dicyandiamide lowered N2O emissions 60, 0, and 63% or 287 (2012), 5 (2013), and 1300 kg CO2 ha-1 (2014) compared to control treatments (Figure I). The lack of a response in one of the
seasons may have been due to premature application of the inhibitor and N fertilizers at a time when the crop plants were too small to take up a substantial amount of ammonium before the efficacy of the nitrification inhibitor had expired. In subsurface drip irrigated (SDI) tomato, the reductions due to the nitrification inhibitor were 11% (difference not significant) and 29%, or 30 (2012) and 72 kg CO2 ha-1 (2013). In corn in 2012, the reductions in N2O emissions with different fertilizer formulations (were 30% for UAN (equivalent to 200 kg CO2 ha-1), and 75% (509 kg CO2 ha-1) for calcium nitrate with respect to aqua ammonia, and 65% (306 kg CO2 ha-1) for calcium nitrate with respect to UAN. There was a consistent trend for lower N2O emissions when corn was fertilized with two knife-injected bands of UAN fertilizer than with one albeit the differences were not always significant. The largest difference in N2O emissions amounting to 4500 kg CO2 ha-1 was between one fertilizer band in the bed and the two band application. We did not detect effects on yield or nitrogen use efficiency in any of the N fertilizer or nitrification inhibitor experiments. Subsurface drip irrigation reduced N2O emissions in two corn growing seasons by 60 and 95%, or 265 (2013) and 1950 kg CO2 ha-1 (2014). The results in the lettuce systems were inconsistent: In 2013, N2O emissions were lowered by 68%, or 307 kg CO2 ha-1 in the ‘sprinkler & drip’ combination compared to the ‘sprinkler’ treatment, but in 2012, N2O emissions were similar in the two treatments. Conclusions Among the N2O emission mitigation practices, SDI instead of FI and the use of nitrification inhibitors most consistently lowered N2O emissions. Subsurface drip irrigation has previously been shown to reduce N2O efflux in tomato (Kallenbach et al., 2010; Kennedy et al., 2013), while our results involving the nitrification
Figure I. Total seasonal N2O emissions in CO2 equivalents (CO2eq.) in corn, tomato, and lettuce experiments 2012-2014. NI = nitrification inhibitor. Bars designated with the same letters are not significantly different (P<0.05). n = 3 or 4.

xiv
inhibitor are in agreement with those of many other studies, as shown in a recent meta-analysis (Akiyama et al., 2010). Using nitrification inhibitors appears to be most effective in systems with high N2O emission potential, e.g. FI systems receiving N fertilizer additions that are spatially and temporally concentrated, as in the corn systems studied. In the SDI tomato systems, the reduction of N2O emissions in one of the seasons amounted to <1.7% of total GHG emissions, and furthermore, there were no yield benefits from using the nitrification inhibitor, suggesting that in SDI tomato systems the use of these inhibitors may not be economical. Our results comparing the effects of different N fertilizers on N2O emissions implicated the ammonia oxidizer (nitrification) pathways of N2O production as contributing more to N2O emissions than denitrification and showed lower N2O emissions with nitrate than ammonium fertilizers. It should be noted that these results cannot necessarily be extrapolated to every soil type and situation. For example, denitrification could be more important in finer textured soils or in soils with high carbon availability. The results should not be used to recommend the use of nitrate fertilizers either, as those consume more energy to manufacture and could increase nitrate leaching risk in some soils. The trend for higher N2O emissions with applications of fertilizer N in one rather than two bands per unit area, a practice that results in a localized increase of fertilizer N concentration, has previously been demonstrated with other N sources and slightly different placement methods (Tenuta and Beauchamp, 2000; Engel et al., 2010; Maharjan and Venterea, 2013; Zhu et al., 2015). The principle that decreasing the spatial concentration of N fertilizers reduces N2O emissions can likely be applied as management practice and should be further explored in different cropping systems. It should be noted that N2O emissions can also be reduced if growers refrain from applying N fertilizer in excess of plants’ needs. The results of contract 08-324 and those of a concurrent study sponsored by CDFA-FREP identified the levels of N application rates that resulted in the lowest N2O emissions while not reducing yields in tomato, lettuce, wheat, rice, and corn systems. Guidelines on N fertilization enabling crops to reach their yield potential, which varies across regions and in addition depends on soil type and conditions, would likely contribute to lower aggregated N2O emissions from agricultural soil (DeCock, 2014).

1
1. Introduction
Nitrous oxide (N2O) is an important greenhouse gas produced by agricultural activities, in particular nitrogen (N) fertilization. In California, about 13.1 Tg (million metric ton) N2O from anthropogenic sources is emitted, which contributes about 3% to California’s total greenhouse gas (GHG) budget, or about 24% of all GHG emissions from California’s agriculture (CARB 2014). Management practices that mitigate N2O emissions from agricultural soil, if adopted by growers, could contribute to limiting the impact of agriculture on California’s greenhouse gas emissions. We evaluated management practices that hold promise of reducing N2O emissions while maintaining productivity. The potential N2O emission mitigation practices were experimentally compared to standard practices on commercial farms or, in one case, in research plots where commercial machinery and irrigation comparable to an on-farm setting were employed. The three cropping systems serving as model systems were lettuce (with a statewide acreage of 200,000 acres), corn (595,000 acres), and processing tomato (260,000 acres) (CDFA, 2014).
Nitrous oxide is mainly produced by soil microorganisms during nitrification and denitrification and through chemo-denitrification (Firestone and Davidson, 1989; VanCleemput and Samater, 1996; Wrage et al., 2001). In agricultural soil, the rates of N2O production depend on the quantity and forms of nitrogen applied, but also on biophysical factors, such as soil moisture, temperature, carbon, and oxygen levels, microbial activity, and plant development (Tiedje, 1988; Venterea et al., 2012).
A growing body of research is showing that under low oxygen conditions, which occur with high soil moisture and/or carbon availability, a large proportion of N2O following ammonical fertilizer applications is produced by the ammonia oxidizer (nitrification) pathways, (Bergstrom et al., 2001; Khalil et al., 2004; Schellenberg et al., 2012; Zhu et al., 2013; Abalos et al., 2014). Nitrification inhibitors slow the conversion of ammonia to nitrate and thus have the potential to reduce the production of N2O by the nitrification pathway. Denitrification may also be reduced because of the smaller nitrate pool during the time of nitrification inhibition. A recent meta-analysis showed that nitrification inhibitors, when applied together with N fertilizers, reduced N2O emissions on average by 38% (95% confidence interval -45% to -31%) compared with those from soil where only N fertilizer was applied (Akiyama et al., 2010).
The urease and nitrification inhibitor AgrotainPlus™ with the active ingredients N-(n-butyl)-thiophosphoric triamide (NBPT; urease inhibitor) and dicyandiamide (DCD; nitrification inhibitor) is one of the few currently approved nitrification inhibitors that can be used with liquid fertilizers. The urease inhibitor slows down ammonia volatilization in surface urea applications. Ammonium is usually quickly nitrified in agricultural soils (Robertson, 1997), and nitrification inhibitors are only effective in reducing N2O emissions if crops take up a significant portion of ammonium before the inhibitor has been degraded. At 20° C, DCD’s efficacy has been reported to last ≤ 35 days and at 30° C, ≤ 14 days (Irigoyen et al., 2003). Dicyandiamide is an uncharged molecule that diffuses through the soil solution as urea does. However, ammonium, which is held on

2
the soil’s cation exchange sites, may stay near the point of application (knife injection). At the onset of this research, it was not clear whether the lack of a charge on DCD and the expected movement of DCD away from its point of application was a disadvantage since DCD might separate from ammonium under high soil moisture. We therefore tested a reacted form of DCD, G77, which is positively charged (Koch Agronomic Services, Wichita, KS) in one of the experiments in a corn system. In addition, we evaluated whether nitrification inhibitors effectively reduce N2O emissions in subsurface drip irrigated systems, such as tomato.
Several studies have shown that locally concentrating N fertilizer, such as urea, e.g. by banding, tends to produce greater N2O emissions than dispersing fertilizers through the soil, e.g. by broadcasting and disking (Tenuta and Beauchamp, 2000; Engel et al., 2010). To prove the concept that locally less concentrated applications of N fertilizers produce less N2O per unit area than more concentrated applications, we measured N2O emissions after applying identical amounts of liquid urea ammonium nitrate (UAN) at two banding densities in furrow-irrigated corn. We used UAN rather than granular fertilizers as the use of liquid N fertilizers has increased in last few decades with about 40% of N fertilizers now being used in the U.S. in this form (USDA-NASS 2012).
Our previous research in lettuce production systems showed moderate N2O emissions when the growing crop was fertigated via subsurface drip irrigation (SDI) (Burger and Horwath, 2012). However, the effects of surface drip irrigation and fertigation on N2O emissions has not been compared to those of sprinkler irrigation. In a melon production system in Spain, N2O emissions were reduced by 3.58 kg N2O-N ha-1 or 68% in surface drip irrigation compared to furrow irrigation (Sanchez-Martin et al., 2008).
In an organically managed system, crops rely on N mineralized from soil organic matter and organic inputs, rather than on synthetic fertilizer N additions. Therefore, spikes of large N2O emissions that are often observed after rewetting soil amended with synthetic N fertilizers may be less likely in organic systems. We measured N2O emissions in a furrow-irrigated organic tomato system since the vast majority of organic processing tomatoes in the Sacramento Valley are grown under furrow-irrigation (Bustamante, 2014). Most of the conventional tomato production is subsurface drip irrigated. To compare the impact of different crop production systems on the total greenhouse gas emissions, or global warming potential, the energy use of farming operations was also considered (Robertson et al., 2000; Mosier et al., 2005; Mosier et al., 2006). Comparing N2O emissions and total greenhouse gas emissions (carbon dioxide equivalents) in cropping systems provides a useful perspective in evaluating alternative and standard management practices.
In this project, we investigated the effects of different fertilizer types, urease and nitrification inhibitors, N fertilizer placement, and irrigation methods on N2O emissions. Because any potential mitigation practices must maintain yield potential and not adversely affect the environment, we also measured yields and N use efficiency of the crops.
3
2. Materials and Methods
2.1. Tomato systems
2.1.1. Field sites
The experiments in the processing tomato systems were conducted in four grower fields in Yolo County. Two conventionally managed fields under subsurface drip irrigation near Winters (38°34.5’N, 121°57’W) were used to compare nitrous oxide emissions, yields and nitrogen use efficiency under standard N fertilization with and without the use of a nitrification inhibitor. The soil of the field used in 2012-13 was classified as Brentwood silty clay, a fine montmorillonitic, thermic, Typic Xerochrepts, containing in the surface 30 cm 0.7% organic matter. The soil texture distribution was 32% clay, 20% sand, and 48% silt. The pH was 7.3. A field adjacent to the one used in the first year was used in 2013-14. The soil type was Rincon silty clay loam, a fine monmorillonitic, thermic Typic Haploxeralf containing 2.0% organic matter and a soil particle distribution of 31% clay, 20% sand, and 49% silt. The pH was 7.8.
The organically managed tomato production fields were on a farm near Woodland (38°41.5’N, 121°53.5’W). The soil in both fields in 2012-13 and 2013-14 was Brentwood silty clay. The fields of the organic farm were furrow-irrigated.
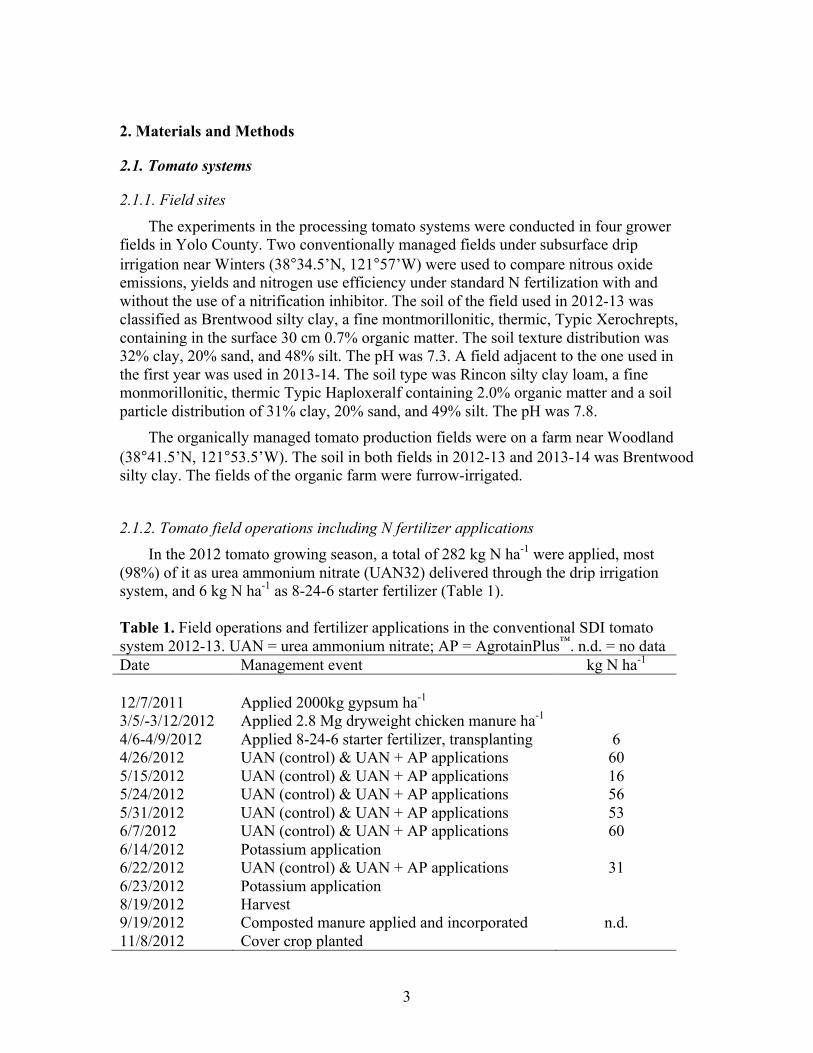
2.1.2. Tomato field operations including N fertilizer applications In the 2012 tomato growing season, a total of 282 kg N ha-1 were applied, most
(98%) of it as urea ammonium nitrate (UAN32) delivered through the drip irrigation system, and 6 kg N ha-1 as 8-24-6 starter fertilizer (Table 1).
Table 1. Field operations and fertilizer applications in the conventional SDI tomato system 2012-13. UAN = urea ammonium nitrate; AP = AgrotainPlus™. n.d. = no data Date Management event kg N ha-1 12/7/2011 Applied 2000kg gypsum ha-1 3/5/-3/12/2012 Applied 2.8 Mg dryweight chicken manure ha-1 4/6-4/9/2012 Applied 8-24-6 starter fertilizer, transplanting 6 4/26/2012 UAN (control) & UAN + AP applications 60 5/15/2012 UAN (control) & UAN + AP applications 16 5/24/2012 UAN (control) & UAN + AP applications 56 5/31/2012 UAN (control) & UAN + AP applications 53 6/7/2012 UAN (control) & UAN + AP applications 60 6/14/2012 Potassium application 6/22/2012 UAN (control) & UAN + AP applications 31 6/23/2012 Potassium application 8/19/2012 Harvest 9/19/2012 Composted manure applied and incorporated n.d. 11/8/2012 Cover crop planted

4
The nitrification and urease inhibitor AgrotainPlus™ was mixed with UAN fertilizer and applied to a 7-ha area of the 43-ha field at every application date. The inhibitor was applied at the rate of 0.75% of the UAN fertilizer mass. The total N application was 281 kg N ha-1. The composted manure applied in fall 2012 was not analyzed.
In 2013-14, 6 kg N ha-1 was applied as starter as 8-24-6 and 219 kg N ha-1 was
applied through the drip system (Table 2). A total of 3.7 Mg dryweight composted cattle manure with a total N content of 1.3% was applied in September 2013. Table 2. Management events conventional tomato 2013-14. Date Management event kg N ha-1 3/23/2013 Applied 8-24-6 starter fertilizer 6 3/23/2013 Tomato seedlings planted 4/13/2013 UAN (control) & UAN + AP applications 13.2 4/24/2013 UAN (control) & UAN + AP applications 13.2 5/1/2013 UAN (control) & UAN + AP applications 13.2 5/8/2013 UAN (control) & UAN + AP applications 44.8 5/15/2013 UAN (control) & UAN + AP applications 44.8 5/22/2013 UAN (control) & UAN + AP applications 44.8 5/29/2013 UAN (control) & UAN + AP applications 22.4 6/5/2013 UAN (control) & UAN + AP applications 22.4 7/25/2013 Harvest 9/16/2013 3.7 Mg dryweight composted cattle manure ha-1 applied 48.0 9/19/2013 Tillage
In the organic system, a total of 34 kg N as guano was shanked in about 20 cm deep in the middle of the bed (Tables 3 & 4). Additionally, 4.5 Mg dryweight composted or semi-composted chicken manure with a total N content of 4.0% N is applied every fall.
Table 3. Management events and N applications in the organic tomato system 2012-13. Date Management event kg N ha-1 5/6-5/9/2012
Irrigation
5/14-5/16/2012
Irrigation
5/31/2012 Cultivation & fertilization 34.5 6/12/2012 Irrigation 7/2/2012 Irrigation 9/5/2012 Harvest 9/9/2012 4.5 Mg dryweight chicken manure ha-1 applied 180

5
Table 4. Management events and N applications in the organic tomato system 2013-14. n.d. = no data. Date Management event kg N ha-1 2/13/2013 Vetch cover crop incorporated n.d. 4/13/2013 17 kg Guano (12-12-2.5) ha-1 applied 2.0 4/26/2013 Seedlings planted 5/2-5/6/2013
Sprinkler irrigation
5/21/2013 271 kg guano (12-12-2.5) ha-1 applied 32.5 5/26 -6/1/2013
Irrigation
7/8/2013 Irrigation 7/15/2013 Irrigation 7/24/2013 Irrigation 8/2/2013 Irrigation 8/17/2013 Irrigation 8/31/2013 Harvest 9/4/2013 4.5 Mg dryweight chicken manure applied 180
2.1.3 Nitrous oxide flux measurements in tomato systems In 2012-13, the N2O flux measurements in the organically conventionally managed
tomato system were taken in three replicate areas within the section of the field. In the conventionally managed field, flux measurements were taken in three replicate areas in each the section receiving the nitrification inhibitor and three replicates within the remainder of the field. In each replicate round PVC chambers bases (20.3 cm diameter) were placed in the center of the bed, near the edge of the bed, and in the furrow. The bases were inserted 8 cm deep into the soil and extended 5 cm above the soil.
In 2013-14, four replicate chamber areas were randomly selected in different beds of of the organically managed tomato field and in the conventionally managed field in each the area receiving the fertilizer and nitrification inhibitor and the area receiving only fertilizer. Rectangular thin-wall stainless steel chambers and bases were used in the beds. The chamber bases reached from the edge to the middle of the beds and covered an area of 50 x 30 cm. The bases had a 2 cm-wide horizontal flange at the top end and were inserted 8 cm deep into the soil, so that the flange was resting on the soil surface. The bases were left in place unless field operations required their temporary removal.
Nitrous oxide flux was measured, using a static chamber technique (Hutchinson and Livingston, 1993). The height of all the chambers was 10 cm. The chambers were vented with 150 mm long and 4.8 mm diameter tubes and covered with reflective material to minimize temperature fluctuations within the chambers during measurements. During sampling, the chambers were fitted onto the bases and headspace air was removed by inserting the needle of a polypropylene syringe (Monoject) through the septum of the sampling port and slowly withdrawing 20 mL gas 20, 40, and 60 min after deploying the chamber tops onto the bases. In addition 5 ambient air samples, serving as the time zero
6
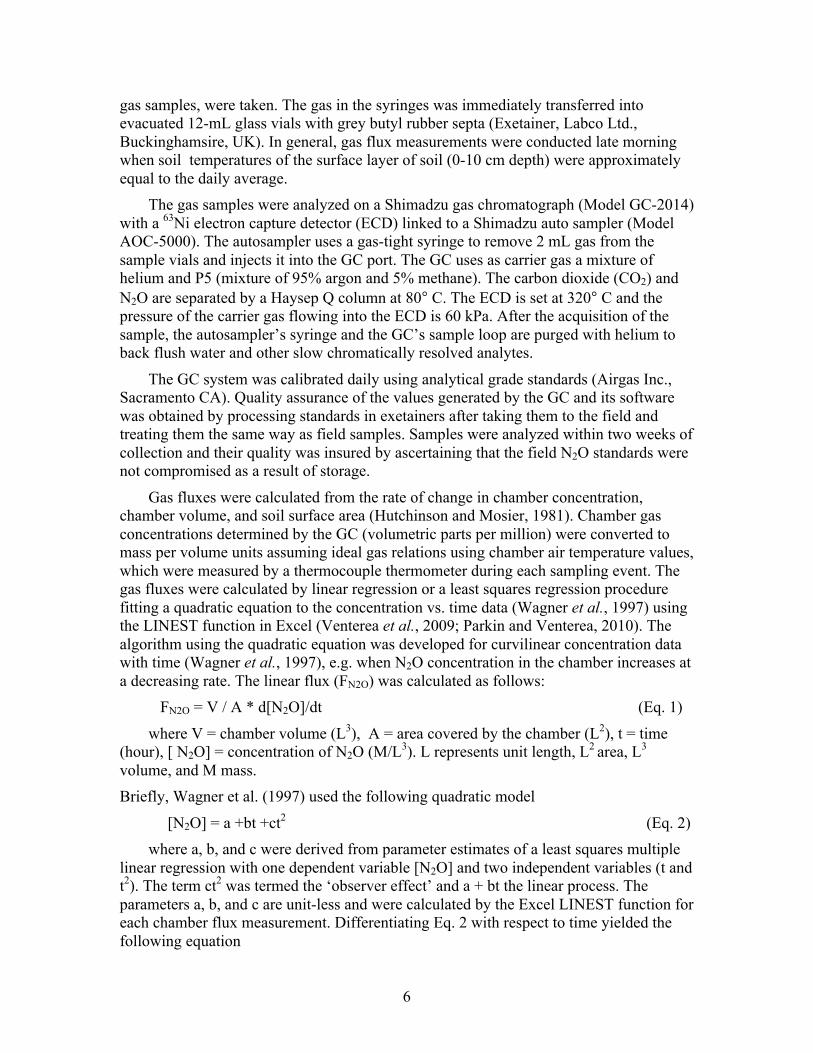
gas samples, were taken. The gas in the syringes was immediately transferred into evacuated 12-mL glass vials with grey butyl rubber septa (Exetainer, Labco Ltd., Buckinghamsire, UK). In general, gas flux measurements were conducted late morning when soil temperatures of the surface layer of soil (0-10 cm depth) were approximately equal to the daily average.
The gas samples were analyzed on a Shimadzu gas chromatograph (Model GC-2014) with a 63Ni electron capture detector (ECD) linked to a Shimadzu auto sampler (Model AOC-5000). The autosampler uses a gas-tight syringe to remove 2 mL gas from the sample vials and injects it into the GC port. The GC uses as carrier gas a mixture of helium and P5 (mixture of 95% argon and 5% methane). The carbon dioxide (CO2) and N2O are separated by a Haysep Q column at 80° C. The ECD is set at 320° C and the pressure of the carrier gas flowing into the ECD is 60 kPa. After the acquisition of the sample, the autosampler’s syringe and the GC’s sample loop are purged with helium to back flush water and other slow chromatically resolved analytes.
The GC system was calibrated daily using analytical grade standards (Airgas Inc., Sacramento CA). Quality assurance of the values generated by the GC and its software was obtained by processing standards in exetainers after taking them to the field and treating them the same way as field samples. Samples were analyzed within two weeks of collection and their quality was insured by ascertaining that the field N2O standards were not compromised as a result of storage.
Gas fluxes were calculated from the rate of change in chamber concentration, chamber volume, and soil surface area (Hutchinson and Mosier, 1981). Chamber gas concentrations determined by the GC (volumetric parts per million) were converted to mass per volume units assuming ideal gas relations using chamber air temperature values, which were measured by a thermocouple thermometer during each sampling event. The gas fluxes were calculated by linear regression or a least squares regression procedure fitting a quadratic equation to the concentration vs. time data (Wagner et al., 1997) using the LINEST function in Excel (Venterea et al., 2009; Parkin and Venterea, 2010). The algorithm using the quadratic equation was developed for curvilinear concentration data with time (Wagner et al., 1997), e.g. when N2O concentration in the chamber increases at a decreasing rate. The linear flux (FN2O) was calculated as follows:
FN2O = V / A * d[N2O]/dt (Eq. 1)
where V = chamber volume (L3), A = area covered by the chamber (L2), t = time (hour), [ N2O] = concentration of N2O (M/L3). L represents unit length, L2 area, L3 volume, and M mass. Briefly, Wagner et al. (1997) used the following quadratic model
[N2O] = a +bt +ct2 (Eq. 2) where a, b, and c were derived from parameter estimates of a least squares multiple
linear regression with one dependent variable [N2O] and two independent variables (t and t2). The term ct2 was termed the ‘observer effect’ and a + bt the linear process. The parameters a, b, and c are unit-less and were calculated by the Excel LINEST function for each chamber flux measurement. Differentiating Eq. 2 with respect to time yielded the following equation

7
d[N2O]/d(t) = b + 2ct (Eq. 3) and setting t = 0 yields the instantaneous N2O flux b at time t0 without the ‘observer
effect’, i.e. the effect of the chamber diminishing the N2O flux from the soil surface to the atmosphere. In other words, the flux is computed as the first derivative of the quadratic function at t0 (Parkin and Venterea, 2010).
Linear regression was used if the coefficient of determination (r2) was >0.90. For the remainder of the fluxes, the slope of the quadratic equation was used if r2>0.80, or, if the latter criterion was not met, the slope of a linear regression model that included three time points where r2 >0.80. The minimum detectable change in chamber N2O concentration by this GC system is 0.02 microliters per liter (µL L-1), corresponding to a field N2O flux of 2.5 micrograms (µg) N2O-nitrogen (N) per square meter-hour (m-2 h-1).
The GC system was calibrated daily using analytical grade N2O standards (Airgas Inc., Sacramento CA). Quality assurance of the N2O values generated by the GC and its software was obtained by processing N2O standards in exetainers after taking them to the field and treating them the same way as field samples. The two standard preparation approaches ensured quality assurance of the lab and field protocols used in this study. Samples were analyzed within two weeks of collection and their quality was insured by ascertaining that the field N2O standards were not compromised as a result of extended storage.
2.1.4. Cumulative seasonal and annual N2O emissions
The cumulative annual and seasonal N2O emissions were calculated by trapezoidal integration of daily fluxes (mean of flux at sampling date and flux at next sampling date, multiplied by the number of days) under the assumption that the measured fluxes represented mean daily fluxes, and that mean daily fluxes changed linearly between measurements (Venterea et al., 2005).
Cumulative EN2O = (date 2 – date1) * (Fday1 + Fday2)/2 (Eq. 5) where Fday1, Fday2 are the daily fluxes (g N2O-N ha-1 d-1 on date 1 and date 2.
2.1.5. Global warming potential of tomato systems as CO2 equivalents
Conversion of N2O annual and seasonal emissions into CO2 equivalents was carried out using a conversion factor of 298 for N2O (298 kg CO2 per kg N2O) (IPCC, 2007a). The fuel use for the tractors, tomato transplanter, harvester, manure spreader, and manure transport used for the various field operations was measured either on-farm using a SCADA engine monitoring system or other measurement of fuel consumption. The fuel use of the diesel pumps used to convey surface water and pressurize it for the drip irrigation system was measured based on operation time of the pumps reported by the farmers and measured rates of fuel use per hour of each pump. The fuel use quantities were converted to CO2 equivalents using a conversion factor of 10.08 kg CO2 per gallon diesel fuel (USEPA). To convert the energy embedded in the production of UAN fertilizer, a conversion factor of 4.77 (kg CO2 per kg fertilizer N) was used (Kongshaug, 1998; Snyder et al., 2009).
8
2.2. Corn
2.2.1. Corn field sites
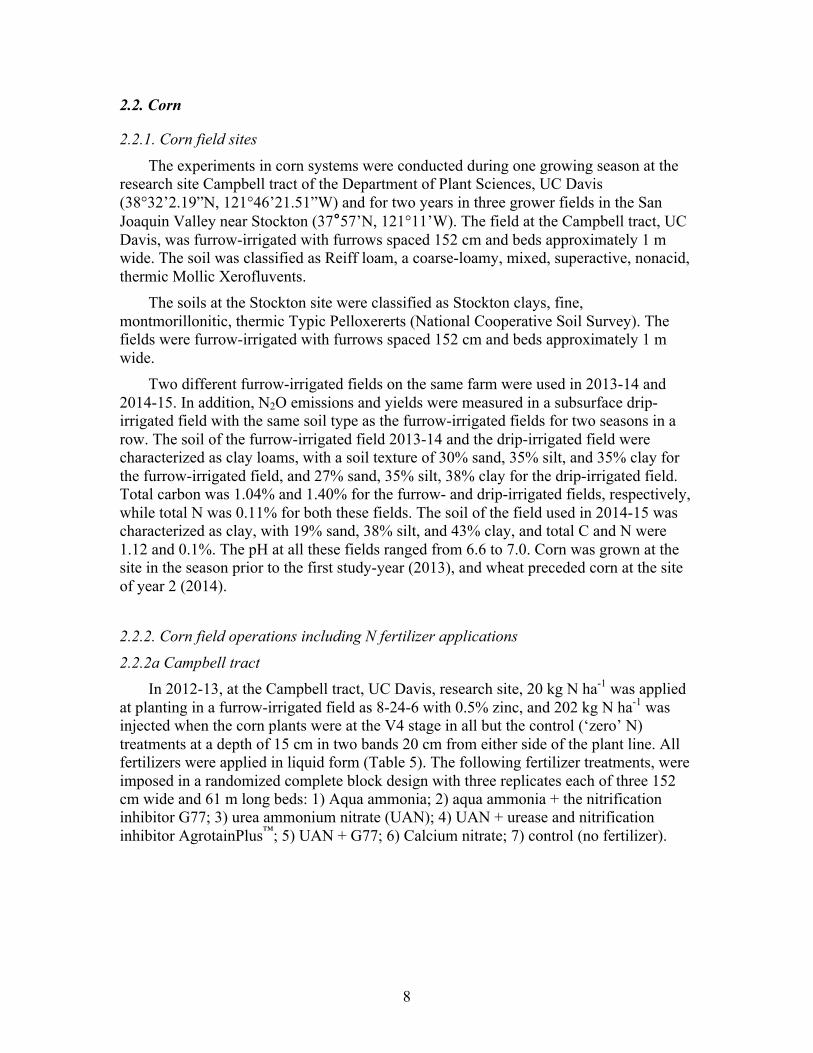
The experiments in corn systems were conducted during one growing season at the research site Campbell tract of the Department of Plant Sciences, UC Davis (38°32’2.19”N, 121°46’21.51”W) and for two years in three grower fields in the San Joaquin Valley near Stockton (37°57’N, 121°11’W). The field at the Campbell tract, UC Davis, was furrow-irrigated with furrows spaced 152 cm and beds approximately 1 m wide. The soil was classified as Reiff loam, a coarse-loamy, mixed, superactive, nonacid, thermic Mollic Xerofluvents.
The soils at the Stockton site were classified as Stockton clays, fine, montmorillonitic, thermic Typic Pelloxererts (National Cooperative Soil Survey). The fields were furrow-irrigated with furrows spaced 152 cm and beds approximately 1 m wide.
Two different furrow-irrigated fields on the same farm were used in 2013-14 and 2014-15. In addition, N2O emissions and yields were measured in a subsurface drip-irrigated field with the same soil type as the furrow-irrigated fields for two seasons in a row. The soil of the furrow-irrigated field 2013-14 and the drip-irrigated field were characterized as clay loams, with a soil texture of 30% sand, 35% silt, and 35% clay for the furrow-irrigated field, and 27% sand, 35% silt, 38% clay for the drip-irrigated field. Total carbon was 1.04% and 1.40% for the furrow- and drip-irrigated fields, respectively, while total N was 0.11% for both these fields. The soil of the field used in 2014-15 was characterized as clay, with 19% sand, 38% silt, and 43% clay, and total C and N were 1.12 and 0.1%. The pH at all these fields ranged from 6.6 to 7.0. Corn was grown at the site in the season prior to the first study-year (2013), and wheat preceded corn at the site of year 2 (2014).
2.2.2. Corn field operations including N fertilizer applications
2.2.2a Campbell tract In 2012-13, at the Campbell tract, UC Davis, research site, 20 kg N ha-1 was applied
at planting in a furrow-irrigated field as 8-24-6 with 0.5% zinc, and 202 kg N ha-1 was injected when the corn plants were at the V4 stage in all but the control (‘zero’ N) treatments at a depth of 15 cm in two bands 20 cm from either side of the plant line. All fertilizers were applied in liquid form (Table 5). The following fertilizer treatments, were imposed in a randomized complete block design with three replicates each of three 152 cm wide and 61 m long beds: 1) Aqua ammonia; 2) aqua ammonia + the nitrification inhibitor G77; 3) urea ammonium nitrate (UAN); 4) UAN + urease and nitrification inhibitor AgrotainPlus™; 5) UAN + G77; 6) Calcium nitrate; 7) control (no fertilizer).

9
Table 5. Crop management at Campbell tract, UC Davis, during 2012 corn growing season. Date Event 5/25/2012 Corn planted, 2 rows per bed 5/29/2012 Irrigation 30 h 6/15/2012 Irrigation 11 h 6/25/2012 Fertilizer applied 202 kg N ha-1 6/28/2012 Irrigation (94 mm) 7/6/2012 Irrigation (49 mm) 7/16 – 7/19/2012 Extra long irrigation (315 mm) 8/1-8/2 2012 Irrigation (145 mm) 8/13-8/14/2012 Irrigation (98 mm) 8/29/2012 Irrigation (121 mm) 10/30/2012 Corn harvest 2.2.2b Stockton site
At the grower sites near Stockton, 8 and 13 kg N ha-1 were applied at planting as starter fertilizer as 8-24-6 with 0.5% zinc in 2013 and 2014, respectively (Table 6). In 2013, the following N fertilizer treatments in the form of UAN32 at the rate of 218 kg N ha-1 were randomly imposed on three 184 m long beds per treatment 17 days after planting when the corn was about 13 cm tall: 1) Two fertilizer bands injected at a depth of 13 cm, on either side of the plants about 15 cm from the plant row (‘two band’) (grower practice); 2) one fertilizer band on the shoulder of the bed about 15 cm from the plant row (‘one band’); 3) two fertilizer bands and AgrotainPlus (urease and nitrification inhibitor, dicyandiamide (DCD) and N-(n-butyl)-thiophosphoric triamide) applied at the rate of 0.75% of the UAN fertilizer mass (‘NI’); 4) 337 kg N ha-1 applied as two bands (‘High N’); 5) no fertilizer (control). In the adjacent subsurface drip-irrigated field, 250 kg N ha-1 in the form of UAN was applied as fertigations in five increments of 50 kg N ha-1 (‘Drip’). Table 6. Field management at Stockton site 2013. Date Event 4/17/2013 Corn planted; starter fertilizer applied 5/4/2013 Fertilizer treatments imposed 5/12/2013 Subsurface drip irrigation started 5/19/2013 Irrigation 6/7/2013 Irrigation 6/16/2013 Irrigation 2/26/2013 Irrigation 7/4/2013 Irrigation 7/10/2013 Irrigation 7/20/2013 Irrigation 8/4/2013 Irrigation 8/11/2013 Irrigation; denting begins 9/26/2013 Harvest
10
In 2014, the experiment under furrow-irrigation was conducted in the same manner in another field with a bed and furrow length of 170 m (Table 7). However, the N fertilizer rate for the N fertilizer placement and nitrification inhibitor treatments in the second season was 252 kg N ha-1 and the ‘high N’ rate was 342 kg N ha-1. An additional treatment was a single band of fertilizer placed in the bed about 15 cm from the plant line (‘one band bed’). In the second season, the zero N treatment had to be omitted since by mistake fertilizer was applied in those plots. The subsurface drip-irrigated field was N fertilized at the same rates as in the 2013 season. Table 7. Field management at Stockton site 2014. Date Event 4/18/2014 Corn planted; starter fertilizer applied 5/15/2014 Fertilizer treatments imposed 5/26/2014 Irrigation; irrigation SDI started 6/2/2014 Irrigation 6/12/2014 Irrigation 6/22/2014 Irrigation 7/1/2014 Irrigation 7/10/2014 Irrigation 7/20/2014 Irrigation 7/29/2014 Irrigation 8/11/2013 Harvest
2.2.3. Nitrous oxide measurements in corn systems 2.2.3a Campbell tract
Initially (5/28/2012 – 7/6/2012), rectangular chamber bases covering an area of 30 x 50 cm from the edge to the center of the middle beds and in the furrows 14 x 15 cm chamber bases were installed and N2O flux measurements taken. In calculating the N2O emissions per area during this period, bed and furrow fluxes were weighted at 75 and 25%, respectively. From 7/7/2012 until the end of the season (10/25/2012), additional measurements of shoulder N2O fluxes were made, using bases and chambers installed on the shoulders of the beds that covered an area of 14 x 15 cm. To calculate N2O emissions per area for the latter period, the N2O fluxes from beds, shoulders, and furrows were weighted at 65, 25, and 10%, respectively.
Gas sampling procedures were as described in 2.2.2b. However, in the Campbell Tract experiments, due to the large number of treatments, only two gas samples were removed from the chambers at 20 and 40 min after chamber deployment in addition to the ambient air samples serving as the time zero gas samples. Gas fluxes were calculated from the rate of change in chamber concentration, chamber volume, and soil surface area (Hutchinson and Mosier, 1981). Chamber gas concentrations determined by the gas chromatograph (volumetric parts per million) were converted to mass per volume units assuming ideal gas relations using chamber air temperature values, which were measured using a thermocouple thermometer during each sampling event. The flux calculation used an algorithm appropriate for curvilinear concentration data with time when gas

11
concentrations in the chamber increased at a decreasing rate (Hutchinson and Mosier, 1981; Hutchinson and Davidson, 1993), and used linear regression at all other times, i.e. if
1 > (C1- C0) / (C2 – C1) (Eq. 4) where C1 = [N2O]chamber after the first time interval, C0 = [N2O]chamber at time zero,
and C2 = [N2O]chamber after the second time interval (Hutchinson and Mosier, 1981).
2.2.3b Stockton sites
Each treatment in the furrow-irrigated field was set up in three beds, and replicates within each treatment were established in the middle bed of each treatment at three different distances from the head-end of the furrow. Rectangular 30 x 50 cm stainless steel chamber bases were installed on the bed across one plant line and covering one half of the bed width. Smaller 14 x 15 cm chamber bases were placed in the shoulder and in the furrow. The bases were inserted to a depth of 6 cm with a horizontal flange flush with the soil. In the SDI field, three replicates with two 30 x 50 cm and one 14 x 15 cm chamber bases were established in random locations, i.e. one 30 x 50 cm base in the bed across the plant rows and another one with the same dimensions in the middle of the bed between sets of two rows, and a small one in the furrow. The bases were left in place unless farm operations necessitated their temporary removal.
Prior to the start of both seasons, gas samples were taken before fertilization to establish a baseline for the site. In 2013, gas samples were measured before an irrigation event and for 4-6 consecutive days following the event, until the fluxes returned to baseline. In general, the gas samples were taken late morning when soil temperatures were near their daily average. Additionally, gas samples were collected post harvest from October 2013 to March 2014 after a rain event or every 2 weeks. In 2014, samples were taken before an irrigation event and for the first, second, and 6th day after an event to capture the pattern of N2O fluxes, as established in the prior season. In 2014, due to a miscommunication with the grower, the experimental plots could not be maintained beyond October 2014. However, N2O monitoring continued through February 2015 in the field that was subsurface drip irrigated during the growing season.
Gas sampling procedures were as described in 2.1.3. At the Stockton sites, as at the Campbell tract, only two gas samples were removed from the chambers at 20 and 40 min after chamber deployment in addition to the ambient air samples serving as the time zero gas samples. Gas fluxes were calculated from the rate of change in chamber concentration, chamber volume, and soil surface area (Hutchinson and Mosier, 1981). Chamber gas concentrations determined by the gas chromatograph (volumetric parts per million) were converted to mass per volume units assuming ideal gas relations using chamber air temperature values, which were measured using a thermocouple thermometer during each sampling event. In both seasons, the N2O flux per unit area of each replicate was calculated by weighting bed, shoulder, and furrow fluxes 65%, 25%, and 10%, respectively.
The cumulative annual and seasonal N2O emissions in the corn systems were calculated by trapezoidal integration of daily fluxes (see section 2.1.4. and equation 5).

12
2.3. Lettuce
2.3.1. Lettuce field sites
The lettuce experiments were conducted near Soledad (36°25.5’N and 121°20.5’W). The soil type was Cropley silty clay, classified as fine montmorillonitic, thermic Chromic Pelloxererts. The soil texture was 26% sand, 38% silt, and 36% clay. Soil pH was 7.2 and bulk density in the beds 1.22 and in the furrows 1.29 g cm-3.
2.3.2. Lettuce field operations including N fertilizer applications In each of two seasons, N2O emissions were monitored in fields that were either
sprinkler irrigated during the whole growing season or sprinkler irrigated up to the thinning stage and then surface drip irrigated (Tables 8 & 9). Table 8. Management events in lettuce experiments 2012. Date Sprinkler all season Date Sprinkler & drip 5/19/2012 Starter fert. 63 kg N ha-1 7/19/2012 Starter fert. 63 kg N ha-1 6/9/2012 Planted head lettuce 7/20/2012 Planted Romaine lettuce 7/3/2012 Thinning 8/14/2012 Thinning 7/9/2012 UAN fertilizer 135 kg N ha-1 8/17/2012 180 kg N ha-1 7/24/2012 UAN fertilizer 56 kg N ha-1 8/22/2012 Surface drip installed 8/20/2012 Harvest 9/8/2012 Aq. NH3 62 kg N ha-1 9/15/2012 Aq. NH3 31 kg N ha-1 9/25/2012 Harvest Table 9. Management events in lettuce experiments 2013. Date Sprinkler all season Date Sprinkler & drip 3/17/2013 Planted 3/15/2013 Planted 4/13/2013 Thinning 4/12/2013 Thinning 4/18/2013 UAN fert. 116 kg N ha-1 4/16/2013 UAN fert. 155 kg N ha-1 5/10/2013 UAN fert. 101 kg N ha-1 4/28/2013 Surface drip installed 6/6/2013 Harvest 5/9/2013 Fertigation 60 kg N ha-1 5/25/2013 Fertigation 36 kg N ha-1 5/31/2013 Harvest
2.3.3. Nitrous oxide measurements in lettuce production systems Five chamber locations were randomly established in each of the two fields. In the
beds, round (25.4 cm diameter) PVC chamber bases were driven 6 cm deep into the soil, leaving 5 cm of the base protruding above the soil surface. During sampling, chambers with an effective height of 20 cm were sealed to the bases with rubber gaskets. In the furrows, round (10 cm diameter) PVC bases and chambers with an effective height of 10 cm were used. In general, the gas samples were taken late morning when soil temperatures were near their daily average. Gas samples were removed from the chambers through septa with a syringe at 10, 20, and 30 min after chamber deployment in addition to the ambient air samples serving as the time zero gas samples. Gas fluxes were
13
calculated from the rate of change in chamber concentration, chamber volume, and soil surface area (Hutchinson and Mosier, 1981). Chamber gas concentrations determined by the gas chromatograph (volumetric parts per million) were converted to mass per volume units assuming ideal gas relations using chamber air temperature values, which were measured using a thermocouple thermometer during each sampling event. In both years, the sprinkler only treatment was in 1.52 m wide beds with 4 plant rows, and the bed and furrow fluxes were weighted 85 and 15%, respectively. The sprinkler & drip irrigated treatment was in 203 cm wide beds with 6 plant rows, and bed and furrow fluxes were weighted 81 and 19%, respectively.
The cumulative annual and seasonal N2O emissions in the lettuce systems were calculated by trapezoidal integration of daily fluxes (see section 2.1.4. and equation 5).
2.4. Environmental variables
2.4.1. Soil and air temperatures, soil moisture During each sampling event, in addition to chamber air temperatures, soil and
ambient air temperatures were measured and gravimetric soil moisture in the 0-15 cm layer was determined. In addition, gravimetric soil moisture was calculated from field-moist and oven-dry (105ºC) mass of soil collected in the 0-15cm layer using a 1.83-cm steel corer. The gravimetric soil moisture values were converted to water-filled pore space values by using measured bulk density values in the 5-15 cm layer. 2.4.2 Soil bulk density
The bulk density was measured twice per growing and rainy season by collecting 10 cm dia. x 7 cm long cores in the 5-15 cm layer of soil, followed by drying the cores to 105ºC. 2.4.3. Soil inorganic N
In the tomato systems, inorganic N (NO3- and NH4
+) in the 0-15 cm layer was measured approximately bi-weekly during the cropping season and monthly during the rainy season. During the corn growing season, soil samples in the 0-15cm layer were taken weekly. Post-harvest, soil samples were taken approximately every three weeks in both tomato and corn systems. At the beginning and end of the tomato and corn growing seasons, soil samples in the 0-15 cm layer were taken to a depth of 60 cm. In the lettuce production systems, soil samples during the growing season were taken every two to three days following fertilization and irrigation events and approximately weekly during all other times. The soil inorganic N was analyzed by extracting 15 g of well-mixed soil with 80 mL of 2M potassium chloride solution, and by analyzing the extracts colorimetrically for ammonium (NH4
+) and nitrate (NO3-) by a Shimadzu
spectrophotometer (Model UV-Mini 1240). For determining NH4+, the phenate
(indophenol blue) method was employed (Forster, 1995). Nitrate in the extracts was reduced to nitrite (NO2
-) with vanadium chloride, and the NO2- was analyzed by
diazotizing with sulfanilamide followed by coupling with N-(1-naphthyl)ethylenediamine-dihydrochloride (Doane and Horwáth, 2003).
2.4.4. Soil total carbon and nitrogen The total C and N in soil of the 0-30 cm layer and in the plant material was measured
by a C and N analyzer (Costech Analytical Technologies Inc., Valencia, CA) by the dry
14
combustion method (Dumas, 1848) after grinding air-dried representative soil samples to a fine powder.
2.4.5. Soil pH The pH in the 0-30 cm layer of soil was measured in supernatant of soil slurries
(soil/H2O ratio 1:1) by a pH meter (Model 220, Denver Instrument Co., Arvada, CO). Soil texture was determined by a modified pipet method (USDA,1992).
2.5. Crop yields and N use efficiencies
2.5.1. Tomato
In the 2013 growing season, yields and N content of the harvested plant parts were measured in each of the four sampling areas per treatment in 2m x 1.52 m microplots. During the growing seasons, three randomly selected plants per treatment were collected and processed in order two assess N uptake. Fresh weights of vines and tomatoes were recorded, and the dry weight of the vines was determined after drying a subsample at 60° C. A subset of the tomatoes was ground into a slurry. Dry weight of the fruit was assessed by lyophilizing a portion of the tomato slurry samples. The freeze-dried samples, as well as pulverized samples of vines, were then analyzed for total N content by the C and N analyzer.
2.5.2 Corn
2.5.2a Campbell tract At the Campbell tract site, corn biomass and crop N uptake was measured five times
during the growing season, the first time 49 d after planting, or 18 days after the side dress N application, and thereafter approximately every two weeks. At each sampling, five randomly selected plants were weighed, chopped by a garden shredder (Sears Craftsman), and a subsample was dried at 60°C and analyzed for total N content as described in section 2.6. All the grain harvested in the 60 m long middle bed in each replicate plot was weighed in the field. Grain moisture and total N was determined in a subsample. The apparent N use efficiency was determined by dividing the total grain biomass by the fertilizer N applied.
2.5.2b Stockton site Corn was grown for grain in the 2013 season and for silage in the 2014 season.
Yields were determined by hand harvesting 2 rows of corn in a 4 m long section of each replicate plot. In 2013, the biomass and grain were weighed, then the cobs were removed from the plants, and the grain was stripped, weighed, and dried at 60 °C. A subsample of the grain was then further dried at 105° C to adjust grain yields for moisture content. The grain and biomass were ground separately in a Wiley Mill and then ball-milled to a fine powder. In 2014, subsamples of the plant material were processed as above. About 5 mg of sample was used for total N analysis as described in 2.6. To calculate the apparent NUE, N uptake was divided by the sum of the amount of N applied as fertilizer and the nitrate content in the top 60 cm measured at pre-plant.
15
2.6. Statistical analyses
Differences in time-integrated annual N2O emissions between treatments were assessed using analysis of variance (ANOVA) and standard mean separation procedures. Appropriate transformation of the N2O emission data was carried out for the statistical analysis whenever the data were not normally distributed. Corn: The two seasons, within the furrow irrigated field, were analyzed separately as a randomized complete block design. To meet the assumptions of homogeneity of variance, normal distribution of residuals, and additivity, the data were log transformed for the corn 2013-14 season and power transformed for 2014 for the ANOVA of cumulative N2O emissions. The data were analyzed as a completely randomized design as an initial ANOVA did not reveal a block (distance from irrigation canal) effect. A Tukey means separation procedure was performed to detect differences between treatment means. All models were significant at p<0.05. All statistical analyses were conducted in R. Because the furrow and subsurface drip irrigated fields were separate entities, a 2-sample-t-test was used to detect differences between the subsurface drip irrigated field and the 2 band treatment of the furrow irrigated field. In the tomato and lettuce systems, treatment differences were evaluated using t-tests (P <0.05).

16
Table 10. Summary of experimental treatments by crop and year, including the amounts of N additions. SDI = subsurface drip irrigation; FI = furrow irrigation; UAN = urea ammonium-nitrate; Aq.A. = aqua ammonia; NUE = N use efficiency. Crop & year
Treatments kg N ha-1 Purpose
Tomato 2012-13
1.) Nitrification inhibitor, SDI 2.) Control, SDI 3.) Organic management, FI
282 282 214
Evaluate effects of nitrification inhibitor and organic management on N2O emissions, yields, and N use efficiency
Tomato 2013-14
1.) Nitrification inhibitor, SDI 2.) Control, SDI 3.) Organic management, FI
225 225 214
Evaluate effects of nitrification inhibitor and organic management on N2O emissions, yields, and N use efficiency
Corn 2012
1.) Aq.A., FI 2.) Aq.A. & nitrification inhibitor G77, FI 3.) UAN, FI 4.) UAN & nitrification inhibitor G77, FI 5.) UAN & nitrification inhibitor, FI 6.) Calcium nitrate, FI 7.) Control, FI
222
222 222
222
222 222 20
Evaluate effects of fertilizer type and two kind of nitrification inhibitors on N2O emissions, yields, and N use efficiency
Corn 2013-14
1.) UAN, 2 bands, FI 2.) UAN, 1 band, FI 3.) UAN, nitrification inhibitor, FI 4.) UAN, high N rate, FI 5.) UAN, SDI 6.) Control, FI
226 226
226 345 250
8
Compare fertilizer N placement methods on N2O, yields, and NUE: One band vs. two bands of liquid N fertilizer per row of corn (same total amount of fertilizer in both treatments); Nitrification inhibitor effects on N2O, yields, and NUE; Irrigation system effects on N2O, yields, and NUE: FI vs. SDI; All the above treatments were evaluated in one experiment that also included a high N rate (50% more N applied than the standard treatment) and control treatment.
Corn 2014
1.) UAN, 2 bands, FI 2.) UAN 1 band shoulder, FI 3.) UAN, 1 band bed, FI 4.) UAN, nitrification inhibitor, FI 5.) UAN, high N rate, FI 6.) UAN, SDI
252 252 252
252 342 250
Compare fertilizer N placement methods on N2O, yields, and NUE: One band in the bed or one band in the shoulder vs. two bands of liquid N fertilizer per row of corn (same total amount of fertilizer in each of the three treatments); Nitrification inhibitor effects on N2O, yields, and NUE; Irrigation system effects on N2O, yields, and NUE: FI vs. SDI; All the above treatments were evaluated in one experiment that also included a high N rate (50% more N applied than the standard treatment) and control treatment.
17
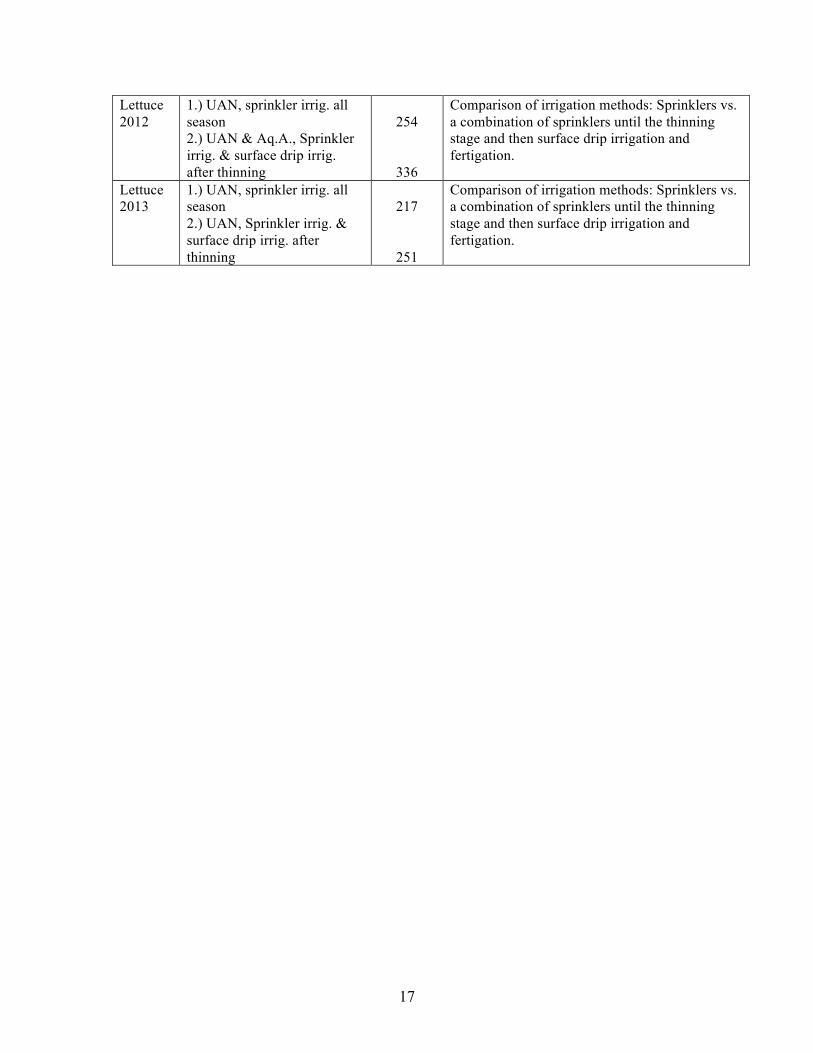
Lettuce 2012
1.) UAN, sprinkler irrig. all season 2.) UAN & Aq.A., Sprinkler irrig. & surface drip irrig. after thinning
254
336
Comparison of irrigation methods: Sprinklers vs. a combination of sprinklers until the thinning stage and then surface drip irrigation and fertigation.
Lettuce 2013
1.) UAN, sprinkler irrig. all season 2.) UAN, Sprinkler irrig. & surface drip irrig. after thinning
217
251
Comparison of irrigation methods: Sprinklers vs. a combination of sprinklers until the thinning stage and then surface drip irrigation and fertigation.

18
3. Results and Discussion
3.1. Tomato 3.1.a Conventional tomato
During the 2012 growing season, daily N2O fluxes did not exceed 40 g N2O-N ha-1. In the control treatment, the highest fluxes occurred in the berms, whereas in the NI treatment, the highest fluxes were recorded in the furrows (Figures 1 & 2). A significant N2O flux occurred at harvest, especially in the control treatment in the bed positions, while in the NI treatment, the N2O flux was elevated in the furrows. The rainfall events in the fall 2012 triggered N2O daily fluxes that were higher than those during the growing season by at least an order of magnitude. The application of composted manure did not result in an immediate increase in N2O emissions.
In the 2013-14 growing season, the daily N2O emissions were below 33 g N2O-N ha-
1. The highest daily flux occurred post-harvest following the first rainfall after harvest. Incidentally, cattle manure had been applied a few days before this rainfall. However, it is not possible to separate the effect of the cattle manure from that of the increased moisture because there was no control treatment. In general manure application causes greater N2O emissions than application of synthetic N (DeCock, 2014). However, only a small percentage (<15%) of the N in composted cattle manure would be available to plants (Pettygrove et al, 2009). Furthermore, the carbon availability of manure and composts may increase denitrification, and thus N2O emissions (Paul & Beauchamp, 1989; Velthof et al., 2003; Rochette at al., 2008).
The N2O emissions during both growing seasons in the conventional subsurface drip-irrigated tomato systems, including nitrification and inhibitor and control treatments, were <0.51 kg (±0.01) N2O-N ha-1 (Table 11), and similar in magnitude to N2O emissions measured earlier in this type of system (0.58 ±0.06 kg N2O-N ha-1)(Kennedy et al., 2013). In a surface drip-irrigated melon system in Spain, growing season N2O emissions were 193 g N2O-N ha-1 (Abalos et al., 2014).
The cumulative growing season N2O emissions in 2012 did not differ between NI and control treatments, whereas in 2013, cumulative growing season N2O emissions were significantly higher in the control than in the NI treatment, with a mean difference of 148 g N2O-N ha-1 between the two treatments. This difference represents a reduction of 29% of N2O emissions due to the use of the nitrification inhibitor, which is within the range of reductions (-29% to -22%, mean = -25%) found for DCD on upland soils, as reported in a recent meta-analysis (Akiyama et al., 2010). In 2012, the mean difference between inhibitor and control treatment was 50 g N2O-N ha-1.
The percentage of N fertilizer emitted as N2O during the growing seasons ranged from 0.16 – 0.22%. In 2012-13, the cumulative post-harvest N2O emissions were 1.7 - >7 times greater than the growing season emissions, but in 2013-14, cumulative post-harvest emissions were about one third of growing season emissions (Table 11). In both years, there were distinct spikes of emissions occurring with the first rainfall after harvest, as

19
observed in earlier studies (e.g. (Burger and Horwath, 2012; Kennedy et al., 2013)(Figures 1 & 2). The rain events in the fall 2012 triggered high N2O emissions in the treatments that had received the nitrification inhibitor, with the highest N2O fluxes occurring in the furrow positions. It is unlikely that the fall N2O emissions in in this treatment were due to the application of the nitrification inhibitor in the preceding growing season since soil ammonium and nitrate concentrations in fall 2012 were very similar between nitrification inhibitor and control treatments (Figures 6-7). The nitrification inhibitor, which has an efficacy for 3-4 weeks (see section 2.2. of this report), and the liquid UAN fertilizer were mixed and delivered as fertigations through the drip lines, and irrigation rewetting the volume of soil where fertilizer and nitrification inhibitor had been applied continued throughout the growing season. Both the measured inorganic N concentrations in the soil and the nature of the fertilizer delivery system do not seem to indicate that the earlier use of the nitrification inhibitor caused the high fall N2O emissions.
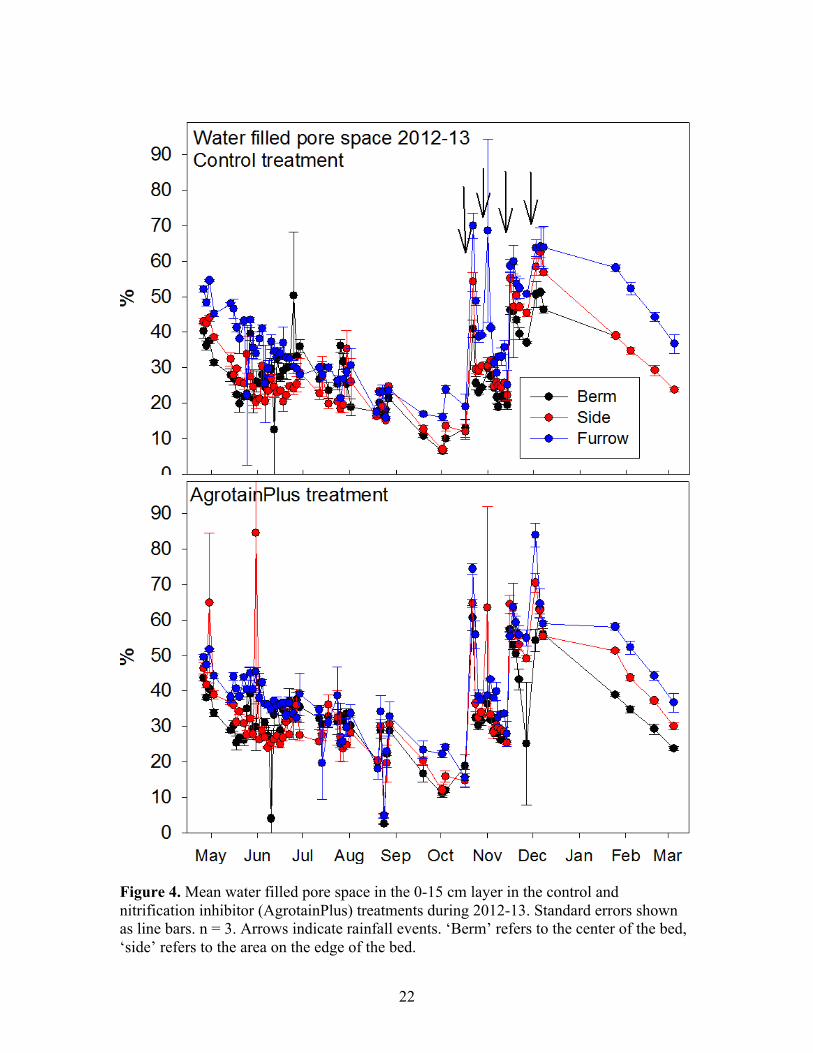
The most likely reason for the high N2O emissions in the 2012 NI (AgrotainPlus) treatment is the higher WFPS following the fall rain events compared to that of the control treatment (Figure 4). Denitrification increases with increasing WFPS (Robertson & Groffmann, 2015)
Figure 1. Mean daily N2O flux and management and rain events in the control treatment in subsurface drip irrigated tomato system 2012-13. Error bars shown as line bars. n = 3. ‘Berm’ = middle of the bed; ‘side’ = area on the edge of the bed.

20
Figure 2. Mean daily N2O flux and management and rain events in the treatment receiving the nitrification inhibitor AgrotainPlus together with the N fertilizer in subsurface drip irrigated tomato system 2012-13. Error bars shown as line bars. n = 3.
Figure 3. Mean daily N2O fluxes and management and rain events in the control and in the treatment receiving the nitrification inhibitor AgrotainPlus (NI) together with the N fertilizer in subsurface drip irrigated tomato system 2013-14. Error bars shown as line bars. n = 3.
21
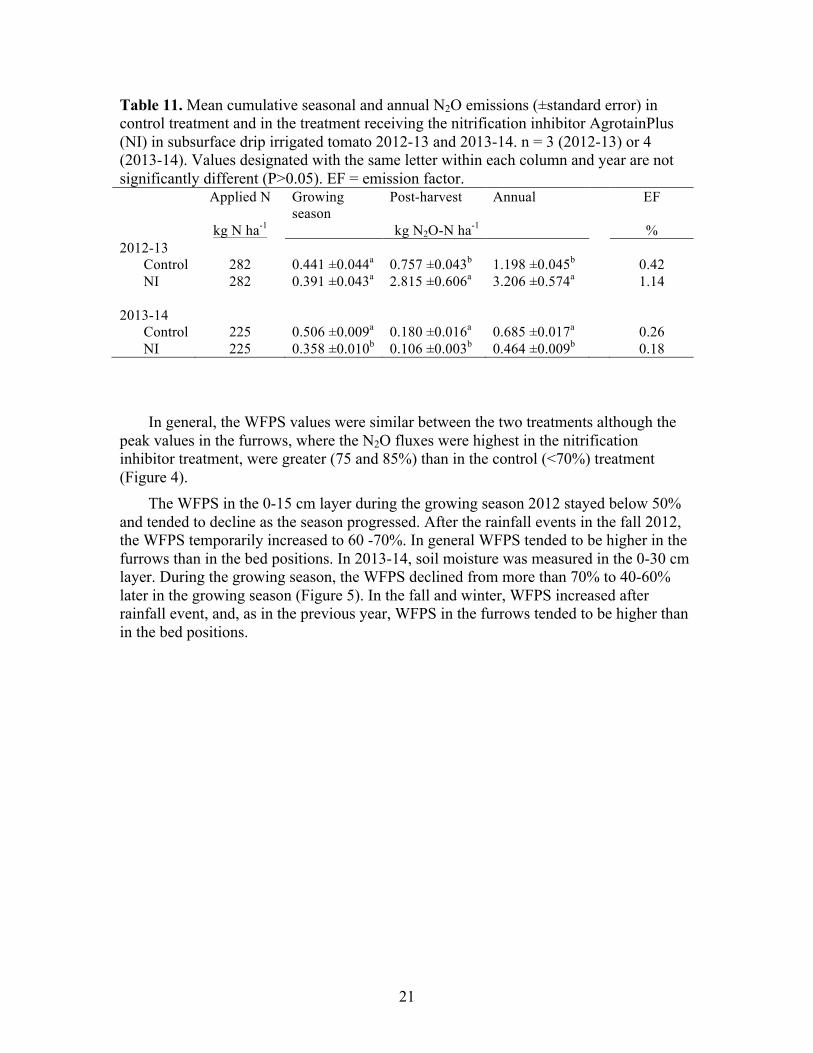
Table 11. Mean cumulative seasonal and annual N2O emissions (±standard error) in control treatment and in the treatment receiving the nitrification inhibitor AgrotainPlus (NI) in subsurface drip irrigated tomato 2012-13 and 2013-14. n = 3 (2012-13) or 4 (2013-14). Values designated with the same letter within each column and year are not significantly different (P>0.05). EF = emission factor. Applied N Growing
season Post-harvest Annual EF
kg N ha-1 kg N2O-N ha-1 % 2012-13 Control 282 0.441 ±0.044a 0.757 ±0.043b 1.198 ±0.045b 0.42 NI 282 0.391 ±0.043a 2.815 ±0.606a 3.206 ±0.574a 1.14 2013-14 Control 225 0.506 ±0.009a 0.180 ±0.016a 0.685 ±0.017a 0.26 NI 225 0.358 ±0.010b 0.106 ±0.003b 0.464 ±0.009b 0.18
In general, the WFPS values were similar between the two treatments although the peak values in the furrows, where the N2O fluxes were highest in the nitrification inhibitor treatment, were greater (75 and 85%) than in the control (<70%) treatment (Figure 4).
The WFPS in the 0-15 cm layer during the growing season 2012 stayed below 50% and tended to decline as the season progressed. After the rainfall events in the fall 2012, the WFPS temporarily increased to 60 -70%. In general WFPS tended to be higher in the furrows than in the bed positions. In 2013-14, soil moisture was measured in the 0-30 cm layer. During the growing season, the WFPS declined from more than 70% to 40-60% later in the growing season (Figure 5). In the fall and winter, WFPS increased after rainfall event, and, as in the previous year, WFPS in the furrows tended to be higher than in the bed positions.
22
Figure 4. Mean water filled pore space in the 0-15 cm layer in the control and nitrification inhibitor (AgrotainPlus) treatments during 2012-13. Standard errors shown as line bars. n = 3. Arrows indicate rainfall events. ‘Berm’ refers to the center of the bed, ‘side’ refers to the area on the edge of the bed.

23
Figure 5. Mean soil water filled pore space in the 0-30 cm layer in subsurface drip-irrigated tomato systems in 2013-14. Standard errors shown as line bars. n = 4. Arrows indicate rainfall events.
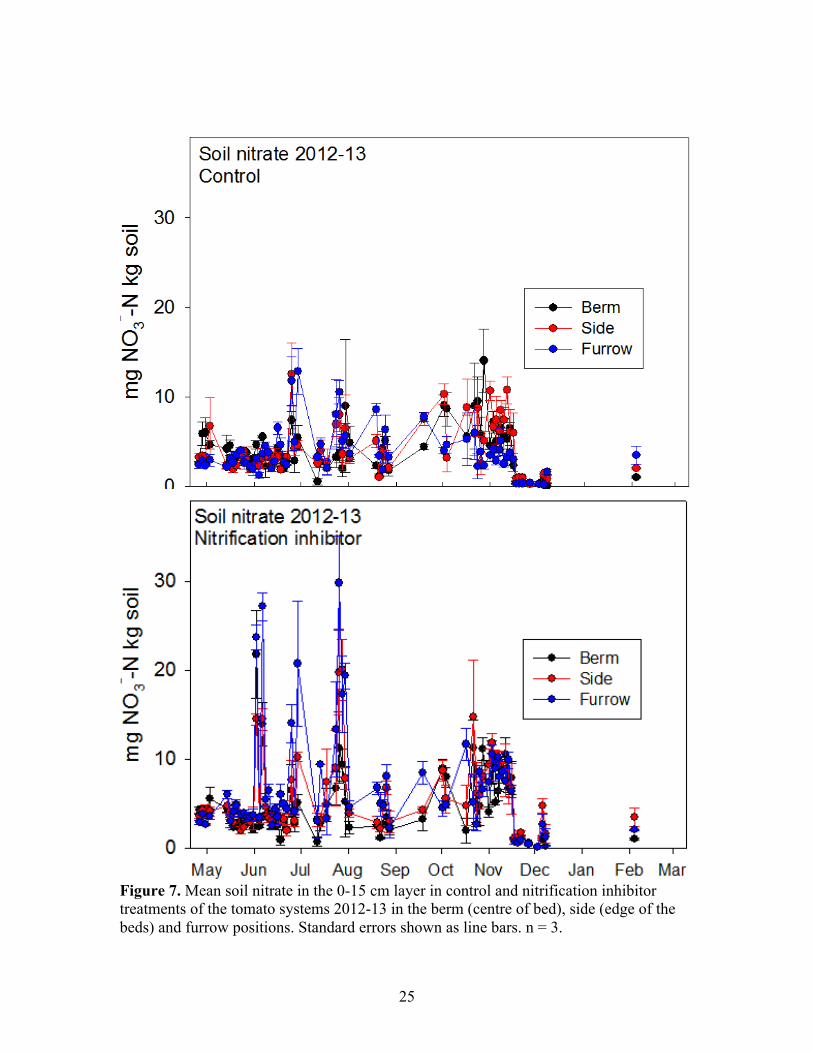
In 2012-13, in both treatments, soil ammonium concentrations tended to be higher in the berms during the growing season (Figure 6). In the fall, soil ammonium concentrations tended to be higher in the furrow positions of the NI treatment. Most soil nitrate concentrations were around 10 mg N kg-1 in both treatments (Figure 7). During the growing season, soil nitrate concentrations tended to be higher in the furrows of the NI treatment.

24
Figure 6. Mean soil ammonium in the 0-15 cm layer in control and nitrification inhbitor treatments of the tomato systems 2012-13 in the berm (centre of bed), side (edge of the beds) and furrow positions. Standard errors shown as line bars. n = 3.
25
Figure 7. Mean soil nitrate in the 0-15 cm layer in control and nitrification inhibitor treatments of the tomato systems 2012-13 in the berm (centre of bed), side (edge of the beds) and furrow positions. Standard errors shown as line bars. n = 3.
26
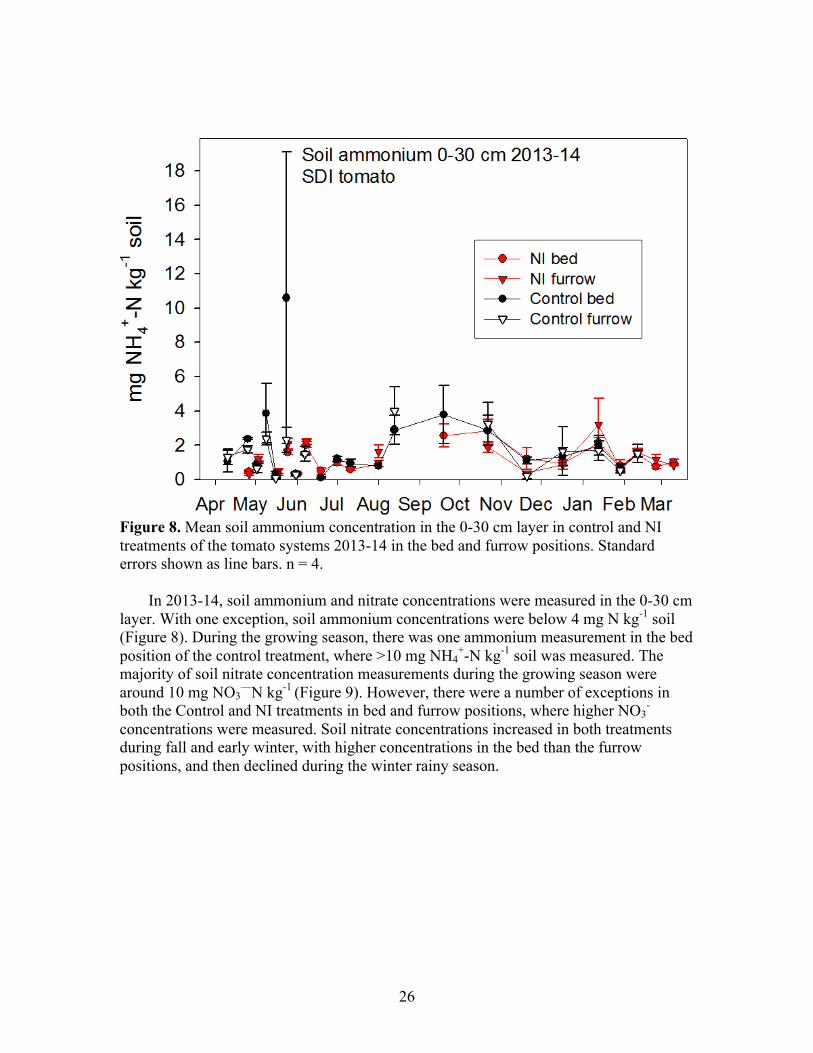
Figure 8. Mean soil ammonium concentration in the 0-30 cm layer in control and NI treatments of the tomato systems 2013-14 in the bed and furrow positions. Standard errors shown as line bars. n = 4.
In 2013-14, soil ammonium and nitrate concentrations were measured in the 0-30 cm layer. With one exception, soil ammonium concentrations were below 4 mg N kg-1 soil (Figure 8). During the growing season, there was one ammonium measurement in the bed position of the control treatment, where >10 mg NH4
+-N kg-1 soil was measured. The majority of soil nitrate concentration measurements during the growing season were around 10 mg NO3
—N kg-1 (Figure 9). However, there were a number of exceptions in both the Control and NI treatments in bed and furrow positions, where higher NO3
- concentrations were measured. Soil nitrate concentrations increased in both treatments during fall and early winter, with higher concentrations in the bed than the furrow positions, and then declined during the winter rainy season.

27
Figure 9. Mean soil nitrate concentrations in the 0-30 cm layer in control and NI treatments of the tomato systems 2013-14 in the bed and furrow positions. Standard errors shown as line bars. n = 4.

28
3.1.b Organic tomato system
Figure 10. Mean daily N2O flux and management and rain events in the organically managed furrow-irrigated tomato system 2012-13. Error bars shown as line bars. n = 3. ‘Berm’ = middle of the bed; ‘side’ = area on the edge of the bed.
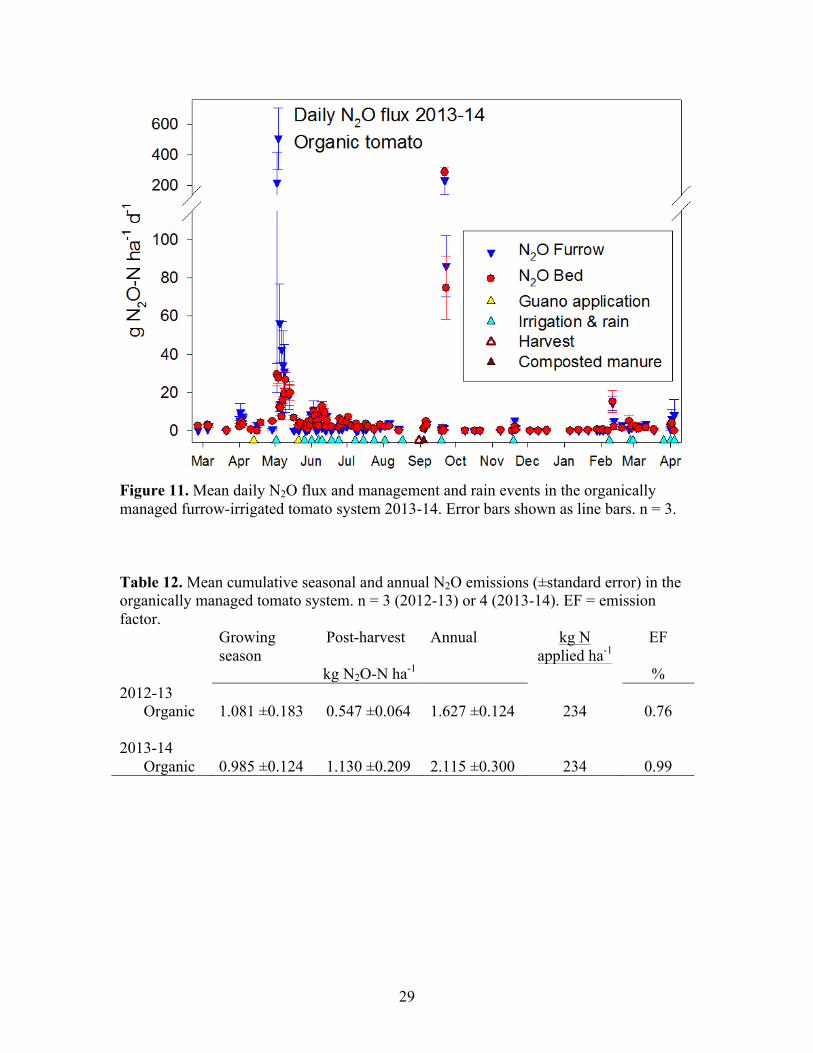
The N2O emissions in the furrow-irrigated organically managed tomato fields showed a similar pattern from year-to-year and between growing and post-harvest seasons (Table 11). At both sites, early growing season N2O fluxes contributed the most to the seasonal emissions (Figures 10 and 11). In both years, a small amount of guano was applied at planting and about 30 kg N ha-1 as side dress. However, the guano did not seem to have a pronounced effect on N2O emissions since the largest peaks of N2O flux occurred before the guano application (Figure 11 & Table 4). The N2O emissions following the first rainfall marked the single most pronounced post-harvest N2O emission event. In both years, growing season N2O emissions made up roughly half of the annual N2O emissions.
In the organic tomato system in both years, the highest daily fluxes were measured early in the growing season and following the first rainfall after harvest in the fall (Figures 10 & 11). Both the growing season and annual N2O emissions in the organically managed tomato fields were similar between the two years (Table 12).
29
Figure 11. Mean daily N2O flux and management and rain events in the organically managed furrow-irrigated tomato system 2013-14. Error bars shown as line bars. n = 3. Table 12. Mean cumulative seasonal and annual N2O emissions (±standard error) in the organically managed tomato system. n = 3 (2012-13) or 4 (2013-14). EF = emission factor. Growing
season Post-harvest Annual kg N
applied ha-1 EF
kg N2O-N ha-1 % 2012-13 Organic 1.081 ±0.183 0.547 ±0.064 1.627 ±0.124 234 0.76 2013-14 Organic 0.985 ±0.124 1.130 ±0.209 2.115 ±0.300 234 0.99
30
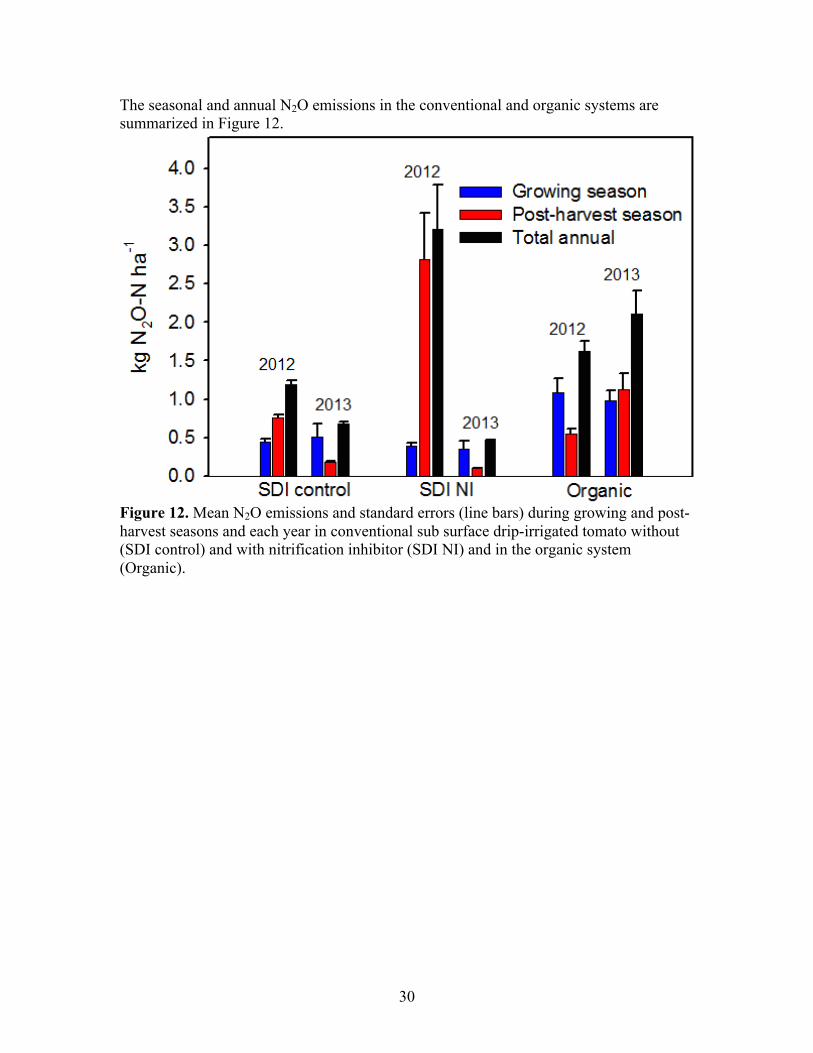
The seasonal and annual N2O emissions in the conventional and organic systems are summarized in Figure 12.
Figure 12. Mean N2O emissions and standard errors (line bars) during growing and post-harvest seasons and each year in conventional sub surface drip-irrigated tomato without (SDI control) and with nitrification inhibitor (SDI NI) and in the organic system (Organic).

31
Figure 13. Mean water filled pore space in berm, side, and furrow positions in the organic tomatoes in the 0-15 cm layer in 2012-13. Standard errors shown as line bars. n = 3.
In the furrow-irrigated organic tomato in 2012-13, the the highest WFPS values were recorded in the side and furrow positions, where WFPS fluctuated between approximately 50 and 70% (Figure 13). The WFPS reached again more than 60% with the rainfall events in the fall. Ammonium concentrations ranged between 10 and 60 mg NH4
+-N kg-1 in the center of the beds early on in the growing season (May), but for the remainder of the year, ammonium concentrations were below 5 mg NH4
+-N kg-1 (Figure 14). Nitrate concentrations were slightly elevated during the first half of the growing season.
In 2013-14, the WFPS in the furrows during the growing season was mostly above 70% and between 30 and 60% in the beds (Figure 15). Following harvest, WFPS ranged between 20 and 40% before rising again to 60% after the rainfall events in February 2014. The soil inorganic N concentrations were similar in 2013 as in 2014 with respect to the peaks reached early in the growing season (Figure 16). Later on through fall, soil ammonium conentratins were mostly below 10 mg N kg-1, but soil nitrate concentrations stayed above 40 mg N kg-1 through the winter rainy season.
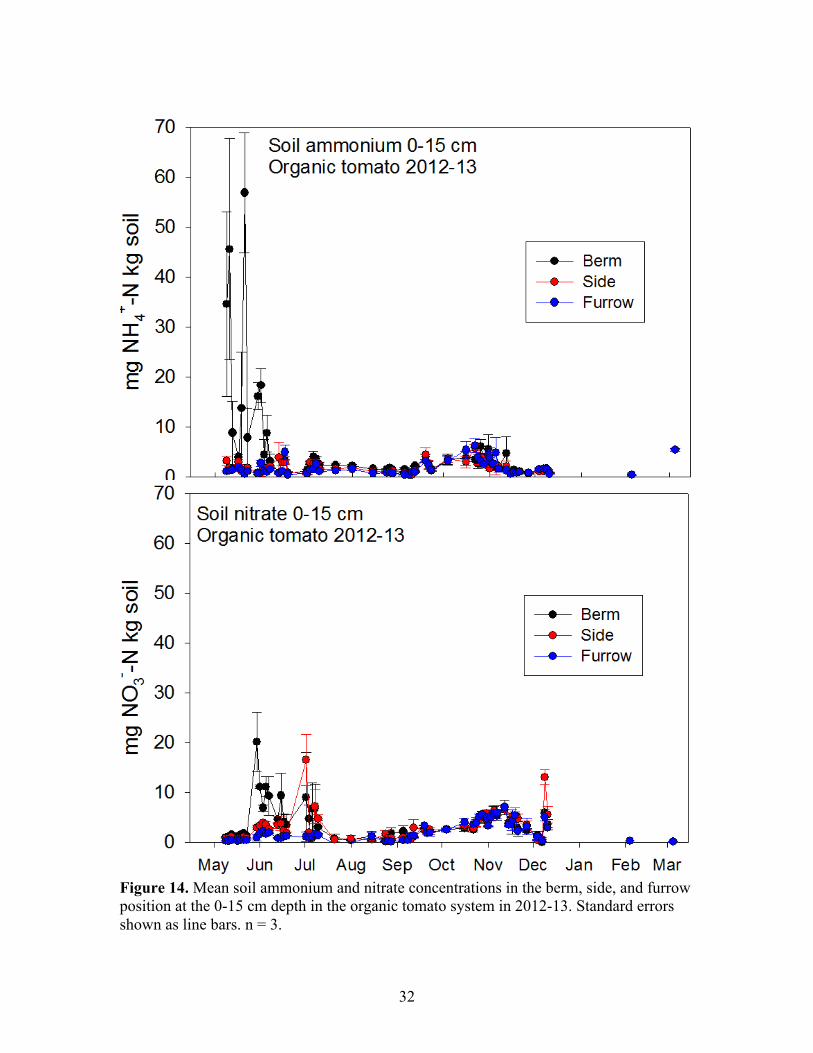
32
Figure 14. Mean soil ammonium and nitrate concentrations in the berm, side, and furrow position at the 0-15 cm depth in the organic tomato system in 2012-13. Standard errors shown as line bars. n = 3.

33
Figure 15. Water filled pore space in the 0-15 cm layer in beds and furrows in the organic tomato system 2013-14.
Figure 16. Soil ammonium and nitrate concentrations in the 0-15 cm layer in the organic tomato system 2013-14. Standard errors shown as line bars. n = 4.
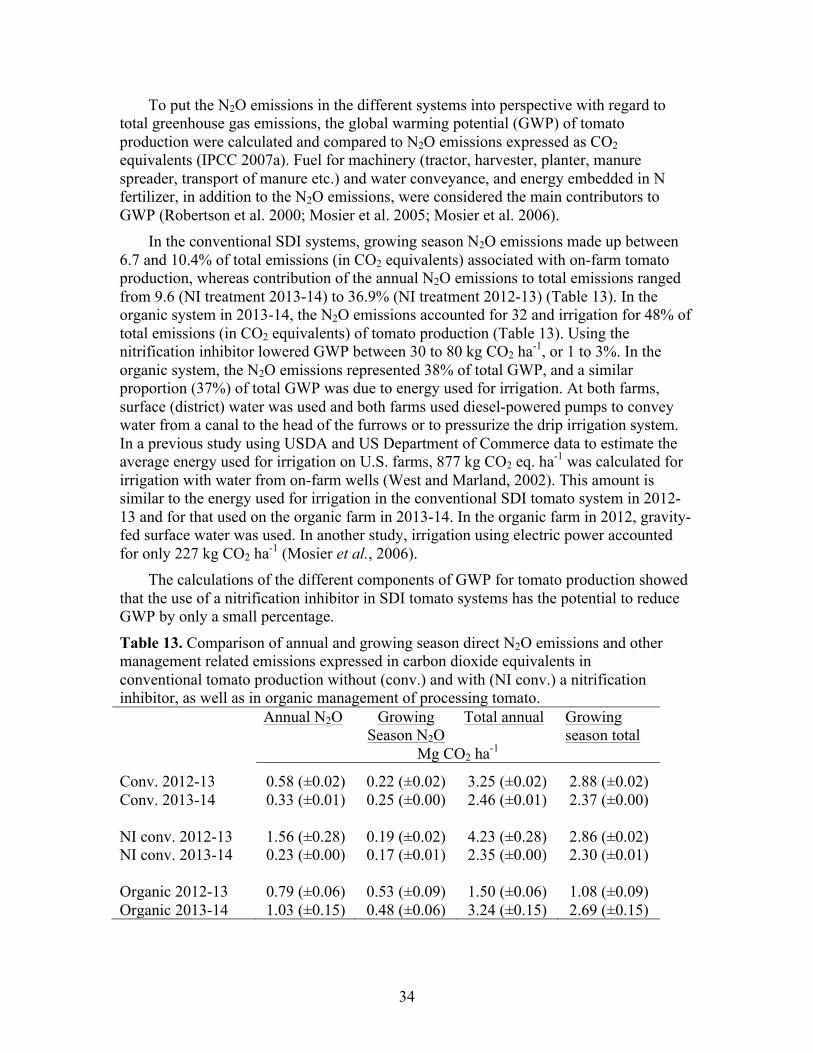
34
To put the N2O emissions in the different systems into perspective with regard to total greenhouse gas emissions, the global warming potential (GWP) of tomato production were calculated and compared to N2O emissions expressed as CO2 equivalents (IPCC 2007a). Fuel for machinery (tractor, harvester, planter, manure spreader, transport of manure etc.) and water conveyance, and energy embedded in N fertilizer, in addition to the N2O emissions, were considered the main contributors to GWP (Robertson et al. 2000; Mosier et al. 2005; Mosier et al. 2006).
In the conventional SDI systems, growing season N2O emissions made up between 6.7 and 10.4% of total emissions (in CO2 equivalents) associated with on-farm tomato production, whereas contribution of the annual N2O emissions to total emissions ranged from 9.6 (NI treatment 2013-14) to 36.9% (NI treatment 2012-13) (Table 13). In the organic system in 2013-14, the N2O emissions accounted for 32 and irrigation for 48% of total emissions (in CO2 equivalents) of tomato production (Table 13). Using the nitrification inhibitor lowered GWP between 30 to 80 kg CO2 ha-1, or 1 to 3%. In the organic system, the N2O emissions represented 38% of total GWP, and a similar proportion (37%) of total GWP was due to energy used for irrigation. At both farms, surface (district) water was used and both farms used diesel-powered pumps to convey water from a canal to the head of the furrows or to pressurize the drip irrigation system. In a previous study using USDA and US Department of Commerce data to estimate the average energy used for irrigation on U.S. farms, 877 kg CO2 eq. ha-1 was calculated for irrigation with water from on-farm wells (West and Marland, 2002). This amount is similar to the energy used for irrigation in the conventional SDI tomato system in 2012-13 and for that used on the organic farm in 2013-14. In the organic farm in 2012, gravity-fed surface water was used. In another study, irrigation using electric power accounted for only 227 kg CO2 ha-1 (Mosier et al., 2006).
The calculations of the different components of GWP for tomato production showed that the use of a nitrification inhibitor in SDI tomato systems has the potential to reduce GWP by only a small percentage.
Table 13. Comparison of annual and growing season direct N2O emissions and other management related emissions expressed in carbon dioxide equivalents in conventional tomato production without (conv.) and with (NI conv.) a nitrification inhibitor, as well as in organic management of processing tomato. Annual N2O Growing
Season N2O Total annual Growing
season total Mg CO2 ha-1 Conv. 2012-13 0.58 (±0.02) 0.22 (±0.02) 3.25 (±0.02) 2.88 (±0.02) Conv. 2013-14 0.33 (±0.01) 0.25 (±0.00) 2.46 (±0.01) 2.37 (±0.00) NI conv. 2012-13 1.56 (±0.28) 0.19 (±0.02) 4.23 (±0.28) 2.86 (±0.02) NI conv. 2013-14 0.23 (±0.00) 0.17 (±0.01) 2.35 (±0.00) 2.30 (±0.01) Organic 2012-13 0.79 (±0.06) 0.53 (±0.09) 1.50 (±0.06) 1.08 (±0.09) Organic 2013-14 1.03 (±0.15) 0.48 (±0.06) 3.24 (±0.15) 2.69 (±0.15)

35
Plant and harvest data were only collected in year two (2013-14) of the experiment (Table 14). The nitrification inhibitor had no effect on tomato N uptake, which was similar between control and nitrification inhibitor treatments. In the conventional systems, the apparent N uptake efficiency was 73 and 74% of applied fertilizer N plus pre-plant soil nitrate, which is lower than the average apparent N use efficiency (83.6%) among 16 California subsurface drip-irrigated tomato grower fields according to a recent survey (Lazcano et al., 2015). Assuming a similar amount of N was added as manure in fall 2012 (analyses missing) as in fall 2013, the apparent NUEs would be 71 and 73%. In the organic system, the apparent NUE seemed higher, but the variability among samples was greater too. The apparent NUE in the organic system is likely underestimated because not all the N in the composted manure was plant available in the cropping season following the application of the manure. Table 14 shows that in all systems only about half of the applied N was exported with the harvested fruit. Table 14. Mean yield, fruit N, biomass N uptake, and N use efficiencies (NUE) (±standard errors) in tomato systems in 2013. NI = nitrification inhibitor. Yield N red fruit N uptake NUEfruit
* NUEuptake*
Mg ha-1 kg ha-1 % Conv. 105 (±6) 177 (±15) 219 (±9) 59 (±3) 73 (±3) NI conv. 101 (±8) 137 (±9) 220 (±12) 46 (±3) 74 (±4) Organic 108 (±19) 170 (±23) 288 (±33) 50 (±7) 85 (±10) *To calculate apparent NUE, pre-plant inorganic N of the 0-60 cm layer of 73 kg ha-1 and fertilizer N were used for the conventional SDI system; for the organic system, the N inputs used were pre-plant inorganic N of the 0-60 cm layer of 123 kg ha-1, guano-N, and total N in composted manure applied in fall 2012.
3.2 Corn 3.2.a Campbell tract 2012
In the corn experiments at the UC Davis Campbell tract, the source of N had a clear effect on N2O emissions, while the effects of two different nitrification inhibitors on the N2O emissions indicated nitrification as the main source of N2O. The bulk of the N2O emissions in all treatments occurred after the N fertilizer side dress application.
In all the N fertilized treatments, there was a sharp increase in emissions following the side dress N application of 202 kg N ha-1 on June 25, 2012 (Figures 17 and 18). The daily emissions between the sidedress application and the beginning of August ranged approximately between 60 and 100 g N2O-N ha-1, those of the UAN treatment between 30 and 40 g N2O-N ha-1, and those of the calcium nitrate treatment between 5 and 20 g N2O-N ha-1. The daily N2O emissions were lower in the UAN fertilized treatments that also received either of the nitrification inhibitors. However, application of the
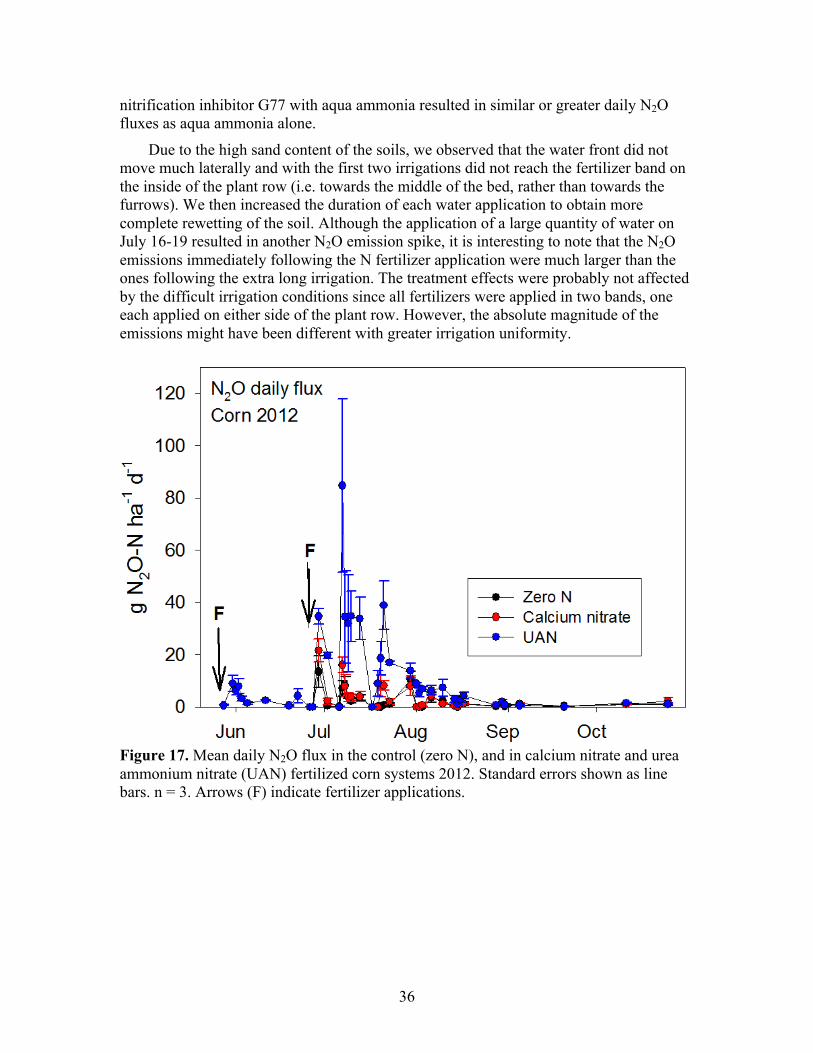
36
nitrification inhibitor G77 with aqua ammonia resulted in similar or greater daily N2O fluxes as aqua ammonia alone.
Due to the high sand content of the soils, we observed that the water front did not move much laterally and with the first two irrigations did not reach the fertilizer band on the inside of the plant row (i.e. towards the middle of the bed, rather than towards the furrows). We then increased the duration of each water application to obtain more complete rewetting of the soil. Although the application of a large quantity of water on July 16-19 resulted in another N2O emission spike, it is interesting to note that the N2O emissions immediately following the N fertilizer application were much larger than the ones following the extra long irrigation. The treatment effects were probably not affected by the difficult irrigation conditions since all fertilizers were applied in two bands, one each applied on either side of the plant row. However, the absolute magnitude of the emissions might have been different with greater irrigation uniformity.
Figure 17. Mean daily N2O flux in the control (zero N), and in calcium nitrate and urea ammonium nitrate (UAN) fertilized corn systems 2012. Standard errors shown as line bars. n = 3. Arrows (F) indicate fertilizer applications.
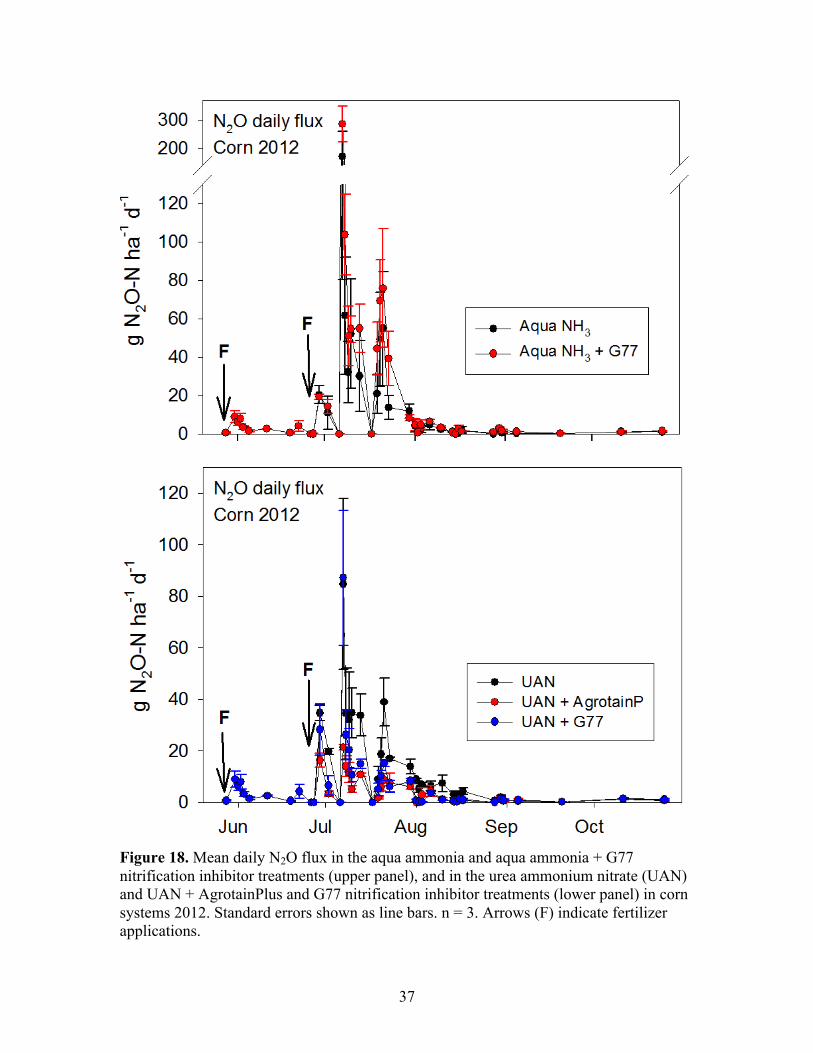
37
Figure 18. Mean daily N2O flux in the aqua ammonia and aqua ammonia + G77 nitrification inhibitor treatments (upper panel), and in the urea ammonium nitrate (UAN) and UAN + AgrotainPlus and G77 nitrification inhibitor treatments (lower panel) in corn systems 2012. Standard errors shown as line bars. n = 3. Arrows (F) indicate fertilizer applications.

38
Figure 19. Mean cumulative growing season N2O emissions in the following fertilizer treatments in corn system 2012: Aqua ammonia (Aq. NH3), Aq. NH3 + nitrification inhibitor (NI) G77, Urea ammonium nitrate (UAN), UAN + NI AgrotainPlus, UAN + G77, calcium nitrate, control (zero N). Standard errors shown as line bars. n = 3. Bars designated with the same letters are not significantly different from each other (P <0.05). The fertilizer N application rate was 222 kg N ha-1 (20 kg N ha-1 in the control).
The total cumulative N2O emissions were highest in the aqua ammonia fertilized treatments, intermediate in the UAN treatment, and lowest in the UAN treatments also receiving a nitrification inhibitor, the calcium nitrate and the control treatments (Figure 19). Total N2O emissions did not significantly differ between aqua ammonia and aqua ammonia + G77 nitrification inhibitor treatments. The cumulative total N2O emissions did not significantly differ between UAN receiving the AgrotainPlus or G77 nitrification inhibitor. For a summary of results, see also Table 18 at the end of the corn section.
Nitrification has been shown to be the major source of N2O from ammonical fertilizer sources under low oxygen conditions (Zhu et al., 2013), which may have existed in parts of these soils after irrigations, so it is not surprising that the highest cumulative emissions were measured in the aqua ammonia treatment. First of all, in this treatment, the greatest amount of NH4
+ substrate was available since aqua ammonia is 100% NH3, whereas 25% of the N in UAN fertilizer is nitrate. Second, application of ammonia fertilizer has the potential to raise the soil pH, and alkaline forming N fertilizers promote denitrification and nitrifier denitrification (Mulvaney et al., 1997). A third factor may be that application of ammonia in soil leads to localized zones of high concentration of ammonium near the surface because this ion adheres to negatively charged exchange sites on clay particles and organic matter. Most of the aqueous ammonia was probably concentrated as ammonium near the point of injection. It is likely that much of the N2O produced following the aqua ammonia side dress application formed as the by-product of
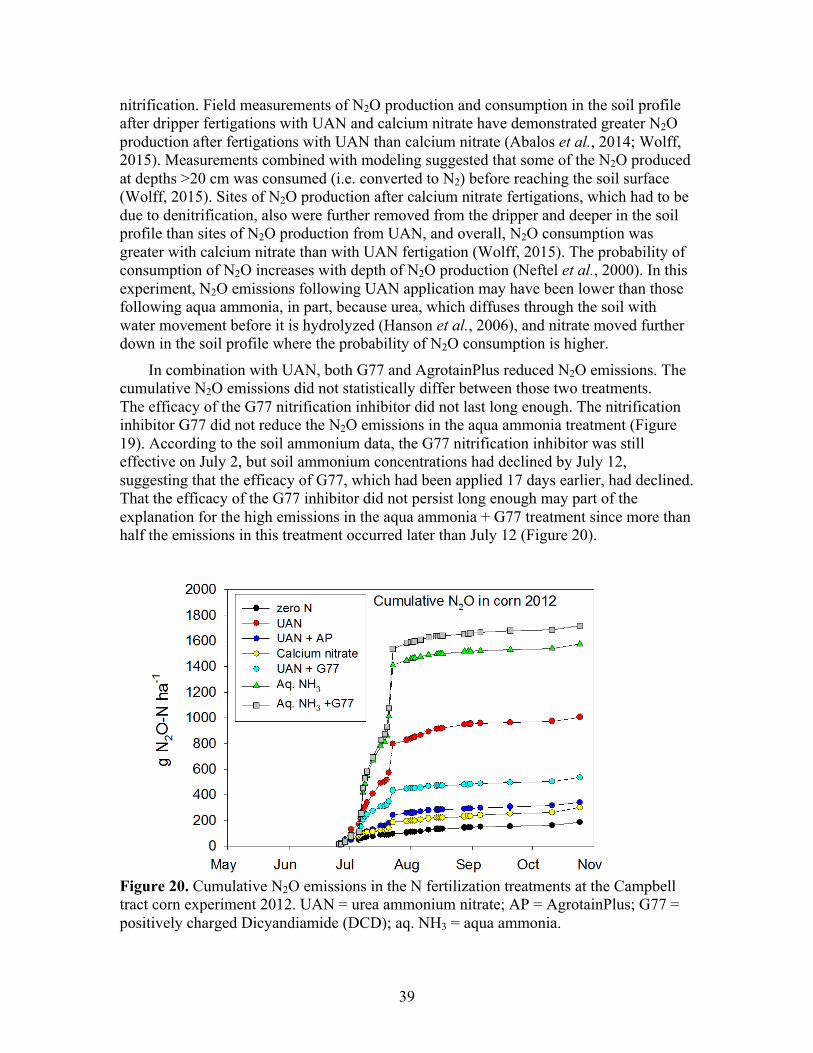
39
nitrification. Field measurements of N2O production and consumption in the soil profile after dripper fertigations with UAN and calcium nitrate have demonstrated greater N2O production after fertigations with UAN than calcium nitrate (Abalos et al., 2014; Wolff, 2015). Measurements combined with modeling suggested that some of the N2O produced at depths >20 cm was consumed (i.e. converted to N2) before reaching the soil surface (Wolff, 2015). Sites of N2O production after calcium nitrate fertigations, which had to be due to denitrification, also were further removed from the dripper and deeper in the soil profile than sites of N2O production from UAN, and overall, N2O consumption was greater with calcium nitrate than with UAN fertigation (Wolff, 2015). The probability of consumption of N2O increases with depth of N2O production (Neftel et al., 2000). In this experiment, N2O emissions following UAN application may have been lower than those following aqua ammonia, in part, because urea, which diffuses through the soil with water movement before it is hydrolyzed (Hanson et al., 2006), and nitrate moved further down in the soil profile where the probability of N2O consumption is higher.
In combination with UAN, both G77 and AgrotainPlus reduced N2O emissions. The cumulative N2O emissions did not statistically differ between those two treatments. The efficacy of the G77 nitrification inhibitor did not last long enough. The nitrification inhibitor G77 did not reduce the N2O emissions in the aqua ammonia treatment (Figure 19). According to the soil ammonium data, the G77 nitrification inhibitor was still effective on July 2, but soil ammonium concentrations had declined by July 12, suggesting that the efficacy of G77, which had been applied 17 days earlier, had declined. That the efficacy of the G77 inhibitor did not persist long enough may part of the explanation for the high emissions in the aqua ammonia + G77 treatment since more than half the emissions in this treatment occurred later than July 12 (Figure 20).
Figure 20. Cumulative N2O emissions in the N fertilization treatments at the Campbell tract corn experiment 2012. UAN = urea ammonium nitrate; AP = AgrotainPlus; G77 = positively charged Dicyandiamide (DCD); aq. NH3 = aqua ammonia.
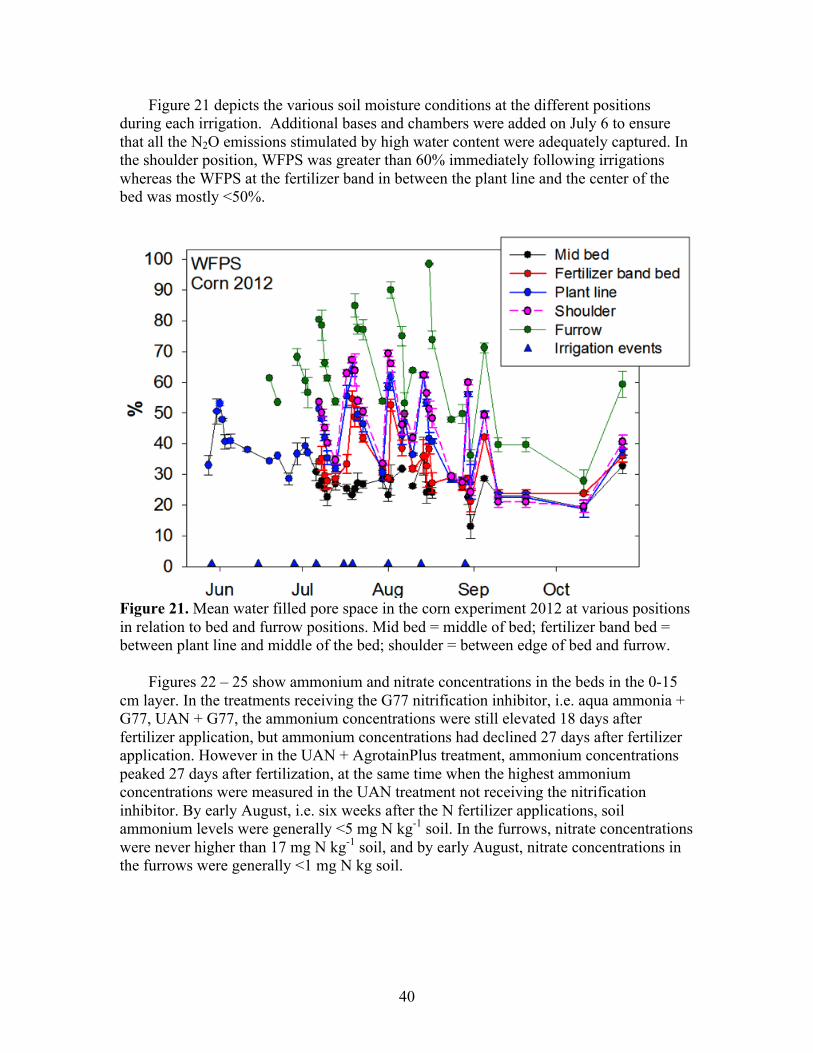
40
Figure 21 depicts the various soil moisture conditions at the different positions during each irrigation. Additional bases and chambers were added on July 6 to ensure that all the N2O emissions stimulated by high water content were adequately captured. In the shoulder position, WFPS was greater than 60% immediately following irrigations whereas the WFPS at the fertilizer band in between the plant line and the center of the bed was mostly <50%.
Figure 21. Mean water filled pore space in the corn experiment 2012 at various positions in relation to bed and furrow positions. Mid bed = middle of bed; fertilizer band bed = between plant line and middle of the bed; shoulder = between edge of bed and furrow.
Figures 22 – 25 show ammonium and nitrate concentrations in the beds in the 0-15 cm layer. In the treatments receiving the G77 nitrification inhibitor, i.e. aqua ammonia + G77, UAN + G77, the ammonium concentrations were still elevated 18 days after fertilizer application, but ammonium concentrations had declined 27 days after fertilizer application. However in the UAN + AgrotainPlus treatment, ammonium concentrations peaked 27 days after fertilization, at the same time when the highest ammonium concentrations were measured in the UAN treatment not receiving the nitrification inhibitor. By early August, i.e. six weeks after the N fertilizer applications, soil ammonium levels were generally <5 mg N kg-1 soil. In the furrows, nitrate concentrations were never higher than 17 mg N kg-1 soil, and by early August, nitrate concentrations in the furrows were generally <1 mg N kg soil.

41
Figure 22. Mean soil ammonium (upper panel) and nitrate (lower panel) concentrations in the aqua ammonia (NH3) and aqua NH3 + G77 nitrification inhibitor treatments in the bed 0-15 cm layer in corn. Standard errors shown as line bars. n = 3.

42
Figure 23. Mean soil ammonium (upper panel) and nitrate (lower panel) concentrations in the urea ammonium nitrate (UAN) and UAN + AgrotainPlus and G77 nitrification inhibitor treatments in the bed 0-15 cm layer in corn. Standard errors shown as line bars. n = 3.

43
Figure 24. Mean soil ammonium (upper panel) and nitrate (lower panel) concentrations in the control (zero N), calcium nitrate, and urea ammonium nitrate (UAN) treatments in the bed 0-15 cm layer in corn. Standard errors shown as line bars. n = 3.
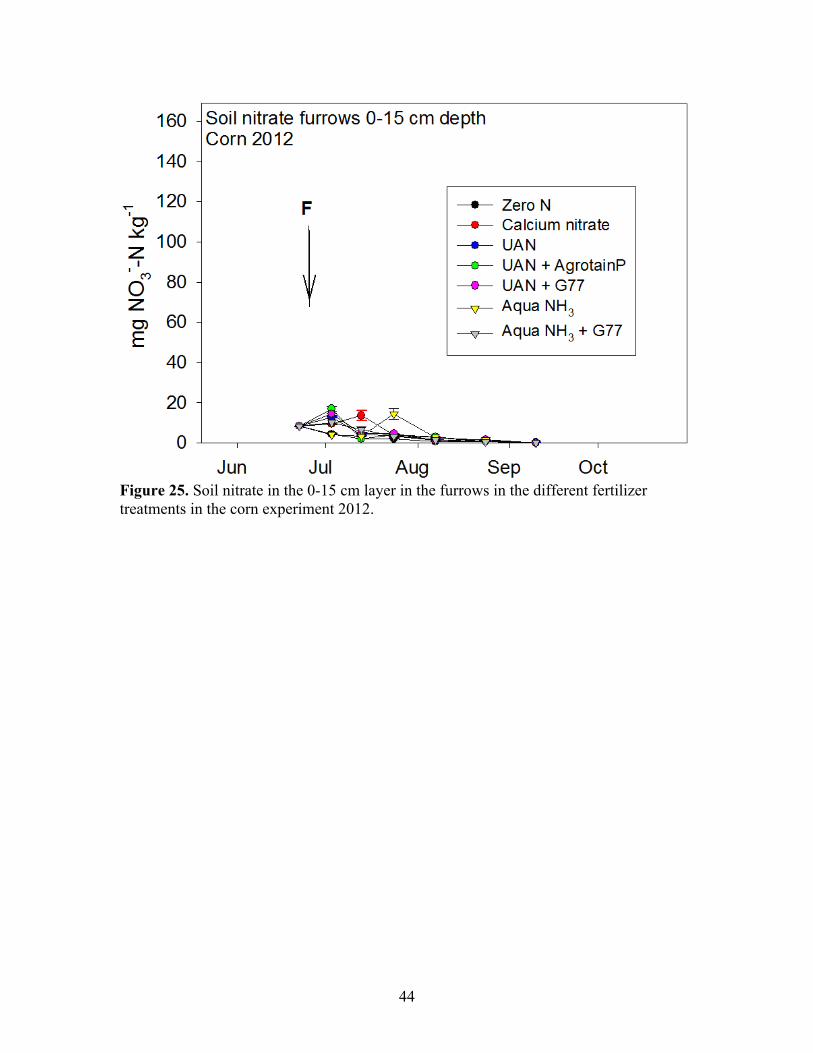
44
Figure 25. Soil nitrate in the 0-15 cm layer in the furrows in the different fertilizer treatments in the corn experiment 2012.

45
Crop N uptake 18 days after the fertilizer N application ranged between 54 and 107 kg N ha-1 (Figure 26). About one month after the fertilizer application the corn crop had taken up about 160 kg N ha-1, and by early August, the crop had taken up between 200-300 kg N ha-1 in the N fertilized treatments.
Nitrification inhibitors only work effectively if crops take up significant quantities of ammonium before it is nitrified. Crop N uptake data showed that by the time the efficacy of the nitrification inhibitors declined, the corn had taken up between 60 and 105 kg N ha-1 (Figure 24), so a substantial amount of the N may have been taken up as ammonium. However, from about the middle of July onwards, the crop must have mostly taken up nitrate. The crop N uptake data highlight how important it is to apply nitrification inhibitors when crop N demand and root proliferation are great enough to take up a good portion of N as ammonium. Ideally nitrification inhibitors are applied just before crop N uptake accelerates. Corn N uptake increases dramatically at the V8 stage (Bender et al., 2013), which was reached towards the end of July. So, making optimal use of the currently approved nitrification inhibitors is not possible, and in corn, side dress application as late as possible is of utmost importance. Development and approval of nitrification inhibitors with longer efficacy could greatly increase the usefulness of these products.
Figure 26. Corn N uptake in the different fertilizer treatments in corn system 2012.

46
Corn yields did not significantly differ among the fertilized treatments (Table 15). However, grain N content in UAN and control treatments in two of the three nitrification inhibitor treatments, but this result was not further supported by soil inorganic N data.
Table 15. Mean corn yields (±standard errors) and grain N content in 2012. Values designated with the same letters are not significantly different from each other (P<0.05). n = 3. Treatment Yield Grain N Mg ha-1 kg N ha-1 Zero N 3.50 (±0.52) 53.0 (±15.4)b
UAN 9.47 (±0.71) 58.7 (±19.9)b
UAN +AgrotainPlus 9.38 (±0.06) 102.7 (±6.9)a
UAN + G77 9.41 (±0.05) 88.8 (±8.9)ab
Aqua ammonia 8.58 (±0.87) 72.0 (±37.2)ab
Aqua ammonia + G77 8.79 (±0.37) 101.4 (±4.6)a
Calcium nitrate 9.10 (±0.46) 93.8 (±7.5)ab

47
3.2.b Stockton site
At the Stockton site in 2013-2015, we further tested the use of nitrification inhibitors and investigated the effects of N fertilizer placement and subsurface drip irrigation on N2O emissions. In contrast to the soil at the Campbell tract, which was a sandy loam, the soils at the Stockton site were rich in clay, so the irrigation conditions were quite different here.
At the Stockton site, the N2O emissions in 2013 increased dramatically with the first irrigation after the N fertilizer side dress application, and even higher peaks occurred with the second irrigation, but subsequent N2O peaks did not occur in all but the 1 band and High N treatments. (Figure 27). Applying the side dress N fertilizer in one band instead of two lead to higher peak fluxes und greater cumulative emissions of N2O. The N2O fluxes of the 1 band and high N treatment were elevated after 6 of the 9 irrigation events. By August, N2O fluxes in all the treatments were at background levels. In the SDI treatment, the highest daily N2O fluxes were 11 g N2O-N ha-1.
Figure 27. Daily N2O flux in control (zero N), one band N fertilizer per plant row (1 Band), high N rate, nitrification inhibitor (NI), two N fertilizer bands per plant row, and subsurface drip irrigated (Drip) treatments during the corn growing season 2013. Arrows indicate irrigation events.

48
Figure 28. Daily post-harvest N2O flux in control (zero N), one band N fertilizer per plant row (1 Band), high N rate, nitrification inhibitor (NI), two N fertilizer bands per plant row (2 Band), and subsurface drip irrigated (Drip) treatments following the corn growing season in 2013-14.
The highest daily fluxes during the fall-winter were approximately 10 g N2O-N ha-1
(Figure 28). During this period, the N2O fluxes in the SDI treatment were similar or greater than those of the other treatments.

49
Figure 29. Mean annual N2O emissions in control (zero N), one band N fertilizer per plant row (1 band), high N rate, nitrification inhibitor (NI), two N fertilizer bands per plant row (2 band), and subsurface drip irrigated (Drip) treatments in corn systems in 2013-14. Standard errors shown as line bars. n = 3. The fertilizer N rates were 226 in 2 band, NI and 1 band treatments, 345 kg N ha-1 in the High N treatment, and 8 kg N ha-1 in the control.
In 2013-14, the highest cumulative emissions occurred in the 1 band and high N treatment (Figure 29). However, the total emissions in the 2 band and NI treatment were not different from those of the 1 band and high N treatments based on Tukey’s mean comparison test. The total cumulative N2O emissions were significantly lower in the control and SDI than the 1 band and High N treatments.
In the second year (2014), two separate 1 band treatments were imposed with one band in the bed (i.e. on the inside of the plant row towards the middle of the bed) and the other in the bed’s shoulder. In 2014, the N2O fluxes were elevated after irrigations in all the furrow-irrigated treatments (Figure 30). Except for the NI treatment, the N2O fluxes did not recede to ambient levels in between irrigations. After the last four of nine irrigations total, the peaks kept getting smaller with every irrigation event. Daily fluxes in the SDI treatment were consistently low.
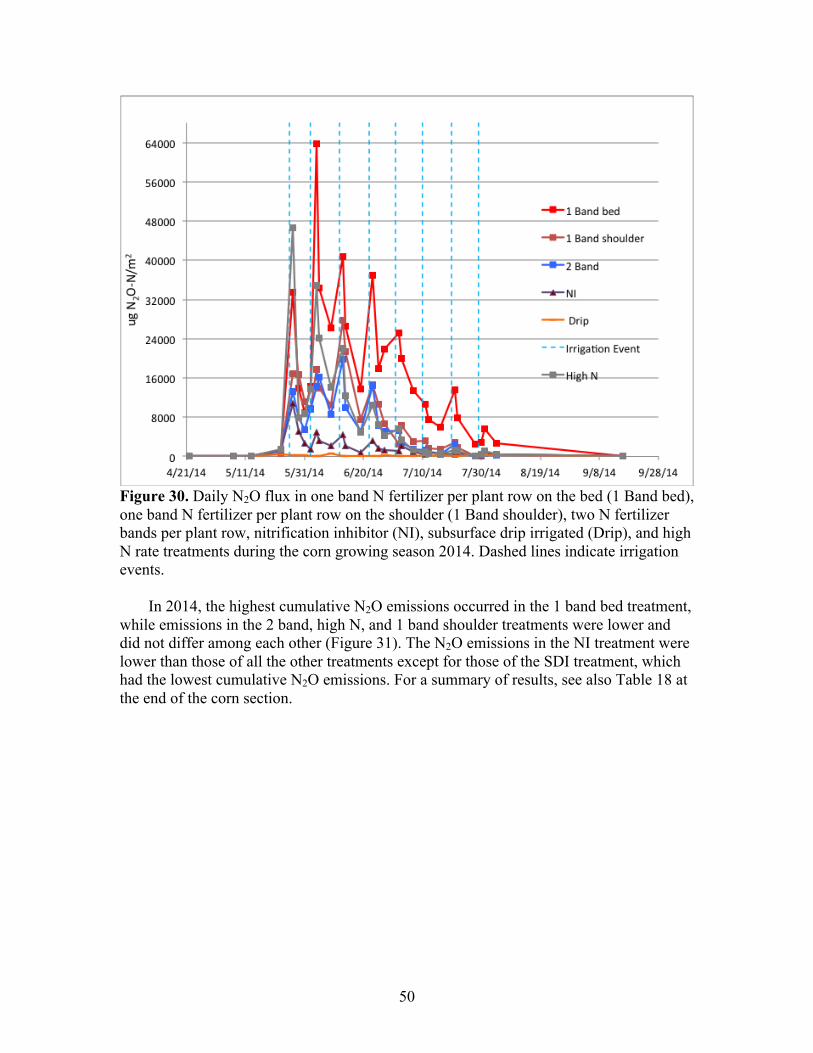
50
Figure 30. Daily N2O flux in one band N fertilizer per plant row on the bed (1 Band bed), one band N fertilizer per plant row on the shoulder (1 Band shoulder), two N fertilizer bands per plant row, nitrification inhibitor (NI), subsurface drip irrigated (Drip), and high N rate treatments during the corn growing season 2014. Dashed lines indicate irrigation events.
In 2014, the highest cumulative N2O emissions occurred in the 1 band bed treatment, while emissions in the 2 band, high N, and 1 band shoulder treatments were lower and did not differ among each other (Figure 31). The N2O emissions in the NI treatment were lower than those of all the other treatments except for those of the SDI treatment, which had the lowest cumulative N2O emissions. For a summary of results, see also Table 18 at the end of the corn section.
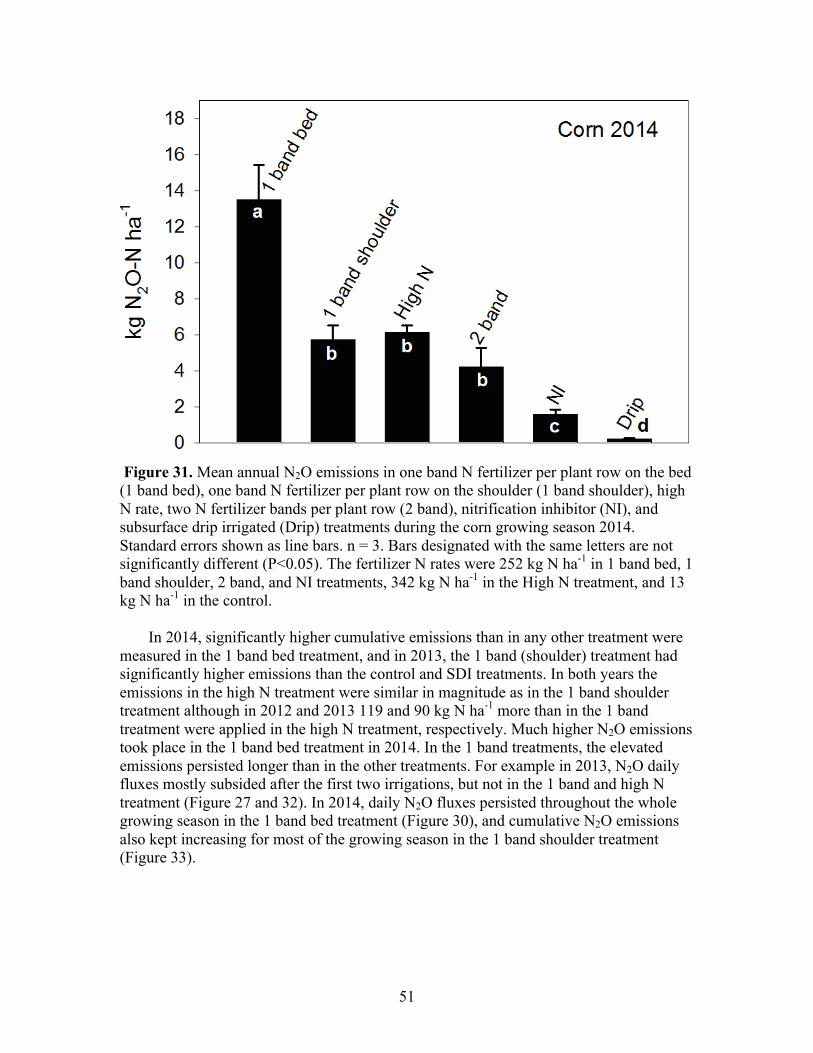
51
Figure 31. Mean annual N2O emissions in one band N fertilizer per plant row on the bed (1 band bed), one band N fertilizer per plant row on the shoulder (1 band shoulder), high N rate, two N fertilizer bands per plant row (2 band), nitrification inhibitor (NI), and subsurface drip irrigated (Drip) treatments during the corn growing season 2014. Standard errors shown as line bars. n = 3. Bars designated with the same letters are not significantly different (P<0.05). The fertilizer N rates were 252 kg N ha-1 in 1 band bed, 1 band shoulder, 2 band, and NI treatments, 342 kg N ha-1 in the High N treatment, and 13 kg N ha-1 in the control.
In 2014, significantly higher cumulative emissions than in any other treatment were measured in the 1 band bed treatment, and in 2013, the 1 band (shoulder) treatment had significantly higher emissions than the control and SDI treatments. In both years the emissions in the high N treatment were similar in magnitude as in the 1 band shoulder treatment although in 2012 and 2013 119 and 90 kg N ha-1 more than in the 1 band treatment were applied in the high N treatment, respectively. Much higher N2O emissions took place in the 1 band bed treatment in 2014. In the 1 band treatments, the elevated emissions persisted longer than in the other treatments. For example in 2013, N2O daily fluxes mostly subsided after the first two irrigations, but not in the 1 band and high N treatment (Figure 27 and 32). In 2014, daily N2O fluxes persisted throughout the whole growing season in the 1 band bed treatment (Figure 30), and cumulative N2O emissions also kept increasing for most of the growing season in the 1 band shoulder treatment (Figure 33).
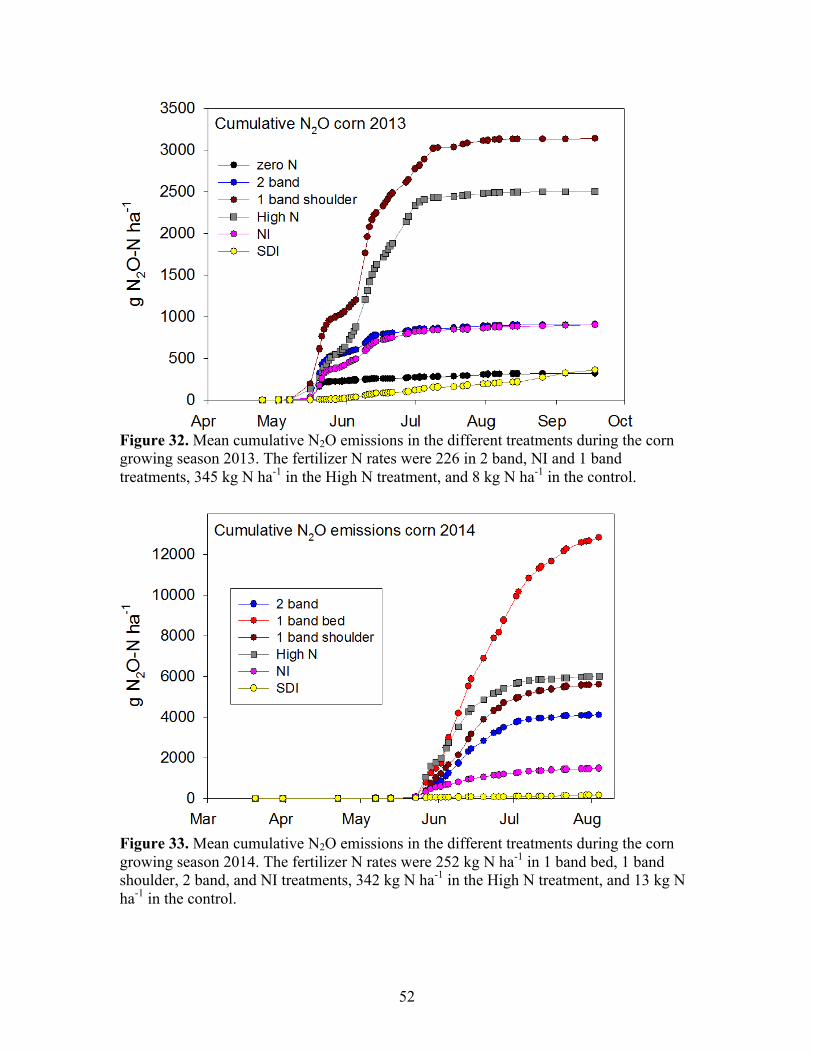
52
Figure 32. Mean cumulative N2O emissions in the different treatments during the corn growing season 2013. The fertilizer N rates were 226 in 2 band, NI and 1 band treatments, 345 kg N ha-1 in the High N treatment, and 8 kg N ha-1 in the control.
Figure 33. Mean cumulative N2O emissions in the different treatments during the corn growing season 2014. The fertilizer N rates were 252 kg N ha-1 in 1 band bed, 1 band shoulder, 2 band, and NI treatments, 342 kg N ha-1 in the High N treatment, and 13 kg N ha-1 in the control.

53
Figure 34. Weighted seasonal N2O emissions by chamber location in the different treatments in corn 2013. The weighting was 65, 25, and 10% for bed, shoulder and furrow emissions, respectively. The fertilizer N rates were 226 in 2 band, NI and 1 band treatments, 345 kg N ha-1 in the High N treatment, and 8 kg N ha-1 in the control.
The experiments testing the responses to various localized concentration of applied N showed that N2O emissions increased dramatically above certain levels of applied N. For example, in 2013, the weighted N2O emissions from the shoulder locations were disproportionally high in the 1 band and High N treatments (Figure 34). In the shoulder location, twice as much UAN (218 kg N ha-1) had been applied in the 1 band than in the 2 band treatment (109 kg N ha-1), and in the High N treatment about 170 kg N ha-1 had been applied in this location. However, shoulder N2O emissions were 10 and 5 times greater in the 1 band and High N than in the 2 band treatment, respectively.
One likely reason for the exponential increase in N2O emissions from the locations where fertilizer N had been applied in high concentration is the formation of nitrite that can occur in the presence of high ammonia concentrations due to inhibition of the bacteria (e.g. Nitrobacter spp.) carrying out the second step of nitrification (nitrite to nitrate) (Venterea and Rolston, 2000; Engel et al., 2010; Hawkins et al., 2010). Under low O2 concentration, nitrite becomes the substrate of N2O production by nitrifying bacteria (nitrifier denitrification) (Wrage et al., 2001; Zhu et al., 2013). In 2014, we did measure soil nitrite concentrations in addition to ammonium and nitrate. High nitrite, as well as high ammonium levels, persisted in the 1 band bed and 1 band shoulder treatments, where localized concentrations of applied N were greatest (Figures 41 and 42), confirming that nitrite oxidizers were persistently inhibited in the treatments that received the greatest amount of ammonia. The results are also consistent with those of the

54
Campbell tract experiment a year earlier, where the treatment that received the greatest amount of ammonical N (aqua ammonia) showed the greatest N2O emissions, albeit at that site we did not measure nitrite as supporting evidence.
Urea of the UAN fertilizer diffuses from the site of application in the soil before it is hydrolyzed, thus lowering the amount of localized high concentrations of ammonium (Hanson et al., 2006). The high ammonium levels and persistent presence of nitrite in the 1 band bed treatment in 2014 may have been due to the lower opportunity of urea to diffuse before being hydrolyzed because of lower soil water content in the bed than furrow position (Figure 38), causing a build-up of ammonium and consequently nitrite in the zones where the UAN had been applied.
Overall, the N2O emissions were higher in 2014 than 2013 although the experimental design did not allow a formal statistical comparison between the two years. The main reasons accounting for the differences in N2O emissions are probably as follows:
1. The field used in 2014-15 had a 8% higher clay content (see section 2.1.2). Meta-analyses and individual studies have shown that N2O emissions are greater in finer than coarser textured soils (Bouwman et al., 2002; Rochette et al., 2008).
2. The N application rates and the initial pre-plant available N (inorganic N) were higher in 2014 than 2013.
Other factors, such as temperature and irrigation frequency were similar in the two years.
The effect of the nitrification inhibitor on N2O emission was quite different between the two years. In 2013, N2O emissions did not differ between the nitrification inhibitor and the 2 band treatments, while in 2014, the use of the nitrification inhibitor significantly reduced the N2O emissions (63% reduction compared to 2 band treatment), similarly as in the Campbell tract experiment (60% reduction compared to standard N fertilization). The reason for the lack of N2O emissions reduction in 2013 is most likely the much earlier application of the N fertilizers and inhibitor in 2013. The side dress N application occurred 17 days after planting in 2013 (Table 6), but 27 days after planting in 2014 (Table 7). Although in 2013, 27 days after the side-dress application, ammonium concentrations were still elevated compared to the standard 2 band treatment, indicating at least some effect of the nitrification inhibitor, the plants probably had not taken up much of the ammonium because in 2013 they were much smaller during the time between fertilizer application and the point in time when the efficacy of the nitrification inhibitor had worn off than in 2014. When the efficacy of the nitrification inhibitor had worn off, a significant amount of ammonium was probably nitrified and N2O was released during its conversion to nitrate. Our data suggest that timing N fertilizer and nitrification inhibitor application strongly affects the usefulness of a nitrification inhibitor in a corn system.
In 2014, the N2O emissions from the subsurface drip irrigated system were lower than those from the other treatments, which were all furrow-irrigated. The reduction in N2O emissions due to subsurface drip irrigation was 95% (comparison with 2 band treatment). Subsurface drip irrigation has been previously shown to reduce N2O emissions in tomato compared to furrow irrigation by 71% (Kennedy et al., 2013). During the growing season 2013, the N2O emissions were significantly lower in the
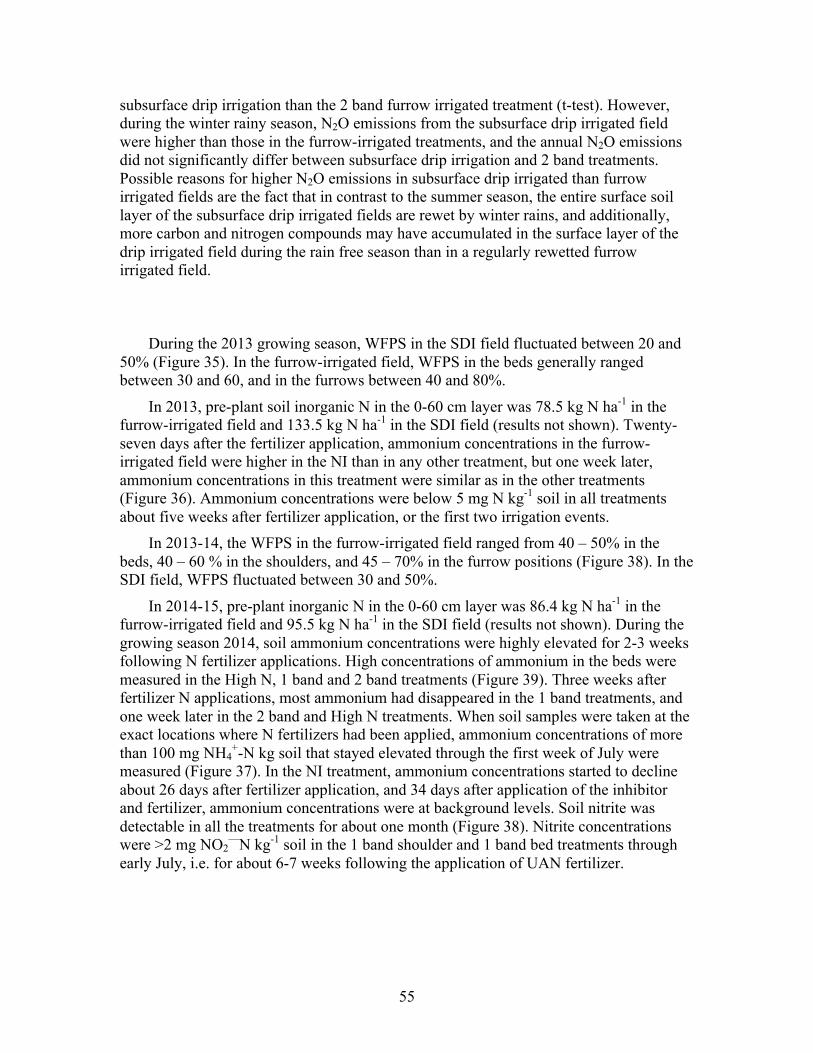
55
subsurface drip irrigation than the 2 band furrow irrigated treatment (t-test). However, during the winter rainy season, N2O emissions from the subsurface drip irrigated field were higher than those in the furrow-irrigated treatments, and the annual N2O emissions did not significantly differ between subsurface drip irrigation and 2 band treatments. Possible reasons for higher N2O emissions in subsurface drip irrigated than furrow irrigated fields are the fact that in contrast to the summer season, the entire surface soil layer of the subsurface drip irrigated fields are rewet by winter rains, and additionally, more carbon and nitrogen compounds may have accumulated in the surface layer of the drip irrigated field during the rain free season than in a regularly rewetted furrow irrigated field.
During the 2013 growing season, WFPS in the SDI field fluctuated between 20 and 50% (Figure 35). In the furrow-irrigated field, WFPS in the beds generally ranged between 30 and 60, and in the furrows between 40 and 80%.
In 2013, pre-plant soil inorganic N in the 0-60 cm layer was 78.5 kg N ha-1 in the furrow-irrigated field and 133.5 kg N ha-1 in the SDI field (results not shown). Twenty-seven days after the fertilizer application, ammonium concentrations in the furrow-irrigated field were higher in the NI than in any other treatment, but one week later, ammonium concentrations in this treatment were similar as in the other treatments (Figure 36). Ammonium concentrations were below 5 mg N kg-1 soil in all treatments about five weeks after fertilizer application, or the first two irrigation events.
In 2013-14, the WFPS in the furrow-irrigated field ranged from 40 – 50% in the beds, 40 – 60 % in the shoulders, and 45 – 70% in the furrow positions (Figure 38). In the SDI field, WFPS fluctuated between 30 and 50%.
In 2014-15, pre-plant inorganic N in the 0-60 cm layer was 86.4 kg N ha-1 in the furrow-irrigated field and 95.5 kg N ha-1 in the SDI field (results not shown). During the growing season 2014, soil ammonium concentrations were highly elevated for 2-3 weeks following N fertilizer applications. High concentrations of ammonium in the beds were measured in the High N, 1 band and 2 band treatments (Figure 39). Three weeks after fertilizer N applications, most ammonium had disappeared in the 1 band treatments, and one week later in the 2 band and High N treatments. When soil samples were taken at the exact locations where N fertilizers had been applied, ammonium concentrations of more than 100 mg NH4
+-N kg soil that stayed elevated through the first week of July were measured (Figure 37). In the NI treatment, ammonium concentrations started to decline about 26 days after fertilizer application, and 34 days after application of the inhibitor and fertilizer, ammonium concentrations were at background levels. Soil nitrite was detectable in all the treatments for about one month (Figure 38). Nitrite concentrations were >2 mg NO2
—N kg-1 soil in the 1 band shoulder and 1 band bed treatments through early July, i.e. for about 6-7 weeks following the application of UAN fertilizer.

56
Figure 35. Mean water filled pore space in furrow irrigated (upper panel) and subsurface drip irrigated (SDI)(lower panel) corn systems in 2013-14. Standard errors shown as line bars. n = 3.

57
Figure 36. Mean soil ammonium (upper panel) and nitrate (lower panel) concentrations in the beds in 2013-14. Standard errors shown as line bars. n = 3.

58
Figure 37. Mean soil ammonium (upper panel) and nitrate (lower panel) concentrations in the furrows in 2013-14. Standard errors shown as line bars. n = 3.
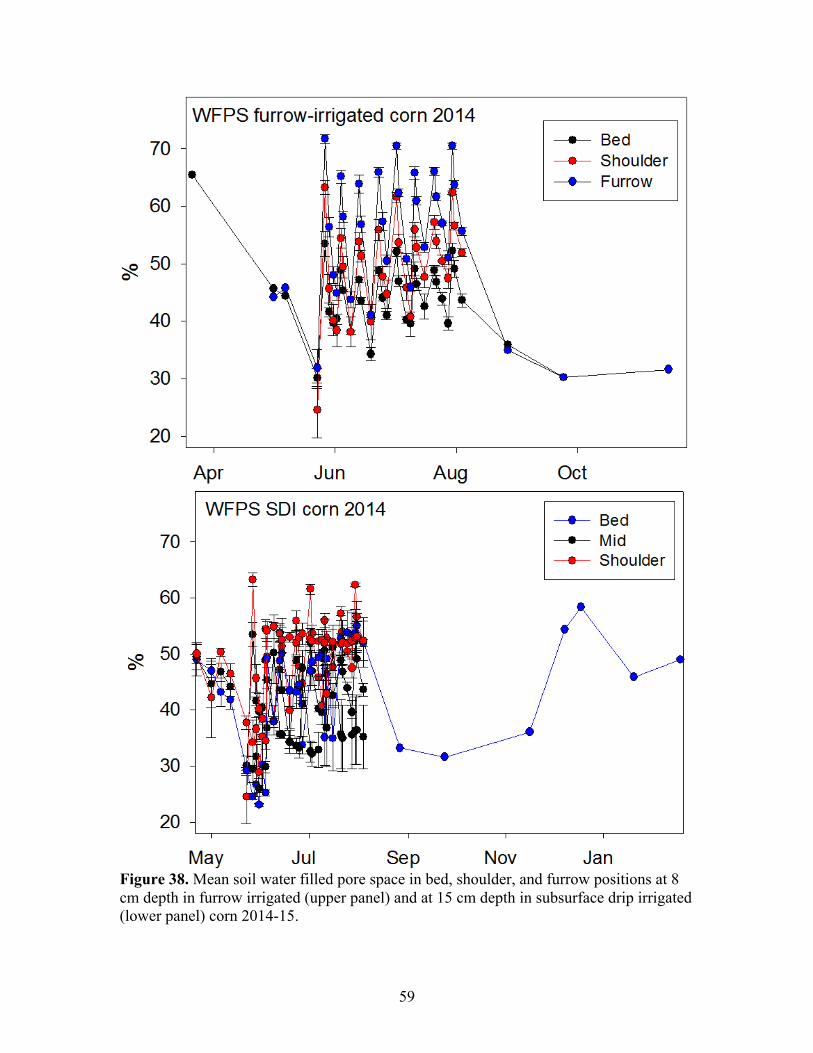
59
Figure 38. Mean soil water filled pore space in bed, shoulder, and furrow positions at 8 cm depth in furrow irrigated (upper panel) and at 15 cm depth in subsurface drip irrigated (lower panel) corn 2014-15.

60
Figure 39. Mean ammonium concentrations in the beds in the 0-15 cm layer in different fertilizer placement and nitrification inhibitor (NI) treatments in corn 2014.
61
Figure 40. Mean inorganic N (ammonium & nitrate) in 0-15 cm layer in N fertilizer, nitrification inhibitor (NI), and subsurface drip irrigation (SDI) treatments in corn 2014.
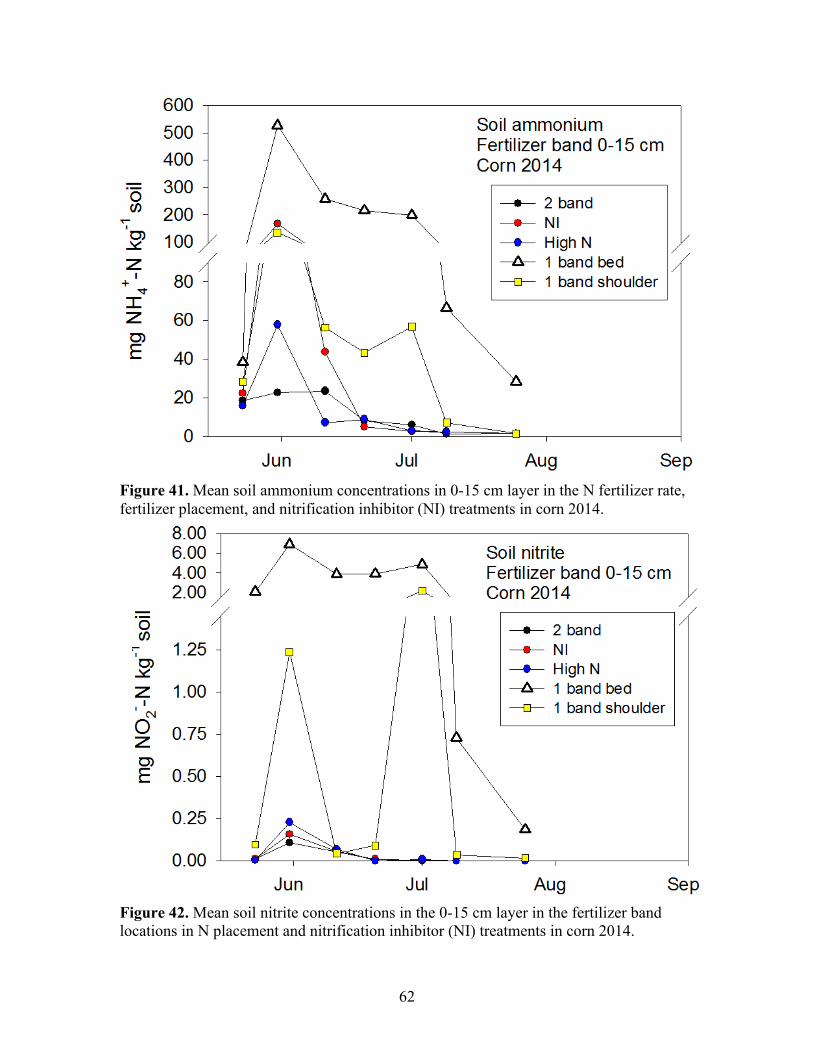
62
Figure 41. Mean soil ammonium concentrations in 0-15 cm layer in the N fertilizer rate, fertilizer placement, and nitrification inhibitor (NI) treatments in corn 2014.
Figure 42. Mean soil nitrite concentrations in the 0-15 cm layer in the fertilizer band locations in N placement and nitrification inhibitor (NI) treatments in corn 2014.

63
The yields, N uptake by the crop, and apparent N use efficiencies are shown in Tables 16 and 17. The pre-plant soil inorganic N in the top 60 cm was included as N source in addition to the synthetic N fertilizer. In 2013, yields in the SDI treatment were greater than those of any other treatment, while yields in the remaining treatments did not differ except for the control, where the lowest yields were recorded. In 2014, yields were similar among all the treatments. Table 16. Mean corn yields, grain N yield, total N uptake, and apparent N use efficiencies for grain and total biomass (±standard errors) in 2013. n = 3. Within columns, values designated with the same letters are not significantly different (P<0.05). Treatment Yield Grain N N uptake NUEgrain NUEuptake Mg ha-1 kg N ha-1 % Zero N 3.8 (±1.1)c 64 (±15) 115 (±11) 2 band 8.7 (±0.9)b 147 (±5) 197 (±11) 53 (±2) 70 (±4) 1 band 9.7 (±0.3)b 156 (±15) 225 (±26) 56 (±3) 80 (±9) High N 12.4 (±2.6)b 226 (±29) 288 (±35) 57 (±7) 73 (±9) NI 7.3 (±1.6)b 120 (±10) 165 (±15) 43 (±4) 59 (±5) SDI 19.3 (±3.8)a 310 (±20) 525 (±37) 157 (±11) 158 (±11) Table 17. Mean corn silage yields, total N uptake, and apparent N use efficiency (±standard errors) in 2014. n = 3. Treatment Yield Biomass N NUEuptake Mg ha-1 kg N ha-1 % 2 band 30.0 (±1.9) 301 (±13) 87 (±4) 1 band bed 31.0 (±1.4) 352 (±11) 102 (±3) 1 band shoulder 31.2 (±1.9) 363 (±25) 105 (±7) High N 32.9 (±2.8) 377 (±30) 86 (±7) NI 29.1 (±1.2) 300 (±15) 87 (±4) SDI 30.8 (±4.4) 336 (±59) 94 (±17)

64
Table 18. Summary of fertilizer N application rates, N2O emissions, CO2 equivalents, and emission factors (EF) in the corn experiments. Standard errors are shown in parentheses. FI = furrow irrigation; SDI = subsurface drip irrigation. Treatments kg N ha-1 kg N2O-N ha-1 Mg CO2eq. ha-1 Mean EF (%) 2012 1.) Aq.A., FI 2.) Aq.A. & nitrification
inhibitor G77, FI 3.) UAN, FI 4.) UAN & nitrification
inhibitor G77, FI 5.) UAN & nitrification
inhibitor, FI 6.) Calcium nitrate, FI 7.) Control, FI
222 222
222 222
222
222 20
1.39 (±0.08) 1.51 (±0.21) 0.97 (±0.15) 0.56 (±0.05) 0.39 (±0.03) 0.35 (±0.06) 0.27 (±0.06)
0.65 (±0.04) 0.71 (±0.10) 0.46 (±0.07) 0.26 (±0.02) 0.18 (±0.01) 0.16 (±0.03) 0.13 (±0.03)
0.63 0.68
0.44 0.25
0.17
0.16
2013-14 1.) UAN, 2 bands, FI 2.) UAN, 1 band, FI 3.) UAN, nitrification
inhibitor, FI 4.) UAN, high N rate, FI 5.) UAN, SDI 6.) Control, FI
226 226 226
345 250
8
0.93 (±0.34) 3.16 (±1.38) 0.94 (±0.28) 2.52 (±0.39) 0.46 (±0.04) 0.34 (±0.03)
0.43 (±0.16) 1.48 (±0.65) 0.44 (±0.13) 1.18 (±0.18) 0.21 (±0.02) 0.16 (±0.01)
0.41 1.40 0.41
0.73 0.18
2014 1.) UAN, 2 bands, FI 2.) UAN 1 band
shoulder, FI 3.) UAN, 1 band bed, FI 4.) UAN, nitrification
inhibitor, FI 5.) UAN, high N rate, FI 6.) UAN, SDI
252 252
252 252
342 250
4.23 (±1.04) 5.72 (±0.82) 13.49 (±1.95) 1.57 (±0.30) 6.14 (±0.40) 0.23 (±0.03)
1.98 (±0.49) 2.68 (±0.38) 6.32 (±0.91) 0.73 (±0.14) 2.88 (±0.19) 0.11 (±0.01)
1.68 2.27
5.35 0.62
1.80 0.09
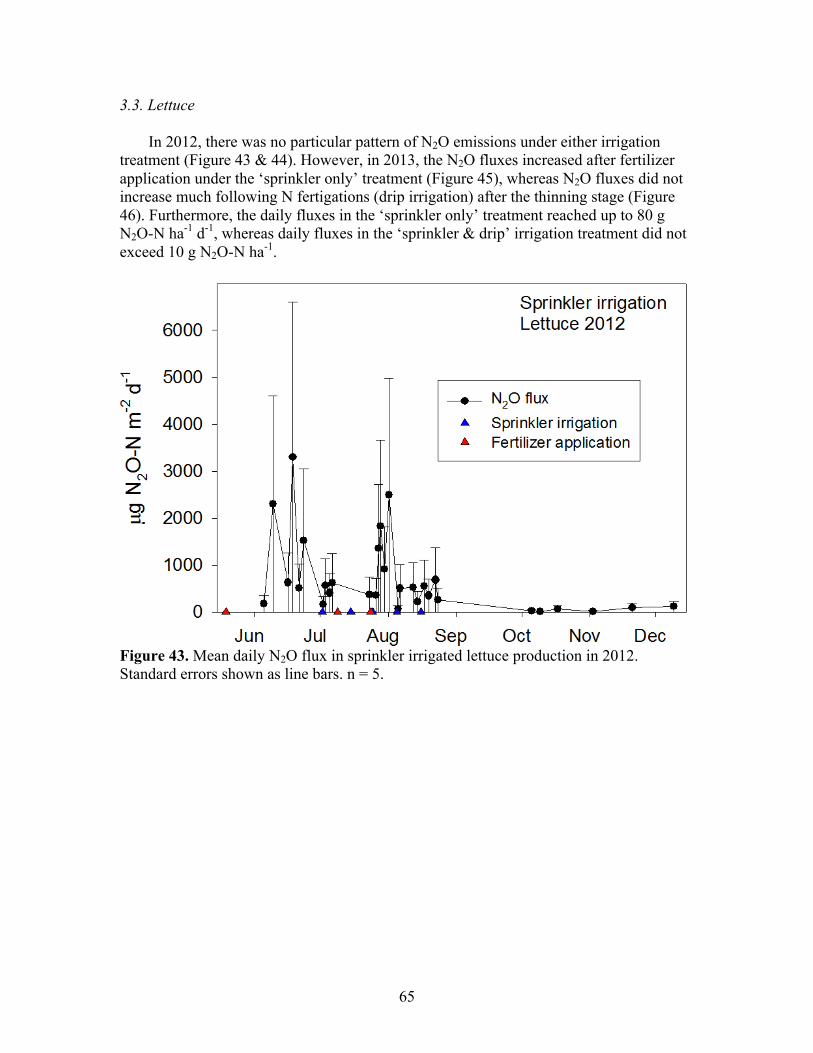
65
3.3. Lettuce
In 2012, there was no particular pattern of N2O emissions under either irrigation treatment (Figure 43 & 44). However, in 2013, the N2O fluxes increased after fertilizer application under the ‘sprinkler only’ treatment (Figure 45), whereas N2O fluxes did not increase much following N fertigations (drip irrigation) after the thinning stage (Figure 46). Furthermore, the daily fluxes in the ‘sprinkler only’ treatment reached up to 80 g N2O-N ha-1 d-1, whereas daily fluxes in the ‘sprinkler & drip’ irrigation treatment did not exceed 10 g N2O-N ha-1.
Figure 43. Mean daily N2O flux in sprinkler irrigated lettuce production in 2012. Standard errors shown as line bars. n = 5.
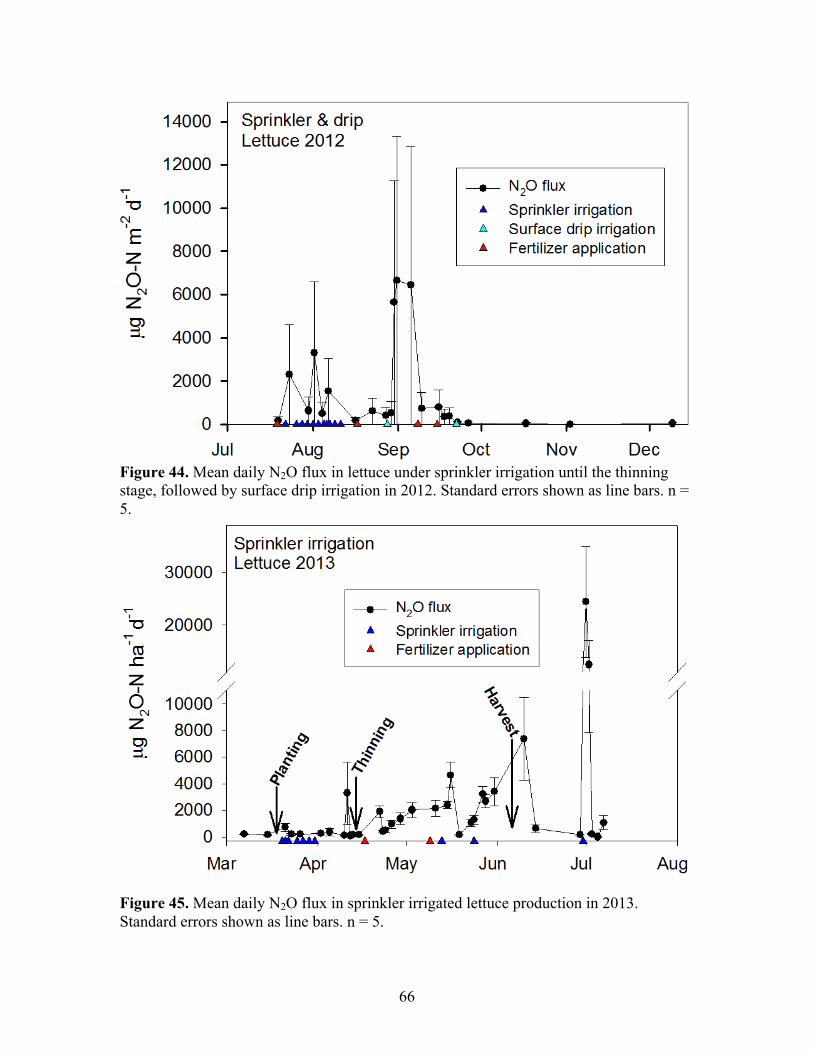
66
Figure 44. Mean daily N2O flux in lettuce under sprinkler irrigation until the thinning stage, followed by surface drip irrigation in 2012. Standard errors shown as line bars. n = 5.
Figure 45. Mean daily N2O flux in sprinkler irrigated lettuce production in 2013. Standard errors shown as line bars. n = 5.
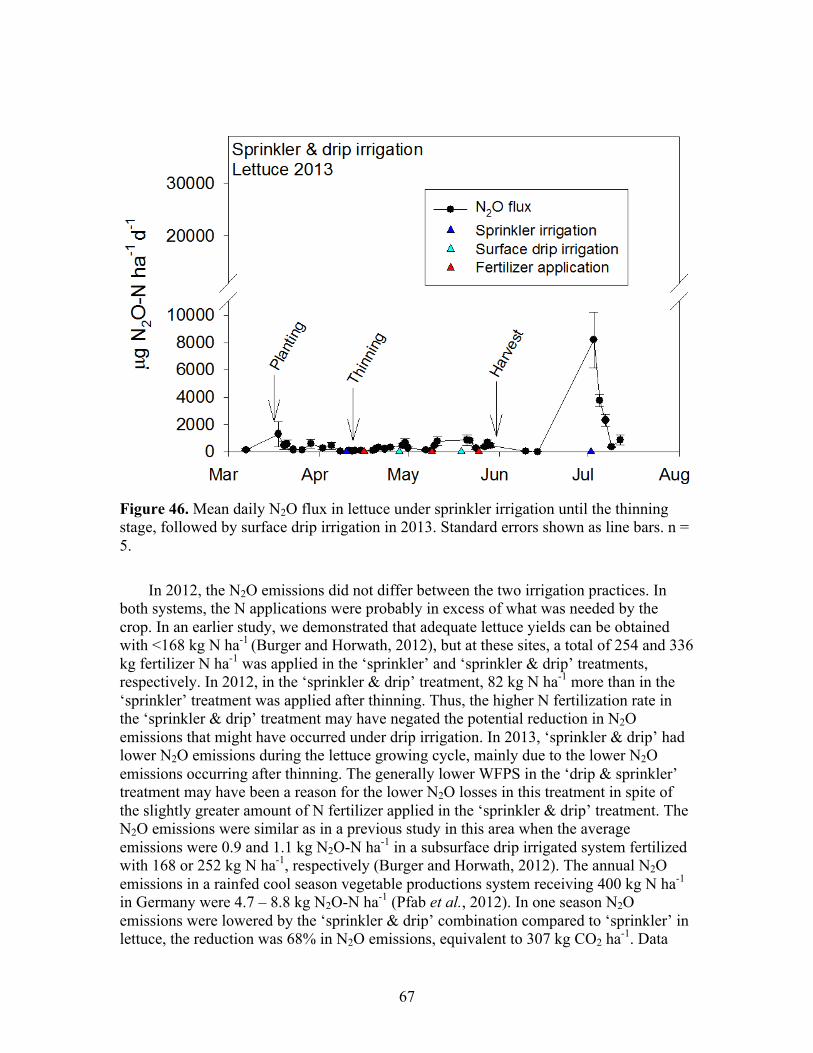
67
Figure 46. Mean daily N2O flux in lettuce under sprinkler irrigation until the thinning stage, followed by surface drip irrigation in 2013. Standard errors shown as line bars. n = 5.
In 2012, the N2O emissions did not differ between the two irrigation practices. In both systems, the N applications were probably in excess of what was needed by the crop. In an earlier study, we demonstrated that adequate lettuce yields can be obtained with <168 kg N ha-1 (Burger and Horwath, 2012), but at these sites, a total of 254 and 336 kg fertilizer N ha-1 was applied in the ‘sprinkler’ and ‘sprinkler & drip’ treatments, respectively. In 2012, in the ‘sprinkler & drip’ treatment, 82 kg N ha-1 more than in the ‘sprinkler’ treatment was applied after thinning. Thus, the higher N fertilization rate in the ‘sprinkler & drip’ treatment may have negated the potential reduction in N2O emissions that might have occurred under drip irrigation. In 2013, ‘sprinkler & drip’ had lower N2O emissions during the lettuce growing cycle, mainly due to the lower N2O emissions occurring after thinning. The generally lower WFPS in the ‘drip & sprinkler’ treatment may have been a reason for the lower N2O losses in this treatment in spite of the slightly greater amount of N fertilizer applied in the ‘sprinkler & drip’ treatment. The N2O emissions were similar as in a previous study in this area when the average emissions were 0.9 and 1.1 kg N2O-N ha-1 in a subsurface drip irrigated system fertilized with 168 or 252 kg N ha-1, respectively (Burger and Horwath, 2012). The annual N2O emissions in a rainfed cool season vegetable productions system receiving 400 kg N ha-1 in Germany were 4.7 – 8.8 kg N2O-N ha-1 (Pfab et al., 2012). In one season N2O emissions were lowered by the ‘sprinkler & drip’ combination compared to ‘sprinkler’ in lettuce, the reduction was 68% in N2O emissions, equivalent to 307 kg CO2 ha-1. Data

68
from a melon production system in Spain have shown a reduction of 3.58 kg N2O-N ha-1 or 68% in surface drip irrigation compared to furrow irrigation(Sanchez-Martin et al., 2008).
Figure 47. Mean cumulative N2O emissions in lettuce production systems in 2012 and standard errors shown as line bars. The left panel shows (from left) the emissions occurring before the thinning stage (blue), the emissions under surface drip irrigation (red), post harvest emissions, and total N2O emissions. The right panel shows the emissions for the same periods, but the time from thinning to harvest was under sprinkler irrigation. n = 5. The fertilizer N rates were 254 kg N ha-1 in the sprinkler and 336 kg N ha-1 in the sprinkler & drip treatment.
The total cumulative N2O emissions in 2012 did not differ between the two irrigation treatments (Figure 47). However, in 2013, the cumulative N2O emissions were significantly greater in the ‘sprinkler’ than in the treatment that included surface drip irrigation and fertigation after the thinning stage (Figure 48).
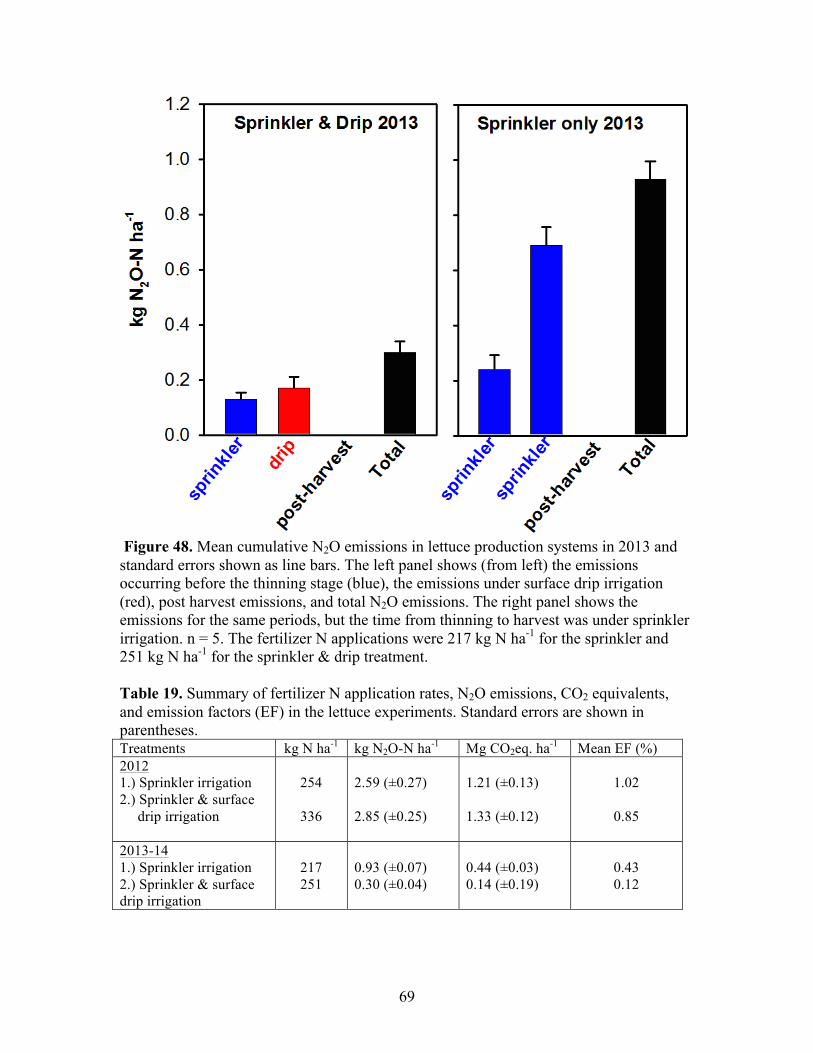
69
Figure 48. Mean cumulative N2O emissions in lettuce production systems in 2013 and standard errors shown as line bars. The left panel shows (from left) the emissions occurring before the thinning stage (blue), the emissions under surface drip irrigation (red), post harvest emissions, and total N2O emissions. The right panel shows the emissions for the same periods, but the time from thinning to harvest was under sprinkler irrigation. n = 5. The fertilizer N applications were 217 kg N ha-1 for the sprinkler and 251 kg N ha-1 for the sprinkler & drip treatment. Table 19. Summary of fertilizer N application rates, N2O emissions, CO2 equivalents, and emission factors (EF) in the lettuce experiments. Standard errors are shown in parentheses. Treatments kg N ha-1 kg N2O-N ha-1 Mg CO2eq. ha-1 Mean EF (%) 2012 1.) Sprinkler irrigation 2.) Sprinkler & surface
drip irrigation
254
336
2.59 (±0.27) 2.85 (±0.25)
1.21 (±0.13) 1.33 (±0.12)
1.02
0.85
2013-14 1.) Sprinkler irrigation 2.) Sprinkler & surface drip irrigation
217 251
0.93 (±0.07) 0.30 (±0.04)
0.44 (±0.03) 0.14 (±0.19)
0.43 0.12
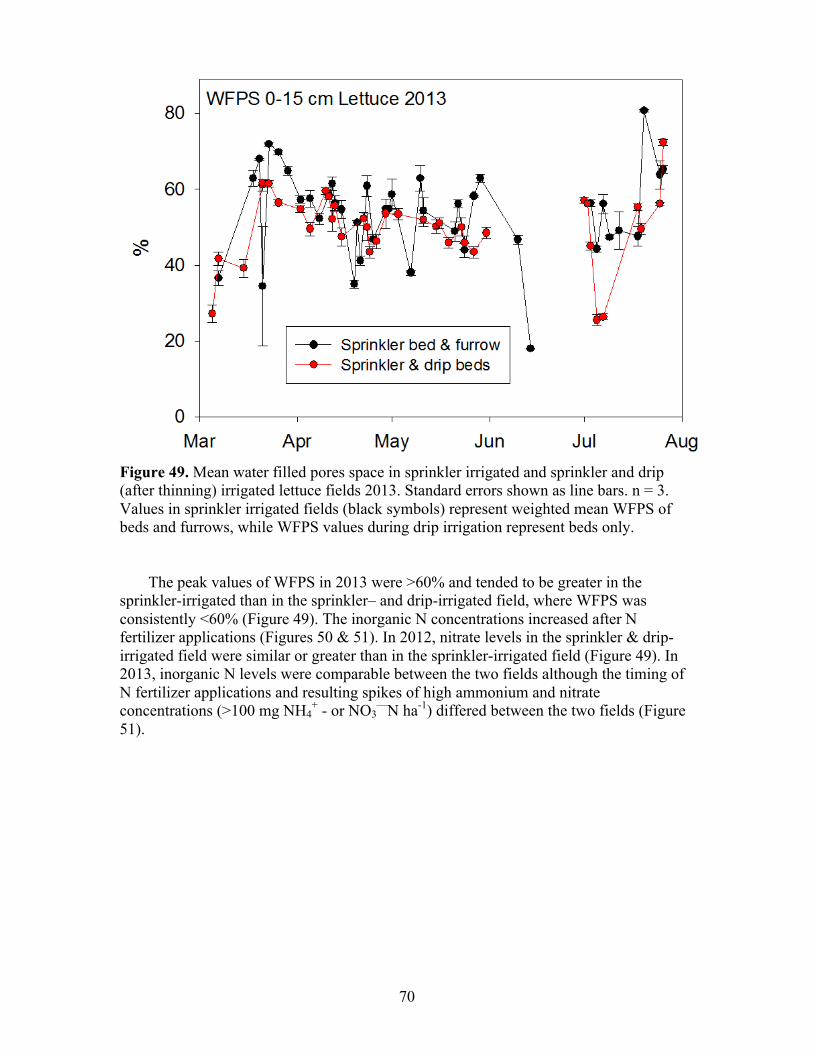
70
Figure 49. Mean water filled pores space in sprinkler irrigated and sprinkler and drip (after thinning) irrigated lettuce fields 2013. Standard errors shown as line bars. n = 3. Values in sprinkler irrigated fields (black symbols) represent weighted mean WFPS of beds and furrows, while WFPS values during drip irrigation represent beds only.
The peak values of WFPS in 2013 were >60% and tended to be greater in the sprinkler-irrigated than in the sprinkler– and drip-irrigated field, where WFPS was consistently <60% (Figure 49). The inorganic N concentrations increased after N fertilizer applications (Figures 50 & 51). In 2012, nitrate levels in the sprinkler & drip-irrigated field were similar or greater than in the sprinkler-irrigated field (Figure 49). In 2013, inorganic N levels were comparable between the two fields although the timing of N fertilizer applications and resulting spikes of high ammonium and nitrate concentrations (>100 mg NH4
+ - or NO3—N ha-1) differed between the two fields (Figure
51).

71
Figure 50. Mean soil ammonium and nitrate in the 0-15 cm layer in sprinkler-irrigated (upper panel) and sprinkler- and drip-irrigated (lower panel) lettuce in 2012. Standard errors shown as line bars. n = 3. Management events are also shown.
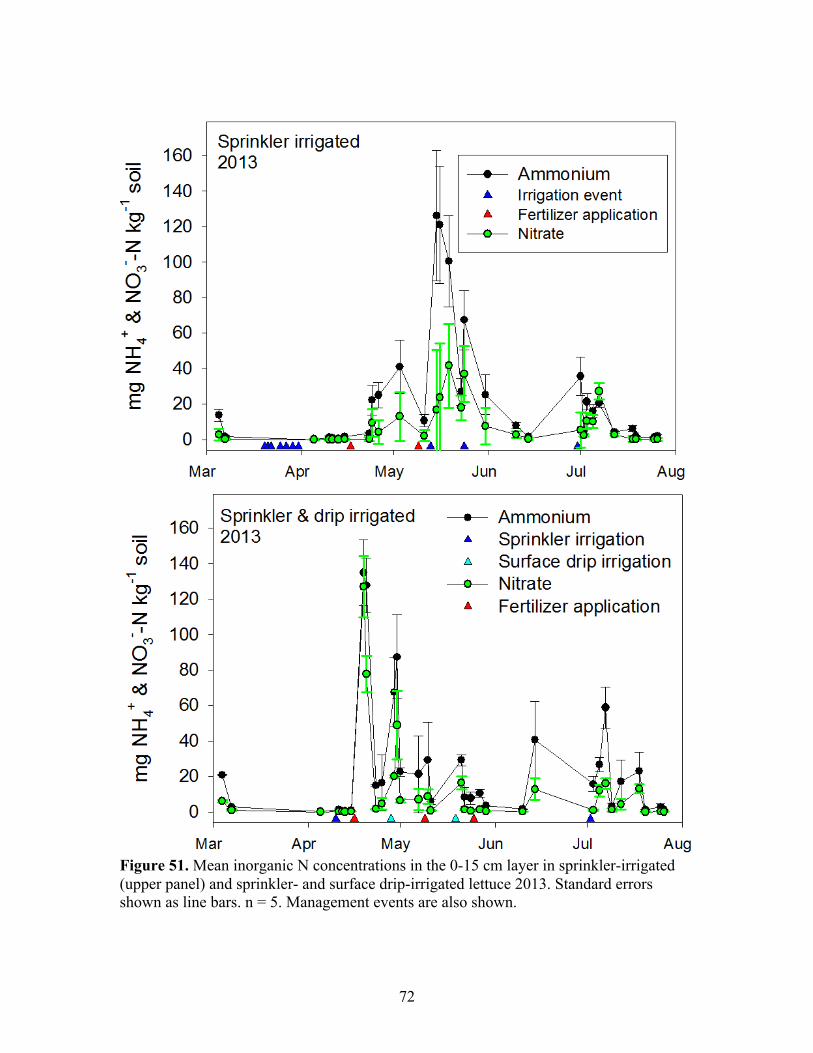
72
Figure 51. Mean inorganic N concentrations in the 0-15 cm layer in sprinkler-irrigated (upper panel) and sprinkler- and surface drip-irrigated lettuce 2013. Standard errors shown as line bars. n = 5. Management events are also shown.

73
4. Summary and Conclusions
In this project we evaluated standard and alternative agricultural management practices in terms of greenhouse gas emissions with a focus on N2O. We compared the effects of different N sources and fertilizer N placement, urease and nitrification inhibitors, organic management, and irrigation techniques on N2O emissions, productivity (yields), and N use efficiency. Field studies, mostly on commercial farms, were used to test these management approaches and estimate their greenhouse gas mitigation potential. The studies were conducted in tomato, corn, and lettuce cropping systems. A summary of total growing season or annual N2O emissions and emission factors (percentage of applied N emitted as N2O) is shown in Table 20.
We had hypothesized that ammonia based fertilizers lead to greater N2O emissions than mixtures of ammonium and other N forms or nitrate fertilizers because of recent evidence that under low oxygen, e.g. at high soil moisture and/or with ample carbon availability, the potential for N2O production as by-product of ammonical fertilizer nitrification is high (Zhu et al., 2013). Our results in a corn system showed that significantly more N2O was released after banding liquid fertilizer in the form of aqua ammonia compared to urea ammonium nitrate, while calcium nitrate produced N2O emissions not different from those in the control (no fertilizer) treatment. The reductions in N2O emissions were 30% for UAN (equivalent to 200 kg CO2 ha-1), and 75% (509 kg CO2 ha-1) for calcium nitrate with respect to aqua ammonia, and 65% (306 kg CO2 ha-1) for calcium nitrate with respect to UAN. These results implicated the nitrification pathway as the main source of N2O. The fact that urea and nitrate more readily diffuse through the soil than ammonium may have also influenced the result, i.e. in the aqua ammonia treatment more ammonium was likely concentrated than in the UAN treatment since urea may have moved some distance in the soil before being hydrolyzed. Dispersion of ammonium fertilizer versus localized concentration, e.g. in a band, may be a factor affecting N2O emissions. For example, in an earlier CARB-sponsored study in a wheat system, 39% less N2O was emitted after application of broadcast ammonium sulfate than knife-injected anhydrous ammonia (Zhu-Barker et al., 2015). Few studies have compered N2O emissions after applying these particular fertilizers. Both UAN and aqua ammonia are widely used in California. Breitenbeck and Bremner (1986) found no difference in N2O emissions between urea and ammonium sulfate fertilized plots over 106 days. A study comparing the N2O emissions in response to ammonium sulfate, urea, and calcium nitrate fertilization in a sod system, did not provide conclusive results either (Bergstrom et al., 2001). Use of the DCD nitrification inhibitor lowered the N2O emissions by 60% or 287 kg CO2 ha-1 compared to those following UAN side dress application in one of the corn systems, confirming nitrification as the main pathway of N2O production. The potential for this nitrification inhibitor to lower N2O emissions was additionally tested in another corn and in a subsurface drip irrigated tomato system for two seasons each. In the corn systems, in one of the two years there was no reduction in N2O, and in the other year N2O emissions were reduced by 63%, equivalent to 1300 kg CO2 ha-1. In the tomato system during the growing season, in one of the two years, the difference in N2O emissions between the nitrification inhibitor and control treatment was not significant, and in the other year the reduction was 29%, or 72 kg CO2 ha-1. The results in the corn systems on one hand

74
indicated great N2O mitigation potential for nitrification inhibitors. On the other hand, our studies suggested that the timing of the nitrification inhibitor application may determine the inhibitor’s efficacy and usefulness as N2O mitigation tool. The lack of N2O emission reduction in one of the studies in corn systems may have been due to low uptake of ammonium by the crop. The N fertilizer and nitrification inhibitor were applied during a period when the corn seedlings were too small to take up a significant amount of ammonium. In the tomato systems, the N2O emissions during the growing seasons with or without the nitrification inhibitor were low with ≤0.5kg N2O-N ha-1 (emission factor 0.2%) and the difference the use of the nitrification inhibitor made was small. However, the lower N2O emissions in the nitrification inhibitor compared to the standard treatment at least provided proof of the concept that delaying nitrification can reduce N2O emissions in cropping systems.
Table 20. Applied fertilizer N, mean N2O emissions, and emission factors in tomato, corn, and lettuce field experiments. Standard errors shown in parentheses. Crop & year Treatments kg N ha-1 kg N2O-N ha-1 Emission
factor (%) Tomato 2012-13 (annual)
1.) Nitrification inhibitor, SDI 2.) Control, SDI 3.) Organic management, FI
282 282 214
3.21 (±0.57) 1.20 (±0.05) 1.63 (±0.12)
1.14 (±0.20) 0.42 (±0.02) 0.76 (±0.06)
Tomato 2013-14 (annual)
1.) Nitrification inhibitor, SDI 2.) Control, SDI 3.) Organic management, FI
225 225 214
0.46 (±0.01) 0.69 (±0.02) 2.12 (±0.30)
0.20 (±0.00) 0.31 (±0.00) 0.99 (±0.14)
Corn 2012 (growing season)
1.) Aq.A., FI 2.) Aq.A. & nitrification inhibitor G77, FI 3.) UAN, FI 4.) UAN & nitrification inhibitor G77, FI 5.) UAN & nitrification inhibitor, FI 6.) Calcium nitrate, FI 7.) Control, FI
222 222 222 222 222 222 20
1.39 (±0.08) 1.51 (±0.21) 0.97 (±0.15) 0.56 (±0.05) 0.39 (±0.03) 0.35 (±0.06) 0.27 (±0.06)
0.63 (±0.04) 0.68 (±0.09) 0.44 (±0.07) 0.25 (±0.02) 0.18 (±0.01) 0.16 (±0.03) not calculated
Corn 2013-14 (annual)
1.) UAN, 2 bands, FI 2.) UAN, 1 band, FI 3.) UAN, nitrification inhibitor, FI 4.) UAN, high N rate, FI 5.) UAN, SDI 6.) Control, FI
226 226 226 345 250
8
0.93 (±0.34) 3.16 (±1.38) 0.94 (±0.28) 2.52 (±0.39) 0.46 (±0.04) 0.34 (±0.03)
0.41 (±0.15) 1.40 (±0.61) 0.41 (±0.12) 0.73 (±0.11) 0.18 (±0.02) not calculated
Corn 2014 (growing season)
1.) UAN, 2 bands, FI 2.) UAN 1 band shoulder, FI 3.) UAN, 1 band bed, FI 4.) UAN, nitrification inhibitor, FI 5.) UAN, high N rate, FI 6.) UAN, SDI
252 252 252 252 342 250
4.23 (±1.04) 5.72 (±0.82) 13.49 (±1.95) 1.57 (±0.30) 6.14 (±0.40) 0.23 (±0.03)
1.68 (±0.41) 2.27 (±0.33) 5.35 (±0.77) 0.62 (±0.12) 1.80 (±0.12) 0.09 (±0.01)
Lettuce 2012 (growing season)
1.) UAN, sprinkler irrig. all season 2.) UAN & Aq.A., Sprinkler irrig. & surface drip irrig. after thinning
254 336
2.59 (±0.27) 2.85 (±0.25)
1.02 (±0.57) 0.85 (±0.07)
Lettuce 2013 (growing season)
1.) UAN, sprinkler irrig. all season 2.) UAN, Sprinkler irrig. & surface drip irrig. after thinning
217 251
0.93 (±0.07) 0.30 (±0.04)
0.43 (±0.03) 0.12 (±0.02)

75
Besides manipulating N transformations, we investigated N fertilizer placement as N2O mitigation strategy. In the furrow-irrigated corn system, fewer knife-injected bands with higher concentrations of N fertilizer produced greater emissions of N2O per unit area compared to greater numbers of knife-injected bands with lower N concentrations. Our results showed that in zones of high concentrations of ammonium, nitrite accumulates accompanied by persistent N2O emissions. Applying fertilizer in fewer bands per unit area has the same effect on N2O emissions as applying N fertilizer at a higher rate because disproportionally high, sustained N2O fluxes originate from these hotspots of concentrated ammonical fertilizer. Our observations are in agreement with those of Engel et al.(2010) and Maharjan & Venterea (2013) who also found higher levels of nitrite and greater N2O emissions after banded than following broadcast urea applications. In our experiments, differences in emissions were not always significant, but the overall trend for the more highly concentrated applications of UAN to emit more N2O was consistent. In 2014, applying UAN side dress in two bands rather than in one band in the bed reduced the N2O emissions by 69% or 4500 kg CO2 ha-1.
Subsurface drip irrigation reduced the N2O emissions more consistently than any other treatment. In the corn system in 2013, the N2O emission reduction compared to the standard furrow-irrigated treatment was 60%, or 265 kg CO2 ha-1, and in 2014, 95%, equivalent to 1950 kg CO2 ha-1. While subsurface drip irrigation has been shown to reduce N2O emissions in systems other than corn (Kallenbach et al., 2010; Kennedy et al., 2013), the effect of surface drip irrigation on N2O emissions has previously not been compared with those of sprinkler irrigation systems. In lettuce, the N2O emissions were not consistently lower with drip irrigation after the thinning stage. In one season, N2O emissions were lowered by the ‘sprinkler & drip’ combination compared to ‘sprinkler’ treatment. The reduction in N2O emissions was 68%, equivalent to 307 kg CO2 ha-1. However, in the other season, N2O emissions were similar in the two treatments. It is therefore questionable whether this irrigation practice alone is a viable mitigation option in lettuce.
To compare cropping systems, in particular conventional subsurface drip irrigated and organically managed tomato production, the global warming potentials, expressed in CO2 equivalents, including energy use associated with crop production, were calculated. This comparison showed that the contribution from direct N2O emissions to total GHG emissions during the growing season was relatively low in all years and systems (5 -14%). However, in two cases, the annual N2O emissions accounted for 32 and 37% of the total emissions. This means that the N2O emissions during the times when no cash crops are grown are highly variable and difficult to control, as shown in one of the fall seasons of the present project when the emissions in both the organic and the conventional tomato systems were relatively high. Most likely, the magnitude of those emissions depend on the rainfall patterns at the beginning of the rainy season (see ARB contract 08-324).
The magnitude of greenhouse gases from other sources, such as the energy required for irrigation water conveyance, can vary greatly, and the energy embedded in fertilizers varies between cropping systems (organic vs. conventional). This observation calls attention to opportunities of GHG mitigation other than practices mitigating direct N2O emissions that were the objective of the present studies.
76
5. Recommendations, Economics Among the N2O mitigation practices, SDI most reliably reduced the emissions. Subsurface drip irrigation has been adopted by almost all tomato growers in the State (E. Miyao personal communication) because this type of irrigation also increased yields and allows better control over water use. Installing SDI is a large investment and the costs of maintaining the system increase with time since installation (Miyao et al., 2014). Farmers now employ SDI also for rotation crops other than tomato, but farmers will only install SDI if high value crops are part of the rotation.
The other practice that reduced N2O emissions was the use of nitrification inhibitors. The cost to the farmer for the nitrification inhibitor material used in the present study was approximately $20 per acre ($50 per ha) for a 200 lbs N per acre (224 kg N per ha) fertilizer application. Formulations are available for dry or liquid fertilizer material. Additional products from other firms are being approved for and launched in California. The differences of N2O emissions following various fertilizer types and application modes were significant. However, the ease of application and suitability for each bed configuration and irrigation system are probably more important factors influencing the choice of fertilizer than price. For example, at current fertilizer prices, aqua ammonia is only about 16% cheaper than UAN.
The one mitigation practice not addressed in the present study was improvement of nitrogen use efficiency (NUE) in cropping systems through application of the appropriate amount of N fertilizer. Our previous contract with ARB (08-324) and a concurrent study sponsored by CDFA-FREP addressed the benefits of improving NUE in terms of N2O emissions as these studies included N rate trials and concomitant N2O emissions. Improving NUE benefits environmental protection in multiple ways (e.g. groundwater quality). Pre-plant nitrate sampling, as demonstrated in this report, is a pre-requisite practice for famers to be able to adjust fertilizer N to the appropriate level in each field. To do this farmers would probably have to spend several hundred dollars per field, but potentially there could also be savings in fertilizer costs.
77
6. References Abalos, D., Sanchez-Martin, L., Garcia-Torres, L., van Groenigen, J.W., Vallejo, A.,
2014. Management of irrigation frequency and nitrogen fertilization to mitigate GHG and NO emissions from drip-fertigated crops. Sci. Total Environ. 490, 880-888.
Akiyama, H., Yan, X.Y., Yagi, K., 2010. Evaluation of effectiveness of enhanced-efficiency fertilizers as mitigation options for N2O and NO emissions from agricultural soils: meta-analysis. Global Change Biol. 16, 1837-1846.
Bender, R.R., Haegele, J.W., Ruffo, M.L., Below, F.E., 2013. Nutrient Uptake, Partitioning, and Remobilization in Modern, Transgenic Insect-Protected Maize Hybrids. Agron. J. 105, 161-170.
Bergstrom, D.W., Tenuta, M., Beauchamp, E.G., 2001. Nitrous oxide production and flux from soil under sod following application of different nitrogen fertilizers. Commun. Soil Sci. Plant Anal. 32, 553-570.
Bouwman, A.F., Boumans, L.J.M., Batjes, N.H., 2002. Emissions of N2O and NO from fertilized fields: Summary of available measurement data. Global Biogeochemical Cycles 16.
Breitenbeck, G.A., Bremner, J.M., 1986. Effects of various nitrogen fertilizers on emission of nitrous-oxide from soils. Biol. Fertility Soils 2, 195-199.
Burger, M., Horwath, W.R., 2012. Assessment of baseline nitrous oxide emissions in California cropping systems. In: California Air Resources Board, contract 08-324.
Burger, M., Lazcano, C.M., Horwath, W.R., 2013. Assessment of nitrous oxide emissions in California's dairy systems. CA Air Resources Board, contract 09-325.
Bustamante, S.J.C., 2014. Nitrogen ferilization management in organic processing tomato production: N sufficiency prediction through early-season soil and plant monitoring. Master's thesis. University of California Davis, Davis, p. 54.
California Air Resources Board (CARB), 2014. California Greenhouse Gas Emission Inventory -2015 Edition. 2000-2013 Inventory by economic sector - Full Detail. Available at: http://www.arb.ca.gov/cc/inventory/data/data.htm
Decock C (2014) Mitigating Nitrous Oxide Emissions from Corn Cropping Systems in the Midwestern US: Potential and Data Gaps. Environ Sci Technol 48 (8):4247-4256.
Doane, T.A., Horwáth, W.R., 2003. Spectrophotometric determination of nitrate with a single reagent. Anal. Lett. 36, 2713-2722.
Dumas, J.B., 1848. Sur les procédés de l’analyse organique. Ann. Chim. , 195-213.
Engel, R., Liang, D.L., Wallander, R., Bembenek, A., 2010. Influence of Urea Fertilizer Placement on Nitrous Oxide Production from a Silt Loam Soil. Journal of Environmental Quality 39, 115-125.
Firestone, M.K., Davidson, E.A., 1989. Microbiological Basis of NO and N2O Production and Consumption. In: Andreae, M.O., Schimel, D.S. (Eds.), Exchange of

78
Trace Gases between Terrestrial Ecosystems and the Atmosphere. Wiley, New York, pp. 7-21.
Forster, J.C., 1995. Soil nitrogen. In: K., A., P, N. (Eds.), Methods in Applied Soil Microbiology and Biochemistry. Academic Press, San Diego, pp. 79-87.
Garland, G.M., Suddick, E., Burger, M., Horwath, W.R., Six, J., 2011. Direct N2O emissions following transition from conventional till to no-till in a cover cropped Mediterranean vineyard (Vitis vinifera). Agriculture Ecosystems & Environment 144, 423-428.
Garland, G.M., Suddick, E., Burger, M., Horwath, W.R., Six, J., 2014. Direct N2O emissions from a Mediterranean vineyard: Event-related baseline measurements. Agriculture Ecosystems & Environment 195, 44-52.
Hanson, B.R., Simunek, J., Hopmans, J.W., 2006. Evaluation of urea-ammonium-nitrate fertigation with drip irrigation using numerical modeling. Agric. Water Manage. 86, 102-113.
Hawkins, S., Robinson, K., Layton, A., Sayler, G., 2010. Limited impact of free ammonia on Nitrobacter spp. inhibition assessed by chemical and molecular techniques. Bioresour. Technol. 101, 4513-4519.
Hutchinson, G.L., Livingston, G.P., 1993. Use of chamber systems to measure trace gas fluxes. In: Rolston, D.E. (Ed.), Agricultural Ecosystem Effects on Trace Gases and Global Climate Change. ASA Special Publication no. 55, Madison, WI.
Hutchinson, G.L., Mosier, A.R., 1981. Improved soil cover method for field measurement of nitrous oxide fluxes. Soil Sci. Soc. Am. J. 45, 311-316.
IPCC, 2007a. Intergovernmental Panel on Climate Change WGI, Fourth Assessment Report, Climate Change, c/o WMO,7bis, Avenue de la Paix, C.P.N. 2300, 1211 Geneva 2, Switzerland.
IPCC, 2007b. Mitigation of Climate Change. Chapter 8: Agriculture. Intergovernmental Panel on Climate Change, New York.
Irigoyen, I., Muro, J., Azpilikueta, M., Aparicio-Tejo, P.M., 2003. Ammonium oxidation kinetics in the presence of nitrification inhibitors DCD and DMPP at various temperatures. Aust. J. Soil Res. 41, 1177-1183.
Kallenbach, C.M., Rolston, D.E., Horwath, W.R., 2010. Cover cropping affects soil N2O and CO2 emissions differently depending on type of irrigation. Agriculture Ecosystems & Environment 137, 251-260.
Kennedy, T.L., Suddick, E.C., Six, J., 2013. Reduced nitrous oxide emissions and increased yields in California tomato cropping systems under drip irrigation and fertigation. Agriculture Ecosystems & Environment 170, 16-27.
Khalil, K., Mary, B., Renault, P., 2004. Nitrous oxide production by nitrification and denitrification in soil aggregates as affected by O2 concentration. Soil Biology & Biochemistry 36, 687-699.

79
Kongshaug, G., 1998. Energy consumption and greenhouse gas emissions in fertilizer production. International Fertilizer Industry Association Technical Conference, Marrakech, Morocco.
Lazcano, C., Wade, J., Horwath, W.R., Burger, M., 2015. Soil sampling protocol reliably estimates preplant NO3
- in SDI tomatoes. California Agriculture 4: 222-229. Maharjan, B., Venterea, R.T., 2013. Nitrite intensity explains N management effects on
N2O emissions in maize. Soil Biology & Biochemistry 66, 229-238. Miyao, E., Agerter, B., Klonsky, K., Stewart, D., 2014. Sample costs to produce
processing tomatoes, subsurface drip irrigated (SDI) in the Sacramento Valley & Northern Delta. University of California - Cooperative Extension. Available at: http://coststudyfiles.ucdavis.edu/uploads/cs_public/3e/62/3e625c07-cf86-4591-a51d-6609fdd1f89f/process-tomato-drip.pdf
Mosier, A.R., Halvorson, A.D., Peterson, G.A., Robertson, G.P., Sherrod, L., 2005. Measurement of net global warming potential in three agroecosystems. Nutrient Cycling in Agroecosystems 72, 67-76.
Mosier, A.R., Halvorson, A.D., Reule, C.A., Liu, X.J.J., 2006. Net global warming potential and greenhouse gas intensity in irrigated cropping systems in northeastern Colorado. Journal of Environmental Quality 35, 1584-1598.
Mulvaney, R.L., Khan, S.A., Mulvaney, C.S., 1997. Nitrogen fertilizers promote denitrification. Biol. Fertility Soils 24, 211-220.
Neftel, A., Blatter, A., Schmid, M., Lehmann, B., Tarakanov, S.V., 2000. An experimental determination of the scale length of N2O in the soil of a grassland. Journal of Geophysical Research: Atmospheres 105, 12095-12103.
Parkin, T.B., Venterea, R.T., 2010. Chapter 3. Chamber-based trace gas flux measurements. In: Follett, R.F. (Ed.), Sampling Protocols.
Paul, J.W., Bauchamp, E.G., 1989. Effect of carbon constituents in manure on denitrification in soil. Can. J. Soil Sci. 69: 49-61.
Pettygrove, G.S., Heinrich, A.L., Crohn, D.M., 2009. Manure nitrogen mineralization. Manure Technical Guide Series. University of California Cooperative Extension, 1-5.
Pfab, H., Palmer, I., Buegger, F., Fiedler, S., Mueller, T., Ruser, R., 2012. Influence of a nitrification inhibitor and of placed N-fertilization on N2O fluxes from a vegetable cropped loamy soil. Agriculture Ecosystems & Environment 150, 91-101.
Robertson, P.G., Groffmann, P.A. 2015. Nitrogen transformations. In: Paul, E.A. (Ed.), Soil Microbiology, Ecology and Biochemistry. Academic Press, Burlington, MA.
Robertson, G.P., Paul, E.A., Harwood, R.R., 2000. Greenhouse gases in intensive agriculture: Contributions of individual gases to the radiative forcing of the atmosphere. Science (Washington DC) 289, 1922-1925.
Robertson, P.G., 1997. Nitrogen use efficiency in row-crop agriculture: Crop nitrogen use and soil nitrogen loss. In: Jackson, L.E. (Ed.), Ecology in Agriculture. Academic Press, San Diego, pp. 347-365.

80
Rochette, P., Angers, D.A., Chantigny, M.H., Gagnon, B., Bertrand, N., 2008. N2O fluxes in soils of contrasting textures fertilized with liquid and solid dairy cattle manures. Can. J. Soil Sci. 88, 175-187.
Sanchez-Martin, L., Arce, A., Benito, A., Garcia-Torres, L., Vallejo, A., 2008. Influence of drip and furrow irrigation systems on nitrogen oxide emissions from a horticultural crop. Soil Biology & Biochemistry 40, 1698-1706.
Schellenberg, D.L., Alsina, M.M., Muhammad, S., Stockert, C.M., Wolff, M.W., Sanden, B.L., Brown, P.H., Smart, D.R., 2012. Yield-scaled global warming potential from N2O emissions and CH4 oxidation for almond (Prunus dulcis) irrigated with nitrogen fertilizers on arid land. Agriculture Ecosystems & Environment 155, 7-15.
Snyder, C.S., Bruulsema, T.W., Jensen, T.L., Fixen, P.E., 2009. Review of greenhouse gas emissions from crop production systems and fertilizer management effects. Agriculture Ecosystems & Environment 133, 247-266.
Tenuta, M., Beauchamp, E.G., 2000. Nitrous oxide production from urea granules of different sizes. Journal of Environmental Quality 29, 1408-1413.
Tiedje, J.M., 1988. Ecology of denitrification and dissimilatory nitrate reduction to ammonium. In: Zehnder, A.J.B. (Ed.), Biology of Anaerobic Microorganisms. John Wiley, New York, pp. 179-244.
VanCleemput, O., Samater, A.H., 1996. Nitrite in soils: Accumulation and role in the formation of gaseous N compounds. Fertilizer Research 45, 81-89.
Velthof, G.L., Kuikman, P.J., Oenema, O., 2003. Nitrous oxide emission from animal manures applied to soil under controlled conditions. Biol. Fertil. Soils 37: 221-230.
Venterea, R.T., Burger, M., Spokas, K.A., 2005. Nitrogen oxide and methane emissions under varying tillage and fertilizer management. Journal of Environmental Quality 34, 1467-1477.
Venterea, R.T., Halvorson, A.D., Kitchen, N., Liebig, M.A., Cavigelli, M.A., Del Grosso, S.J., Motavalli, P.P., Nelson, K.A., Spokas, K.A., Singh, B.P., Stewart, C.E., Ranaivoson, A., Strock, J., Collins, H., 2012. Challenges and opportunities for mitigating nitrous oxide emissions from fertilized cropping systems. Front. Ecol. Environ. 10, 562-570.
Venterea, R.T., Rolston, D.E., 2000. Nitric and nitrous oxide emissions following fertilizer application to agricultural soil: Biotic and abiotic mechanisms and kinetics. Journal of Geophysical Research-Atmospheres 105, 15117-15129.
Venterea, R.T., Spokas, K.A., Baker, J.M., 2009. Accuracy and Precision Analysis of Chamber-Based Nitrous Oxide Gas Flux Estimates. Soil Sci. Soc. Am. J. 73, 1087-1093.
Verhoeven, E., Six, J., 2014. Biochar does not mitigate field-scale N2O emissions in a Northern California vineyard: An assessment across two years. Agriculture Ecosystems & Environment 191, 27-38.
Wagner, S.W., Reicosky, D.C., Alessi, R.S., 1997. Regression models for calculating gas fluxes measured with a closed chamber. Agron. J. 89, 279-284.

81
West, T.O., Marland, G., 2002. A synthesis of carbon sequestration, carbon emissions, and net carbon flux in agriculture: comparing tillage practices in the United States. Agriculture Ecosystems & Environment 91, 217-232.
Wolff, M.W., 2015. Net global warming potential and nitrogen fertigation in orchards and vineyards: Opportunities for mitigation. Chapter 2: Effects of drip fertigation and N-source on soil N2O production in almonds. Dissertation. University of California Davis, pp 34-76.
Wrage, N., Velthof, G.L., van Beusichem, M.L., Oenema, O., 2001. Role of nitrifier denitrification in the production of nitrous oxide. Soil Biology & Biochemistry 33, 1723-1732.
Zhu, X., Burger, M., Doane, T.A., Horwath, W.R., 2013. Ammonia oxidation pathways and nitrifier denitrification are significant sources of N2O and NO under low oxygen availability. Proceedings of the National Academy of Sciences of the United States of America 110, 6328-6333.
Zhu-Barker, X., Horwath, W.R., Burger, M., 2015. Knife-injected anhydrous ammonia increases yield-scaled N2O emissions compared to broadcast or band-applied ammonium sulfate in wheat. Agriculture, Ecosystems and Environment 212: 148-157.

82