evaluating minimum spanning tree based segmentation · pdf fileevaluating minimum spanning...
TRANSCRIPT

Evaluating Minimum Spanning Tree Based
Segmentation Algorithms�
Yll Haxhimusa, Adrian Ion, Walter G. Kropatsch, and Thomas Illetschko
Pattern Recognition and Image Processing Group 183/2,Institute for Computer Aided Automation, Vienna University of Technology, Austria
{yll, ion, krw, illetsch}@prip.tuwien.ac.at
Abstract. Two segmentation methods based on the minimum spanningtree principle are evaluated with respect to each other. The hierarchicalminimum spanning tree method is also evaluated with respect to humansegmentations. Discrepancy measure is used as best suited to computethe segmentation error between the methods. The evaluation is doneusing gray value images. It is shown that the segmentation results ofthese methods have a considerable difference.
1 Introduction
In [8] it is suggested to bridge and not to eliminate the representational gap, andto focus efforts on region segmentation, perceptual grouping, and image abstrac-tion. The segmentation process results in “homogeneous” regions with respect tothe low-level cues using some similarity measures. Problems emerge because i)homogeneity of low-level cues will not map to the semantics [8] and ii) the degreeof homogeneity of a region is in general quantified by threshold(s) for a givenmeasure [2]. The union of regions forming the group is again a region with bothinternal and external properties and relations. The low-level coherence of bright-ness, color, texture or motion attributes should be used to come up sequentiallywith hierarchical partitions [12]. It is important that a grouping method has thefollowing properties [1]: i) capture perceptually important groupings or regions,which reflect global aspects of the image, ii) be highly efficient, running in timelinear in the number of pixels, and iii) creates hierarchical partitions [12].
Low-level cue image segmentation cannot produce a complete final “good”segmentation [11]. This lead researchers to look at the segmentation only in thecontext of a task, as well as the evaluation of the segmentation methods. Howeverin [9] the segmentation is evaluated purely as segmentation by comparing the seg-mentation done by humans with those done by the normalized cuts method [12].As can be seen in Fig. 1, there is a high degree of consistency of segmentationdone by humans (already demonstrated empirically in [9]), even thought humanssegment images at different granularity (refinement or coarsening). This refine-ment or coarsening could be thought of as a hierarchical structure on the image,i.e. the pyramid. Therefore in [9] a segmentation consistency measure that does� Supported by the Austrian Science Fund under grant FSP-S9103-N04.
A. Gagalowicz and W. Philips (Eds.): CAIP 2005, LNCS 3691, pp. 579–586, 2005.c© Springer-Verlag Berlin Heidelberg 2005
580 Y. Haxhimusa et al.
#35 #17 #2 #12 #18
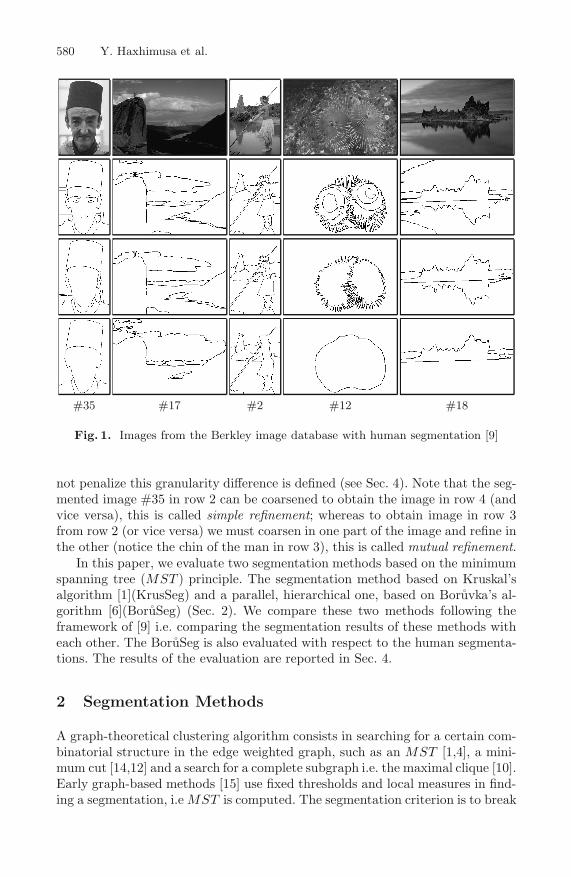
Fig. 1. Images from the Berkley image database with human segmentation [9]
not penalize this granularity difference is defined (see Sec. 4). Note that the seg-mented image #35 in row 2 can be coarsened to obtain the image in row 4 (andvice versa), this is called simple refinement; whereas to obtain image in row 3from row 2 (or vice versa) we must coarsen in one part of the image and refine inthe other (notice the chin of the man in row 3), this is called mutual refinement.
In this paper, we evaluate two segmentation methods based on the minimumspanning tree (MST ) principle. The segmentation method based on Kruskal’salgorithm [1](KrusSeg) and a parallel, hierarchical one, based on Bor̊uvka’s al-gorithm [6](Bor̊uSeg) (Sec. 2). We compare these two methods following theframework of [9] i.e. comparing the segmentation results of these methods witheach other. The Bor̊uSeg is also evaluated with respect to the human segmenta-tions. The results of the evaluation are reported in Sec. 4.
2 Segmentation Methods
A graph-theoretical clustering algorithm consists in searching for a certain com-binatorial structure in the edge weighted graph, such as an MST [1,4], a mini-mum cut [14,12] and a search for a complete subgraph i.e. the maximal clique [10].Early graph-based methods [15] use fixed thresholds and local measures in find-ing a segmentation, i.e MST is computed. The segmentation criterion is to break

Evaluating Minimum Spanning Tree Based Segmentation Algorithms 581
#35 #17 #2 #12 #18
Fig. 2. Segmentation produces by Bor̊uSeg(k = 300) in row 1-3 (from coarser tofiner segmentation), in row 4 KrusSeg(k = 300, σ = 1.5) and in row 5 KrusSeg(k =30000, σ = 1.5)
the MST edges with the largest weight, which reflect the low-cost connection be-tween two elements. To overcome the problem of a fixed threshold, Urquhart [13]normalizes the weight of an edge using the smallest weight incident on the ver-tices touching that edge. The methods in [1,4,6] use an adaptive criterion thatdepends on local properties rather than global ones.
We evaluate segmentations of the well known method [1] based on Kruskal’salgorithm, with the one [6] based on Bor̊uvka’s algorithm. Since, for both meth-ods there is a threshold dependent on the size of the connected component used(k/|CC|1 see [1,6] for more details.) in the merging criteria, the segmentationinclusion trees are different, because of the way the data is processed, the firstone does it in serial and the other one in parallel. Setting this threshold to zero
1 |CC| cardinality of the connected component.

582 Y. Haxhimusa et al.
both of the methods would produce the MST of the image, independent of theway the data is processed.
Some samples of the segmentation results, obtained by applying these meth-ods to gray value images are shown in Fig. 2. The Bor̊uSeg method is capable ofproducing a hierarchy of images, the pyramid (see the images in Fig. 2, whererow 1 represent lower levels of the pyramid, row 2 the middle levels, and row3 the higher levels). The methods use only local contrast based on pixel inten-sity values. We smoothed the images before segmenting them with the KrusSeg2
method (Gaussian with parameter σ = 1.5), whereas Bor̊uSeg worked with nonsmoothed images. As expected, and seen from Fig. 2, segmentation methodswhich are based only on low-level local cues can not create results as good ashumans. The overall number of regions in rows 1 and 4 in each column of Fig. 2,are almost the same, and this condition is required in [9] to perform the evalua-tion in Sec. 4. Both of the methods are capable of segmenting the face of a mansatisfactory (image #35). The Bor̊uSeg method did not merge the statue on thetop of the mountain with the sky (image #17), compared to humans which dosegment this statue as a single region (see Fig. 1). Both methods have problemssegmenting the sea creatures (image #12). Note that the segmentation done byhumans on the image of rocks (image #18), contains the axis of symmetry, eventhought there is no “big” local contrast, therefore both of the methods fail inthis respect.
3 Evaluating Segmentations
There are two general methods used to evaluate segmentations: (i) qualitativeand (ii) quantitative methods. Qualitative methods involve humans, meaningthat different observers would give different evaluations about the segmenta-tions (e.g. [7]). Quantitative methods are classified into analytic methods andempirical methods [16]. Analytical methods study the principles and propertiesof the algorithm, like processing complexity, efficiency and so on. For referenceson the analytic studies of methods based on minimum spanning tree see Sec. 2.The empirical methods study properties of the segmentations by measuring how“good” a segmentation is close to an “ideal” one, by determining this “good-ness” with some function of parameters. Both of the approaches depend on thesubjects, the first one, in coming up with the reference (perfect) segmentation3
and the second one, in defining the “goodness” function. The difference betweenthe segmented image and the (ideal) reference can be used to asses the perfor-mance of the algorithm [16]. The reference image could be a synthetic imageor be manually segmented by humans. Higher value of the discrepancy meansbigger error, signaling poor performance of the segmentation method. In [16],it is concluded that evaluation methods based on “mis-segmented pixels shouldbe more powerful than other methods using other measures”. In [9] the errormeasures used for evaluating segmentation counts the mis-segmented pixels.2 The method is very sensitive to noise [1].3 Also called a gold standard [3].

Evaluating Minimum Spanning Tree Based Segmentation Algorithms 583
In this paper we use the framework given in [9] to evaluate qualitatively theresult of the KrusSeg [1] with Bor̊uSeg [6] and of the Bor̊uSeg with respect tohumans using the discrepancy measures defined in the next section.
4 Benchmarking Segmentations
In [9] segmentations made by humans are used as a reference and basis for bench-marking segmentations produced by different methods. The concept behind thisis the observation that even though different people produce different segmenta-tions for the same image, the obtained segmentations differ, mostly, only in thelocal refinement of certain regions. This concept has been studied in [9] on a hu-man segmentation database (see Fig. 1) and used as a basis for defining two errormeasures, which do not penalize a segmentation if it is coarser or more refinedthan the other. In this sense, in an image P a pixel error measure E(S1, S2, p),between two segmentations S1 and S2 containing pixel p ∈ P , called the localrefinement error, is defined as:
E(S1, S2, p) =|R(S1, p)\R(S2, p)|
|R(S1, p)| (1)
where \ denotes set difference, |x| the cardinality of a set x, and R(S, p) is theset of pixels corresponding to the connected component in segmentation S thatcontains pixel p. Using the local refinement error E(S1, S2, p) the following errormeasures are defined in [9]: the Global Consistency Error (GCE), which forcesall local refinements to be in the same direction, and is defined as:
GCE(S1, S2) =1n
min
⎧⎨
⎩
∑
p∈P
E(S1, S2, p),∑
p∈P
E(S2, S1, p)
⎫⎬
⎭(2)
and the Local Consistency Error (LCE), allowing refinement in different direc-tions in different parts of the image:
LCE(S1, S2) =1n
∑
p∈P
min {E(S1, S2, p), E(S2, S1, p)} (3)
n is the number of pixels in the image. Notice that LCE ≤ GCE for any two seg-mentations. GCE is tougher measure than LCE, because GCE tolerates simplerefinements, while LCE tolerates mutual refinement as well.
We have used the GCE and LCE measures presented above to evaluate theBor̊uSeg method [6] using the human segmented images from the Berkley humanssegmented images database [9]. Also, the evaluation of Bor̊uSeg with respect toKrusSeg is done.
4.1 Evaluation of Segmentations on the Berkley Image Database
As mentioned in [9] a segmentation consisting of a single region and a segmen-tation where each pixel is a region, is the coarsest and finest possible of any

584 Y. Haxhimusa et al.
Human vs. human Bor̊uSeg vs. human Bor̊uSeg vs. KrusSeg
1 10 20 30 40 50 60 70 80 90 1000
0.1
0.2
0.3
0.4
0.5
0.6
0.7
0.8
0.9
1
1 10 20 30 40 50 60 70 80 90 1000
0.1
0.2
0.3
0.4
0.5
0.6
0.7
0.8
0.9
1
1 10 20 30 40 50 60 70 80 90 1000
0.1
0.2
0.3
0.4
0.5
0.6
0.7
0.8
0.9
1
1 10 20 30 40 50 60 70 80 90 1000
0.1
0.2
0.3
0.4
0.5
0.6
0.7
0.8
0.9
1
1 10 20 30 40 50 60 70 80 90 1000
0.1
0.2
0.3
0.4
0.5
0.6
0.7
0.8
0.9
1
1 10 20 30 40 50 60 70 80 90 1000
0.1
0.2
0.3
0.4
0.5
0.6
0.7
0.8
0.9
1
Fig. 3. The LCE (above) and GCE (below), error measure results for 100 images
segmentation. In this sense, the LCE and GCE measures should not be usedwhen the number of regions in the two segmentation differs a lot. So, takinginto consideration that the Bor̊uSeg produces a whole hierarchy of segmenta-tions with different number of regions (from coarser to finer), we have selectedfor the evaluation two levels of this pyramid. In the first case, we have taken foreach image the segmentation level produced by the Bor̊uSeg with the number ofregions closest to the average number of regions produced by the humans (forthe same image). When evaluating the KrusSeg we have chosen for the Bor̊uSegthe segmentation level that had the number of regions closest to the number ofregions produced by the KrusSeg method. In all the cases this meant going lowerin the pyramid and taking a level which is basically a refinement of the one usedwhen comparing to the humans. Also, as recommended by Felzenszwalb etal [1],the images given to the KrusSeg method have been smoothed with a Gaussianfilter (e.g. σ = 1.5). Because the KrusSeg still produced much more regions thanthe human segmentations in the database have, an evaluation of the KrusSegvs. the humans would have been unfair.
As data for the experiments, we take 100 gray level images from the BerkleyImage Database4. For each of the images in the test, we calculate the GCE andLCE using the results produced by the KrusSeg and the corresponding level fromthe hierarchy produced by Bor̊uSeg, and the human segmentations for the sameimage together with the corresponding level from the Bor̊uSeg pyramid. In thecase of humans and Bor̊uSeg, having more than one pair of GCE and LCE foreach image, we calculate the mean and the standard deviation. The results aresummarized in Fig. 3. As a reference point, in the same figure, you can see the4 http://www.cs.berkeley.edu/projects/vision/grouping/segbench/

Evaluating Minimum Spanning Tree Based Segmentation Algorithms 585
Human vs. human Bor̊uSeg vs. human Bor̊uSeg vs. KrusSeg
0 0.2 0.4 0.6 0.8 10
20
40
60
80
100
120
140
160
mean: 0.0592
0 0.2 0.4 0.6 0.8 10
20
40
60
80
100
120
140
160
mean: 0.1619
0 0.1 0.2 0.3 0.4 0.5 0.6 0.7 0.8 0.9 10
20
40
60
80
100
120
140
160
mean: 0.3619
0 0.2 0.4 0.6 0.8 10
20
40
60
80
100
120
140
160
mean: 0.0832
0 0.2 0.4 0.6 0.8 10
20
40
60
80
100
120
140
160
mean: 0.2289
0 0.1 0.2 0.3 0.4 0.5 0.6 0.7 0.8 0.9 10
20
40
60
80
100
120
140
160
mean: 0.4070
Fig. 4. Histograms of LCE (above) and GCE (below) discrepancy measure
results for calculating the GCE and LCE values for pairwise two segmentationsmade by humans, for the same image. We can see that the humans did verygood and proved to be consistent when segmenting the same image, and thatthe Bor̊uSeg produces segmentations that obtained higher values for the GCEand LCE error measures.
In Fig. 4 one can see the histograms of the GCE and LCE values obtained([0 . . . 1], where zero means no error), humans vs. humans, Bor̊uSeg vs. humans,and Bor̊uSeg vs. KrusSeg. Notice that the humans are consistent in segmentingthe images and the humans vs. humans histogram shows a peak very close to 0.Also, the results show that there is a considerable difference (GCE mean value0.4) between the segmentations produced by the Bor̊uSeg and KrusSeg methods.
5 Conclusion and Outlook
In this paper we have evaluated segmentation results of two methods based onthe minimum spanning tree principle. The evaluation is done using discrepancymeasures that do not penalize segmentations that are coarser or more refinedin certain regions. We use gray scale images to evaluate the quality of results.In the case of Bor̊uSeg, this evaluation can be used to find classes of images forwhich the algorithm has segmentation problems, corresponding to higher GCEand LCE values. We have observed that the results produced by the Bor̊uSegvs. KrusSeg methods have shown a considerable difference. We plan to use alarger image database to confirm the quality of the obtained results, and do theevaluation with additional low level cues (color and texture) as well as differentstatistical measures.

586 Y. Haxhimusa et al.
References
1. P. F. Felzenszwalb and D. P. Huttenlocher. Image Segmentation Using LocalVariation. In Proceedings of IEEE Conference on CVPR, p:98–104, June 1998.
2. C.-S. Fu, W. Cho, S, and K. Essig. Hierarchical Color Image Region Segmentationfor Content-based Image Retrieval System. IEEE Transaction on Image Processing,9(1):156–162, 2000.
3. C. N. Graaf, A. S. E. Koster, K. L. Vincken, and M. A. Viergever. Validationof the Interleaved Pyramid for the Segmentation of 3d Vector Images. PatternRecognition Letters, 15(5):469–475, 1994.
4. L. Guigues, L. M. Herve, and J.-P. Cocquerez. The Hierarchy of the Cocoons ofa Graph and its Application to Image Segmentation. Pattern Recognition Letters,24(8):1059–1066, 2003.
5. Y. Haxhimusa, A. Ion, W. G. Kropatsch, and L. Brun. Hierarchical Image Parti-tioning using Combinatorial Maps. Joint Hungarian-Austrian Conference on ImageProcessing and Patt. Recog., p:179–186, 2005.
6. Y. Haxhimusa and W. G. Kropatsch. Segmentation Graph Hierarchies. In A. Fred,T. Caelli, R. P. Duin, A. Campilho, and D. de Ridder, editors, Proceedings of JointInter. Work. on Struct., Synt., and Statis. Patt. Recog., LNCS 3138:343–351, 2004.
7. M. Heath, S. Sarkar, T. Sanocki, and K. Bowyer. A Robust Visual Methods forAssessing the Relative Performance of Edge-detection Algorithms. IEEE Transac-tions on PAMI, 19(12):1338–1359, 1997.
8. Y. Kesselman and S. Dickinson. Generic Model Abstraction from Examples. IEEETrans. on PAMI, issue on Synt. and Struct. Patt. Recog., 2005. to appear.
9. D. Martin, C. Fowlkes, D. Tal, and J. Malik. A Database of Human SegmentedNatural Images and its Application to Evaluating Segmentation Algorithms andMeasuring Ecological Statistics. In Proc. 8th ICCV, (2):416–423, July 2001.
10. M. Pavan and M. Pelillo. Dominant Sets and Hierarchical Clustering. In ICCV03,2003.
11. B. S. Borra and S. Sarkar. A Framework for Performance Characterization ofIntermediate-level Grouping Modules. Pattern Recognition and Image Analysis,19(11):1306–1312, 1997.
12. J. Shi and J. Malik. Normalized Cuts and Image Segmentation. In ProceedingsIEEE Conference CVPR, p:731–737, 1997.
13. R. Urquhart. Graph Theoretical Clustering Based on Limited Neighborhood Sets.Pattern Recognition, 13:3:173–187, 1982.
14. Z. Wu and R. Leahy. An Optimal Graph Theoretic Approach to Data Clustering:Theory and Its Application to Image Segmentation. IEEE Transactions on PAMI,15(11):1101–1113, 1993.
15. C. Zahn. Graph-theoretical Methods for Detecting and describing Gestalt Clusters.In IEEE Trans. Comput., Vol. 20:68–86, 1971.
16. Y. Zhang. A Survey on Evaluation Methods for Image Segmentation. PatternRecognition, 29(8):1335–1346, 1996.