evaluating last-mile distribution systems in nigeria ...pdf.usaid.gov/pdf_docs/pa00kzhp.pdf ·...
TRANSCRIPT
FEBRUARY 2015
This publication was produced for review by the U.S. Agency for International Development. It was prepared by the
USAID | DELIVER PROJECT, Task Order 4.
Evaluating Last-Mile Distribution
Systems in Nigeria

The authors' views expressed in this publication do not necessarily reflect the views of the U.S. Agency for
International Development or the United States Government.
Evaluating Last-Mile Distribution
Systems in Nigeria
USAID | DELIVER PROJECT, Task Order 4
The USAID | DELIVER PROJECT, Task Order 4, is funded by the U.S. Agency for International Development (USAID) under contract number GPO-I-00-06-00007-00, order number AID-OAA-TO-10-00064, beginning September 30, 2010. Task Order 4 is implemented by John Snow, Inc., in collaboration with Asociación Benéfica PRISMA; Cargo Management Logistics; Crown Agents USA, Inc.; Eastern and Southern African Management Institute; FHI 360; Futures Institute for Development, LLC; LLamasoft, Inc; The Manoff Group, Inc.; OPS MEND, LLC; PATH; PHD International (a division of the RTT Group); and VillageReach. The project improves essential health commodity supply chains by strengthening logistics management information systems, streamlining distribution systems, identifying financial resources for procurement and supply chain operation, and enhancing forecasting and procurement planning. The project encourages policymakers and donors to support logistics as a critical factor in the overall success of their healthcare mandates.
Recommended Citation
Watson, Noel, and Joseph McCord. 2015. “Evaluating Last-Mile Distribution Systems in Nigeria.” Arlington, Va.: USAID | DELIVER PROJECT, Task Order 4.
Abstract
The design of “last mile” distribution systems in healthcare delivery, indeed of supply chains in general, is a principal driver of their cost and performance. To contribute to the evidence base on design of last-mile distribution systems, the present study measures key costing and other outcome indicators for distribution through four different last-mile distribution systems in Nigeria. The study was conducted in five states in Nigeria—Bauchi, Ebonyi, Sokoto, Cross River, and Benue—which provided an opportunity to examine eight examples of the four systems. Three design options were evaluated: the level of dependence on service delivery point personnel, whether information capture was based on physical counts of inventory, and whether information capture and delivery occurred simultaneously or separately. The study set out to: 1) determine the stockout rates and inventory levels achieved within the various last-mile systems; 2) estimate the operating costs of each of the eight last-mile distribution system examples and investigate variations in costs between the systems; 3) estimate the start-up costs for these systems; 4) consider the scalability of the last-mile distribution systems given considerations for adding commodities and facilities to the systems; and 5) determine data quality and lead time for collection of data achieved by the various last-mile systems.
Cover photo: The local government area maternal and child health coordinator resupplying family planning
commodities to the service delivery provider, July 2015, Sokoto State, Nigeria. Photographer: Kubra Ahmed for
the USAID | DELIVER PROJECT
USAID | DELIVER PROJECT
John Snow, Inc.
1616 Fort Myer Drive, 16th Floor
Arlington, VA 22209 USA
Phone: 703-528-7474
Fax: 703-528-7480
Email: [email protected]
Internet: deliver.jsi.com
v
Contents
Acronyms............................................................................................................................................................................ ix
Acknowledgments ............................................................................................................................................................ xi
Executive Summary ........................................................................................................................................................ xiii
Last-Mile Distribution Systems ............................................................................................................................... xiii
Categorizing Design Choices for Last-Mile Distribution Systems ................................................................. xiv
Methodology ................................................................................................................................................................ xv
Results .......................................................................................................................................................................... xvi
Conclusions ................................................................................................................................................................. xix
Introduction ........................................................................................................................................................................ 1
Objectives ....................................................................................................................................................................... 2
Categorizing Design Choices for Last-Mile Distribution Systems ......................................................................... 3
Design Choices for Evaluation ................................................................................................................................... 3
Research Questions, Opportunity in Nigeria, and Methodology........................................................................... 7
Research Questions ..................................................................................................................................................... 7
Opportunity in Nigeria ................................................................................................................................................ 7
Methodology .................................................................................................................................................................. 9
Findings ............................................................................................................................................................................... 19
Inventory Performance of Last-Mile Systems ...................................................................................................... 19
Costing Last-Mile Distribution Systems in Nigeria at Current Scale ............................................................. 20
Comparing Costs across Last-Mile Distribution Systems ................................................................................. 24
Start-Up Costs ............................................................................................................................................................ 28
Scalability ....................................................................................................................................................................... 29
Data Quality of Last-Mile Distribution Systems .................................................................................................. 36
Summary and Discussion ............................................................................................................................................... 39
Summary of Results .................................................................................................................................................... 39
Implications of Design Choice ................................................................................................................................. 41
References ......................................................................................................................................................................... 45
Appendix A ....................................................................................................................................................................... 47
Costing of Last-Mile Distribution Systems ................................................................................................................ 47
Additional Cost Methodology Details ................................................................................................................... 47
Appendix B ........................................................................................................................................................................ 59
vi
Comparing Costs across Last-Mile Distribution Systems ...................................................................................... 59
Comparing Costs ........................................................................................................................................................ 59
Comparing Costs Incorporating Number of Commodities ............................................................................. 63
Appendix C ....................................................................................................................................................................... 65
Estimating Costs Assuming All Management Effort from Government of Nigeria .......................................... 65
Appendix D ....................................................................................................................................................................... 69
Scalability of Last-Mile Distribution Systems ............................................................................................................. 69
Framework for Scalability ......................................................................................................................................... 69
Cost Modeling ............................................................................................................................................................. 70
Insights into DDIC, R&DD, and IC&DD Operations ........................................................................................ 76
Developing Scalability Framework with Additional Cost Modeling ............................................................... 79
Scalability Framework Results ................................................................................................................................. 81
Conclusion .................................................................................................................................................................... 85
Appendix E ........................................................................................................................................................................ 87
Inventory Data Quality Assessment ............................................................................................................................ 87
Selection of Facilities .................................................................................................................................................. 88
Figures
Figure 1. Ebonyi DDIC Stockout Rate Performance for FP Commodities in Early Adopter LGAs ....... 12
Figure 2. Ebonyi DDIC Stockout Rate Performance for Malaria Commodities in Early Adopter
LGAs .............................................................................................................................................................................. 12
Figure 3. Bauchi DDIC Stockout Rate Performance for FP Commodities in Early Adopter LGAs ....... 12
Figure 4. Bauchi DDIC Stockout Rate Performance for Malaria Commodities in Early Adopter
LGAs .............................................................................................................................................................................. 12
Figure 5. Total Supply Chain Costs (U.S.$) per cbm Delivered ...................................................................... 21
Figure 6. DDIC Ebonyi Costs by Function ........................................................................................................... 22
Figure 7. R&DD Benue Costs by Function ........................................................................................................... 22
Figure 8. R&R FP Sokoto Costs by Function ....................................................................................................... 23
Figure 9. IC&DD Benue Costs by Function ......................................................................................................... 23
Figure 10. Breakdown of Costs by Funder ........................................................................................................... 24
Figure 11. Average Total Supply Chain Costs with Confidence Intervals (U.S.$) ...................................... 26
Figure 12. Comparing Functional Costs across Last-Mile Distribution Systems ......................................... 27
Figure 13. Total Cost Comparison of Last-Mile Distribution Systems with Increase in Commodities . 30
Figure 14. Costs per cbm for Last-Mile Distribution Systems with Increase in Number of
Commodities ............................................................................................................................................................... 32
Figure 15. Total Costs of Last-Mile Distribution Systems as Number of Facilities Increases .................. 34
Figure 16. Costs per Facility for Last-Mile Distribution Systems with Increase in Number of
Facilities ......................................................................................................................................................................... 36
Figure 17. Start-up Costs of Last-Mile Distribution Systems ........................................................................... 40
Figure 18. One-Way Sensitivity Analysis of Total Costs of Last-Mile Distribution Systems .................... 57
vii
Figure 19. Normalized Costs Assuming DDIC Ebonyi Number of Facilities, Volumes, and Number of
Commodities ............................................................................................................................................................... 63
Figure 20. Normalized Management Costs at DDIC Ebonyi Scale and Number of Commodities ........ 64
Figure 21. Normalized Costs Assuming All GoN Effort for Management .................................................... 67
Figure 22. Components of Dimensions of Scalability ......................................................................................... 70
Figure 23. Logistics Details for DDIC .................................................................................................................... 76
Figure 24. DDIC Transportation and Information Capture Costs ................................................................. 77
Figure 25. Number of Trucks for DDIC versus R&DD/IC&DD ..................................................................... 78
Figure 26. Route Details DDIC versus R&DD/IC&DD ..................................................................................... 79
Figure 27. Additional Cost Impact Modeling for Scalability Framework ....................................................... 79
Tables
Table 1. Last-Mile Distribution Systems in Nigeria ........................................................................................... xiv
Table 2. Categorization of Last-Mile Systems Operating in Nigeria .............................................................. xv
Table 3. Implications of Design Choice for Last-Mile Distribution Systems ................................................ xv
Table 4. Scale and Costing Results for Last-Mile Distribution Systems ...................................................... xvii
Table 5. Categorization of Last-Mile Systems Operating in Nigeria ................................................................ 4
Table 6. Implications of Design Choice for Last-Mile Distribution Systems .................................................. 5
Table 7. Last-Mile Distribution Systems in Nigeria .............................................................................................. 8
Table 8. Last-Mile Distribution System Details in Nigeria .................................................................................. 9
Table 9. Details of Staggered Rollout of DDIC to LGAs in Ebonyi ................................................................ 10
Table 10. Details of Staggered Rollout of DDIC to LGAs in Bauchi .............................................................. 11
Table 11. Supply Chain Scale for Last-Mile Distribution Systems in Nigeria................................................ 13
Table 12. Stockout Rates and % of Months of Stock above Inventory Level ............................................... 19
Table 13. Supply Chain Costs of Last-Mile Distribution Systems ................................................................... 21
Table 14. Cost Comparison Results by Funder (U.S.$) .................................................................................... 25
Table 15. Start-Up Costs of Last-Mile Distribution Systems ........................................................................... 28
Table 16. Inventory Accuracy Results from Physical Inventory Audit ........................................................... 37
Table 17. Reporting Rates and Time to Database for Last-Mile Distribution Systems ............................. 38
Table 18. Total Costs of Last-Mile Distributions Systems after Normalizing to DDIC Ebonyi Scale .... 39
Table 19. Inventory Availability and Inventory Accuracy for Last-Mile Distribution Systems ................. 40
Table 20. Observations on Implications of Last-Mile Distribution System Design Choices .................... 41
Table 21. Cost Categories and Descriptions ....................................................................................................... 47
Table 22. R&R Cost Line Items ............................................................................................................................... 53
Table 23. R&DD Cost Line Items ........................................................................................................................... 54
Table 24. DDIC Cost Line Items ............................................................................................................................ 55
Table 25. IC&DD HIV and R&DD HIV Cost Line Items ................................................................................... 56
Table 26. Supply Chain Scale for Last-Mile Distribution Systems in Nigeria................................................ 59
Table 27. DDIC Scaling Assumptions: Estimated Scaling Factor for Cost Line Items Given Benchmark
Increase ......................................................................................................................................................................... 60
Table 28. R&DD Malaria Scaling Assumptions: Estimated Scaling Factor for Cost Line Items Given
Benchmark Increase ................................................................................................................................................... 61
viii
Table 29. R&R Scaling Assumptions: Estimated Scaling Factor for Cost Line Items Given Benchmark
Increase ......................................................................................................................................................................... 61
Table 30. IC&DD HIV and R&DD HIV Scaling Assumptions: Estimated Scaling Factor for Cost Line
Items Given Benchmark Increase ........................................................................................................................... 62
Table 31. Conversion Factors to GoN for Management Labor ...................................................................... 65
Table 32. Estimating Management Costs for All GoN Effort (U.S.$) ............................................................. 66
Table 33. Effect on Total Costs of All GoN Effort for Management ............................................................. 66
Table 34. DDIC Parameters and Assumptions .................................................................................................... 72
Table 35. R&R Parameters and Assumptions ...................................................................................................... 73
Table 36. R&DD Parameters and Assumptions .................................................................................................. 73
Table 37. IC&DD Parameters and Assumptions (Information Capture) ...................................................... 74
Table 38. IC&DD Parameters and Assumptions (Direct Delivery)................................................................ 75
Table 39. Cost Impact Comparison ....................................................................................................................... 80
Table 40. Cost Comparison Using Scalability-Supporting Metric ................................................................... 81
Table 41. Comparing System Scalability – Adding Volume per Facility ......................................................... 82
Table 42. Comparing System Scalability – Adding Facilities ............................................................................. 83
Table 43. Comparing System Scalability – Adoption in Different Regions ................................................... 84
Table 44. Summary of Scalability Analysis ............................................................................................................. 85
Table 45. Commodities Used for Data Quality Assessment ........................................................................... 87
Table 46. Data Quality Assessment Details ......................................................................................................... 88
ix
Acronyms
A/A artesunate/amodiaquine
A/L artemether/lumefantrine
ART antiretroviral treatment
AZT azidothymidine
cbm cubic meter
CCW central contraceptive warehouse
CMS central medical stores
DD direct delivery
DDIC direct delivery and information capture
FMOH Federal Ministry of Health
FP family planning
GFATM Global Fund to Fight AIDS, Tuberculosis and Malaria
GoN Government of Nigeria
HIV human immunodeficiency virus
IC information capture
IC&DD information capture and direct delivery
IP implementing partner
LGA local government administration
LMIS logistics management information system
LOE level of effort
M&E monitoring and evaluation
MAPS Malaria Action Program for States
MOH Ministry of Health
NGN Nigerian naira
NVP nevirapine
OI opportunistic infection
ORS oral rehydration solution
PEPFAR President's Emergency Plan for AIDS Relief
PFSCM Partnership for Supply Chain Management
x
PMI President’s Malaria Initiative
R&DD review and direct delivery
R&R review & resupply
RDT rapid diagnostic kit
RH reproductive health
SDP service delivery point
SMOH State Ministry of Health
SP sulfadoxine-pyrimethamine
3PL third-party logistics service provider
3TC lamivudine
UNFPA United Nations Population Fund
USAID United States Agency for International Development
xi
Acknowledgments
The authors would like to thank and express their sincere appreciation to the staff of the Nigeria and Core USAID | DELIVER PROJECT; the Nigeria Partnership for Supply Chain Management office; the Ministry of Health in Ebonyi, Bauchi, Cross River, Benue, and Sokoto states; and the Federal Ministry of Health in Nigeria for the time, expertise, and support they provided for this activity. Special thanks go to Emmanuel Ogwuche, Elizabeth Igharo, Fatiya Askederin, Ezekiel Akintunde, Innocent Ibegbunam, Elizabeth Obaje, Tony Anammah, Kolawole Falayajo, Phillip Adegbotolu, John Durgavich, and Iyeme Efem.

xii
xiii
Executive Summary
The design of “last mile” distribution systems in healthcare delivery, indeed of supply chains in general, is a principal driver of their cost and performance. To contribute to the evidence base on design of last-mile distribution systems, this study measured key costing and other outcome indicators for distribution of health commodities through four different last-mile distribution systems in Nigeria. The study was conducted in five states in Nigeria—Bauchi, Benue, Cross River, Ebonyi, and Sokoto—which provided an opportunity to examine eight examples or instances of the four systems. The study set out to: 1) determine the stockout rates and inventory levels achieved within the various last-mile systems; 2) estimate the operating costs of each of the eight last-mile distribution system examples and investigate variations in costs between the systems; 3) estimate the start-up costs for these systems; 4) consider the scalability of the last-mile distribution systems given considerations for adding commodities and facilities to the systems; and 5) determine data quality and lead time for collection of data achieved by the various last-mile system systems. Here operating costs are the ongoing accounting costs required for the last-mile distribution system to function as designed, while start-up costs are the initial costs required for putting the system in place at the outset.
Last-Mile Distribution Systems
The four systems that we look at in this evaluation are the review and resupply (R&R) system, the review and direct delivery (R&DD) system, the direct delivery and information capture (DDIC) system, and the local government administration (LGA) review meetings referred to as the information capture and direct delivery (IC&DD) system. As shown in Table 1, in the five states these systems were employed as follows: Bauchi, R&R for reproductive health/family planning (RH/FP) programs and DDIC for RH/FP and malaria programs; Benue, R&DD for malaria programs and IC&DD for HIV programs; Cross River, R&DD for malaria and HIV programs; Ebonyi, DDIC for malaria and RH/FP programs; and Sokoto, R&R for RH/FP programs.
For the R&R system, service delivery point (SDP) facility staff attend meetings in clusters (usually a number of SDPs located in a few geographically contiguous LGAs) where information on consumption and inventory levels is collected or captured; in return, inventory is immediately provided to SDP personnel to be transported by them back to the SDP facilities. Here public transportation is the main mode of transport for facility staff. In Nigeria, facility workers bring their inventory from the facilities to review meetings and information capture of inventory levels is based on physical counts of this inventory.
For the R&DD, SDP facility staff also attend meetings in clusters to provide information on consumption patterns and inventory needs. Based on information collected during the review meetings, delivery of needed inventory occurs at a later date separately from the review meetings. In Nigeria, inventory is not brought to the review meetings for physical count, so information capture on inventory levels is based solely on inventory records brought by the SDP facility staff.
DDIC, otherwise called “moving warehouse,” involves a delivery truck and logistics personnel traveling to SDPs and performing physical counts of commodities to determine how much
xiv
inventory should be given to the facilities, with the required inventory then pulled from the delivery truck.
Finally, for IC&DD, visits to facilities by LGA personnel allow information on consumption patterns and inventory needs to be collected. These LGA personnel then attend their own review meeting to submit this information collected from the SDP facilities. As with R&DD, delivery of needed inventory occurs separately both from review meetings and visits by the LGA personnel to facilities and is based on information submitted through the LGA personnel review meetings.
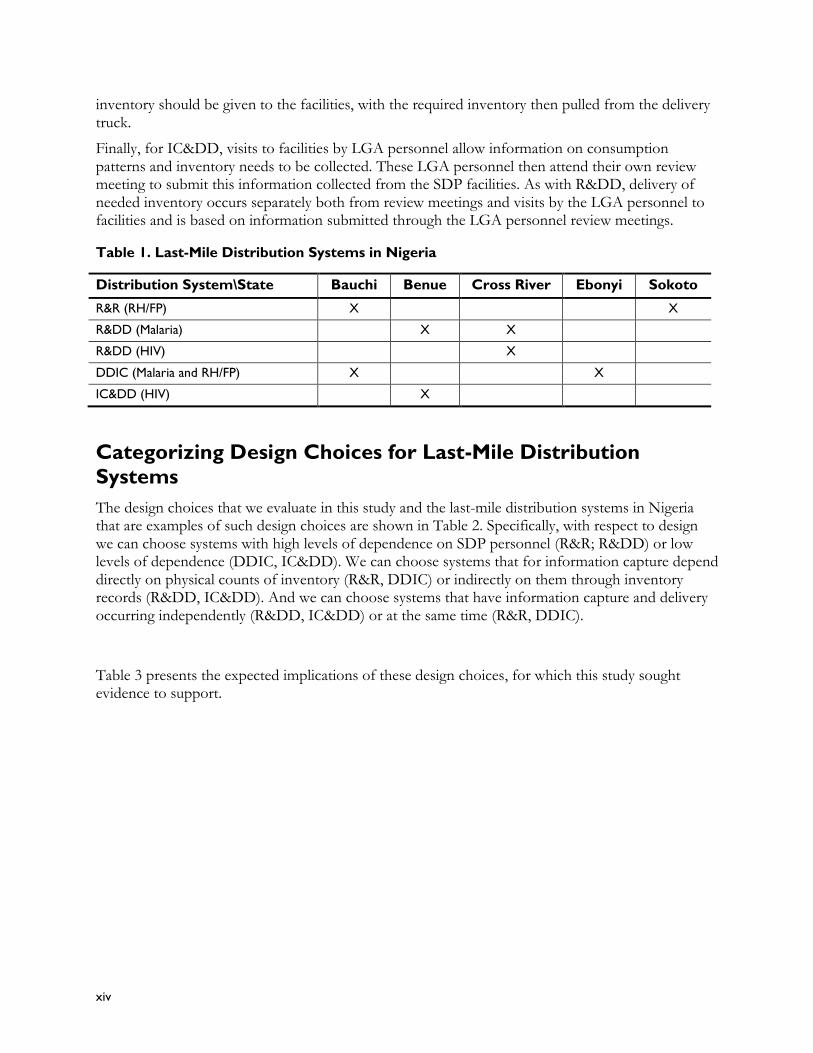
Table 1. Last-Mile Distribution Systems in Nigeria
Distribution System\State Bauchi Benue Cross River Ebonyi Sokoto
R&R (RH/FP) X X
R&DD (Malaria) X X
R&DD (HIV) X
DDIC (Malaria and RH/FP) X X
IC&DD (HIV) X
Categorizing Design Choices for Last-Mile Distribution
Systems
The design choices that we evaluate in this study and the last-mile distribution systems in Nigeria that are examples of such design choices are shown in Table 2. Specifically, with respect to design we can choose systems with high levels of dependence on SDP personnel (R&R; R&DD) or low levels of dependence (DDIC, IC&DD). We can choose systems that for information capture depend directly on physical counts of inventory (R&R, DDIC) or indirectly on them through inventory records (R&DD, IC&DD). And we can choose systems that have information capture and delivery occurring independently (R&DD, IC&DD) or at the same time (R&R, DDIC).
Table 3 presents the expected implications of these design choices, for which this study sought evidence to support.
xv
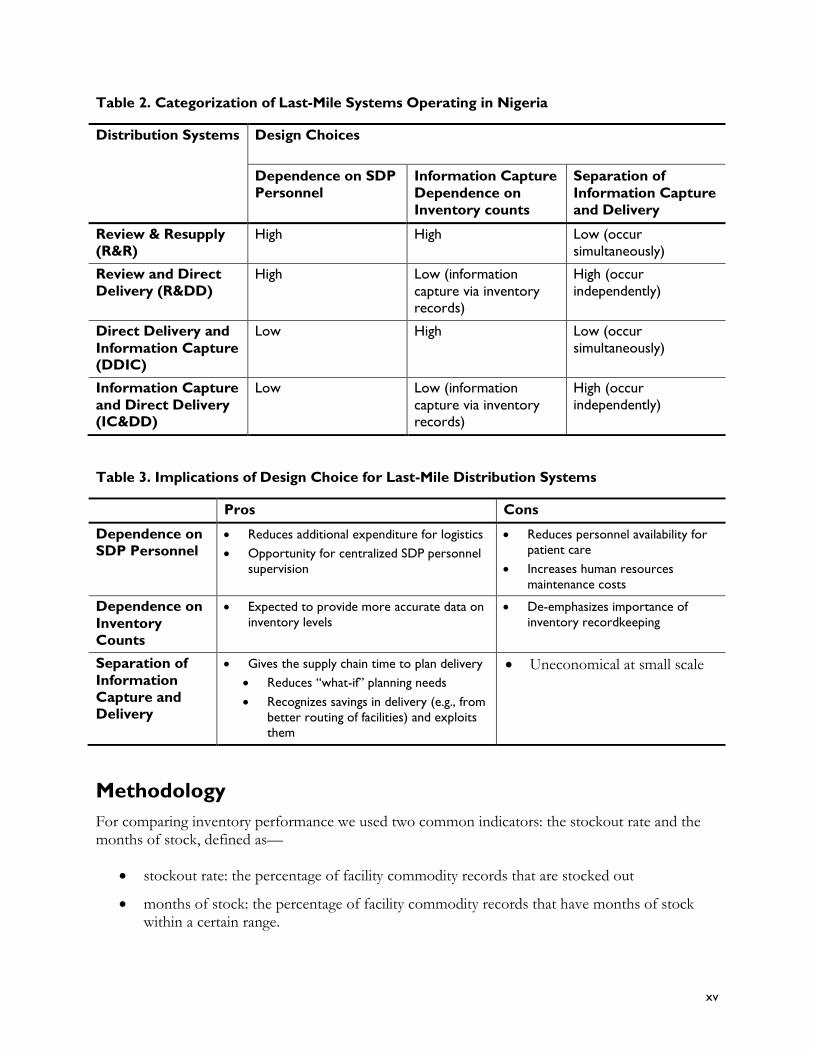
Table 2. Categorization of Last-Mile Systems Operating in Nigeria
Distribution Systems
Design Choices
Dependence on SDP
Personnel
Information Capture
Dependence on
Inventory counts
Separation of
Information Capture
and Delivery
Review & Resupply
(R&R)
High High Low (occur
simultaneously)
Review and Direct
Delivery (R&DD)
High Low (information
capture via inventory records)
High (occur
independently)
Direct Delivery and
Information Capture (DDIC)
Low High Low (occur
simultaneously)
Information Capture
and Direct Delivery (IC&DD)
Low Low (information
capture via inventory records)
High (occur
independently)
Table 3. Implications of Design Choice for Last-Mile Distribution Systems
Pros Cons
Dependence on
SDP Personnel
Reduces additional expenditure for logistics
Opportunity for centralized SDP personnel
supervision
Reduces personnel availability for
patient care
Increases human resources
maintenance costs
Dependence on
Inventory
Counts
Expected to provide more accurate data on
inventory levels
De-emphasizes importance of
inventory recordkeeping
Separation of
Information
Capture and Delivery
Gives the supply chain time to plan delivery
Reduces “what-if” planning needs
Recognizes savings in delivery (e.g., from
better routing of facilities) and exploits
them
Uneconomical at small scale
Methodology
For comparing inventory performance we used two common indicators: the stockout rate and the months of stock, defined as—
stockout rate: the percentage of facility commodity records that are stocked out
months of stock: the percentage of facility commodity records that have months of stock within a certain range.
xvi
These inventory performance indicators were generated from the reports submitted by facilities or generated at facilities (DDIC) at the end of each replenishment cycle.
Our costing approach estimated the costs of operating the systems at their current scale in terms of number of facilities and volume of commodities delivered. We collected cost information at all levels of the supply chain that were involved in supporting inventory movement, whether central/federal, state, LGA, or facility, using standard costing methodologies. Given the difference in scale of the various last-mile distribution systems, a comparison of costs across the systems required answering the question: “What would the costs have been if each system in their respective states had been delivering the same volume of commodities to the same number of facilities?” We did this via cost modeling with some analysis to see how the results would change if our assumptions on the changes in costs were assumed to have some error.
For estimating start-up costs we identified the activities involved for each of the last-mile distribution systems such as advocacy, pre-training preparations, orientation of health facilities, etc. Field personnel familiar with start-up costs and activities for each of the last-mile distribution systems were surveyed for estimates of start-up costs. As with comparing operating costs across the last-mile distributing systems, our approach to estimating start-up costs compensated for the differences in scale observed.
To consider the scalability of the different last-mile distribution systems with respect to the addition of commodities and facilities, we use additional mathematical modeling. Our approach made use of the detailed understanding of the operations of each last-mile distribution system that our costing exercise facilitated. We directly use this insight to make a prediction of what will happen to costs of each system as we add more and more commodities or add more and more facilities.
Data quality was assessed from multiple perspectives. The first was the accuracy of the inventory records captured in requisition and reporting forms, that is, the degree to which reported inventory levels matched with actual inventory. The inventory data accuracy metric used here was the percentage of facility-commodity combinations with deviations within a specific threshold percentage of the benchmark. To generate the data for the inventory data accuracy metric, an audit of the data reported on these forms was performed through a physical count of inventory quantities at a sample of facilities in distribution systems. Additional perspectives on data quality included—
1. reporting rates: the percentage of facilities that submit reports in a reporting cycle
2. time to database: the number of working days from the beginning of the reporting and requisition schedule to the point where 98 percent of facility reporting forms had been entered into a central digital database.
Results
Inventory Management
With respect to inventory management, all systems were similarly functional, with single-digit stockout rates and good general inventory availability.
Costing Operations at Current Scale
A costing exercise using standard costing methodology revealed that at their respective scales, all last-mile systems use significant amounts (share of total costs at 10 percent or greater) of
xvii
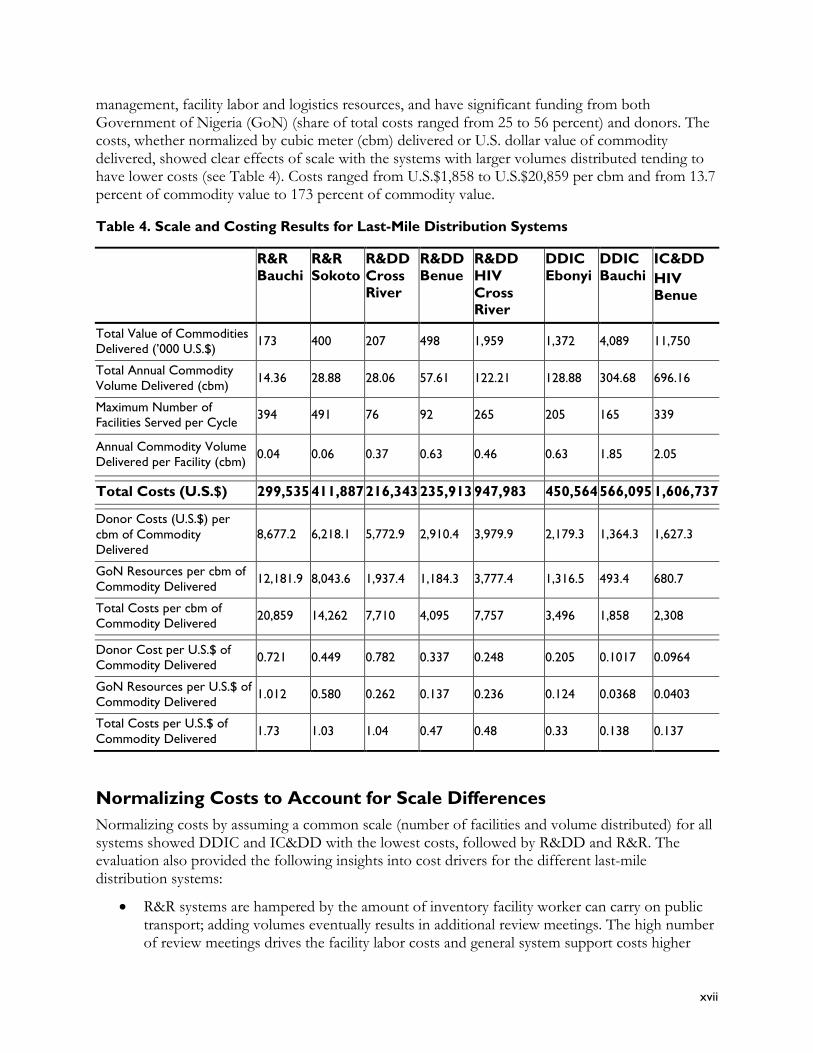
management, facility labor and logistics resources, and have significant funding from both Government of Nigeria (GoN) (share of total costs ranged from 25 to 56 percent) and donors. The costs, whether normalized by cubic meter (cbm) delivered or U.S. dollar value of commodity delivered, showed clear effects of scale with the systems with larger volumes distributed tending to have lower costs (see Table 4). Costs ranged from U.S.$1,858 to U.S.$20,859 per cbm and from 13.7 percent of commodity value to 173 percent of commodity value.
Table 4. Scale and Costing Results for Last-Mile Distribution Systems
R&R
Bauchi
R&R
Sokoto
R&DD
Cross
River
R&DD
Benue
R&DD
HIV
Cross River
DDIC
Ebonyi
DDIC
Bauchi
IC&DD
HIV Benue
Total Value of Commodities
Delivered (’000 U.S.$) 173 400 207 498 1,959 1,372 4,089 11,750
Total Annual Commodity
Volume Delivered (cbm) 14.36 28.88 28.06 57.61 122.21 128.88 304.68 696.16
Maximum Number of
Facilities Served per Cycle 394 491 76 92 265 205 165 339
Annual Commodity Volume
Delivered per Facility (cbm) 0.04 0.06 0.37 0.63 0.46 0.63 1.85 2.05
Total Costs (U.S.$) 299,535 411,887 216,343 235,913 947,983 450,564 566,095 1,606,737
Donor Costs (U.S.$) per
cbm of Commodity
Delivered
8,677.2 6,218.1 5,772.9 2,910.4 3,979.9 2,179.3 1,364.3 1,627.3
GoN Resources per cbm of
Commodity Delivered 12,181.9 8,043.6 1,937.4 1,184.3 3,777.4 1,316.5 493.4 680.7
Total Costs per cbm of
Commodity Delivered 20,859 14,262 7,710 4,095 7,757 3,496 1,858 2,308
Donor Cost per U.S.$ of
Commodity Delivered 0.721 0.449 0.782 0.337 0.248 0.205 0.1017 0.0964
GoN Resources per U.S.$ of
Commodity Delivered 1.012 0.580 0.262 0.137 0.236 0.124 0.0368 0.0403
Total Costs per U.S.$ of
Commodity Delivered 1.73 1.03 1.04 0.47 0.48 0.33 0.138 0.137
Normalizing Costs to Account for Scale Differences
Normalizing costs by assuming a common scale (number of facilities and volume distributed) for all systems showed DDIC and IC&DD with the lowest costs, followed by R&DD and R&R. The evaluation also provided the following insights into cost drivers for the different last-mile distribution systems:
R&R systems are hampered by the amount of inventory facility worker can carry on public transport; adding volumes eventually results in additional review meetings. The high number of review meetings drives the facility labor costs and general system support costs higher
xviii
than for other systems lacking such dynamics. However, actual information capture, transport, and storage costs are lowest for R&R compared with all systems, given that 1) information capture and delivery occur simultaneously; 2) the use of facility labor reduces the need for additional logistics personnel; and 3) public transportation is usually a relatively cheap form of transportation for persons with small cargo.
For R&DD, the cost of storage, transport, and information capture through review meetings (stipends) is more costly than for all other systems. This is arguably because these activities occur separately.
For IC&DD, despite the separation of the activities, the cost of storage, transport, and information capture are lower than for R&DD as the cost of information capture is greatly reduced by the use of LGA monitoring and evaluation (M&E) officers. The distribution approach also employed more cost-efficient direct delivery from central warehouse to facilities, skipping a separate state-based storage tier of the supply chain, compared with the R&DD.
Finally, for DDIC, the savings from information capture and delivery occurring simultaneously result in the second lowest such costs of all the systems Additional contributors to cost saving include similar storage tier skipping in the supply chain (for antimalarial commodities) as with the IC&DD. System support costs for DDIC were high as well, given the additional support needed for the more complex activities that accompany truck deliveries.
The costs of information capture, storage, and transport across the four last-mile systems suggest the automatic cost savings benefit of having information capture and delivery occur simultaneously. However, where activities occur separately, opportunities can exist for additional cost savings if attention is paid to optimizing the costs in the supply chain given the flexibility provided. An example of this is the use of LGA M&E officer review meetings for information capture in IC&DD versus SDP facility staff review meetings in R&DD.
Except for the R&R systems, facility labor costs across the systems are similar despite some systems having in theory a higher dependence on SDP personnel. This may suggest a natural budgeting of time for last-mile systems by SDP personnel, i.e., systems that depend more heavily on SDP personnel may see more rationing of the time that the SDP personnel commits to the last-mile distribution system. The result is that the overall time provided by the SDP personnel is similar across those last-mile distribution systems.
Start-Up Costs
The ranking of start-up costs was a bit counter to the ranking of operational costs normalized to account for scale differences. The highest operating cost system—R&R—actually had the lowest start-up costs, while the DDIC with the lowest operating costs actually had one of the highest start-up costs. Generally though, this means that the higher start-up costs can be justified given sufficient scale.
Scalability
The relationship that arose from the exercise of normalizing costs by assuming a common scale (number of facilities and volume distributed) for all systems seems to play out in simulations of
xix
adding commodities and facilities: DDIC and IC&DD have similar costs with slight preference for DDIC for low number of commodities and facilities, followed by R&DD and then R&R. More importantly average costs, e.g., cost per cbm and cost per facility, tend to decrease with addition of commodities or fall initially before plateauing, with addition of facilities for all systems confirming economies of scale. This is particularly revealing for the DDIC given that one of the speculations about this system is its inability to handle large number of commodities (Sarley, Baruwa, & Tien, 2010).
Data Quality
For both DDIC and R&R, where the information capture for requisition form submission is directly dependent on physical counts, the percentage of submitted inventory records that are within 5 percent of the physical inventory is above 60 percent and averages 76 percent across the systems. On the other hand, the accuracy for the IC&DD and R&DD systems, where information capture is based on inventory records, is below 40 percent and averages 29 percent. So when physical counts drive information capture, submitted inventory level records are at least twice as accurate as when not. We were unable to determine whether the inventory stockkeeping at the facilities was also affected by the approach to information capture for requisition submission.
Facility reporting rates for DDIC, R&R, and R&DD-malaria are above 90 percent, while the HIV systems have reporting rates closer to 70 percent. (In contrast with the other systems, DDIC reporting rates are measured based on availability of SDP staff at a facility when the DDIC team arrives at the facility.) Most of the systems take a little over a month to have the data collected through information capture entered into a central database. R&R systems have the lowest time for entry in the central database of three weeks.
Conclusions
The purpose of this study was to contribute to the evidence base on design of last-mile distribution systems and thus inform their design. We focused on three design options—dependence on SDP personnel, dependence on inventory counts, and separation of information capture and delivery— and collected evidence from four categories of distribution systems in Nigeria to see the effect of those design options on the costs and performance of these systems.
With respect to the performance of the four last-mile distribution systems we find that DDIC and IC&DD have the lowest costs and were similar on some metrics, e.g., inventory availability, while on other metrics like inventory accuracy DDIC had a distinct advantage. For start-up costs, DDIC was one of the highest but there is an expectation that additional start-up costs could be recovered from the operational savings given sufficient time. The scalability prospects for these systems especially the DDIC and IC&DD are good. Average supply chain costs are projected to keep falling or fall then plateau as we add commodities or facilities respectively, and both systems should maintain their low cost status compared with the alternatives considered here.
With respect to our design options, dependence on SDP personnel can reduce additional expenditure on logistics as R&R systems were observed to have the lowest costs for logistics activities of storage, distribution, and information capture. R&R can also provide opportunity for SDP personnel supervision; start-up costs for R&R did not have a separate training component since training could occur at the first review meeting. Dependence on SDP personnel can be costly. As part of the R&DD start-up, training of facility workers under R&DD occurred outside of review meetings and R&DD’s training costs were the highest of all the systems while DDIC with a lower
xx
dependence on facility workers had the lowest training costs for health facilities. For operating costs, facility labor costs for R&R were almost 10 times that of other systems when operating at the same scale. This is particularly significant given that the human resource within healthcare is one of the most constrained.
Using physical counts for information capture generally resulted in more accurate information on inventory at SDP facilities. The concern with de-emphasis on inventory recording resulting from use of physical counts is mitigated based on two observations. The first is that the Nigerian healthcare setting is characterized by multiple vertical programs operating through health facilities. Unless all programs adopted physical counts, inventory recording would still be emphasized by non-physical count–based systems. However, given the results found here, such programs may also suffer from poor accuracy of the information on inventory at SDP facilities. The second observation is that at R&R review meetings, poor inventory records identified by physical counts would prompt targeted supervision and training, while DDIC teams in some cases did provide some retraining of SDP staff at the facility when inventory records were significantly different from physical count data. Inventory stockkeeping at facilities may not suffer if physical counts are used to prompt targeted retraining.
Finally, both separate and simultaneous information capture and delivery can serve as the foundation of cost-efficient last-mile distribution systems. We observed IC&DD (separate) with similar costs as DDIC (simultaneous). Whereas DDIC benefited from the automatic cost savings inherent in having simultaneous information capture and delivery, arguably IC&DD’s comparable costs were driven by deliberate attention of managers and designers to finding cost savings through opportunities such as using LGA M&E officers to collect reporting forms and reducing logistics costs by tier-skipping in the supply chain. This suggests a general rule concerning the conditions for success for the two design options. Cost savings under simultaneous information capture and delivery tend to be easier to achieve, but the system operates under constraints. For the R&R systems, these constraints are significant impediments to overall cost efficiencies. On the other hand, managers and designers of systems with separate information capture and delivery will likely have to work harder to achieve similar savings but have more flexibility in pursuing those savings.
1
Introduction
“Last mile” distribution systems —logistics systems that replenish inventory commodities at service delivery points (SDPs) but also facilitate inventory and logistics data capture—are crucial to healthcare delivery in developing countries (Chandani, Noel, Pomeroy, Andersson, Pahl, & Williams, 2012; Robertson, Forte, Trapsida, & Hill, 2009; Pagnoni, Convelbo, Tiendrebeogo, Cousens, & Esposito, 1997; Gill, et al., 2013; USAID | DELIVER PROJECT, Task Order 4, 2011). In Nigeria, different last-mile distribution systems operating in various states provided an opportunity for a study of these systems. The systems examined in this study are the following: review and resupply (R&R) systems; review and direct delivery (R&DD) systems; direct delivery and information capture (DDIC) systems; and information capture and direct delivery (IC&DD) systems.
Review and resupply: R&R systems, otherwise referred to as “collection” systems (i+ Solutions, MIT Zaragoza, Transaid, and VillageReach, 2010; VillageReach, 2009), involve scheduled meetings for clusters of SDP personnel at subcentral locations where information on consumption and inventory levels is collected; in return, inventory is immediately provided to the SDP personnel, who are then responsible for the physical transportation of this inventory to the SDP. In Nigeria, this system is primarily used for family planning (FP) commodities, and as the volumes of these commodities are small enough, facility workers bring their inventory from the facilities and information capture is based on physical counts of this inventory as well as summary reports from the facility.
Review and direct delivery: R&DD, as with R&R, involves scheduled meetings for clusters of SDP personnel at subcentral locations where information on consumption and inventory levels is collected, but commodities are not provided at this time. Instead, delivery of commodities to the SDPs based on the information captured occurs at a later date. These systems are referred to as cluster review meetings in Nigeria and are used for HIV and malaria commodities. Since the volumes of these commodities are large, inventory is not brought to review meetings as with the R&R, but instead information capture is done based on inventory records that are brought to the review meetings by the facility workers.
Direct delivery and information capture: DDIC systems, otherwise referred to as “moving warehouse” or “informed push” systems (Systems for Improved Access to Pharmaceuticals and Services (SIAPS) Program, 2014; USAID | DELIVER PROJECT Task Order 1, 2008), involve a delivery truck and logistics personnel traveling to SDPs and performing physical counts of commodities along with some review of SDP inventory records to determine how much inventory should be given to facilities, which is then pulled from the delivery truck.
Information capture and direct delivery: IC&DD systems have information collection occurring separately from delivery as with the R&DD, but the information capture occurs at the facility. In Nigeria, these systems are referred to as local government administration (LGA) review meetings because they involve LGA monitoring and evaluation (M&E) officers visiting facilities to collect inventory reports created by facility workers, followed by these LGA officers attending centrally located meetings for submission of the inventory reports. These systems have been used for HIV commodities.
2
Objectives
To contribute to the evidence base on last-mile systems in Nigeria, the present study was designed to measure key costing and other outcome indicators for distribution through R&R, R&DD, DDIC, and IC&DD last-mile systems. The study set out to—
3. determine the stockout rates and inventory levels achieved by the various last-mile systems
4. calculate the total cost for each last-mile distribution system and investigate variations in costs between the systems
5. estimate the start-up costs for these systems
6. determine the data quality and lead time for collection of data provided by the various instances of the last-mile systems
7. consider the scalability of the systems given expectations for adding commodities and facilities to the systems.
3
Categorizing Design Choices for
Last-Mile Distribution Systems
Everything starts with design. The initial act of conceiving of what we will do and how we will do it sets the stage for everything else. And this is true for technology, where the architecture of our cell phone determines how fast it is and what else we can do with it besides making a phone call. This is true for a building where the blueprint decides how much a building will cost, how that building will look, how the rooms will flow from one to another, how that building will perform in an earthquake or fire.
This is true for supply chains, whether the supply chain delivers health commodities or cell phones; the blueprint for the supply chain determines its cost and its performance. We want a better understanding of what the consequences are of particular choices for systems that focus on healthcare commodities. We want to learn from design choices that others have made to drive future design choices because everything starts with design.
Design Choices for Evaluation
Previous studies of last-mile design have focused on impact of formal and dedicated logistics systems compared with informal and ad hoc systems (VillageReach, 2009); the use of cross-docking to support direct delivery to health facilities (World Bank, 2010); general investment in supply chain strengthening such as commodity procurement (Futures Institute, 2011); increased frequency of delivery (Sarley, Baruwa, & Tien, 2010); delivery-based system versus collection-based system (i+ Solutions, MIT Zaragoza, Transaid, and VillageReach, 2010); outsourcing logistics to a third party (USAID | DELIVER PROJECT, 2010; Vian, 2003; MIT Zaragoza, Transaid, and VillageReach, 2011); and costing of last-mile systems (Rosen, Bancroft, Hasselback, Levin, Mvundura, & Tien, 2013). The design choices that we evaluate here and the last-mile distribution systems in Nigeria that are examples of such design choices are captured in Table 5. We can choose systems with varying levels of dependence on SDP personnel; we can choose systems that directly depend on physical counts or indirectly on them through inventory records for information capture; and finally we can choose systems that have the information capture and direct delivery occurring independently or at the same time.
4
Table 5. Categorization of Last-Mile Systems Operating in Nigeria
Distribution Systems Design Choices
Dependence on SDP
Personnel
Information Capture
Dependence on
Inventory Counts
Separation of
Information Capture
and Delivery
Review & Resupply
(R&R)
High High Low (occur
simultaneously)
Review and Direct
Delivery (R&DD)
High Low (information capture
via inventory records)
High (occur
independently)
Direct Delivery and
Information Capture
(DDIC)
Low High Low (occur
simultaneously)
Information Capture
and Direct Delivery (IC&DD)
Low Low (information capture
via inventory records)
High (occur
independently)
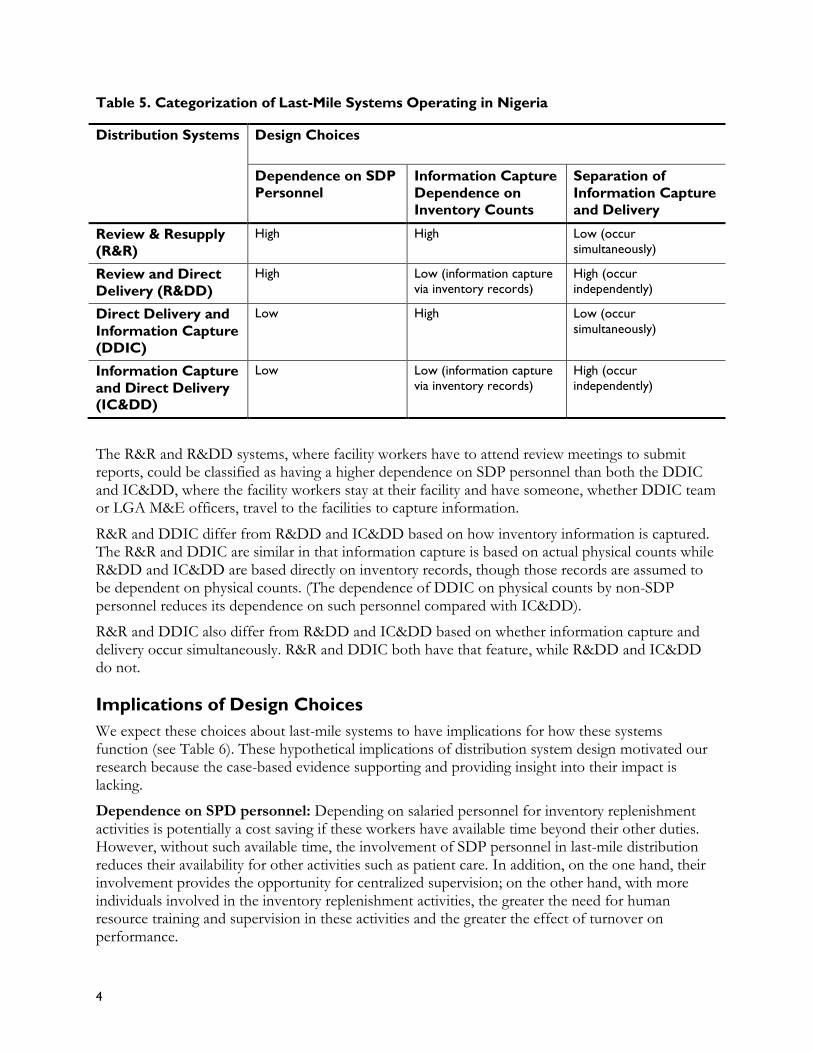
The R&R and R&DD systems, where facility workers have to attend review meetings to submit reports, could be classified as having a higher dependence on SDP personnel than both the DDIC and IC&DD, where the facility workers stay at their facility and have someone, whether DDIC team or LGA M&E officers, travel to the facilities to capture information.
R&R and DDIC differ from R&DD and IC&DD based on how inventory information is captured. The R&R and DDIC are similar in that information capture is based on actual physical counts while R&DD and IC&DD are based directly on inventory records, though those records are assumed to be dependent on physical counts. (The dependence of DDIC on physical counts by non-SDP personnel reduces its dependence on such personnel compared with IC&DD).
R&R and DDIC also differ from R&DD and IC&DD based on whether information capture and delivery occur simultaneously. R&R and DDIC both have that feature, while R&DD and IC&DD do not.
Implications of Design Choices
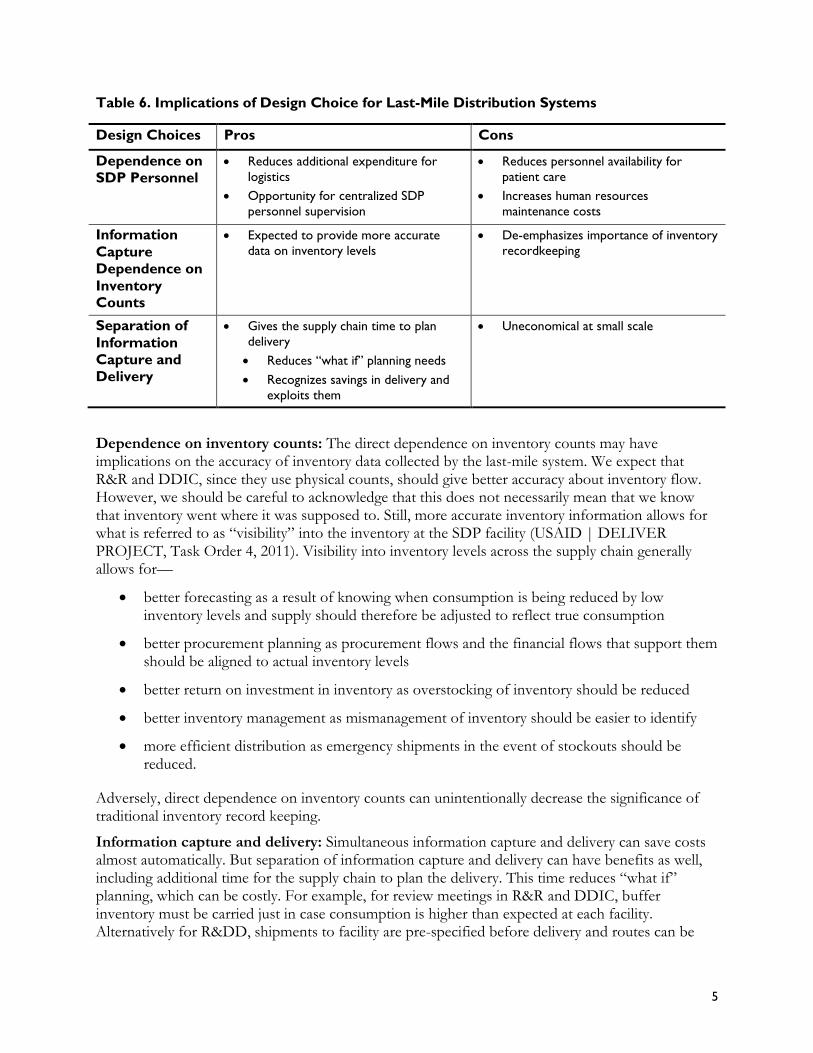
We expect these choices about last-mile systems to have implications for how these systems function (see Table 6). These hypothetical implications of distribution system design motivated our research because the case-based evidence supporting and providing insight into their impact is lacking.
Dependence on SPD personnel: Depending on salaried personnel for inventory replenishment activities is potentially a cost saving if these workers have available time beyond their other duties. However, without such available time, the involvement of SDP personnel in last-mile distribution reduces their availability for other activities such as patient care. In addition, on the one hand, their involvement provides the opportunity for centralized supervision; on the other hand, with more individuals involved in the inventory replenishment activities, the greater the need for human resource training and supervision in these activities and the greater the effect of turnover on performance.
5
Table 6. Implications of Design Choice for Last-Mile Distribution Systems
Design Choices Pros Cons
Dependence on
SDP Personnel
Reduces additional expenditure for
logistics
Opportunity for centralized SDP
personnel supervision
Reduces personnel availability for
patient care
Increases human resources
maintenance costs
Information
Capture
Dependence on
Inventory Counts
Expected to provide more accurate
data on inventory levels
De-emphasizes importance of inventory
recordkeeping
Separation of
Information
Capture and
Delivery
Gives the supply chain time to plan
delivery
Reduces “what if” planning needs
Recognizes savings in delivery and
exploits them
Uneconomical at small scale
Dependence on inventory counts: The direct dependence on inventory counts may have implications on the accuracy of inventory data collected by the last-mile system. We expect that R&R and DDIC, since they use physical counts, should give better accuracy about inventory flow. However, we should be careful to acknowledge that this does not necessarily mean that we know that inventory went where it was supposed to. Still, more accurate inventory information allows for what is referred to as “visibility” into the inventory at the SDP facility (USAID | DELIVER PROJECT, Task Order 4, 2011). Visibility into inventory levels across the supply chain generally allows for—
better forecasting as a result of knowing when consumption is being reduced by low inventory levels and supply should therefore be adjusted to reflect true consumption
better procurement planning as procurement flows and the financial flows that support them should be aligned to actual inventory levels
better return on investment in inventory as overstocking of inventory should be reduced
better inventory management as mismanagement of inventory should be easier to identify
more efficient distribution as emergency shipments in the event of stockouts should be reduced.
Adversely, direct dependence on inventory counts can unintentionally decrease the significance of traditional inventory record keeping.
Information capture and delivery: Simultaneous information capture and delivery can save costs almost automatically. But separation of information capture and delivery can have benefits as well, including additional time for the supply chain to plan the delivery. This time reduces “what if” planning, which can be costly. For example, for review meetings in R&R and DDIC, buffer inventory must be carried just in case consumption is higher than expected at each facility. Alternatively for R&DD, shipments to facility are pre-specified before delivery and routes can be
6
planned based on these pre-specified deliveries to create savings, whether by changing routes, or changing transportation to better suit the planned deliveries.
In summary, the design choices that we study here have implications for 1) the burden placed on health facility workers and the human resource support for those workers; 2) the quality of information that is available for monitoring, evaluation, and management of the supply chain, and finally 3) the opportunity for natural cost savings versus the need for management attention to find other cost savings in the system—i.e., when we combine information capture and delivery we will have some automatic savings but some constraints, while separating them gives us more flexibility but we must work smarter to find cost savings.
7
Research Questions,
Opportunity in Nigeria, and
Methodology
Research Questions
The following questions concerning last-mile distribution systems have driven the analysis in this study:
1. How do these systems compare with respect to inventory availability?
2. How do the operating costs of these systems compare with each other, and how are they driven by the choices made in their design?
3. What are the start-up costs for these systems?
4. How do these systems compare with respect to ability to handle added volumes, or additional facilities, i.e., scalability?
5. How do these systems compare with respect to data quality of information capture?
Here operating costs are the ongoing accounting costs required for the last-mile distribution system to function as designed, while start-up costs are the initial costs required for putting the system in place at the outset.
Opportunity in Nigeria
In Nigeria the opportunity existed to collect evidence and gain insight into the implications of last- mile distribution system design. All four systems were in operation—some operating in the same state—and with similar implementing partner management structure and norms (see Table 7). In particular, the introduction of pilots of the DDIC distribution system approach in two states served as an impetus for this research study.
Our strategy for selecting and comparing systems for the study was driven by the following considerations. We did not seek to compare formally designed last-mile systems with non-formal or non-functioning systems. We chose formal systems because designs are formal; they are deliberate choices that are made about how the supply chain will perform. We also focused on systems for which there was a reasonable expectation for functionality because although one can learn from dysfunctional systems, it can be more difficult. Functional systems managed by states or other agencies were also avoided as it increased the difficulty in determining the drivers of performance differences across the systems. In such comparisons, it could be difficult to determine whether it was the system design or the management that was driving observed differences. Finally, we did not try to address questions concerning health outcome differences across these systems. For example, we do not answer questions about whether more lives are saved with one last-mile system versus
8
another. In supply chain management research, health outcome differences are typically studied when comparing functional systems with dysfunctional systems (World Bank, 2010). Along with inventory availability, other factors contribute to health outcomes and so unless the difference in inventory availability is large, differences in health outcomes attributable to inventory availability are difficult to identify.
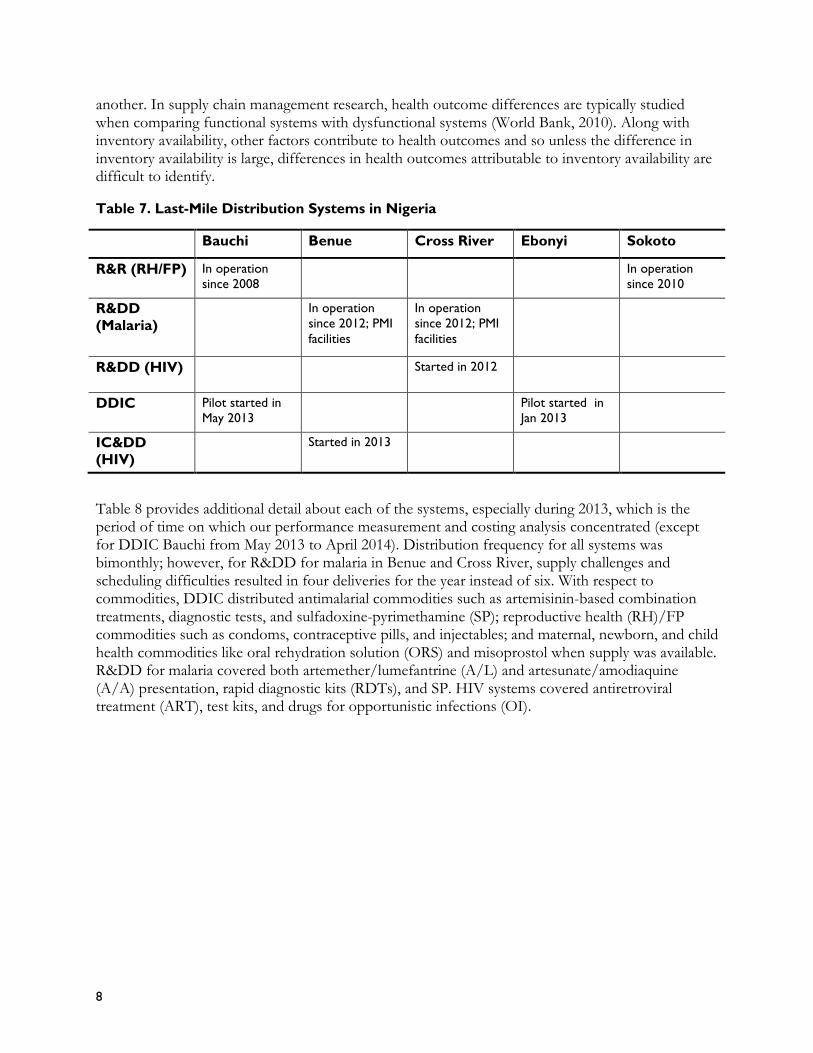
Table 7. Last-Mile Distribution Systems in Nigeria
Bauchi Benue Cross River Ebonyi Sokoto
R&R (RH/FP) In operation
since 2008
In operation
since 2010
R&DD
(Malaria)
In operation
since 2012; PMI
facilities
In operation
since 2012; PMI
facilities
R&DD (HIV) Started in 2012
DDIC Pilot started in
May 2013
Pilot started in
Jan 2013
IC&DD
(HIV)
Started in 2013
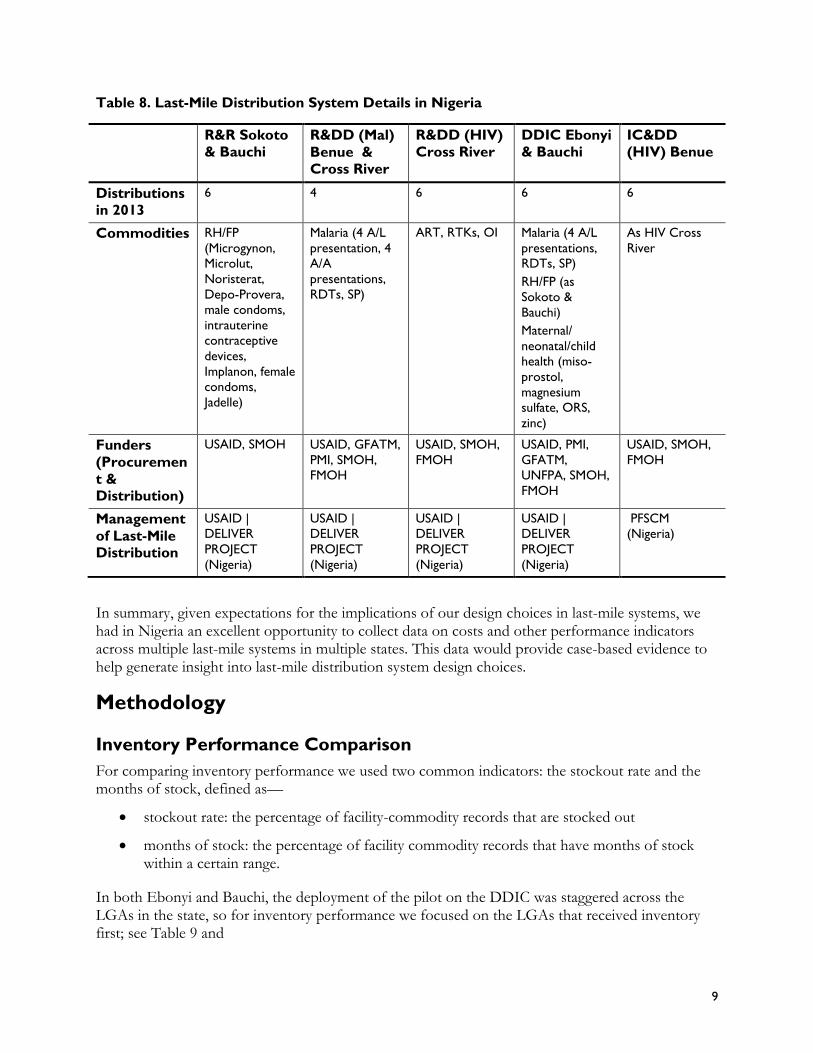
Table 8 provides additional detail about each of the systems, especially during 2013, which is the period of time on which our performance measurement and costing analysis concentrated (except for DDIC Bauchi from May 2013 to April 2014). Distribution frequency for all systems was bimonthly; however, for R&DD for malaria in Benue and Cross River, supply challenges and scheduling difficulties resulted in four deliveries for the year instead of six. With respect to commodities, DDIC distributed antimalarial commodities such as artemisinin-based combination treatments, diagnostic tests, and sulfadoxine-pyrimethamine (SP); reproductive health (RH)/FP commodities such as condoms, contraceptive pills, and injectables; and maternal, newborn, and child health commodities like oral rehydration solution (ORS) and misoprostol when supply was available. R&DD for malaria covered both artemether/lumefantrine (A/L) and artesunate/amodiaquine (A/A) presentation, rapid diagnostic kits (RDTs), and SP. HIV systems covered antiretroviral treatment (ART), test kits, and drugs for opportunistic infections (OI).
9
Table 8. Last-Mile Distribution System Details in Nigeria
R&R Sokoto
& Bauchi
R&DD (Mal)
Benue &
Cross River
R&DD (HIV)
Cross River
DDIC Ebonyi
& Bauchi
IC&DD
(HIV) Benue
Distributions
in 2013
6 4 6 6 6
Commodities RH/FP
(Microgynon,
Microlut,
Noristerat,
Depo-Provera,
male condoms,
intrauterine
contraceptive
devices,
Implanon, female
condoms,
Jadelle)
Malaria (4 A/L
presentation, 4
A/A
presentations,
RDTs, SP)
ART, RTKs, OI Malaria (4 A/L
presentations,
RDTs, SP)
RH/FP (as
Sokoto &
Bauchi)
Maternal/
neonatal/child
health (miso-
prostol,
magnesium
sulfate, ORS,
zinc)
As HIV Cross
River
Funders
(Procuremen
t & Distribution)
USAID, SMOH USAID, GFATM,
PMI, SMOH,
FMOH
USAID, SMOH,
FMOH
USAID, PMI,
GFATM,
UNFPA, SMOH,
FMOH
USAID, SMOH,
FMOH
Management
of Last-Mile Distribution
USAID |
DELIVER
PROJECT
(Nigeria)
USAID |
DELIVER
PROJECT
(Nigeria)
USAID |
DELIVER
PROJECT
(Nigeria)
USAID |
DELIVER
PROJECT
(Nigeria)
PFSCM
(Nigeria)
In summary, given expectations for the implications of our design choices in last-mile systems, we had in Nigeria an excellent opportunity to collect data on costs and other performance indicators across multiple last-mile systems in multiple states. This data would provide case-based evidence to help generate insight into last-mile distribution system design choices.
Methodology
Inventory Performance Comparison
For comparing inventory performance we used two common indicators: the stockout rate and the months of stock, defined as—
stockout rate: the percentage of facility-commodity records that are stocked out
months of stock: the percentage of facility commodity records that have months of stock within a certain range.
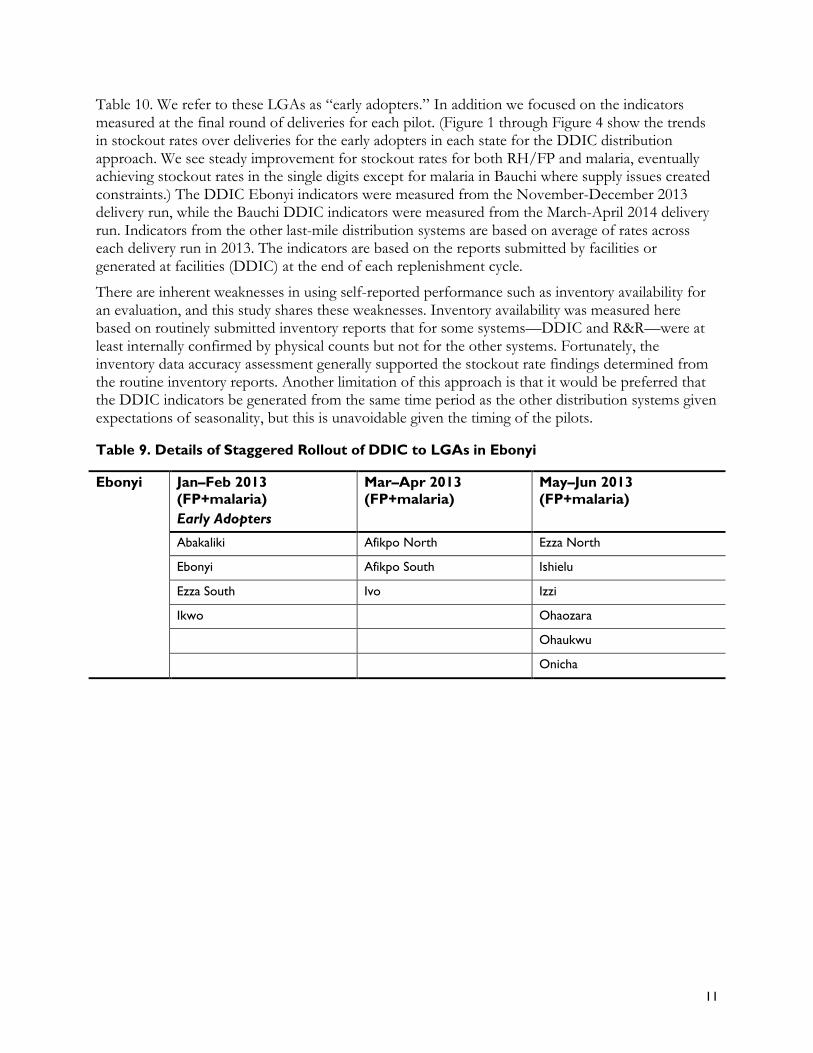
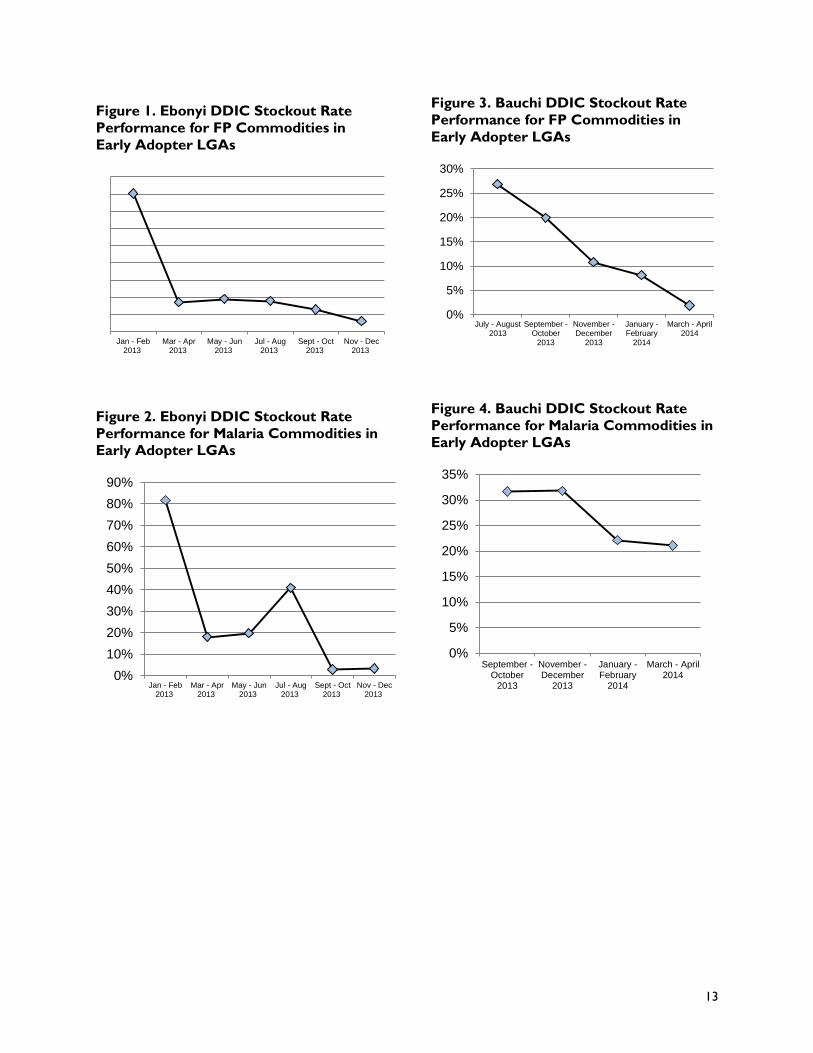
In both Ebonyi and Bauchi, the deployment of the pilot on the DDIC was staggered across the LGAs in the state, so for inventory performance we focused on the LGAs that received inventory first; see Table 9 and

10
11
Table 10. We refer to these LGAs as “early adopters.” In addition we focused on the indicators measured at the final round of deliveries for each pilot. (Figure 1 through Figure 4 show the trends in stockout rates over deliveries for the early adopters in each state for the DDIC distribution approach. We see steady improvement for stockout rates for both RH/FP and malaria, eventually achieving stockout rates in the single digits except for malaria in Bauchi where supply issues created constraints.) The DDIC Ebonyi indicators were measured from the November-December 2013 delivery run, while the Bauchi DDIC indicators were measured from the March-April 2014 delivery run. Indicators from the other last-mile distribution systems are based on average of rates across each delivery run in 2013. The indicators are based on the reports submitted by facilities or generated at facilities (DDIC) at the end of each replenishment cycle.
There are inherent weaknesses in using self-reported performance such as inventory availability for an evaluation, and this study shares these weaknesses. Inventory availability was measured here based on routinely submitted inventory reports that for some systems—DDIC and R&R—were at least internally confirmed by physical counts but not for the other systems. Fortunately, the inventory data accuracy assessment generally supported the stockout rate findings determined from the routine inventory reports. Another limitation of this approach is that it would be preferred that the DDIC indicators be generated from the same time period as the other distribution systems given expectations of seasonality, but this is unavoidable given the timing of the pilots.
Table 9. Details of Staggered Rollout of DDIC to LGAs in Ebonyi
Ebonyi Jan–Feb 2013
(FP+malaria)
Early Adopters
Mar–Apr 2013
(FP+malaria)
May–Jun 2013
(FP+malaria)
Abakaliki Afikpo North Ezza North
Ebonyi Afikpo South Ishielu
Ezza South Ivo Izzi
Ikwo Ohaozara
Ohaukwu
Onicha
12
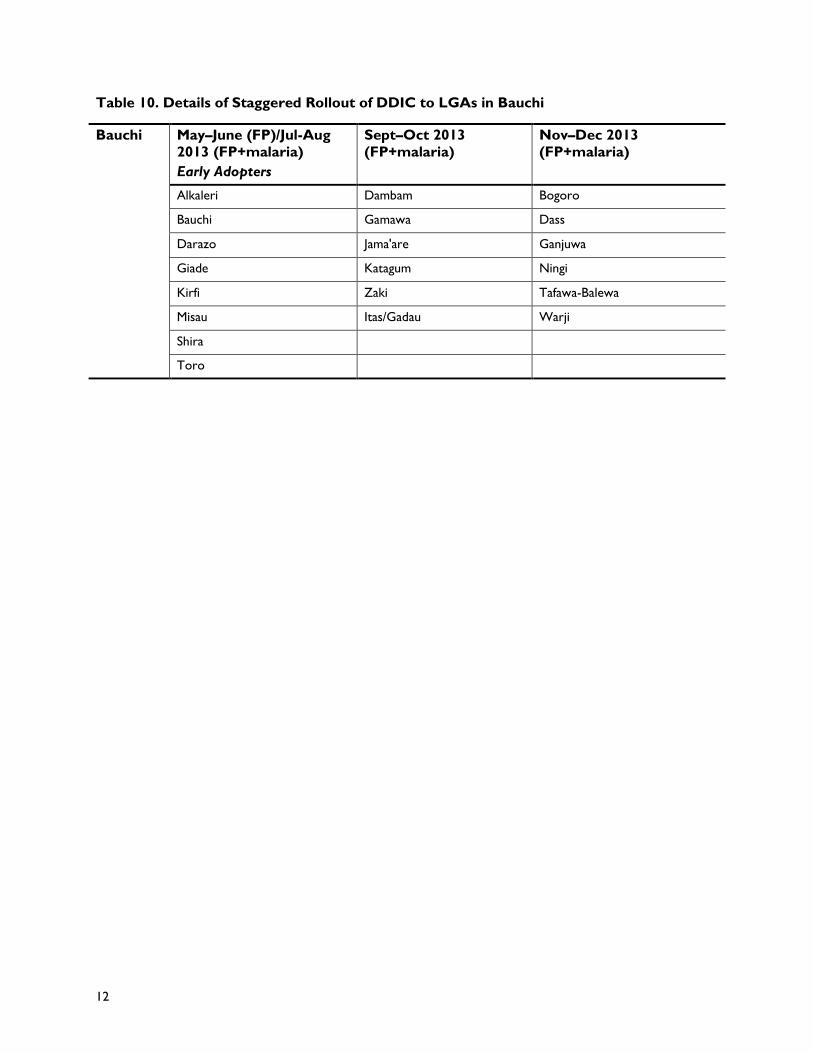
Table 10. Details of Staggered Rollout of DDIC to LGAs in Bauchi
Bauchi May–June (FP)/Jul-Aug
2013 (FP+malaria)
Early Adopters
Sept–Oct 2013
(FP+malaria)
Nov–Dec 2013
(FP+malaria)
Alkaleri Dambam Bogoro
Bauchi Gamawa Dass
Darazo Jama'are Ganjuwa
Giade Katagum Ningi
Kirfi Zaki Tafawa-Balewa
Misau Itas/Gadau Warji
Shira
Toro
13
Figure 1. Ebonyi DDIC Stockout Rate
Performance for FP Commodities in
Early Adopter LGAs
Figure 2. Ebonyi DDIC Stockout Rate
Performance for Malaria Commodities in
Early Adopter LGAs
Figure 3. Bauchi DDIC Stockout Rate
Performance for FP Commodities in
Early Adopter LGAs
Figure 4. Bauchi DDIC Stockout Rate
Performance for Malaria Commodities in
Early Adopter LGAs
Jan - Feb2013
Mar - Apr2013
May - Jun2013
Jul - Aug2013
Sept - Oct2013
Nov - Dec2013
0%
10%
20%
30%
40%
50%
60%
70%
80%
90%
Jan - Feb2013
Mar - Apr2013
May - Jun2013
Jul - Aug2013
Sept - Oct2013
Nov - Dec2013
0%
5%
10%
15%
20%
25%
30%
July - August2013
September -October
2013
November -December
2013
January -February
2014
March - April2014
0%
5%
10%
15%
20%
25%
30%
35%
September -October
2013
November -December
2013
January -February
2014
March - April2014
14
Costing Operations
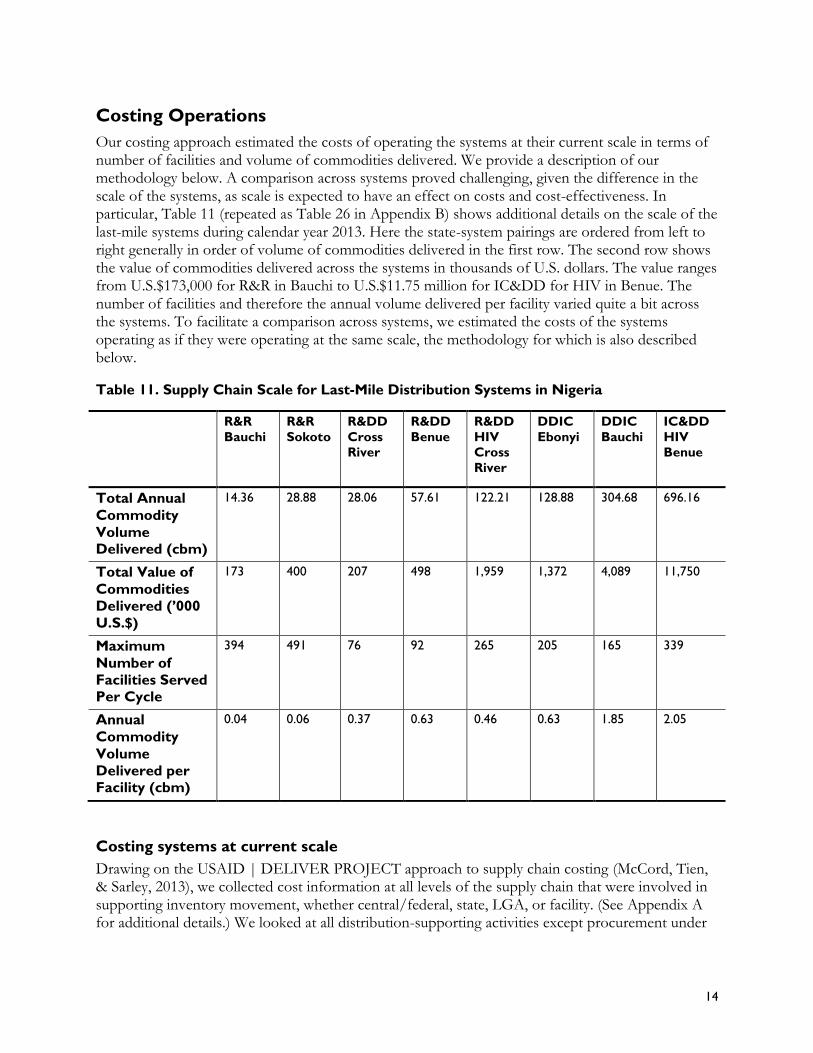
Our costing approach estimated the costs of operating the systems at their current scale in terms of number of facilities and volume of commodities delivered. We provide a description of our methodology below. A comparison across systems proved challenging, given the difference in the scale of the systems, as scale is expected to have an effect on costs and cost-effectiveness. In particular, Table 11 (repeated as Table 26 in Appendix B) shows additional details on the scale of the last-mile systems during calendar year 2013. Here the state-system pairings are ordered from left to right generally in order of volume of commodities delivered in the first row. The second row shows the value of commodities delivered across the systems in thousands of U.S. dollars. The value ranges from U.S.$173,000 for R&R in Bauchi to U.S.$11.75 million for IC&DD for HIV in Benue. The number of facilities and therefore the annual volume delivered per facility varied quite a bit across the systems. To facilitate a comparison across systems, we estimated the costs of the systems operating as if they were operating at the same scale, the methodology for which is also described below.
Table 11. Supply Chain Scale for Last-Mile Distribution Systems in Nigeria
R&R
Bauchi
R&R
Sokoto
R&DD
Cross
River
R&DD
Benue
R&DD
HIV
Cross
River
DDIC
Ebonyi
DDIC
Bauchi
IC&DD
HIV
Benue
Total Annual
Commodity
Volume Delivered (cbm)
14.36 28.88 28.06 57.61 122.21 128.88 304.68 696.16
Total Value of
Commodities
Delivered (’000
U.S.$)
173 400 207 498 1,959 1,372 4,089 11,750
Maximum
Number of
Facilities Served Per Cycle
394 491 76 92 265 205 165 339
Annual
Commodity
Volume
Delivered per Facility (cbm)
0.04 0.06 0.37 0.63 0.46 0.63 1.85 2.05
Costing systems at current scale
Drawing on the USAID | DELIVER PROJECT approach to supply chain costing (McCord, Tien, & Sarley, 2013), we collected cost information at all levels of the supply chain that were involved in supporting inventory movement, whether central/federal, state, LGA, or facility. (See Appendix A for additional details.) We looked at all distribution-supporting activities except procurement under
15
the assumption that they would not be influenced much by the system it was serving, although we did keep track of the value of commodities delivered.
In reporting the costs, we use the perspective of who bears the cost whether it is 1) direct to project/implementing partner (USAID | DELIVER PROJECT, the Partnership for Supply Chain Management (PFSCM), or their subcontractors), or 2) a Government of Nigeria (GoN) resource. Such a perspective is typical in costing exercises, but in our setting this distinction is important because the two types of funders have significant differences in terms of accessible resources, the cost of obtaining these resources, and their effectiveness. In addition, the share of costs is a dynamic one as donor and government policies and resources change. Identifying the source of funds facilitates the estimation of the impact on cost if the share of resources were to change. (For example, in Appendix C, we estimate the costs for each of the systems if all management was done by GoN resources instead of utilizing project resources as is done currently.)
In reporting the costs we also use a functional breakdown into four categories of 1) management, 2) information capture and commodities storage and transport, 3) facility workers, and 4) system support defined below. This functional breakdown allows for a streamlined reporting of total costs while still shedding light on the hypothesized implications of system design choices being studied.
1) Management refers to management activities at the implementing partner and state and federal Ministry of Health (SMOH, FMOH) levels. For management costs, the costs of project and GoN labor used for the last-mile distribution system were collected by surveying relevant staff and asking for estimates of their level of effort (LOE) allocated to supporting the distribution system and costing that LOE based on relevant salary information. This included HIV implementing partner and FMOH staff as well. In some cases, we reduced survey effort by extrapolating from one group to other similar groups. For example, we used surveyed SMOH LOE information from Bauchi to estimate SMOH LOE in others states and systems.
2) The second functional category is information capture and commodities storage and transport. When facility labor is involved in information capture, this functional category does not cover the cost of this labor (such costs would still be captured in facility workers’ labor costs) but would cover any additional stipend given to facility workers or others to support information capture. For some of the logistics costs (and system support costs) we depended on historical project vouchers and contractor invoices for cost estimation. This covered many activities such as last-mile delivery, some contracted storage options, interstate transport, stipends for review meetings and so forth. Other costs that could not be captured in this way included, for example, use of government storage facilities. These costs were estimated by surveys. To reduce the estimation effort, we used cost findings at one facility to estimate others facilities. For example, we used the USAID | DELIVER PROJECT costing tool survey (Tien, Baruwa, & Young, 2013) to capture warehousing costs at the Oshodi FP facility to estimate various SMOH storage costs by applying the same per cubic meter (cbm) rate captured for Oshodi. (We did not cost facility storage because some commodities posed an estimation problem given that they were not always stored in a set aside storage area.)
3) The third functional category, facility workers, covers the salary for facility workers performing activities that support inventory information capture and replenishment, such as recordkeeping, physical count and attending review meetings. What is not captured here is the opportunity cost of the facility worker performing these activities, such as when a facility worker is at a review meeting instead of providing patient care at the facility. Facility labor costs were estimated by surveys similar to those used for estimating management costs. We surveyed facility workers at review meetings and samples of workers involved in DDIC and HIV to estimate their LOE. For systems where we did
16
not interview staff, namely R&DD for malaria, we used our findings from systems where facility workers did similar activities.
4) System support is a catch-all category for all other costs such as communication, coordination of review meetings, additional supervision, and information technology expenses. In general, many of the costs that fall in this category can be thought of as system support costs.
As with our methodology for measuring inventory availability, costs here were also self-reported and share the inherent weaknesses in using self-reported performance. We explicitly relied on the expectations for strong financial reporting and controls that the U.S. Government has of its contractors like the USAID | DELIVER PROJECT and PFSCM. Without depending on such self-reporting, it would have been extremely difficult to cost as many state last-mile distribution system combinations as we do.
Comparing costs across systems
Our approach to facilitating a comparison across systems with different scale was to try to answer the question: “What would the costs have been if each system in their respective states had been delivering the same volume of commodities to the same number of facilities?” We do this via cost modeling in Excel with some analysis to see how the results would change if our assumptions on the changes in costs were assumed to have some error. We used the number of facilities (205) and the volume distributed (128 cbm) in DDIC Ebonyi as the target or benchmark number of facilities and volume for each system, and so we can describe this process as normalizing costs by the DDIC Ebonyi scale. We chose DDIC Ebonyi because it was roughly the midpoint among the other systems with respect to volume and number of facilities.
Based on surveys of field personnel about the expected changes in each cost line item, our modeling involved adjusting each cost line item to reflect the new benchmark number of facilities and volume taken from the DDIC Ebonyi. As such the estimation approach is limited by the quality of the estimates from the field personnel. This limitation was somewhat mitigated as we were also able to generate a range for costs for each state system within which we are confident the true costs would fall. This range was generated based on assumptions of potential errors in the estimates from the field personnel. (See Appendix B for additional details.)
Estimating Start-Up Costs
The cost components that were included in start-up costs included—
advocacy
data management
pre-training preparations
preparation and orientation of health facilities
selection of team leaders/conveyors
sensitization of SMOH and LGA personnel
training of team leaders/conveyors and other staff
monitoring and supportive visit to health facilities.
17
Here team leaders/conveyors are the principal staff that travel with the truck and are responsible for commodities as they are being delivered in the R&DD and DDIC systems. In the DDIC system, they are also responsible for doing the physical counts at the health facility.
As with comparing operating costs across the last-mile distributing systems, our approach to estimating start-up costs compensated for the differences in scale observed. We assumed each distribution system was being implemented in the same state and that the state had 200 facilities and each facility had two members of staff requiring training. For DDIC and R&DD malaria, we assumed we needed 11 team leaders or conveyors for delivery while all other factors about the operating scale were the same across the systems. Field personnel familiar with start-up costs and activities for each of the last-mile distribution systems were surveyed for estimates of start-up costs, and the quality of the estimates depends on their expertise.
Scalability Modeling
How will the different systems perform if we push them to move more commodities and support more facilities? Such considerations are justified given such recent trends as product integration across vertical programs in healthcare and the facts that the highest number of commodities delivered by any of the last-mile systems was 22 and that the number of facilities serviced varied from 76 to 491 (see Table 11). Specifically, we tried to answer the following questions:
1. Will the relative ranking of system costs hold as the number of commodities or facilities supported increases?
2. How will average costs change as the number of commodities or facilities increases?
The second question can identify whether these systems have a point at which the average costs begin to increase and thus diseconomies of scale set in. This would also imply that these systems could have a limit to the number of commodities or facilities that they could support. This will be particularly revealing for DDIC, given that it is speculated that this system would be unable to handle a large number of commodities (Sarley, Baruwa, & Tien, 2010) and that, as of this publication, the DDIC Ebonyi and Bauchi systems fielded the most commodities that had ever been supported by DDIC.
We answered these questions through additional mathematical modeling. This modeling approach differs from what was used to compare costs across the different last-mile systems. There we surveyed field personnel for the expected change in costs assuming a hypothetical shift to the DDIC Ebonyi scale. Our requirements for scalability modeling, however, required estimating costs over a range of commodities and a range of number of facilities as opposed to estimating one set of costs at the volume and number of facilities of DDIC Ebonyi. Our approach made use of the detailed understanding of how each last-mile distribution system operates that our costing exercise facilitated. We directly use this information to make a prediction of what will happen to costs of each system as we add more and more commodities or add more and more facilities.
As the foundation for our modeling, we assumed the initial network to which we would distribute was the DDIC Ebonyi network of 205 facilities, with average distances between facilities and from the state medical store calculated from a separate truck routing analysis performed on the network. We modeled the key activities for each last-mile distribution system calculating costs for information capture, inventory transportation from the state medical store to health facilities, and facility labor for inventory management–related activities. For information capture, we tracked stipends and non-facility labor for the relevant systems. To track transportation costs, we directly modeled transport
18
resources as if they were public health sector owned and tracked all the costs related to transportation such as fuel, depreciation, insurance, driver’s salary, etc. Since the systems in Nigeria make use of third-party logistics service providers (3PLs), we added a markup on top of these modeled transport costs to simulate 3PL quotes. For facility labor costs, we used the findings from our costing exercise to drive the assumptions of the level of such costs for each of the different last- mile distribution systems. Management cost and distribution costs in the upper tiers of the supply chain were not modeled to allow for focus; we essentially assumed that the management and upper tiers of supply chain were the same for each last-mile system. Such costs are already generally considered to have economies of scale, and there was evidence from the costing exercise that management costs across last-mile systems are similar Finally, we use an Excel program created at MIT Zaragoza for modeling supply chain costs (MIT Zaragoza, Transaid, and VillageReach, 2011). For additional details about our approach to modeling and examining scalability, see Appendix D.
Such a modeling approach is constrained by the understanding and insight into each of the last-mile distribution systems generated from field studies, the appropriateness of the key activities that are specifically captured in the model, and the quality of the assumptions made for various cost parameters. For the latter in particular, the cost modeling approach was based on average system parameters (e.g., average distances between facilities and between facilities and state warehouse) and ignored the impact of variability.
Assessing Data Quality
Data quality was assessed from multiple perspectives. The first was the accuracy of the inventory records captured in requisition and reporting forms, that is, the degree to which reported inventory levels matched with actual inventory. The inventory data accuracy metric used here was the percentage of facility-commodity combinations with deviations within a specific threshold percentage of the benchmark.
To generate the data for the inventory data accuracy metric, an audit of the data reported on these forms was performed through a physical count of inventory quantities at a sample of facilities in distribution systems; see Appendix E for further details about our approach. For DDIC, the audit was performed within hours after the DDIC visit. For R&R and R&DD malaria, the audit was performed a day after the review meetings. For HIV (both R&DD and IC&DD), the audit was performed within a week of report submission. One limitation of this approach is the delay between the creation of the inventory record and the audit for R&R, R&DD, and IC&DD. In each case the delay was unavoidable but to reduce the impact of the delay, data were also collected at the facility on any changes in inventory levels during the delay.
Additional perspectives on data quality included—
1. reporting rates: the percentage of facilities that submit reports in a reporting cycle
2. time to database, which is the number of working days from the beginning of the reporting and requisition schedule to the point where 98 percent of facility reporting forms had been entered into a central digital database.
As a complement to inventory data accuracy, reporting rates similarly support visibility into SDPs as it does not matter if inventory record accuracy is 100 percent if only a few facilities are reporting regularly. For DDIC, since facilities did not submit reporting forms, the reporting rate is the percentage of facilities in which a facility worker is present at the facility at the time of the visit. The
19
time to database reflects the delay before SDP data becomes visible. In general, the smaller this delay, the more timely and effective the response to what the data reveal about the SDPs.
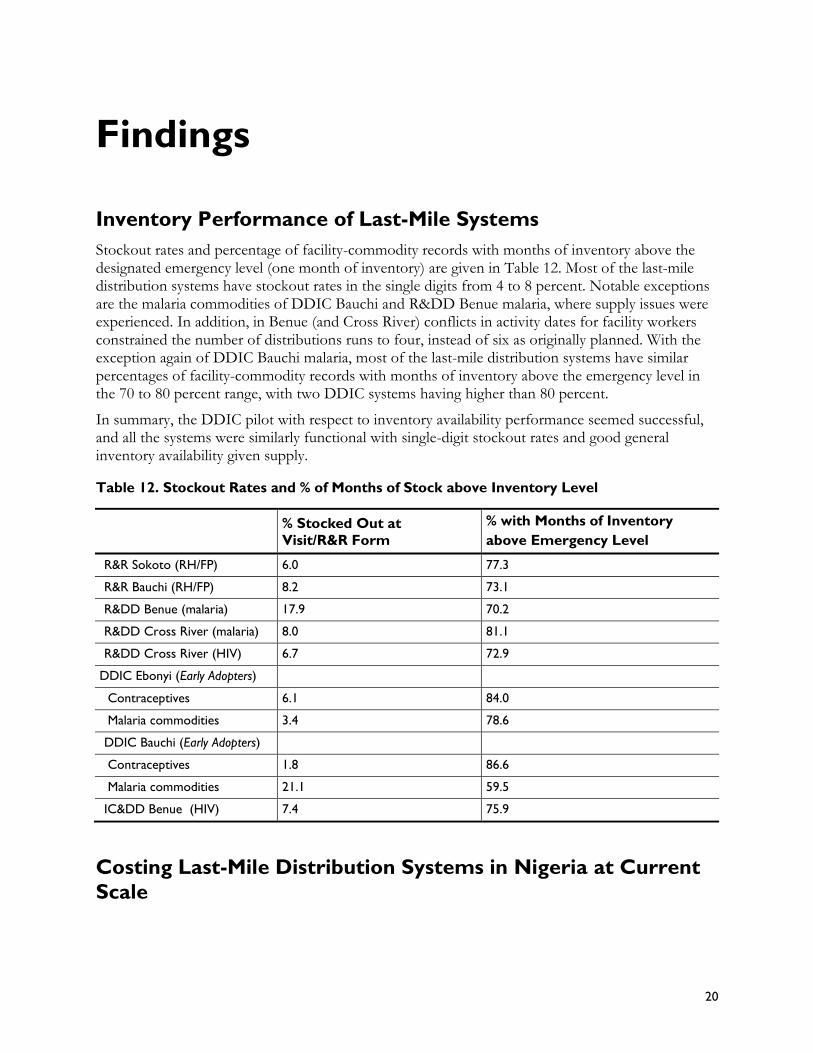
20
Findings
Inventory Performance of Last-Mile Systems
Stockout rates and percentage of facility-commodity records with months of inventory above the designated emergency level (one month of inventory) are given in Table 12. Most of the last-mile distribution systems have stockout rates in the single digits from 4 to 8 percent. Notable exceptions are the malaria commodities of DDIC Bauchi and R&DD Benue malaria, where supply issues were experienced. In addition, in Benue (and Cross River) conflicts in activity dates for facility workers constrained the number of distributions runs to four, instead of six as originally planned. With the exception again of DDIC Bauchi malaria, most of the last-mile distribution systems have similar percentages of facility-commodity records with months of inventory above the emergency level in the 70 to 80 percent range, with two DDIC systems having higher than 80 percent.
In summary, the DDIC pilot with respect to inventory availability performance seemed successful, and all the systems were similarly functional with single-digit stockout rates and good general inventory availability given supply.
Table 12. Stockout Rates and % of Months of Stock above Inventory Level
% Stocked Out at
Visit/R&R Form
% with Months of Inventory
above Emergency Level
R&R Sokoto (RH/FP) 6.0 77.3
R&R Bauchi (RH/FP) 8.2 73.1
R&DD Benue (malaria) 17.9 70.2
R&DD Cross River (malaria) 8.0 81.1
R&DD Cross River (HIV) 6.7 72.9
DDIC Ebonyi (Early Adopters)
Contraceptives 6.1 84.0
Malaria commodities 3.4 78.6
DDIC Bauchi (Early Adopters)
Contraceptives 1.8 86.6
Malaria commodities 21.1 59.5
IC&DD Benue (HIV) 7.4 75.9
Costing Last-Mile Distribution Systems in Nigeria at Current
Scale
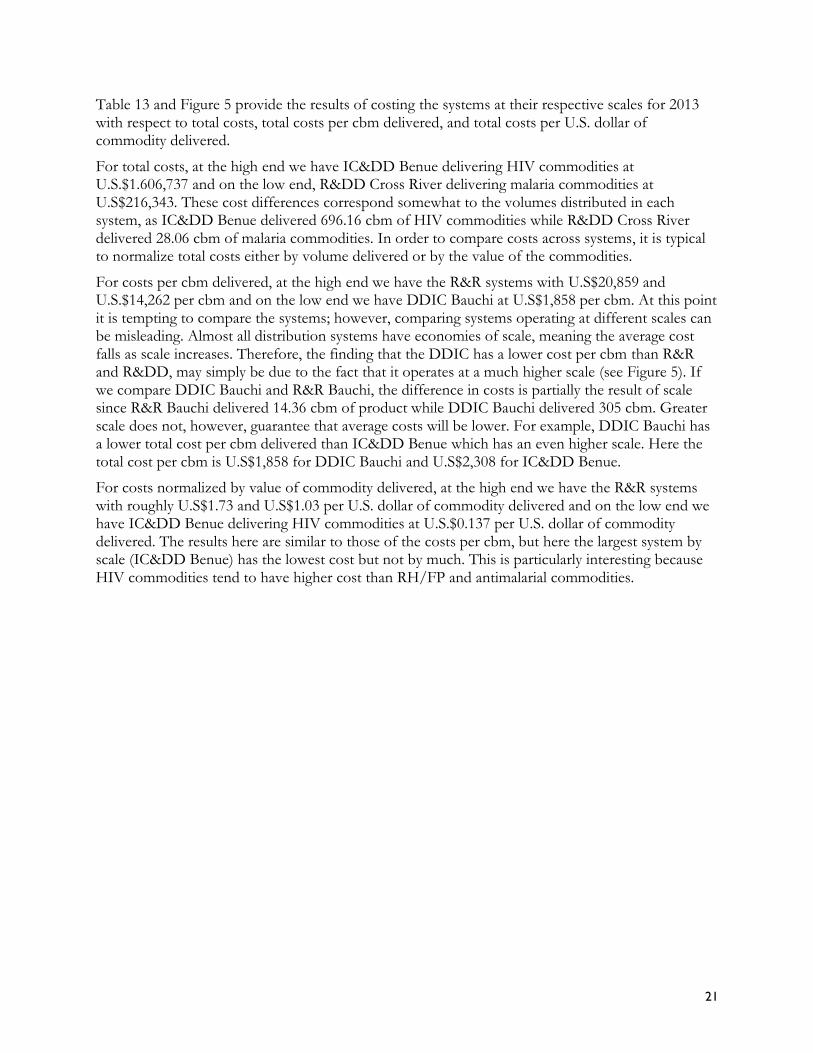
21
Table 13 and Figure 5 provide the results of costing the systems at their respective scales for 2013 with respect to total costs, total costs per cbm delivered, and total costs per U.S. dollar of commodity delivered.
For total costs, at the high end we have IC&DD Benue delivering HIV commodities at U.S.$1.606,737 and on the low end, R&DD Cross River delivering malaria commodities at U.S$216,343. These cost differences correspond somewhat to the volumes distributed in each system, as IC&DD Benue delivered 696.16 cbm of HIV commodities while R&DD Cross River delivered 28.06 cbm of malaria commodities. In order to compare costs across systems, it is typical to normalize total costs either by volume delivered or by the value of the commodities.
For costs per cbm delivered, at the high end we have the R&R systems with U.S$20,859 and U.S.$14,262 per cbm and on the low end we have DDIC Bauchi at U.S$1,858 per cbm. At this point it is tempting to compare the systems; however, comparing systems operating at different scales can be misleading. Almost all distribution systems have economies of scale, meaning the average cost falls as scale increases. Therefore, the finding that the DDIC has a lower cost per cbm than R&R and R&DD, may simply be due to the fact that it operates at a much higher scale (see Figure 5). If we compare DDIC Bauchi and R&R Bauchi, the difference in costs is partially the result of scale since R&R Bauchi delivered 14.36 cbm of product while DDIC Bauchi delivered 305 cbm. Greater scale does not, however, guarantee that average costs will be lower. For example, DDIC Bauchi has a lower total cost per cbm delivered than IC&DD Benue which has an even higher scale. Here the total cost per cbm is U.S$1,858 for DDIC Bauchi and U.S$2,308 for IC&DD Benue.
For costs normalized by value of commodity delivered, at the high end we have the R&R systems with roughly U.S$1.73 and U.S$1.03 per U.S. dollar of commodity delivered and on the low end we have IC&DD Benue delivering HIV commodities at U.S.$0.137 per U.S. dollar of commodity delivered. The results here are similar to those of the costs per cbm, but here the largest system by scale (IC&DD Benue) has the lowest cost but not by much. This is particularly interesting because HIV commodities tend to have higher cost than RH/FP and antimalarial commodities.
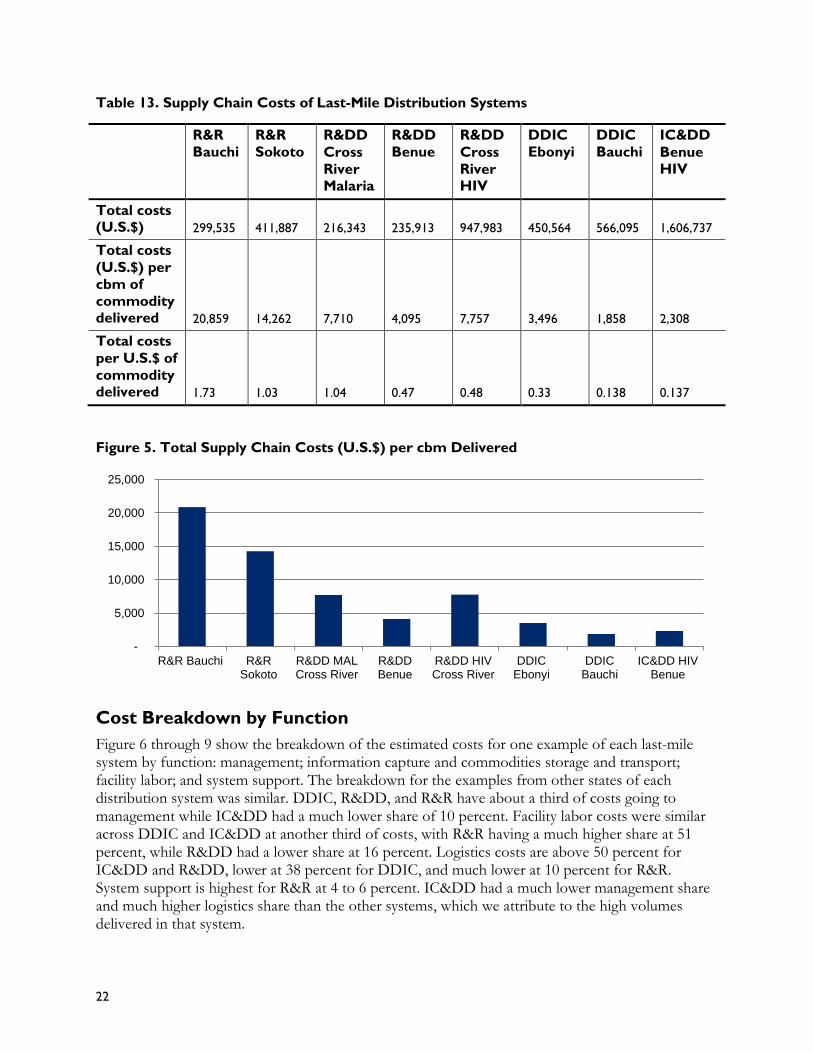
22
Table 13. Supply Chain Costs of Last-Mile Distribution Systems
R&R
Bauchi
R&R
Sokoto
R&DD
Cross
River Malaria
R&DD
Benue
R&DD
Cross
River HIV
DDIC
Ebonyi
DDIC
Bauchi
IC&DD
Benue
HIV
Total costs (U.S.$) 299,535 411,887 216,343 235,913 947,983 450,564 566,095 1,606,737
Total costs
(U.S.$) per
cbm of
commodity delivered 20,859 14,262 7,710 4,095 7,757 3,496 1,858 2,308
Total costs
per U.S.$ of
commodity delivered 1.73 1.03 1.04 0.47 0.48 0.33 0.138 0.137
Figure 5. Total Supply Chain Costs (U.S.$) per cbm Delivered
Cost Breakdown by Function
Figure 6 through 9 show the breakdown of the estimated costs for one example of each last-mile system by function: management; information capture and commodities storage and transport; facility labor; and system support. The breakdown for the examples from other states of each distribution system was similar. DDIC, R&DD, and R&R have about a third of costs going to management while IC&DD had a much lower share of 10 percent. Facility labor costs were similar across DDIC and IC&DD at another third of costs, with R&R having a much higher share at 51 percent, while R&DD had a lower share at 16 percent. Logistics costs are above 50 percent for IC&DD and R&DD, lower at 38 percent for DDIC, and much lower at 10 percent for R&R. System support is highest for R&R at 4 to 6 percent. IC&DD had a much lower management share and much higher logistics share than the other systems, which we attribute to the high volumes delivered in that system.
-
5,000
10,000
15,000
20,000
25,000
R&R Bauchi R&RSokoto
R&DD MALCross River
R&DDBenue
R&DD HIVCross River
DDICEbonyi
DDICBauchi
IC&DD HIVBenue
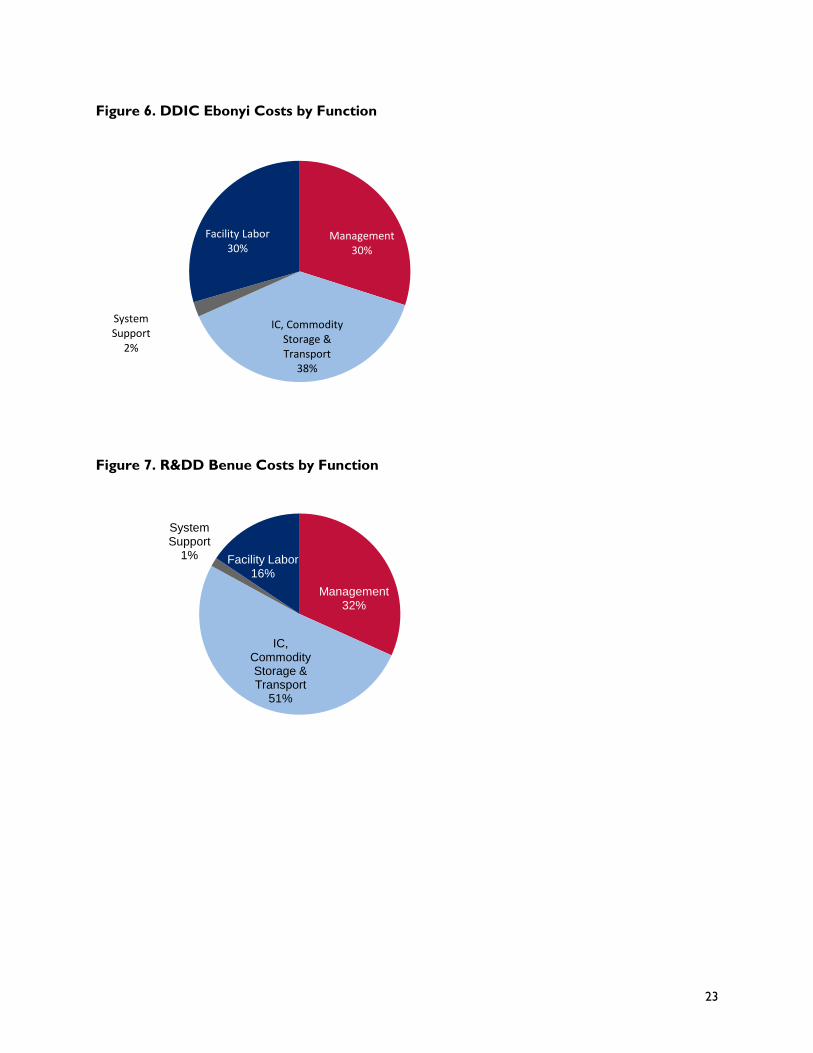
23
Figure 6. DDIC Ebonyi Costs by Function
Figure 7. R&DD Benue Costs by Function
Management 30%
IC, Commodity Storage & Transport
38%
System Support
2%
Facility Labor 30%
Management 32%
IC, Commodity Storage & Transport
51%
System Support
1% Facility Labor 16%
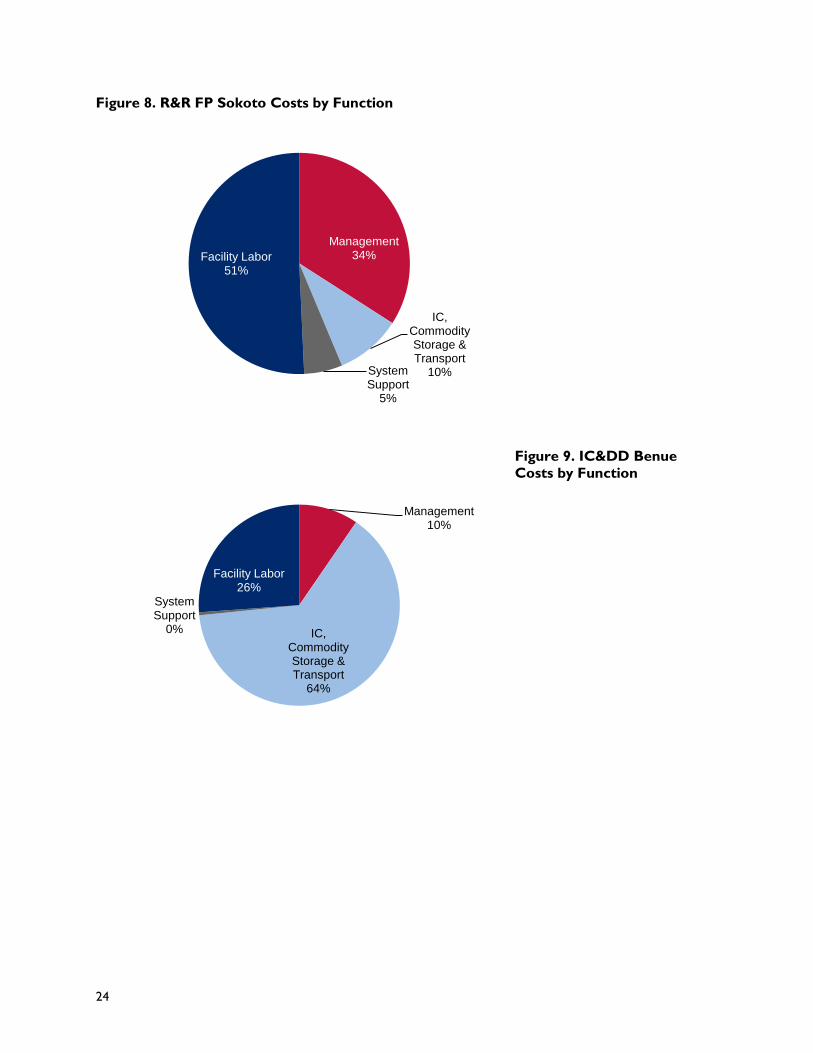
24
Figure 8. R&R FP Sokoto Costs by Function
Figure 9. IC&DD Benue
Costs by Function
Management 34%
IC, Commodity Storage & Transport
10% System Support
5%
Facility Labor 51%
Management 10%
IC, Commodity Storage & Transport
64%
System Support
0%
Facility Labor 26%
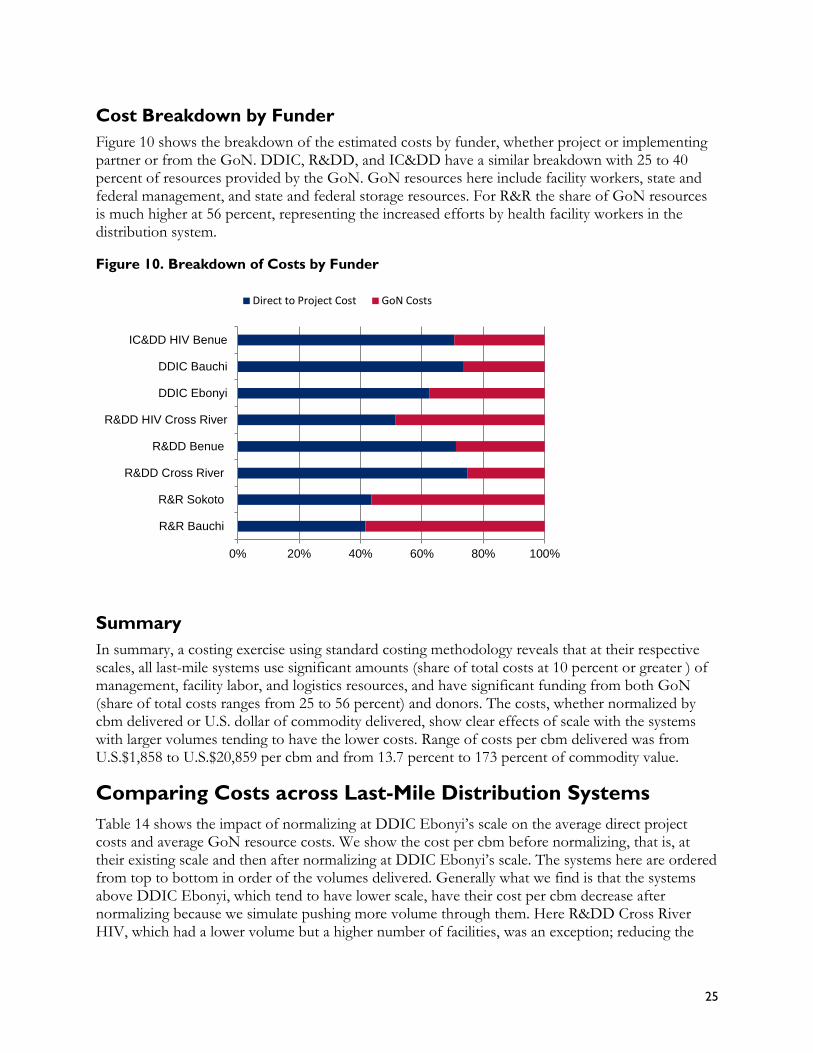
25
Cost Breakdown by Funder
Figure 10 shows the breakdown of the estimated costs by funder, whether project or implementing partner or from the GoN. DDIC, R&DD, and IC&DD have a similar breakdown with 25 to 40 percent of resources provided by the GoN. GoN resources here include facility workers, state and federal management, and state and federal storage resources. For R&R the share of GoN resources is much higher at 56 percent, representing the increased efforts by health facility workers in the distribution system.
Figure 10. Breakdown of Costs by Funder
Summary
In summary, a costing exercise using standard costing methodology reveals that at their respective scales, all last-mile systems use significant amounts (share of total costs at 10 percent or greater ) of management, facility labor, and logistics resources, and have significant funding from both GoN (share of total costs ranges from 25 to 56 percent) and donors. The costs, whether normalized by cbm delivered or U.S. dollar of commodity delivered, show clear effects of scale with the systems with larger volumes tending to have the lower costs. Range of costs per cbm delivered was from U.S.$1,858 to U.S.$20,859 per cbm and from 13.7 percent to 173 percent of commodity value.
Comparing Costs across Last-Mile Distribution Systems
Table 14 shows the impact of normalizing at DDIC Ebonyi’s scale on the average direct project costs and average GoN resource costs. We show the cost per cbm before normalizing, that is, at their existing scale and then after normalizing at DDIC Ebonyi’s scale. The systems here are ordered from top to bottom in order of the volumes delivered. Generally what we find is that the systems above DDIC Ebonyi, which tend to have lower scale, have their cost per cbm decrease after normalizing because we simulate pushing more volume through them. Here R&DD Cross River HIV, which had a lower volume but a higher number of facilities, was an exception; reducing the
0% 20% 40% 60% 80% 100%
R&R Bauchi
R&R Sokoto
R&DD Cross River
R&DD Benue
R&DD HIV Cross River
DDIC Ebonyi
DDIC Bauchi
IC&DD HIV Benue
Direct to Project Cost GoN Costs
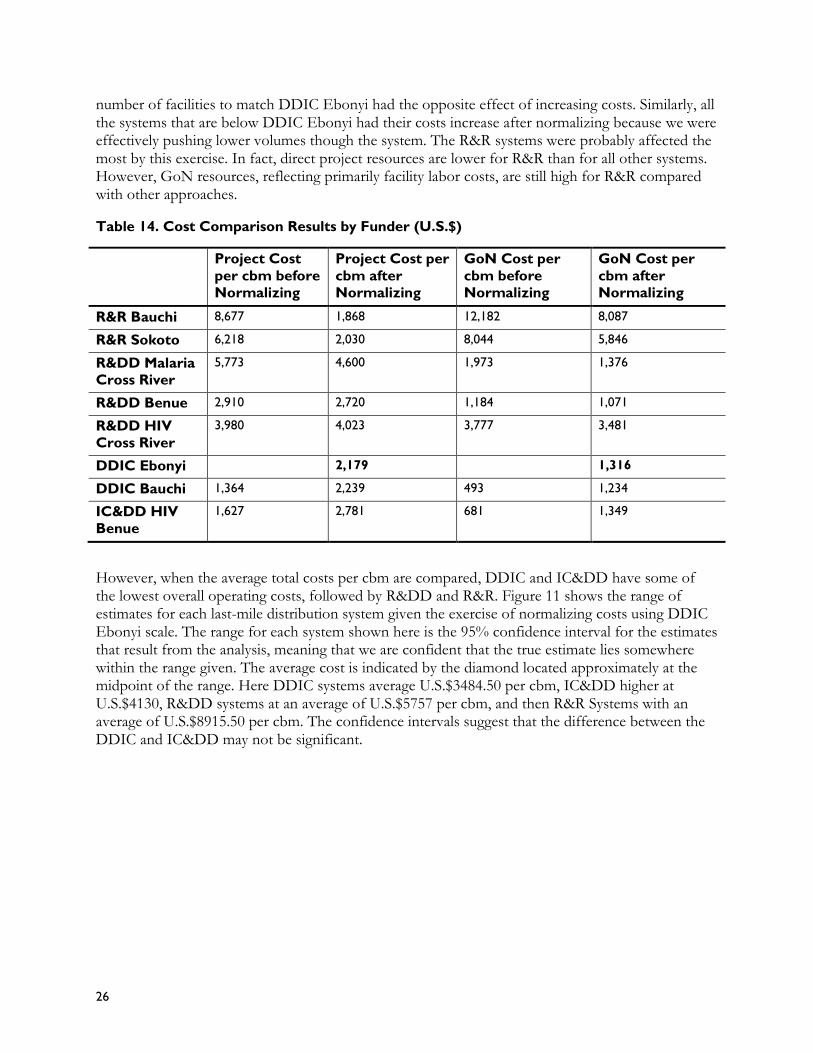
26
number of facilities to match DDIC Ebonyi had the opposite effect of increasing costs. Similarly, all the systems that are below DDIC Ebonyi had their costs increase after normalizing because we were effectively pushing lower volumes though the system. The R&R systems were probably affected the most by this exercise. In fact, direct project resources are lower for R&R than for all other systems. However, GoN resources, reflecting primarily facility labor costs, are still high for R&R compared with other approaches.
Table 14. Cost Comparison Results by Funder (U.S.$)
Project Cost
per cbm before
Normalizing
Project Cost per
cbm after
Normalizing
GoN Cost per
cbm before
Normalizing
GoN Cost per
cbm after
Normalizing
R&R Bauchi 8,677 1,868 12,182 8,087
R&R Sokoto 6,218 2,030 8,044 5,846
R&DD Malaria
Cross River
5,773 4,600 1,973 1,376
R&DD Benue 2,910 2,720 1,184 1,071
R&DD HIV
Cross River
3,980 4,023 3,777 3,481
DDIC Ebonyi 2,179 1,316
DDIC Bauchi 1,364 2,239 493 1,234
IC&DD HIV
Benue
1,627 2,781 681 1,349
However, when the average total costs per cbm are compared, DDIC and IC&DD have some of the lowest overall operating costs, followed by R&DD and R&R. Figure 11 shows the range of estimates for each last-mile distribution system given the exercise of normalizing costs using DDIC Ebonyi scale. The range for each system shown here is the 95% confidence interval for the estimates that result from the analysis, meaning that we are confident that the true estimate lies somewhere within the range given. The average cost is indicated by the diamond located approximately at the midpoint of the range. Here DDIC systems average U.S.$3484.50 per cbm, IC&DD higher at U.S.$4130, R&DD systems at an average of U.S.$5757 per cbm, and then R&R Systems with an average of U.S.$8915.50 per cbm. The confidence intervals suggest that the difference between the DDIC and IC&DD may not be significant.
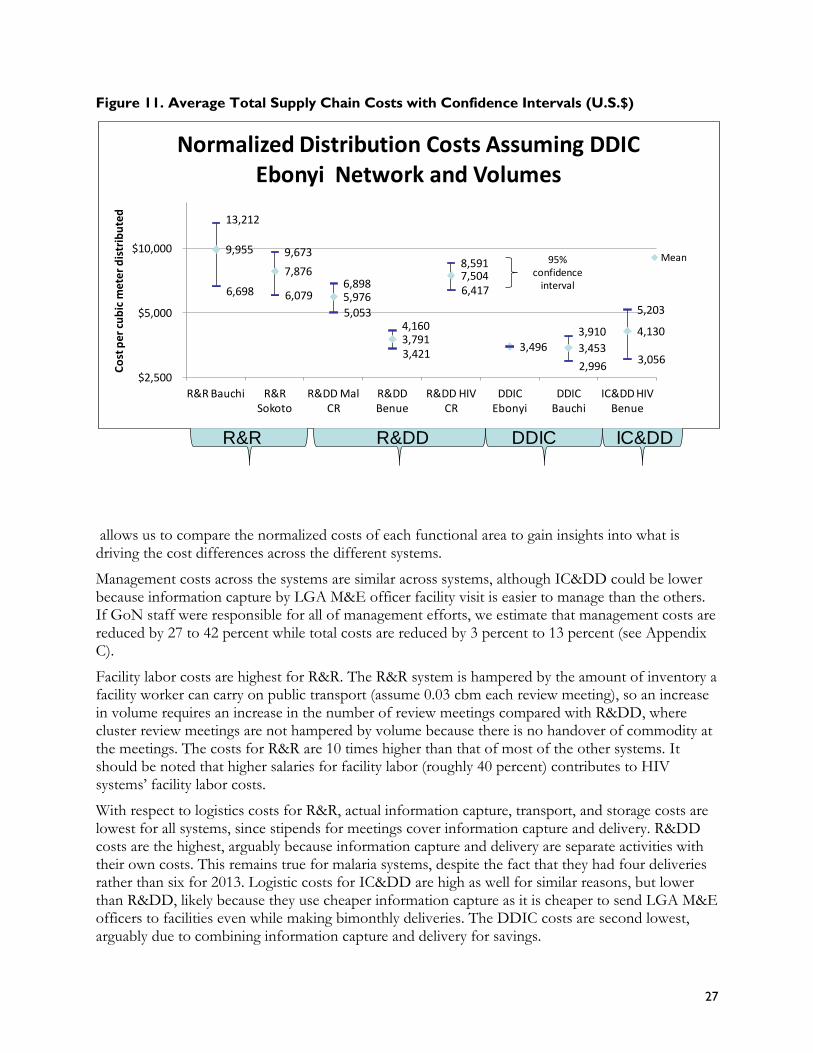
27
Figure 11. Average Total Supply Chain Costs with Confidence Intervals (U.S.$)
allows us to compare the normalized costs of each functional area to gain insights into what is driving the cost differences across the different systems.
Management costs across the systems are similar across systems, although IC&DD could be lower because information capture by LGA M&E officer facility visit is easier to manage than the others. If GoN staff were responsible for all of management efforts, we estimate that management costs are reduced by 27 to 42 percent while total costs are reduced by 3 percent to 13 percent (see Appendix C).
Facility labor costs are highest for R&R. The R&R system is hampered by the amount of inventory a facility worker can carry on public transport (assume 0.03 cbm each review meeting), so an increase in volume requires an increase in the number of review meetings compared with R&DD, where cluster review meetings are not hampered by volume because there is no handover of commodity at the meetings. The costs for R&R are 10 times higher than that of most of the other systems. It should be noted that higher salaries for facility labor (roughly 40 percent) contributes to HIV systems’ facility labor costs.
With respect to logistics costs for R&R, actual information capture, transport, and storage costs are lowest for all systems, since stipends for meetings cover information capture and delivery. R&DD costs are the highest, arguably because information capture and delivery are separate activities with their own costs. This remains true for malaria systems, despite the fact that they had four deliveries rather than six for 2013. Logistic costs for IC&DD are high as well for similar reasons, but lower than R&DD, likely because they use cheaper information capture as it is cheaper to send LGA M&E officers to facilities even while making bimonthly deliveries. The DDIC costs are second lowest, arguably due to combining information capture and delivery for savings.
R&R R&DD DDIC IC&DD
13,212
9,673
6,898
4,160
8,591
3,910
5,203
9,955
7,876
5,976
3,791
7,504
3,496 3,453
4,130
6,698 6,079
5,053
3,421
6,417
2,9963,056
$2,500
$5,000
$10,000
R&R Bauchi R&R Sokoto
R&DD Mal CR
R&DD Benue
R&DD HIV CR
DDIC Ebonyi
DDIC Bauchi
IC&DD HIV Benue
Co
st p
er c
ub
ic m
ete
r d
istr
ibu
ted
Normalized Distribution Costs Assuming DDIC Ebonyi Network and Volumes
Mean95% confidence
interval
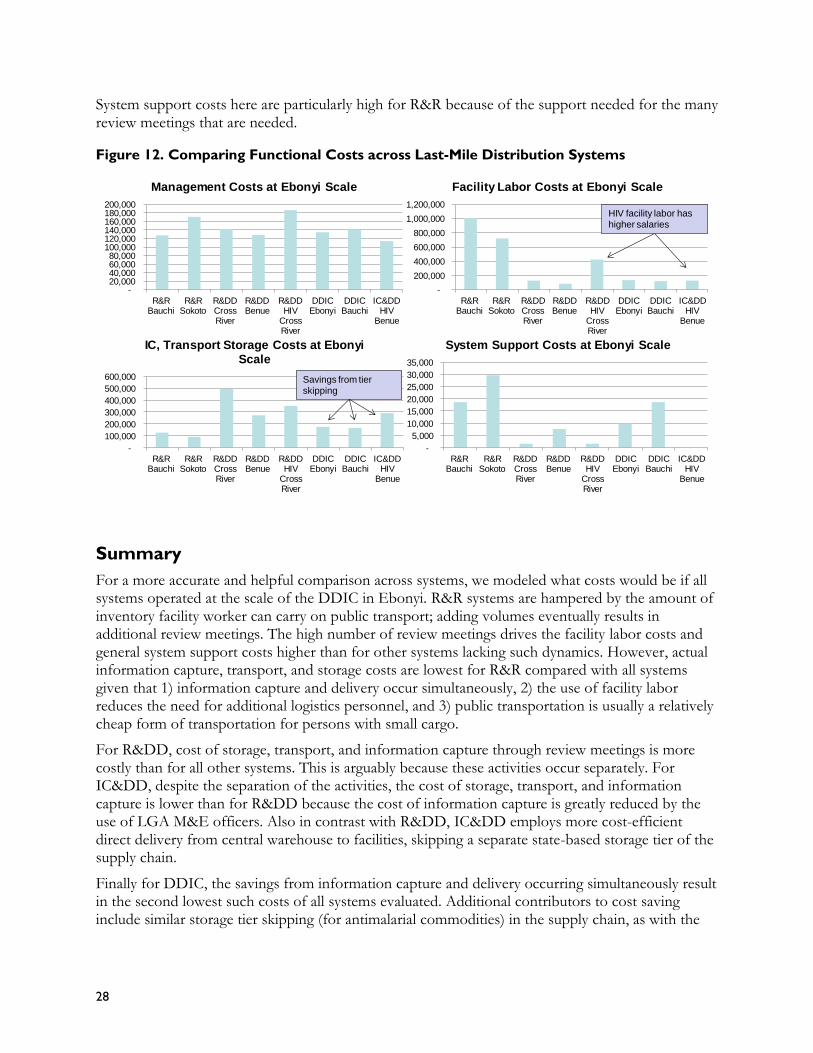
28
System support costs here are particularly high for R&R because of the support needed for the many review meetings that are needed.
Figure 12. Comparing Functional Costs across Last-Mile Distribution Systems
Summary
For a more accurate and helpful comparison across systems, we modeled what costs would be if all systems operated at the scale of the DDIC in Ebonyi. R&R systems are hampered by the amount of inventory facility worker can carry on public transport; adding volumes eventually results in additional review meetings. The high number of review meetings drives the facility labor costs and general system support costs higher than for other systems lacking such dynamics. However, actual information capture, transport, and storage costs are lowest for R&R compared with all systems given that 1) information capture and delivery occur simultaneously, 2) the use of facility labor reduces the need for additional logistics personnel, and 3) public transportation is usually a relatively cheap form of transportation for persons with small cargo.
For R&DD, cost of storage, transport, and information capture through review meetings is more costly than for all other systems. This is arguably because these activities occur separately. For IC&DD, despite the separation of the activities, the cost of storage, transport, and information capture is lower than for R&DD because the cost of information capture is greatly reduced by the use of LGA M&E officers. Also in contrast with R&DD, IC&DD employs more cost-efficient direct delivery from central warehouse to facilities, skipping a separate state-based storage tier of the supply chain.
Finally for DDIC, the savings from information capture and delivery occurring simultaneously result in the second lowest such costs of all systems evaluated. Additional contributors to cost saving include similar storage tier skipping (for antimalarial commodities) in the supply chain, as with the
-
100,000
200,000
300,000
400,000
500,000
600,000
R&R Bauchi
R&R Sokoto
R&DD Cross River
R&DD Benue
R&DD HIV
Cross River
DDIC Ebonyi
DDIC Bauchi
IC&DD HIV
Benue
IC, Transport Storage Costs at Ebonyi
Scale
-
200,000
400,000
600,000
800,000
1,000,000
1,200,000
R&R Bauchi
R&R Sokoto
R&DD Cross River
R&DD Benue
R&DD HIV
Cross River
DDIC Ebonyi
DDIC Bauchi
IC&DD HIV
Benue
Facility Labor Costs at Ebonyi Scale
HIV facility labor has higher salaries
Savings from tier skipping
-20,000 40,000 60,000 80,000
100,000 120,000 140,000 160,000 180,000 200,000
R&R Bauchi
R&R Sokoto
R&DD Cross River
R&DD Benue
R&DD HIV
Cross River
DDIC Ebonyi
DDIC Bauchi
IC&DD HIV
Benue
Management Costs at Ebonyi Scale
-
5,000
10,000
15,000
20,000
25,000
30,000
35,000
R&R Bauchi
R&R Sokoto
R&DD Cross River
R&DD Benue
R&DD HIV
Cross River
DDIC Ebonyi
DDIC Bauchi
IC&DD HIV
Benue
System Support Costs at Ebonyi Scale
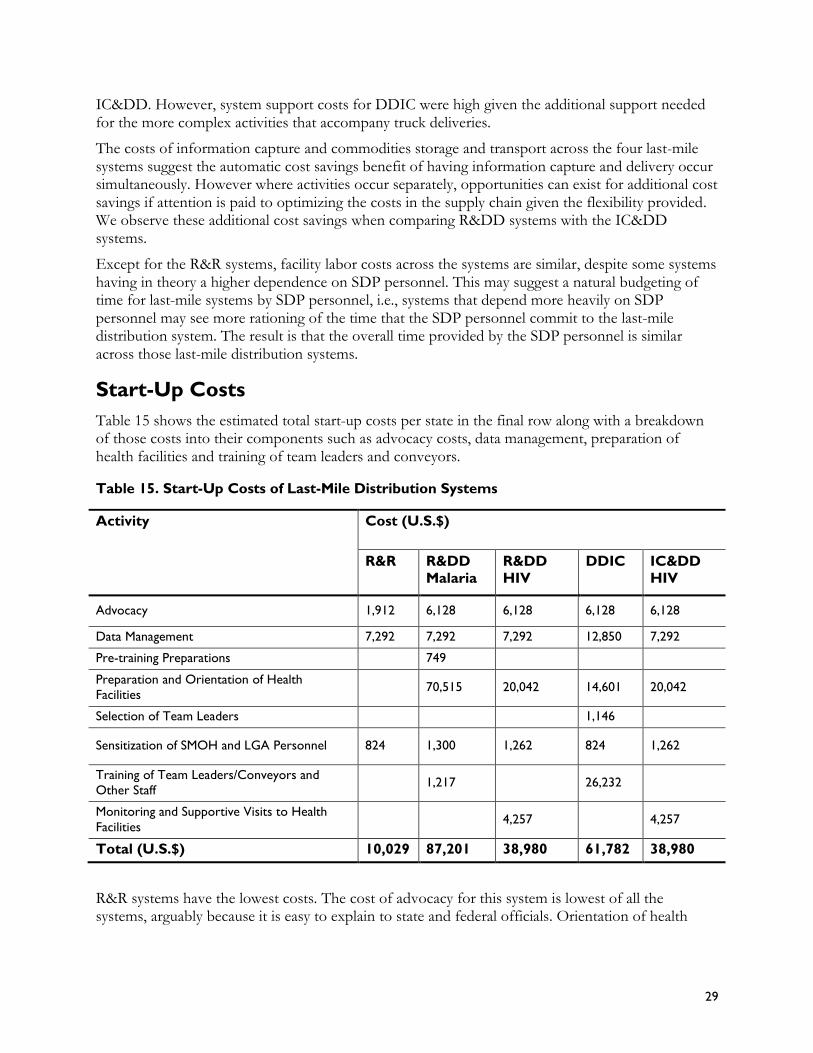
29
IC&DD. However, system support costs for DDIC were high given the additional support needed for the more complex activities that accompany truck deliveries.
The costs of information capture and commodities storage and transport across the four last-mile systems suggest the automatic cost savings benefit of having information capture and delivery occur simultaneously. However where activities occur separately, opportunities can exist for additional cost savings if attention is paid to optimizing the costs in the supply chain given the flexibility provided. We observe these additional cost savings when comparing R&DD systems with the IC&DD systems.
Except for the R&R systems, facility labor costs across the systems are similar, despite some systems having in theory a higher dependence on SDP personnel. This may suggest a natural budgeting of time for last-mile systems by SDP personnel, i.e., systems that depend more heavily on SDP personnel may see more rationing of the time that the SDP personnel commit to the last-mile distribution system. The result is that the overall time provided by the SDP personnel is similar across those last-mile distribution systems.
Start-Up Costs
Table 15 shows the estimated total start-up costs per state in the final row along with a breakdown of those costs into their components such as advocacy costs, data management, preparation of health facilities and training of team leaders and conveyors.
Table 15. Start-Up Costs of Last-Mile Distribution Systems
Activity Cost (U.S.$)
R&R R&DD
Malaria
R&DD
HIV
DDIC IC&DD
HIV
Advocacy 1,912 6,128 6,128 6,128 6,128
Data Management 7,292 7,292 7,292 12,850 7,292
Pre-training Preparations 749
Preparation and Orientation of Health
Facilities 70,515 20,042 14,601 20,042
Selection of Team Leaders
1,146
Sensitization of SMOH and LGA Personnel 824 1,300 1,262 824 1,262
Training of Team Leaders/Conveyors and
Other Staff 1,217
26,232
Monitoring and Supportive Visits to Health
Facilities
4,257
4,257
Total (U.S.$) 10,029 87,201 38,980 61,782 38,980
R&R systems have the lowest costs. The cost of advocacy for this system is lowest of all the systems, arguably because it is easy to explain to state and federal officials. Orientation of health
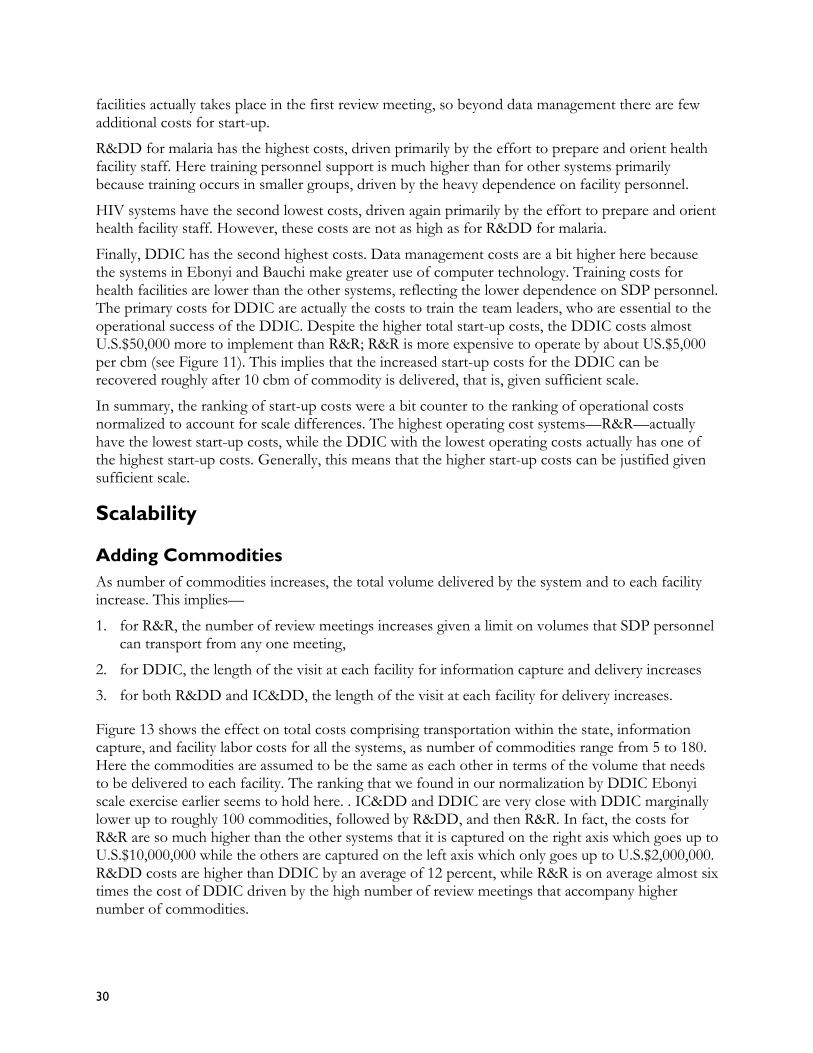
30
facilities actually takes place in the first review meeting, so beyond data management there are few additional costs for start-up.
R&DD for malaria has the highest costs, driven primarily by the effort to prepare and orient health facility staff. Here training personnel support is much higher than for other systems primarily because training occurs in smaller groups, driven by the heavy dependence on facility personnel.
HIV systems have the second lowest costs, driven again primarily by the effort to prepare and orient health facility staff. However, these costs are not as high as for R&DD for malaria.
Finally, DDIC has the second highest costs. Data management costs are a bit higher here because the systems in Ebonyi and Bauchi make greater use of computer technology. Training costs for health facilities are lower than the other systems, reflecting the lower dependence on SDP personnel. The primary costs for DDIC are actually the costs to train the team leaders, who are essential to the operational success of the DDIC. Despite the higher total start-up costs, the DDIC costs almost U.S.$50,000 more to implement than R&R; R&R is more expensive to operate by about US.$5,000 per cbm (see Figure 11). This implies that the increased start-up costs for the DDIC can be recovered roughly after 10 cbm of commodity is delivered, that is, given sufficient scale.
In summary, the ranking of start-up costs were a bit counter to the ranking of operational costs normalized to account for scale differences. The highest operating cost systems—R&R—actually have the lowest start-up costs, while the DDIC with the lowest operating costs actually has one of the highest start-up costs. Generally, this means that the higher start-up costs can be justified given sufficient scale.
Scalability
Adding Commodities
As number of commodities increases, the total volume delivered by the system and to each facility increase. This implies—
1. for R&R, the number of review meetings increases given a limit on volumes that SDP personnel can transport from any one meeting,
2. for DDIC, the length of the visit at each facility for information capture and delivery increases
3. for both R&DD and IC&DD, the length of the visit at each facility for delivery increases.
Figure 13 shows the effect on total costs comprising transportation within the state, information capture, and facility labor costs for all the systems, as number of commodities range from 5 to 180. Here the commodities are assumed to be the same as each other in terms of the volume that needs to be delivered to each facility. The ranking that we found in our normalization by DDIC Ebonyi scale exercise earlier seems to hold here. . IC&DD and DDIC are very close with DDIC marginally lower up to roughly 100 commodities, followed by R&DD, and then R&R. In fact, the costs for R&R are so much higher than the other systems that it is captured on the right axis which goes up to U.S.$10,000,000 while the others are captured on the left axis which only goes up to U.S.$2,000,000. R&DD costs are higher than DDIC by an average of 12 percent, while R&R is on average almost six times the cost of DDIC driven by the high number of review meetings that accompany higher number of commodities.
31
Figure 13. Total Cost Comparison of Last-Mile Distribution Systems with Increase in
Commodities
Economies of scale
From the total cost curves shown in Figure 13, we can derive the average cost curves, that is, the cost per cbm for each system in Figure 14. Figure 14 shows that for all systems the average cost falls as one adds more commodities; however, the average costs for R&R are so much higher than the other systems that again it is captured on the right axis which goes up to U.S.$14,000 per cbm while the others are captured on the left axis which only goes up to U.S.$6,000 per cbm. Why do the average costs fall? Consider how costs are affected as one adds more commodities to each system:
For R&R, in our modeling approach a separate round of review meetings and the attendant costs of the review meetings (stipends, inventory delivery costs to meetings, administrative and SDP staff LOE) were needed after every five commodities due to the assumed limit of what SDP personnel could physically transport using public transportation. Therefore, the number of review meetings grew uniformly with the number of commodities, and so the average costs of information capture
USD 1
USD 10
USD 100
USD 1,000
USD 10,000
USD 100,000
USD 1,000,000
USD 10,000,000
USD 100,000
USD 1,000,000
0 20 40 60 80 100 120 140 160 180 200
R&
R
DD
IC,
R&
DD
, a
nd
IC
&D
D
Number of Commodities
Total Cost Comparison (Transportation, Information Capture & Facility Labor): DDIC vs R&R vs R&DD vs IC&DD
DDIC R&DD IC&DD R&R
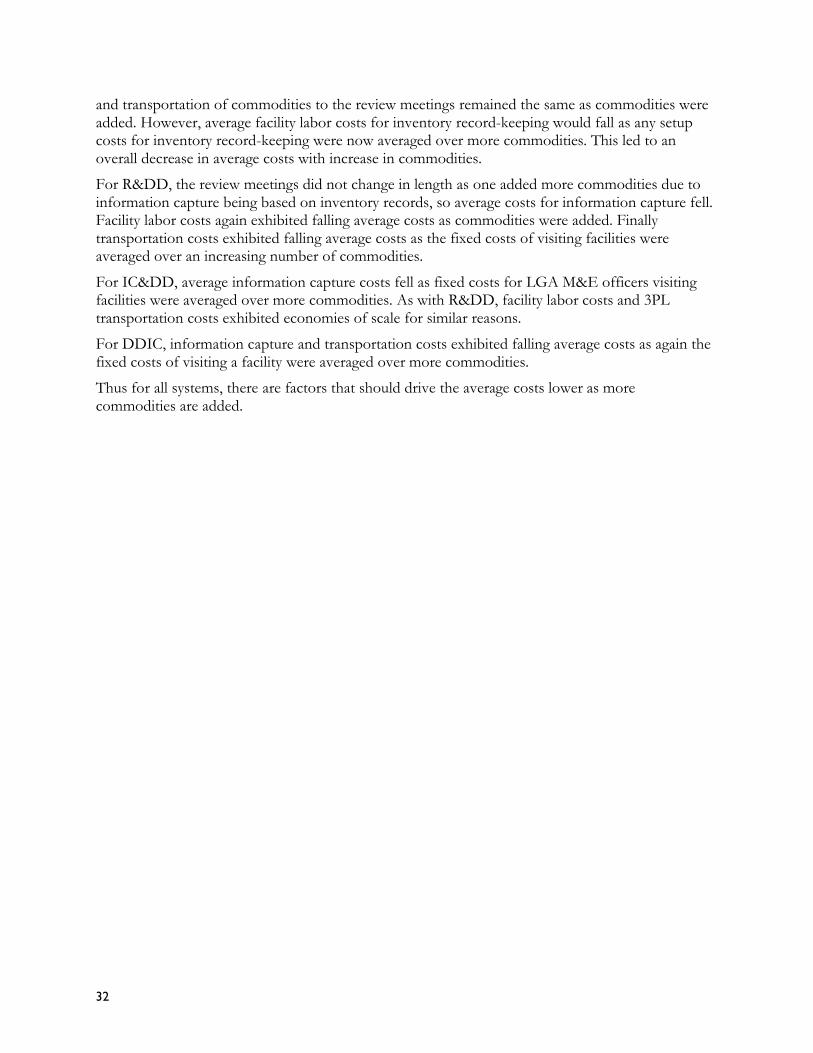
32
and transportation of commodities to the review meetings remained the same as commodities were added. However, average facility labor costs for inventory record-keeping would fall as any setup costs for inventory record-keeping were now averaged over more commodities. This led to an overall decrease in average costs with increase in commodities.
For R&DD, the review meetings did not change in length as one added more commodities due to information capture being based on inventory records, so average costs for information capture fell. Facility labor costs again exhibited falling average costs as commodities were added. Finally transportation costs exhibited falling average costs as the fixed costs of visiting facilities were averaged over an increasing number of commodities.
For IC&DD, average information capture costs fell as fixed costs for LGA M&E officers visiting facilities were averaged over more commodities. As with R&DD, facility labor costs and 3PL transportation costs exhibited economies of scale for similar reasons.
For DDIC, information capture and transportation costs exhibited falling average costs as again the fixed costs of visiting a facility were averaged over more commodities.
Thus for all systems, there are factors that should drive the average costs lower as more commodities are added.
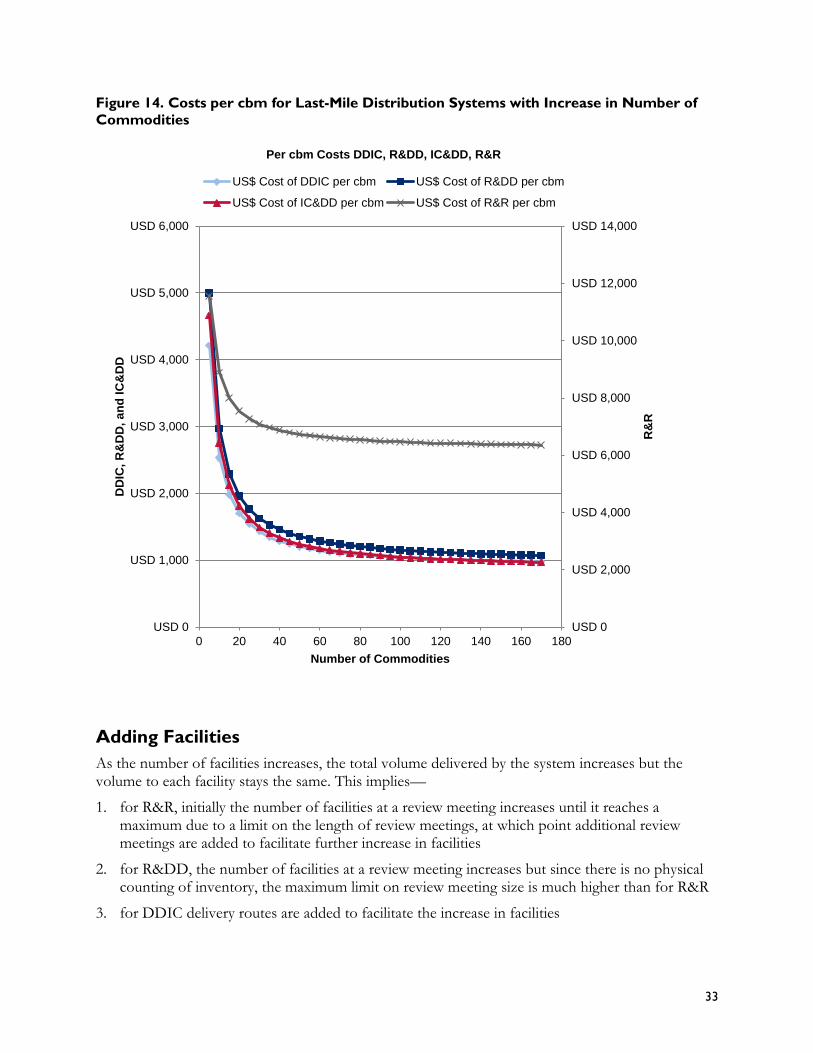
33
Figure 14. Costs per cbm for Last-Mile Distribution Systems with Increase in Number of
Commodities
Adding Facilities
As the number of facilities increases, the total volume delivered by the system increases but the volume to each facility stays the same. This implies—
1. for R&R, initially the number of facilities at a review meeting increases until it reaches a maximum due to a limit on the length of review meetings, at which point additional review meetings are added to facilitate further increase in facilities
2. for R&DD, the number of facilities at a review meeting increases but since there is no physical counting of inventory, the maximum limit on review meeting size is much higher than for R&R
3. for DDIC delivery routes are added to facilitate the increase in facilities
USD 0
USD 2,000
USD 4,000
USD 6,000
USD 8,000
USD 10,000
USD 12,000
USD 14,000
USD 0
USD 1,000
USD 2,000
USD 3,000
USD 4,000
USD 5,000
USD 6,000
0 20 40 60 80 100 120 140 160 180R
&R
DD
IC,
R&
DD
, a
nd
IC
&D
D
Number of Commodities
Per cbm Costs DDIC, R&DD, IC&DD, R&R
US$ Cost of DDIC per cbm US$ Cost of R&DD per cbm
US$ Cost of IC&DD per cbm US$ Cost of R&R per cbm
34
4. for IC&DD, LGA M&E officer facility visit routes are expanded and delivery routes added to facilitate the increase in facilities.
Figure 15 shows total costs for each system change as one adds facilities, assuming 20 commodities for distribution. These facilities are assumed to be similar to each other in terms of proximity to other facilities and volumes to be delivered. As before, we see DDIC having the lowest cost, then IC&DD, then R&DD, and then R&R. IC&DD costs are higher than DDIC by an average of 11 percent, R&DD by an average of 15 percent, and R&R is on average about 4.5 times the cost of DDIC. For a small number of facilities, the R&DD actually has lower costs than the IC&DD reflecting the fact that it is cheaper to bring a small number of facilities to a central location (R&DD) rather than visiting these facilities individually but then still having a central meeting (IC&DD). At 20 facilities, R&DD is 17 percent higher than DDIC, IC&DD is 47 percent higher than DDIC, and R&R about 4.5 times higher.
35
Figure 15. Total Costs of Last-Mile Distribution Systems as Number of Facilities Increases
Economies of scale
From the total cost curves shown in Figure 15, we can again derive the average cost curves, that is, the cost per facility for each system in Figure 16. Costs per Facility for Last-Mile Distribution Systems with Increase in Number of Facilities
$1.00
$10.00
$100.00
$1,000.00
$10,000.00
$100,000.00
$1,000,000.00
$10,000,000.00
USD 20,000
USD 200,000
0 100 200 300 400 500 600
Number of Facilities
Total Cost Comparison (Transportation, Information Capture & Facility Labor): DDIC vs R&R vs R&DD vs IC&DD
DDIC R&DD IC&DD R&R
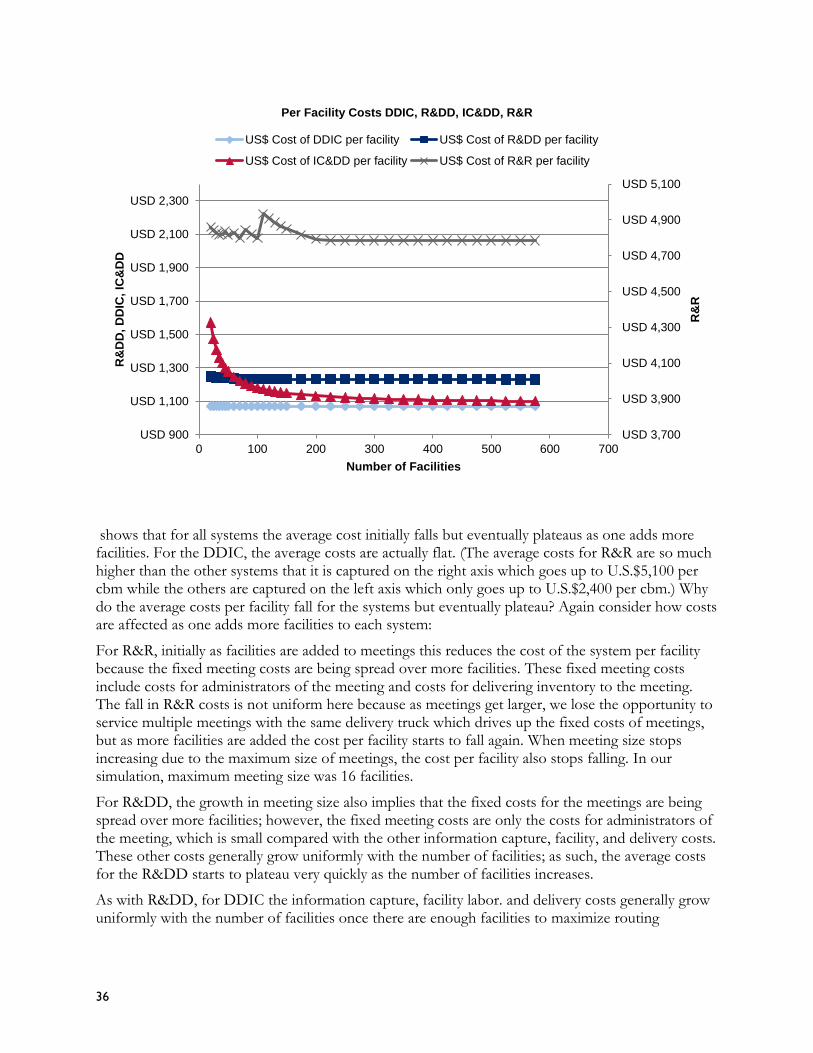
36
shows that for all systems the average cost initially falls but eventually plateaus as one adds more facilities. For the DDIC, the average costs are actually flat. (The average costs for R&R are so much higher than the other systems that it is captured on the right axis which goes up to U.S.$5,100 per cbm while the others are captured on the left axis which only goes up to U.S.$2,400 per cbm.) Why do the average costs per facility fall for the systems but eventually plateau? Again consider how costs are affected as one adds more facilities to each system:
For R&R, initially as facilities are added to meetings this reduces the cost of the system per facility because the fixed meeting costs are being spread over more facilities. These fixed meeting costs include costs for administrators of the meeting and costs for delivering inventory to the meeting. The fall in R&R costs is not uniform here because as meetings get larger, we lose the opportunity to service multiple meetings with the same delivery truck which drives up the fixed costs of meetings, but as more facilities are added the cost per facility starts to fall again. When meeting size stops increasing due to the maximum size of meetings, the cost per facility also stops falling. In our simulation, maximum meeting size was 16 facilities.
For R&DD, the growth in meeting size also implies that the fixed costs for the meetings are being spread over more facilities; however, the fixed meeting costs are only the costs for administrators of the meeting, which is small compared with the other information capture, facility, and delivery costs. These other costs generally grow uniformly with the number of facilities; as such, the average costs for the R&DD starts to plateau very quickly as the number of facilities increases.
As with R&DD, for DDIC the information capture, facility labor. and delivery costs generally grow uniformly with the number of facilities once there are enough facilities to maximize routing
USD 3,700
USD 3,900
USD 4,100
USD 4,300
USD 4,500
USD 4,700
USD 4,900
USD 5,100
USD 900
USD 1,100
USD 1,300
USD 1,500
USD 1,700
USD 1,900
USD 2,100
USD 2,300
0 100 200 300 400 500 600 700
R&
R
R&
DD
, D
DIC
, IC
&D
D
Number of Facilities
Per Facility Costs DDIC, R&DD, IC&DD, R&R
US$ Cost of DDIC per facility US$ Cost of R&DD per facility
US$ Cost of IC&DD per facility US$ Cost of R&R per facility
37
efficiencies, e.g., to ensure that delivery trucks are close to filled when leaving the warehouse and close to empty when returning.
For IC&DD, adding facilities reduces the average cost of information capture in two ways. First, the cost of the LGA M&E officers visiting one more facility spreads the fixed costs of visiting facilities over a larger number of facilities. Second, the fixed costs of the review meeting for the officers are also spread over a larger number of facilities as the number of facilities increases. The delivery costs grow uniformly with the number of facilities and are higher than the costs of information capture. As a result, IC&DD costs fall initially but begin to plateau.
It should be noted that the plateau of average cost for all the systems here is based on the assumption of adding similar facilities to the system in terms of volumes to be distributed to the facility, distances from other facilities, etc. If the added facilities are very different from existing facilities this could cause a different behavior in average costs. For example if the added facilities are much closer to existing facilities or to themselves, or have lower volumes required for delivery, the average costs may continue to fall. If the added facilities are not as accessible or have larger volumes required for delivery, average costs could slow their rate of fall or even increase.
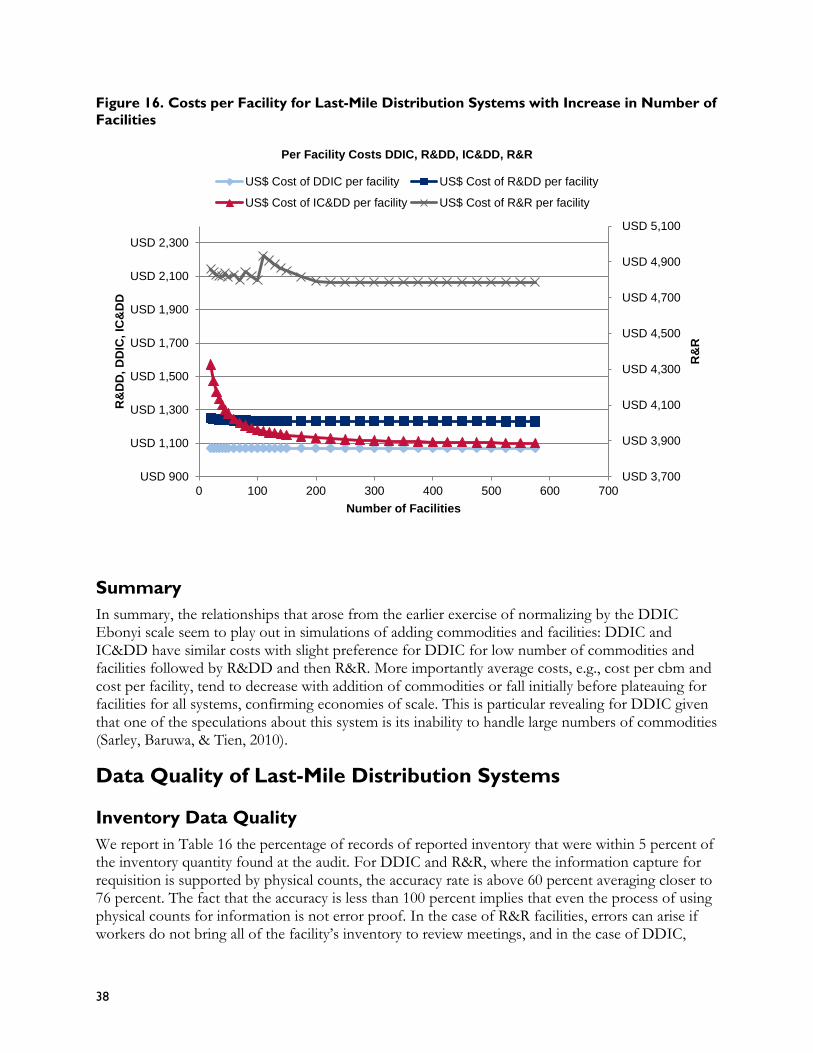
38
Figure 16. Costs per Facility for Last-Mile Distribution Systems with Increase in Number of
Facilities
Summary
In summary, the relationships that arose from the earlier exercise of normalizing by the DDIC Ebonyi scale seem to play out in simulations of adding commodities and facilities: DDIC and IC&DD have similar costs with slight preference for DDIC for low number of commodities and facilities followed by R&DD and then R&R. More importantly average costs, e.g., cost per cbm and cost per facility, tend to decrease with addition of commodities or fall initially before plateauing for facilities for all systems, confirming economies of scale. This is particular revealing for DDIC given that one of the speculations about this system is its inability to handle large numbers of commodities (Sarley, Baruwa, & Tien, 2010).
Data Quality of Last-Mile Distribution Systems
Inventory Data Quality
We report in Table 16 the percentage of records of reported inventory that were within 5 percent of the inventory quantity found at the audit. For DDIC and R&R, where the information capture for requisition is supported by physical counts, the accuracy rate is above 60 percent averaging closer to 76 percent. The fact that the accuracy is less than 100 percent implies that even the process of using physical counts for information is not error proof. In the case of R&R facilities, errors can arise if workers do not bring all of the facility’s inventory to review meetings, and in the case of DDIC,
USD 3,700
USD 3,900
USD 4,100
USD 4,300
USD 4,500
USD 4,700
USD 4,900
USD 5,100
USD 900
USD 1,100
USD 1,300
USD 1,500
USD 1,700
USD 1,900
USD 2,100
USD 2,300
0 100 200 300 400 500 600 700
R&
R
R&
DD
, D
DIC
, IC
&D
D
Number of Facilities
Per Facility Costs DDIC, R&DD, IC&DD, R&R
US$ Cost of DDIC per facility US$ Cost of R&DD per facility
US$ Cost of IC&DD per facility US$ Cost of R&R per facility
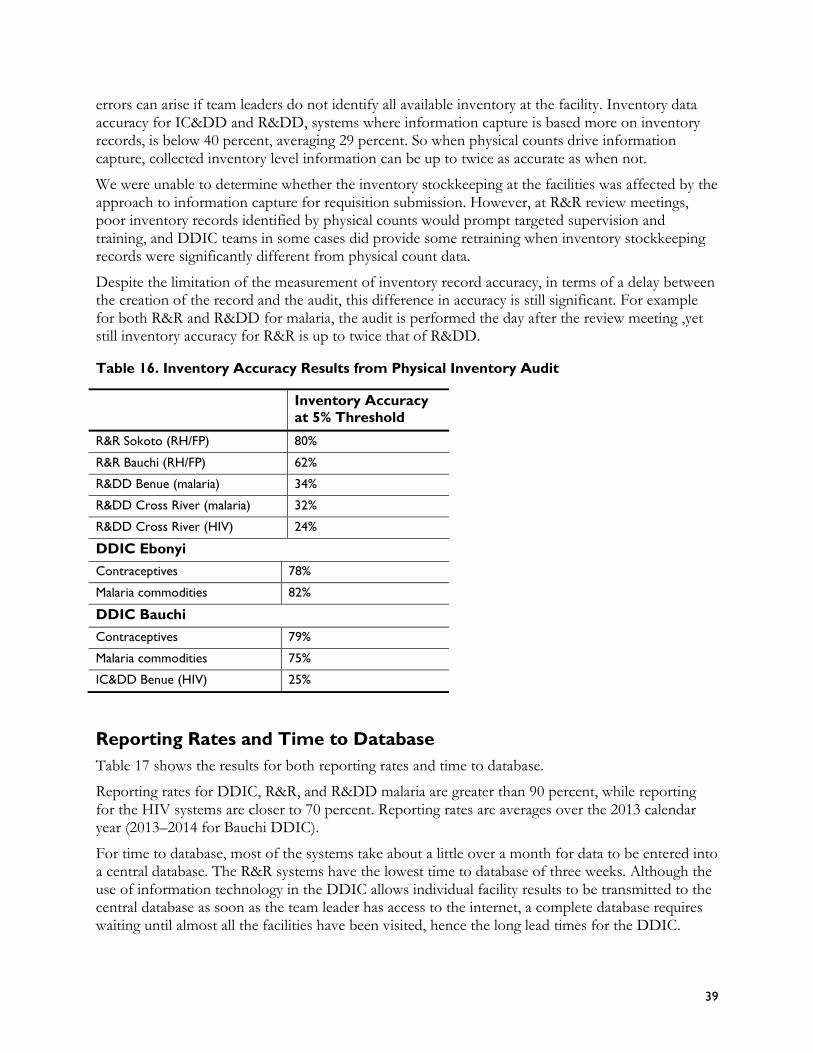
39
errors can arise if team leaders do not identify all available inventory at the facility. Inventory data accuracy for IC&DD and R&DD, systems where information capture is based more on inventory records, is below 40 percent, averaging 29 percent. So when physical counts drive information capture, collected inventory level information can be up to twice as accurate as when not.
We were unable to determine whether the inventory stockkeeping at the facilities was affected by the approach to information capture for requisition submission. However, at R&R review meetings, poor inventory records identified by physical counts would prompt targeted supervision and training, and DDIC teams in some cases did provide some retraining when inventory stockkeeping records were significantly different from physical count data.
Despite the limitation of the measurement of inventory record accuracy, in terms of a delay between the creation of the record and the audit, this difference in accuracy is still significant. For example for both R&R and R&DD for malaria, the audit is performed the day after the review meeting ,yet still inventory accuracy for R&R is up to twice that of R&DD.
Table 16. Inventory Accuracy Results from Physical Inventory Audit
Inventory Accuracy
at 5% Threshold
R&R Sokoto (RH/FP) 80%
R&R Bauchi (RH/FP) 62%
R&DD Benue (malaria) 34%
R&DD Cross River (malaria) 32%
R&DD Cross River (HIV) 24%
DDIC Ebonyi
Contraceptives 78%
Malaria commodities 82%
DDIC Bauchi
Contraceptives 79%
Malaria commodities 75%
IC&DD Benue (HIV) 25%
Reporting Rates and Time to Database
Table 17 shows the results for both reporting rates and time to database.
Reporting rates for DDIC, R&R, and R&DD malaria are greater than 90 percent, while reporting for the HIV systems are closer to 70 percent. Reporting rates are averages over the 2013 calendar year (2013–2014 for Bauchi DDIC).
For time to database, most of the systems take about a little over a month for data to be entered into a central database. The R&R systems have the lowest time to database of three weeks. Although the use of information technology in the DDIC allows individual facility results to be transmitted to the central database as soon as the team leader has access to the internet, a complete database requires waiting until almost all the facilities have been visited, hence the long lead times for the DDIC.
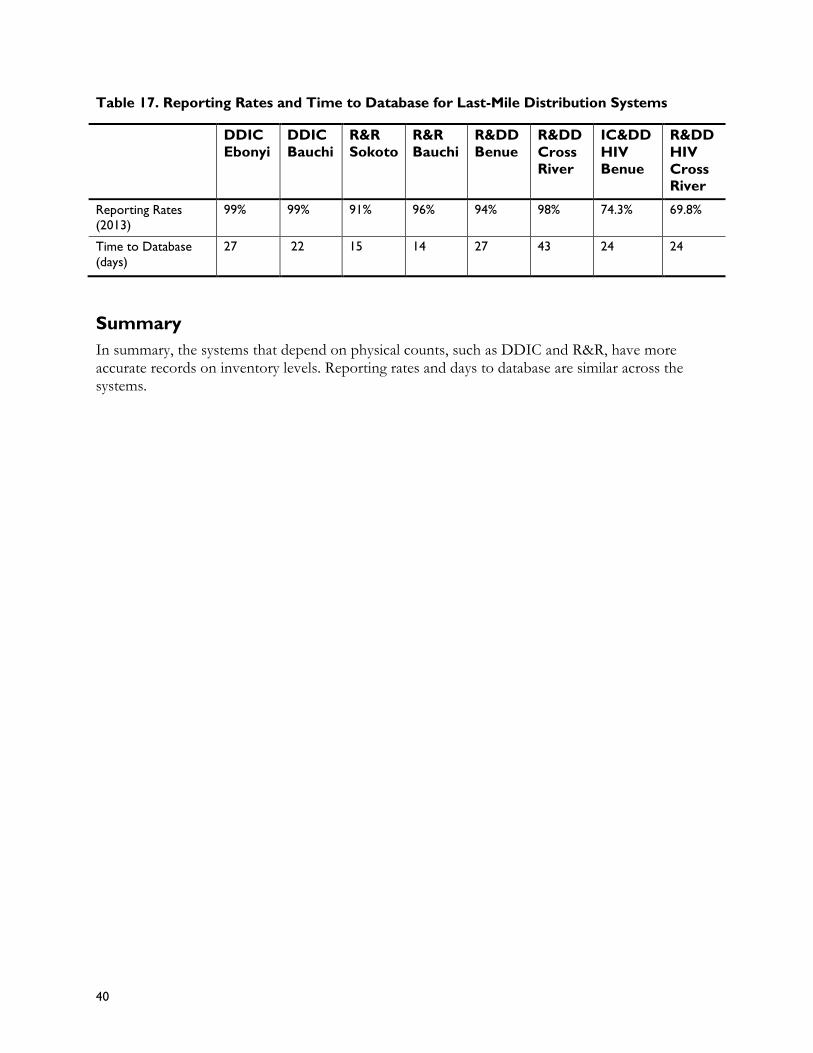
40
Table 17. Reporting Rates and Time to Database for Last-Mile Distribution Systems
DDIC
Ebonyi
DDIC
Bauchi
R&R
Sokoto
R&R
Bauchi
R&DD
Benue
R&DD
Cross
River
IC&DD
HIV
Benue
R&DD
HIV
Cross River
Reporting Rates
(2013)
99% 99% 91% 96% 94% 98% 74.3% 69.8%
Time to Database
(days)
27 22 15 14 27 43 24 24
Summary
In summary, the systems that depend on physical counts, such as DDIC and R&R, have more accurate records on inventory levels. Reporting rates and days to database are similar across the systems.
41
Summary and Discussion
The purpose of this study was to inform design of last-mile public health supply chains in Nigeria. We focused on three design options—dependence on SDP personnel, dependence on inventory counts and separation of information capture and delivery—with expectations for implications and collected evidence from four distribution systems in Nigeria to see the effect of those design options on the costs and performance of these systems.
Summary of Results
Summarizing the cost and performance results, we found that while DDIC and IC&DD had the lowest costs (see Table 18) and were similar on certain metrics like inventory availability, DDIC had a distinct advantage on other metrics like inventory data accuracy and reporting rates (see
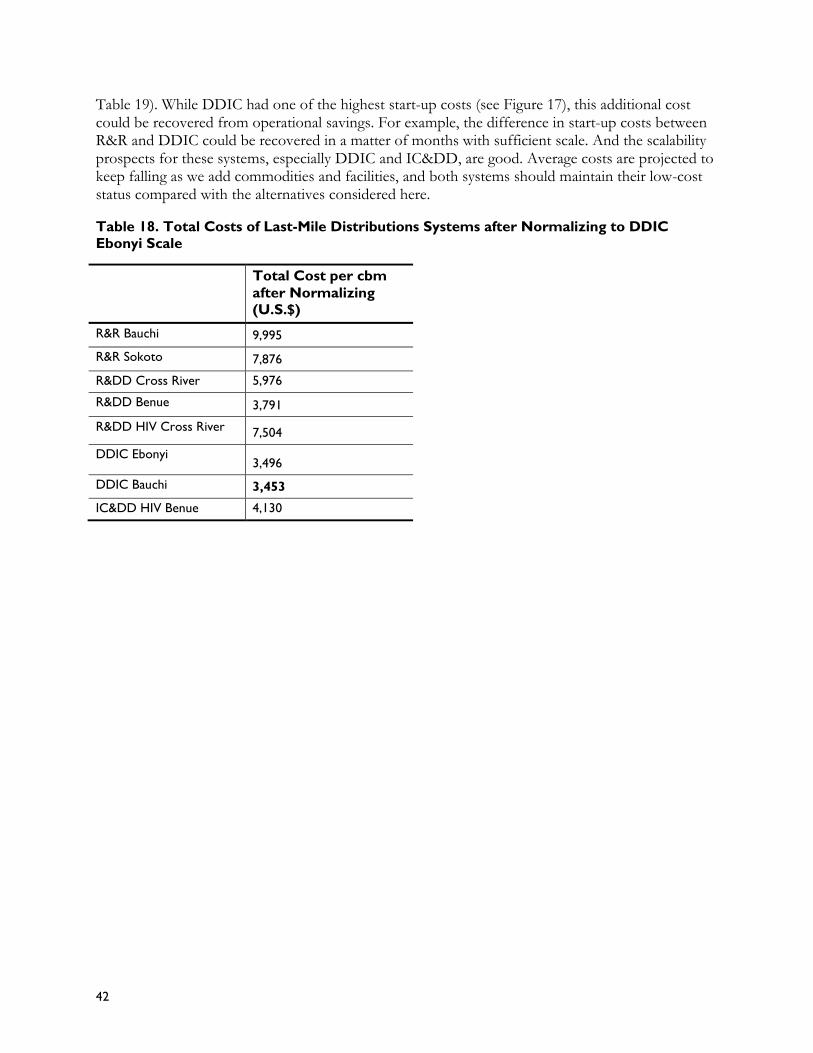
42
Table 19). While DDIC had one of the highest start-up costs (see Figure 17), this additional cost could be recovered from operational savings. For example, the difference in start-up costs between R&R and DDIC could be recovered in a matter of months with sufficient scale. And the scalability prospects for these systems, especially DDIC and IC&DD, are good. Average costs are projected to keep falling as we add commodities and facilities, and both systems should maintain their low-cost status compared with the alternatives considered here.
Table 18. Total Costs of Last-Mile Distributions Systems after Normalizing to DDIC Ebonyi Scale
Total Cost per cbm
after Normalizing (U.S.$)
R&R Bauchi 9,995 R&R Sokoto 7,876
R&DD Cross River 5,976
R&DD Benue 3,791
R&DD HIV Cross River 7,504
DDIC Ebonyi 3,496
DDIC Bauchi 3,453
IC&DD HIV Benue 4,130
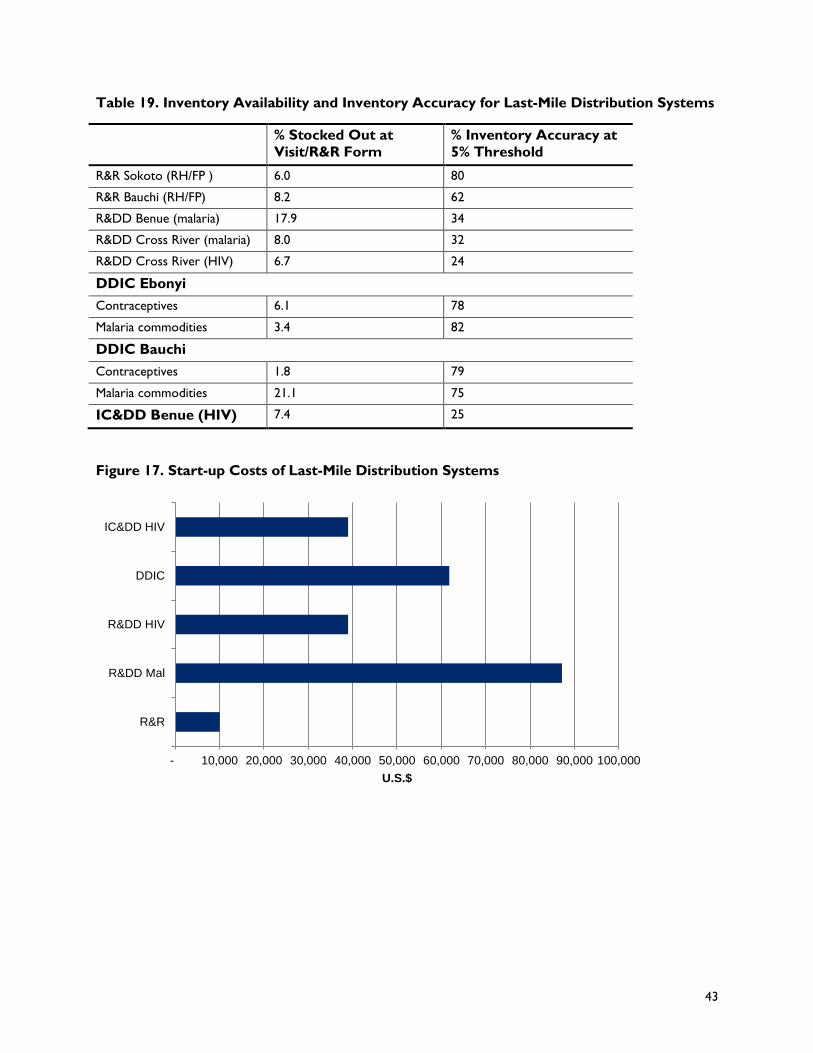
43
Table 19. Inventory Availability and Inventory Accuracy for Last-Mile Distribution Systems
% Stocked Out at
Visit/R&R Form
% Inventory Accuracy at
5% Threshold
R&R Sokoto (RH/FP ) 6.0 80
R&R Bauchi (RH/FP) 8.2 62
R&DD Benue (malaria) 17.9 34
R&DD Cross River (malaria) 8.0 32
R&DD Cross River (HIV) 6.7 24
DDIC Ebonyi
Contraceptives 6.1 78
Malaria commodities 3.4 82
DDIC Bauchi
Contraceptives 1.8 79
Malaria commodities 21.1 75
IC&DD Benue (HIV) 7.4 25
Figure 17. Start-up Costs of Last-Mile Distribution Systems
- 10,000 20,000 30,000 40,000 50,000 60,000 70,000 80,000 90,000 100,000
R&R
R&DD Mal
R&DD HIV
DDIC
IC&DD HIV
U.S.$
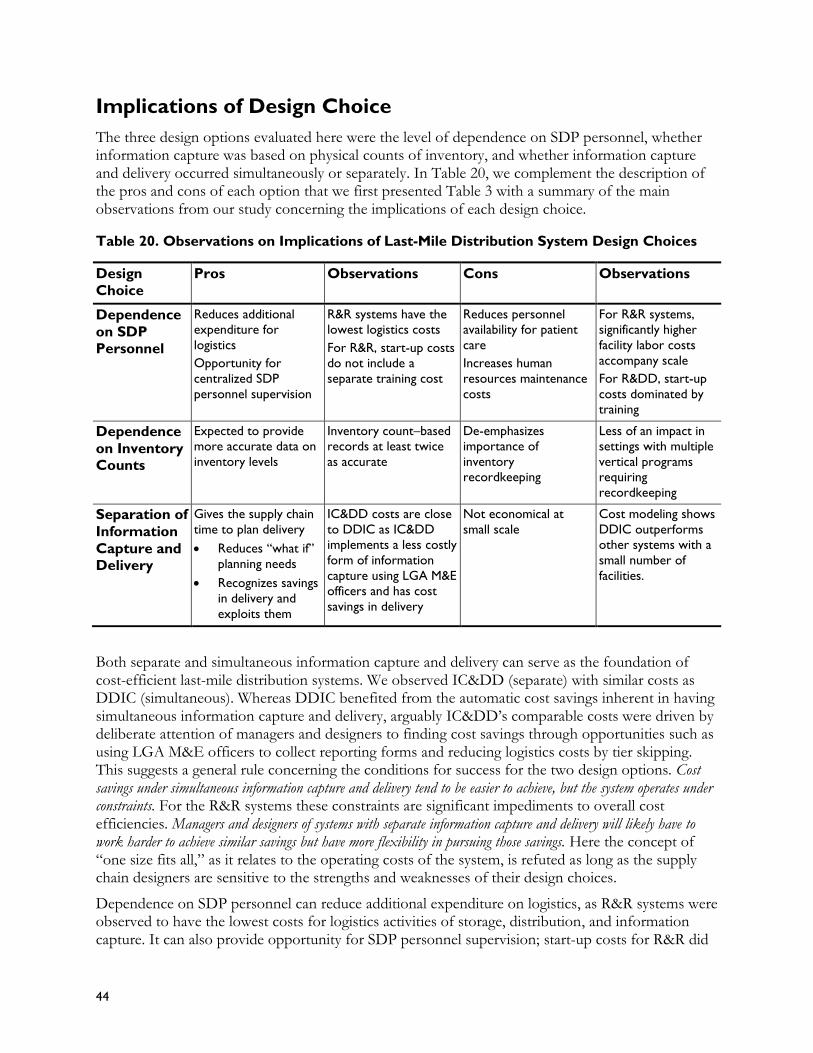
44
Implications of Design Choice
The three design options evaluated here were the level of dependence on SDP personnel, whether information capture was based on physical counts of inventory, and whether information capture and delivery occurred simultaneously or separately. In Table 20, we complement the description of the pros and cons of each option that we first presented Table 3 with a summary of the main observations from our study concerning the implications of each design choice.
Table 20. Observations on Implications of Last-Mile Distribution System Design Choices
Design
Choice
Pros Observations Cons Observations
Dependence
on SDP Personnel
Reduces additional
expenditure for
logistics
Opportunity for
centralized SDP
personnel supervision
R&R systems have the
lowest logistics costs
For R&R, start-up costs
do not include a
separate training cost
Reduces personnel
availability for patient
care
Increases human
resources maintenance
costs
For R&R systems,
significantly higher
facility labor costs
accompany scale
For R&DD, start-up
costs dominated by
training
Dependence
on Inventory Counts
Expected to provide
more accurate data on
inventory levels
Inventory count–based
records at least twice
as accurate
De-emphasizes
importance of
inventory
recordkeeping
Less of an impact in
settings with multiple
vertical programs
requiring
recordkeeping
Separation of
Information
Capture and Delivery
Gives the supply chain
time to plan delivery
Reduces “what if”
planning needs
Recognizes savings
in delivery and
exploits them
IC&DD costs are close
to DDIC as IC&DD
implements a less costly
form of information
capture using LGA M&E
officers and has cost
savings in delivery
Not economical at
small scale
Cost modeling shows
DDIC outperforms
other systems with a
small number of
facilities.
Both separate and simultaneous information capture and delivery can serve as the foundation of cost-efficient last-mile distribution systems. We observed IC&DD (separate) with similar costs as DDIC (simultaneous). Whereas DDIC benefited from the automatic cost savings inherent in having simultaneous information capture and delivery, arguably IC&DD’s comparable costs were driven by deliberate attention of managers and designers to finding cost savings through opportunities such as using LGA M&E officers to collect reporting forms and reducing logistics costs by tier skipping. This suggests a general rule concerning the conditions for success for the two design options. Cost savings under simultaneous information capture and delivery tend to be easier to achieve, but the system operates under constraints. For the R&R systems these constraints are significant impediments to overall cost efficiencies. Managers and designers of systems with separate information capture and delivery will likely have to work harder to achieve similar savings but have more flexibility in pursuing those savings. Here the concept of “one size fits all,” as it relates to the operating costs of the system, is refuted as long as the supply chain designers are sensitive to the strengths and weaknesses of their design choices.
Dependence on SDP personnel can reduce additional expenditure on logistics, as R&R systems were observed to have the lowest costs for logistics activities of storage, distribution, and information capture. It can also provide opportunity for SDP personnel supervision; start-up costs for R&R did
45
not have a separate training component since training can occur at the first review meeting. Dependence on SDP personnel can be costly. Start-up required training for facility workers under R&DD occurred outside of review meetings and were the highest of all the systems while DDIC with a lower dependence on facility workers had the lowest training costs for health facilities. For operating costs, facility labor costs for R&R were almost 10 times that of other systems when operating at same scale. This is particularly significant given that the human resource within healthcare is one of the most constrained.
These observations go to the heart of one of the more fundamental questions being faced by designers of last-mile distribution systems—how much should SDP personnel be involved in supply chain management–related activities?—and the related question of whether dedicated supply chain management personnel are appropriate within last-mile distribution systems? For the last-mile distribution system designer, the scale of the system being designed usually plays a significant part in how the first question is answered. In fact, we see in Table 11 that smaller-scale systems (by volume delivered) tend to be designed with a greater dependence on SDP personnel (R&R and R&DD) than larger systems. The big-picture perspective recognizes though that those systems are only operating on a small scale because they are focused on a few products. And that taken in its totality with respect to all the commodities that flow through the SDP, these SDP personnel operate in a very large scale (albeit in some cases dysfunctional) last-mile distribution system. Thus even though for small-scale vertical last-mile distribution systems, a designed dependence on SDP personnel may be appropriate, it may not be appropriate given the larger last-mile distribution system for the other commodities at the SDP that the SDP personnel must also support as well. Accordingly, dedicated supply chain management personnel within last-mile distribution systems will seem more appropriate as the true scale of the last-mile distributions systems needed to serve SDPs is recognized.
Finally using physical counts for information capture generally results in more accurate inventory information about inventory at the SDP facilities. The concern with de-emphasis on recordkeeping resulting from use of physical counts is mitigated by two observations. The first is that the Nigerian healthcare setting is characterized by multiple vertical programs operating through health facilities. Unless all programs adopted physical counts, inventory recording would still be emphasized by non-physical count–based systems. However, given the results found here, such programs may also suffer from poor accuracy in those inventory records. The second observation is that at R&R review meetings poor inventory records identified by physical counts would prompt targeted supervision and training, while DDIC teams in some cases did provide some retraining of SDP staff while present at the facility when inventory stockkeeping records were significantly different from physical count data. Inventory stockkeeping at facilities may not suffer if physical counts are used to prompt targeted retraining.
Interestingly, in most if not all last-mile distribution systems, physical counts are generally recognized as important, and information capture is designed so as to be at least indirectly dependent on the physical counts. The seeming breakdown in information capture efficiency for these systems that do not directly depend on physical counts is not then one of designer intent but rather of a poor recognition of the factors that will inhibit the design from achieving its stated goals. In many cases, factors such as lack of training, lack of incentives, and lack of capacity reduce the accuracy of the data from this type of information capture. Accordingly addressing those factors in the design of a last-mile distribution system should improve the accuracy of the data from information capture. Indeed, the approach to information capture in the R&R and DDIC systems can be considered then not just simply as a direct dependence on physical counts but rather as
46
addressing those factors in this health supply chain environment that would otherwise reduce the quality of the information captured. In the case of the DDIC, the factor addressed could potentially be the lack of SDP personnel capacity for this activity, while in the case of the R&R the factor addressed could potentially be the lack of training, since the review meetings allow for continual and targeted supervision.

47
48
References
Chandani, Y., Noel, M., Pomeroy, A., Andersson, S., Pahl, M., & Williams, T. (2012). Factors affecting availability of essential medicines among community health workers in Ethiopia, Malawi, and Rwanda: solving the last mile puzzle. American Journal of Tropical Medicines & Hygiene (5 Suppl), 120-126.
Futures Institute. (2011). The Impact of Stock-outs on the Use of Modern Contraception. Interim Report. Glastonbury, CT: Futures Institute.
Gill, C., Young, M., Schroder, K., Carvajal-Velez, L., McNabb, M. A., Qazi, S., et al. (2013). Bottlenecks, barriers and solutions: results from multicountry consultations focused on reduction of childhood pneumonia and diarrhoea deaths. Lancet , 381 (9876), 1487-90.
i+ Solutions, MIT Zaragoza, Transaid, and VillageReach. (2010). Capacity Building and Supply Chain Assistance in Nigeria. Work Order 4: Commodity Distribution Optimization. Netherlands: i+ Solutions.
McCord, J., Tien, M., & Sarley, D. (2013). Guide to Public Health Supply Chain Costing: A Basic Methodology. Arlington, Va: USAID | DELIVER PROJECT, Task Order 4.
MIT Zaragoza, Transaid, and VillageReach. (2011). Framework on Distribution Outsourcing in Government-Run Distribution Systems. Zaragoza, Spain: MIT Zaragoza International Logistics Program.
National Bureau of Statistics of Nigeria. (2014). CPI Report June. National Bureau of Statistics of Nigeria.
Pagnoni, F., Convelbo, N., Tiendrebeogo, J., Cousens, S., & Esposito, F. (1997). A community-based programme to provide prompt and adequate treatment of presumptive malaria in children. Transactions of Royal Society of Tropical Medicine & Hygiene , 91, 512-517.
Robertson, J., Forte, G., Trapsida, J., & Hill, S. (2009). What essential medicines for children are on the shelf? Bulletin World Health Organization , 87, 231-237.
Rosen, J. E., Bancroft, E., Hasselback, L., Levin, C., Mvundura, M., & Tien, M. (2013). Last Mile Costs of Public Health Supply Chains in Developing Countries: Recommendations for Inclusions in the United Nations OneHealth Model. Arlington, Va.: USAID | DELIVER PROJECT, Task Order 4.
Sarley, D., Baruwa, E., & Tien, M. (2010). Zimbabwe: Supply Chain Costing of Health Commodities. Arlington, Va: USAID | DELIVER PROJECT, Task Order 1.
Systems for Improved Access to Pharmaceuticals and Services (SIAPS) Program. (2014). Promising Practices in Supply Chain Management: Distribution. Arlington, VA: Management Sciences for Health.
Tien, M., Baruwa, E., & Young, D. (2013). Supply Chain Costing Tool User's Manual. Arlington, Va: USAID | DELIVER PROJECT, Task Order 4.
USAID | DELIVER PROJECT. (2010). Emerging Trends in Outsourcing. Arlington, VA: USAID|DELIVER PROJECT.
USAID | DELIVER PROJECT Task Order 1. (2008). DeliveryTeam Topping Up: Bringing About Reliable Distribution in Difficult. Arlington, Va: USAID | DELIVER PROJECT Task Order 1.
USAID | DELIVER PROJECT, Task Order 4. (2011). Using Last Mile Distribution to Increase Access to Health Commodities. Arlington, Va: USAID | DELIVER PROJECT, Task Order 4.
Vian, T. (2003). Zimbabwe: Assessing the Cost of Transporting HIV/AIDS Commodities. A Case Study in Financial Analysis. Arlington, VA: USAID|DELIVER PROJECT.
49
VillageReach. (2009). Comparison of Costs Incurred in Dedicated and Diffused Vaccine Logistics System: Cost-Effectiveness of Vaccine Logistics in Cabo Delgado and Niassa Province, Mozambique. Seattle: VillageReach.
World Bank. (2010). Policy Note: Enhancing Public Supply Chain Management in Zambia: Results of the Essential Drug Public Pilot Program. Washington DC: World Bank.
WorldBank. (1993). The World Development Report 1993: Investing in Health. Oxford: Oxford University Press.
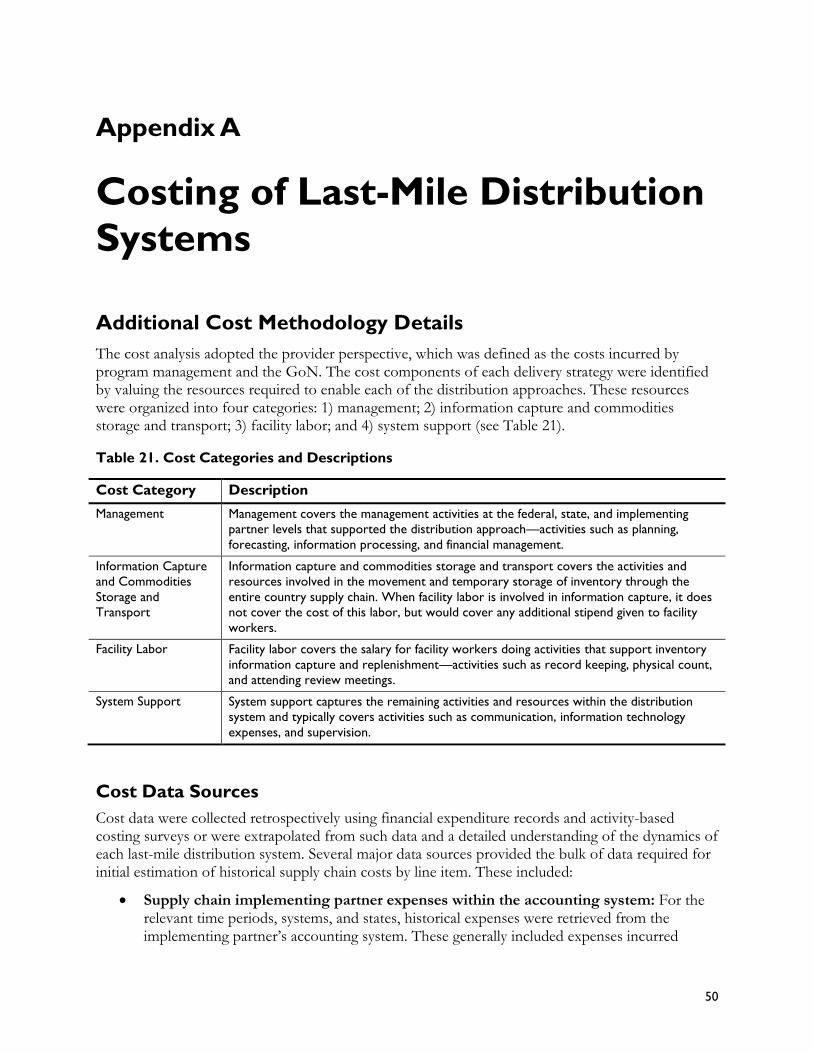
50
Appendix A
Costing of Last-Mile Distribution
Systems
Additional Cost Methodology Details
The cost analysis adopted the provider perspective, which was defined as the costs incurred by program management and the GoN. The cost components of each delivery strategy were identified by valuing the resources required to enable each of the distribution approaches. These resources were organized into four categories: 1) management; 2) information capture and commodities storage and transport; 3) facility labor; and 4) system support (see Table 21).
Table 21. Cost Categories and Descriptions
Cost Category Description
Management Management covers the management activities at the federal, state, and implementing
partner levels that supported the distribution approach—activities such as planning,
forecasting, information processing, and financial management.
Information Capture
and Commodities
Storage and
Transport
Information capture and commodities storage and transport covers the activities and
resources involved in the movement and temporary storage of inventory through the
entire country supply chain. When facility labor is involved in information capture, it does
not cover the cost of this labor, but would cover any additional stipend given to facility
workers.
Facility Labor Facility labor covers the salary for facility workers doing activities that support inventory
information capture and replenishment—activities such as record keeping, physical count,
and attending review meetings.
System Support System support captures the remaining activities and resources within the distribution
system and typically covers activities such as communication, information technology
expenses, and supervision.
Cost Data Sources
Cost data were collected retrospectively using financial expenditure records and activity-based costing surveys or were extrapolated from such data and a detailed understanding of the dynamics of each last-mile distribution system. Several major data sources provided the bulk of data required for initial estimation of historical supply chain costs by line item. These included:
Supply chain implementing partner expenses within the accounting system: For the relevant time periods, systems, and states, historical expenses were retrieved from the implementing partner’s accounting system. These generally included expenses incurred
51
directly by the implementing partner, such as per diems paid to project staff and GoN staff, or ancillary expenses associated with supporting resupply meetings. As the implementing partner accounting tree codes did not provide the specificity required for this exercise, a manual process was established in which project accounting staff retrieved expense vouchers of interest, and manually transferred relevant expenses to a spreadsheet for analysis. In several limited instances, specific distribution runs were not available within the accounting system, and their costs were estimated by taking the average of existing cycles.
3PL invoices and associated work orders: Several major logistics activities are undertaken by 3PLs on behalf of the projects. These 3PLs provide detailed invoices for services rendered, which include warehousing, interstate transport, and last-mile delivery to facilities. Typically these invoices (or the associated work orders) include details on total amounts billed and level of commodities handled. For several systems, implementing partner contract management staff maintain a spreadsheet which tracks last-mile delivery costs, number of facilities served, value, and volume of commodities handled. This spreadsheet is manually updated by transcribing invoice and work order data for each distribution run. For storage, interstate transport, and HIV last-mile deliveries, no such spreadsheet is actively maintained, so one was constructed using historical documents from systems, states, and time periods of interest.
USAID | DELIVER PROJECT supply chain costing tool (activity-based) surveys conducted for Central Contraceptive Warehouse, Oshodi: The USAID | DELIVER PROJECT developed a standardized survey tool in 2009 to estimate total supply chain costs at given locations that cover labor, asset depreciation, and other direct costs (McCord, Tien, & Sarley, 2013). In February 2014, this survey was conducted for the central contraceptive warehouse (CCW) in Oshodi, Lagos.
Activity-based surveys for estimating service delivery–level logistics labor costs: Several surveys were conducted to estimate the time and salaries of staff who spend portions of their working days on logistics tasks. These require respondent estimation of logistics effort, which is not ideal, but preferable in this study to intensive time-in-motion studies. These surveys were conducted for Bauchi R&R meetings, Bauchi DDIC, Ebonyi DDIC, Cross River R&DD HIV, and Benue IC&DD HIV. For all except the Bauchi R&R meetings, this survey accompanied the data quality assessment visit, meaning sampling was equivalent for the two studies.
GoN civil service pay scale: The GoN implements a nationwide structured pay scale that applies to all salaried government employees. Each numerical civil service grade and step has an associated salary amount in Nigerian naira (NGN), which includes all relevant benefits. This scale was compared with respondent civil service grades to estimate the value of GoN staff time.
Activity-based surveys for estimating implementing partner LOE by state and program: A survey was conducted for implementing partner staff to estimate time spent supporting specific programs and states. Top-level managers identified relevant staff for each program, who then responded by email to a series of questions that identified their LOE attributable to specific states, programs, and implementation versus full-scale operations.
52
Activity-based surveys for estimating HIV service provision implementing partner effort in Benue and Cross River: A survey similar to the USAID | DELIVER PROJECT costing tool was conducted for Abuja-based staff of the service delivery implementing partners who support logistics activities in Cross River and Benue. These surveys estimated LOE in full-time equivalents for central and state level support.
Costs were measured in a combination of NGN and U.S.$, depending on which currency was used to purchase or pay for the resources. Costs in NGN were measured at the time the expenditure was incurred and converted to U.S.$ 2013 prices, based on the average exchange rate for the year (U.S.$1=157.71 NGN) (OANDA). Costs for DDIC Bauchi were adjusted for a partial year of inflation (National Bureau of Statistics of Nigeria, 2014). Items with a lifespan of more than one year were classified as capital costs and were annuitized using a discount rate of 3 percent (WorldBank, 1993). The lifespan of computers was estimated at two years, general equipment at four years, and buildings at seven years.
For each distribution approach, the total project cost per cbm (i.e., the cost of all ingredients) and the MOH-incurred costs per cbm (i.e., the cost incurred by the MOH as opposed to the implementing partner) were calculated. Calculations of “per cbm” under each distribution approach were based on the volume of commodities recorded as distributed for each system during January–December 2013 (May 2013–April 2014 for DDIC Bauchi). No adjustment was made to account for any loss of commodities within the supply chain as the assumption was made that all commodities sent via each distribution approach could not be accounted for until arrival at SDPs.
Cost Line Item Assumptions
General scope
Costs were estimated by line item for each state and program within the scope of the evaluation. The architecture of these line items covers major logistics-related consumption of resources, including management, storage, distribution, and data collection, as they occur at each level of the country supply chain. Quantification and procurement of commodities were not included in this evaluation of in-country delivery systems, as this study focused on in-country distribution and data collection models. While the general scope of costs is the same between all evaluated systems, some line items are included in certain systems and not in others, depending on their relevancy. For example, while facility logistics data collection costs are included in all cost estimates, some systems include line items for resupply meeting costs while the systems that do not use this mechanism do not. The line items are also designed to include costs borne to all parties within the supply chain, including the GoN and implementing partners that conduct certain activities within the supply chain. Finally, the line items are designed to include both direct logistics costs and allocated or indirect labor associated with logistics operations.
Lists of line items were drafted for each system based on discussions between evaluators and implementing partner staff on the design of each system. The evaluators reviewed the generated lists with the implementing partner staff to ensure that they contained the correct items.
The time periods associated with historical cost estimates align with the time periods for the overall evaluation: calendar year 2013 for all states and systems, except for Bauchi DDIC, which covers May 2013 through April 2014.
53
Summary of estimation approaches by line item
Central-level GoN management oversight
This line item includes management effort of logistics systems that occurs at the federal level of the health system. Each health program in Nigeria includes some LOE at the federal level that supports national coordination and policy development for the supply chain. For example, the Unified HIV Supply Chain includes both the National AIDS Control Agency and National AIDS Control and Prevention Program as national-level supply chain stakeholders. Total labor costs were estimated for these offices through reported staffing levels and staff seniority and the federal pay scale. These costs were then allocated to individual states by dividing them by 37, assuming that at a national level the attention and management effort per state might be approximately equal between states (including the Federal Capital Territory). For antimalarial delivery this cost related to the efforts of the National Malaria Elimination Program, and for FP product delivery this included the FMOH Family Planning Unit.
Abuja and state-level implementing partner management oversight and contract
management
This line item includes the value of management effort undertaken by Abuja-based staff of PFSCM and the USAID | DELIVER PROJECT in support of specific state operations. The cost is based on responses to the activity-based survey described above, which paired number of hours per period with salaries to identify costs per state and system. The salaries applied are “fully loaded” in that they include the implementing partner’s assigned overhead and applicable fee. Central-level management staff also indicated who among the staff list was based in states of interest and what percentage of their time went to supporting the systems of interest (usually 100 percent). In this way, estimates of state-level effort were produced.
Central- and state-level service provision implementing partner management
Similar to the PFSCM and USAID | DELIVER PROJECT staff, implementing partners (mainly nongovernmental organizations) are contracted to strengthen service provision of Nigeria’s expanding HIV testing and ART. Under the Unified HIV Supply Chain, the service provision implementing partners continue to play a role in collection of logistics data from the facilities they support. Based on the surveys mentioned above, the service provision implementing partners provided staffing levels and titles of dedicated logistics staff based in Abuja and in states of interest. Based on the titles, salaries were estimated using the logistics implementing partner’s salary scale, including overhead and fees.
Central-level storage (including labor, utilities, and equipment)
Estimates of central-level storage costs varied by health program: FP, malaria, and HIV all use separate central-level operations. Last-mile systems that handle these products included these costs accordingly. DDIC costs included both central-level costs of storing the FP and ant-malarial commodities.
FP products are centrally stored at the CCW in Oshodi, Lagos. Application of the USAID | DELIVER PROJECT supply chain costing tool produced an estimate of the annual GoN costs of running this operation in 2013. These costs include labor, utilities, and asset depreciation on equipment. These costs were compared with the total volume of commodities issued from the warehouse in 2013, and allocated to states of interest based on the proportion of national issuing
54
volume represented by that state’s issue volume during the same time period. Effectively, this process produced a “storage cost per cbm” that was applied to individual states.
Antimalarial commodities purchased by the President’s Malaria Initiative (PMI) are either directly shipped from the port of entry to a state-level warehouse or stored in Abuja at a private warehouse contracted by the implementing partner. Total central storage costs for antimalarial commodities were obtained from historical invoices for calendar year 2013. Also included in the invoices was the quantity of American standard pallets issued during each month, which was converted to a total cubic volume for the year. Similar to allocation of central storage costs for FP, volume of issues was used to allocate total annual storage costs to individual state systems. A similar approach was used for central storage costs for the Unified HIV Supply Chain.
Transport between central and intermediary (state) levels
FP products moving between the CCW in Lagos and state stores traveled on 3PL vehicles, sometimes contracted by GoN and sometimes by the USAID | DELIVER PROJECT. To estimate the costs of this activity relevant to individual state systems, an average per cbm rate was calculated from USAID | DELIVER PROJECT contracted deliveries for specific states and then applied to the total cubic volume issued by that state’s system.
A similar approach was applied for antimalarial interstate deliveries, although in the case of Bauchi DDIC, a lack of documented deliveries from Abuja to Bauchi meant that for Bauchi DDIC antimalarial commodities, an average Lagos to Bauchi rate was applied for the full volume.
Interstate transport for the HIV states (Cross River and Benue) required a different approach. Under the Unified HIV Supply Chain, last-mile order fulfillment and delivery occur at a zonal store rather than each state store. For example, facilities in all five Phase 1 states are resupplied by a store in Calabar, Cross River. For facilities in Cross River, they are also resupplied by the store in their state, but the costs of transporting commodities and storage in Cross River should be allocated across all of the states within Phase 1. The total transport costs for 2013 were allocated to Cross River using the relative commodity issue volumes of Cross River among Phase 1 states for July 2012 through December 2013. Although this time period does not completely align with the main timeline for analysis, the proportional volumes between states should be relatively close. In the case of Benue, the central store in Abuja also serves as the resupply point for facilities, so there are no interstate transport costs to include.
State-level MOH oversight labor
For this line item, it was assumed that three MOH staff with civil service grade 14 would each spend 25 percent of their time on the program for all last-mile distribution systems.
GoN supervision labor
For DDIC, a specific line-item is included for GoN supervision labor. For this line item, it was assumed that an MOH staff with civil service grade 12 would undertake supervision. This salary was applied to the number of days for which a supervision vehicle was expensed to estimate the value of supervision labor.
Total state/intermediary storage costs
All systems and states of interest (aside from Benue HIV) include some level of resources dedicated to storage and order fulfillment at the state level. Apart from Cross River HIV, all of these state-level operations are undertaken using GoN storage resources—publicly constructed and operated
55
state medical stores. For these states, a per cubic meter storage cost was developed using the costs and throughput of the CCW in Lagos and then applied to each state and system per the cubic volume reflected in each instance. While this reflects a fairly broad assumption that per volume storage costs are equivalent across states, the stores perform similar operations, using staff that are paid under the same salary structure.
Cross River HIV storage occurs in the state capital, Calabar, using a 3PL which manages storage for last-mile delivery to all of the five Phase 1 states. Calabar storage costs were obtained from historical invoices for 2013 and applied to Cross River specifically using the proportional volume of Cross River among Phase 1 states.
Commodity transport from state/intermediary levels to health facilities
In all systems of interest except R&R, last-mile delivery is conducted by 3PLs contracted by the implementing partner. Historical invoices and associated work orders were used to calculate costs over relevant time periods.
Other system expenses (stipends and per diems to staff, car hire, equipment purchase and installation, communications expense)
Several expenses are incurred by the implementing partner in each of the systems of interest, including per diems and stipends for GoN staff contribution to logistics activities. These costs are included in the expense accounting system from which historical expense records were downloaded for the period of interest. Many expenses were summed and directly included in the analysis, while several required extrapolation to account for missing distribution cycles within the obtained records. In these instances, the extrapolation (usually for between one and three out of six distribution cycles), assumes that average costs would have applied for missing distribution cycles. For DDIC per diems, amounts were verified against distribution cycle reports, which state the number of days required to complete the cycle.
Non-facility labor for information capture
Some non-facility labor used for information capture were estimated from 1) the stipends and per diems paid for staff; 2) experience-driven assumptions about the length of information capture activities such as review meetings for R&R, R&DD, and IC&DD and trips to facilities to collect information for ICⅅ and 3) assumptions about the salary grade of staff members involved.
Facility logistics labor
The value of facility logistics labor was obtained through the activity-based surveys described above. The surveys asked respondents for their civil service grade and step and then the average amount of time spent on individual logistics tasks for the commodities of interest. The surveys also asked for the civil service grades and time spent by other staff at the facility. Grades and steps were converted into salary rates using the federal salary scale and then compared with time responses to determine average cost per distribution cycle. These responses were then averaged to estimate an average logistic labor costs per facility and per distribution cycle for specific logistics tasks such as completing consumption records, managing inventory, and attending resupply meetings. In instances where civil service step was not included, it was assumed to be step 5. In instances where neither grade nor step was reported in a response, it was estimated by taking the average of responses for the same position (e.g., nurse practitioner, community health extension worker). Average costs were also calculated per commodity managed, which was obtained from logistics reports that were matched using facility names.
56
These surveys were conducted for Benue HIV (n=29), Cross River HIV (n=33), and Bauchi R&R (n=127). For Bauchi R&R, the per facility per cycle average cost was scaled up to the maximum number of facilities reporting within that system for six cycles. For Sokoto R&R, the same approach was used based on the Bauchi R&R average cost. For Benue and Cross River R&DD, the same approach was used based on the Bauchi R&R average cost. While an R&DD-specific time survey was not conducted, an assumption was that facility staff requirements under the system are similar enough to R&R to justify extension of the Bauchi R&R results. For Ebonyi and Bauchi DDIC, the Bauchi R&R results were also applied, with the removal of time spent on meeting travel and attendance and conducting physical counts, to produce a slightly lower per facility average cost. For Benue and Cross River HIV, results were aggregated across the two states but disaggregated by service provision type (prevention of mother-to-child transmission as compared with ART). Average costs were then scaled up for each state using the number of facilities of each type. The higher per facility costs observed (compared with other systems) was seen as driven by the assignment of more highly qualified (and expensive) staff to manage HIV/AIDS service provision and logistics activities.
Costing Results for Each Last-Mile Distribution System
The detailed costs for all eight last-mile distribution systems are provided in Table 22 through
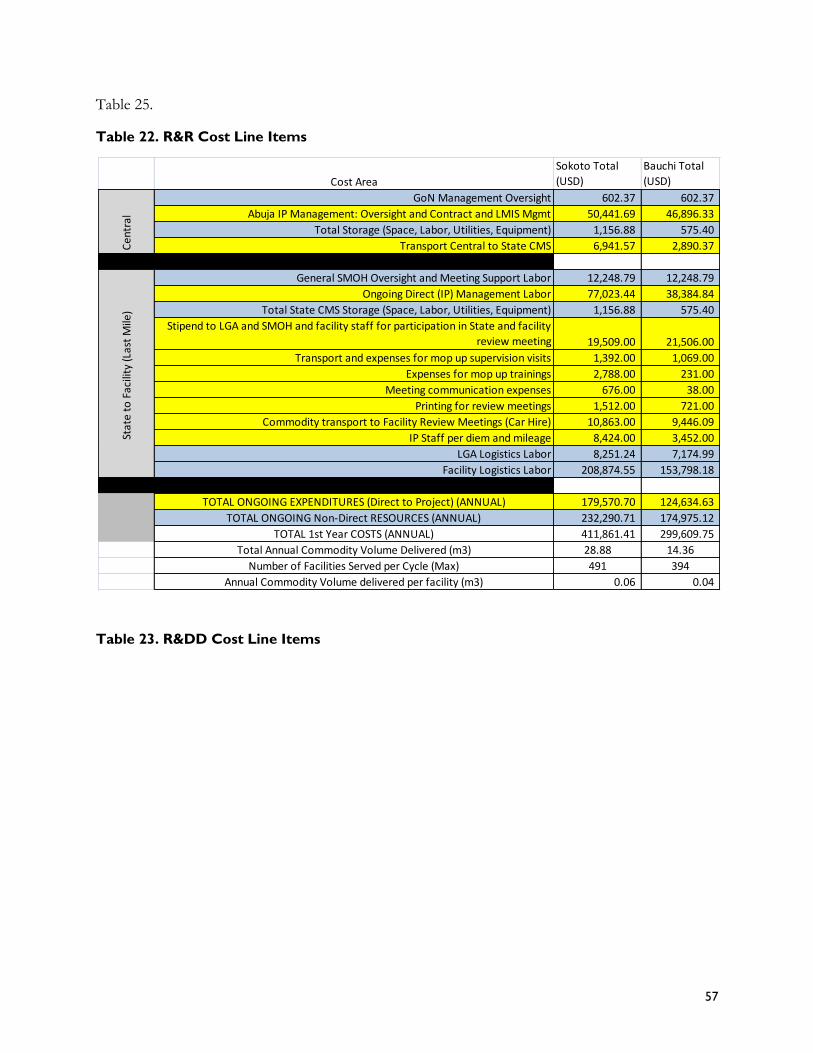
57
Table 25.
Table 22. R&R Cost Line Items
Table 23. R&DD Cost Line Items
Cost Area
Sokoto Total
(USD)
Bauchi Total
(USD)
GoN Management Oversight 602.37 602.37
Abuja IP Management: Oversight and Contract and LMIS Mgmt 50,441.69 46,896.33
Total Storage (Space, Labor, Utilities, Equipment) 1,156.88 575.40
Transport Central to State CMS 6,941.57 2,890.37
General SMOH Oversight and Meeting Support Labor 12,248.79 12,248.79
Ongoing Direct (IP) Management Labor 77,023.44 38,384.84
Total State CMS Storage (Space, Labor, Utilities, Equipment) 1,156.88 575.40
Stipend to LGA and SMOH and facility staff for participation in State and facility
review meeting 19,509.00 21,506.00
Transport and expenses for mop up supervision visits 1,392.00 1,069.00
Expenses for mop up trainings 2,788.00 231.00
Meeting communication expenses 676.00 38.00
Printing for review meetings 1,512.00 721.00
Commodity transport to Facility Review Meetings (Car Hire) 10,863.00 9,446.09
IP Staff per diem and mileage 8,424.00 3,452.00
LGA Logistics Labor 8,251.24 7,174.99
Facility Logistics Labor 208,874.55 153,798.18
TOTAL ONGOING EXPENDITURES (Direct to Project) (ANNUAL) 179,570.70 124,634.63
TOTAL ONGOING Non-Direct RESOURCES (ANNUAL) 232,290.71 174,975.12
TOTAL 1st Year COSTS (ANNUAL) 411,861.41 299,609.75
Total Annual Commodity Volume Delivered (m3) 28.88 14.36
Number of Facilities Served per Cycle (Max) 491 394
Annual Commodity Volume delivered per facility (m3) 0.06 0.04
Cen
tral
Stat
e to
Fac
ility
(Las
t M
ile)
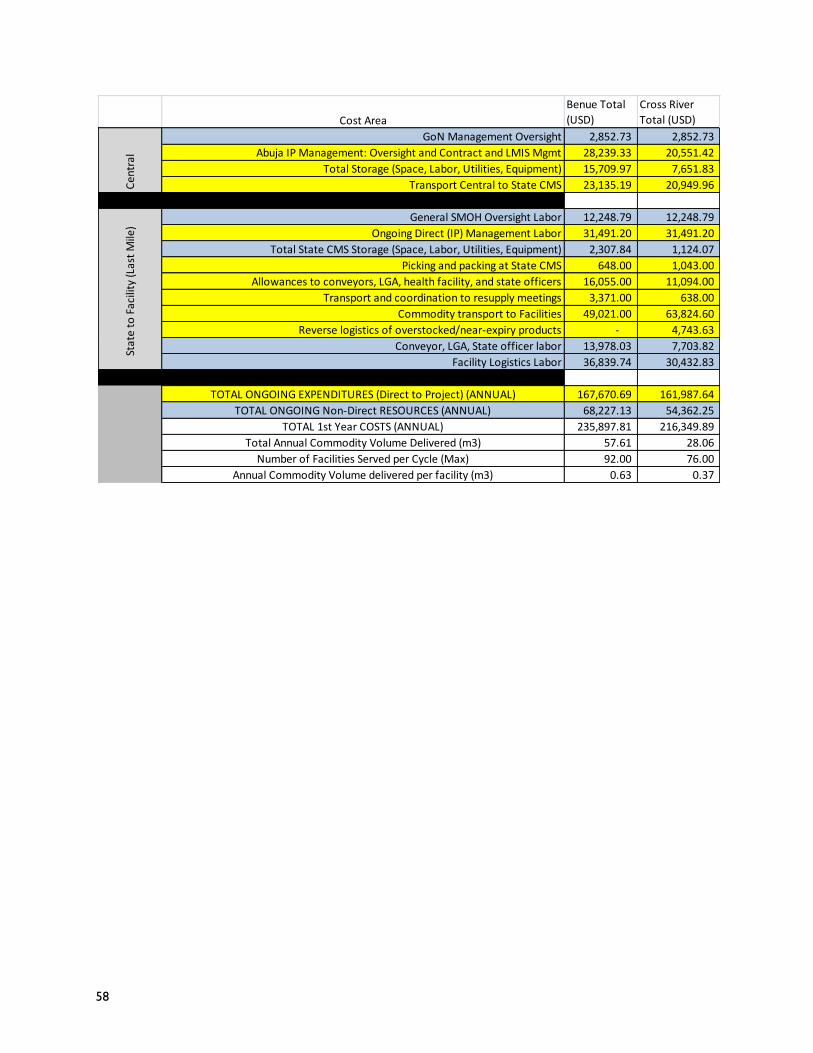
58
Cost Area
Benue Total
(USD)
Cross River
Total (USD)
GoN Management Oversight 2,852.73 2,852.73
Abuja IP Management: Oversight and Contract and LMIS Mgmt 28,239.33 20,551.42
Total Storage (Space, Labor, Utilities, Equipment) 15,709.97 7,651.83
Transport Central to State CMS 23,135.19 20,949.96
General SMOH Oversight Labor 12,248.79 12,248.79
Ongoing Direct (IP) Management Labor 31,491.20 31,491.20
Total State CMS Storage (Space, Labor, Utilities, Equipment) 2,307.84 1,124.07
Picking and packing at State CMS 648.00 1,043.00
Allowances to conveyors, LGA, health facility, and state officers 16,055.00 11,094.00
Transport and coordination to resupply meetings 3,371.00 638.00
Commodity transport to Facilities 49,021.00 63,824.60
Reverse logistics of overstocked/near-expiry products - 4,743.63
Conveyor, LGA, State officer labor 13,978.03 7,703.82
Facility Logistics Labor 36,839.74 30,432.83
TOTAL ONGOING EXPENDITURES (Direct to Project) (ANNUAL) 167,670.69 161,987.64
TOTAL ONGOING Non-Direct RESOURCES (ANNUAL) 68,227.13 54,362.25
TOTAL 1st Year COSTS (ANNUAL) 235,897.81 216,349.89
Total Annual Commodity Volume Delivered (m3) 57.61 28.06
Number of Facilities Served per Cycle (Max) 92.00 76.00
Annual Commodity Volume delivered per facility (m3) 0.63 0.37
Cen
tral
Stat
e to
Fac
ility
(Las
t M
ile)
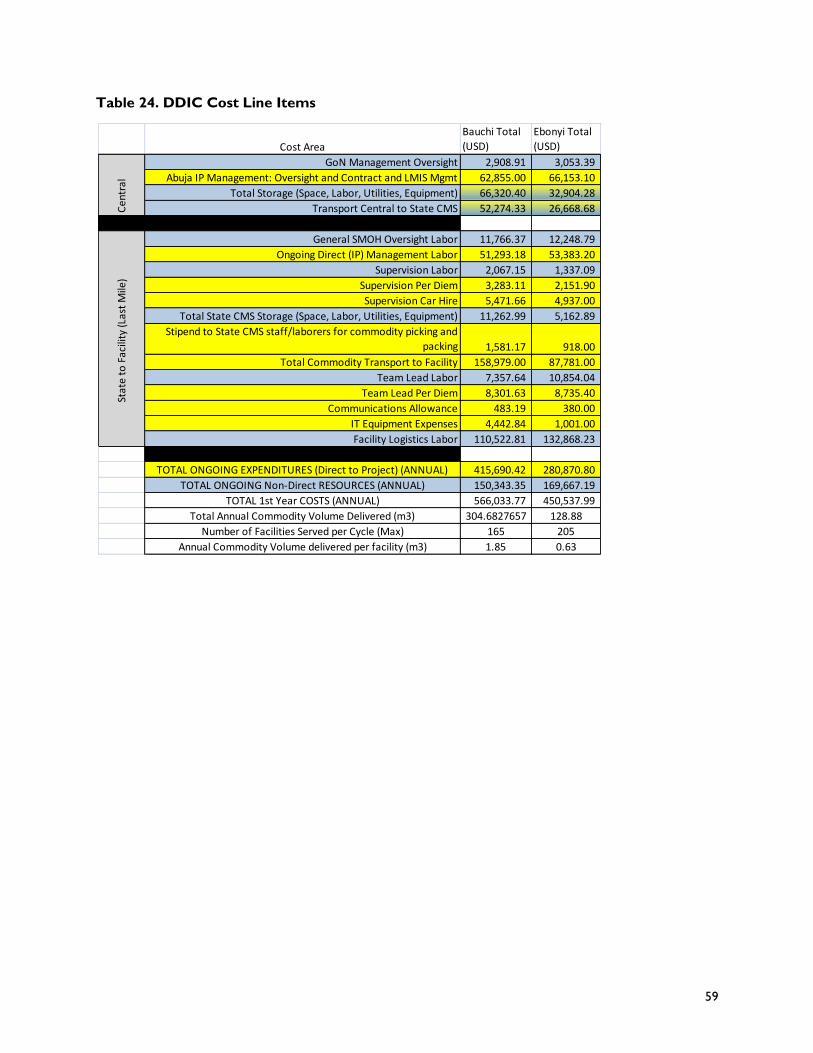
59
Table 24. DDIC Cost Line Items
Cost Area
Bauchi Total
(USD)
Ebonyi Total
(USD)
GoN Management Oversight 2,908.91 3,053.39
Abuja IP Management: Oversight and Contract and LMIS Mgmt 62,855.00 66,153.10
Total Storage (Space, Labor, Utilities, Equipment) 66,320.40 32,904.28
Transport Central to State CMS 52,274.33 26,668.68
General SMOH Oversight Labor 11,766.37 12,248.79
Ongoing Direct (IP) Management Labor 51,293.18 53,383.20
Supervision Labor 2,067.15 1,337.09
Supervision Per Diem 3,283.11 2,151.90
Supervision Car Hire 5,471.66 4,937.00
Total State CMS Storage (Space, Labor, Utilities, Equipment) 11,262.99 5,162.89
Stipend to State CMS staff/laborers for commodity picking and
packing 1,581.17 918.00
Total Commodity Transport to Facility 158,979.00 87,781.00
Team Lead Labor 7,357.64 10,854.04
Team Lead Per Diem 8,301.63 8,735.40
Communications Allowance 483.19 380.00
IT Equipment Expenses 4,442.84 1,001.00
Facility Logistics Labor 110,522.81 132,868.23
TOTAL ONGOING EXPENDITURES (Direct to Project) (ANNUAL) 415,690.42 280,870.80
TOTAL ONGOING Non-Direct RESOURCES (ANNUAL) 150,343.35 169,667.19
TOTAL 1st Year COSTS (ANNUAL) 566,033.77 450,537.99
Total Annual Commodity Volume Delivered (m3) 304.6827657 128.88
Number of Facilities Served per Cycle (Max) 165 205
Annual Commodity Volume delivered per facility (m3) 1.85 0.63
Cen
tral
Stat
e to
Fac
ility
(Las
t M
ile)
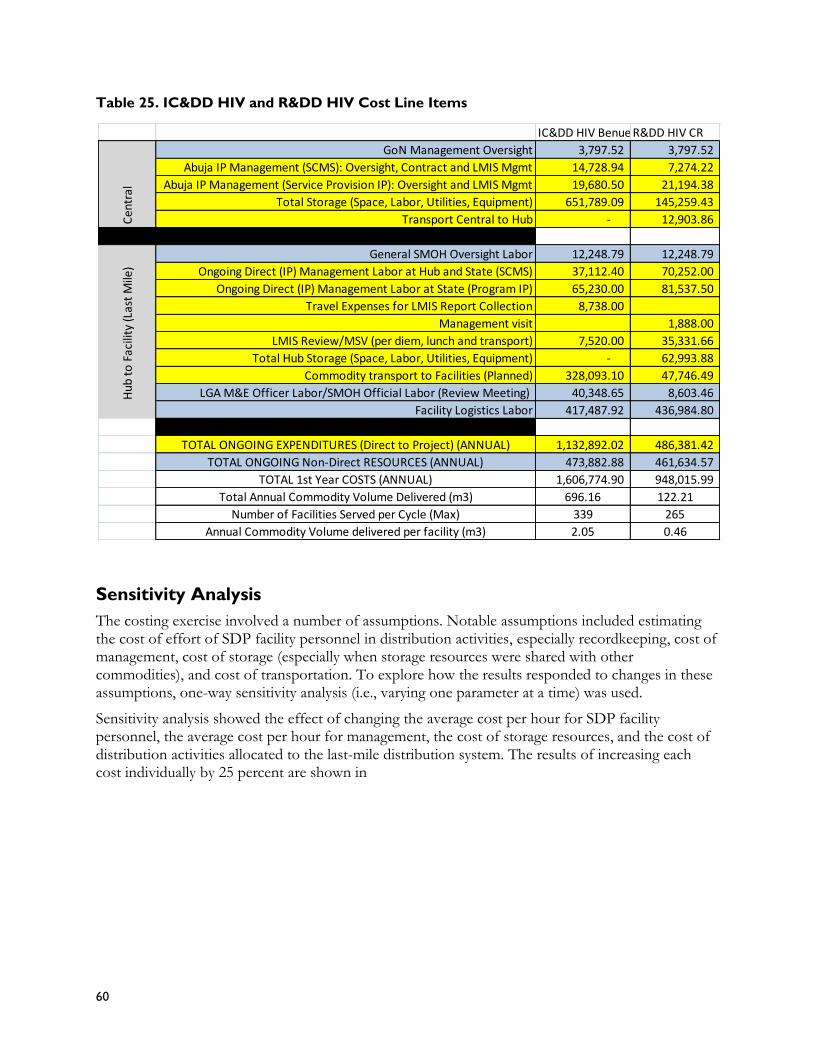
60
Table 25. IC&DD HIV and R&DD HIV Cost Line Items
Sensitivity Analysis
The costing exercise involved a number of assumptions. Notable assumptions included estimating the cost of effort of SDP facility personnel in distribution activities, especially recordkeeping, cost of management, cost of storage (especially when storage resources were shared with other commodities), and cost of transportation. To explore how the results responded to changes in these assumptions, one-way sensitivity analysis (i.e., varying one parameter at a time) was used.
Sensitivity analysis showed the effect of changing the average cost per hour for SDP facility personnel, the average cost per hour for management, the cost of storage resources, and the cost of distribution activities allocated to the last-mile distribution system. The results of increasing each cost individually by 25 percent are shown in
IC&DD HIV Benue R&DD HIV CR
GoN Management Oversight 3,797.52 3,797.52
Abuja IP Management (SCMS): Oversight, Contract and LMIS Mgmt 14,728.94 7,274.22
Abuja IP Management (Service Provision IP): Oversight and LMIS Mgmt 19,680.50 21,194.38
Total Storage (Space, Labor, Utilities, Equipment) 651,789.09 145,259.43
Transport Central to Hub - 12,903.86
General SMOH Oversight Labor 12,248.79 12,248.79
Ongoing Direct (IP) Management Labor at Hub and State (SCMS) 37,112.40 70,252.00
Ongoing Direct (IP) Management Labor at State (Program IP) 65,230.00 81,537.50
Travel Expenses for LMIS Report Collection 8,738.00
Management visit 1,888.00
LMIS Review/MSV (per diem, lunch and transport) 7,520.00 35,331.66
Total Hub Storage (Space, Labor, Utilities, Equipment) - 62,993.88
Commodity transport to Facilities (Planned) 328,093.10 47,746.49
LGA M&E Officer Labor/SMOH Official Labor (Review Meeting) 40,348.65 8,603.46
Facility Logistics Labor 417,487.92 436,984.80
TOTAL ONGOING EXPENDITURES (Direct to Project) (ANNUAL) 1,132,892.02 486,381.42
TOTAL ONGOING Non-Direct RESOURCES (ANNUAL) 473,882.88 461,634.57
TOTAL 1st Year COSTS (ANNUAL) 1,606,774.90 948,015.99
Total Annual Commodity Volume Delivered (m3) 696.16 122.21
Number of Facilities Served per Cycle (Max) 339 265
Annual Commodity Volume delivered per facility (m3) 2.05 0.46
Cen
tral
Hub
to
Fac
ility
(Las
t M
ile)
61
Figure 18. Generally, storage costs showed the least sensitivity (except for IC&DD) while the sensitivity with respect to the other costs was similar.
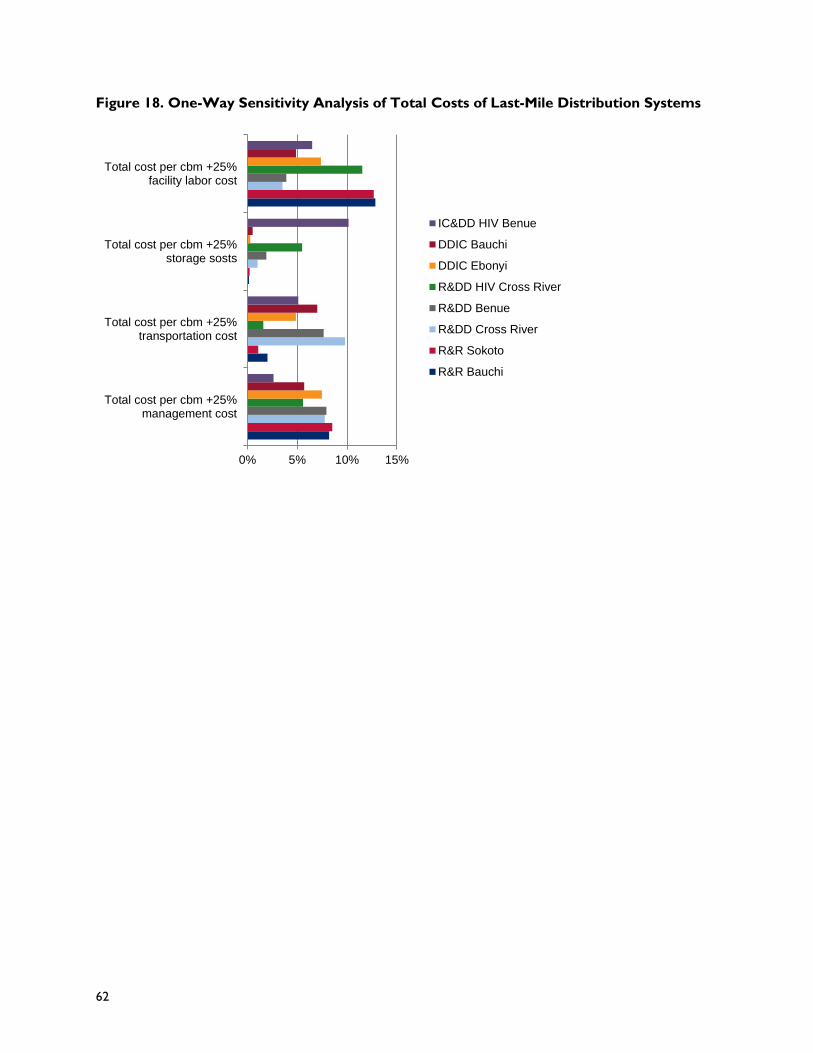
62
Figure 18. One-Way Sensitivity Analysis of Total Costs of Last-Mile Distribution Systems
0% 5% 10% 15%
Total cost per cbm +25%management cost
Total cost per cbm +25%transportation cost
Total cost per cbm +25%storage sosts
Total cost per cbm +25%facility labor cost
IC&DD HIV Benue
DDIC Bauchi
DDIC Ebonyi
R&DD HIV Cross River
R&DD Benue
R&DD Cross River
R&R Sokoto
R&R Bauchi

63
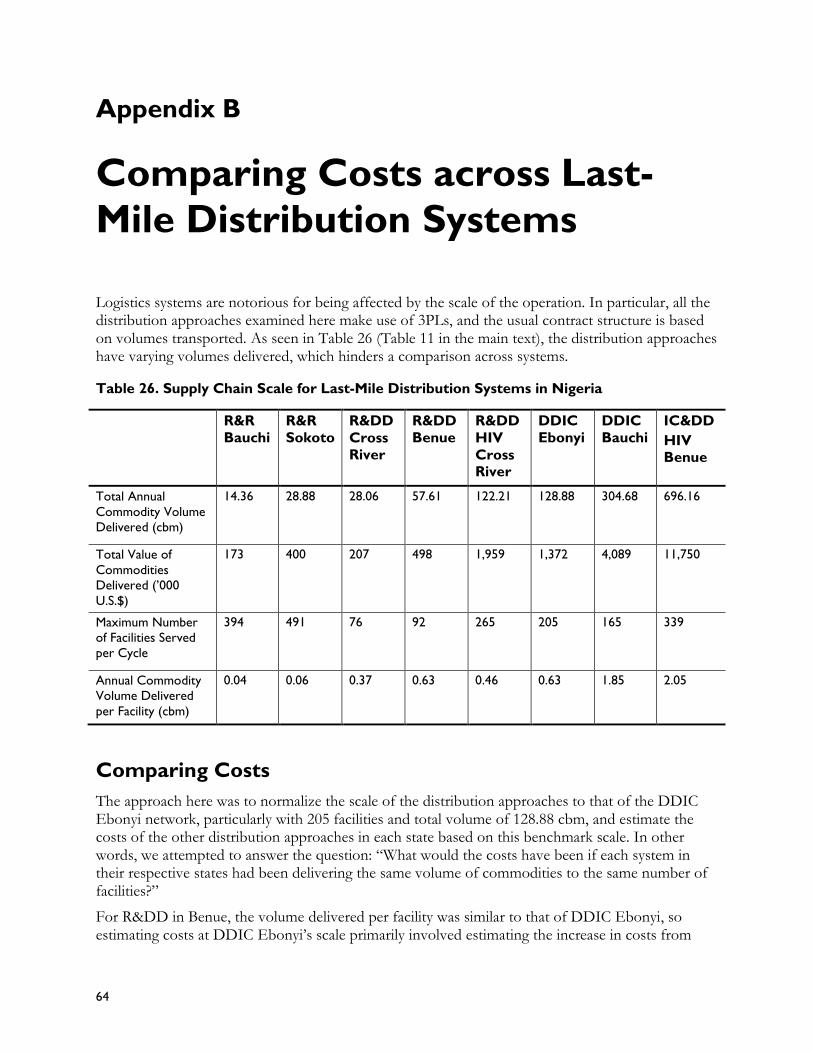
64
Appendix B
Comparing Costs across Last-
Mile Distribution Systems
Logistics systems are notorious for being affected by the scale of the operation. In particular, all the distribution approaches examined here make use of 3PLs, and the usual contract structure is based on volumes transported. As seen in Table 26 (Table 11 in the main text), the distribution approaches have varying volumes delivered, which hinders a comparison across systems.
Table 26. Supply Chain Scale for Last-Mile Distribution Systems in Nigeria
R&R
Bauchi
R&R
Sokoto
R&DD
Cross
River
R&DD
Benue
R&DD
HIV
Cross River
DDIC
Ebonyi
DDIC
Bauchi
IC&DD
HIV Benue
Total Annual
Commodity Volume
Delivered (cbm)
14.36 28.88 28.06 57.61 122.21 128.88 304.68 696.16
Total Value of
Commodities
Delivered (’000
U.S.$)
173 400 207 498 1,959 1,372 4,089 11,750
Maximum Number
of Facilities Served
per Cycle
394 491 76 92 265 205 165 339
Annual Commodity
Volume Delivered
per Facility (cbm)
0.04 0.06 0.37 0.63 0.46 0.63 1.85 2.05
Comparing Costs
The approach here was to normalize the scale of the distribution approaches to that of the DDIC Ebonyi network, particularly with 205 facilities and total volume of 128.88 cbm, and estimate the costs of the other distribution approaches in each state based on this benchmark scale. In other words, we attempted to answer the question: “What would the costs have been if each system in their respective states had been delivering the same volume of commodities to the same number of facilities?”
For R&DD in Benue, the volume delivered per facility was similar to that of DDIC Ebonyi, so estimating costs at DDIC Ebonyi’s scale primarily involved estimating the increase in costs from
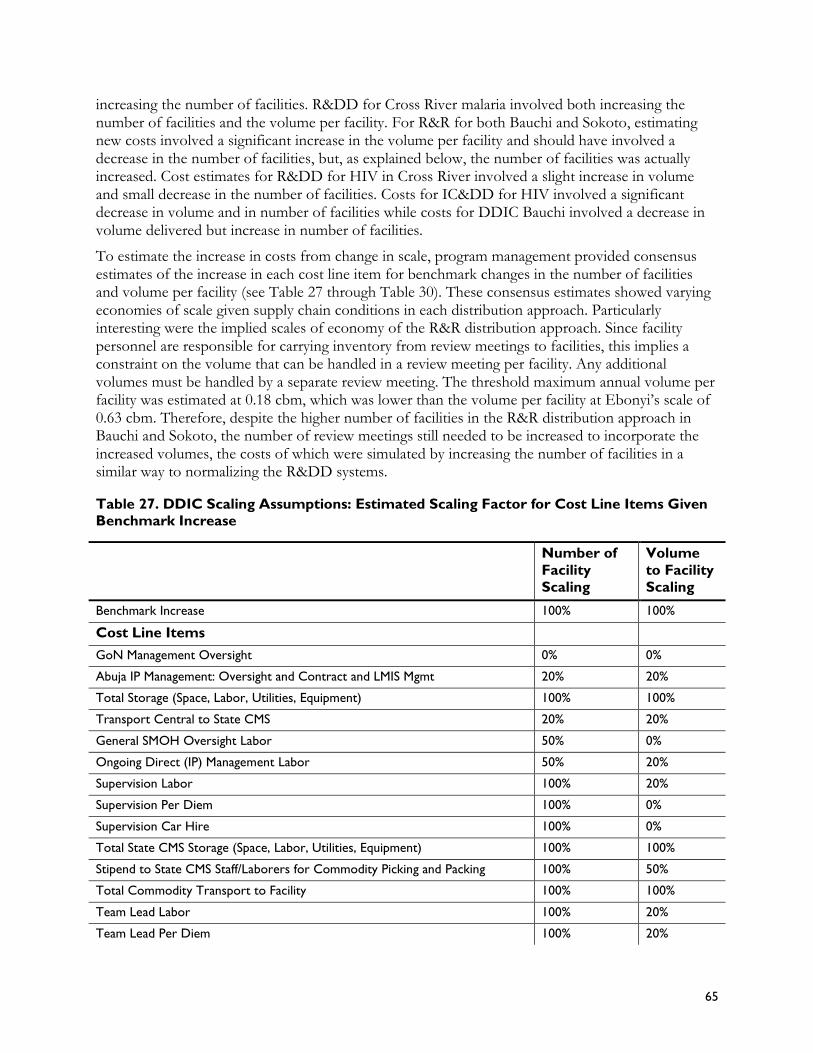
65
increasing the number of facilities. R&DD for Cross River malaria involved both increasing the number of facilities and the volume per facility. For R&R for both Bauchi and Sokoto, estimating new costs involved a significant increase in the volume per facility and should have involved a decrease in the number of facilities, but, as explained below, the number of facilities was actually increased. Cost estimates for R&DD for HIV in Cross River involved a slight increase in volume and small decrease in the number of facilities. Costs for IC&DD for HIV involved a significant decrease in volume and in number of facilities while costs for DDIC Bauchi involved a decrease in volume delivered but increase in number of facilities.
To estimate the increase in costs from change in scale, program management provided consensus estimates of the increase in each cost line item for benchmark changes in the number of facilities and volume per facility (see Table 27 through Table 30). These consensus estimates showed varying economies of scale given supply chain conditions in each distribution approach. Particularly interesting were the implied scales of economy of the R&R distribution approach. Since facility personnel are responsible for carrying inventory from review meetings to facilities, this implies a constraint on the volume that can be handled in a review meeting per facility. Any additional volumes must be handled by a separate review meeting. The threshold maximum annual volume per facility was estimated at 0.18 cbm, which was lower than the volume per facility at Ebonyi’s scale of 0.63 cbm. Therefore, despite the higher number of facilities in the R&R distribution approach in Bauchi and Sokoto, the number of review meetings still needed to be increased to incorporate the increased volumes, the costs of which were simulated by increasing the number of facilities in a similar way to normalizing the R&DD systems.
Table 27. DDIC Scaling Assumptions: Estimated Scaling Factor for Cost Line Items Given Benchmark Increase
Number of
Facility
Scaling
Volume
to Facility
Scaling
Benchmark Increase 100% 100%
Cost Line Items
GoN Management Oversight 0% 0%
Abuja IP Management: Oversight and Contract and LMIS Mgmt 20% 20%
Total Storage (Space, Labor, Utilities, Equipment) 100% 100%
Transport Central to State CMS 20% 20%
General SMOH Oversight Labor 50% 0%
Ongoing Direct (IP) Management Labor 50% 20%
Supervision Labor 100% 20%
Supervision Per Diem 100% 0%
Supervision Car Hire 100% 0%
Total State CMS Storage (Space, Labor, Utilities, Equipment) 100% 100%
Stipend to State CMS Staff/Laborers for Commodity Picking and Packing 100% 50%
Total Commodity Transport to Facility 100% 100%
Team Lead Labor 100% 20%
Team Lead Per Diem 100% 20%
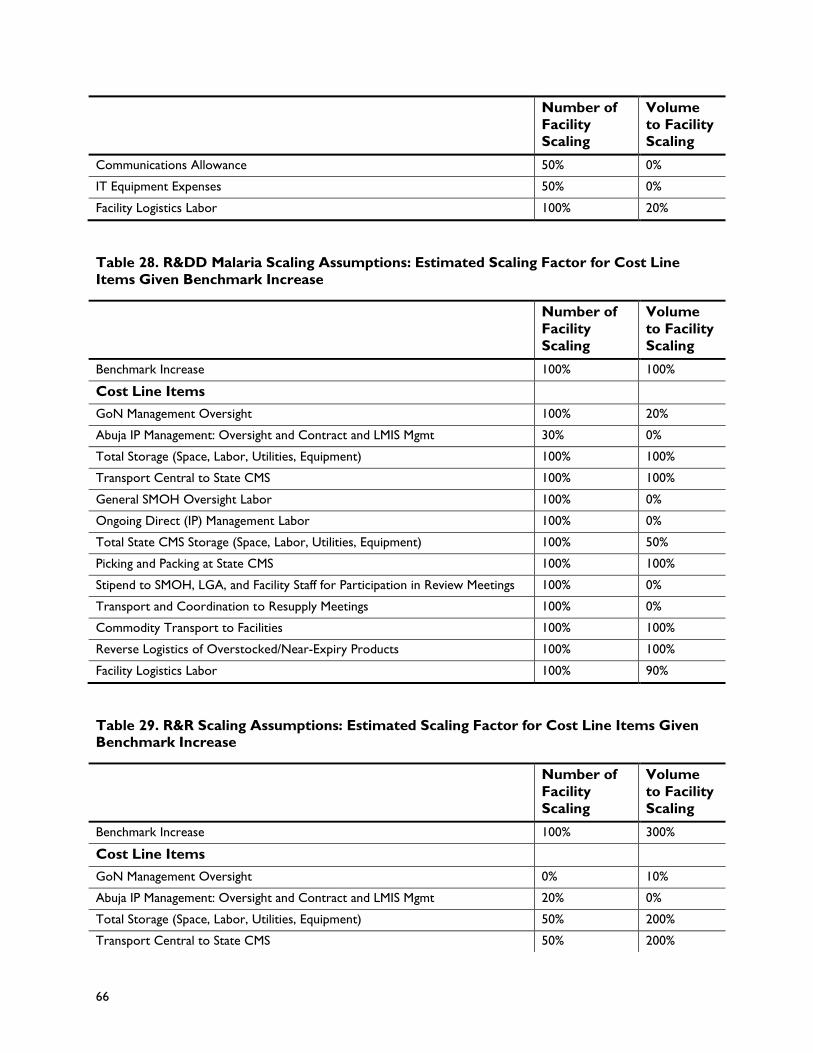
66
Number of
Facility
Scaling
Volume
to Facility
Scaling
Communications Allowance 50% 0%
IT Equipment Expenses 50% 0%
Facility Logistics Labor 100% 20%
Table 28. R&DD Malaria Scaling Assumptions: Estimated Scaling Factor for Cost Line
Items Given Benchmark Increase
Number of
Facility
Scaling
Volume
to Facility
Scaling
Benchmark Increase 100% 100%
Cost Line Items
GoN Management Oversight 100% 20%
Abuja IP Management: Oversight and Contract and LMIS Mgmt 30% 0%
Total Storage (Space, Labor, Utilities, Equipment) 100% 100%
Transport Central to State CMS 100% 100%
General SMOH Oversight Labor 100% 0%
Ongoing Direct (IP) Management Labor 100% 0%
Total State CMS Storage (Space, Labor, Utilities, Equipment) 100% 50%
Picking and Packing at State CMS 100% 100%
Stipend to SMOH, LGA, and Facility Staff for Participation in Review Meetings 100% 0%
Transport and Coordination to Resupply Meetings 100% 0%
Commodity Transport to Facilities 100% 100%
Reverse Logistics of Overstocked/Near-Expiry Products 100% 100%
Facility Logistics Labor 100% 90%
Table 29. R&R Scaling Assumptions: Estimated Scaling Factor for Cost Line Items Given Benchmark Increase
Number of
Facility
Scaling
Volume
to Facility
Scaling
Benchmark Increase 100% 300%
Cost Line Items
GoN Management Oversight 0% 10%
Abuja IP Management: Oversight and Contract and LMIS Mgmt 20% 0%
Total Storage (Space, Labor, Utilities, Equipment) 50% 200%
Transport Central to State CMS 50% 200%
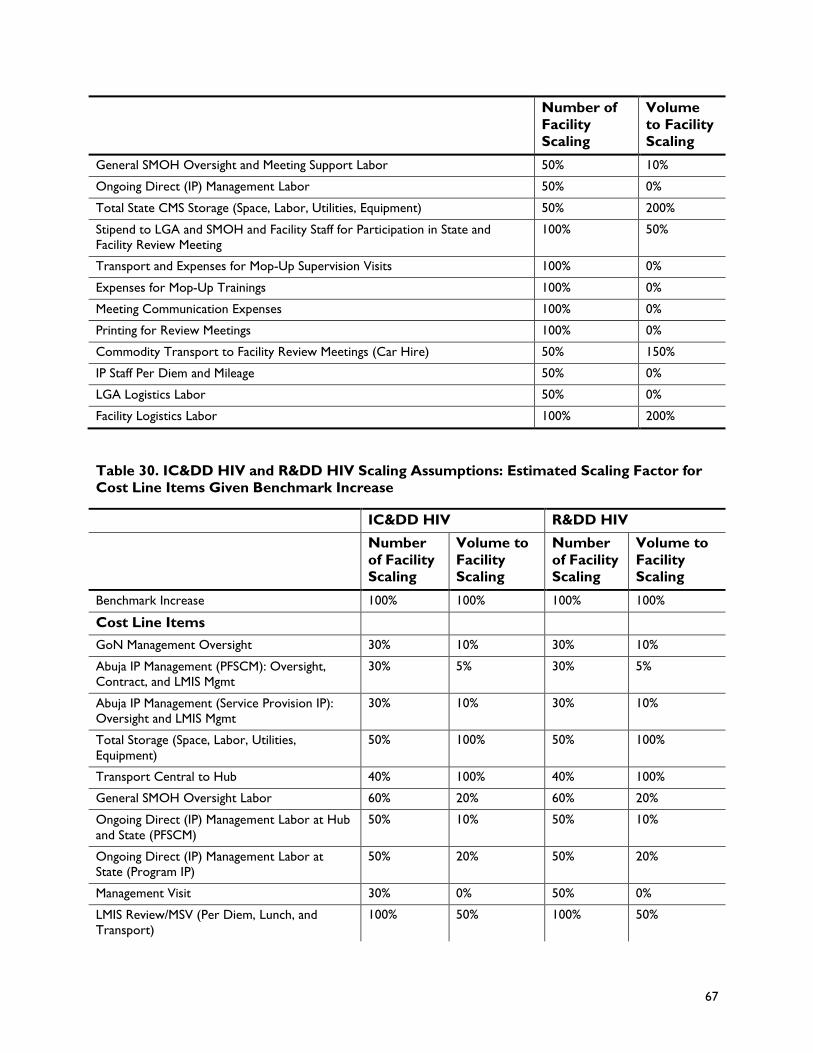
67
Number of
Facility
Scaling
Volume
to Facility
Scaling
General SMOH Oversight and Meeting Support Labor 50% 10%
Ongoing Direct (IP) Management Labor 50% 0%
Total State CMS Storage (Space, Labor, Utilities, Equipment) 50% 200%
Stipend to LGA and SMOH and Facility Staff for Participation in State and
Facility Review Meeting
100% 50%
Transport and Expenses for Mop-Up Supervision Visits 100% 0%
Expenses for Mop-Up Trainings 100% 0%
Meeting Communication Expenses 100% 0%
Printing for Review Meetings 100% 0%
Commodity Transport to Facility Review Meetings (Car Hire) 50% 150%
IP Staff Per Diem and Mileage 50% 0%
LGA Logistics Labor 50% 0%
Facility Logistics Labor 100% 200%
Table 30. IC&DD HIV and R&DD HIV Scaling Assumptions: Estimated Scaling Factor for
Cost Line Items Given Benchmark Increase
IC&DD HIV R&DD HIV
Number
of Facility Scaling
Volume to
Facility Scaling
Number
of Facility Scaling
Volume to
Facility Scaling
Benchmark Increase 100% 100% 100% 100%
Cost Line Items
GoN Management Oversight 30% 10% 30% 10%
Abuja IP Management (PFSCM): Oversight,
Contract, and LMIS Mgmt
30% 5% 30% 5%
Abuja IP Management (Service Provision IP):
Oversight and LMIS Mgmt
30% 10% 30% 10%
Total Storage (Space, Labor, Utilities,
Equipment)
50% 100% 50% 100%
Transport Central to Hub 40% 100% 40% 100%
General SMOH Oversight Labor 60% 20% 60% 20%
Ongoing Direct (IP) Management Labor at Hub
and State (PFSCM)
50% 10% 50% 10%
Ongoing Direct (IP) Management Labor at
State (Program IP)
50% 20% 50% 20%
Management Visit 30% 0% 50% 0%
LMIS Review/MSV (Per Diem, Lunch, and
Transport)
100% 50% 100% 50%
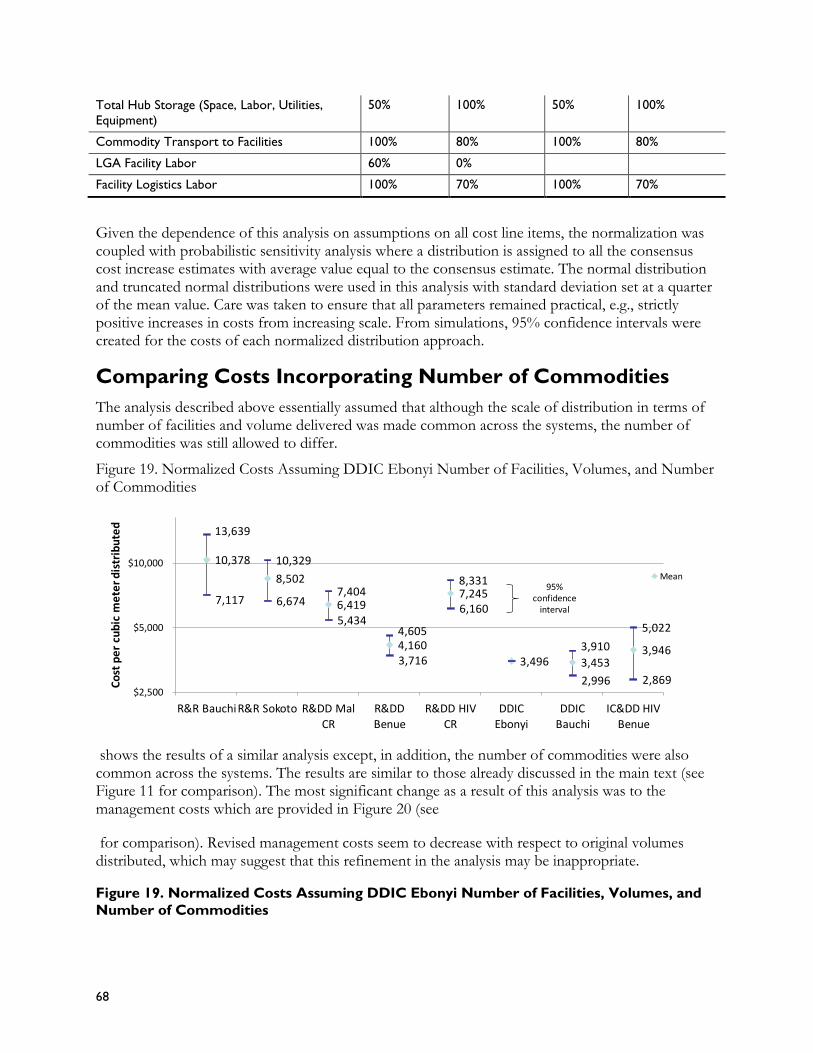
68
Total Hub Storage (Space, Labor, Utilities,
Equipment)
50% 100% 50% 100%
Commodity Transport to Facilities 100% 80% 100% 80%
LGA Facility Labor 60% 0%
Facility Logistics Labor 100% 70% 100% 70%
Given the dependence of this analysis on assumptions on all cost line items, the normalization was coupled with probabilistic sensitivity analysis where a distribution is assigned to all the consensus cost increase estimates with average value equal to the consensus estimate. The normal distribution and truncated normal distributions were used in this analysis with standard deviation set at a quarter of the mean value. Care was taken to ensure that all parameters remained practical, e.g., strictly positive increases in costs from increasing scale. From simulations, 95% confidence intervals were created for the costs of each normalized distribution approach.
Comparing Costs Incorporating Number of Commodities
The analysis described above essentially assumed that although the scale of distribution in terms of number of facilities and volume delivered was made common across the systems, the number of commodities was still allowed to differ.
Figure 19. Normalized Costs Assuming DDIC Ebonyi Number of Facilities, Volumes, and Number of Commodities
shows the results of a similar analysis except, in addition, the number of commodities were also common across the systems. The results are similar to those already discussed in the main text (see Figure 11 for comparison). The most significant change as a result of this analysis was to the management costs which are provided in Figure 20 (see
for comparison). Revised management costs seem to decrease with respect to original volumes distributed, which may suggest that this refinement in the analysis may be inappropriate.
Figure 19. Normalized Costs Assuming DDIC Ebonyi Number of Facilities, Volumes, and
Number of Commodities
13,639
10,329
7,404
4,605
8,331
3,910
5,022
10,378
8,502
6,419
4,160
7,245
3,496 3,4533,946
7,117 6,674
5,434
3,716
6,160
2,996 2,869$2,500
$5,000
$10,000
R&R BauchiR&R Sokoto R&DD Mal
CR
R&DD
Benue
R&DD HIV
CR
DDIC
Ebonyi
DDIC
Bauchi
IC&DD HIV
Benue
Co
st p
er
cub
ic m
ete
r d
istr
ibu
ted
Normalized Distribution Costs Assuming Ebonyi DDIC Network, Volumes and Number of Commodities
Mean95%
confidenceinterval
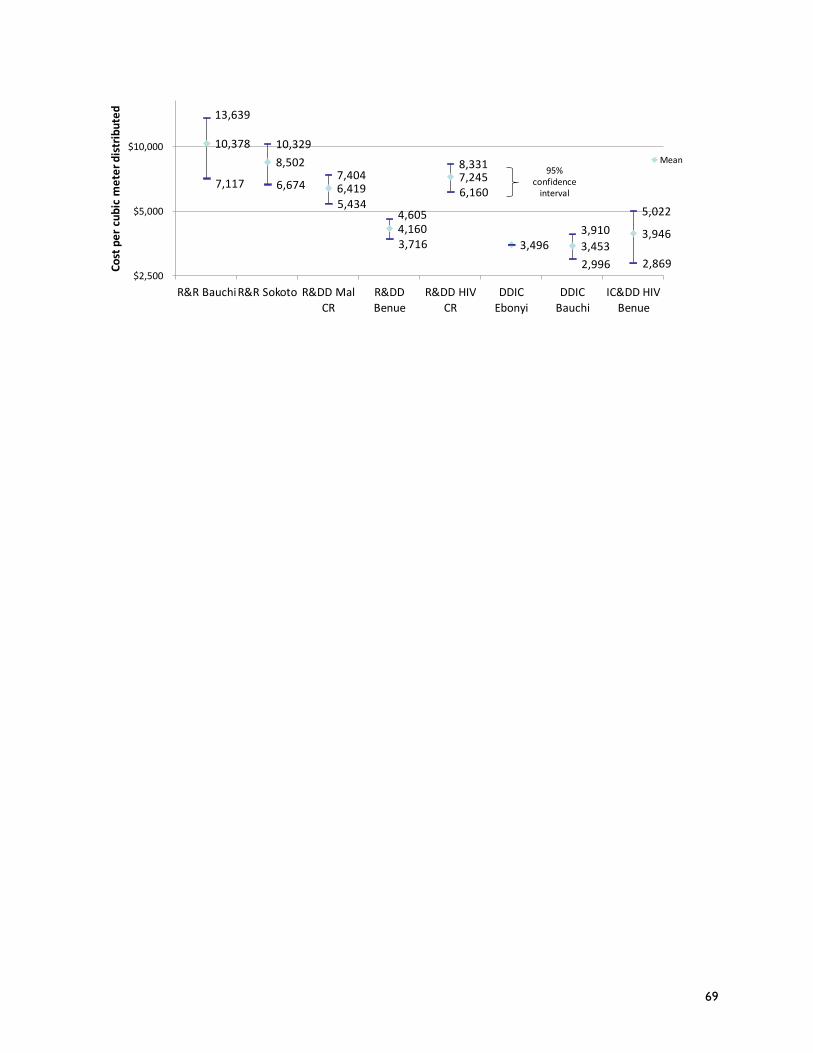
69
13,639
10,329
7,404
4,605
8,331
3,910
5,022
10,378
8,502
6,419
4,160
7,245
3,496 3,4533,946
7,117 6,674
5,434
3,716
6,160
2,996 2,869$2,500
$5,000
$10,000
R&R BauchiR&R Sokoto R&DD Mal
CR
R&DD
Benue
R&DD HIV
CR
DDIC
Ebonyi
DDIC
Bauchi
IC&DD HIV
Benue
Co
st p
er
cub
ic m
ete
r d
istr
ibu
ted
Normalized Distribution Costs Assuming Ebonyi DDIC Network, Volumes and Number of Commodities
Mean95%
confidenceinterval
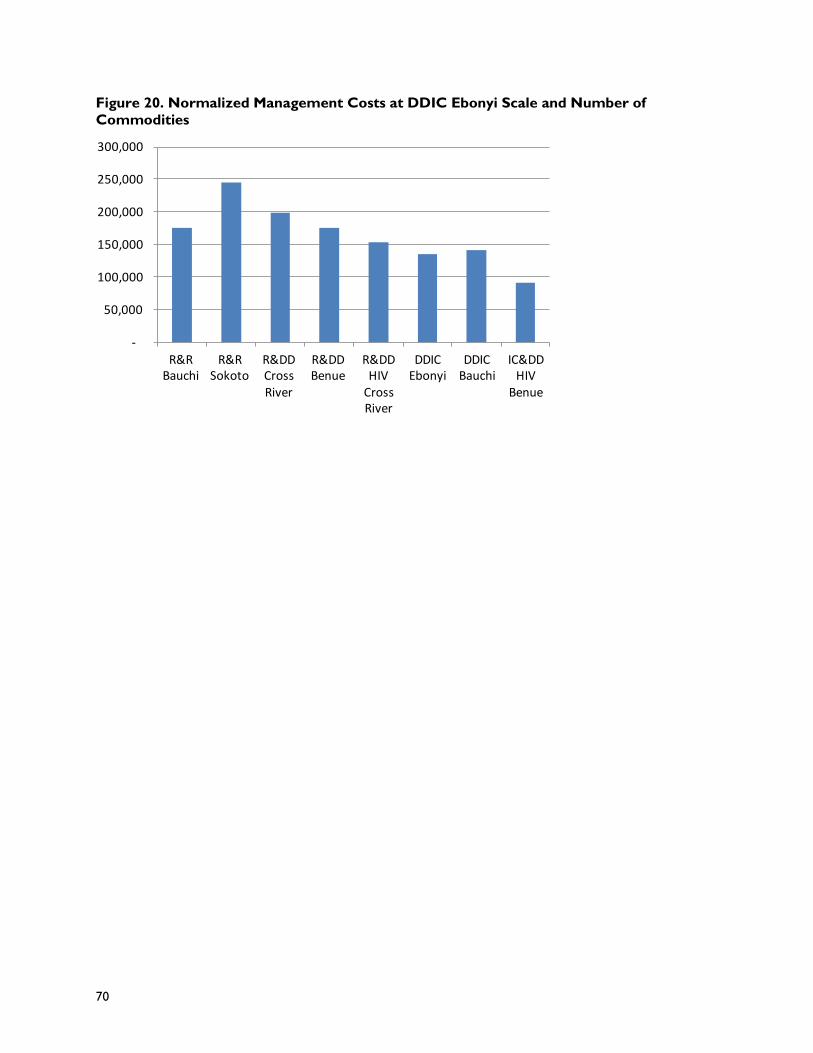
70
Figure 20. Normalized Management Costs at DDIC Ebonyi Scale and Number of
Commodities
-
50,000
100,000
150,000
200,000
250,000
300,000
R&R Bauchi
R&R Sokoto
R&DD Cross River
R&DD Benue
R&DD HIV
Cross River
DDIC Ebonyi
DDIC Bauchi
IC&DD HIV
Benue
Management Costs at Ebonyi Scale and Number of Commodities
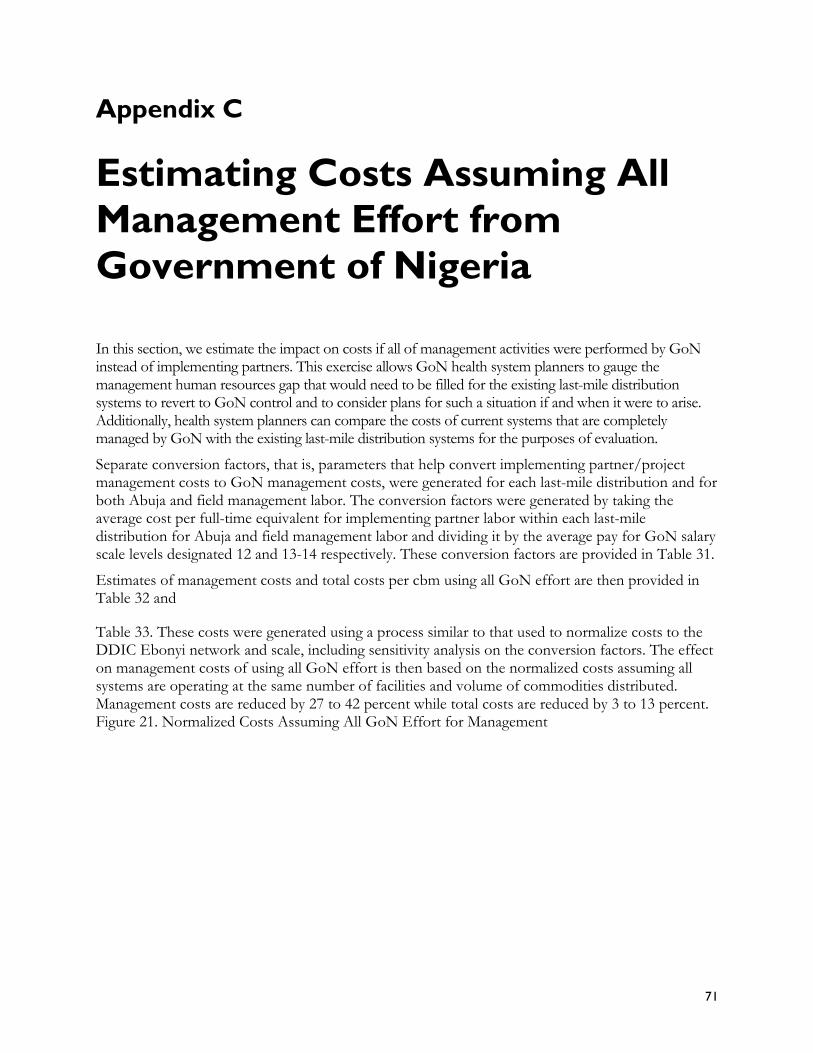
71
Appendix C
Estimating Costs Assuming All
Management Effort from
Government of Nigeria
In this section, we estimate the impact on costs if all of management activities were performed by GoN instead of implementing partners. This exercise allows GoN health system planners to gauge the management human resources gap that would need to be filled for the existing last-mile distribution systems to revert to GoN control and to consider plans for such a situation if and when it were to arise. Additionally, health system planners can compare the costs of current systems that are completely managed by GoN with the existing last-mile distribution systems for the purposes of evaluation.
Separate conversion factors, that is, parameters that help convert implementing partner/project management costs to GoN management costs, were generated for each last-mile distribution and for both Abuja and field management labor. The conversion factors were generated by taking the average cost per full-time equivalent for implementing partner labor within each last-mile distribution for Abuja and field management labor and dividing it by the average pay for GoN salary scale levels designated 12 and 13-14 respectively. These conversion factors are provided in Table 31.
Estimates of management costs and total costs per cbm using all GoN effort are then provided in Table 32 and
Table 33. These costs were generated using a process similar to that used to normalize costs to the DDIC Ebonyi network and scale, including sensitivity analysis on the conversion factors. The effect on management costs of using all GoN effort is then based on the normalized costs assuming all systems are operating at the same number of facilities and volume of commodities distributed. Management costs are reduced by 27 to 42 percent while total costs are reduced by 3 to 13 percent. Figure 21. Normalized Costs Assuming All GoN Effort for Management
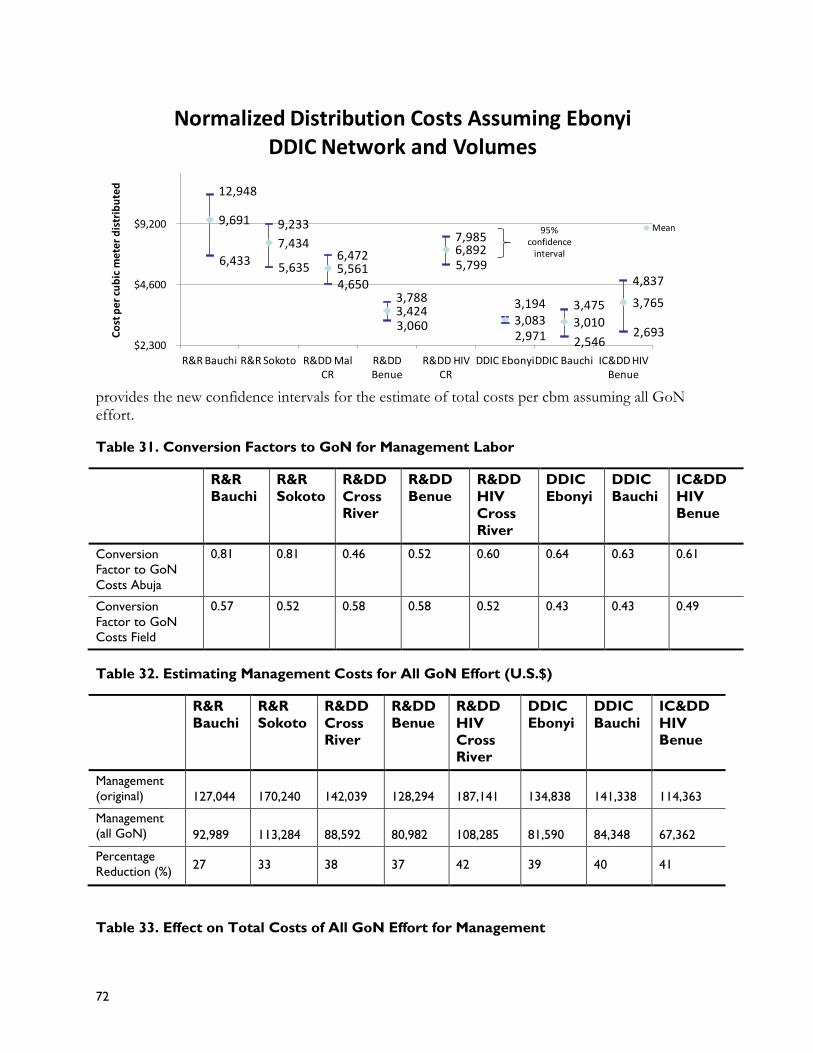
72
provides the new confidence intervals for the estimate of total costs per cbm assuming all GoN effort.
Table 31. Conversion Factors to GoN for Management Labor
R&R
Bauchi
R&R
Sokoto
R&DD
Cross River
R&DD
Benue
R&DD
HIV
Cross
River
DDIC
Ebonyi
DDIC
Bauchi
IC&DD
HIV Benue
Conversion
Factor to GoN
Costs Abuja
0.81 0.81 0.46 0.52 0.60 0.64 0.63 0.61
Conversion
Factor to GoN
Costs Field
0.57 0.52 0.58 0.58 0.52 0.43 0.43 0.49
Table 32. Estimating Management Costs for All GoN Effort (U.S.$)
R&R
Bauchi
R&R
Sokoto
R&DD
Cross River
R&DD
Benue
R&DD
HIV
Cross River
DDIC
Ebonyi
DDIC
Bauchi
IC&DD
HIV Benue
Management
(original) 127,044 170,240 142,039 128,294 187,141 134,838 141,338 114,363
Management
(all GoN) 92,989 113,284 88,592 80,982 108,285 81,590 84,348 67,362
Percentage
Reduction (%) 27 33 38 37 42 39 40 41
Table 33. Effect on Total Costs of All GoN Effort for Management
12,948
9,233
6,472
3,788
7,985
3,194 3,475
4,837
9,691
7,434
5,561
3,424
6,892
3,083 3,010
3,765
6,4335,635
4,650
3,060
5,799
2,971 2,5462,693
$2,300
$4,600
$9,200
R&R Bauchi R&R Sokoto R&DD Mal CR
R&DD Benue
R&DD HIV CR
DDIC EbonyiDDIC Bauchi IC&DD HIV Benue
Co
st p
er c
ub
ic m
ete
r d
istr
ibu
ted
Normalized Distribution Costs Assuming EbonyiDDIC Network and Volumes
Mean95% confidence
interval
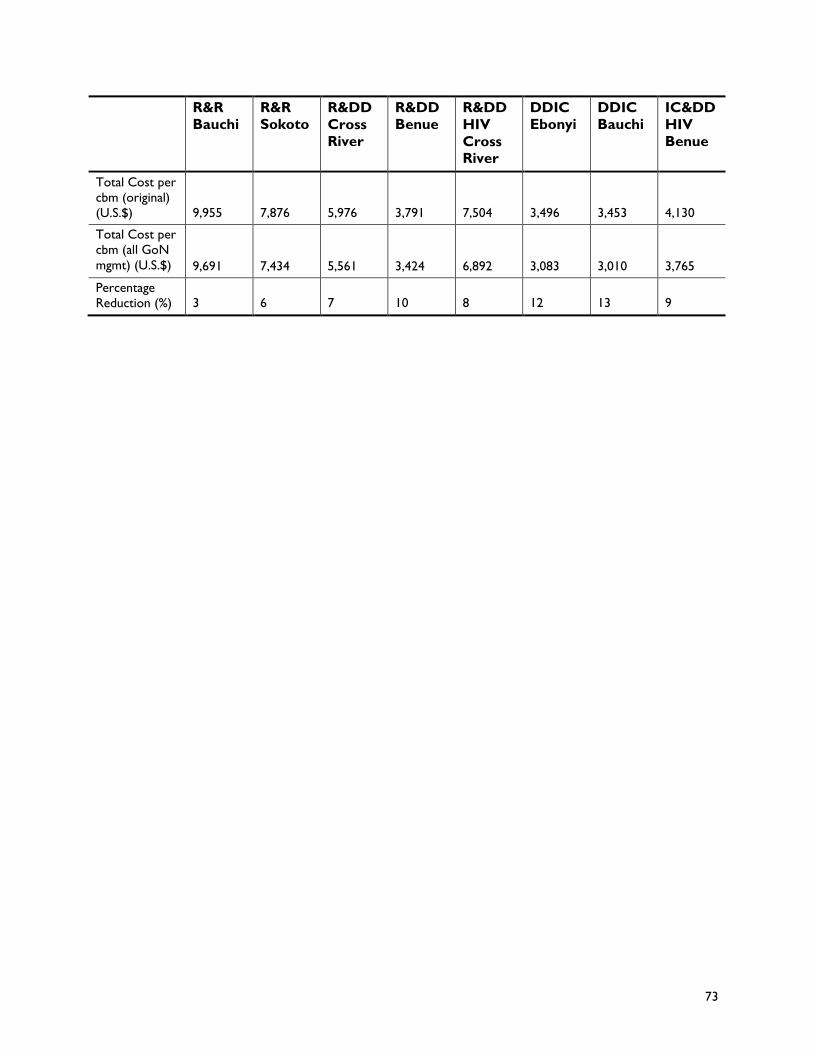
73
R&R Bauchi
R&R Sokoto
R&DD
Cross
River
R&DD Benue
R&DD
HIV
Cross River
DDIC Ebonyi
DDIC Bauchi
IC&DD
HIV
Benue
Total Cost per
cbm (original)
(U.S.$) 9,955 7,876 5,976 3,791 7,504 3,496 3,453 4,130
Total Cost per
cbm (all GoN
mgmt) (U.S.$) 9,691 7,434 5,561 3,424 6,892 3,083 3,010 3,765
Percentage
Reduction (%) 3 6 7 10 8 12 13 9
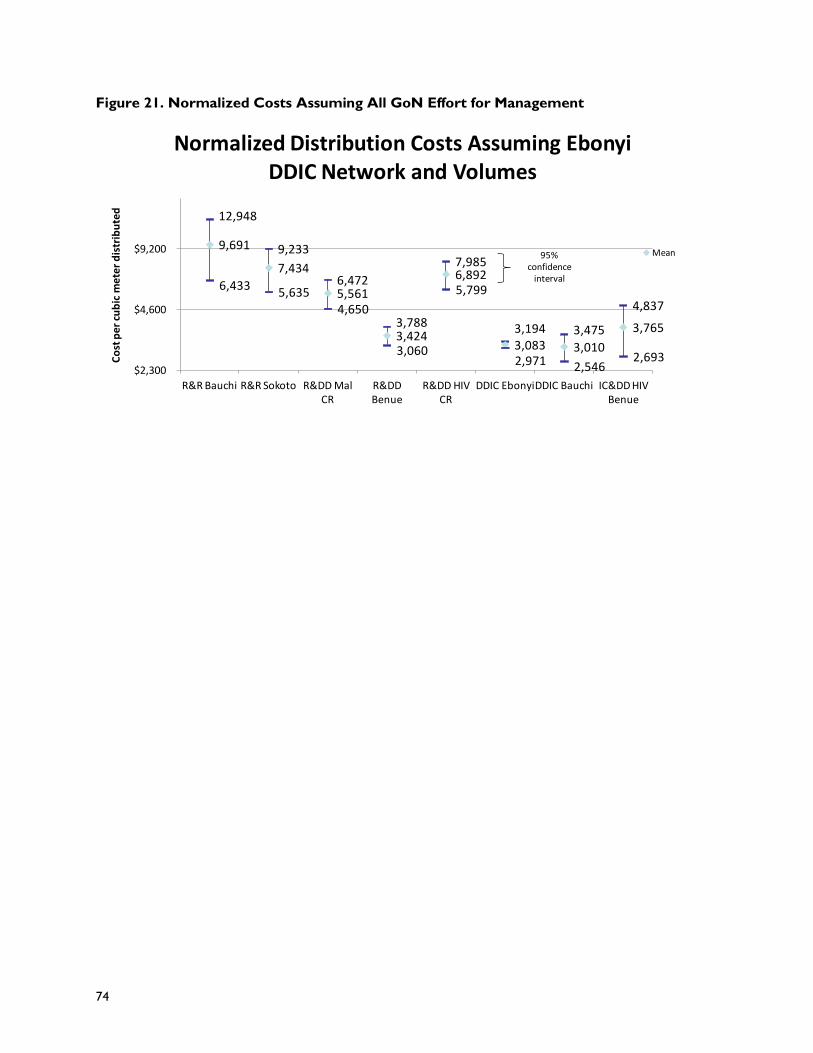
74
Figure 21. Normalized Costs Assuming All GoN Effort for Management
12,948
9,233
6,472
3,788
7,985
3,194 3,475
4,837
9,691
7,434
5,561
3,424
6,892
3,083 3,010
3,765
6,4335,635
4,650
3,060
5,799
2,971 2,5462,693
$2,300
$4,600
$9,200
R&R Bauchi R&R Sokoto R&DD Mal CR
R&DD Benue
R&DD HIV CR
DDIC EbonyiDDIC Bauchi IC&DD HIV Benue
Co
st p
er c
ub
ic m
ete
r d
istr
ibu
ted
Normalized Distribution Costs Assuming EbonyiDDIC Network and Volumes
Mean95% confidence
interval

75
76
Appendix D
Scalability of Last-Mile
Distribution Systems
The need for the analysis covered in this appendix proceeded from a desire to look beyond how systems such as DDIC, R&R, and R&DD are currently operating and consider the implications of asking these systems to do more, that is, consider their scalability. Here we describe a framework for thinking about scalability, then attempt to realize this framework through some cost modeling, and then produce results with respect to the scalability of different last-mile systems.
Framework for Scalability
In analyzing scalability, our framework incorporates the following dimensions: 1) the ease of adding additional volume to be distributed to each facility, 2) the ease of adding more facilities to the system, and then 3) the ease of adoption in other regions. This last dimension is particularly important in Nigeria. Within each dimension of scalability, there are different components that would contribute to this idea of the ease of scaling up (see Figure 22). For example, with respect to the ease of adding volume, the impact on the complexity of operations and the impact of the increase in cost of operation of adding similar or different commodities should be considered in evaluating the ease of this type of scale-up. The security of this additional volume could also be a factor.
For the ease of adding facilities, factors that should be considered include the training required of staff at facilities, the increase in complexity of operations, and the increase in costs of operations. Additional factors that can also be considered include the cost impact of poor road infrastructure and of changes to the density of facilities whether resulting from additional rural facilities or urban facilities.
Finally for the ease of adoption in different regions, additional factors that can be considered include advocacy costs, overall start-up costs, and cost impact of poor transportation resources and of higher cost of resources.
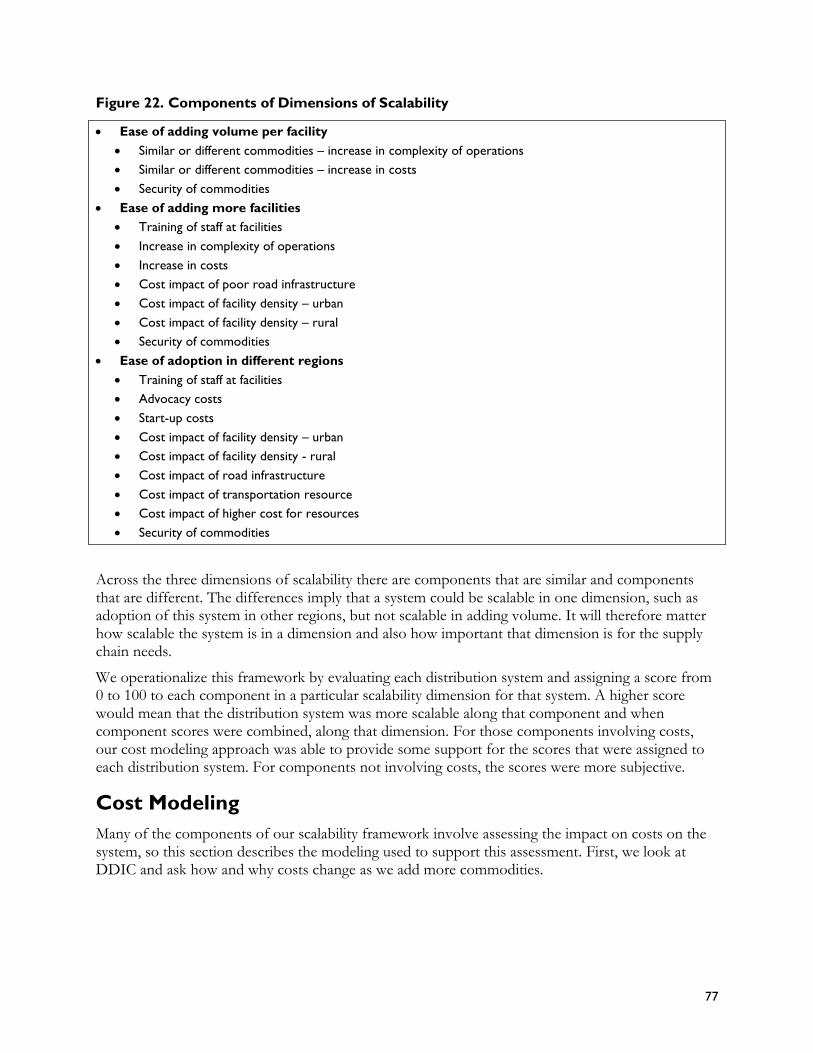
77
Figure 22. Components of Dimensions of Scalability
Ease of adding volume per facility
Similar or different commodities – increase in complexity of operations
Similar or different commodities – increase in costs
Security of commodities
Ease of adding more facilities
Training of staff at facilities
Increase in complexity of operations
Increase in costs
Cost impact of poor road infrastructure
Cost impact of facility density – urban
Cost impact of facility density – rural
Security of commodities
Ease of adoption in different regions
Training of staff at facilities
Advocacy costs
Start-up costs
Cost impact of facility density – urban
Cost impact of facility density - rural
Cost impact of road infrastructure
Cost impact of transportation resource
Cost impact of higher cost for resources
Security of commodities
Across the three dimensions of scalability there are components that are similar and components that are different. The differences imply that a system could be scalable in one dimension, such as adoption of this system in other regions, but not scalable in adding volume. It will therefore matter how scalable the system is in a dimension and also how important that dimension is for the supply chain needs.
We operationalize this framework by evaluating each distribution system and assigning a score from 0 to 100 to each component in a particular scalability dimension for that system. A higher score would mean that the distribution system was more scalable along that component and when component scores were combined, along that dimension. For those components involving costs, our cost modeling approach was able to provide some support for the scores that were assigned to each distribution system. For components not involving costs, the scores were more subjective.
Cost Modeling
Many of the components of our scalability framework involve assessing the impact on costs on the system, so this section describes the modeling used to support this assessment. First, we look at DDIC and ask how and why costs change as we add more commodities.
78
DDIC Model Setup
We assume a network of facilities similar to that of Ebonyi, with 205 facilities and similar average interfacility distances and average distance from the state medical store. For transportation we initially focused on 2 options: 1) 3PL at a cost of U.S.$696 per cbm1 and 2) simulated 3PL assuming public health sector–owned transportation resources but with markup. Health sector–owned transportation was used, since we did not have information about how 3PL quotes for distribution as the systems were asked to carry increasing volumes of commodities or deliver to increasing numbers of facilities. We assumed 6 delivery sessions in a year, with routes lasting at most 4 days of 12 hours each, referred to as a 4-day plan. Additional costs modeled include facility labor costs and non-facility labor and allowances for information capture and inventory delivery. Management costs and distribution costs in the upper tiers of the supply chain were not modeled to allow for focus. There is evidence that management costs across last-mile systems are similar, and we essentially assume that the unmodeled upper-tiers supply chain was the same for each last-mile system.
Simulated 3PL costs included fuel costs, depreciation, maintenance, breakdown, driver salaries, and driver stipends used to cover transportation. Non-facility labor and allowances for information capture covered labor costs and stipends for team leaders (conveyors and LGA or/and SMOH officials who supported information collection and delivery for other last-mile distribution systems) and communication costs.
The modeling was done using software developed using Excel for modeling supply chain costs by MIT-Zaragoza as part of a U.K. Department for International Development project meant to make such software publicly available (MIT Zaragoza, Transaid, and VillageReach, 2011).
Table 34 captures additional information about assumptions used in the model. Specifically, we assume about 3 minutes per commodity spent at each facility by team leader; an annual volume per commodity of 0.03 cbm; delivery labor costs of 9,600 NGN per day; and annual cost of facility labor per cbm of 125,986 NGN. We also assume that some of the truck volume (25 percent) has to be set aside for safety stock and to organizing the truck as the number of commodities increase. For our simulated 3PL costs, we assume—
driver salary of 2,500 NGN per day
maintenance cost per km and breakdown cost per km of 16 NGN and 0.88 NGN respectively
insurance per year at about 5 percent of original value of vehicle
an artificial logistics markup of 70 percent, which equated the simulated 3PL costs with the quoted rate for Ebonyi’s distribution volume
average speed of transport and fuel efficiency of 40 km per hour and 6.5 km per liter respectively
a depreciation cost per km assuming a 150,000 mile useful life
1 Original quote from 3PL for service in Ebonyi for 20 commodities for distribution for 1 year.
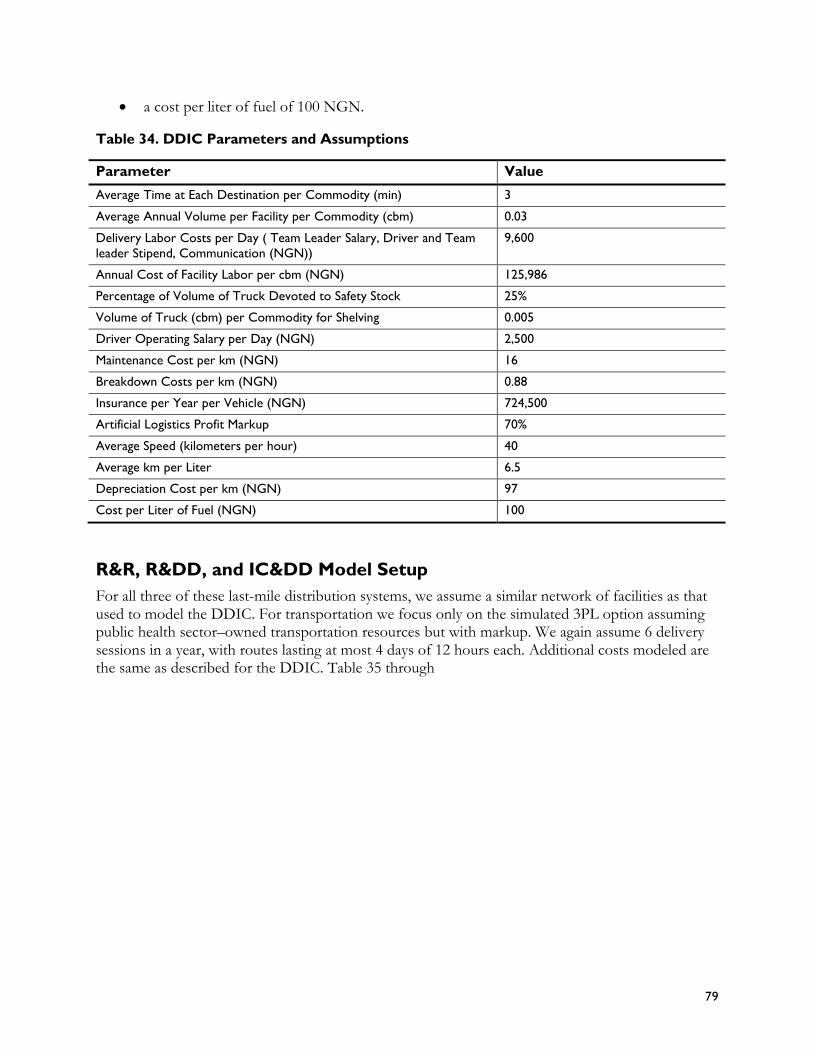
79
a cost per liter of fuel of 100 NGN.
Table 34. DDIC Parameters and Assumptions
Parameter Value
Average Time at Each Destination per Commodity (min) 3
Average Annual Volume per Facility per Commodity (cbm) 0.03
Delivery Labor Costs per Day ( Team Leader Salary, Driver and Team
leader Stipend, Communication (NGN))
9,600
Annual Cost of Facility Labor per cbm (NGN) 125,986
Percentage of Volume of Truck Devoted to Safety Stock 25%
Volume of Truck (cbm) per Commodity for Shelving 0.005
Driver Operating Salary per Day (NGN) 2,500
Maintenance Cost per km (NGN) 16
Breakdown Costs per km (NGN) 0.88
Insurance per Year per Vehicle (NGN) 724,500
Artificial Logistics Profit Markup 70%
Average Speed (kilometers per hour) 40
Average km per Liter 6.5
Depreciation Cost per km (NGN) 97
Cost per Liter of Fuel (NGN) 100
R&R, R&DD, and IC&DD Model Setup
For all three of these last-mile distribution systems, we assume a similar network of facilities as that used to model the DDIC. For transportation we focus only on the simulated 3PL option assuming public health sector–owned transportation resources but with markup. We again assume 6 delivery sessions in a year, with routes lasting at most 4 days of 12 hours each. Additional costs modeled are the same as described for the DDIC. Table 35 through
80
Table 38 capture additional information about assumptions and parameters used in the R&R, R&DD, and IC&DD (information capture and direct delivery) models respectively.
For R&R, some assumptions include that the maximum volume per facility per review meeting is 0.3 cbm, review meetings have maximum length of 4 hours, and the average time per facility per commodity is 3 minutes. These assumptions mean that review meetings have a limit on the number of facilities and number of commodities that can be processed at a review meeting. Stipends are provided for facility workers of 2,500 NGN and for non-facility review meeting labor of 9,000 NGN. Facility labor costs per cbm are 867,454 NGN. The delivery truck used for delivery to the review meetings is smaller, so the driver’s salary is lower and the vehicle moves faster.
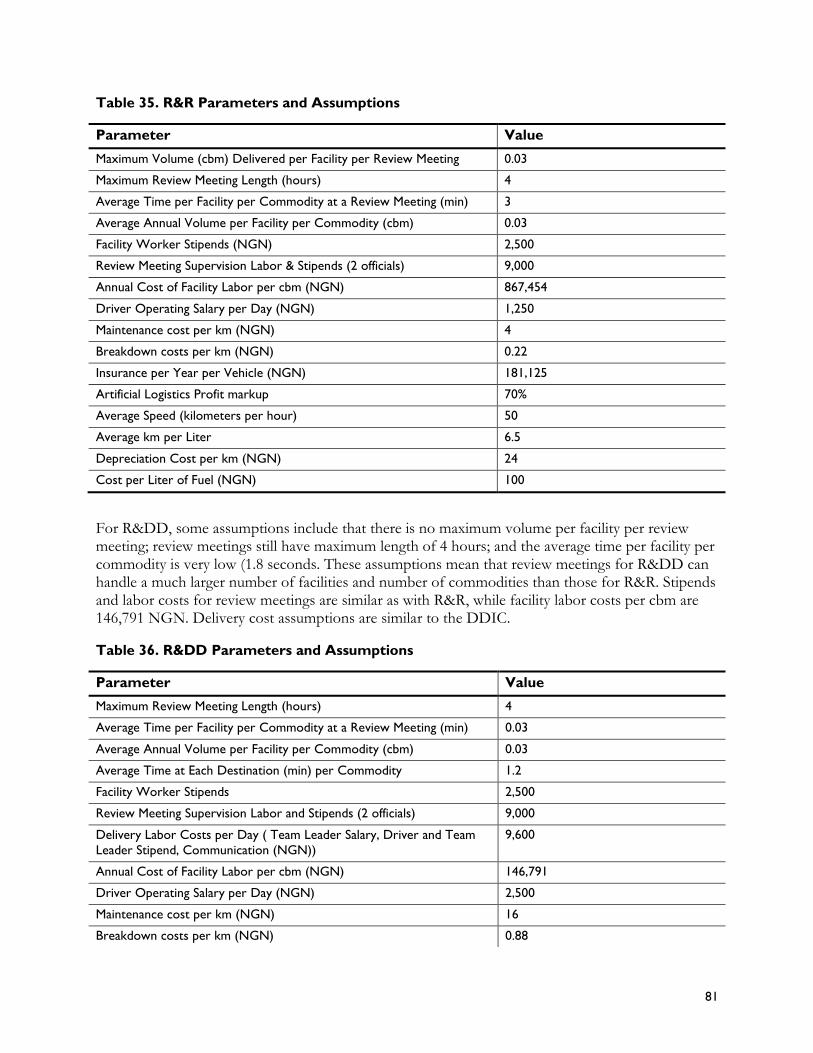
81
Table 35. R&R Parameters and Assumptions
Parameter Value
Maximum Volume (cbm) Delivered per Facility per Review Meeting 0.03
Maximum Review Meeting Length (hours) 4
Average Time per Facility per Commodity at a Review Meeting (min) 3
Average Annual Volume per Facility per Commodity (cbm) 0.03
Facility Worker Stipends (NGN) 2,500
Review Meeting Supervision Labor & Stipends (2 officials) 9,000
Annual Cost of Facility Labor per cbm (NGN) 867,454
Driver Operating Salary per Day (NGN) 1,250
Maintenance cost per km (NGN) 4
Breakdown costs per km (NGN) 0.22
Insurance per Year per Vehicle (NGN) 181,125
Artificial Logistics Profit markup 70%
Average Speed (kilometers per hour) 50
Average km per Liter 6.5
Depreciation Cost per km (NGN) 24
Cost per Liter of Fuel (NGN) 100
For R&DD, some assumptions include that there is no maximum volume per facility per review meeting; review meetings still have maximum length of 4 hours; and the average time per facility per commodity is very low (1.8 seconds. These assumptions mean that review meetings for R&DD can handle a much larger number of facilities and number of commodities than those for R&R. Stipends and labor costs for review meetings are similar as with R&R, while facility labor costs per cbm are 146,791 NGN. Delivery cost assumptions are similar to the DDIC.
Table 36. R&DD Parameters and Assumptions
Parameter Value
Maximum Review Meeting Length (hours) 4
Average Time per Facility per Commodity at a Review Meeting (min) 0.03
Average Annual Volume per Facility per Commodity (cbm) 0.03
Average Time at Each Destination (min) per Commodity 1.2
Facility Worker Stipends 2,500
Review Meeting Supervision Labor and Stipends (2 officials) 9,000
Delivery Labor Costs per Day ( Team Leader Salary, Driver and Team
Leader Stipend, Communication (NGN))
9,600
Annual Cost of Facility Labor per cbm (NGN) 146,791
Driver Operating Salary per Day (NGN) 2,500
Maintenance cost per km (NGN) 16
Breakdown costs per km (NGN) 0.88
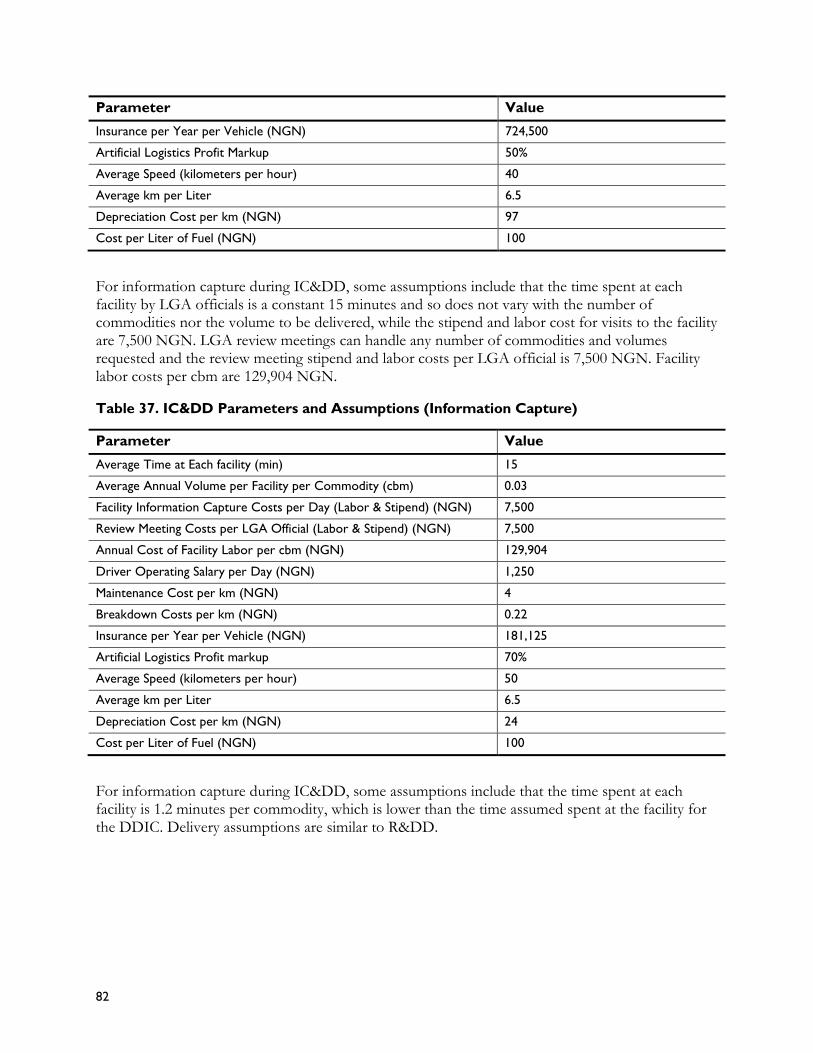
82
Parameter Value
Insurance per Year per Vehicle (NGN) 724,500
Artificial Logistics Profit Markup 50%
Average Speed (kilometers per hour) 40
Average km per Liter 6.5
Depreciation Cost per km (NGN) 97
Cost per Liter of Fuel (NGN) 100
For information capture during IC&DD, some assumptions include that the time spent at each facility by LGA officials is a constant 15 minutes and so does not vary with the number of commodities nor the volume to be delivered, while the stipend and labor cost for visits to the facility are 7,500 NGN. LGA review meetings can handle any number of commodities and volumes requested and the review meeting stipend and labor costs per LGA official is 7,500 NGN. Facility labor costs per cbm are 129,904 NGN.
Table 37. IC&DD Parameters and Assumptions (Information Capture)
Parameter Value
Average Time at Each facility (min) 15
Average Annual Volume per Facility per Commodity (cbm) 0.03
Facility Information Capture Costs per Day (Labor & Stipend) (NGN) 7,500
Review Meeting Costs per LGA Official (Labor & Stipend) (NGN) 7,500
Annual Cost of Facility Labor per cbm (NGN) 129,904
Driver Operating Salary per Day (NGN) 1,250
Maintenance Cost per km (NGN) 4
Breakdown Costs per km (NGN) 0.22
Insurance per Year per Vehicle (NGN) 181,125
Artificial Logistics Profit markup 70%
Average Speed (kilometers per hour) 50
Average km per Liter 6.5
Depreciation Cost per km (NGN) 24
Cost per Liter of Fuel (NGN) 100
For information capture during IC&DD, some assumptions include that the time spent at each facility is 1.2 minutes per commodity, which is lower than the time assumed spent at the facility for the DDIC. Delivery assumptions are similar to R&DD.
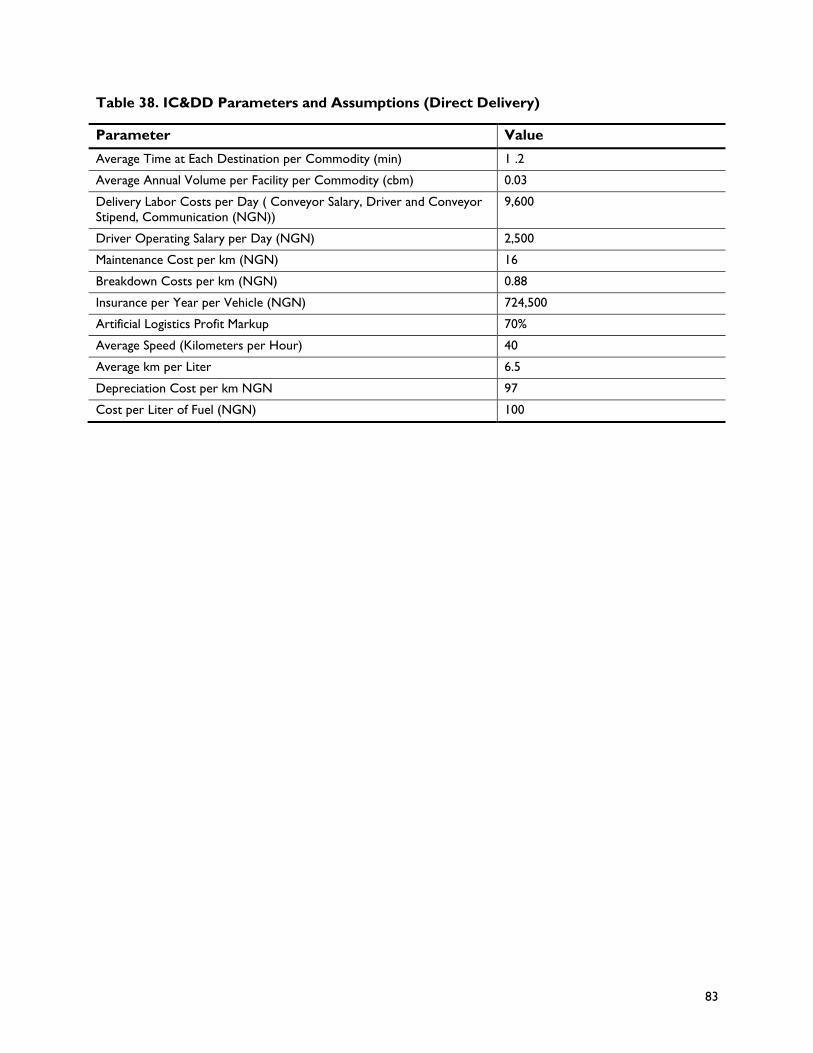
83
Table 38. IC&DD Parameters and Assumptions (Direct Delivery)
Parameter Value
Average Time at Each Destination per Commodity (min) 1 .2
Average Annual Volume per Facility per Commodity (cbm) 0.03
Delivery Labor Costs per Day ( Conveyor Salary, Driver and Conveyor
Stipend, Communication (NGN))
9,600
Driver Operating Salary per Day (NGN) 2,500
Maintenance Cost per km (NGN) 16
Breakdown Costs per km (NGN) 0.88
Insurance per Year per Vehicle (NGN) 724,500
Artificial Logistics Profit Markup 70%
Average Speed (Kilometers per Hour) 40
Average km per Liter 6.5
Depreciation Cost per km NGN 97
Cost per Liter of Fuel (NGN) 100
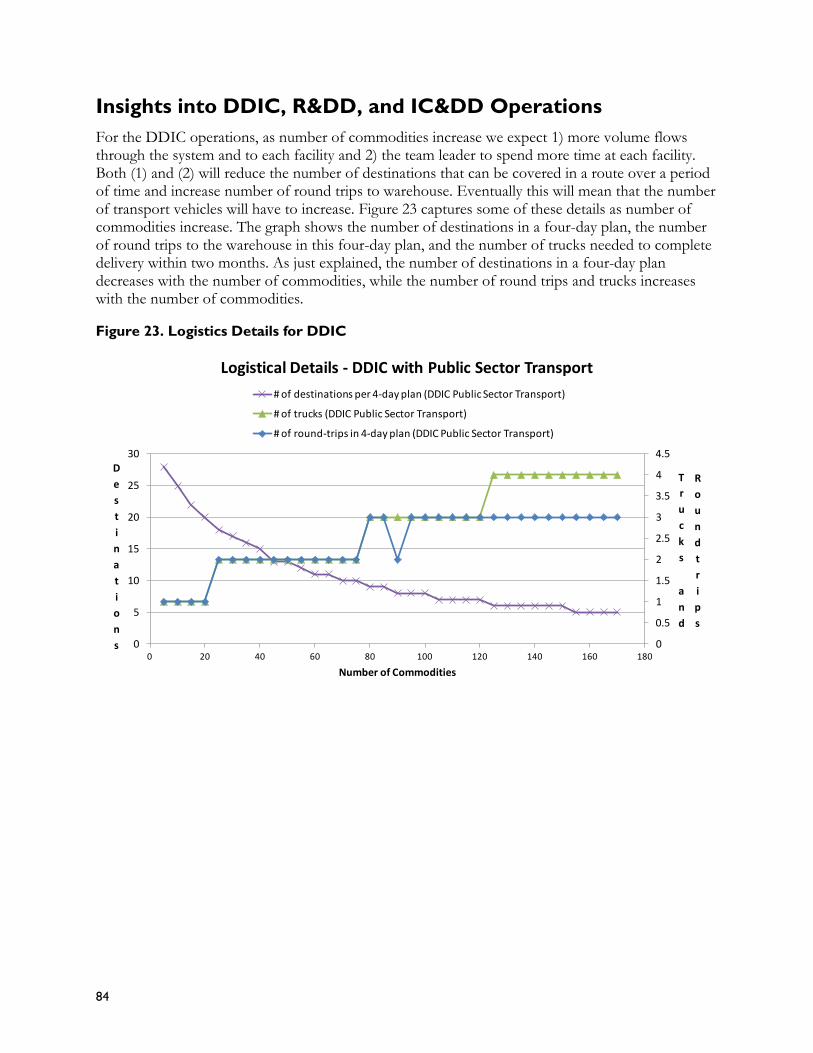
84
Insights into DDIC, R&DD, and IC&DD Operations
For the DDIC operations, as number of commodities increase we expect 1) more volume flows through the system and to each facility and 2) the team leader to spend more time at each facility. Both (1) and (2) will reduce the number of destinations that can be covered in a route over a period of time and increase number of round trips to warehouse. Eventually this will mean that the number of transport vehicles will have to increase. Figure 23 captures some of these details as number of commodities increase. The graph shows the number of destinations in a four-day plan, the number of round trips to the warehouse in this four-day plan, and the number of trucks needed to complete delivery within two months. As just explained, the number of destinations in a four-day plan decreases with the number of commodities, while the number of round trips and trucks increases with the number of commodities.
Figure 23. Logistics Details for DDIC
0
0.5
1
1.5
2
2.5
3
3.5
4
4.5
0
5
10
15
20
25
30
0 20 40 60 80 100 120 140 160 180
T
r
u
c
k
s
a
n
d
R
o
u
n
d
t
r
i
p
s
D
e
s
t
i
n
a
t
i
o
n
s
Number of Commodities
Logistical Details - DDIC with Public Sector Transport
# of destinations per 4-day plan (DDIC Public Sector Transport)
# of trucks (DDIC Public Sector Transport)
# of round-trips in 4-day plan (DDIC Public Sector Transport)
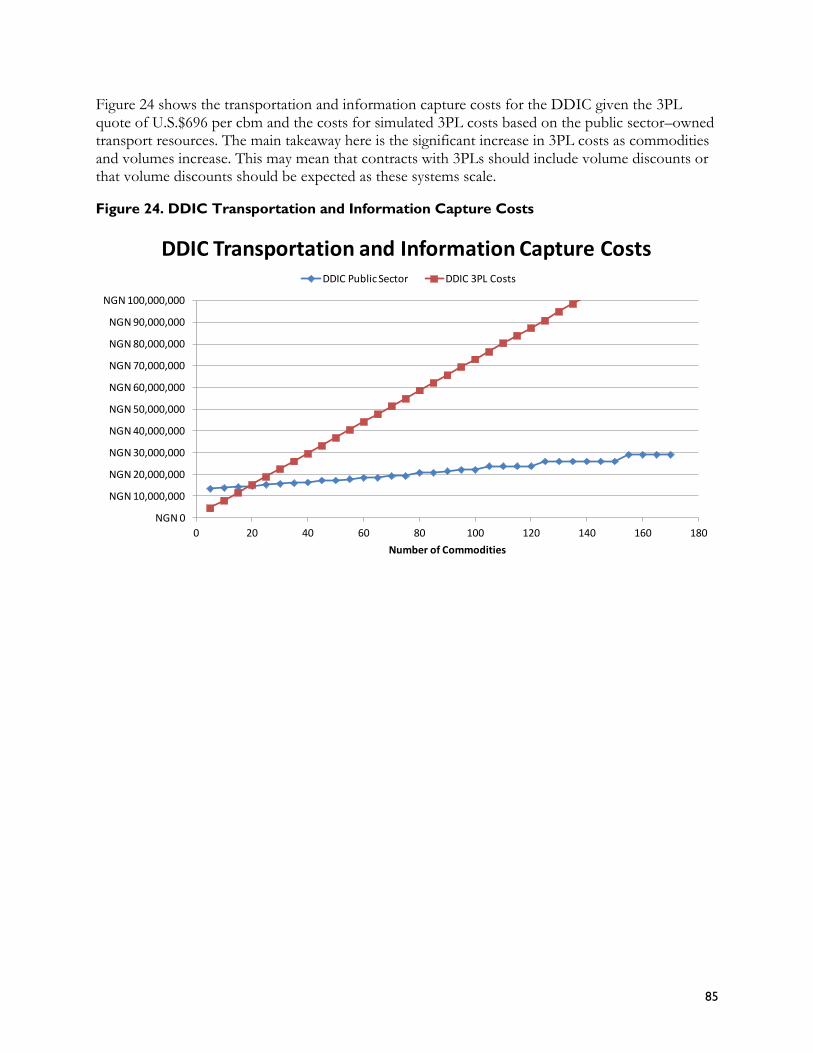
85
Figure 24 shows the transportation and information capture costs for the DDIC given the 3PL quote of U.S.$696 per cbm and the costs for simulated 3PL costs based on the public sector–owned transport resources. The main takeaway here is the significant increase in 3PL costs as commodities and volumes increase. This may mean that contracts with 3PLs should include volume discounts or that volume discounts should be expected as these systems scale.
Figure 24. DDIC Transportation and Information Capture Costs
NGN 0
NGN 10,000,000
NGN 20,000,000
NGN 30,000,000
NGN 40,000,000
NGN 50,000,000
NGN 60,000,000
NGN 70,000,000
NGN 80,000,000
NGN 90,000,000
NGN 100,000,000
0 20 40 60 80 100 120 140 160 180
Number of Commodities
DDIC Transportation and Information Capture CostsDDIC Public Sector DDIC 3PL Costs
86
Similar to DDIC, as commodities increase for R&DD and IC&DD we expect 1) more volume flows through the system and to each facility and 2) the length of the visit at each facility for delivery to increase. As with DDIC, this would reduce the number of destinations that could be covered in a route over a specified period of time and increase the number of round trips to warehouse. Eventually the number of transport vehicles would increase as well. Figure 25 compares the number of trucks needed by the DDIC versus the R&DD and the IC&DD as the number of commodities increases from 5 to 180, while
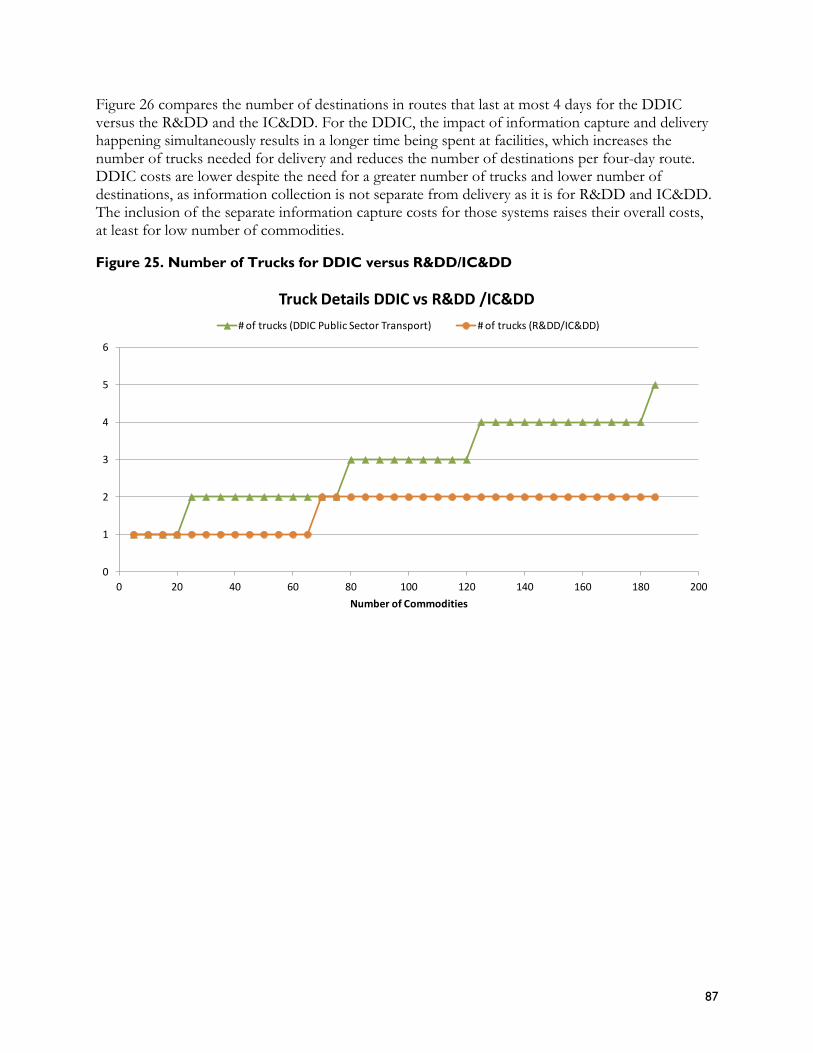
87
Figure 26 compares the number of destinations in routes that last at most 4 days for the DDIC versus the R&DD and the IC&DD. For the DDIC, the impact of information capture and delivery happening simultaneously results in a longer time being spent at facilities, which increases the number of trucks needed for delivery and reduces the number of destinations per four-day route. DDIC costs are lower despite the need for a greater number of trucks and lower number of destinations, as information collection is not separate from delivery as it is for R&DD and IC&DD. The inclusion of the separate information capture costs for those systems raises their overall costs, at least for low number of commodities.
Figure 25. Number of Trucks for DDIC versus R&DD/IC&DD
0
1
2
3
4
5
6
0 20 40 60 80 100 120 140 160 180 200
Number of Commodities
Truck Details DDIC vs R&DD /IC&DD
# of trucks (DDIC Public Sector Transport) # of trucks (R&DD/IC&DD)
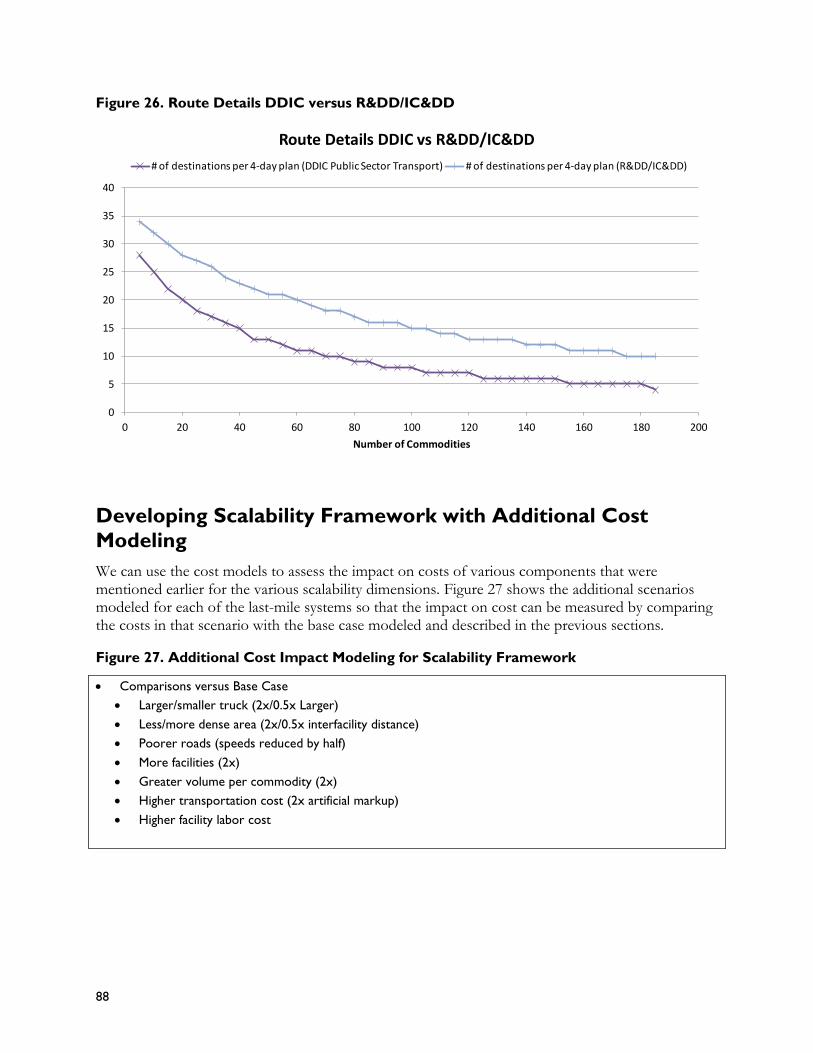
88
Figure 26. Route Details DDIC versus R&DD/IC&DD
Developing Scalability Framework with Additional Cost
Modeling
We can use the cost models to assess the impact on costs of various components that were mentioned earlier for the various scalability dimensions. Figure 27 shows the additional scenarios modeled for each of the last-mile systems so that the impact on cost can be measured by comparing the costs in that scenario with the base case modeled and described in the previous sections.
Figure 27. Additional Cost Impact Modeling for Scalability Framework
Comparisons versus Base Case
Larger/smaller truck (2x/0.5x Larger)
Less/more dense area (2x/0.5x interfacility distance)
Poorer roads (speeds reduced by half)
More facilities (2x)
Greater volume per commodity (2x)
Higher transportation cost (2x artificial markup)
Higher facility labor cost
0
5
10
15
20
25
30
35
40
0 20 40 60 80 100 120 140 160 180 200
Number of Commodities
Route Details DDIC vs R&DD/IC&DD
# of destinations per 4-day plan (DDIC Public Sector Transport) # of destinations per 4-day plan (R&DD/IC&DD)
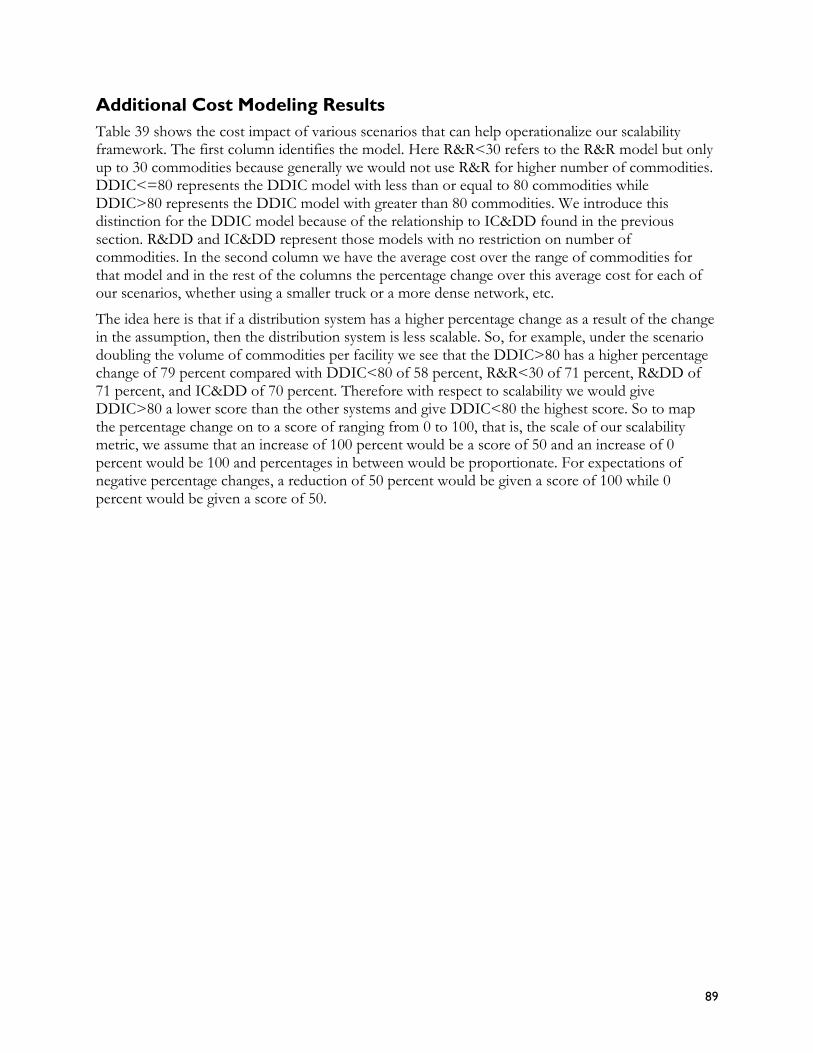
89
Additional Cost Modeling Results
Table 39 shows the cost impact of various scenarios that can help operationalize our scalability framework. The first column identifies the model. Here R&R<30 refers to the R&R model but only up to 30 commodities because generally we would not use R&R for higher number of commodities. DDIC<=80 represents the DDIC model with less than or equal to 80 commodities while DDIC>80 represents the DDIC model with greater than 80 commodities. We introduce this distinction for the DDIC model because of the relationship to IC&DD found in the previous section. R&DD and IC&DD represent those models with no restriction on number of commodities. In the second column we have the average cost over the range of commodities for that model and in the rest of the columns the percentage change over this average cost for each of our scenarios, whether using a smaller truck or a more dense network, etc.
The idea here is that if a distribution system has a higher percentage change as a result of the change in the assumption, then the distribution system is less scalable. So, for example, under the scenario doubling the volume of commodities per facility we see that the DDIC>80 has a higher percentage change of 79 percent compared with DDIC<80 of 58 percent, R&R<30 of 71 percent, R&DD of 71 percent, and IC&DD of 70 percent. Therefore with respect to scalability we would give DDIC>80 a lower score than the other systems and give DDIC<80 the highest score. So to map the percentage change on to a score of ranging from 0 to 100, that is, the scale of our scalability metric, we assume that an increase of 100 percent would be a score of 50 and an increase of 0 percent would be 100 and percentages in between would be proportionate. For expectations of negative percentage changes, a reduction of 50 percent would be given a score of 100 while 0 percent would be given a score of 50.
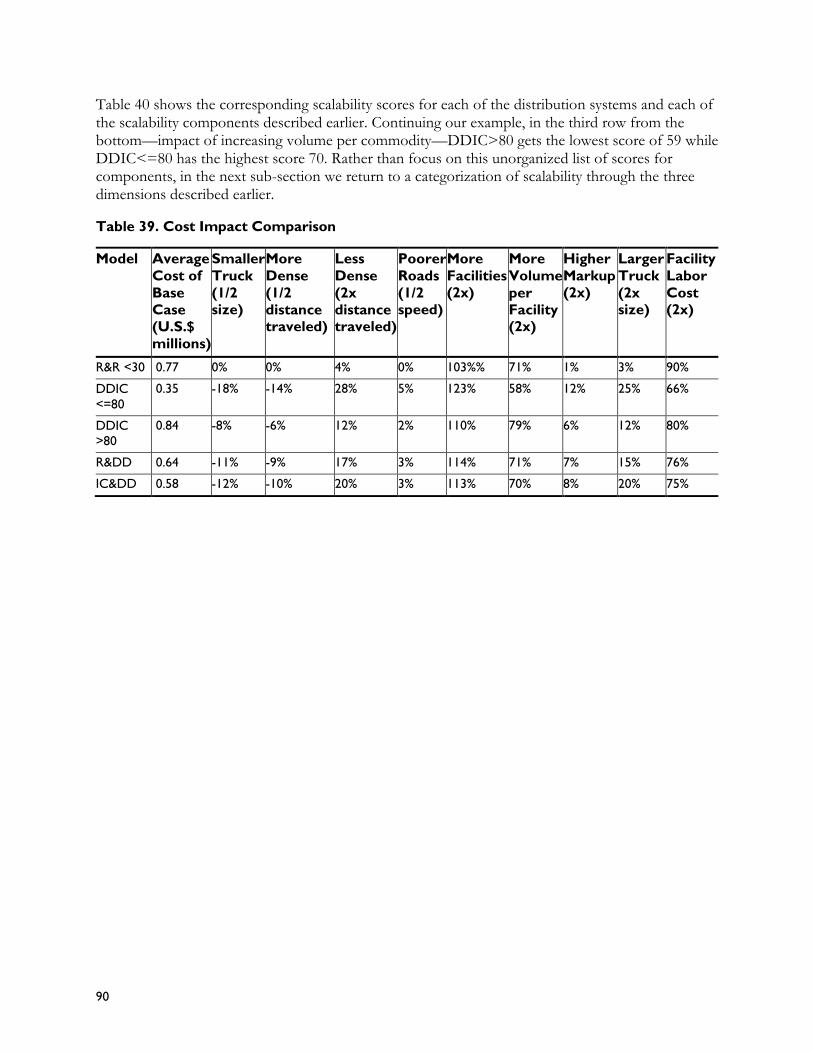
90
Table 40 shows the corresponding scalability scores for each of the distribution systems and each of the scalability components described earlier. Continuing our example, in the third row from the bottom—impact of increasing volume per commodity—DDIC>80 gets the lowest score of 59 while DDIC<=80 has the highest score 70. Rather than focus on this unorganized list of scores for components, in the next sub-section we return to a categorization of scalability through the three dimensions described earlier.
Table 39. Cost Impact Comparison
Model Average
Cost of
Base
Case
(U.S.$
millions)
Smaller
Truck
(1/2 size)
More
Dense
(1/2
distance traveled)
Less
Dense
(2x
distance traveled)
Poorer
Roads
(1/2 speed)
More
Facilities
(2x)
More
Volume
per
Facility (2x)
Higher
Markup
(2x)
Larger
Truck
(2x size)
Facility
Labor
Cost (2x)
R&R <30 0.77 0% 0% 4% 0% 103%% 71% 1% 3% 90%
DDIC
<=80
0.35 -18% -14% 28% 5% 123% 58% 12% 25% 66%
DDIC
>80
0.84 -8% -6% 12% 2% 110% 79% 6% 12% 80%
R&DD 0.64 -11% -9% 17% 3% 114% 71% 7% 15% 76%
IC&DD 0.58 -12% -10% 20% 3% 113% 70% 8% 20% 75%
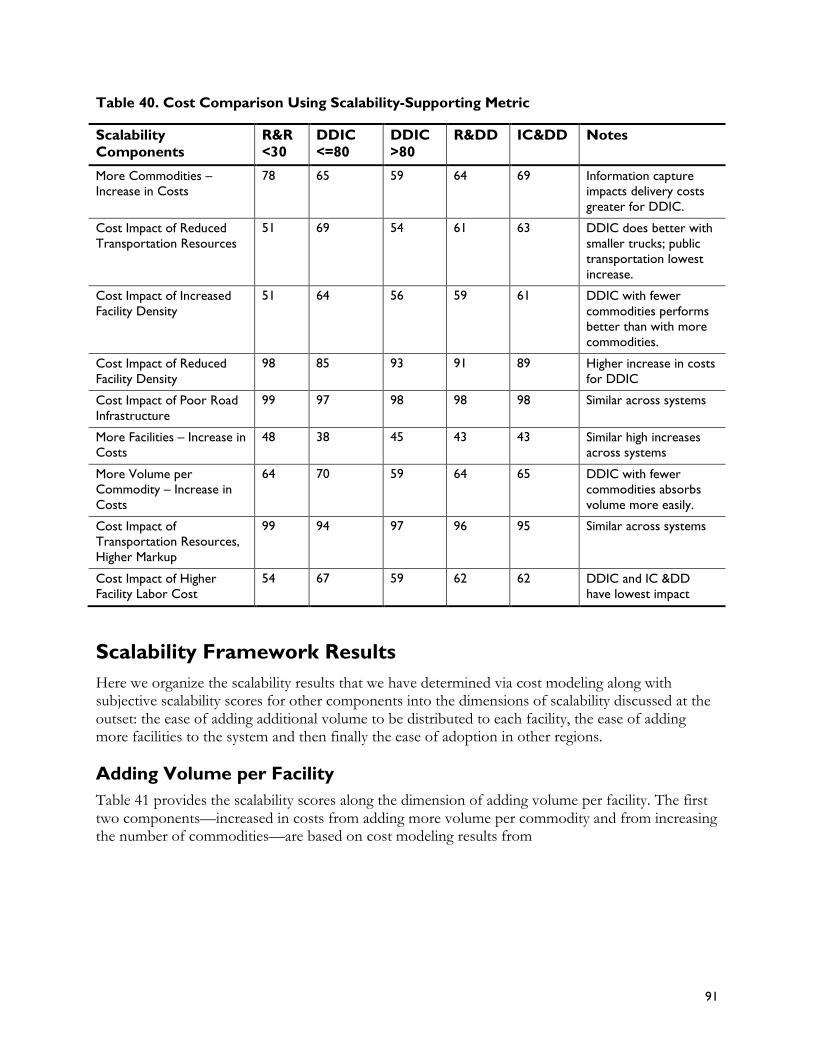
91
Table 40. Cost Comparison Using Scalability-Supporting Metric
Scalability
Components
R&R
<30
DDIC
<=80
DDIC
>80
R&DD IC&DD Notes
More Commodities –
Increase in Costs
78 65 59 64 69 Information capture
impacts delivery costs
greater for DDIC.
Cost Impact of Reduced
Transportation Resources
51 69 54 61 63 DDIC does better with
smaller trucks; public
transportation lowest
increase.
Cost Impact of Increased
Facility Density
51 64 56 59 61 DDIC with fewer
commodities performs
better than with more
commodities.
Cost Impact of Reduced
Facility Density
98 85 93 91 89 Higher increase in costs
for DDIC
Cost Impact of Poor Road
Infrastructure
99 97 98 98 98 Similar across systems
More Facilities – Increase in
Costs
48 38 45 43 43 Similar high increases
across systems
More Volume per
Commodity – Increase in
Costs
64 70 59 64 65 DDIC with fewer
commodities absorbs
volume more easily.
Cost Impact of
Transportation Resources,
Higher Markup
99 94 97 96 95 Similar across systems
Cost Impact of Higher
Facility Labor Cost
54 67 59 62 62 DDIC and IC &DD
have lowest impact
Scalability Framework Results
Here we organize the scalability results that we have determined via cost modeling along with subjective scalability scores for other components into the dimensions of scalability discussed at the outset: the ease of adding additional volume to be distributed to each facility, the ease of adding more facilities to the system and then finally the ease of adoption in other regions.
Adding Volume per Facility
Table 41 provides the scalability scores along the dimension of adding volume per facility. The first two components—increased in costs from adding more volume per commodity and from increasing the number of commodities—are based on cost modeling results from
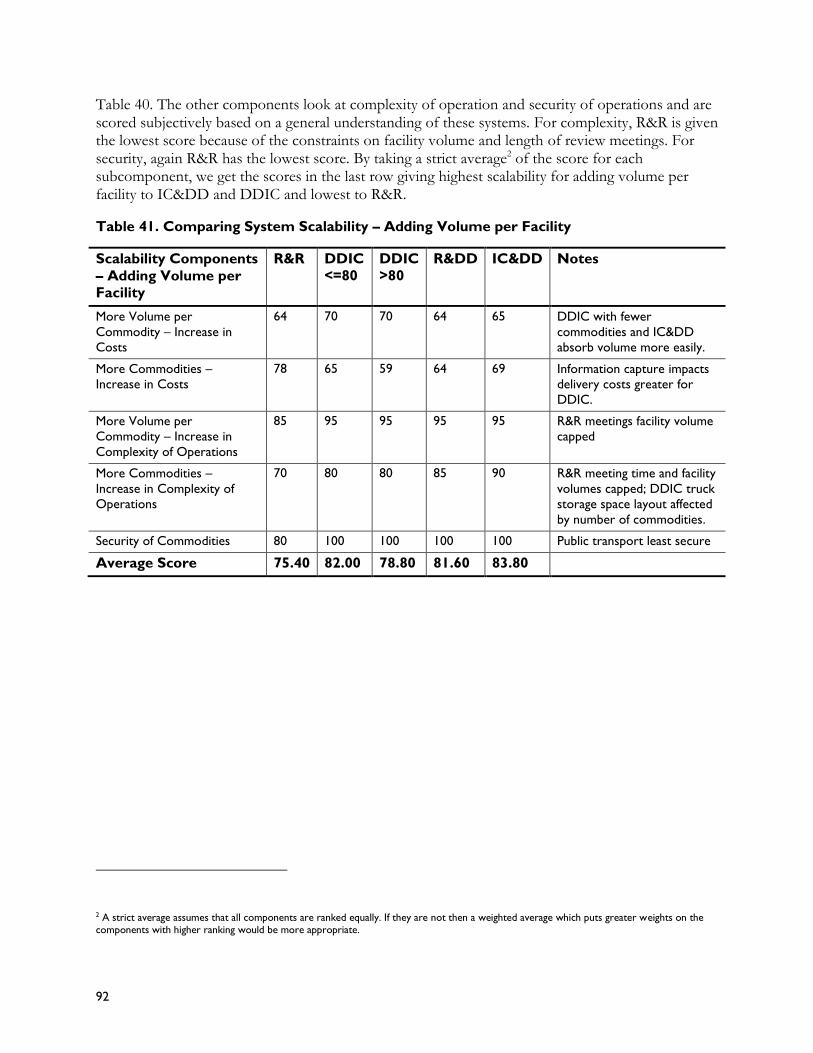
92
Table 40. The other components look at complexity of operation and security of operations and are scored subjectively based on a general understanding of these systems. For complexity, R&R is given the lowest score because of the constraints on facility volume and length of review meetings. For security, again R&R has the lowest score. By taking a strict average2 of the score for each subcomponent, we get the scores in the last row giving highest scalability for adding volume per facility to IC&DD and DDIC and lowest to R&R.
Table 41. Comparing System Scalability – Adding Volume per Facility
Scalability Components
– Adding Volume per
Facility
R&R DDIC
<=80
DDIC
>80
R&DD IC&DD Notes
More Volume per
Commodity – Increase in
Costs
64 70 70 64 65 DDIC with fewer
commodities and IC&DD
absorb volume more easily.
More Commodities –
Increase in Costs
78 65 59 64 69 Information capture impacts
delivery costs greater for
DDIC.
More Volume per
Commodity – Increase in
Complexity of Operations
85 95 95 95 95 R&R meetings facility volume
capped
More Commodities –
Increase in Complexity of
Operations
70 80 80 85 90 R&R meeting time and facility
volumes capped; DDIC truck
storage space layout affected
by number of commodities.
Security of Commodities 80 100 100 100 100 Public transport least secure
Average Score 75.40 82.00 78.80 81.60 83.80
2 A strict average assumes that all components are ranked equally. If they are not then a weighted average which puts greater weights on the components with higher ranking would be more appropriate.
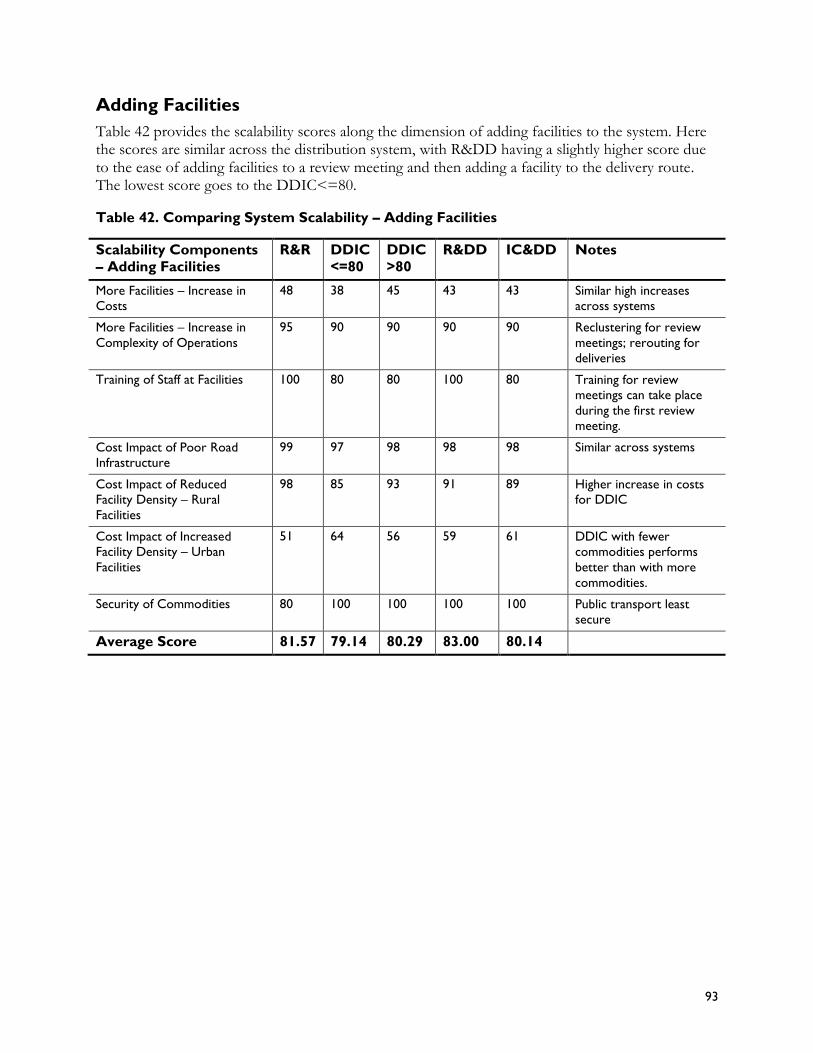
93
Adding Facilities
Table 42 provides the scalability scores along the dimension of adding facilities to the system. Here the scores are similar across the distribution system, with R&DD having a slightly higher score due to the ease of adding facilities to a review meeting and then adding a facility to the delivery route. The lowest score goes to the DDIC<=80.
Table 42. Comparing System Scalability – Adding Facilities
Scalability Components
– Adding Facilities
R&R DDIC
<=80
DDIC
>80
R&DD IC&DD Notes
More Facilities – Increase in
Costs
48 38 45 43 43 Similar high increases
across systems
More Facilities – Increase in
Complexity of Operations
95 90 90 90 90 Reclustering for review
meetings; rerouting for
deliveries
Training of Staff at Facilities 100 80 80 100 80 Training for review
meetings can take place
during the first review
meeting.
Cost Impact of Poor Road
Infrastructure
99 97 98 98 98 Similar across systems
Cost Impact of Reduced
Facility Density – Rural
Facilities
98 85 93 91 89 Higher increase in costs
for DDIC
Cost Impact of Increased
Facility Density – Urban
Facilities
51 64 56 59 61 DDIC with fewer
commodities performs
better than with more
commodities.
Security of Commodities 80 100 100 100 100 Public transport least
secure
Average Score 81.57 79.14 80.29 83.00 80.14
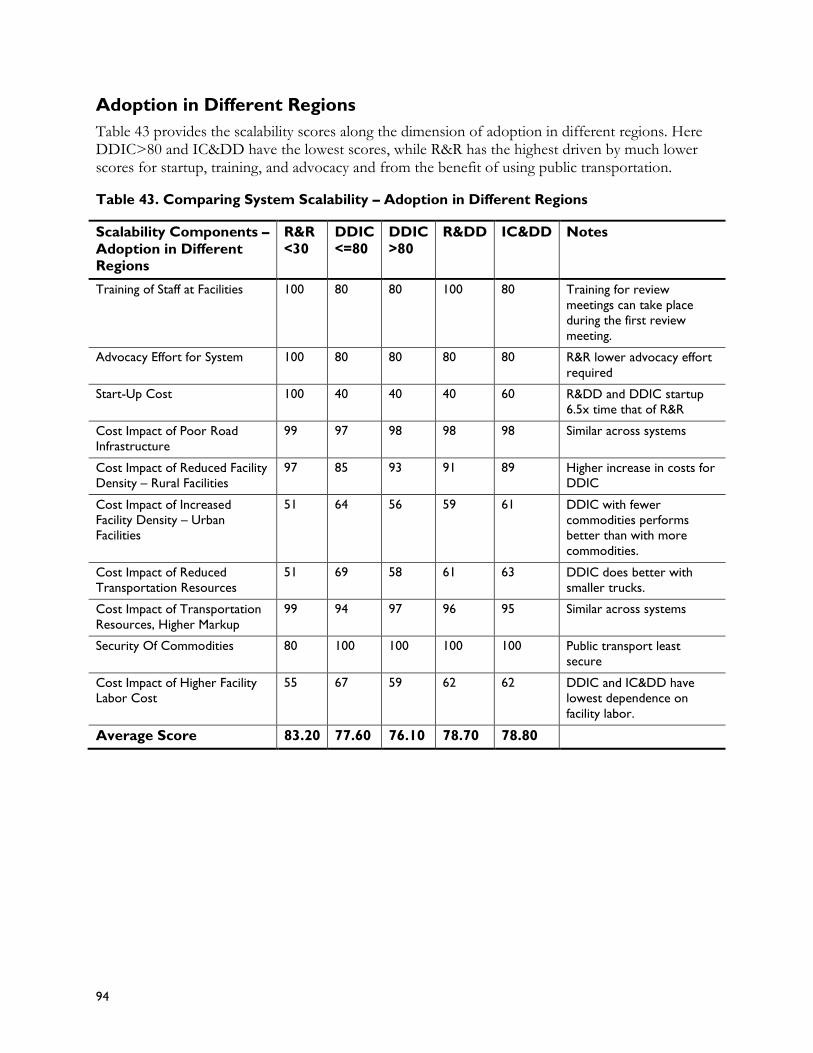
94
Adoption in Different Regions
Table 43 provides the scalability scores along the dimension of adoption in different regions. Here DDIC>80 and IC&DD have the lowest scores, while R&R has the highest driven by much lower scores for startup, training, and advocacy and from the benefit of using public transportation.
Table 43. Comparing System Scalability – Adoption in Different Regions
Scalability Components –
Adoption in Different Regions
R&R
<30
DDIC
<=80
DDIC
>80
R&DD IC&DD Notes
Training of Staff at Facilities 100 80 80 100 80 Training for review
meetings can take place
during the first review
meeting.
Advocacy Effort for System 100 80 80 80 80 R&R lower advocacy effort
required
Start-Up Cost 100 40 40 40 60 R&DD and DDIC startup
6.5x time that of R&R
Cost Impact of Poor Road
Infrastructure
99 97 98 98 98 Similar across systems
Cost Impact of Reduced Facility
Density – Rural Facilities
97 85 93 91 89 Higher increase in costs for
DDIC
Cost Impact of Increased
Facility Density – Urban
Facilities
51 64 56 59 61 DDIC with fewer
commodities performs
better than with more
commodities.
Cost Impact of Reduced
Transportation Resources
51 69 58 61 63 DDIC does better with
smaller trucks.
Cost Impact of Transportation
Resources, Higher Markup
99 94 97 96 95 Similar across systems
Security Of Commodities 80 100 100 100 100 Public transport least
secure
Cost Impact of Higher Facility
Labor Cost
55 67 59 62 62 DDIC and IC&DD have
lowest dependence on
facility labor.
Average Score 83.20 77.60 76.10 78.70 78.80
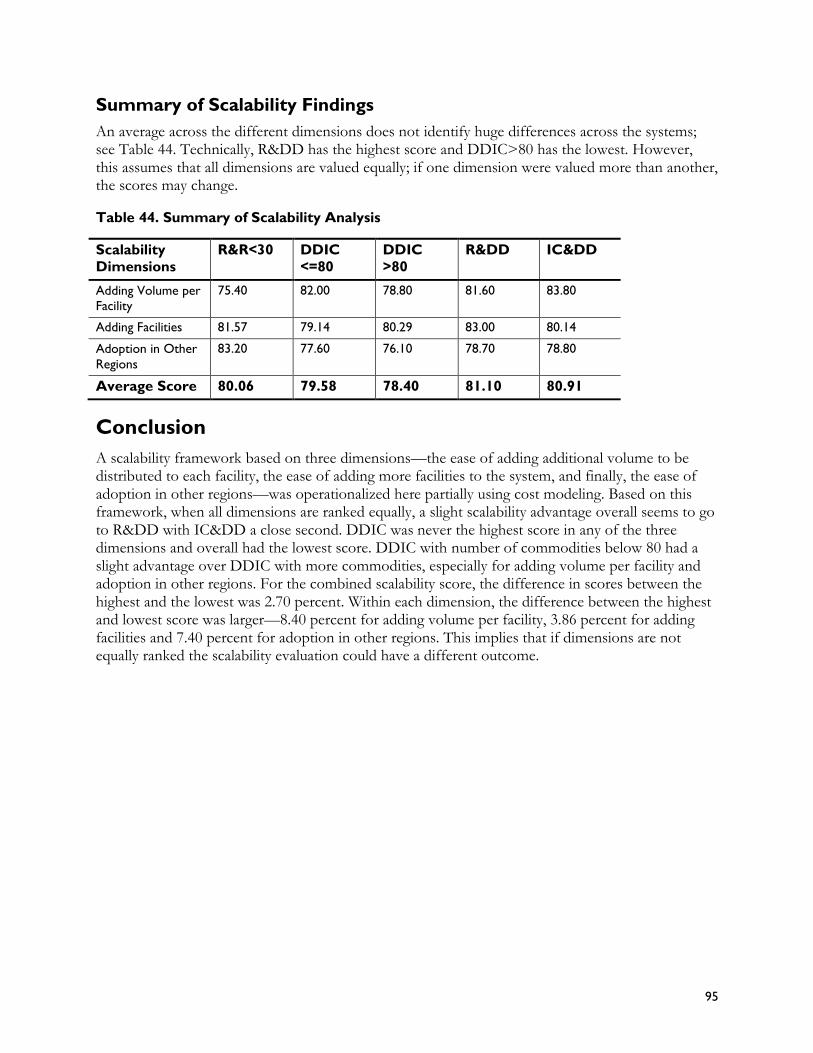
95
Summary of Scalability Findings
An average across the different dimensions does not identify huge differences across the systems; see Table 44. Technically, R&DD has the highest score and DDIC>80 has the lowest. However, this assumes that all dimensions are valued equally; if one dimension were valued more than another, the scores may change.
Table 44. Summary of Scalability Analysis
Scalability
Dimensions
R&R<30 DDIC
<=80
DDIC
>80
R&DD IC&DD
Adding Volume per
Facility
75.40 82.00 78.80 81.60 83.80
Adding Facilities 81.57 79.14 80.29 83.00 80.14
Adoption in Other
Regions
83.20 77.60 76.10 78.70 78.80
Average Score 80.06 79.58 78.40 81.10 80.91
Conclusion
A scalability framework based on three dimensions—the ease of adding additional volume to be distributed to each facility, the ease of adding more facilities to the system, and finally, the ease of adoption in other regions—was operationalized here partially using cost modeling. Based on this framework, when all dimensions are ranked equally, a slight scalability advantage overall seems to go to R&DD with IC&DD a close second. DDIC was never the highest score in any of the three dimensions and overall had the lowest score. DDIC with number of commodities below 80 had a slight advantage over DDIC with more commodities, especially for adding volume per facility and adoption in other regions. For the combined scalability score, the difference in scores between the highest and the lowest was 2.70 percent. Within each dimension, the difference between the highest and lowest score was larger—8.40 percent for adding volume per facility, 3.86 percent for adding facilities and 7.40 percent for adoption in other regions. This implies that if dimensions are not equally ranked the scalability evaluation could have a different outcome.

96
97
Appendix E
Inventory Data Quality
Assessment
Inventory data quality concerned the match of reported inventory levels with actual inventory, and the metric used was the percentage of facility-commodity combinations with deviations within a specific threshold percentage of the benchmark. Determining inventory data quality involved performing physical inventory audits at a point in time close to when the physical inventory supporting the monthly reports were conducted by facility workers or team leaders. For R&R and R&DD systems, this was usually the day following a review meeting, while for DDIC, this meant the same day as the DDIC visit by the team leader. For both HIV last-mile distribution systems, given the differences in channels for the submission of reporting and requisition forms, the assessment was scheduled for within a week of when submission was scheduled, which was usually the 7th of the month. In Table 45 we list the specific commodities that we used for the inventory quality assessment and provide additional details of the assessment in
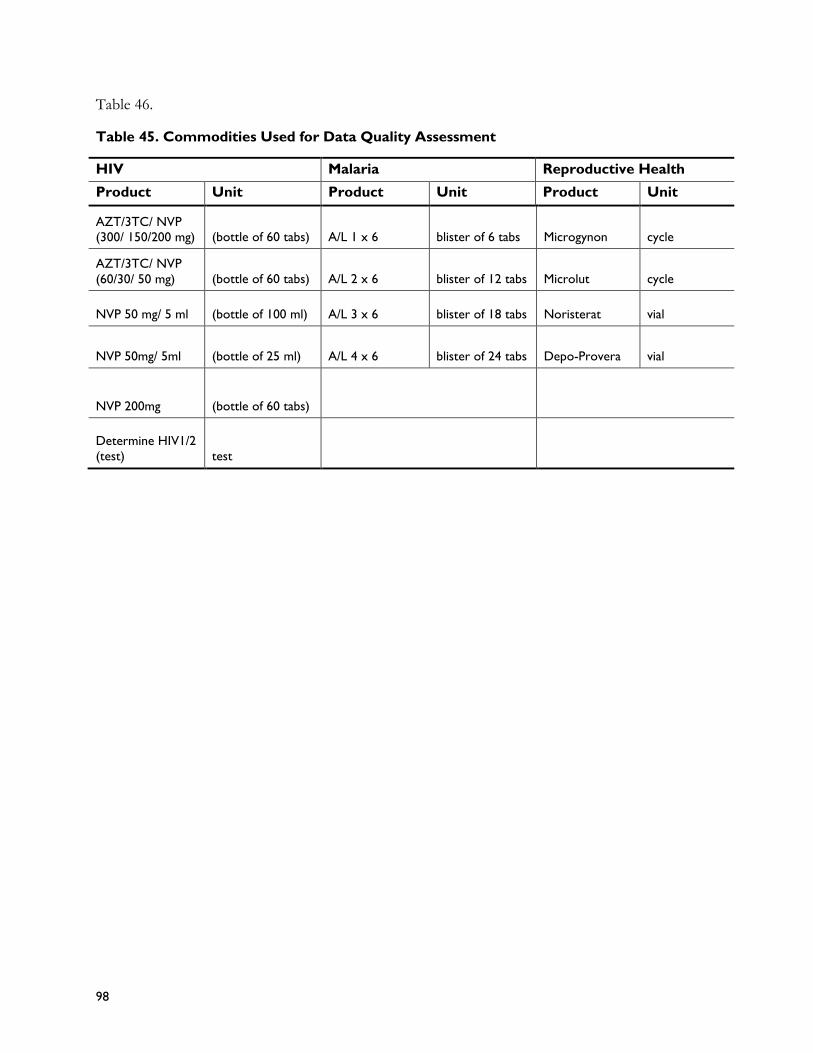
98
Table 46.
Table 45. Commodities Used for Data Quality Assessment
HIV Malaria Reproductive Health
Product Unit Product Unit Product Unit
AZT/3TC/ NVP
(300/ 150/200 mg) (bottle of 60 tabs) A/L 1 x 6 blister of 6 tabs Microgynon cycle
AZT/3TC/ NVP
(60/30/ 50 mg) (bottle of 60 tabs) A/L 2 x 6 blister of 12 tabs Microlut cycle
NVP 50 mg/ 5 ml (bottle of 100 ml) A/L 3 x 6 blister of 18 tabs Noristerat vial
NVP 50mg/ 5ml (bottle of 25 ml) A/L 4 x 6 blister of 24 tabs Depo-Provera vial
NVP 200mg (bottle of 60 tabs)
Determine HIV1/2
(test) test
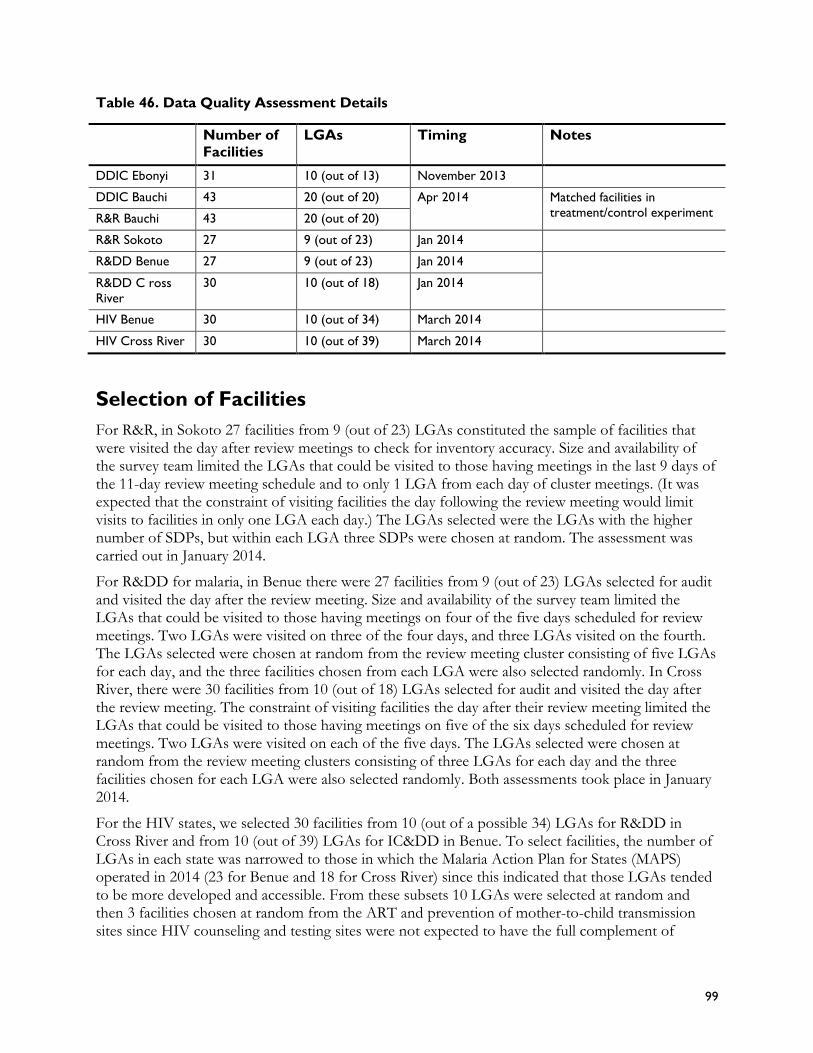
99
Table 46. Data Quality Assessment Details
Number of
Facilities
LGAs Timing Notes
DDIC Ebonyi 31 10 (out of 13) November 2013
DDIC Bauchi 43 20 (out of 20) Apr 2014 Matched facilities in
treatment/control experiment R&R Bauchi 43 20 (out of 20)
R&R Sokoto 27 9 (out of 23) Jan 2014
R&DD Benue 27 9 (out of 23) Jan 2014
R&DD C ross
River
30 10 (out of 18) Jan 2014
HIV Benue 30 10 (out of 34) March 2014
HIV Cross River 30 10 (out of 39) March 2014
Selection of Facilities
For R&R, in Sokoto 27 facilities from 9 (out of 23) LGAs constituted the sample of facilities that were visited the day after review meetings to check for inventory accuracy. Size and availability of the survey team limited the LGAs that could be visited to those having meetings in the last 9 days of the 11-day review meeting schedule and to only 1 LGA from each day of cluster meetings. (It was expected that the constraint of visiting facilities the day following the review meeting would limit visits to facilities in only one LGA each day.) The LGAs selected were the LGAs with the higher number of SDPs, but within each LGA three SDPs were chosen at random. The assessment was carried out in January 2014.
For R&DD for malaria, in Benue there were 27 facilities from 9 (out of 23) LGAs selected for audit and visited the day after the review meeting. Size and availability of the survey team limited the LGAs that could be visited to those having meetings on four of the five days scheduled for review meetings. Two LGAs were visited on three of the four days, and three LGAs visited on the fourth. The LGAs selected were chosen at random from the review meeting cluster consisting of five LGAs for each day, and the three facilities chosen from each LGA were also selected randomly. In Cross River, there were 30 facilities from 10 (out of 18) LGAs selected for audit and visited the day after the review meeting. The constraint of visiting facilities the day after their review meeting limited the LGAs that could be visited to those having meetings on five of the six days scheduled for review meetings. Two LGAs were visited on each of the five days. The LGAs selected were chosen at random from the review meeting clusters consisting of three LGAs for each day and the three facilities chosen for each LGA were also selected randomly. Both assessments took place in January 2014.
For the HIV states, we selected 30 facilities from 10 (out of a possible 34) LGAs for R&DD in Cross River and from 10 (out of 39) LGAs for IC&DD in Benue. To select facilities, the number of LGAs in each state was narrowed to those in which the Malaria Action Plan for States (MAPS) operated in 2014 (23 for Benue and 18 for Cross River) since this indicated that those LGAs tended to be more developed and accessible. From these subsets 10 LGAs were selected at random and then 3 facilities chosen at random from the ART and prevention of mother-to-child transmission sites since HIV counseling and testing sites were not expected to have the full complement of
100
inventory that formed the basis of the assessment. Both assessments took place in March 2014. Political unrest in Benue during the assessment forced a substitution of one of our LGAs, but also reduced the list of remaining LGAs from which to choose by eight.
For the DDIC system in Ebonyi, 31 facilities in 10 (out of 13) LGAs constituted the sample of facilities that were visited within hours after the DDIC truck visit to check inventory and consumption accuracy. The 10 LGAs covered all 3 phases of the rollout of the DDIC, and the assessment was carried out in November 2013. In Ebonyi, each LGA had four facilities in the DDIC which were supported by MAPS funded by USAID through PMI. The 31 facilities in the sample were chosen by selecting at random 1 facility from the 4 MAPS facilities in each LGA and then 2 facilities at random from the remaining facilities. One additional facility was selected for an initial and successful test of the survey instrument.
Bauchi provided a unique opportunity for a treatment-control within-state comparison of the DDIC with the R&R approach for FP products. Eighty-six facilities were identified for this comparison—43 would move to DDIC and 43 would maintain the existing R&R approach—from all 20 LGAs covered by the DDIC and out of 20 LGAs using the R&R system. The treatment facilities were randomly chosen to be in the treatment group after facilities were paired based on LGA, rate of stockouts, consumption (size of facility), and coefficient of variation for the four contraceptives (Microgynon, Microlut, Noristerat, Depo-Provera). These factors were not significantly associated with percentage of facilities stocked out, but were associated with internal stockcard consistency metrics. The assessment took place in April 2014.

101
For more information, please visit deliver.jsi.com.

USAID | DELIVER PROJECT
John Snow, Inc.
1616 Fort Myer Drive, 16th Floor
Arlington, VA 22209 USA
Phone: 703-528-7474
Fax: 703-528-7480
Email: [email protected]
Internet: deliver.jsi.com