evaluating extensible 3d (x3d) graphics for use in ... · evaluating extensible 3d (x3d) graphics...
TRANSCRIPT
Evaluating Extensible 3D(X3D) Graphics For Use in
Software Visualisationby
Craig Anslow
A thesissubmitted to the Victoria University of Wellington
in fulfilment of therequirements for the degree of
Master of Sciencein Computer Science.
Victoria University of Wellington2008


Abstract
3D web software visualisation has always been expensive, special purpose, andhard to program. Most of the technologies used require large amounts of scripting,are not reliable on all platforms, are binary formats, or no longer maintained.We can make end-user web software visualisation of object-oriented programscheap, portable, and easy by using Extensible (X3D) 3D Graphics, which is a newopen standard. In this thesis we outline our experience with X3D and discuss thesuitability of X3D as an output format for software visualisation.

ii

Acknowledgments
I would first just like to say that my Mum and Dad and have been great supportover the past few years in completing this degree and without them the strugglewould have been much worse. Thanks to Frank for accommodating me. Myweekends would not have been as much fun or balanced without my lovely dogs,Amber-Rose and Ruby-Anne.
Thanks to my close friend Alex Potanin for just being Alex; interrupting meat the most opportune moment and asking me to do things when least expected.I know I can always rely on you. So thanks for letting me come and discuss myideas and problems with you over the course of my degree. Even if the discussionalways ended up talking about you, I knew you were always interested in what Ihad to say about you.
To James Noble, Robert Biddle, and Stuart Marshall, thank you very muchfor supervising me. Without your leadership and guidance I do not know what Iwould have done. It has been great to have three completely different personalitiesto be able to inspire me, give me advice, pointers, and direction on many aspectsof my project. Your help has been much appreciated and will not be forgotten.
Through the Elvis Software Design Research Group I have had many a finetime and met some really great people including: Mike McGavin, Donald Gordon,Kirk Jackson, Pippin Barr, Rilla Khaled, Angela Martin, Matt Duignan, ChrisAndreae, Stephen Nelson, Darren Willis, Jennifer Ferreira, Pia Holland, AnnieLuxton, Hayden Smith, Brenda Chawner, Joerg Evermann, Robbie Morrison, WmLeler, Gary Haggard, Craig Chambers, Tim Wright, David Pearce, and EwanTempero. There were also some students who had to put up with me being theiroffice mates for many years which I know is not an easy task to do, so thanksto: Feng Lu, Nick Jamieson, Will Smart, Dean Pemberton, Jennifer Ferreira, andRashina Hoda.
Thank you to Mike McGavin, John Fouhy, and Jonathan Aumonier-Ward,(JAWs) for introducing me to a relatively new cool sport in Wellington, UltimateFrisbee. Without playing and thinking about Ultimate constantly I would havehad no reason to stay active. I have also met some other outstanding individualsfrom this community and played in some really interesting teams.
iii

iv
During my degree I had the opportunity to attend a Web3D Consortium work-shop where I had the opportunity to meet some of the pioneers in the X3D com-munity including Don Brutzman, Leonard Daly, Alan Hudson, Tony Parisi, ChrisThorne, and Rita Turkowski. Thank you all for the wonderful advice, support andencouragement. Thanks to John Coady for helping with X3D programming.
In the journey of this thesis I have had the opportunity to meet and emailvarious people along the way and discuss with them my research and future plans.So thanks to the following people: Liz Richardson, Liz Medford, Lyndon Hawk,Michael Richmond, Nadyne Mielke, Bruce Campbell, Ben Stephenson, Alan Black-well, Neville Churcher, Andy Cockburn, Tim Bell, Tim Dwyer, Peter Eades, SteveReiss, Gary Sevitsky, Ronald Bourret, Lianjiang Fu, Paul H J Kelly, Dennis Mancl,Margaret-Anne Storey, Tamara Munzner, Daniel Keim, Matt Ward, John Stasko,Ben Shneiderman, Robert Kosara, Malcolm Munro, Paul McIntosh, Michele Lanza,Orla Greevy, Dale Bent, Rasmus Koch Hansen, Rachel Ryan, Guillaume Langelier,Tilman Giese, and Keith Andrews. I can’t remember everyone, so sorry if I left anyone off the list.
Doing this thesis would not have been possible without some levels of funding.Thanks to Rachel Irving for employing me for a couple of years in the marketinggroup at Victoria University of Wellington. I had a splendid time working witha great bunch of people. Thanks to my managers at Unisys, Grant Nielsen andTim Hogan for employing me on two vastly different projects. Thanks to AndrewWhelan for listening and providing support.
Thanks to the School of Mathematics, Statistics, and Computer Science forfunding me with a scholarship and a small research grant. Thanks to the Facultyof Science for funding me with a small research grant as well. Thanks to LizRichardson and Shona De Sain for part time employment in the Faculty of Science.Thanks to my supervisor James Noble for some funding through the DSTOOLsgrant. Finally, thanks to Harris Stratex Networks for a Masters scholarship.
Contents
1 Introduction 11.1 Motivation . . . . . . . . . . . . . . . . . . . . . . . . . . . . . . . . . 21.2 Contributions . . . . . . . . . . . . . . . . . . . . . . . . . . . . . . . 31.3 Outline . . . . . . . . . . . . . . . . . . . . . . . . . . . . . . . . . . . 3
2 Background 52.1 Information Visualisation . . . . . . . . . . . . . . . . . . . . . . . . 6
2.1.1 2D Versus 3D Visualisation . . . . . . . . . . . . . . . . . . . 72.1.2 3D Information Visualisation Techniques . . . . . . . . . . . 10
2.2 Software Visualisation . . . . . . . . . . . . . . . . . . . . . . . . . . 152.2.1 Early 3D Software Visualisation . . . . . . . . . . . . . . . . 202.2.2 Source Code Visualisations . . . . . . . . . . . . . . . . . . . 202.2.3 Object-Oriented Metrics . . . . . . . . . . . . . . . . . . . . . 212.2.4 UML Diagrams . . . . . . . . . . . . . . . . . . . . . . . . . . 232.2.5 Dynamic Visualisations . . . . . . . . . . . . . . . . . . . . . 23
2.3 VARE: Visualisation Architecture for REuse . . . . . . . . . . . . . . 252.3.1 Programming Mapping Visualisation . . . . . . . . . . . . . 252.3.2 Architecture . . . . . . . . . . . . . . . . . . . . . . . . . . . . 262.3.3 Execution Traces . . . . . . . . . . . . . . . . . . . . . . . . . 262.3.4 Visualisation Tools . . . . . . . . . . . . . . . . . . . . . . . . 292.3.5 3D Technologies . . . . . . . . . . . . . . . . . . . . . . . . . 31
2.4 Summary . . . . . . . . . . . . . . . . . . . . . . . . . . . . . . . . . . 34
3 Exploring X3D 373.1 Overview . . . . . . . . . . . . . . . . . . . . . . . . . . . . . . . . . . 383.2 Specification . . . . . . . . . . . . . . . . . . . . . . . . . . . . . . . . 39
3.2.1 Basic Example . . . . . . . . . . . . . . . . . . . . . . . . . . . 393.2.2 Encodings . . . . . . . . . . . . . . . . . . . . . . . . . . . . . 393.2.3 Profiles . . . . . . . . . . . . . . . . . . . . . . . . . . . . . . . 39
3.3 X3D Nodes . . . . . . . . . . . . . . . . . . . . . . . . . . . . . . . . . 433.3.1 Geometry . . . . . . . . . . . . . . . . . . . . . . . . . . . . . 43
v

vi CONTENTS
3.3.2 Grouping . . . . . . . . . . . . . . . . . . . . . . . . . . . . . 443.3.3 Viewing and Navigation . . . . . . . . . . . . . . . . . . . . . 473.3.4 Lighting, Environment, and Sound . . . . . . . . . . . . . . . 473.3.5 Animation and Interaction . . . . . . . . . . . . . . . . . . . 483.3.6 Prototypes . . . . . . . . . . . . . . . . . . . . . . . . . . . . . 49
3.4 Resources . . . . . . . . . . . . . . . . . . . . . . . . . . . . . . . . . . 493.4.1 X3D Browsers and Plug-ins . . . . . . . . . . . . . . . . . . . 493.4.2 Content Authoring and Editing Tools . . . . . . . . . . . . . 513.4.3 Export and Translator Tools . . . . . . . . . . . . . . . . . . . 55
3.5 Discussion . . . . . . . . . . . . . . . . . . . . . . . . . . . . . . . . . 553.5.1 Improvements to the Specification . . . . . . . . . . . . . . . 573.5.2 Future of X3D on the Web . . . . . . . . . . . . . . . . . . . . 58
4 X3D Software Visualisations 614.1 VARE-3D . . . . . . . . . . . . . . . . . . . . . . . . . . . . . . . . . . 62
4.1.1 Architecture . . . . . . . . . . . . . . . . . . . . . . . . . . . . 624.1.2 Implementation . . . . . . . . . . . . . . . . . . . . . . . . . . 634.1.3 Visualisation Transformation . . . . . . . . . . . . . . . . . . 644.1.4 Discussion . . . . . . . . . . . . . . . . . . . . . . . . . . . . . 70
4.2 Algorithm Animations . . . . . . . . . . . . . . . . . . . . . . . . . . 724.2.1 Shortest Path . . . . . . . . . . . . . . . . . . . . . . . . . . . 734.2.2 Heapsort . . . . . . . . . . . . . . . . . . . . . . . . . . . . . . 774.2.3 Elementary Sorting . . . . . . . . . . . . . . . . . . . . . . . . 804.2.4 Discussion . . . . . . . . . . . . . . . . . . . . . . . . . . . . . 85
4.3 UML Diagrams . . . . . . . . . . . . . . . . . . . . . . . . . . . . . . 894.3.1 Class Diagrams . . . . . . . . . . . . . . . . . . . . . . . . . . 894.3.2 Package Diagrams . . . . . . . . . . . . . . . . . . . . . . . . 934.3.3 Sequence Diagrams . . . . . . . . . . . . . . . . . . . . . . . . 934.3.4 Discussion . . . . . . . . . . . . . . . . . . . . . . . . . . . . . 95
4.4 Documentation-Related Visualisations . . . . . . . . . . . . . . . . . 974.4.1 Source Code Visualisation . . . . . . . . . . . . . . . . . . . . 984.4.2 API Javadoc Visualisation . . . . . . . . . . . . . . . . . . . . 984.4.3 Structured Video Visualisation . . . . . . . . . . . . . . . . . 984.4.4 Discussion . . . . . . . . . . . . . . . . . . . . . . . . . . . . . 101
4.5 Execution Trace Visualisations . . . . . . . . . . . . . . . . . . . . . . 1034.5.1 All Elements From an Execution Trace . . . . . . . . . . . . . 1034.5.2 3D Compound Shapes . . . . . . . . . . . . . . . . . . . . . . 1054.5.3 3D Metaphors . . . . . . . . . . . . . . . . . . . . . . . . . . . 1104.5.4 Discussion . . . . . . . . . . . . . . . . . . . . . . . . . . . . . 115

CONTENTS vii
4.6 Summary . . . . . . . . . . . . . . . . . . . . . . . . . . . . . . . . . . 116
5 Software Visualisation Media Evaluation Framework 117
5.1 Differences With Earlier Evaluation Model . . . . . . . . . . . . . . 118
5.2 Scope∗ . . . . . . . . . . . . . . . . . . . . . . . . . . . . . . . . . . . 121
5.2.1 Requirements∗ . . . . . . . . . . . . . . . . . . . . . . . . . . 121
5.2.2 Design∗ . . . . . . . . . . . . . . . . . . . . . . . . . . . . . . 122
5.2.3 Method∗ . . . . . . . . . . . . . . . . . . . . . . . . . . . . . . 123
5.2.4 Performance . . . . . . . . . . . . . . . . . . . . . . . . . . . . 123
5.3 Form∗ . . . . . . . . . . . . . . . . . . . . . . . . . . . . . . . . . . . . 123
5.3.1 Graphical Capability . . . . . . . . . . . . . . . . . . . . . . . 123
5.3.2 Presentation∗ . . . . . . . . . . . . . . . . . . . . . . . . . . . 125
5.3.3 Visualisation Techniques∗ . . . . . . . . . . . . . . . . . . . . 126
5.4 Interaction∗ . . . . . . . . . . . . . . . . . . . . . . . . . . . . . . . . 127
5.4.1 User Controls∗ . . . . . . . . . . . . . . . . . . . . . . . . . . 127
5.4.2 User Navigation∗ . . . . . . . . . . . . . . . . . . . . . . . . . 127
5.4.3 User Tasks∗ . . . . . . . . . . . . . . . . . . . . . . . . . . . . 128
5.5 Discussion . . . . . . . . . . . . . . . . . . . . . . . . . . . . . . . . . 128
6 Evaluation of X3D 131
6.1 Scope . . . . . . . . . . . . . . . . . . . . . . . . . . . . . . . . . . . . 132
6.1.1 Requirements . . . . . . . . . . . . . . . . . . . . . . . . . . . 132
6.1.2 Design . . . . . . . . . . . . . . . . . . . . . . . . . . . . . . . 133
6.1.3 Method . . . . . . . . . . . . . . . . . . . . . . . . . . . . . . . 134
6.1.4 Performance . . . . . . . . . . . . . . . . . . . . . . . . . . . . 137
6.2 Form . . . . . . . . . . . . . . . . . . . . . . . . . . . . . . . . . . . . 138
6.2.1 Graphical Capability . . . . . . . . . . . . . . . . . . . . . . . 138
6.2.2 Presentation . . . . . . . . . . . . . . . . . . . . . . . . . . . . 141
6.2.3 Visualisation Techniques . . . . . . . . . . . . . . . . . . . . . 143
6.3 Interaction . . . . . . . . . . . . . . . . . . . . . . . . . . . . . . . . . 146
6.3.1 User Controls . . . . . . . . . . . . . . . . . . . . . . . . . . . 146
6.3.2 User Navigation . . . . . . . . . . . . . . . . . . . . . . . . . 148
6.3.3 User Tasks . . . . . . . . . . . . . . . . . . . . . . . . . . . . . 151
6.4 Discussion . . . . . . . . . . . . . . . . . . . . . . . . . . . . . . . . . 152
6.4.1 Advantages of X3D . . . . . . . . . . . . . . . . . . . . . . . . 153
6.4.2 Disadvantages of X3D . . . . . . . . . . . . . . . . . . . . . . 154
6.4.3 Potential Improvements for X3D . . . . . . . . . . . . . . . . 156

viii CONTENTS
7 Conclusions 1577.1 Contributions . . . . . . . . . . . . . . . . . . . . . . . . . . . . . . . 1587.2 Future Work . . . . . . . . . . . . . . . . . . . . . . . . . . . . . . . . 158
A Evaluation of X3D Summary 161
List of Figures
2.1 Harry Beck’s 1933 original London Underground map. Reproducedby kind permission of London’s Transport Museum c©Transportfor London. . . . . . . . . . . . . . . . . . . . . . . . . . . . . . . . . 8
2.2 Tree Map — KDirStat. . . . . . . . . . . . . . . . . . . . . . . . . . . 12
2.3 Cone Tree [220]. . . . . . . . . . . . . . . . . . . . . . . . . . . . . . . 13
2.4 Hyperbolic 3D Viewer [166]. . . . . . . . . . . . . . . . . . . . . . . . 14
2.5 Information Cube [213]. . . . . . . . . . . . . . . . . . . . . . . . . . 14
2.6 Information Landscape. . . . . . . . . . . . . . . . . . . . . . . . . . 16
2.7 Botanical Tree [122]. . . . . . . . . . . . . . . . . . . . . . . . . . . . . 17
2.8 Areas of software visualisation [237]. . . . . . . . . . . . . . . . . . . 18
2.9 Jinsight software visualisation system. . . . . . . . . . . . . . . . . . 19
2.10 Object-Oriented Metrics in VRML [57]. . . . . . . . . . . . . . . . . . 22
2.11 X3D-UML [163]. . . . . . . . . . . . . . . . . . . . . . . . . . . . . . . 24
2.12 BLOOM, Spiral views of the stack (sampled during execution) [203]. 24
2.13 The Programming Mapping Visualisation Model [221, 234, 239]. . . 26
2.14 The VARE architecture [160]. . . . . . . . . . . . . . . . . . . . . . . 27
2.15 XTE — example execution trace of a Java program. . . . . . . . . . . 28
2.16 Spider, a test drive of the Java Calendar component [157, 158]. . . . 29
2.17 VET displaying a sequence and an association diagram of the samedata from an execution trace [162]. . . . . . . . . . . . . . . . . . . . 30
2.18 Blur SVG visualisation tool [74]. . . . . . . . . . . . . . . . . . . . . . 32
3.1 X3D content that encodes a sphere with an image of the world usedas texture and the text “Hello world!” [41]. . . . . . . . . . . . . . . 40
3.2 An image of the world earth-topo.png [41]. . . . . . . . . . . . . . . 41
3.3 X3D Sample Document — Hello World. . . . . . . . . . . . . . . . . 41
3.4 The X3D nodes represented as a tree structure from the Hello Worldsample document. . . . . . . . . . . . . . . . . . . . . . . . . . . . . . 42
3.5 X3D Baseline Profiles [265]. . . . . . . . . . . . . . . . . . . . . . . . 42
3.6 Examples of 3D geometry definitions in X3D [41]. . . . . . . . . . . 45
ix

x LIST OF FIGURES
3.7 Examples of extrusion geometry definitions in X3D [41]. . . . . . . 46
3.8 X3D Routing Event Model [41]. . . . . . . . . . . . . . . . . . . . . . 49
3.9 X3D Browser Software Architecture [265]. . . . . . . . . . . . . . . . 50
3.10 Octaga X3D Player Example — animating whale shark, courtesy ofMarko Steffensen from Octaga (http://www.octaga.com). . . . . . 52
3.11 BS Contact VRML/X3D Player Example — Golden Gate Bridge,courtesy of the National Institute of Standards and Technology(NIST) (http://www.nist.gov). . . . . . . . . . . . . . . . . . . . . . 53
3.12 Flux Player Example — person running and then jumping, cour-tesy of Yilmaz Degirmenci from the US Naval Postgraduate School(http://www.nps.edu). . . . . . . . . . . . . . . . . . . . . . . . . . . 54
3.13 X3D Editing Tools. . . . . . . . . . . . . . . . . . . . . . . . . . . . . 56
4.1 VARE-3D architecture. . . . . . . . . . . . . . . . . . . . . . . . . . . 63
4.2 VARE-3D — web interface for execution trace X3D software visuali-sations. . . . . . . . . . . . . . . . . . . . . . . . . . . . . . . . . . . . 65
4.3 Basic X3D Execution Trace Visualisation — in this simple X3D soft-ware visualisation 10,000 events have been transformed from theXTE execution trace of the Eclipse IDE Java application by XSLT.Blue spheres represent object creation events, green boxes methodcalls, white cones method returns and end of an object, field accessescyan cylinders, and field modifications as pink cylinders. . . . . . . 66
4.4 Example Eclipse XTE execution trace. . . . . . . . . . . . . . . . . . 68
4.5 XTE execution trace XSL stylesheet. . . . . . . . . . . . . . . . . . . 69
4.6 UML Class Diagram XSL prototype stylesheet. . . . . . . . . . . . . 71
4.7 X3D Shortest Path Algorithm Animation — shortest path fromvertex A to all other vertices. Hand crafted in X3D following thestrategy of Brown and Najork [33, 168, 169]. . . . . . . . . . . . . . . 73
4.8 Shortest Path Algorithm — initial 2D state. . . . . . . . . . . . . . . 74
4.9 X3D Shortest Path Algorithm Animation — different stages of thealgorithm. . . . . . . . . . . . . . . . . . . . . . . . . . . . . . . . . . 76
4.10 X3D Heapsort Algorithm Animation — completed algorithm ani-mation with united sticks like array and heap views. . . . . . . . . . 78
4.11 X3D Heapsort Algorithm Animation — different stages of the al-gorithm. The anomalous node placements in parts 4.11(b), 4.11(c),and 4.11(d), are the results of the elements being in motion. . . . . . 81
4.12 X3D Elementary Sorting Algorithm Animation — chips view. . . . 82
4.13 X3D Elementary Sorting Algorithm Animation — blocks view. . . . 84
4.14 X3D Elementary Sorting Algorithm Animation — blocks behind view. 84
LIST OF FIGURES xi
4.15 X3D routing event model from the insertion sort algorithm animation. 864.16 X3D Cityscape UML class diagram — 100 classes . . . . . . . . . . . 904.17 X3D Eclipse UML class diagram — 4536 classes, showing the flexi-
ble scale of the visualisation technique. . . . . . . . . . . . . . . . . 914.18 UML Class diagram prototype declaration and an example proto-
type instance from the CityScape Java program. . . . . . . . . . . . 924.19 X3D Cityscape UML package diagram . . . . . . . . . . . . . . . . . 944.20 X3D Cityscape UML sequence diagram . . . . . . . . . . . . . . . . 964.21 Source code visualisation with a UML like class diagram and C++
source code. . . . . . . . . . . . . . . . . . . . . . . . . . . . . . . . . 994.22 API Javadoc Visualisation with the Cityscape UML class diagram. . 1004.23 Structured Video Visualisation with a UML like class diagram. . . . 1024.24 All elements from an execution trace represented as a sequence of
spheres. . . . . . . . . . . . . . . . . . . . . . . . . . . . . . . . . . . . 1044.25 All elements from an execution trace represented as different shapes
on different lines. . . . . . . . . . . . . . . . . . . . . . . . . . . . . . 1044.26 All elements from an execution trace represented as a different
shapes and on the same line. . . . . . . . . . . . . . . . . . . . . . . . 1054.27 All elements from the CityScape execution trace represented as a
cube like shape. . . . . . . . . . . . . . . . . . . . . . . . . . . . . . . 1064.28 XSLT code to parse an object creation event from our execution traces1074.29 JavaScript layout function that calculates x, y, and z coordinates for
a node. . . . . . . . . . . . . . . . . . . . . . . . . . . . . . . . . . . . 1084.30 Elements from the CityScape cube visualisation. . . . . . . . . . . . 1094.31 10,000 elements from the Eclipse execution trace. . . . . . . . . . . . 1104.32 100,000 elements from the Eclipse execution trace. . . . . . . . . . . 1114.33 CityScape 3D Spiral. . . . . . . . . . . . . . . . . . . . . . . . . . . . 1114.34 Eclipse 3D Spiral. . . . . . . . . . . . . . . . . . . . . . . . . . . . . . 1124.35 All elements from an execution trace represented as an information
landscape. . . . . . . . . . . . . . . . . . . . . . . . . . . . . . . . . . 1134.36 All elements from an execution trace represented as an information
cube. . . . . . . . . . . . . . . . . . . . . . . . . . . . . . . . . . . . . 114
6.1 Editing X3D file in a text editor. . . . . . . . . . . . . . . . . . . . . . 1366.2 Creating an X3D software visualisation from the command line
using the Apache Xalan XSLT processor. . . . . . . . . . . . . . . . . 1376.3 Eclipse execution trace — 50,000 events. . . . . . . . . . . . . . . . . 1446.4 Eclipse UML package diagram — 257 packages . . . . . . . . . . . . 1446.5 Information Cube — wireframe rendering. . . . . . . . . . . . . . . 147

xii LIST OF FIGURES
6.6 Algorithm animation user controls. . . . . . . . . . . . . . . . . . . . 1486.7 X3D Navigation — navigation options by right clicking in the Oc-
taga Player. . . . . . . . . . . . . . . . . . . . . . . . . . . . . . . . . . 1496.8 Information Landscape — showing available viewpoints. . . . . . . 150

Chapter 1
Introduction
Software visualisation is defined as the use of the crafts of typography,graphic design, animation, and cinematography with modern human-computer interaction and computer graphics technology to facilitateboth the human understanding and effective use of computer software.John Stasko, John Domingue, Marc H. Brown, and Blaine A. Price [237].
Software visualisation has existed in many forms for a long time. Softwarevisualisation has been used for many different purposes including algorithm ani-mation, education, program structure, program execution, program debugging,memory leak analysis, software engineering, reverse engineering, software main-tenance, and software reuse [68]. Software visualisation can be thought of asthe application of information visualisation techniques in software engineeringand can show the structure of software, runtime behaviour, and representationof source code. Extensible 3D (X3D) Graphics [265] is a new light weight openstandard for web based 3D graphics. The goal of this thesis is to evaluate X3Dfor use in software visualisation which could potentially help with all of thesepurposes.
Frederick P. Brooks Jr. claims in his seminal paper No Silver Bullet: Essence andAccidents of Software Engineering [32] that software is invisible and unvisualisable.The reality of object-oriented software today is that it is quite complex and con-tinually growing in complexity in a variety of ways [22]. If we want softwarevisualisation to be a practical tool for developers, we have to develop visualisationtechniques and systems that are designed to handle the complexity of tomorrowssystems, not yesterdays [208]. The large scale software systems of today makessoftware visualisation harder now than before.
1

2 CHAPTER 1. INTRODUCTION
1.1 Motivation
As part of an ongoing research project we have designed a Visualisation Archi-tecture for REuse (VARE) [160] for evaluating software components over the web.The design supports visualising components in multiple languages and configura-tions (e.g. complete programs or just code fragments). Our architecture requirestools to develop and deliver easy to learn and easy to use visualisations fromexecution traces.
Our research group has created a prototype tool that can produce 2D ScalableVector Graphics (SVG) visualisations over the web from our execution traces [74,75]. Ware et al. [263] demonstrate that displaying object-oriented software inthree dimensions instead of two can make it easier for users to understand thedata. We want to create 3D software visualisations for software reuse, softwaremaintenance, and reverse engineering that can be viewed over the web and hasgood XML support which is an important requirement for VARE [160]. We requirea language and a tool that can produce these 3D web software visualisations.
The tools and visualisations that we are interested in building are aimed atsoftware developers who have standard personal computers (CRT or LCD monitor,keyboard and mouse, web browser) and an Internet connection. The computerrequirements include approximately 512MB-2GB of memory, a dedicated graphics/ video card, and no special purpose hardware for input or output. Our visuali-sation architecture project [160] needs a web-based technology that meets theserequirements.
Most web-based technologies that are used to create 3D software visualisationsover the web use either Java3D, Java applets, or VRML. Java3D requires libraries tobe installed onto users platforms and require a viewer to be created. Java appletshave security restrictions, are slow to load when embedded in a web page, andsometimes have problems when working on different platforms. VRML is nolonger maintained, hard to extend, and hard to inter-operate with other languages.Java3D is a binary format while VRML is a text based format that uses the oldOpenInventor style syntax. All of these technologies lack support for XML.
This thesis evaluates using X3D [265] – the new open standard for web 3Dgraphics – for use in software visualisation. This thesis addresses the followingresearch questions: How good is X3D for use in software visualisation? How welldoes X3D support the software visualisation pipeline, by creating visualisationsfrom execution traces? How well does X3D support our software visualisationarchitecture?

1.2. CONTRIBUTIONS 3
1.2 Contributions
The key contribution of this thesis is evaluating how suitable X3D is for softwarevisualisation. In more detail:
• X3D Software Visualisation Case Studies (§4) - this work replicates anddiscusses the implementation of a range of software visualisations in X3Dincluding algorithm animations, UML diagrams, documentation-relatedvisualisations, and execution trace visualisations.
• VARE-3D (§4.1) - this effort provides a prototype tool which can producesoftware visualisations in X3D from XML execution traces over the web.
• Software Visualisation Media Evaluation Framework (§5) - this work cre-ates a framework for evaluating software visualisation media or graphicstechnologies for use in software visualisation based on a previous evaluationmodel.
• Evaluating X3D For Use in Software Visualisation (§6) - this work appliesour software visualisation media evaluation framework to evaluate howgood X3D is for software visualisation.
1.3 Outline
The remainder of this thesis is organised as follows:
• Chapter 2 contains related work in the areas of information visualisation,software visualisation, and describes our visualisation architecture project,VARE.
• Chapter 3 explores X3D giving an overview, describing the specification,listing some X3D resources such as browsers and tools, and discussingimprovements to the specification and the future of X3D on the web.
• Chapter 4 presents our web-based prototype tool for producing X3D soft-ware visualisations, then describes our X3D software visualisation casestudies. Our case studies include algorithm animations, UML diagrams,documentation-related visualisations, and execution trace visualisations.
• Chapter 5 describes a framework for evaluating software visualisation mediaor graphics technologies in software visualisation.

4 CHAPTER 1. INTRODUCTION
• Chapter 6 then applies our software visualisation media evaluation frame-work with our X3D software visualisations and our use of the X3D specifica-tion.
• Chapter 7 summarises our findings, by discussing the advantages, disadvan-tages and potential improvements of X3D for software visualisation. We alsolist our contributions of this thesis, and address future work.

Chapter 2
Background
Contents2.1 Information Visualisation . . . . . . . . . . . . . . . . . . . . . . . 6
2.1.1 2D Versus 3D Visualisation . . . . . . . . . . . . . . . . . . 7
2.1.2 3D Information Visualisation Techniques . . . . . . . . . . 10
2.2 Software Visualisation . . . . . . . . . . . . . . . . . . . . . . . . . 15
2.2.1 Early 3D Software Visualisation . . . . . . . . . . . . . . . 20
2.2.2 Source Code Visualisations . . . . . . . . . . . . . . . . . . 20
2.2.3 Object-Oriented Metrics . . . . . . . . . . . . . . . . . . . . 21
2.2.4 UML Diagrams . . . . . . . . . . . . . . . . . . . . . . . . . 23
2.2.5 Dynamic Visualisations . . . . . . . . . . . . . . . . . . . . 23
2.3 VARE: Visualisation Architecture for REuse . . . . . . . . . . . . 25
2.3.1 Programming Mapping Visualisation . . . . . . . . . . . . 25
2.3.2 Architecture . . . . . . . . . . . . . . . . . . . . . . . . . . . 26
2.3.3 Execution Traces . . . . . . . . . . . . . . . . . . . . . . . . 26
2.3.4 Visualisation Tools . . . . . . . . . . . . . . . . . . . . . . . 29
2.3.5 3D Technologies . . . . . . . . . . . . . . . . . . . . . . . . 31
2.4 Summary . . . . . . . . . . . . . . . . . . . . . . . . . . . . . . . . . 34
5

6 CHAPTER 2. BACKGROUND
In a recent survey [133, 134] based on questionnaires completed by 111 re-searchers from software maintenance, re-engineering and reverse engineering,40% found software visualisation absolutely necessary for their work and another42% found it important but not critical. 7% think that is is at least relevant and6% that they can do without but it is nice to have. Only 1% believe software visu-alisation is not an issue at all. Finally, 4% did not answer the question. From thesame survey relatively few people consider software visualisation their primaryresearch (11%) or at least a substantial part of their research (18%). Many peopleare doing software visualisation research every now and then (20%), howevermost people are primarily using or integrating existing software visualisation toolsdeveloped by others (33%).
We believe that applying visualisation techniques to software will help to assistdevelopers to understand software. Understanding the shape of existing softwareis a crucial first step to understanding how software systems have been built [22].Developers face the task of understanding software when they want to reuse,maintain, reverse engineer, or re-engineer a piece of software. Visualising thesource code and run-time of software can give a greater insight into the structureand behaviour of software, and will be able to help developers in these tasks [237].
The main reasons for wanting to reuse and maintain software are to saveon time, effort, and costs in both development and maintenance of quality soft-ware [193]. For software reuse the developer will not have to implement a newsolution to an old problem. For software maintenance the refactoring of code andfixing bugs will be reduced. The reason for reverse engineering is to break a pieceof software down to understand it to either build a copy of the software or toimprove the software [39]. Re-engineering is the subsequent modification of thesoftware once it has been reverse engineered, usually to add new functionality orto correct errors.
Next we describe the nature of information visualisation, and techniques forvisualising information. We then describe the nature of software visualisation,and look at various software visualisation systems that have used 3D graphics.Finally, in the last section, we describe the software visualisation architecture beingdeveloped by our research group.
2.1 Information Visualisation
Card et. al [45] describe information visualisation as the use of computer-supported,interactive, visual representations of abstract data to amplify cognition. Even afterproducing a visual representation, the following issues must be addressed: ex-

2.1. INFORMATION VISUALISATION 7
ploration, navigation, and interpolation of the data [46]. Several overviews oninformation visualisation exist [23, 45, 50, 101, 231, 232, 258].
The theory of the visual display of quantitative information [253] consists ofprinciples that generate design options and that guide choices among the designoptions. Tufte [253] describes graphical excellence of quantitative information, asthe well designed presentation of interesting data - a matter of substance, of statis-tics, and of design. Graphical excellence consists of complex ideas communicatedwith clarity, precision, and efficiency. This results in a visualisation displaying thegreatest number of ideas, in the shortest time and in the smallest space possible.
An early example of graphical excellence is the original London Undergroundmap designed by Harry Beck in 1933, see Figure 2.1. Typically most people willuse the map as a visualisation tool for planning a journey from one station toanother and a feasible route between them. People may memorise their route bycolour or the direction of the lines involved and any intermediate stations. Theinternal model created by memorising a route is known as a cognitive map [232].Beck based the map on electrical circuit diagrams which does not reflect thegeography of the city above. The revolutionary design with minor modificationsand additions still remains today. Further information on the history of the LondonUnderground Map is located in Garland [88].
Ben Shneiderman [228] created a visual design guideline called the visualinformation seeking mantra which says show an overview first, then zoom andfilter, and finally show details-on-demand. He then proposed a task by data typetaxonomy which has seven data types (1-, 2-, 3-dimensional data, temporal andmulti-dimensional data, and tree and network data) and seven tasks which auser can perform (overview, zoom, filter, details-on-demand, relate, history, andextract). This mantra is one of the very few methodical guidelines for designinginformation visualisations and it is the most widely cited [64]. There are, however,other user task heuristics [4, 5, 142, 254, 278, 279] but they are not as useful forevaluating usability, focus on low level tasks, or are domain specific. Each of theseother user task heuristics have components which overlap Shneiderman’s [228]mantra.
2.1.1 2D Versus 3D Visualisation
Visualisation in 2D has been heavily explored [45]. What benefits 3D representationis over 2D still remains to be answered for information and software visualisation.The goal of this thesis is not to determine if 3D software visualisations are betterthan 2D software visualisations. Instead we are going to evaluate a 3D technology– X3D, an open standard for web 3D graphics – for use in software visualisation.

8 CHAPTER 2. BACKGROUND
Figure 2.1: Harry Beck’s 1933 original London Underground map. Reproduced bykind permission of London’s Transport Museum c©Transport for London.
2.1. INFORMATION VISUALISATION 9
We now give a brief overview of 2D versus 3D for information visualisation.
A 3D world gives users an extra degree of freedom, but sometimes this leads toconfusion and complications with understanding and navigating a visualisationcompared to 2D visualisations [50]. Ware et al. [16, 260, 261] compared 2D andvarious different 3D techniques for comprehending 3D graphs using fish-tank (noflat screen) virtual reality [214, 244, 259]. Fish-tank virtual reality uses expensivespecial purpose hardware such as head-mounted 3D displays, mounted projec-tors, 3D input devices, and tracking devices. The 3D techniques considerablyoutperformed the 2D displays, errors were reduced when using 3D, and beingable to move or rotate the graph were key features of the 3D techniques. Theyhave since abandoned this mode of viewing because graphics technology todayhave remarkably improved and cheaper since their earlier work. They now use 3Dgraphics technologies that don’t require head mounted displays or head trackingdevices.
Hubona et al. [109] claim understanding of a 3D structure over 2D improveswhen a user can manipulate the structure. Another study by Irani and Ware etal. [110, 111, 112] found that information will be easier to read when 2D UML infor-mation structures are mapped into connected structures built with 3D primitivescalled geon diagrams. Geon diagrams are made out of cones, spheres, cylinders,and boxes.
Risden et al. [218] compared 2D and 3D visualisations of web content and theresults indicated that there were no reliable differences in overall user performanceor satisfaction with the visualisations. Hicks et al. [106] conducted some empiricalevaluations on 2D and 3D representations which presented customer behaviourinformation on telecommunication usage. The results indicated a performanceadvantage for the 2D display compared with both the 3D representations. Accord-ingly the merits about 3D are mixed as there are a number of conflicting researchstudies.
Moving from 2D to 3D user interfaces will not necessarily enhance a user’sperformance through natural support for spatial memory, i.e. a user rememberingwhere objects are located in space. Robertson et al.’s [219] 3D Data Mountain al-lowed users to arrange thumbnail images of web pages on an inclined plane alongthe Z dimension. The results showed that the Data Mountain improved retrievaltimes and reduced error rates in comparison to Internet Explorer’s Favourites.Tavanti and Lind [245] conducted experiments using 2D and 3D interfaces forremembering alphanumeric characters. The results of the experiments confirmedthat the 3D display better supported the task of correctly locating the characterson the depth level.
Some contrasting similar studies on spatial memory were carried out by Cock-
10 CHAPTER 2. BACKGROUND
burn et al. [58, 60, 61, 62] where they replicated both of the two previous examplesby Robertson et al. [219] and Tavanti and Lind [245]. The results showed no sig-nificant difference between 2D and 3D when using computer-supported systems,but 2D performed better when using actual physical systems.
Shneiderman [229] gives evidence that disorientation and occlusions of infor-mation are major weaknesses of 3D visualisations. Shneiderman claims that 3Dinformation visualisation interfaces have the potential for novel social, scientific,and commercial applications if designers go beyond mimicking 3D reality. Inorder to achieve good 3D information visualisations, the following features mustbe supported: rapid situation awareness through effective overviews, reducednumber of actions to accomplish tasks, and prompt and meaningful feedback foruser actions. Bowman et al. [29, 30] provide an excellent introduction to 3D userinterfaces.
Chen [50] claims that current empirical studies suggest that increasing aninterface from 2D to 3D is unlikely to be enough to boost the task performance,unless additional functions are provided so that users can have greater control ofobjects within a 3D visualisation.
Nielsen [172, 173] claims that “3D is never going to make it big-time in userinterfaces and especially web user interfaces until we get true 3D control devices”.This is because 3D images are displayed on a 2D computer screens and are con-trolled through 2D input devices, the mouse and keyboard. Spence [231] alsoclaims for 3D to be useful one has to be able to move the data in a visualisation.
To summarise the 2D versus 3D visualisation debate, one should not assumethat a 3D visualisation is automatically superior to a 2D visualisation. Answeringthe question “which is better, 3D or 2D?” is difficult, if not impossible [84]. Whendeciding on using 3D there should be clear important subtasks for which 3D isclearly beneficial over 2D [258]. Simply increasing a visualisation from 2D to 3D isunlikely to improve task performance unless extra and greater controls of 3D datain the visualisation are created.
2.1.2 3D Information Visualisation Techniques
We now discuss some 3D information visualisation techniques and metaphors. Weare particularly interested in 3D information visualisation techniques that could beused for creating X3D software visualisations. A broader range of 3D informationvisualisation techniques can be found elsewhere [51, 274].
One concept for information visualisation is Focus + Context [45] which re-quires the user having a view of the whole data available (context), while pursingdetailed analysis of a part of it (focus). A distorted view, a focus + context tech-

2.1. INFORMATION VISUALISATION 11
nique, is created by applying a transformation function to an undistorted image.Creating a distorted view magnification in one place occurs at the expense ofcompression in another. Leung and Apperley [143] describe a taxonomy and aunified theory of graphical distortion-oriented presentation techniques for spatialproblems.
The Polyfocal Display [117] is a one-dimensional form that has a transformationand magnification function where the highest peak is the focus of display. Fish-Eyeviews [87] are a way to generate a small display of a large structure in a wideangle or fish-eye lens where distance and level of detail can be defined. Sarkar andBrown [224] extended Furna’s fish-eye concept by creating the graphical fish-eyeview.
The Bifocal Lens [233] contains one part of information in detail while the otherparts in limited detail. Carpendale et al. [46] have created a 3D Bifocal Fish-Eyeview. The Perspective Wall [149] is a conceptual descendant of the bifocal displaywhere the main difference is that of the out-of-focus regions. The Table Lens [198]displays information based on a table format where a specified number of cells ina table are the main focus.
The Hyperbolic Browser [136], for visualising large hierarchies, distorts spaceso when a user moves around in the display a virtual camera follows and con-stantly redisplays the view onto Euclidean space on the screen. Essentially theinformation in the hyperbolic browser is stretched and squeezed as the user movesposition or moves objects.
The traditional way of representing tree structures such as XML documentsis to have a directed graph with a root node at the top then child nodes belowconnected to parent nodes by links. The major problem with this traditional treerepresentation is that it occupies a great deal of space, usually to the extent thatfor more than three levels and more than 50 nodes at the third level, the tree is toolarge for an effective presentation on a display screen [231]. We now discuss someimproved techniques for displaying trees.
Shneiderman created the Tree Map [116, 227] which displays tree structures asa rectangular 2D display in a space-filling manner, where 100% of the designateddisplay space is utilised. The Tree Map was designed to gain a better representationof the utilisation of storage space on a hard disk as viewed from the perspective ofa multiple level directory of subdirectories and files. Figure 2.2 shows a practicaluse of Tree Maps with an image of KDirStat1 which is a graphical disk usage utilityfor KDE that is based on SequoiaView [256, 268] an implementation of a Tree Map.
Bladh et al. [28] created a 3D tree map application, Step Tree. They conducted
1http://kdirstat.sourceforge.net

12 CHAPTER 2. BACKGROUND
Figure 2.2: Tree Map — KDirStat.

2.1. INFORMATION VISUALISATION 13
usability studies and found that users perform significantly better on tasks relatedto interpreting structural relationships when using Step Tree as opposed to TreeMaps. The display of hierarchical depth was a clear advantage over Tree Maps.
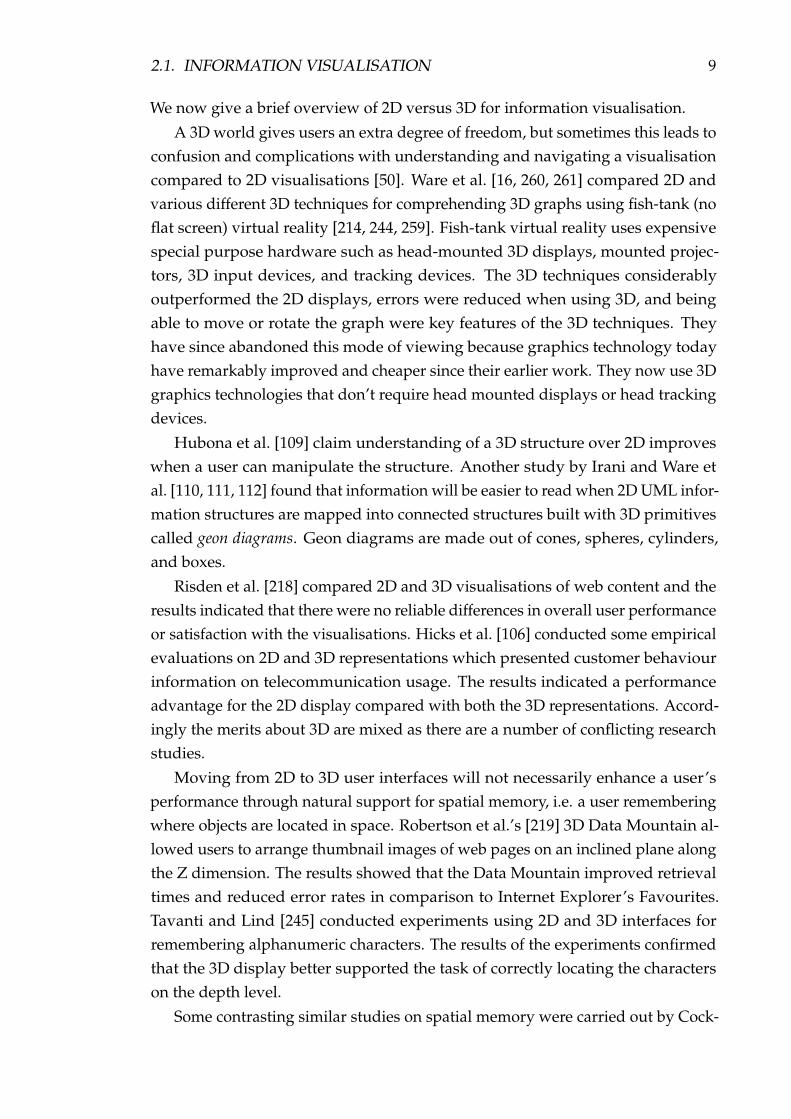
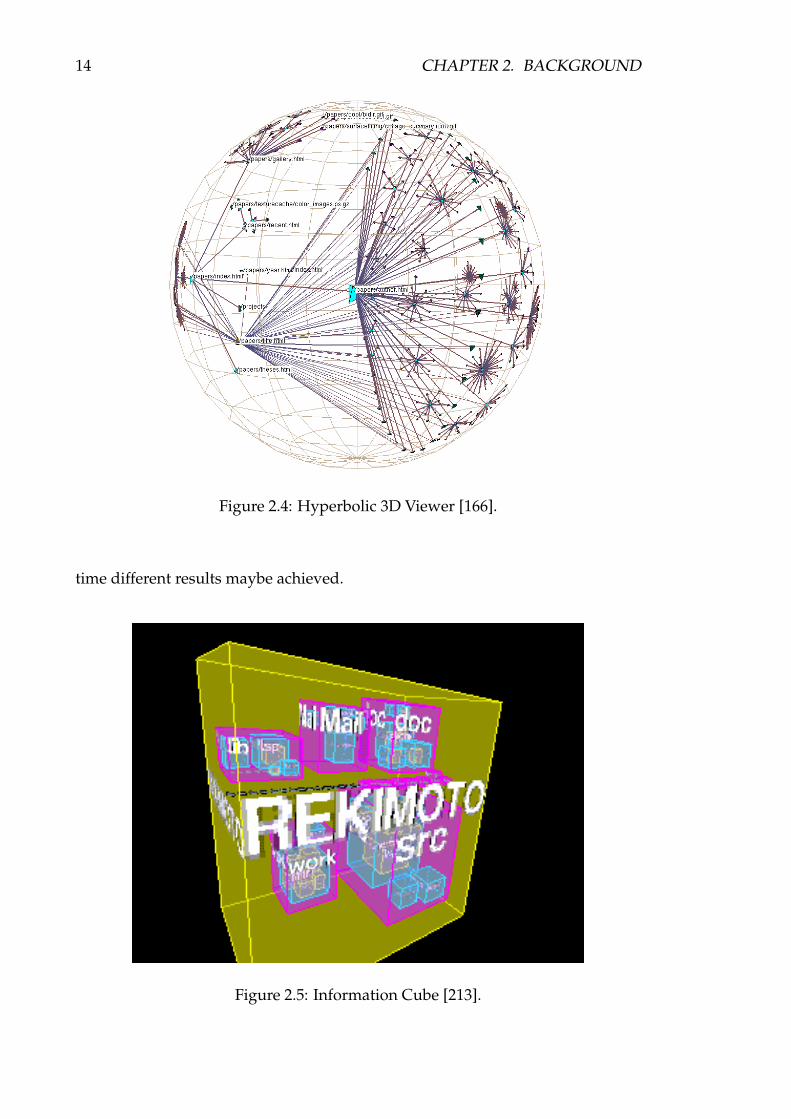
Cone Trees [220] are a technique for visualising hierarchical information struc-tures vertically, see Figure 2.3. The hierarchy is presented in 3D to maximise theeffective use of available screen space and enable visualisation of the whole struc-ture. Cam Trees [220] are an alternative layout which are horizontally oriented.Munzner et al. [166, 167] extended the Cone Tree layout for 3D hyperbolic spaceby placing children on a hemisphere around the cone mouth instead of on itsperimeter, see Figure 2.4.
Figure 2.3: Cone Tree [220].
Cockburn and MacKenzie [59] conducted some empirical studies to demon-strate the performance and effectiveness of users browsing documents through aCone Tree interface versus a Explorer-like tree normal browser. The normal treebrowser performed better for deep and shallow browsing due to the increaseddensity of information in the Cone Tree. The subjects stated that the Cone Treesprovided a better feel for the structure of the data space. Subjects also felt that thelack of experience using the Cone Tree hindered their performance and with more
14 CHAPTER 2. BACKGROUND
Figure 2.4: Hyperbolic 3D Viewer [166].
time different results maybe achieved.
Figure 2.5: Information Cube [213].
2.2. SOFTWARE VISUALISATION 15
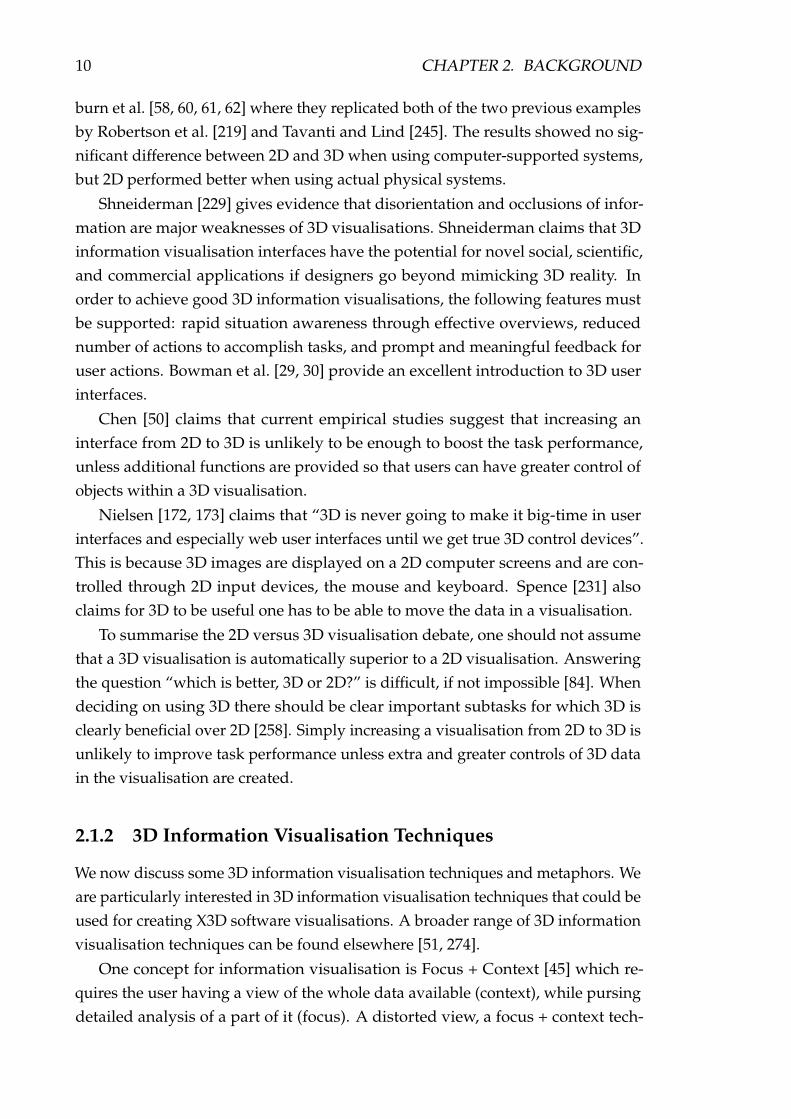
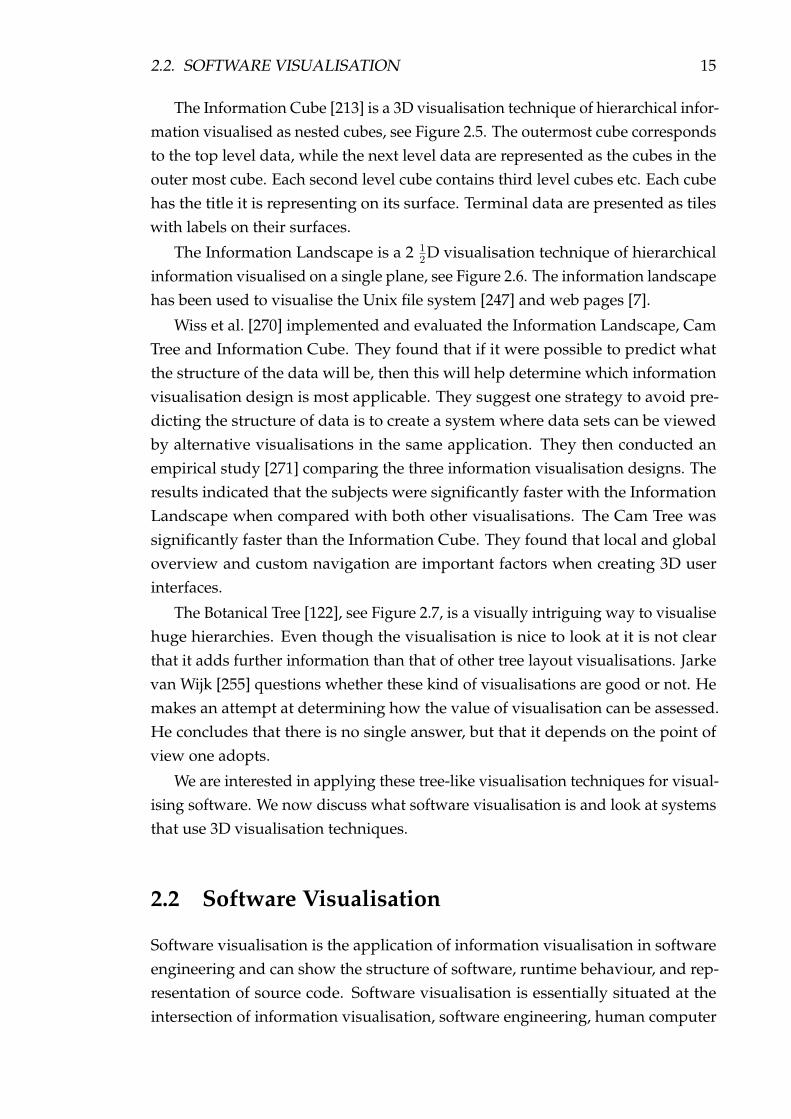
The Information Cube [213] is a 3D visualisation technique of hierarchical infor-mation visualised as nested cubes, see Figure 2.5. The outermost cube correspondsto the top level data, while the next level data are represented as the cubes in theouter most cube. Each second level cube contains third level cubes etc. Each cubehas the title it is representing on its surface. Terminal data are presented as tileswith labels on their surfaces.
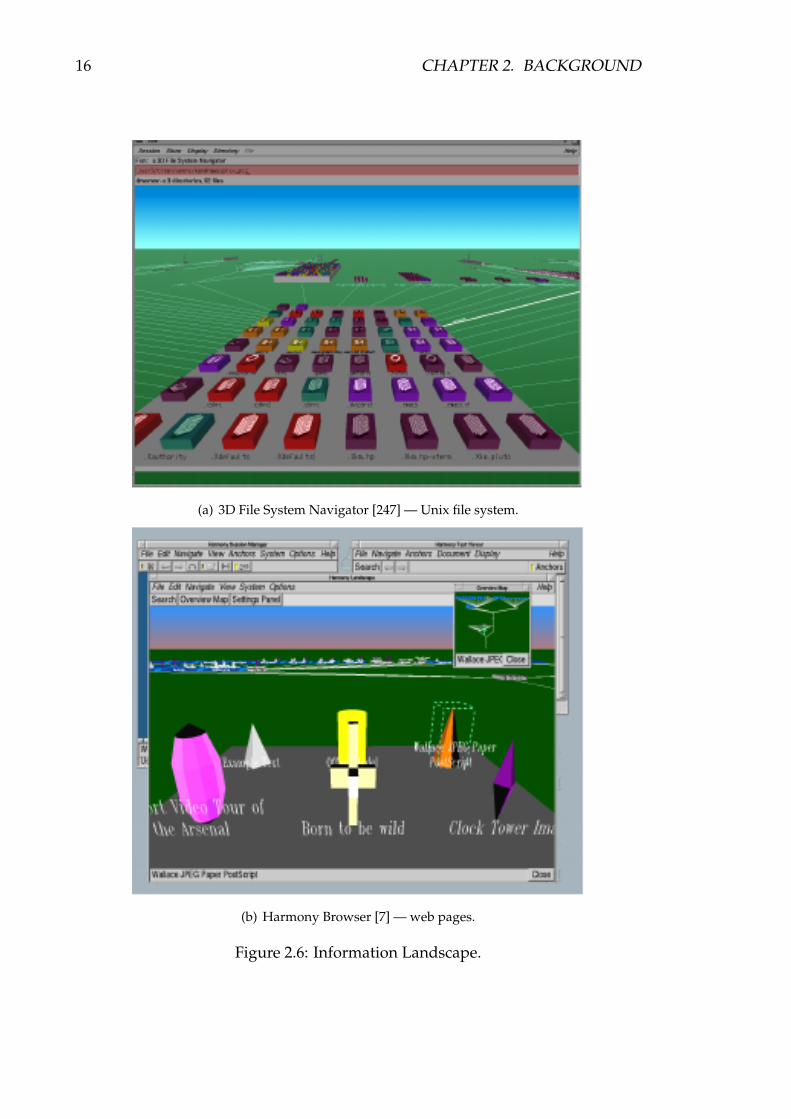
The Information Landscape is a 2 12D visualisation technique of hierarchical
information visualised on a single plane, see Figure 2.6. The information landscapehas been used to visualise the Unix file system [247] and web pages [7].
Wiss et al. [270] implemented and evaluated the Information Landscape, CamTree and Information Cube. They found that if it were possible to predict whatthe structure of the data will be, then this will help determine which informationvisualisation design is most applicable. They suggest one strategy to avoid pre-dicting the structure of data is to create a system where data sets can be viewedby alternative visualisations in the same application. They then conducted anempirical study [271] comparing the three information visualisation designs. Theresults indicated that the subjects were significantly faster with the InformationLandscape when compared with both other visualisations. The Cam Tree wassignificantly faster than the Information Cube. They found that local and globaloverview and custom navigation are important factors when creating 3D userinterfaces.
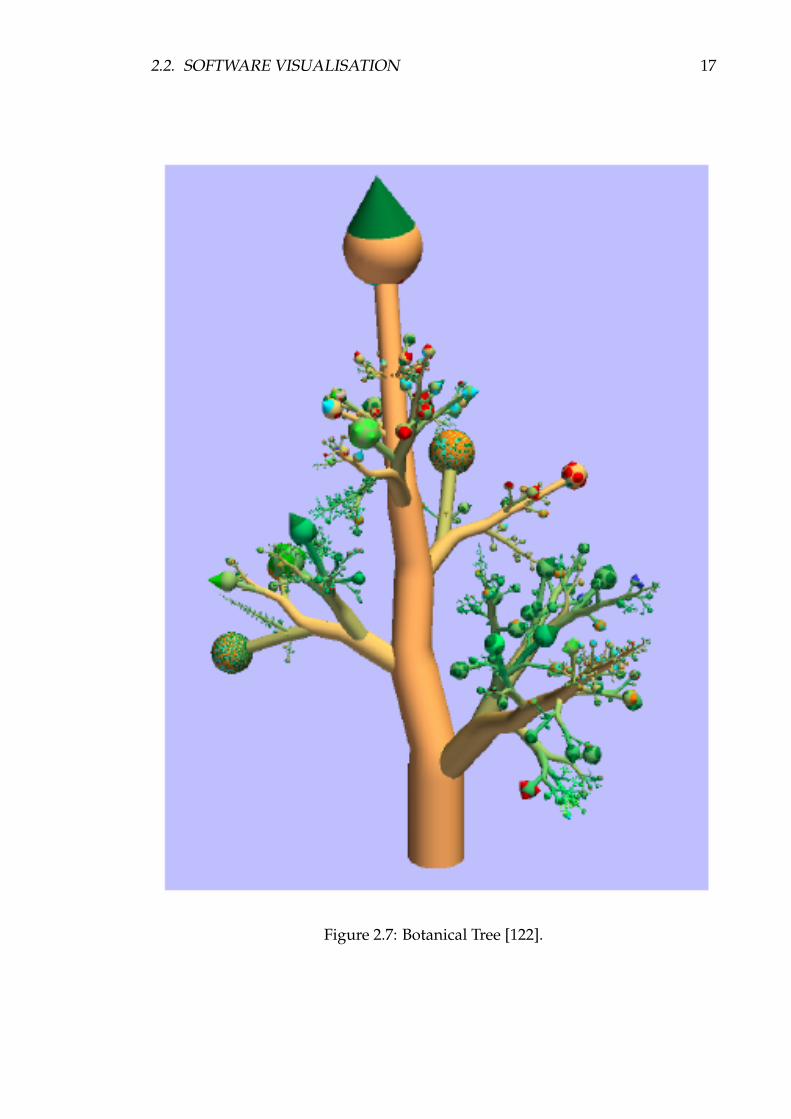
The Botanical Tree [122], see Figure 2.7, is a visually intriguing way to visualisehuge hierarchies. Even though the visualisation is nice to look at it is not clearthat it adds further information than that of other tree layout visualisations. Jarkevan Wijk [255] questions whether these kind of visualisations are good or not. Hemakes an attempt at determining how the value of visualisation can be assessed.He concludes that there is no single answer, but that it depends on the point ofview one adopts.
We are interested in applying these tree-like visualisation techniques for visual-ising software. We now discuss what software visualisation is and look at systemsthat use 3D visualisation techniques.
2.2 Software Visualisation
Software visualisation is the application of information visualisation in softwareengineering and can show the structure of software, runtime behaviour, and rep-resentation of source code. Software visualisation is essentially situated at theintersection of information visualisation, software engineering, human computer
16 CHAPTER 2. BACKGROUND
(a) 3D File System Navigator [247] — Unix file system.
(b) Harmony Browser [7] — web pages.
Figure 2.6: Information Landscape.
2.2. SOFTWARE VISUALISATION 17
Figure 2.7: Botanical Tree [122].
18 CHAPTER 2. BACKGROUND
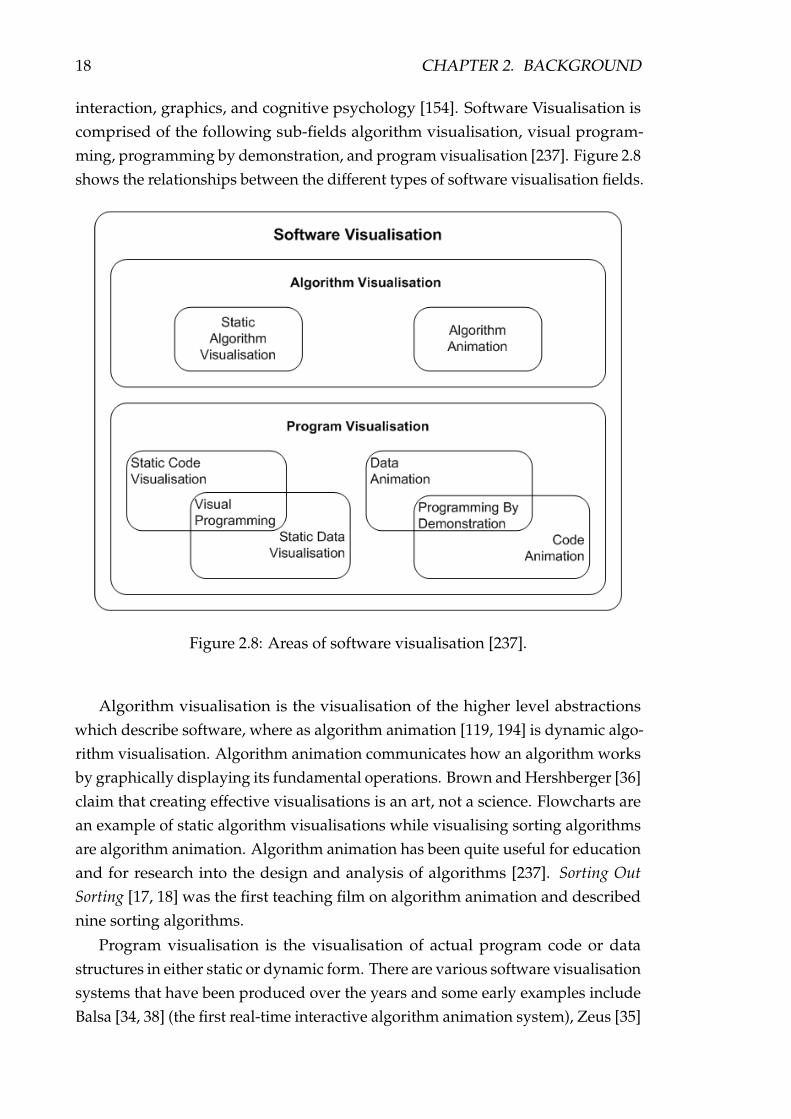
interaction, graphics, and cognitive psychology [154]. Software Visualisation iscomprised of the following sub-fields algorithm visualisation, visual program-ming, programming by demonstration, and program visualisation [237]. Figure 2.8shows the relationships between the different types of software visualisation fields.
Figure 2.8: Areas of software visualisation [237].
Algorithm visualisation is the visualisation of the higher level abstractionswhich describe software, where as algorithm animation [119, 194] is dynamic algo-rithm visualisation. Algorithm animation communicates how an algorithm worksby graphically displaying its fundamental operations. Brown and Hershberger [36]claim that creating effective visualisations is an art, not a science. Flowcharts arean example of static algorithm visualisations while visualising sorting algorithmsare algorithm animation. Algorithm animation has been quite useful for educationand for research into the design and analysis of algorithms [237]. Sorting OutSorting [17, 18] was the first teaching film on algorithm animation and describednine sorting algorithms.
Program visualisation is the visualisation of actual program code or datastructures in either static or dynamic form. There are various software visualisationsystems that have been produced over the years and some early examples includeBalsa [34, 38] (the first real-time interactive algorithm animation system), Zeus [35]
2.2. SOFTWARE VISUALISATION 19
(follow up to Balsa), Tango [235, 239], Polka [238] (a follow up system to Tango),Pavane [222], and Tarraingı́m [174, 175, 176] (a tool for visualising Self programsproduced by James Noble from our research group).
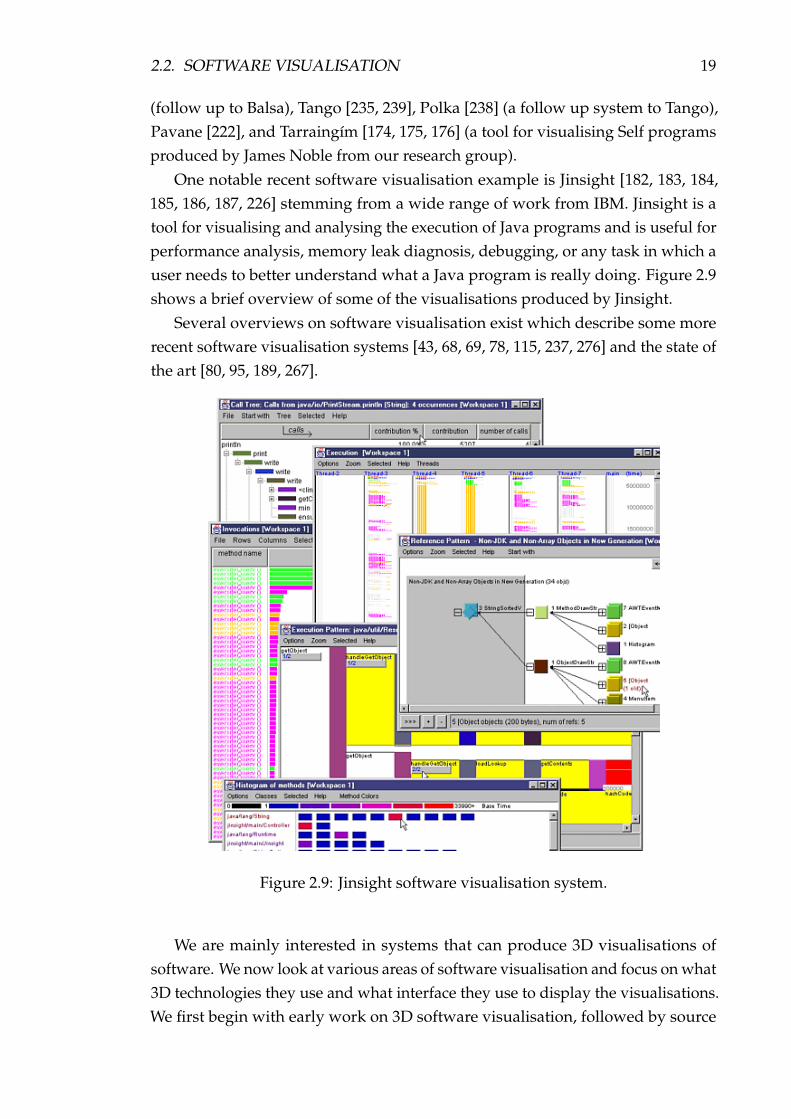
One notable recent software visualisation example is Jinsight [182, 183, 184,185, 186, 187, 226] stemming from a wide range of work from IBM. Jinsight is atool for visualising and analysing the execution of Java programs and is useful forperformance analysis, memory leak diagnosis, debugging, or any task in which auser needs to better understand what a Java program is really doing. Figure 2.9shows a brief overview of some of the visualisations produced by Jinsight.
Several overviews on software visualisation exist which describe some morerecent software visualisation systems [43, 68, 69, 78, 115, 237, 276] and the state ofthe art [80, 95, 189, 267].
Figure 2.9: Jinsight software visualisation system.
We are mainly interested in systems that can produce 3D visualisations ofsoftware. We now look at various areas of software visualisation and focus on what3D technologies they use and what interface they use to display the visualisations.We first begin with early work on 3D software visualisation, followed by source
20 CHAPTER 2. BACKGROUND
code visualisations, object-oriented software metrics, UML diagrams, and finally,dynamic visualisations.
2.2.1 Early 3D Software Visualisation
Stasko and Wehrli [240] identified the need for three-dimensional graphics insoftware visualisation. They list the basic requirements for 3D computation visual-isation, define three categories for characterising visualisations, and discuss theirsystem for supporting 3D animation development by programmers.
Koike [128, 129, 130, 131] described the significance of visualising softwareinformation in three dimensional space and the problems of 2D visualisation. Thiswork also introduced the concept of a 3D class library browser to show methodinheritance. The class hierarchy was represented as a tree in the X-Y plane andmethods of each class were shown in the Z axis with the same X-Y coordinates.Koike also looked at visualising large trace files in 3D of computer processes froma number of computers running in parallel and communicating with each other.
Other early research has been done in 3D for visualising Lisp programs [146],different features of a program [199, 200, 201], the layout and structuring ofobject oriented software in three dimensions as directed graphs (GraphVisual-izer3D [84, 262, 263] and NestedVision3D [181]), web-enabled visualisations ofcomplex SELF programs [72, 73, 105], and the Virtual Reality Modeling Language(VRML) [264] for visualising call graphs [275], design patterns [44], and softwarearchitectures [82].
Several systems have explored the use of 3D graphics for algorithm animation.Some of these systems include Pavane [63, 222], Polka3D [240], Zeus3D [37],3D-AAPE [93], JCAT [168, 169], and Alice [65].
2.2.2 Source Code Visualisations
sv3D [154, 155, 156] is a framework for visualising source code and related at-tributes in 3D. For visualisations, the framework uses 3D metaphors based onthe SeeSoft [79] pixel representation and the 3D File Maps [202]. The frameworkuses transparency, elevation, and special 3D manipulators to overcome occlusion.They apply Shneiderman’s [228] seven high level user needs that an informationvisualisation application should support to the framework. There is no supportfor extraction and querying features, however. sv3D is implemented using Qt forthe user interface and Open Inventor for the rendering components. They alsoshow how sv3D can be combined with an information retrieval tool [273] to enrichsource code searching and browsing in MS Visual Studio. Previous work of theirs
2.2. SOFTWARE VISUALISATION 21
was done using immersive environments [150, 151] whereupon they created avisual language which defines a formal mapping from object-oriented languagesto a visualisation in virtual reality. The language only supports syntactic and staticfeatures of a program.
Numerous other systems have looked at visualising the static structure ofsoftware in 3D as well. J3Browser [1, 2, 3] explores Java class relations in VRMLwhile their other tool VisMOOS [85, 86] is an Eclipse plug-in that uses Java3D.Hierarchical Net [20, 21] visualises the structure of large software systems assoftware landscapes. VizzAnalyzer [147] is a framework designed for reverseengineering and can create visualisations in Java3D. VizzAnalyzer also has abuilt-in tool Vizz3D [179], which can be used as standalone for visualising classand package interaction, program evolution, and program quality as Java3D orOpenGL visualisations. Telea et al. [246] provide an open toolkit for visualisingtelecommunications software for the purposes of reverse engineering using OpenInventor. CCVisu [25, 26, 27] uses a method for computing clustering layouts ofsoftware systems for which the change history is available in VRML and SVG.WhiteCoats [164] visualises the evolution of software from CVS repositories usingVRML. Finally, the Rube [108, 121] framework uses VRML for finite state machines,but does not actually look at any specific source code.
Some researchers have even explored different visualisation metaphors forsource code comprehension. These metaphors include 3D cities (Software World [124,125, 126], Component City [48], 3D City [178], and CodeCity [266] which usesOpenGL), a 3D solar system metaphor [96], 3D self organizing maps [31], and 3Dcomputer game engines (Quake2 [123] and Quake3 [135]).
2.2.3 Object-Oriented Metrics
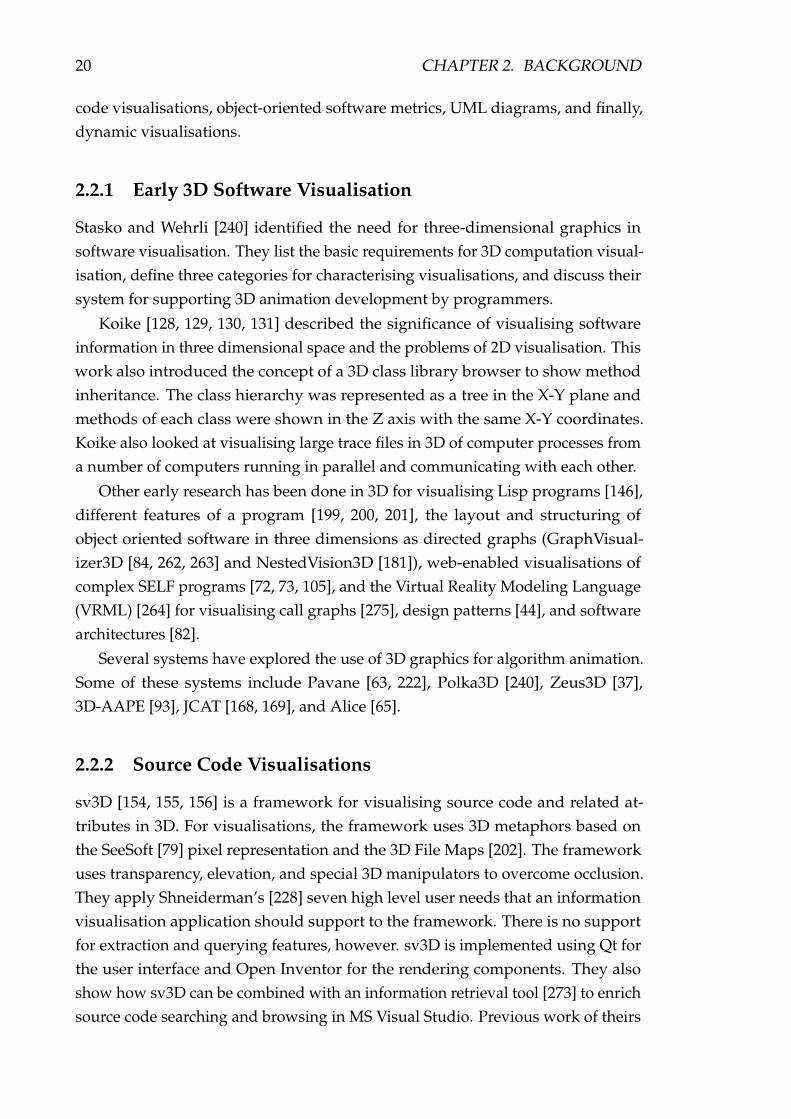
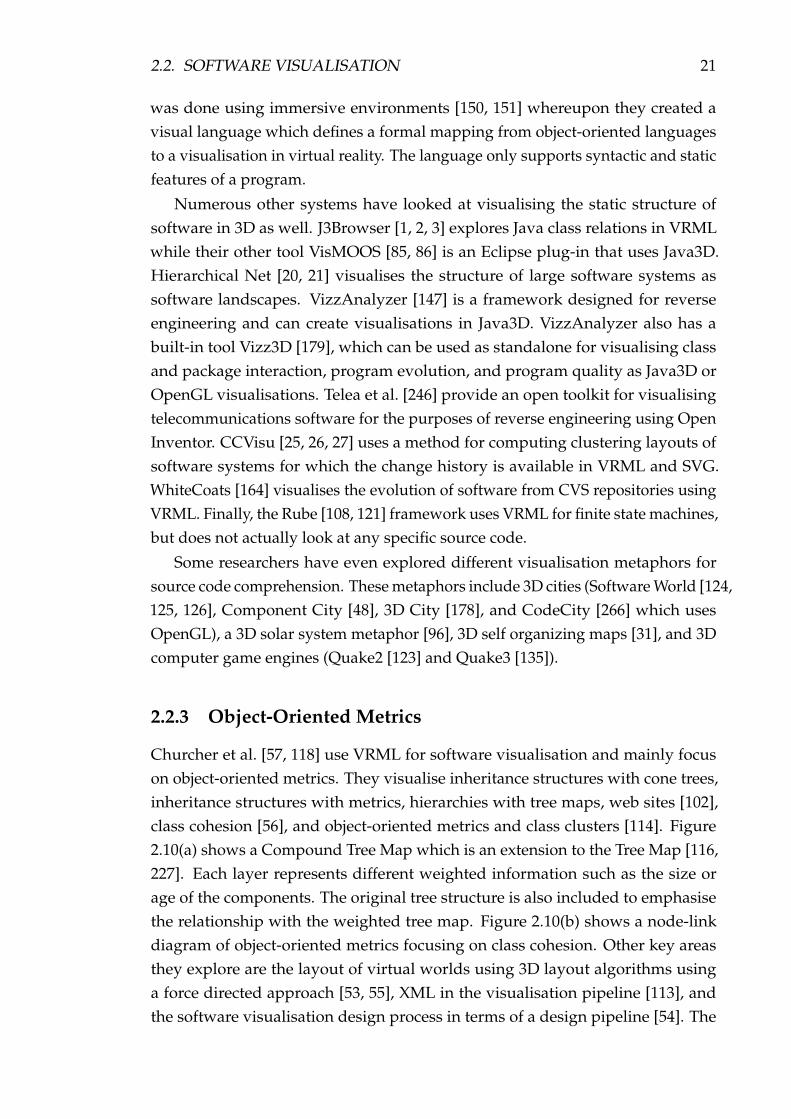
Churcher et al. [57, 118] use VRML for software visualisation and mainly focuson object-oriented metrics. They visualise inheritance structures with cone trees,inheritance structures with metrics, hierarchies with tree maps, web sites [102],class cohesion [56], and object-oriented metrics and class clusters [114]. Figure2.10(a) shows a Compound Tree Map which is an extension to the Tree Map [116,227]. Each layer represents different weighted information such as the size orage of the components. The original tree structure is also included to emphasisethe relationship with the weighted tree map. Figure 2.10(b) shows a node-linkdiagram of object-oriented metrics focusing on class cohesion. Other key areasthey explore are the layout of virtual worlds using 3D layout algorithms usinga force directed approach [53, 55], XML in the visualisation pipeline [113], andthe software visualisation design process in terms of a design pipeline [54]. The
22 CHAPTER 2. BACKGROUND
design pipeline is essentially an architecture for visualising software.
(a) 3D Compound Tree Map [57].
(b) Class Cohesion [57].
Figure 2.10: Object-Oriented Metrics in VRML [57].

2.2. SOFTWARE VISUALISATION 23
Various other systems and research groups have also looked at visualisingobject-oriented metrics in 3D including CrocCosmos [144, 145] (OpenGL andVRML), MetaViz [215, 216, 217] (Java3D), and Langelier et al. [137, 138] (Direct3D).
2.2.4 UML Diagrams
Visualisations of various UML diagrams such as class, object, sequence, andcollaboration diagrams have been explored in 3D using Java3D [66, 76], VRML[90, 92, 197] and X3D [163]. Displaying UML in 3D – which is intended to be drawnon 2D surfaces – does not scale well once there are many nodes in a world. Text isalso hard to render in 3D. When text is rotated in 3D it is hard for a user to viewwhat is meant to be displayed. Rather than representing strict UML diagrams in3D, some research has been conducted that represents UML diagrams as 3D geondiagrams [110, 111, 112]. The geon diagrams are made from 3D primitives suchas cones, spheres, cylinders, and boxes. There also exists a software visualisationtool based on the geon UML representation and implemented in Java3D [47].
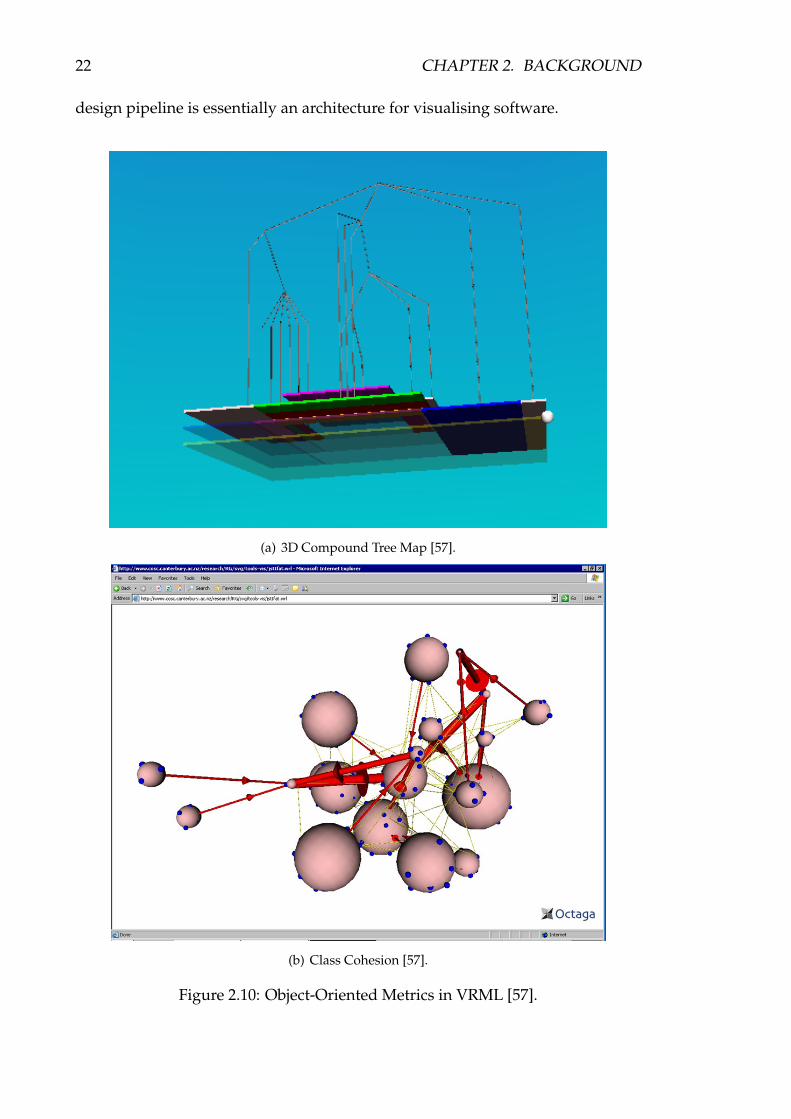
Figure 2.11 shows approximately 700 classes from the Java3D API implementedby McIntosh et al. [163] in X3D. The class information is parsed using JavaMLwhich creates an XML file for each class. Each XML class file is then transformedusing XSLT into separate X3D files. The root X3D visualisation file contains includestatements to all the other X3D class files. The layout of each of the X3D class filesin the root X3D visualisation file is not automated and is hard coded. They foundthat their UML class visualisations only worked in one X3D browser. This is theonly other research group that we are aware of that is using X3D to create UMLsoftware visualisations.
2.2.5 Dynamic Visualisations
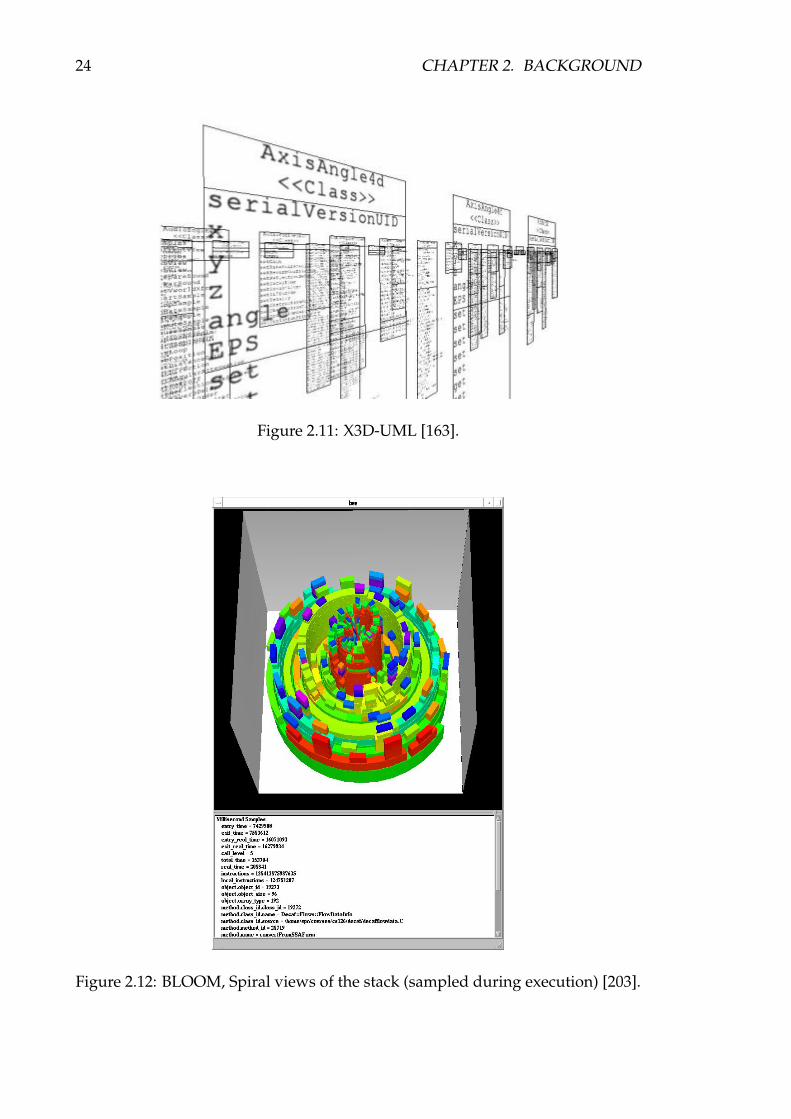
BLOOM [202, 203, 204, 205, 209, 210, 211] is a system for understanding softwarethrough visualisation, see Figure 2.12. BLOOM provides facilities for static anddynamic data collection and offers a wide range of data analysis. The systemincludes a visual query language for specifying what information should bevisualised. All these are used in conjunction with a back end that supports avariety of 2D and 3D visualisation strategies. Some more recent systems by thesame researchers include JIVE [206, 207] and JOVE [212] for dynamic visualisationsof real applications, however, these systems do not create 3D visualisations.
Pounamu [277] is a system which can produce static or dynamic softwarearchitecture notation in XML. They have built a number of tools that convert the
24 CHAPTER 2. BACKGROUND
Figure 2.11: X3D-UML [163].
Figure 2.12: BLOOM, Spiral views of the stack (sampled during execution) [203].
2.3. VARE: VISUALISATION ARCHITECTURE FOR REUSE 25
XML notation about a program into the Graph eXchange Language (GXL)2 [269]and can then convert the GXL information into SVG or VRML [241]. Knight andMunro [127] have also explored using GXL to create visualisations for programcomprehension.
CodeCrawler [139, 140, 141] and the associated tools TraceCrawler [97, 98]and CCJUN [272] explore visualising feature traces in 3D for the purposes ofobject-oriented metrics. These tools use the Jun 3D framework to render thevisualisations. Jun 3D is implemented in Smalltalk and rendered in OpenGL.
Storer et al. [242] has developed a tool for teaching object-oriented program-ming concepts to introductory level computer science courses. The tool providesJava3D visualisations of the execution of Java programs including representationof classes, objects, references, and method execution.
Charters et al. [49] question whether the time has come when no new advancesare being made in software visualisation and all advances are just variants onold themes. We now discuss our approach to advancing the field of softwarevisualisation.
2.3 VARE: Visualisation Architecture for REuse
The Visualisation Architecture for REuse (VARE) [160] project is an ongoing effortin our software design research group for generating web-based visualisationsof programs to support code reuse. The design of VARE supports multiple pro-gramming languages and provides user control for the different parts in thevisualisation process.
2.3.1 Programming Mapping Visualisation
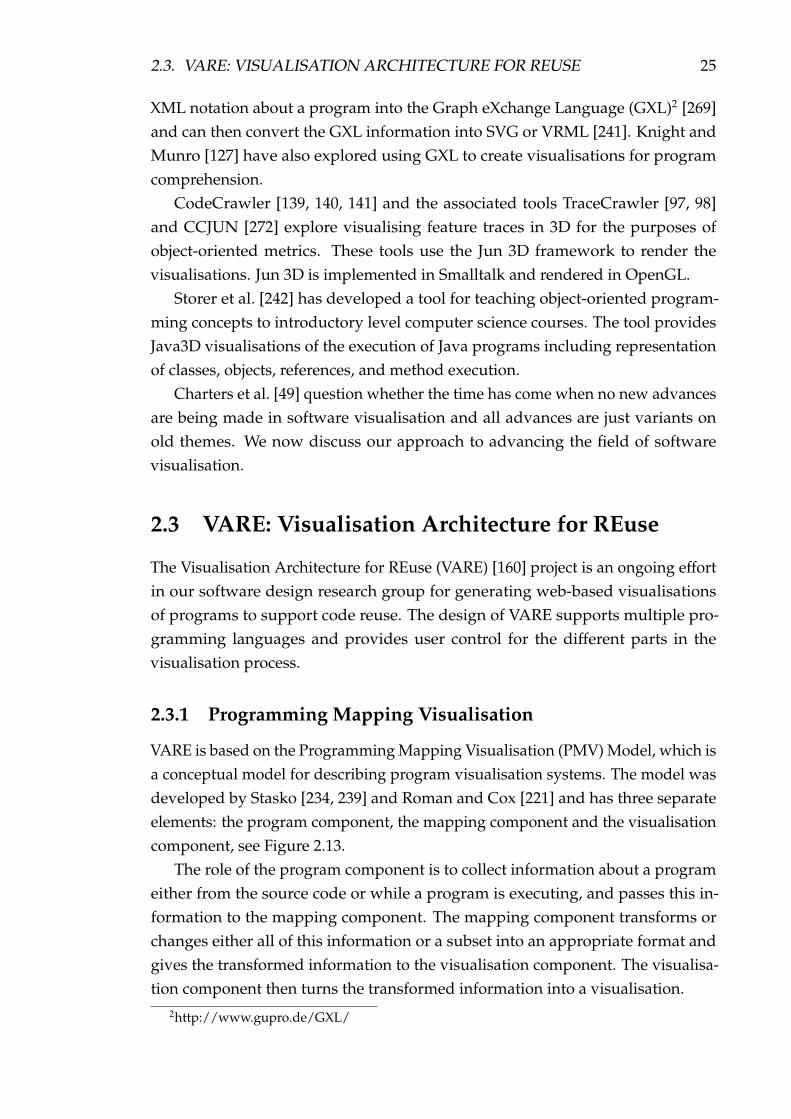
VARE is based on the Programming Mapping Visualisation (PMV) Model, which isa conceptual model for describing program visualisation systems. The model wasdeveloped by Stasko [234, 239] and Roman and Cox [221] and has three separateelements: the program component, the mapping component and the visualisationcomponent, see Figure 2.13.
The role of the program component is to collect information about a programeither from the source code or while a program is executing, and passes this in-formation to the mapping component. The mapping component transforms orchanges either all of this information or a subset into an appropriate format andgives the transformed information to the visualisation component. The visualisa-tion component then turns the transformed information into a visualisation.
2http://www.gupro.de/GXL/
26 CHAPTER 2. BACKGROUND
Figure 2.13: The Programming Mapping Visualisation Model [221, 234, 239].
2.3.2 Architecture
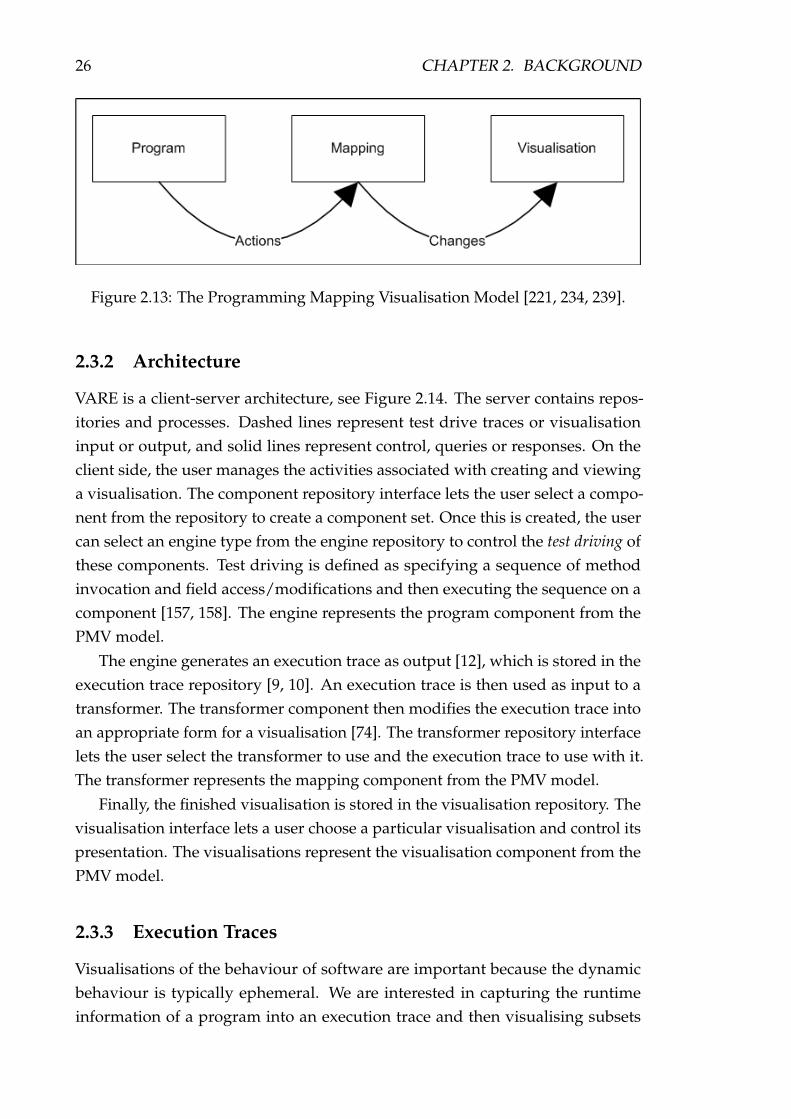
VARE is a client-server architecture, see Figure 2.14. The server contains repos-itories and processes. Dashed lines represent test drive traces or visualisationinput or output, and solid lines represent control, queries or responses. On theclient side, the user manages the activities associated with creating and viewinga visualisation. The component repository interface lets the user select a compo-nent from the repository to create a component set. Once this is created, the usercan select an engine type from the engine repository to control the test driving ofthese components. Test driving is defined as specifying a sequence of methodinvocation and field access/modifications and then executing the sequence on acomponent [157, 158]. The engine represents the program component from thePMV model.
The engine generates an execution trace as output [12], which is stored in theexecution trace repository [9, 10]. An execution trace is then used as input to atransformer. The transformer component then modifies the execution trace intoan appropriate form for a visualisation [74]. The transformer repository interfacelets the user select the transformer to use and the execution trace to use with it.The transformer represents the mapping component from the PMV model.
Finally, the finished visualisation is stored in the visualisation repository. Thevisualisation interface lets a user choose a particular visualisation and control itspresentation. The visualisations represent the visualisation component from thePMV model.
2.3.3 Execution Traces
Visualisations of the behaviour of software are important because the dynamicbehaviour is typically ephemeral. We are interested in capturing the runtimeinformation of a program into an execution trace and then visualising subsets
2.3. VARE: VISUALISATION ARCHITECTURE FOR REUSE 27
Figure 2.14: The VARE architecture [160].
28 CHAPTER 2. BACKGROUND
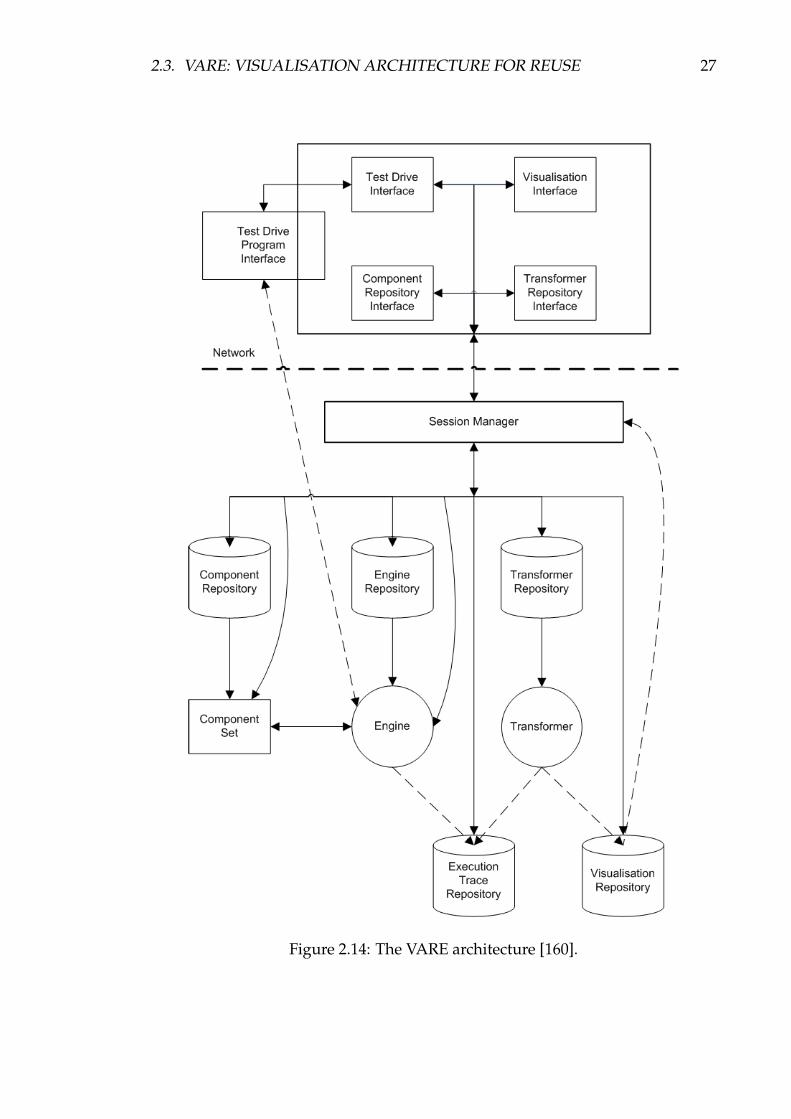
of the information contained within an execution trace. Tracing the executionof a component involves catching information such as method calls, methodreturns, field accesses, field modifications, object creation and object deletion in anexecution trace. Static information such as classes, super-classes, methods, andfields can also be gathered from source files.
We have created a list of requirements for the kinds of information we wouldlike to see in an execution trace language and have created two XML executiontrace languages. Information on the requirements [159] and the languages [12], theProcess Abstraction Language (PAL) [161] and Reusable Component Descriptions(RCD) for static information and eXtensible Trace Executions (XTE) for dynamicinformation [157] can be found elsewhere.
Figure 2.15 shows an example XTE execution trace from a Java program. Theexample shows three events, the creation of an object, a method call, and a methodreturn. Each event has an event id and an id for the thread the event belongsto. Lines 1–7 show the StoreView object being created. Lines 8–13 show thegetUtilities method being called, and then lines 14–19 show the return of thegetUtilities method.
1 <xte:objectcreation xte:eventid="event56" xte:objectid="object22"
2 xte:threadid="thread1">
3 <xte:complextype>
4 <xte:typename>nz.ac.vuw.mcs.comp301.view.gui.StoreView
5 </xte:typename>
6 </xte:complextype>
7 </xte:objectcreation>
8 <xte:methodcall xte:eventid="event57" xte:receiver=""
9 xte:sender="object22" xte:threadid="thread1">
10 <xte:methodname>getGUIUtilities</xte:methodname>
11 <xte:typename>nz.ac.vuw.mcs.comp301.view.gui.GUIUtilities
12 </xte:typename>
13 </xte:methodcall>
14 <xte:methodreturn xte:eventid="event58" xte:threadid="thread1">
15 <xte:objectvalue xte:objectid=""/>
16 <xte:methodname>getGUIUtilities</xte:methodname>
17 <xte:typename>nz.ac.vuw.mcs.comp301.view.gui.GUIUtilities
18 </xte:typename>
19 </xte:methodreturn>
Figure 2.15: XTE — example execution trace of a Java program.

2.3. VARE: VISUALISATION ARCHITECTURE FOR REUSE 29
2.3.4 Visualisation Tools
Some recent visualisation tools that use the VARE architecture will now be de-scribed. Spider [157, 158] is a prototype for exploring and documenting reusablecomponents in a web environment. Figure 2.16 shows a test drive of the JavaCalendar component. Spider documents components with Reusable ComponentDescriptions (RCD) and execution traces with eXtensible Trace Executions (XTE)by interpreting information stored in a component, detecting events in the run-time environment, and interrogating the runtime environment’s state. Spider usesthe Java Debugger Interface [165] to extract information.
Figure 2.16: Spider, a test drive of the Java Calendar component [157, 158].
Visualisation of Execution Traces (VET) [162] is a prototype visualisation appli-cation that lets users interact with and understand execution traces. VET followsthe methodology of show all data of an execution trace, then let users filter out

30 CHAPTER 2. BACKGROUND
unwanted data, and provide details on demand. VET uses filters so that userscan directly adjust the information being displayed by the visualisations. VET is aplug-in based architecture which allows users to design their own visualisationplug-ins, so that a user can decide what to draw and when particular events occur.Users can also design their own filters. Figure 2.17 shows two visualisations, thetop one is a sequence diagram while the bottom one is an association diagram.The two visualisations are synchronised at the same location within the executiontrace and also with the same information that is displayed.
Figure 2.17: VET displaying a sequence and an association diagram of the samedata from an execution trace [162].
Blur [74, 75] is a prototype for visualising execution traces by transformingthem into SVG visualisations that represent UML class or sequence diagrams. Bluris implemented as a Java Servlet running in Apache Tomcat and can be accessedover the web. Figure 2.18(a) shows a SVG UML interactive class diagram. Whenthe mouse covers a piece of code in the right hand side frame, the left hand sidehighlights the appropriate class or method in the UML diagram. This is a helpfultool for developers, because they can have a clear understanding of the classdiagram, and how the code works. Figure 2.18(b) shows a SVG UML sequence

2.3. VARE: VISUALISATION ARCHITECTURE FOR REUSE 31
diagram. This is also helpful for the developer, as they can see the sequence ofinteractions during the execution of a program.
Our research group have previously explored a few 2D technologies for visual-ising our execution traces in VARE. Blur [74, 75] identified several reasons whySVG failed to meet expectations for software visualisation. We are now interestedin seeing if there are any possible web-based 3D technologies that could be usedto complement our SVG visualisations.
2.3.5 3D Technologies
The aim of this thesis is to evaluate X3D for use in software visualisation. In thissection we briefly review some alternative 3D technologies. A more completeexploration would require measuring each of the alternative solutions against ourframework for evaluating software visualisation media (§5) and compare with ourresults from evaluating X3D (§6).
VRML
The Virtual Reality Modeling Language (VRML) [6, 103, 257, 264] is a standardfile format for representing 3D interactive vector graphics, over the web. Thefirst version of VRML was specified in November 1994. The current version wascreated in 1997 and is referred to as VRML97. VRML is a text file format wherea 3D polygon can be specified along with for example the surface colour, image-mapped textures, shininess, and transparency. Animations, sounds, lighting, andother aspects of the virtual world can interact with the user or may be triggeredby external events. VRML files are called worlds and have the .wrl extension.
Other VRML specifications include an XML Schema version of VRML3 and anobject-oriented language which extends VRML [67]. Neither of these applicationsare well supported or sponsored by the Web3D Consortium. VRML was not usedfor this project as X3D has replaced it and it is not easy to incorporate VRML withother applications. Of note is that the Classic VRML encoding and the immersiveprofile of X3D are directly similar to VRML97. Thus, any approach applied to X3Dshould also work for VRML97 as well.
Java 3D
Java 3D [225] provides a set of object-oriented interfaces that support a simple,high-level programming model you can use to build, render, and control thebehaviour of 3D objects and visual environments. The language is not lightweight
3http://www.xvrml.net

32 CHAPTER 2. BACKGROUND
(a) SVG interactive class diagram [74].
(b) SVG sequence diagram [74].
Figure 2.18: Blur SVG visualisation tool [74].

2.3. VARE: VISUALISATION ARCHITECTURE FOR REUSE 33
as it is a binary format and needs a viewer to display the technology. Java3D doesnot work with commercial web browsers unless used with Java applets, basicgraphics need to be encoded, and navigation options have to be developed.
OpenGL
The Open Graphics Library (OpenGL)4 is a specification defining a cross-languagecross-platform API for writing applications that produce 2D and 3D computergraphics. The interface consists of about 250 different function calls which can beused to draw complex three-dimensional scenes from simple primitives. OpenGLis used in CAD, virtual reality, scientific visualisation programs, informationvisualisation, and video game development. OpenGL is a very heavyweightsolution and requires writing all functionality as a software program to producea visualisation. Other programming languages make use of OpenGL by havinglanguage bindings for rendering.
Linden Scripting Language
Second Life5 has a scripting language called the Linden Scripting Language(LSL) [223] named after the company that created Second Life, Linden Labs. LSLis a programming language for users to create virtual worlds in Second Life andhas a syntax that is similar to C. The scripts are compiled to byte-code before run-time execution in a virtual machine on a Linden Lab server. LSL is event driven,features states, 3D variable types, and has functions for manipulating physics andavatar interaction.
COLLAborative Design Activity (COLLADA)
COLLAborative Design Activity (COLLADA) [14] is an intermediate or inter-change file format designed for interactive 3D applications. COLLADA is an openXML standard for exchanging digital assets that store their assets in incompatibleproprietary formats.
COLLADA was originally created by Sony Computer Entertainment as theofficial format for PlayStation 3 and PlayStation Portable development [15]. COL-LADA is now owned by the Khronos Group6 which also manages the OpenGLspecification.
COLLADA was designed as a format for transporting data from one contentauthoring tool to another including: Maya, 3D Studio Max, Softimage XSI, and
4http://www.opengl.org5http://secondlife.com6http://www.khronos.org/collada

34 CHAPTER 2. BACKGROUND
Blender. Maya and 3D Studio Max are both owned by Autodesk. Some applica-tions use the COLLADA format including the Unreal Tournament game engine7
and Google Earth8.
Extensible Application Markup Language (XAML)
The Extensible Application Markup Language (XAML)9 is a new declarative XMLlanguage that defines objects and their properties. The syntax of XAML focuseson defining the user interface for the Windows Presentation Foundation (WPF)or Silverlight and is separate from the application code. XAML supports 3D andcontrol features. XAML requires the .Net framework to be installed on a usersmachine. Since XAML is very new, a Microsoft technology, not cross platform,and primarily used for user interfaces it is not a standard worth considering yetfor our software visualisations.
Graph Drawing Systems
One final kind of alternative technology would be to use specific graph draw-ing [250] systems designed for drawing large 3D directed graphs. Some systemsinclude WilmaScope [77] (Java3D) and Walrus10. Most of these systems do notrun in a web browser and would require lots of customisation to work with oursoftware visualisation system.
2.4 Summary
We are interested in understanding what software looks like to help with softwarereuse, software maintenance, and software re-engineering. We believe that captur-ing the static (source code) and dynamic (run-time) information about software inexecution traces, and then applying information visualisation techniques to theexecution traces, will help to assist developers to understand the structure andbehaviour of software.
We have an existing software visualisation architecture [160] that requires toolsand visualisations to be created to understand software. The interface to ourtools are web based and we have already created a 2D visualisation tool that canproduce SVG software visualisations [74, 75]. Ware et al. [261] demonstrate thatdisplaying object oriented software in three dimensions instead of two can make it
7http://www.unrealtournament3.com8http://earth.google.com9http://www.xaml.net
10http://www.caida.org/tools/visualization/walrus/

2.4. SUMMARY 35
easier for users to understand the data. We want to create software visualisationsover the web in 3D.
Very little research has been done on the applicability of using X3D [265]– the Web3D Consortium’s open standard for web 3D graphics – for softwarevisualisation. We are aware of one other research group using X3D for visualisingUML class diagrams [163], see Figure 2.11 (§2.2.4). We believe it is imperative toevaluate X3D to determine how applicable X3D is for use in software visualisation.The benefit of this evaluation will be that it will help other developers to determinewhether or not X3D is an appropriate media for use in the development of theirsoftware visualisation systems.
Most existing 3D software visualisation systems visualise source code, object-oriented metrics, UML diagrams, or execution traces. Most of these systems arenot web based and are usually standalone desktop applications. The visualisationsproduced from these system usually render the visualisations in languages thatare either no longer supported (VRML), are binary (Java3D), and are very heavyweight (OpenInventor, OpenGL).
X3D is more light-weight, is the open standard for web 3D graphics, has anXML encoding, and can be used over the web. X3D alleviates the problems of other3D languages (§2.3.5) as it is not a heavy-weight solution, not a binary format,and not designed as an intermediary format. In this thesis we have decided toevaluate X3D [265] for use in software visualisation to see if these characteristicsof X3D meet the requirements for our ongoing software visualisation researchproject (§2.3).
This thesis aims to answer the following research questions:
• How good is X3D for use in software visualisation?
• How well does X3D support the software visualisation pipeline, by creatingX3D visualisations from execution traces?
• How well does X3D support our software visualisation architecture?
In the next chapter we explore the X3D language, while the following chaptershows our 3D visualisation tool and the X3D software visualisations that can beproduced from the tool.

36 CHAPTER 2. BACKGROUND

Chapter 3
Exploring X3D
Contents3.1 Overview . . . . . . . . . . . . . . . . . . . . . . . . . . . . . . . . 38
3.2 Specification . . . . . . . . . . . . . . . . . . . . . . . . . . . . . . . 39
3.2.1 Basic Example . . . . . . . . . . . . . . . . . . . . . . . . . . 39
3.2.2 Encodings . . . . . . . . . . . . . . . . . . . . . . . . . . . . 39
3.2.3 Profiles . . . . . . . . . . . . . . . . . . . . . . . . . . . . . . 39
3.3 X3D Nodes . . . . . . . . . . . . . . . . . . . . . . . . . . . . . . . . 43
3.3.1 Geometry . . . . . . . . . . . . . . . . . . . . . . . . . . . . 43
3.3.2 Grouping . . . . . . . . . . . . . . . . . . . . . . . . . . . . 44
3.3.3 Viewing and Navigation . . . . . . . . . . . . . . . . . . . . 47
3.3.4 Lighting, Environment, and Sound . . . . . . . . . . . . . . 47
3.3.5 Animation and Interaction . . . . . . . . . . . . . . . . . . 48
3.3.6 Prototypes . . . . . . . . . . . . . . . . . . . . . . . . . . . . 49
3.4 Resources . . . . . . . . . . . . . . . . . . . . . . . . . . . . . . . . 49
3.4.1 X3D Browsers and Plug-ins . . . . . . . . . . . . . . . . . . 49
3.4.2 Content Authoring and Editing Tools . . . . . . . . . . . . 51
3.4.3 Export and Translator Tools . . . . . . . . . . . . . . . . . . 55
3.5 Discussion . . . . . . . . . . . . . . . . . . . . . . . . . . . . . . . . 55
3.5.1 Improvements to the Specification . . . . . . . . . . . . . . 57
3.5.2 Future of X3D on the Web . . . . . . . . . . . . . . . . . . . 58
37

38 CHAPTER 3. EXPLORING X3D
X3D [265] is a royalty-free open standards file format and run-time architectureto represent and communicate 3D scenes and objects over the web. X3D is anInternational Standards Organization (ISO) standard that provides a system forthe storage, retrieval, interactive, and playback of real time graphics contentembedded in applications, all within an open architecture to support a wide arrayof domains and user scenarios [265]. The aim of this chapter is to give an overviewof X3D, highlighting key components from the specification, describing someavailable tools, and discussing the prospects and the viability of X3D on the webin the future.
3.1 Overview
X3D is the successor to the Virtual Reality Modeling Language (VRML) [264]from the same standards authority, the Web3D Consortium1. There exists a goodoverview of X3D fundamentals [42] and a book on X3D by Don Brutzman andLeonard Daly [41]. Complete details on VRML and early details on X3D areavailable in the literature [6, 257].
There is a broad range of application areas where X3D is currently being ap-plied. Some areas include interactive marketing (entertainment and educationaltitles), building architecture and urban planning, geography, scientific visualisa-tion, industry engineering (oil and gas, automotive, e-learning, virtual trainingand simulation for military and navy), mobiles and PDAs, and education [52].
The basic structure of X3D documents is very similar to any other XML doc-ument. Scene graphs2, nodes, and fields (in X3D terminology) correspond todocuments, elements, and attributes (in XML terminology) [41]. X3D documentscombine both geometry and the run-time behaviour into a single XML file. Thescene graph is the run-time environment of an X3D file. Nodes within the scenegraph can have descriptive fields and can contain one or more child nodes.
X3D content maybe presented in a native X3D browser, a web browser that hasan X3D plug-in or transformed and delivered to a VRML browser. X3D contentcan be created from DTDs or XML Schemas and edited using authoring tools, texteditors, or transformed using Extensible Stylesheet Language Transformations(XSLT) [191, 192]. X3D allows scripts to be embedded such as JavaScript, or refer toexternal JavaScript or Java binary files. The X3D browsers allow full 3D navigation.
1http://www.web3d.org2A scene graph is a directed, acyclic graph containing objects represented as nodes and the
relationships between objects in the 3D world [89].

3.2. SPECIFICATION 39
3.2 Specification
The first X3D draft specification was developed in 1999 and launched as an openstandard in 2001. The specification was first submitted to the ISO in 2002 andbecame official in 2004 as ISO/IEC 19775:2004 - Extensible 3D (X3D) [89] or X3Dversion 3.0. The current version is 3.2.
3.2.1 Basic Example
Figure 3.1 shows the basic Hello World X3D example [41]. The X3D code declaresthe text “Hello world!”, a sphere, and applies an image of the world as texture fromFigure 3.2 to the sphere. Figure 3.3 displays the X3D content in Mozilla Firefoxversion 2.0 using the Octaga X3D web browser plug-in. Figure 3.4 represents thetree structure of the X3D nodes from Figure 3.1.
A user can rotate the globe in Figure 3.3 or zoom-in/zoom-out to find countriesof interest. Lines 1-7 in Figure 3.1 are default X3D information which define theXML version, the X3D DTD and XML Schema, Immersive profile, and the X3Droot node. Lines 8-10 define the meta data, which there can be more of. Lines11-28 define the contents of the X3D scene. Line 12 defines a specific viewpointwhich will be the default view that the X3D browser loads initially. Lines 14-20define the sphere with the image of the world used as texture. Lines 21-26 definethe text to display and define what colour the text is. Line 29 is the closing tag ofthe X3D root element.
3.2.2 Encodings
There are specifications for encoding X3D in XML, binary, and a VRML derivedencoding called X3D classic. X3D files using the XML encoding are saved with thefile extension .x3d, .x3dv for X3D VRML classic encoded, or .x3db for X3D binary.VRML files have the extension of .wrl which stands for world. There are alsolanguage bindings for ECMAScript (implemented as JavaScript) and Java as wellas node prototyping, which together provide support for scene graph extensionsand new language functionality [41].
3.2.3 Profiles
X3D is organised as a set of components where each component describes a set ofrelated functionality. Profiles are built from components and are standardised setsof extensions to meet specific application needs. There are four main profiles inascending functionality order, see Figure 3.5:

40 CHAPTER 3. EXPLORING X3D
1 <?xml version="1.0" encoding="UTF-8"?>
2 <!DOCTYPE X3D PUBLIC "ISO//Web3D//DTD X3D 3.2//EN"
3 "http://www.web3d.org/specifications/x3d-3.2.dtd">
4 <X3D profile="Immersive" version="3.1"
5 xmlns:xsd="http://www.w3.org/2001/XMLSchema-instance"
6 xsd:noNamespaceSchemaLocation="http://www.web3d.org/
7 specifications/x3d-3.1.xsd">
8 <head>
9 <meta content="HelloWorld.x3d" name="title"/>
10 </head>
11 <Scene>
12 <Viewpoint description="hello, world!" position="0 0 10"/>
13 <Group>
14 <Shape>
15 <Sphere/>
16 <Appearance>
17 <ImageTexture url=‘"earth-topo.png"
18 "http://www.web3d.org/x3d/content/examples/earth-topo.png"’ />
19 </Appearance>
20 </Shape>
21 <Shape>
22 <Text string=‘"Hello" "world!"’ />
23 <Appearance>
24 <Material diffuseColor="1 1 1"/>
25 </Appearance>
26 </Shape>
27 </Group>
28 </Scene>
29 </X3D>
Figure 3.1: X3D content that encodes a sphere with an image of the world used astexture and the text “Hello world!” [41].
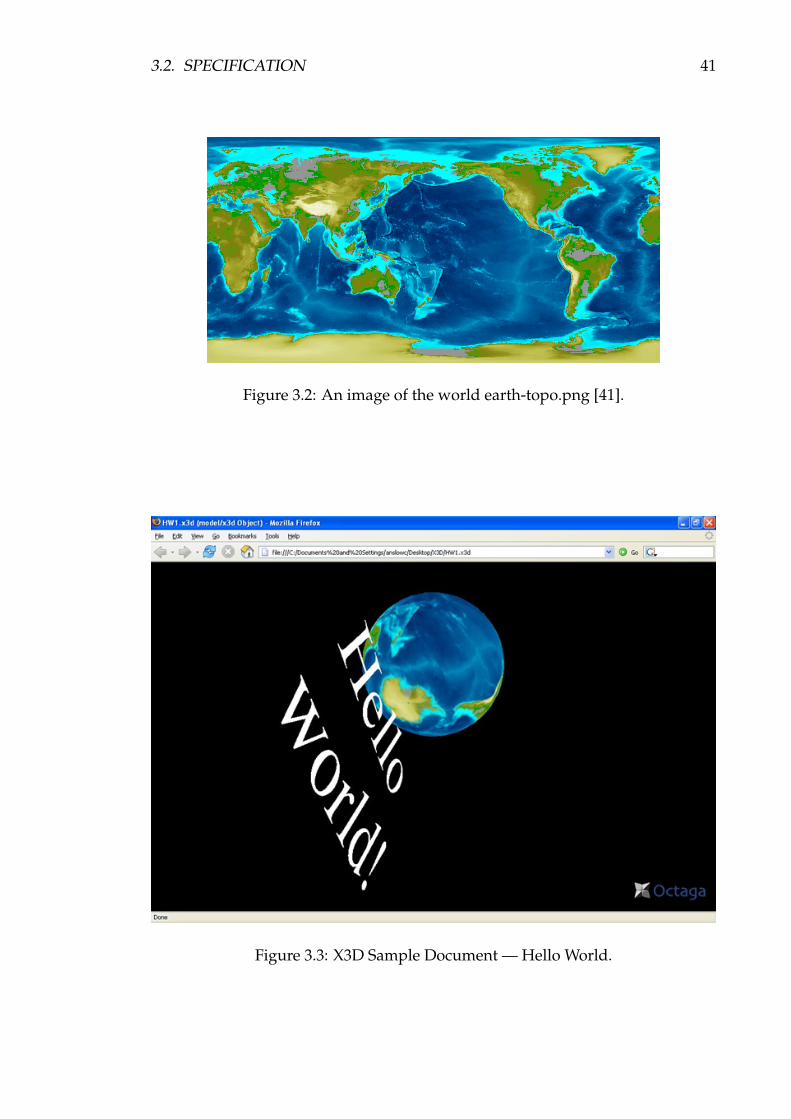
3.2. SPECIFICATION 41
Figure 3.2: An image of the world earth-topo.png [41].
Figure 3.3: X3D Sample Document — Hello World.

42 CHAPTER 3. EXPLORING X3D
Figure 3.4: The X3D nodes represented as a tree structure from the Hello Worldsample document.
Figure 3.5: X3D Baseline Profiles [265].

3.3. X3D NODES 43
• Interchange - is the basic profile for communicating between applications,and supports geometry, texturing, basic lighting, and animation.
• Interactive - enables basic interaction with a 3D environment by addingvarious sensor nodes for user navigation and interaction, enhanced timing,and additional lighting.
• Immersive - enables full 3D graphics and interaction, including audio sup-port, collision, fog, and scripting.
• Full - includes all defined nodes in the X3D specification and incorporatesother advanced components such as NURBS3, H-Anim4 and GeoSpatial5.
There are other additional profiles that complement the main four profileswhich include MPEG-4 Interactive and CAD Distillation Format (CDF). MPEG-4 Interactive is a small subset of the Interactive profile designed for broadcast,handheld devices and mobile phones. CDF enables translations of CAD data toan open format for publishing and interactive media.
3.3 X3D Nodes
There are a number of nodes that can be used in an X3D scene including: geom-etry, grouping, appearance, material, textures, viewing, navigation, animation,interaction, lighting, environment, sound, and prototypes. We will now give abrief overview of some of the nodes. Further detailed information can be foundelsewhere [41].
3.3.1 Geometry
X3D supports 2D and 3D geometry. The 2D geometry nodes include: arcs, closedarcs, circles, polylines, polypoints, rectangles and triangles. The 3D geometrynodes include: boxes, cones, cylinders, spheres, indexed face sets, indexed linesets, elevation grids, and extrusion (see Figure 3.6).
Boxes, cones, cylinders, and spheres are specified as typical 3D shapes. Indexedface sets and indexed line sets specify coordinate points which are then indexed todraw shapes with faces or lines. Elevation grids are used to draw physical worldobjects like terrains, grounds, hills, and skies. Extrusion nodes, see Figure 3.7,
3NURBS is short for non-uniform, rational B-spline and is used for generating and representingcurves and surfaces.
4Humanoid Animation is an abstract representation for modeling 3D human figures.5The GeoSpatial component can be used for geographic and geospatial applications.
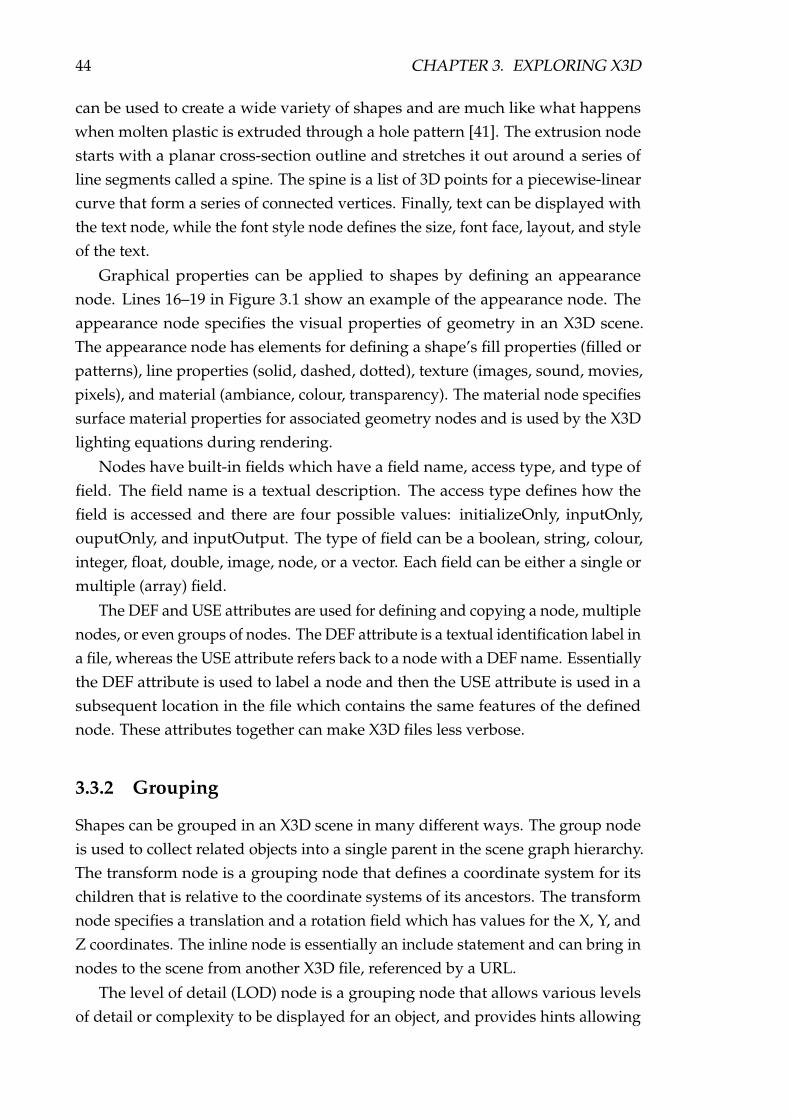
44 CHAPTER 3. EXPLORING X3D
can be used to create a wide variety of shapes and are much like what happenswhen molten plastic is extruded through a hole pattern [41]. The extrusion nodestarts with a planar cross-section outline and stretches it out around a series ofline segments called a spine. The spine is a list of 3D points for a piecewise-linearcurve that form a series of connected vertices. Finally, text can be displayed withthe text node, while the font style node defines the size, font face, layout, and styleof the text.
Graphical properties can be applied to shapes by defining an appearancenode. Lines 16–19 in Figure 3.1 show an example of the appearance node. Theappearance node specifies the visual properties of geometry in an X3D scene.The appearance node has elements for defining a shape’s fill properties (filled orpatterns), line properties (solid, dashed, dotted), texture (images, sound, movies,pixels), and material (ambiance, colour, transparency). The material node specifiessurface material properties for associated geometry nodes and is used by the X3Dlighting equations during rendering.
Nodes have built-in fields which have a field name, access type, and type offield. The field name is a textual description. The access type defines how thefield is accessed and there are four possible values: initializeOnly, inputOnly,ouputOnly, and inputOutput. The type of field can be a boolean, string, colour,integer, float, double, image, node, or a vector. Each field can be either a single ormultiple (array) field.
The DEF and USE attributes are used for defining and copying a node, multiplenodes, or even groups of nodes. The DEF attribute is a textual identification label ina file, whereas the USE attribute refers back to a node with a DEF name. Essentiallythe DEF attribute is used to label a node and then the USE attribute is used in asubsequent location in the file which contains the same features of the definednode. These attributes together can make X3D files less verbose.
3.3.2 Grouping
Shapes can be grouped in an X3D scene in many different ways. The group nodeis used to collect related objects into a single parent in the scene graph hierarchy.The transform node is a grouping node that defines a coordinate system for itschildren that is relative to the coordinate systems of its ancestors. The transformnode specifies a translation and a rotation field which has values for the X, Y, andZ coordinates. The inline node is essentially an include statement and can bring innodes to the scene from another X3D file, referenced by a URL.
The level of detail (LOD) node is a grouping node that allows various levelsof detail or complexity to be displayed for an object, and provides hints allowing
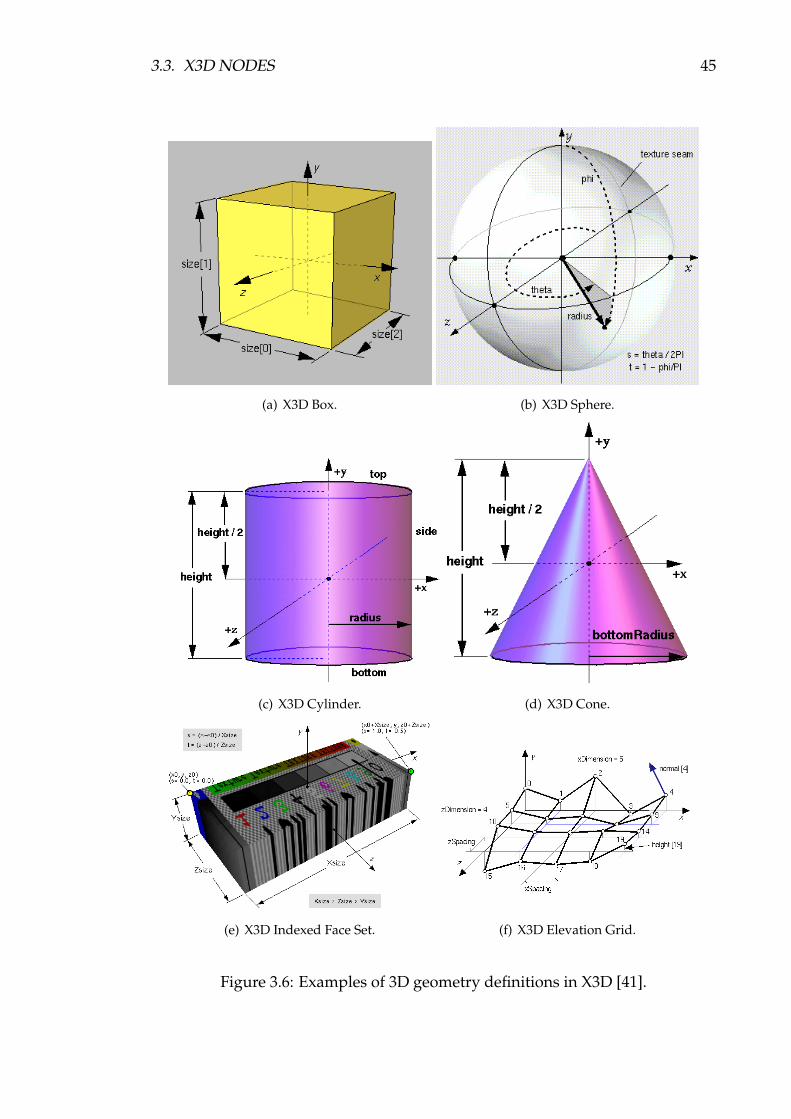
3.3. X3D NODES 45
(a) X3D Box. (b) X3D Sphere.
(c) X3D Cylinder. (d) X3D Cone.
(e) X3D Indexed Face Set. (f) X3D Elevation Grid.
Figure 3.6: Examples of 3D geometry definitions in X3D [41].
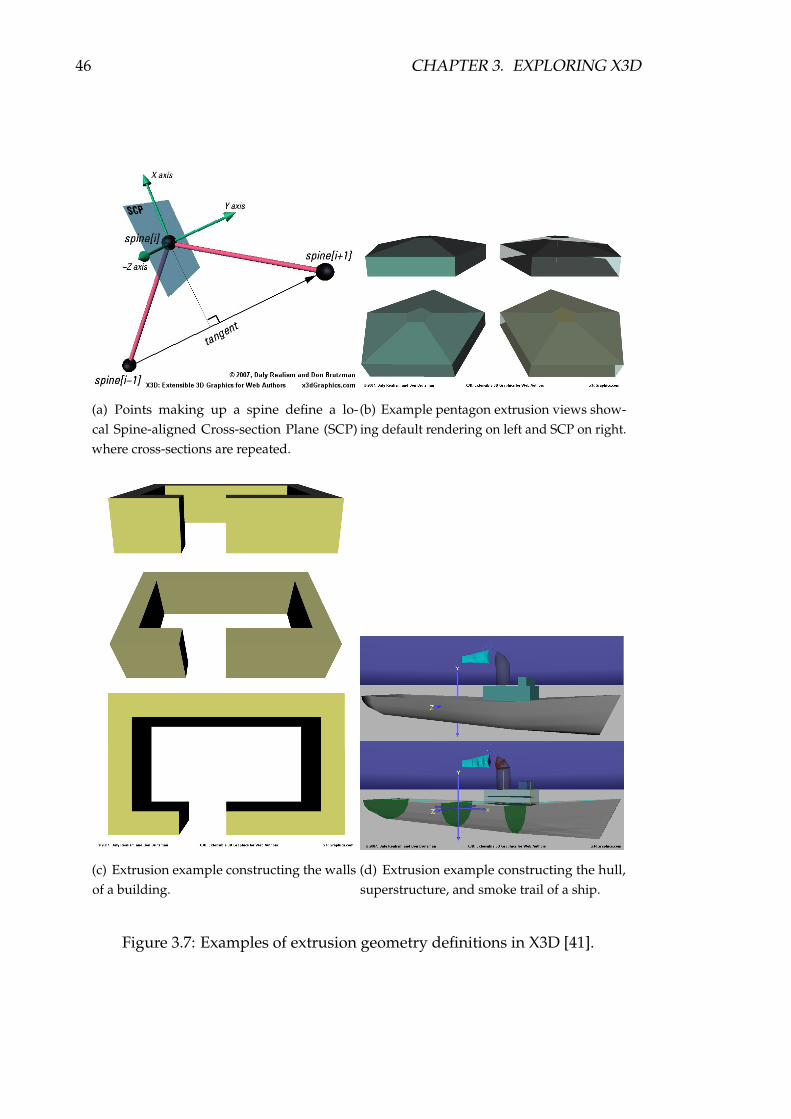
46 CHAPTER 3. EXPLORING X3D
(a) Points making up a spine define a lo-cal Spine-aligned Cross-section Plane (SCP)where cross-sections are repeated.
(b) Example pentagon extrusion views show-ing default rendering on left and SCP on right.
(c) Extrusion example constructing the wallsof a building.
(d) Extrusion example constructing the hull,superstructure, and smoke trail of a ship.
Figure 3.7: Examples of extrusion geometry definitions in X3D [41].

3.3. X3D NODES 47
browsers to automatically choose the appropriate version of the object based onthe distance from the viewer. The switch node can be used to render differentchild nodes (zero or more nodes) that are grouped together. The switch node canbe used for animating geometry and providing customised level of detail. Therendering of the order of the child nodes can also be controlled.
3.3.3 Viewing and Navigation
X3D allows end-users full 3D navigation in a scene and supports the followingnavigation types: any, walk, examine, fly, look-at, none, slide, and pan. Thenavigation info node contains information describing the physical characteristicsof the viewer’s avatar and viewing model. The navigation info node can definethe default navigation type, navigation speed, and rotation speed for a scene thatwill be used when a user loads an X3D file.
Users can navigate to predefined locations and viewing orientations usingviewpoints. The viewpoint node defines a specific location in the local coordinatesystem from which a user may view an X3D scene. Viewpoints can also havetextual descriptions to distinguish them. The anchor node allows geometry to belinked to other viewpoints in the scene or to external content (e.g. X3D or HTMLfiles). The anchor node is similar to the HTML anchor tag.
Scenes can be more responsive for users when the billboard and collision nodesare used. The billboard node can be used to adjust shapes such as text to alwaysbe readable in the current viewpoint by a user. The billboard node is a groupingnode which modifies its coordinate system so that the billboard node’s local Z-axisturns to point at the viewer and the children geometry nodes are also rotated tochange position. The collision node defines object collision detection properties fornodes. The collision node can be disabled to allow users to pass through objects.
3.3.4 Lighting, Environment, and Sound
Various lighting nodes can be used to make an effect on the X3D scene. Directionallight illuminates the environment in a single direction. The headlight node isturned on by default as directional light and is fixed at the location and directionof the current user viewpoint. The point light node provides a single light sourcethat is spread evenly in all directions, while the spotlight node highlights geometrywithin a cone-shaped beam.
The background and fog nodes can be used to provide important environmen-tal effects. The background node can be used to colour the ground and sky withan array of colours or image textures. The fog node gradually replaces the colour

48 CHAPTER 3. EXPLORING X3D
reflected by objects according to the distance from the viewer.
The load sensor node can be used for tracking the download progress ofexternal files which can delay the start of animations until all downloads havecompleted. The proximity sensor node is used to detect changes in the currentviewer position and orientation, and can be used to create heads-up displays(HUDs) such as a dashboard in first-person computer video games. The visibilitysensor node detects whether a specified volume of space is visible from the currentuser view. The difference between the proximity and visibility sensor is thatthe visibility sensor does not detect whether the current user’s view is within apredefined region.
The sound node identifies the source, location, intensity, direction, and spatialcharacteristics for a sound source in an X3D scene. The audio clip node providesand controls the source for the sound node. X3D supports the uncompressedwavefile (.wav), and compressed MIDI (.midi) and MP3 (.mp3) sound file formats.
3.3.5 Animation and Interaction
Animation and user interaction are controlled by sensors and interpolators inconjunction with the routing event model, see Figure 3.8. A user first clicks (touchsensor) or drags (plane, cylinder, or sphere sensor) a geometry node, or types(key sensor) which activates a clock node (time sensor node). The time sensorthen sends values to an interpolator node (scalar, colour, position, orientation, andcoordinate), which in turn outputs values whereupon some other geometry in thescene is modified (e.g. colour, position, orientation). At each step in the animation,events are passed from one node’s output field to another node’s input field via aROUTE directive. This animation process is referred to as the routing event model.The identification of each node in the routing event model is located via the DEFattribute of the node.
Figure 3.8 shows the X3D routing event model where a user can click or draga node which is detected by mouse touch and drag sensors. The touch and dragsensors first activate a timer which then activates the frames of an interpolatorto change a variable in the target node. Depending on the visualisation, userinteraction is not always required to initiate animations. Instead the animationcan be activated by only a time sensor. ROUTE directives are used and act as theglue to link the sensors, interpolators, and target nodes together.
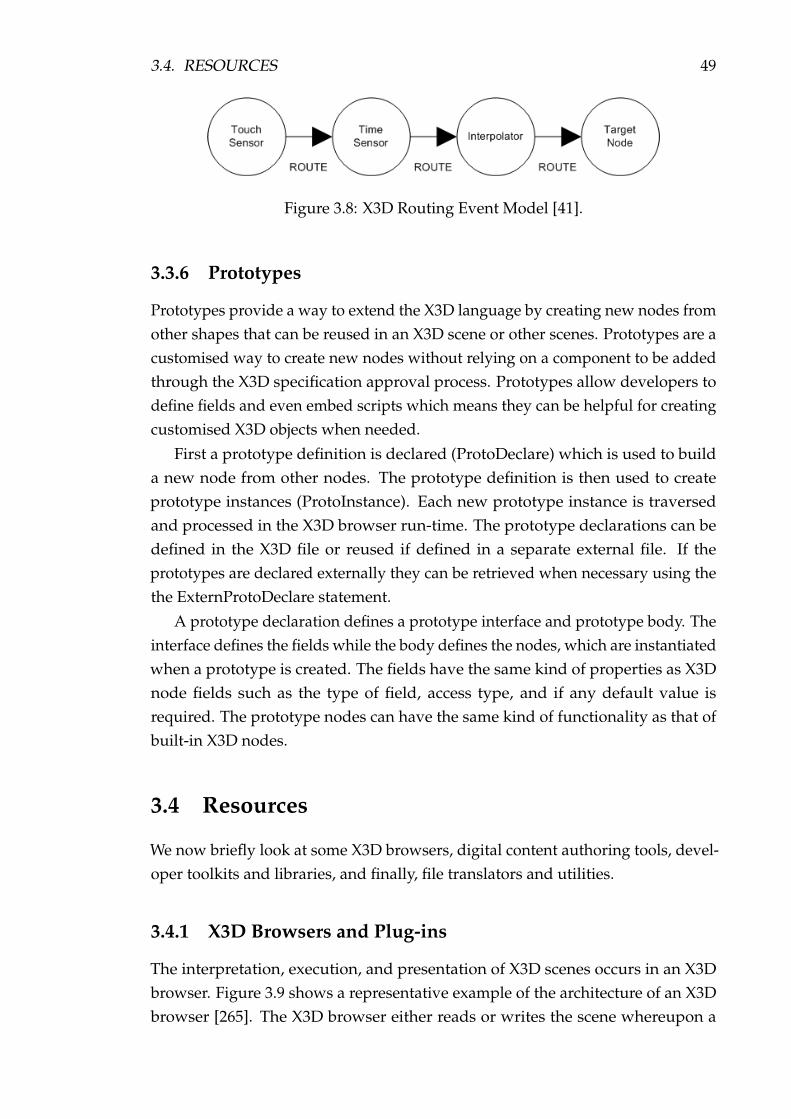
3.4. RESOURCES 49
Figure 3.8: X3D Routing Event Model [41].
3.3.6 Prototypes
Prototypes provide a way to extend the X3D language by creating new nodes fromother shapes that can be reused in an X3D scene or other scenes. Prototypes are acustomised way to create new nodes without relying on a component to be addedthrough the X3D specification approval process. Prototypes allow developers todefine fields and even embed scripts which means they can be helpful for creatingcustomised X3D objects when needed.
First a prototype definition is declared (ProtoDeclare) which is used to builda new node from other nodes. The prototype definition is then used to createprototype instances (ProtoInstance). Each new prototype instance is traversedand processed in the X3D browser run-time. The prototype declarations can bedefined in the X3D file or reused if defined in a separate external file. If theprototypes are declared externally they can be retrieved when necessary using thethe ExternProtoDeclare statement.
A prototype declaration defines a prototype interface and prototype body. Theinterface defines the fields while the body defines the nodes, which are instantiatedwhen a prototype is created. The fields have the same kind of properties as X3Dnode fields such as the type of field, access type, and if any default value isrequired. The prototype nodes can have the same kind of functionality as that ofbuilt-in X3D nodes.
3.4 Resources
We now briefly look at some X3D browsers, digital content authoring tools, devel-oper toolkits and libraries, and finally, file translators and utilities.
3.4.1 X3D Browsers and Plug-ins
The interpretation, execution, and presentation of X3D scenes occurs in an X3Dbrowser. Figure 3.9 shows a representative example of the architecture of an X3Dbrowser [265]. The X3D browser either reads or writes the scene whereupon a

50 CHAPTER 3. EXPLORING X3D
parser interprets the file format of the scene. Nodes are next created and sent tothe scene graph manager which then draws these nodes as images with appro-priate geometry, appearance, positioning, and orientation. The scene graph canreceive events by animation or scripting nodes which can change the values of therendered images or manipulate the geometry in the scene. The Scene AuthoringInterface (SAI)6 defines how the scripting code works which allows developers tocreate code that can work across different operating systems and browsers. Finally,X3D plug-in browsers can be embedded into HTML web pages or widely-usedweb browsers.
Figure 3.9: X3D Browser Software Architecture [265].
Three X3D browsers that operate on the Windows platform and can be pluggedinto Microsoft Internet Explorer or Mozilla Firefox include the Octaga Player, FluxPlayer, and BS Contact VRML/X3D Player. The Octaga Player7 (5MB download) isa high-performance, standards-compliant viewer created by Octaga Incorporated.The Octaga Player Acrobat plug-in for Windows can display X3D models embed-
6The Scene Authoring Interface (SAI) is used either for manipulating the browser and the scenegraph from an external application or from inside the scene graph through the X3D script node.
7http://www.octaga.com
3.4. RESOURCES 51
ded in PDF documents. Figure 3.10 shows an example animation of a whale sharkusing the Octaga Player. The BS Contact VRML/X3D Player8 (6MB download) isa high-performance X3D player created by Bit Management. Figure 3.11 showsan example of the Golden Gate Bridge in San Francisco using the BS VRML/X3DContact Player. The Flux Player9 [180] (1.5MB download) is a plug-in produced byMedia Machines. Figure 3.12 shows a person running from one side of the screento the other and then jumping using the Flux Player.
The BS Contact VRML/X3D Player provides features which the other playersdo not, for capturing screen shots (.bmp and .jpeg formats) and creating videos(.avi format). All three browsers have slightly different names for the same usercontrol and navigation options, and each display their tool-bars in a differentplaces inside the stand-alone browser. Only the Flux player displays the tool-barinside a web browser while the others let a user right click to get to the tool-bar. Allthree browsers also render VRML and have professional versions of their browsers.Being able to render VRML files as well as X3D is important as there are a numberof existing VRML software visualisations which software developers would alsolike to be able to reuse or refer to when creating X3D software visualisations.
Xj3D10 (12MB download) is the Web3D Consortium’s open source project whichis a toolkit for writing VRML and X3D content and is developed in Java. Thecurrent version is 1.0 and was released in April 2006. Xj3D has its own stand-aloneweb browser implemented in Java and does not have a plug-in for MicrosoftInternet Explorer or Mozilla Firefox, which is a part of our software visualisationrequirements for integration with our VARE architecture project (§2.3). FreeWRL11
is an open source VRML and X3D browser that operates on Linux and MacOSX.We have not evaluated either Xj3D or FreeWRL browsers for this project as wewant the X3D browsers to be able to be plugged into either Microsoft InternetExplorer or Mozilla Firefox, and operate on a Windows operating system.
3.4.2 Content Authoring and Editing Tools
Since X3D has text encodings, basic text editors can be used to create and edit X3Ddocuments. There are also various open source and free tools specifically designedfor editing X3D including: X3D-Edit, Flux Studio, and Seamless 3D.
The X3D-Edit Authoring Tool [40]12 is a GUI application that operates as a
8http://www.bitmanagement.de9http://www.mediamachines.com
10http://www.xj3d.org11http://freewrl.sourceforge.net12https://savage.nps.edu/X3D-Edit/

52 CHAPTER 3. EXPLORING X3D
Figure 3.10: Octaga X3D Player Example — animating whale shark, courtesy ofMarko Steffensen from Octaga (http://www.octaga.com).

3.4. RESOURCES 53
Figure 3.11: BS Contact VRML/X3D Player Example — Golden Gate Bridge,courtesy of the National Institute of Standards and Technology (NIST)(http://www.nist.gov).

54 CHAPTER 3. EXPLORING X3D
Figure 3.12: Flux Player Example — person running and then jumping,courtesy of Yilmaz Degirmenci from the US Naval Postgraduate School(http://www.nps.edu).
3.5. DISCUSSION 55
plug-in to NetBeans13. Flux Studio [180] is a GUI application which has a designinterface to graphically see what you are doing rather than working with rawXML. Flux Studio saves the data in its own format. Flux allows multiple views ofthe same drawing, exporting to X3D, and quick preview of your drawing in X3Dusing the Flux Player. Figure 3.13 is a screen shot of X3D-Edit and Flux Studioediting an X3D document. There are also some commercial X3D editing toolsincluding: Octaga Professional, Wirefusion, SwirlX3D, and NSS X3D Modeler.
3.4.3 Export and Translator Tools
Some common digital content creation tools not designed for X3D have plug-insor features that export their native file format into X3D. These tools include: 3DStudio Max, Maya, Blender, MilkShape 3D, SoftImage XSI, Modo, and AC3D.Some of these digital content creation tools can even write and import X3D files.A few browser companies have supplied exporter tools to digital content creationtool companies for producing X3D that is compatible with their browsers suchas Octaga Exporter with 3D Studio Max. The advantage of using digital contentcreation tools is that they allow people who are not programmers or have nocomputer science or programming backgrounds to create X3D content.
There are translator tools for converting other files into X3D files including the3D Object Converter, KML2X3D (Keyhole Markup Language which is used asthe modeling format for Google Earth), and UnrealToX3D [13] (converts UnrealTournament computer game scenes).
There are many existing software visualisations implemented in VRML. SinceX3D has replaced VRML it is important to preserve these software visualisationsso that they can still be viewed. Any file encoded in the the VRML97 standardshould also work with X3D since X3D is backwards compatible. There are howeversome tools for converting VRML files into X3D files. There is a stand-alone Java-based software package for translating VRML files into X3D files and vice-versacreated by the National Institute of Standards and Technology (NIST)14. Xj3D has aseparate command line translator independent of the Xj3D browser for convertingfiles both ways.
3.5 Discussion
There are various issues to discuss regarding the X3D language in terms of im-provements to the specification, and the future of X3D on the web.
13http://www.netbeans.org14http://ovrt.nist.gov/v2 x3d.html

56 CHAPTER 3. EXPLORING X3D
(a) X3D Edit [40].
(b) Flux Studio [180].
Figure 3.13: X3D Editing Tools.
3.5. DISCUSSION 57
3.5.1 Improvements to the Specification
The Web3D Consortium has several working groups that research and proposesolutions to specific technical problems relating to X3D. Some of these groups areexplored next.
An important part of X3D is being able to network with other applications orservices hosted on remote servers. A couple of approaches already exist includ-ing a web browser supported JavaScript approach and an internal script nodenetworking approach. The first approach uses Ajax3D15 where the SAI (§3.4.1)is used to interface with the X3D run-time system and JavaScript or the DOM isused to pass information between a 3D world and a networked server application.The disadvantage of this approach is that it relies on third party applications andprotocols, can have a significant performance overhead, and a potentially highJavaScript code maintenance overhead. The second approach uses either a Java orC++ class inside a script node to communicate via the network. The disadvantageof this approach is that X3D browsers and other X3D applications must havebuilt-in support for these languages. The advantage of the first approach (Ajax3D)is for low frequency communications, while the second approach (internal scriptnode) is best for the more demanding high frequency, throughput, payload, andlow lag communication.
The aim of the X3D networking group is to strengthen the open standardsnetworking capability for X3D. This group has proposed a different approach tothe previous ones above, which uses a direct networking approach where a nodeinterface is used to directly connect the X3D event system to the network. Theadvantage of this approach is that it minimises the use of third party applicationsand protocols and avoids the portability problems of using different programminglanguages. There is also a low performance overhead for high frequency commu-nications such as required for movement tracking in games or exploration in 3Dsoftware visualisations.
There is a conformance program whereby X3D implementations (X3D browsersand tools) are assessed to see if they meet certain X3D standards before they canclaim to be true X3D implementations or use the Web3D Consortium’s X3D trade-marks. The conformance working group manages this process. The advantageof this group is that it encourages vendors to implement X3D browsers and toolsthat are consistent with the X3D specification.
Other groups range from supporting general UI functionality in X3D content,creating an open source X3D-Earth application that uses 3D spatial data to model
15http://www.ajax3d.org
58 CHAPTER 3. EXPLORING X3D
plant earth (an earlier open source X3D project is Planet Earth16 [249]), CAD engi-neering, programmable X3D shaders, modeling 3D human figures, representinghuman anatomy for surgical training, patient education and medical visualisation& modeling. Finally, there is a group focused on developing implementations andutilities for the X3D specification.
3.5.2 Future of X3D on the Web
There are various reasons why the predecessor to X3D, VRML, failed to become apopular open standard for 3D on the web. For X3D to survive and to be a successon the web there must be a number of applications implemented with X3D whichare used by the greater public.
Many 3D web applications are becoming extremely popular with the widercomputer community [71]. Some large scale example applications include GoogleEarth17 for 3D maps and Second Life18 [223] for online virtual worlds. Neither ofthese applications use X3D nor do they use the same standard.
The potential of 3D environments is attracting major attention and investment.IBM19 recently announced that it will invest US$100m over two years to pursue10 ideas that came from a collaborative innovation brainstorming session. Oneof these projects is to take the best of virtual worlds and gaming environments tobuild a standards based 3D Internet. In order for a 3D Internet to work, all devices,platforms and connection speeds would need some open standard protocolsthat will operate efficiently over TCP/IP and UDP with additional support. SunMicrosystems also have a project called Wonderland20 which is a 3D scene managerfor creating collaborative virtual worlds.
Rasmus [100] investigated why 3D technologies for the web are not widelyused on the Internet today. The focus of the report was on end user product andservice web sites. Rasmus concluded that for 3D technologies to be successful, theweb development industry needs to focus more on the people who are going touse the web sites rather than the technology itself.
In our research we are not focusing on end user web sites for the general userpopulation. Instead, we are interested in seeing if X3D would be a viable solutionfor use within our software visualisation architecture. Our software visualisationsare aimed at software developers who we expect to be more sophisticated webusers than the general web end-user because of their technical background.
16http://planet-earth.org17http://earth.google.com18http://secondlife.com19http://www-03.ibm.com/press/us/en/pressrelease/20605.wss20http://lg3d-wonderland.dev.java.net

3.5. DISCUSSION 59
The next chapter demonstrates some software visualisation case studies wehave built using X3D.

60 CHAPTER 3. EXPLORING X3D
Chapter 4
X3D Software Visualisations
Contents4.1 VARE-3D . . . . . . . . . . . . . . . . . . . . . . . . . . . . . . . . . 62
4.1.1 Architecture . . . . . . . . . . . . . . . . . . . . . . . . . . . 62
4.1.2 Implementation . . . . . . . . . . . . . . . . . . . . . . . . . 63
4.1.3 Visualisation Transformation . . . . . . . . . . . . . . . . . 64
4.1.4 Discussion . . . . . . . . . . . . . . . . . . . . . . . . . . . . 70
4.2 Algorithm Animations . . . . . . . . . . . . . . . . . . . . . . . . . 72
4.2.1 Shortest Path . . . . . . . . . . . . . . . . . . . . . . . . . . 73
4.2.2 Heapsort . . . . . . . . . . . . . . . . . . . . . . . . . . . . . 77
4.2.3 Elementary Sorting . . . . . . . . . . . . . . . . . . . . . . . 80
4.2.4 Discussion . . . . . . . . . . . . . . . . . . . . . . . . . . . . 85
4.3 UML Diagrams . . . . . . . . . . . . . . . . . . . . . . . . . . . . . 89
4.3.1 Class Diagrams . . . . . . . . . . . . . . . . . . . . . . . . . 89
4.3.2 Package Diagrams . . . . . . . . . . . . . . . . . . . . . . . 93
4.3.3 Sequence Diagrams . . . . . . . . . . . . . . . . . . . . . . . 93
4.3.4 Discussion . . . . . . . . . . . . . . . . . . . . . . . . . . . . 95
4.4 Documentation-Related Visualisations . . . . . . . . . . . . . . . 97
4.4.1 Source Code Visualisation . . . . . . . . . . . . . . . . . . . 98
4.4.2 API Javadoc Visualisation . . . . . . . . . . . . . . . . . . . 98
4.4.3 Structured Video Visualisation . . . . . . . . . . . . . . . . 98
4.4.4 Discussion . . . . . . . . . . . . . . . . . . . . . . . . . . . . 101
4.5 Execution Trace Visualisations . . . . . . . . . . . . . . . . . . . . 103
4.5.1 All Elements From an Execution Trace . . . . . . . . . . . . 103
61

62 CHAPTER 4. X3D SOFTWARE VISUALISATIONS
4.5.2 3D Compound Shapes . . . . . . . . . . . . . . . . . . . . . 105
4.5.3 3D Metaphors . . . . . . . . . . . . . . . . . . . . . . . . . . 110
4.5.4 Discussion . . . . . . . . . . . . . . . . . . . . . . . . . . . . 115
4.6 Summary . . . . . . . . . . . . . . . . . . . . . . . . . . . . . . . . . 116
We want to see if X3D can support a range of 3D software visualisation tech-niques to determine if X3D is a viable solution for use in software visualisation.We want to experiment with automatically creating X3D software visualisationsover the web, evaluate X3D’s animation and interactivity aspects, examine thetext, layout, and extensibility features, test the integration capabilities of X3D, andfinally analyse the performance display capabilities.
In this chapter we replicate a representative sample of the most commonsoftware visualisation techniques throughout the software visualisation litera-ture [237]. We first describe our prototype tool for producing X3D softwarevisualisations over the web. We then describe our representative case studies foralgorithm animations, UML diagrams, documentation-related visualisations, andvisualisations from execution traces.
4.1 VARE-3D
We are interested in evaluating if X3D is able to create and display visualisationsover the web for developers to understand software components for softwarereuse, maintenance, and re-engineering. We have developed a light-weight pro-totype web-based software visualisation tool called VARE-3D [11]. VARE-3Dimplements a transformer component from our visualisation software architec-ture (§ 2.3). VARE-3D follows on from other lightweight web-based tools thatcolleagues of our research group have built for visual applications [94], sequencediagrams [120], class diagrams [148], UML SVG diagrams [75], and executiontrace visualisations of sequence and class association diagrams [162]. We next de-scribe the architecture, implementation, and visualisation transformation processof VARE-3D. Finally, we finished with a discussion of our prototype tool.
4.1.1 Architecture
Figure 4.1 displays the VARE-3D architecture which is based on the VARE architec-ture (§2.3). Users make queries from a web browser. Users can test drive softwarecomponents by specifying a sequence of method invocation and field access/mod-ifications and then execute the sequence on a component (§2.3.4). The output of a

4.1. VARE-3D 63
test drive is an XML execution trace (§2.3.3) which is stored in a database. Userscan transform XML execution traces using XSLT into X3D software visualisationsand store the visualisations in the same database but a different namespace. Userscan then display the X3D software visualisations in a web browser that has anX3D browser plug-in.
The XML execution traces contain static and dynamic information of softwarecomponents including the events that happened during the execution of a com-ponent (§2.3.3). Separating the test driving and the creation of visualisation stepsallows users to test drive components and then create visualisations in the future.Users can also view stored X3D visualisations without having to test drive remotesoftware or transform XML execution traces.
Figure 4.1: VARE-3D architecture.
4.1.2 Implementation
In VARE-3D we use the BS Contact Player, Octaga Player, and Flux Player plug-ins(§3.4.1), which are all compatible with both Mozilla Firefox and Internet Explorerfor displaying the X3D software visualisations. The Apache Xalan1 XSLT processoris used for transforming the XML execution traces into X3D software visualisations.Apache Tomcat2 is used to host the JavaServer Pages (JSP) and Java Servlet webfront end.
The current implementation status of VARE-3D allows visualisations of tracesbut the prototype is not yet fully integrated with the architecture. The mainpage of VARE-3D consists of a JSP page that has a web form where a user caninput a data source (XML execution trace file) and select a visualisation type(stylesheet). When the visualisation creation web form is submitted the Xalanservlet (XSLTServletWithParams) is executed which takes an XML and XSL file as
1http://xalan.apache.org2http://tomcat.apache.org
64 CHAPTER 4. X3D SOFTWARE VISUALISATIONS
input and transforms the XML file into an X3D software visualisation. Once theservlet has successfully transformed the XML file, the X3D software visualisationfile is then delivered to the client and displayed in the web browser.
The input XML files are either Reusable Component Descriptions (RCD) oreXtensible Execution Traces (XTE) (§2.3.3). Since we have not integrated VARE-3D with a test driving component we use our existing visualisation tools (§2.3.4)to generate our XML execution trace files. The visualisation types in VARE-3Dare only applicable to certain types of execution traces, for example UML classand package diagrams for static RCD description files (§4.3) and execution tracevisualisations for dynamic XTE execution traces (§4.5).
Figure 4.2 shows the VARE-3D visualisation creation interface where the userhas input the EclipseXTE.xml execution trace file and selected the 3D shapesvisualisation type. The EclipseXTE.xml execution trace file contains all the eventsfrom a test drive of the Eclipse IDE Java application. The events represent creatingan object, method calls, method returns, field accesses, and field modifications.
Figure 4.3 shows a simple 3D shapes visualisation which is the output fromthe web form submission of Figure 4.2. The visualisation shows 10,000 eventsfrom the Eclipse IDE Java application, where each event is represented as different3D shapes and displayed in a sequence along the X axis. Blue spheres representobject creation events, green boxes method calls, white cones method returns andend of an object, field accesses cyan cylinders, and field modifications as pinkcylinders. The different shapes show the sequence of events that happened duringthe execution of Eclipse and could potentially show interesting behaviour patternssuch as one object dominating the application.
We are yet to implement the control components from the VARE architectureor integrate a test driving tool and backend database. VARE-3D currently storesthe XML execution traces and XSL stylesheets on the file system and web server.We have, however, explored using the eXist3 and Ipedo4 native XML databases forstoring and retrieving XML execution traces in previous work [9, 10]. Storing andretrieving X3D software visualisations with these kind of native XML databasesshould work similar to storing and retrieving execution traces since they are bothXML formats.
4.1.3 Visualisation Transformation
The main functionality of VARE-3D is the transformation of the RCD and XTE filesinto X3D software visualisations. We will now elaborate on this transformation
3http://exist.sourceforge.net4http://www.ipedo.com

4.1. VARE-3D 65
Figure 4.2: VARE-3D — web interface for execution trace X3D software visualisa-tions.

66 CHAPTER 4. X3D SOFTWARE VISUALISATIONS
Figure 4.3: Basic X3D Execution Trace Visualisation — in this simple X3D softwarevisualisation 10,000 events have been transformed from the XTE execution traceof the Eclipse IDE Java application by XSLT. Blue spheres represent object creationevents, green boxes method calls, white cones method returns and end of an object,field accesses cyan cylinders, and field modifications as pink cylinders.

4.1. VARE-3D 67
process. We process the execution traces using our stylesheets and look for specificelements in the traces. For each RCD file we match the following elements:rcd:packagename, rcd:classname, rcd:fieldname, and rcd:methodname. We thendraw different shapes for each element we match according to the visualisationtype selected by a user. For each XTE file we match the following elements:xte:objectcreation, xte:methodcall, xte:methodreturn, xte:fieldmodification, andxte:fieldaccess. The transformation process is quite straight forward since theexecution trace files and the output X3D software visualisations are both in XMLformat which allows us to use existing XSLT processors.
Figure 4.4 shows an example from one of our XTE execution traces with oneobject creation (Lines 2-6) and three field modification events (Lines 7-37). Figure4.5 shows the stylesheet that transforms this XTE execution trace into the X3Dsoftware visualisation displayed in Figure 4.3. Lines 1–6 of Figure 4.5 are thestandard XSL tags that declare that the stylesheet is an XML file, uses the XSLnamespace and the XTE namespace (http://www.mcs.vuw.ac.nz), and theoutput of processing the stylesheet is an XML file. The stylesheet processes thecreator, date, and object elements (lines 7–9) in the XTE execution trace, but sincethese elements are not important for the software visualisation they are not used.This additional data could be included in the metadata header of the X3D softwarevisualisation file if required.
Lines 11–24 show the main body of the stylesheet which matches the xte:executionelement. Once the XSLT processor reaches the execution element it outputs theX3D DOCTYPE, X3D root, scene, navigation info, viewpoints, and backgroundtags. These tags need to be wrapped inside XSL text tags so that the processorknows to output them as verbatim text. The critical line in the stylesheet is line 20which applies all other event templates in the stylesheet.
Lines 26–38 show the object creation template. Line 27–28 outputs the trans-form node for where the object creation node will be positioned in the X3D scene.Line 29 calculates the X axis value of the translation field based on the position ofthe element in the execution trace. Line 30 uses zero for the X and Y axes values inthe translation field. Lines 31–36 draw a blue sphere for the object creation eventand then line 37–38 closes the transform node and object creation template. Theother templates in the stylesheet are very similar except that different shapes aredrawn. Once the object creation template is complete the next element in the XTEexecution trace is matched. Depending on what type of event the next element isthe appropriate template is processed.
A similar kind of stylesheet is used to create our more complex visualisationsthat use prototypes (§3.3.6), see Figure 4.6. In this stylesheet we are creating a UMLclass diagram where we define a prototype declaration which has the following

68 CHAPTER 4. X3D SOFTWARE VISUALISATIONS
1 <xte:execution>
2 <xte:objectcreation xte:eventid="1" xte:objectid="obj1"
3 xte:threadid="main">
4 <xte:complextype><xte:typename>org.eclipse.core.launcher.Main
5 </xte:typename></xte:complextype>
6 </xte:objectcreation>
7 <xte:fieldmodification xte:eventid="2" xte:objectid="obj1"
8 xte:threadid="main">
9 <xte:fieldname>debug</xte:fieldname>
10 <xte:oldvalue>
11 <xte:primitivevalue><xte:value>1</xte:value>
12 </xte:primitivevalue>
13 </xte:oldvalue>
14 <xte:newvalue>
15 <xte:primitivevalue><xte:value>1</xte:value></xte:primitivevalue>
16 </xte:newvalue>
17 </xte:fieldmodification>
18 <xte:fieldmodification xte:eventid="3" xte:objectid="obj1"
19 xte:threadid="main">
20 <xte:fieldname>bootLocation</xte:fieldname>
21 <xte:oldvalue>
22 <xte:primitivevalue><xte:value>1</xte:value></xte:primitivevalue>
23 </xte:oldvalue>
24 <xte:newvalue>
25 <xte:primitivevalue><xte:value>1</xte:value></xte:primitivevalue>
26 </xte:newvalue>
27 </xte:fieldmodification>
28 <xte:fieldmodification xte:eventid="4" xte:objectid="obj1"
29 xte:threadid="main">
30 <xte:fieldname>installLocation</xte:fieldname>
31 <xte:oldvalue>
32 <xte:primitivevalue><xte:value>1</xte:value></xte:primitivevalue>
33 </xte:oldvalue>
34 <xte:newvalue>
35 <xte:primitivevalue><xte:value>1</xte:value></xte:primitivevalue>
36 </xte:newvalue>
37 </xte:fieldmodification>
Figure 4.4: Example Eclipse XTE execution trace.

4.1. VARE-3D 69
1 <?xml version="1.0"?>
2 <xsl:stylesheet version="1.0"
3 xmlns:xsl="http://www.w3.org/1999/XSL/Transform"
4 xmlns:xte="http://www.mcs.vuw.ac.nz">
5 <xsl:output method="xml" version="1.0" encoding="utf-8"
6 indent="yes" />
7 <xsl:template match="xte:creator"/>
8 <xsl:template match="xte:date"/>
9 <xsl:template match="xte:object"/>
10
11 <xsl:template match="xte:execution">
12 <xsl:text disable-output-escaping="yes">
13 <![CDATA[ <!DOCTYPE X3D PUBLIC "ISO//Web3D//DTD X3D 3.0//EN"
14 "http://www.web3d.org/specifications/x3d-3.0.dtd">
15 <X3D profile="Immersive" version="3.0">
16 <Scene>
17 <NavigationInfo type=’"EXAMINE"’ speed="64"/>
18 <Viewpoint description="Overview" position="112 -5 150"/>
19 <Background skyColor="1 1 1"/>]]></xsl:text>
20 <xsl:apply-templates/>
21 <xsl:text disable-output-escaping="yes">
22 <![CDATA[</Scene>
23 </X3D>]]></xsl:text>
24 </xsl:template>
25
26 <xsl:template match="xte:objectcreation">
27 <xsl:text disable-output-escaping="yes">
28 <![CDATA[<Transform translation="]]></xsl:text>
29 <xsl:value-of select="5*position()"/>
30 <xsl:text disable-output-escaping="yes"><![CDATA[ 0 0">
31 <Shape>
32 <Appearance>
33 <Material diffuseColor="0 0 1"/>
34 </Appearance>
35 <Sphere radius="2"/>
36 </Shape>
37 </Transform>]]></xsl:text>
38 </xsl:template>
Figure 4.5: XTE execution trace XSL stylesheet.
70 CHAPTER 4. X3D SOFTWARE VISUALISATIONS
fields: classname, attributes, operations, height, and width (Lines 1–9).
We first match and apply the package template which creates a group tag anduses the package name as the DEF attribute (Lines 12–17). Next we match allthe classes in the package (Lines 19–38) and group each class inside a transformnode to position the class in the scene (Lines 20–25). Prototype instances are thencreated (Lines 26–36) based on the prototype declaration defined earlier in thefile. Each prototype instance has the attribute name of the prototype declaration(Line 26, e.g. class diagram, package diagram) and the value for each prototypeinstance field which is selected from the element in the execution trace (Lines28–30, e.g. classname field). The fields and methods templates are next processedwhich get all the fields and methods for each class (Lines 31–32). We then have twofields height and width, that are fixed values and determine the size of the classnode prototype instance (Lines 34–35). Finally, we close the prototype instance,transform node for each class, group tag for each package, and package template(Lines 36–41).
Section 4.3 shows how we use the prototype stylesheet in Figure 4.6 to producethe X3D prototype file in Figure 4.18. Figure 4.16 and Figure 4.17 show theeventual X3D software visualisations generated from this stylesheet and prototypegeneration.
4.1.4 Discussion
The design of VARE-3D makes it easy to add new visualisation types by simplyadding a new stylesheet to the system without recompiling any parts of the system.The only part that requires changing is the web page that allows a user to uploada visualisation type and the subsequent page that lets a user select this newvisualisation type. We are yet to implement this user visualisation control featureand other VARE architecture controls and test driving components.
To implement these features the next development steps would be to integrateour XML database component which we have documented elsewhere [9, 10]and some test driving tools (§2.3.4). The database component will be of valueto an end user as they will be able to see what execution traces exist, look at thecontents of the execution traces (if applicable), upload their own visualisationtypes and display X3D software visualisations previously created without relyingon a filesystem. Therefore, integrating both of the database and test drivingcomponents will help provide a complete end to end software visualisation systemfor a user.
The VARE-3D visualisation transformation process allows execution trace datato be encoded using two different approaches. The first approach (Figure 4.5)

4.1. VARE-3D 71
1 <ProtoDeclare name="ClassDiagram" url="x3d-classdiagram.x3d">
2 <field accessType="initializeOnly" name="classname" type="MFString"/>
3 <field accessType="initializeOnly" name="attributes"
4 type="MFString"/>
5 <field accessType="initializeOnly" name="operations"
6 type="MFString"/>
7 <field accessType="initializeOnly" name="height" type="SFFloat"/>
8 <field accessType="initializeOnly" name="width" type="SFFloat"/>
9 </ProtoDeclare>
10 <xsl:apply-templates/>
11
12 <xsl:template match="rcd:package">
13 <xsl:variable name="yposition" select="-20*position()"/>
14 <xsl:text disable-output-escaping="yes">
15 <![CDATA[<Group DEF="]]></xsl:text>
16 <xsl:value-of select="rcd:packagename"/>
17 <xsl:text disable-output-escaping="yes"><![CDATA[">]]></xsl:text>
18
19 <xsl:for-each select="rcd:class">
20 <xsl:text disable-output-escaping="yes">
21 <![CDATA[<Transform translation="]]></xsl:text>
22 <xsl:value-of select="20*position()"/>
23 <xsl:text disable-output-escaping="yes"><![CDATA[ 0 ]]></xsl:text>
24 <xsl:value-of select="yposition"/>
25 <xsl:text disable-output-escaping="yes"><![CDATA[">
26 <ProtoInstance name="ClassDiagram">]]></xsl:text>
27 <xsl:text disable-output-escaping="yes">
28 <![CDATA[<fieldValue name="classname" value="]]></xsl:text>
29 <xsl:value-of select="rcd:classname"/>
30 <xsl:text disable-output-escaping="yes"><![CDATA["/>]]></xsl:text>
31 <xsl:apply-templates select="rcd:fields"/>
32 <xsl:apply-templates select="rcd:methods"/>
33 <xsl:text disable-output-escaping="yes"><![CDATA[
34 <fieldValue name="height" value="15"/>
35 <fieldValue name="width" value="15"/>
36 </ProtoInstance>
37 </Transform>]]></xsl:text>
38 </xsl:for-each>
39 <xsl:text disable-output-escaping="yes">
40 <![CDATA[</Group>]]></xsl:text>
41 </xsl:template>
Figure 4.6: UML Class Diagram XSL prototype stylesheet.

72 CHAPTER 4. X3D SOFTWARE VISUALISATIONS
transforms an execution trace into X3D geometry that uses JavaScript functionsfor layout, while the second approach (Figure 4.6) uses prototypes (§3.3.6). Eachapproach has its merits depending on the type of visualisation that is displayed.Section 4.5 uses the X3D geometry JavaScript function approach while Section 4.3uses the prototypes approach. In Section 4.2 we investigate how we can encodethe data inside the actual software visualisation without relying on JavaScriptfunctions for layout nor prototypes for data display independence.
VARE-3D operates on both Mozilla Firefox and Microsoft Internet Explorer.Our strategy for doing all of the visualisation transformation in XML allows usto leverage high powered XML tools such as the Apache Xalan XSLT processorand Java XML parsing libraries. Our smaller execution traces take less than afew seconds5 to generate a X3D software visualisation while our larger traces (10-50MB) take less than two minutes to produce 10,000-100,000 nodes. The longesttime spent by VARE-3D for creating a software visualisation is actually renderingthe end software visualisation rather than the stylesheet transformation. It takesless than 10 seconds to render about 10,000 nodes, three minutes for 50,000 nodes,but up to 10 minutes to render 100,000 nodes.
The next sections discuss some of the X3D software visualisations that we havecreated, some via VARE-3D and others manually. We want to see how viableX3D is for use in software visualisation. In particular we want to evaluate X3D’sanimation and interactivity aspects, examine the text, layout, and extensibilityfeatures, test the integration capabilities of X3D, and analyse the performancedisplay capabilities.
4.2 Algorithm Animations
In this section we explore the animation and interaction capabilities of X3D foralgorithm animation. We replicate a variety of 3D algorithm animation techniquesfrom the literature. Our X3D algorithm animations are manually hand crafted aswe want to see if X3D can support creating complex software visualisations byhand and encode the data inside the visualisation.
According to Brown and Najork [33] 3D graphics for algorithm animation issignificant and mostly unexplored. Brown and Najork [33, 168, 169] were the firstto identify several reasons for integrating 3D graphics into an algorithm animationsystem. The third dimension can be used for expressing fundamental informationabout structures that are inherently 2D, uniting multiple views of an object, and
5Performance transformation timings of both client and server were measured using a Dell 610laptop with Windows XP and 512MB of RAM.
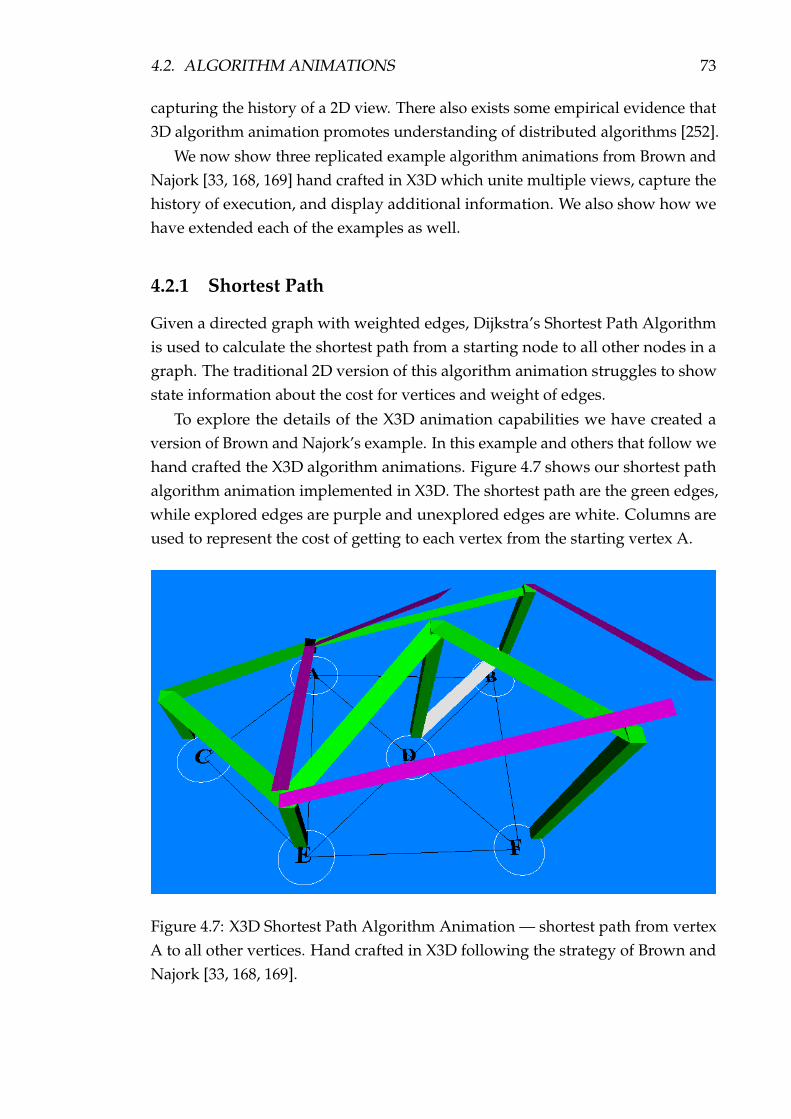
4.2. ALGORITHM ANIMATIONS 73
capturing the history of a 2D view. There also exists some empirical evidence that3D algorithm animation promotes understanding of distributed algorithms [252].
We now show three replicated example algorithm animations from Brown andNajork [33, 168, 169] hand crafted in X3D which unite multiple views, capture thehistory of execution, and display additional information. We also show how wehave extended each of the examples as well.
4.2.1 Shortest Path
Given a directed graph with weighted edges, Dijkstra’s Shortest Path Algorithmis used to calculate the shortest path from a starting node to all other nodes in agraph. The traditional 2D version of this algorithm animation struggles to showstate information about the cost for vertices and weight of edges.
To explore the details of the X3D animation capabilities we have created aversion of Brown and Najork’s example. In this example and others that follow wehand crafted the X3D algorithm animations. Figure 4.7 shows our shortest pathalgorithm animation implemented in X3D. The shortest path are the green edges,while explored edges are purple and unexplored edges are white. Columns areused to represent the cost of getting to each vertex from the starting vertex A.
Figure 4.7: X3D Shortest Path Algorithm Animation — shortest path from vertexA to all other vertices. Hand crafted in X3D following the strategy of Brown andNajork [33, 168, 169].

74 CHAPTER 4. X3D SOFTWARE VISUALISATIONS
Figure 4.8: Shortest Path Algorithm — initial 2D state.
Brown and Najork [33, 168, 169] provide additional state information about thecost of vertices and weight of edges in 3D. Columns are used to represent the costof getting to each vertex. An edge from u to v with weight w leaves the columnabove u at height 0, but the weight is added to the column above v at height w.Whenever an edge is examined from u to v a highlighted copy of the edge is liftedto the top of u’s column, hence its tip will hover over v at height proportional tocost(u) + weight(edge). If v’s column is taller, the edge can lower v’s cost, so v’scolumn is shortened. If the column is not shortened then the highlighted edgedisappears.
The third dimension in this animation provides state information about thecost of vertices and weight of edges. Animation is used to show fundamental oper-ations of the algorithm: lifting an edge represents addition, lowering a highlightededge indicates the outcome of a comparison, and shortening a column showsassignment. Cox and Roman [63] produced a similar animation of the shortestpath algorithm.
We extended this example by displaying the 2D graph from Figure 4.8 beneaththe the columns and edges in the animation from Figure 4.7. We felt it wasimportant to somehow use text for labeling the vertices to help a user understandthe animation. When a user rotates the view or a much larger graph is used for theanimation it is hard to determine which vertex a particular node or column is. The2D graph is implemented using 2D circles and polylines. We found that not all ofthe X3D browsers we tested this example on have implemented the 2D geometry

4.2. ALGORITHM ANIMATIONS 75
component of the X3D specification. Hence, the 2D graph did not always displaydepending on the X3D browser.
Figure 4.9(a) shows the initial state of the animation where all the edges aredrawn in white and vertex A represented as a black box above the 2D graph, andviewed looking down upon the animation. Figure 4.9(b) shows the algorithmstarting where the cost of each node is first noted. The height of column C is four,E eight, D twelve, and B five. At this stage vertex F is unreachable from A. Next,the cheapest node from the starting node not yet visited is selected. If there isanother node which can be reached via this selected node that is cheaper thanbefore then the cost to reach that node is updated in the cost table. Figure 4.9(c)shows the cost from A to E has been reduced from eight to six by the path A-C-E.The algorithm then iterates to the next cheapest node and so on. Figure 4.9(d)shows an edge being examined (E-D) for the cost to get to D via E and C. Figure4.9(e) shows the completed shortest path as green edges, and all the purple edgesthat are not part of the shortest path. Figure 4.9(f) shows a top down view oncethe shortest path algorithm has completed.
We decided to leave the purple and white edges in the animation as it helpsshow what paths existed before the shortest path and the edges that were notexplored. Brown and Najork [33, 168, 169] chose to remove the redundant edges. Ifthe example was a much larger graph then we may actually provide filter controlsfor a user to remove the purple and white edges to show the different paths.Removing the edges was not a critical step in this algorithm animation as we werefocusing on the X3D implementation rather than the algorithm itself. Most 2Dversions of this animation that we know of leave the redundant edges in.
We implemented the columns and edges as indexed face sets (§3.3.1) which isa node that represents a 3D shape formed by constructing faces (polygons) fromvertices listed in the coordinate field (coordIndex) of the indexed face set node.The indexed face set contains a coordinate child node that defines the 3D verticesreferenced by the coordinate index field. The indexed face set uses the indicesin its coordinate index field to specify the polygonal faces by indexing into thecoordinates in the coordinate node.
Manipulating and positioning the columns and edges as indexed face setswas easier than using boxes and cylinders. Calculating the length, position, androtation of a cylinder when used as an edge and when it was either increased ordecreased in size required too much effort. Changing the size of the box meantthat the other elements linked to the box would also have to be adjusted. We couldhave used indexed line sets (§3.3.1) for the edges, but this would have only beenone pixel in depth and would be hard for an user to see the changing of colour foran edge once it was part of the shortest path.

76 CHAPTER 4. X3D SOFTWARE VISUALISATIONS
(a) (b)
(c) (d)
(e) (f)
Figure 4.9: X3D Shortest Path Algorithm Animation — different stages of thealgorithm.

4.2. ALGORITHM ANIMATIONS 77
Our indexed face set columns have eight points while edges have four points.When the cost to a vertex changed the top face of the column was either increasedor decreased in the z dimension by modifying four coordinate points. When anedge was changed only two coordinate points were modified. Coordinate pointswere moved using coordinate interpolators, while the colour of a column or anedge was controlled by colour interpolators. A continuous timer was used to startand keep the animation going, which cycles every 20 seconds.
An alternative way to run this animation is to remove the purple edges oncethe shortest path to a vertex has been found. In order to accomplish this taskwe wanted objects to appear in the animation and then later disappear or bedeleted altogether. We found no specific nodes for doing this task. Instead, wehad to hide objects inside other objects when we did not require them to be visible.We accomplished the invisibility of objects by modifying some of the coordinatepoints of a node. Alternatively, we could have made a node visually transparentby adjusting the transparency attribute of the material node (§3.3.1). We couldhave also added another larger node on top of the node to be hidden, but thelarger node would have to be transparent to begin with.
4.2.2 Heapsort
Finding a single view of an object during an algorithm animation that reveals allof its features can be difficult. Presenting multiple views of that object can be ahelpful technique, but interpreting the multiple views may make it hard for usersto understand.
The traditional way of displaying the heapsort algorithm animation is to havetwo views, one showing the sticks like array and the other the heap. Brown andNajork [33, 168, 169] united the multiple views of the heapsort algorithm in 3D toalleviate the problem where users must mentally integrate the different views inorder to understand the overall algorithm.
Figure 4.10 shows our X3D animation of the completed heapsort algorithmwith the united views of the heap and the array. A node in the tree is an elementin the array being sorted, and has depth (Z axis) proportional to its value.
The algorithm works in two parts. The first part orders elements from the dataset to be sorted into a heap. The second part picks the largest element in the dataset and puts it in its final place in the heap. Then from the remaining unsorteddata the next largest element is selected and put in its final place. This continuesuntil the end of the data set.
In the heap, elements are represented as boxes and paths as cylinders. Positionand colour interpolators are used for element and colour animations which are

78 CHAPTER 4. X3D SOFTWARE VISUALISATIONS
Figure 4.10: X3D Heapsort Algorithm Animation — completed algorithm anima-tion with united sticks like array and heap views.

4.2. ALGORITHM ANIMATIONS 79
controlled by the timer (same kind of timer as in the shortest path animation §4.2.1)that cycles every 20 seconds. According to Brown and Najork [33, 168, 169], usingcolour in this animation is not crucial because the value of a stick is encoded byits length, but it is useful to distinguish the elements during the animation. Wecan use colour to support this statement by colouring the elements using the red,green, blue spectrum to signify that they have been ordered. Elements towardthe red spectrum could represent larger elements, while elements toward the bluespectrum could represent smaller elements. Once an element arrives at its finaldestination its colour is flashed white to signify that it has been ordered. Addingstart, stop, step, and speed buttons is also possible to give a user greater controlover the animation.
We extended this example by including number text labels to the elements asit helps a user to understand the animation when viewing it from in front like inFigure 4.10. When viewing the animation from in front and without text labelsit is hard to determine the value of each element as the length is obscured in thenegative Z axis. The text labels could be embedded inside the boxes but wouldnot be visible. So a separate text object was created which is offset from the boxesbut nested inside a transform node (§3.3.2). The transformation grouping meansthe text will move when the box also moves. Alternatively, we could have usedan image for the text labels and applied the images as texture to the nodes. Wecould then have also applied the text label images to all faces of the nodes so thatif the viewpoint was rotated then the text label would always be visible. Usingtext labels as texture would have required creating separate text label images foreach element in the animation and we deemed that as unnecessary because if weallowed a user to input their own data set then this would have been an extraprocess which we were not interested in evaluating. Since our heapsort animationwas small this extra process would not have scaled very well if our sample dataset was much larger.
Figure 4.11 shows the animation during different stages of the sorting algo-rithm. In this heapsort animation example there are 32 element transition moves.Figure 4.11(a) shows the start of the animation with the initial data set. The nextthree figures show elements that are in motion in the algorithm animation. Fig-ure 4.11(b) shows elements 28 and 8 swapping positions, Figure 4.11(c) showselements 24 and 8 being swapped and 28 reaching its final destination, and Figure4.11(d) shows 12 being swapped with 8 as the last step in the algorithm.
Figures 4.11(e) and 4.11(f) show alternative views of the animation where theviewpoint is rotated by a user to show the boxes displayed horizontally, vertically,and the text labels not visible. Figure 4.11(e) shows the animation in progress whileFigure 4.11(f) shows the animation once completed. These views can expose a

80 CHAPTER 4. X3D SOFTWARE VISUALISATIONS
different way of viewing the animation as no text labels are represented so the usercan only distinguish the elements by their size and position. We believe havingnumber text labels for each element helps a user to understand the algorithmwhen viewing the animation from any view point, but only user studies will beable to prove this.
4.2.3 Elementary Sorting
Visualising a program’s entire execution history can help in understanding thebehaviour of a program, whereas most algorithm animation implementations onlyshow the current state of an algorithm. Displaying the history of a small algorithmanimation shows how the state of the algorithm has changed over time. Whenvisualising larger algorithms the history can reveal features that are not commonlyknown.
Ronald Baecker’s seminal 1981 film Sorting Out Sorting [17] introduced thesticks view for sorting algorithms. The sticks view shows the array of elements asa row of sticks, where the height of each stick is proportional to the element in thearray. When the algorithm is completed the sticks are arranged in ascending orderfrom left to right, but the sticks view does not provide any history of the executionof the algorithm. Brown and Najork [33, 168, 169] created the chips view whichcaptures the history of execution of algorithms and is drawn in the X-Y plane atincreasing values of the Z axis.
We extended this example by showing multiple algorithms all executing atthe same time and implemented in X3D. Brown and Najork [33, 168, 169] in theirexamples only show one algorithm animating at once. We thought that it wouldbe useful to show different algorithms animating concurrently as in Sorting OutSorting but in X3D. Showing multiple algorithm animations concurrently willpotentially help a user understand how the different algorithms work. With thisextension we mainly wanted to determine how well X3D supports displayingmore than one algorithm animating at once.
Figure 4.12 shows bubble, selection, and insertion sort algorithms all animatingat once. The combined views allow a user to see both the current state of thearray and the history of an algorithm’s execution. Whenever an algorithm sortsan element the previous state of the array is drawn in the X-Y plane at increasingvalues of the Z axis in the chips view. The elements in the chips view are encodedby colour and when the algorithm is completed the elements in the sticks viewwill be ordered from blue to red. Once an element is sorted in the sticks view theelement is flashed a white colour to signify that the element has been ordered inthe data set.
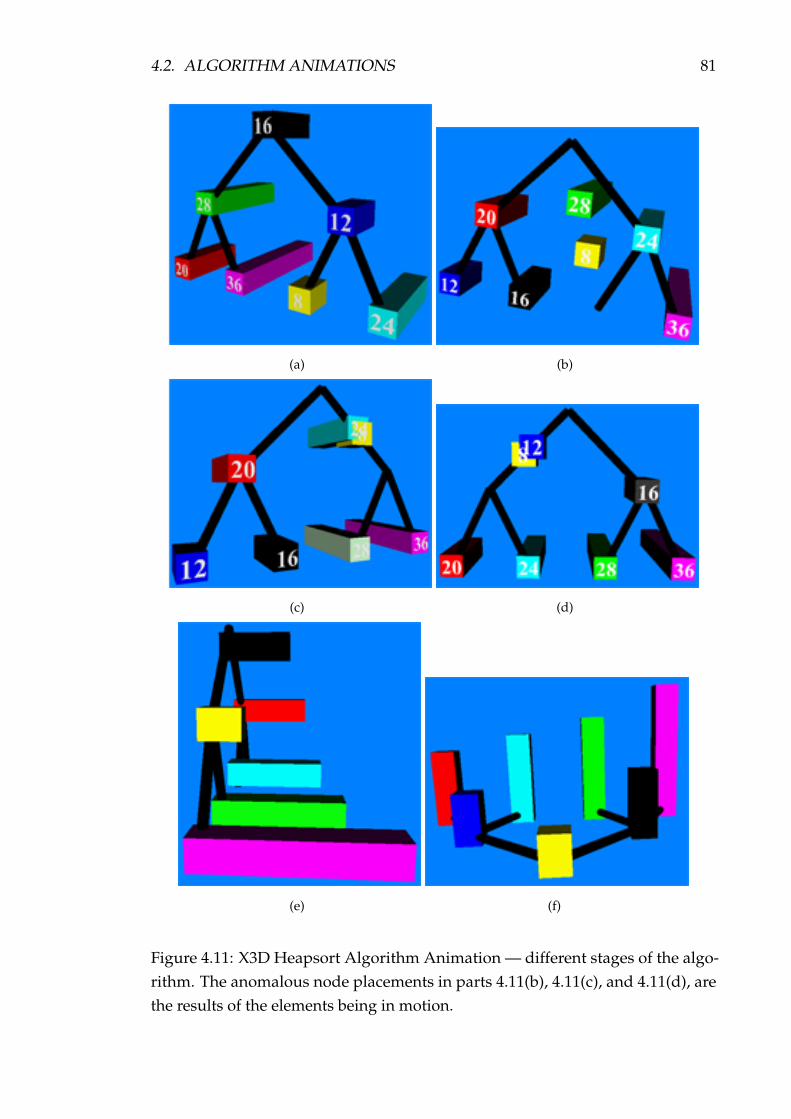
4.2. ALGORITHM ANIMATIONS 81
(a) (b)
(c) (d)
(e) (f)
Figure 4.11: X3D Heapsort Algorithm Animation — different stages of the algo-rithm. The anomalous node placements in parts 4.11(b), 4.11(c), and 4.11(d), arethe results of the elements being in motion.

82 CHAPTER 4. X3D SOFTWARE VISUALISATIONS
Figure 4.12: X3D Elementary Sorting Algorithm Animation — chips view.
4.2. ALGORITHM ANIMATIONS 83
Boxes were used to implement the sticks view. We found it best to implementthe chips view as one node, an indexed face set. Our indexed face sets haveseparate colours for each position in the array. In our example from Figure 4.1210 faces make up one line of the chips view, one face for each element in thearray. If we had of used boxes instead of an indexed face set in the exact sameposition (X-Y-Z coordinates) then the boxes would obscure the sticks view and thealgorithm animation steps when viewing from in front.
We also did another extension to Brown and Najork’s [33, 168, 169] exampleby experimenting with the chips view. Figure 4.13 shows the blocks view instead ofthe chips view, and positioned below where the the chips view would normallybe. Figure 4.14 shows the blocks view again, but positioned behind the animatingsticks view. The chips view is also visible in Figure 4.14. We found that the blockviews in the different positions (below and behind) obscured parts of the executionhistory as some elements were not visible. Depending on the viewpoint some ofthe smaller elements were hidden by some of the larger elements which madeit harder for a user to grasp the execution history. Our implementation of theblocks view required creating a box for each element in the previous executionstate, which significantly increased the amount of X3D code compared with justusing the indexed face set for the chips view. The increase in code was because anindividual box was required instead of one attribute from an indexed face set.
In the animation if a user rotates the viewpoint the text labels above the sticksview would be hard to read, so a billboard node was used (§3.3.3). The billboardnode is a grouping node which modifies its coordinate system so that the billboardnode’s local Z axis turns to point at the viewer. Unfortunately, the billboard nodedoes not allow the text to be legible if the animation is turned upside down.
Rather than the traditional visualisation of iterating through the sticks view byflashing each element as in Sorting Out Sorting, we felt it was best to use a sphereobject for the iteration steps as all the elements in the sticks view are differentcolours. We used the iterating sphere across all the algorithms to be consistentand to show how the actual algorithms work in terms of the inner details. Wetried positioning the sphere in different places. We first positioned the sphere ontop of each element but felt that it distracted the user when the animation wasexecuting and it also meant we had to change the Y coordinate value each timethe sphere moved. We found it best and easiest to position the sphere below thesticks view where it could be viewed from any viewpoint, which meant we onlyhad to change the X coordinate value.
In the elementary sorting algorithm animation we used the inline node whichcan embed an X3D scene stored at a location on the web or local file system intothe current scene. For each individual sorting algorithm in the greater elementary

84 CHAPTER 4. X3D SOFTWARE VISUALISATIONS
Figure 4.13: X3D Elementary Sorting Algorithm Animation — blocks view.
Figure 4.14: X3D Elementary Sorting Algorithm Animation — blocks behind view.
4.2. ALGORITHM ANIMATIONS 85
sorting animation we had to physically position the elements in a different placein the global 3D world so that they were not mapped onto each other. This isbecause we encoded the data into the presentation layer and each individualgeometry node, position interpolator node, and ROUTE directive required aseparate declaration. The only node we could generically use across all of theanimations was the timer which was declared in the root file. We had to use theexport semantics so that the timer could then be imported and used in the separatealgorithm animation files.
4.2.4 Discussion
Routing Event Model: One reason we were interested in using X3D for algo-rithm animation was the motion capabilities provided by the routing event model(§3.3.5). The X3D routing event model allows a user to click or drag a node suchas start, stop, or change speed buttons (see bottom of Figure 4.12) and has eventhandlers that sense these touches or drags. The touch or drag sensors initiatea time sensor which then activates an interpolator that has frames where upona variable in the target node is changed. The target node in our examples are3D geometry (boxes, spheres), material (colour), and coordinate points (insidecoordinate nodes).
The following code in Figure 4.15 is a sample from the insertion sort algorithmanimation that demonstrates the routing event model. The code shows a timesensor (timer), interpolators (position and colour), and target nodes (material andtransform), however, there are not touch sensors used in this example. Readingthrough the code a time sensor is defined to loop and last for 20 seconds (line2). A position and colour interpolator are defined which states at what time inthe animation an element moves or changes colour (lines 4–7). The box geometry(lines 9–14) and the appearance of the box are nested within a transform node(lines 8 and 15). Finally, the ROUTE directives (lines 16–23) are the glue whichlink the timer with the position and colour interpolators (lines 16–17) and then thetransform (lines 18–19) and material (lines 20–23) nodes.
An issue with the X3D routing event model is that for each 3D geometrynode that needs to be animated, a separate position interpolator and two ROUTEdirectives are required. This is the same for the material colour nodes. Fromour perspective the routing event model seems to be quite a cumbersome design.If the routing event model could be achieved by generic JavaScript functions,ROUTE directives, and interpolator nodes it would make it much easier to createcomplex animations. For our algorithm animations which use small data setsthere was a lot of X3D code that could have been reduced if the design of the

86 CHAPTER 4. X3D SOFTWARE VISUALISATIONS
1 <X3D>
2 <Scene>
3 <TimeSensor DEF="TIME" cycleInterval="20" loop="true"/>
4 <PositionInterpolator DEF="MOVE16" key="0.1 0.2
5 0.3 0.4" keyValue="2 8 0, 4 8 0, 4 8 0, 6 8 0"/>
6 <ColorInterpolator DEF="FLASH16" key="0.4 0.5 0.6"
7 keyValue="1 0.5 0, 1 1 0, 1 0.5 0"/>
8 <Transform DEF="ITEM16" translation="2 8 0">
9 <Shape>
10 <Box size="2 16 2"/>
11 <Appearance>
12 <Material DEF="COLOR16" diffuseColor="1 0.5 0"/>
13 </Appearance>
14 </Shape>
15 </Transform>
16 <ROUTE fromNode="TIME" fromField="fraction_changed"
17 toNode="MOVE16" toField="set_fraction"/>
18 <ROUTE fromNode="MOVE16" fromField="value_changed"
19 toNode="ITEM16" toField="set_translation"/>
20 <ROUTE fromNode="TIME" fromField="fraction_changed"
21 toNode="FLASH16" toField="set_fraction"/>
22 <ROUTE fromNode="FLASH16" fromField="value_changed"
23 toNode="COLOR16" toField="set_diffuseColor"/>
24 </Scene>
25 </X3D>
Figure 4.15: X3D routing event model from the insertion sort algorithm animation.

4.2. ALGORITHM ANIMATIONS 87
routing event model used a generic approach. Our most sophisticated example,the elementary sorting algorithm animation (§4.2.3), used 186 ROUTE directivesand 93 interpolators which required a large overhead to manage. For example inFigure 4.15 it would be better to have one generic JavaScript function for each ofthe position and colour interpolators, and the ROUTE directives. If we were toreimplement these animations we would choose to encode the data separate fromthe presentation layer and use prototypes (§3.3.6).
User Control: A common issue across all the 3D algorithm animation exampleswas that X3D did not allow continuous smooth animations [236]. Instead, wehad to create pauses for each element that moved otherwise elements that hada long distance to travel in the scene would be moving while other elements areanimating hence causing confusion for the user. In the code from Figure 4.15, thepause can be seen in the keyValue of the position interpolator, where element 16moves from position 2 8 0 (X,Y, and Z coordinate values) to 4 8 0 and then stays at4 8 0 for another second before moving onto 6 8 0.
We created a dashboard which had start, stop, pause, and speed buttons for auser to control the animation (Figure 4.12). The dashboard was implemented usinga proximity sensor node which generates events when the viewer enters, exits,and moves within a region in space (defined by a box). We found the dashboardto be very useful as it enables a user to rotate the viewpoint and always have thedashboard in front of them to control the animation.
The actual user control buttons in the dashboard were implemented usingtouch sensors, plane sensors, a time sensor, and JavaScript. Start and stop buttonswere straightforward to implement and required a timer, touch sensor, positioninterpolator, and a ROUTE directive. For changing the speed and pause but-tons, JavaScript functions were required. The speed control either increased ordecreased the time sensor cycle interval depending on which way a user dragsthe box attached to the cylinder. The pause button required a function call and anadditional ROUTE directive for each element in the animation.
Auralisation: “Software visualisation” through sound is known as programauralisation which is the process of forming mental images of the structure, andbehaviour of software by listening to the execution of a program [70]. Brownand Hershberger [36] suggest using audio in algorithm animation to reinforcewhat is being displayed visually. In the elementary sorting algorithm animationwe have added sound for when an element has been ordered in the data set.We implemented program auralisation by playing a sound when the elementalso flashes a white colour to signify that it has been ordered. Each element has

88 CHAPTER 4. X3D SOFTWARE VISUALISATIONS
a different tone played whose pitch is linearly related to the element’s value.Likewise we could do the same for the other animations and also play a sound foreach comparison or movement of an element.
Animation Quality: We applied some of the 10 commandments of algorithmanimation to our animations as suggested by Peter Gloor [91]. We tried to beconsistent in all of our animations as we made each of them last the same amountof time per cycle, which was 20 seconds, and provided a dashboard for usercontrols. We allowed interactivity, where upon users can rotate the viewpoint ofthe animation, and stop, start, pause, and change the speed of an animation. Wekept the user interested in our animations as we showed small data sets that madethe animations complete quite quickly and provided some realistic examples thatcould be user in introductory computer science data structure courses.
We emphasised the visual component as much as possible and we feel our sort-ing animations are very self explanatory. The elements in the sorting animationsuse depth or height of columns to represent the value of an element. Colour isemployed to show a red green blue spectrum once elements are ordered. Slidersare used to control the speed of an animation and a sphere is used to simulateiterating through a data set. We also provided the execution history in our elemen-tary sorting animation which shows why the current action happened based on asnapshot of past actions.
We did not manage to apply all of the 10 commandments for various reasons.We could have been more clearer and concise if we had implemented step buttonsthroughout the animations. We believe we can implement this with a JavaScriptfunction as shown by some of our other button implementations. We did not allowuser input in our animations, but we would like to do so in the future. This wouldrequire accessing the run-time of the scene and modifying the input variables andcould be implemented through the X3D Scene Access Interface (SAI). Therefore,we did not allow for the system to be generous and forgiving to erroneous usermanipulations.
We adapted the animations to the knowledge level of a user by allowingthem to be able to set the speed of animations, but we did not provide any stepbutton or built-in online help. We did not incorporate both symbolic and iconicrepresentations (e.g. pseudo code or source code). For this case study showingboth representations was not the focus. Section 4.4 shows how we could integrateonline help and symbolic and iconic representations.
Finally, for our animations we did not include any algorithm analysis but thiswould be a useful feature for a user. We could have listed what the worst casescenario is for each animation in text next to the title of the animation, however,
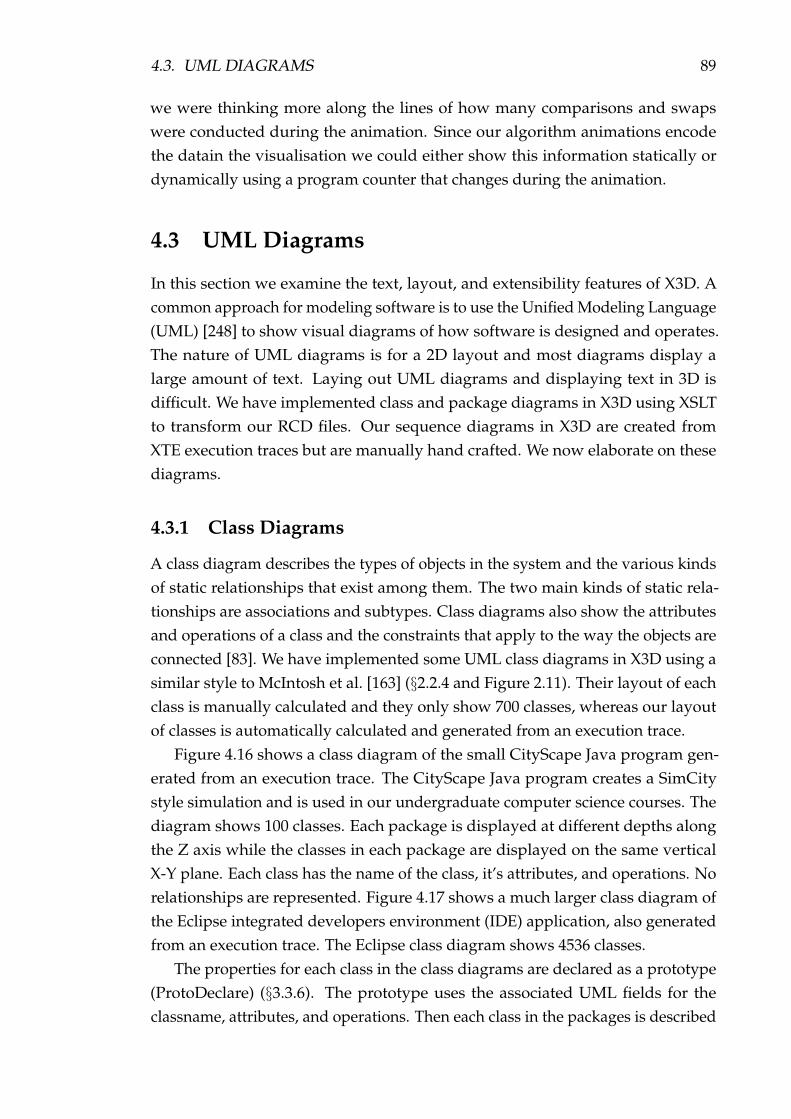
4.3. UML DIAGRAMS 89
we were thinking more along the lines of how many comparisons and swapswere conducted during the animation. Since our algorithm animations encodethe datain the visualisation we could either show this information statically ordynamically using a program counter that changes during the animation.
4.3 UML Diagrams
In this section we examine the text, layout, and extensibility features of X3D. Acommon approach for modeling software is to use the Unified Modeling Language(UML) [248] to show visual diagrams of how software is designed and operates.The nature of UML diagrams is for a 2D layout and most diagrams display alarge amount of text. Laying out UML diagrams and displaying text in 3D isdifficult. We have implemented class and package diagrams in X3D using XSLTto transform our RCD files. Our sequence diagrams in X3D are created fromXTE execution traces but are manually hand crafted. We now elaborate on thesediagrams.
4.3.1 Class Diagrams
A class diagram describes the types of objects in the system and the various kindsof static relationships that exist among them. The two main kinds of static rela-tionships are associations and subtypes. Class diagrams also show the attributesand operations of a class and the constraints that apply to the way the objects areconnected [83]. We have implemented some UML class diagrams in X3D using asimilar style to McIntosh et al. [163] (§2.2.4 and Figure 2.11). Their layout of eachclass is manually calculated and they only show 700 classes, whereas our layoutof classes is automatically calculated and generated from an execution trace.
Figure 4.16 shows a class diagram of the small CityScape Java program gen-erated from an execution trace. The CityScape Java program creates a SimCitystyle simulation and is used in our undergraduate computer science courses. Thediagram shows 100 classes. Each package is displayed at different depths alongthe Z axis while the classes in each package are displayed on the same verticalX-Y plane. Each class has the name of the class, it’s attributes, and operations. Norelationships are represented. Figure 4.17 shows a much larger class diagram ofthe Eclipse integrated developers environment (IDE) application, also generatedfrom an execution trace. The Eclipse class diagram shows 4536 classes.
The properties for each class in the class diagrams are declared as a prototype(ProtoDeclare) (§3.3.6). The prototype uses the associated UML fields for theclassname, attributes, and operations. Then each class in the packages is described
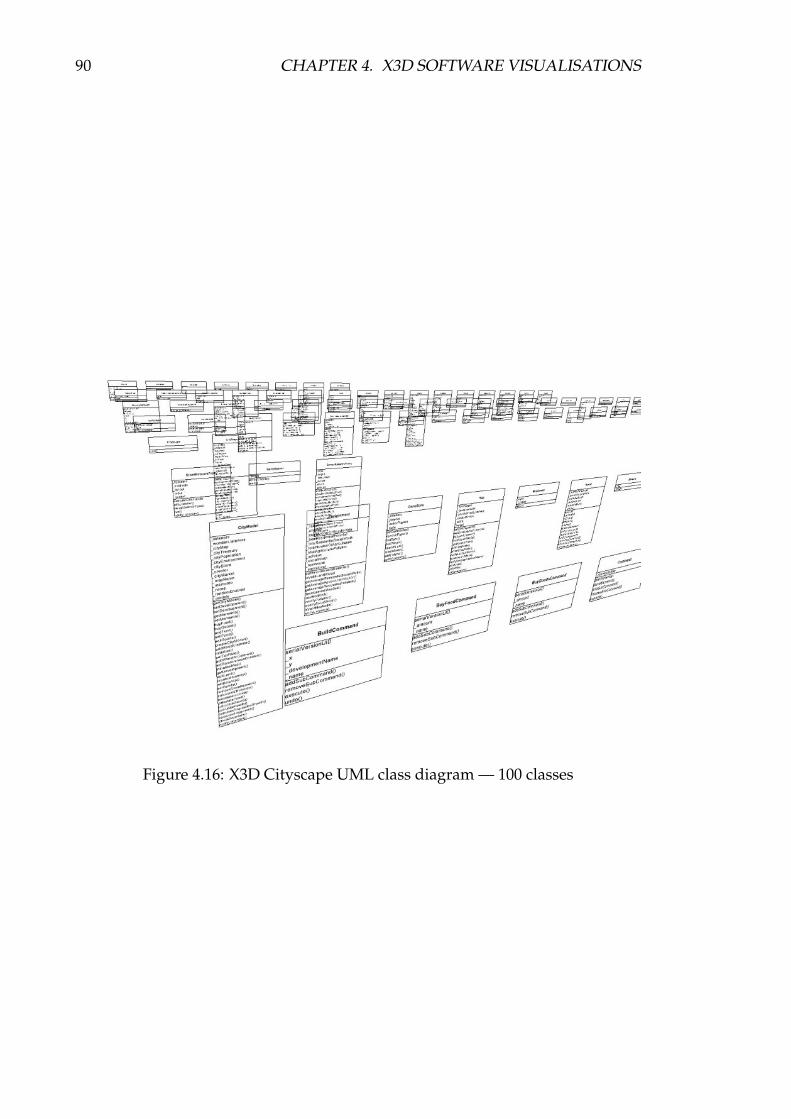
90 CHAPTER 4. X3D SOFTWARE VISUALISATIONS
Figure 4.16: X3D Cityscape UML class diagram — 100 classes

4.3. UML DIAGRAMS 91
Figure 4.17: X3D Eclipse UML class diagram — 4536 classes, showing the flexiblescale of the visualisation technique.

92 CHAPTER 4. X3D SOFTWARE VISUALISATIONS
in a prototype instance (ProtoInstance), which also has the same fields as that ofthe prototype class.
Figure 4.18 is a snippet of X3D code from the CityScape UML class diagramdisplayed in Figure 4.16. In Figure 4.18 the class diagram prototype is declared(lines 1–12), the controller package (lines 13–28), and the prototype instance showsthe BuildCommand class (lines 15–23), along with the class’ attributes (serialVer-sionUID, x, y, developmentName, name) (lines 17–18) and operations (addSub-Command(), removeSubCommand(), execute(), undo()) (lines 19–20).
1 <ProtoDeclare name="ClassDiagram" url="x3d-classdiagram.x3d">
2 <field accessType="initializeOnly" name="classname"
3 type="MFString"/>
4 <field accessType="initializeOnly" name="attributes"
5 type="MFString"/>
6 <field accessType="initializeOnly" name="operations"
7 type="MFString"/>
8 <field accessType="initializeOnly" name="height"
9 type="SFFloat"/>
10 <field accessType="initializeOnly" name="width"
11 type="SFFloat"/>
12 </ProtoDeclare>
13 <Group DEF="nz.ac.vuw.mcs.comp301.controller">
14 <Transform translation="20 0 -120">
15 <ProtoInstance name="ClassDiagram">
16 <fieldValue name="classname" value="BuildCommand"/>
17 <fieldValue name="attributes" value="serialVersionUID _x _y
18 _developmentName _name"/>
19 <fieldValue name="operations" value="addSubCommand()
20 removeSubCommand() execute() undo()"/>
21 <fieldValue name="height" value="15"/>
22 <fieldValue name="width" value="15"/>
23 </ProtoInstance>
24 </Transform>
25
26 ...
27
28 </Group>
Figure 4.18: UML Class diagram prototype declaration and an example prototypeinstance from the CityScape Java program.
4.3. UML DIAGRAMS 93
Line 1 of Figure 4.18 shows a link to the layout X3D file (url=”x3d-classdiagram.x3d”).The class diagram layout file is used to do the layout for each of the prototypeinstances. The prototype instances do not produce any new XML elements insteadthey are mapped to existing X3D geometry. Inside the layout file a JavaScriptfunction draws a border around the class, it’s attributes, and operations. Theborder around a class is implemented with an indexed face set, which calculatesthe height of the border, but has a fixed width. The layout file also defines theglobal position of the class in the world.
4.3.2 Package Diagrams
A package diagram shows packages, classes, and the dependencies among them.In theory a package diagram is just a class diagram that shows only packages anddependencies [83]. We have implemented some package diagrams of some Javaprograms in X3D.
Figure 4.19 shows a package diagram of the same CityScape Java program asin the previous subsection. The diagram shows eight packages at increasing Z andnegative Y axes values. Classes are listed inside of each package. We experimentedwith changing the colours of the text in the package since black is very plain andwanted to see if another colour was more effective. The blue used for the classlistings seems to stand out better than the black from the class diagrams.
The package diagrams were implemented in the same way as the previousclass diagrams with prototypes. The only differences is that the boxes did not needto be as big and that the prototype fields are different. Since we were displayingless information the boxes did not need to cater for attributes and operations,instead we only had a package name and the names of classes.
4.3.3 Sequence Diagrams
Sequence diagrams are a type of interaction diagram. They describe how groups ofobjects collaborate in providing some behaviour [83]. We are interested in seeingif we can create a similar diagram to our previous work as listed in Figure 2.18(b).We have implemented a sequence diagram in X3D manually hand crafted ratherthan using XSLT as in our previous UML diagrams.
Figure 4.20 shows a manual drawing of a sequence diagram of the CityScapeJava program of seven objects and the main method from an oblique angle. Eachobject activation is implemented using cylinders while an object’s lifeline is imple-mented as an indexed line set (§3.3.1). Message calls and message returns are alsoimplemented using indexed line sets.

94 CHAPTER 4. X3D SOFTWARE VISUALISATIONS
Figure 4.19: X3D Cityscape UML package diagram
4.3. UML DIAGRAMS 95
Using cylinders was not the best choice of object to use, nor was a box whenthe diagram scales to be much larger. Once there are many more objects andmessages then the global position of these shapes causes an issue. The issue isthat a cylinder and a box are centred or drawn from the middle point of the shape.This means that that the text labels of the objects at the top of the diagram wouldneed to change position to stay in an even row every time a cylinder or box wasincreased in size. Instead, it would be better to use an indexed face set which canlook like a box, but define eight coordinate points. The first fours points determinewhere the object starts at the highest point in the Y axis (e.g. the top face of thebox). The bottom face is four coordinate points at the lowest point the in the Yaxis. When using boxes for object activation the global position of object names,messages, and message returns are not reliant on the positioning of the boxes andcan therefore be nicely aligned. For the object lifelines we wanted to draw dashedlines rather than solid lines, however not all of the X3D browsers implementedthis feature or line property.
We used a billboard grouping node for the text labels (§3.3.3). The billboardnode enables a user to rotate the view point and to always see the text lined upto the associated element it is matched to. This can be useful if a user rotates theview in order to read the diagram from right to left instead of the norm of left toright. Likewise if a user moves down, left, or right using the slide navigation typein the diagram the text will always face the viewer.
4.3.4 Discussion
The prototypes used to create the UML class and package diagrams took sometime to program, but are very useful for creating automatic software visualisationsof UML diagrams in X3D. Building a library of reusable prototypes such as UMLdiagrams will enable future developers to use them in order to create their ownsoftware visualisations. Creating a software visualisation component in the X3Dspecification from a library of software visualisation prototypes such as UMLdiagrams will mean that X3D browser vendors can implement this kind of com-ponent therefore making it easier for developers to create software visualisationswith X3D.
We could lay out all the packages in the package diagram on a single X-Y planewith the same Z axis value. The package layout for this kind of visualisationwould not scale very well once there are many packages. Instead, we intentionallyoffset the packages in both the Y and Z axes as we would like to be able to combineboth the package and class diagrams together. For example when a user is viewingthe package diagram they can click on a package or a class and get further details.
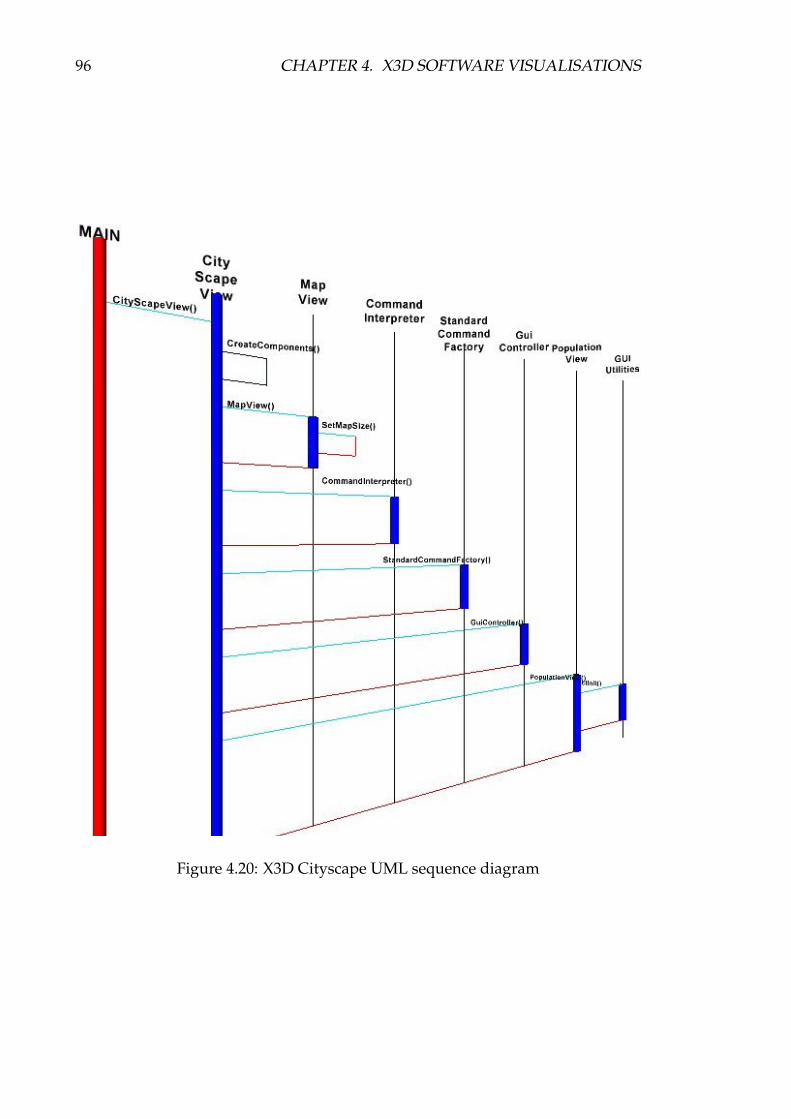
96 CHAPTER 4. X3D SOFTWARE VISUALISATIONS
Figure 4.20: X3D Cityscape UML sequence diagram

4.4. DOCUMENTATION-RELATED VISUALISATIONS 97
Perhaps the classes in a package diagram could be expanded or unfolded to showwhat is visible in a class or all the classes within a package could be laid out on theX-Y plane with the same Z axis value. Likewise a user could then fold or retractthe classes and turn them back into a single package entity.
We are currently investigating the automatic creation of sequence diagramssimilar to our class diagrams and sequence diagrams from execution traces. Creat-ing these kind of visualisations automatically requires more effort since X3D ispurely a graphics file format and it is hard to encode the relationship data betweenthe nodes within a X3D software visualisation. Using prototypes as in our classand package diagrams would be a good approach to solving this problem.
The 3D navigation capabilities provided by the X3D browsers proved to be verysuccessful for navigating amongst 3D UML diagrams. These options includedsliding up and down, flying, walking, and examining. The navigation optionsmade it easy for a user to browse the packages, classes, methods, and fields in theJava software programs. Once the X3D content became very large (4000+ classesFigure 4.17) the rendering speed of the X3D scene was so slow that it compromisedthe performance of these navigation options so that the software visualisation wasunusable.
We found the billboard node for changing the rotation of text to be very usefulas it can help a user to read text labels from the distance or from an oblique angle.The sequence diagram was a good example use of the billboard node because thetext was readable on the far right when exploring the diagram on the left. If thetext were positioned far off in the distance then it would be hard to read. We alsotried using the billboard node in our class diagrams. We found that it was not aseffective, as the classes were positioned at decreasing values in the Z axis but withsimilar Y axis values so it actually made it hard to read the text.
4.4 Documentation-Related Visualisations
In this section we test the integration capabilities of X3D for documentation-relatedvisualisations. When visualising software it can be useful to show the underlyingdata source of the visualisation or combine another view of the software whichmay help in understanding the overall piece of software. We have implementedsome software visualisations in X3D that combine a visualisation with the originalsource code, Javadoc6 API specification, and videos which describe componentsof the software.
6Javadoc is a tool for generating API documentation in HTML format from the original sourceand Java documentation comments in the source code.
98 CHAPTER 4. X3D SOFTWARE VISUALISATIONS
4.4.1 Source Code Visualisation
We are interested in being able to show a visualisation or diagram with the as-sociated source code of a program. This is useful to a developer as they can seethe graphical representation of a program and the code that is associated with thediagram on the same screen. Previous work by colleagues in our research groupshowed how we did this using SVG (§2.3.4 and Figure 2.18(a)).
Figure 4.21 shows a visualisation which represents a UML like class diagramof a C++ program. The image has two displays, the left frame shows the X3Dvisualisation and the right frame shows the original source code of the programwhich was used as the information for the visualisation. The source code isrendered in HTML. In the visualisation classes are represented as red spheres andabstract classes as cones which animate to different colours. The white cylindersrepresent the inherited relationship amongst the classes.
A user can examine the visualisation by rotating the view which gives differentviews of the class diagram to gain a greater understanding. A user can manipulatenodes by dragging them around the visualisation to show different parts of theclass diagram. A user can click on a class which changes to a white colour and theassociated class declaration is highlighted in the source code of the right frameusing JavaScript. In the visualisation the user has selected the class at the bottomright of the visualisation (changing to a white sphere) which has highlighted theassociated class declaration (highlighted yellow) in the source code (the Fox class).
4.4.2 API Javadoc Visualisation
Following on from our source code visualisation we are interested in being ableto provide non-source code textual descriptions of a piece of software alongsidea visualisation. Figure 4.22 shows the class diagram from Figure 4.16 with theJavadoc for the CityScape Java Program.
When a user clicks on a class in the visualisation in the left frame the associatedJavadoc class is displayed in the main class frame window on the right. We couldquite easily also create a visualisation for the packages represented in the Javadoc.The advantage of this visualisation is that X3D allows a user to see the softwarevisualisation as well as browse the Javadoc at the same time.
4.4.3 Structured Video Visualisation
Ron Baecker [19] suggests creating structured video systems for creating visualdemonstrations and explanations of software to show users how to accomplishdesired tasks. Users can access the videos by the web and delivered over the

4.4. DOCUMENTATION-RELATED VISUALISATIONS 99
Figure 4.21: Source code visualisation with a UML like class diagram and C++source code.
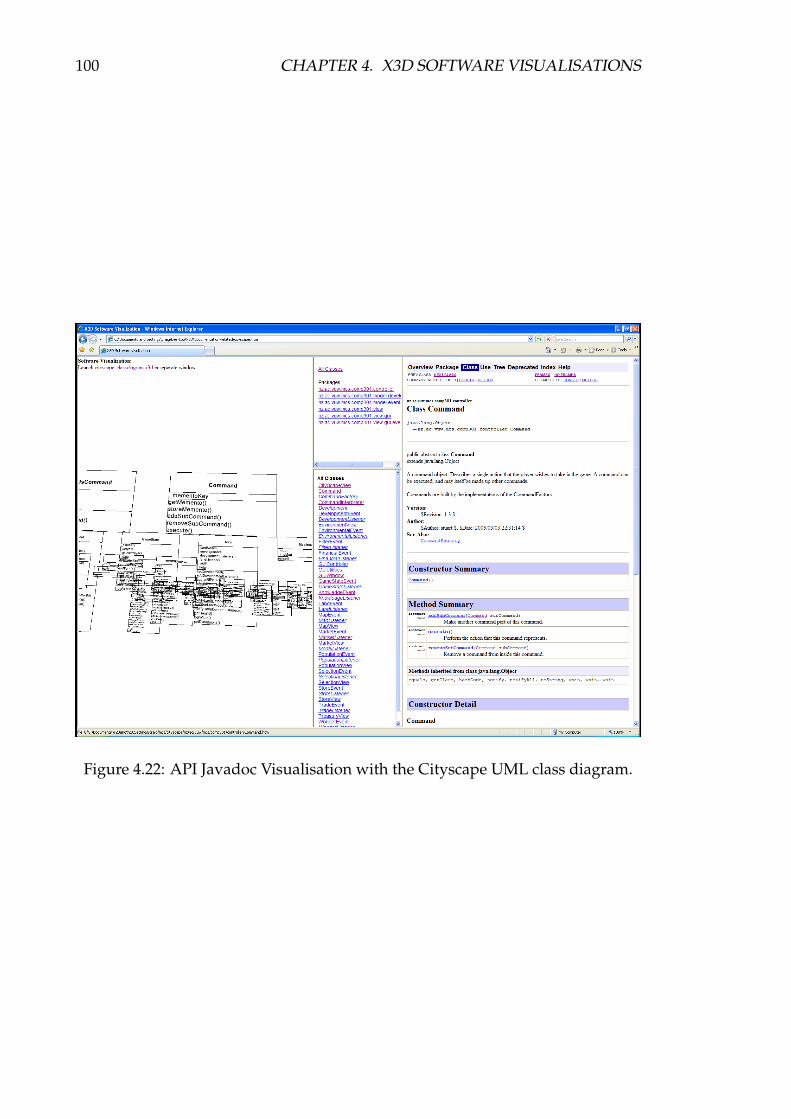
100 CHAPTER 4. X3D SOFTWARE VISUALISATIONS
Figure 4.22: API Javadoc Visualisation with the Cityscape UML class diagram.
4.4. DOCUMENTATION-RELATED VISUALISATIONS 101
Internet. None of his examples show actual source code or visualisations ofsoftware.
Figure 4.23 shows a video of a developer discussing the design of one of thecomponents from the same software visualisation as in Figure 4.21, once a userhas clicked on one of the nodes in the class diagram. The advantage of usinga video approach is that a developer will be able to go into more detail as towhy a particular component was designed in a certain way or what the softwareactually does or intends to accomplish. The videos may even open up issuesor discuss ideas which are just too hard to describe within written or diagramdocumentation.
Each of the components within the visualisation have a video associated withthem. Once a user clicks on a node it triggers a touch sensor to play a movie inthe left part of the visualisation. The video is mapped as texture using the movietexture node to an indexed face set (§3.3.1).
We could also display the video on the specific geometry node of a componentwithin the visualisation that was selected, but it would be harder for a user tointerpret the video since the shapes in the visualisation are all different. If we haveof used UML diagrams and display the video on the classes or packages then thetext would have been hidden. We felt it was better to separate the additional videofrom the main part of the visualisation, so that a user can navigate around thevisualisation and play a video once they come across an interesting component.
Mapping the video as texture to geometry within the visualisation was easierthan using another frame as in the previous documentation visualisations (§4.4.1and 4.4.2). We could have also used the YouTube7 approach by embedding a videoin a web page. The advantage of using the X3D movie texture node is that it onlyrequires a couple of extra lines of X3D code rather than a totally separate HTMLfile. The actual movie is also embedded in the software visualisation rather than aseparate frame.
The video part of the visualisation could also be displayed within a dashboardimplemented with a proximity sensor so that no matter what angle the visualisa-tion is displayed at the video will always be directly straight in front of the viewer.Finally, the location, direction, and relative intensity of the sound of the video canalso be controlled using the X3D sound node.
4.4.4 Discussion
We found the linking capabilities of X3D to be very useful and easy to createdocumentation-related visualisations. The linking between frames is controlled by
7http://youtube.com

102 CHAPTER 4. X3D SOFTWARE VISUALISATIONS
Figure 4.23: Structured Video Visualisation with a UML like class diagram.
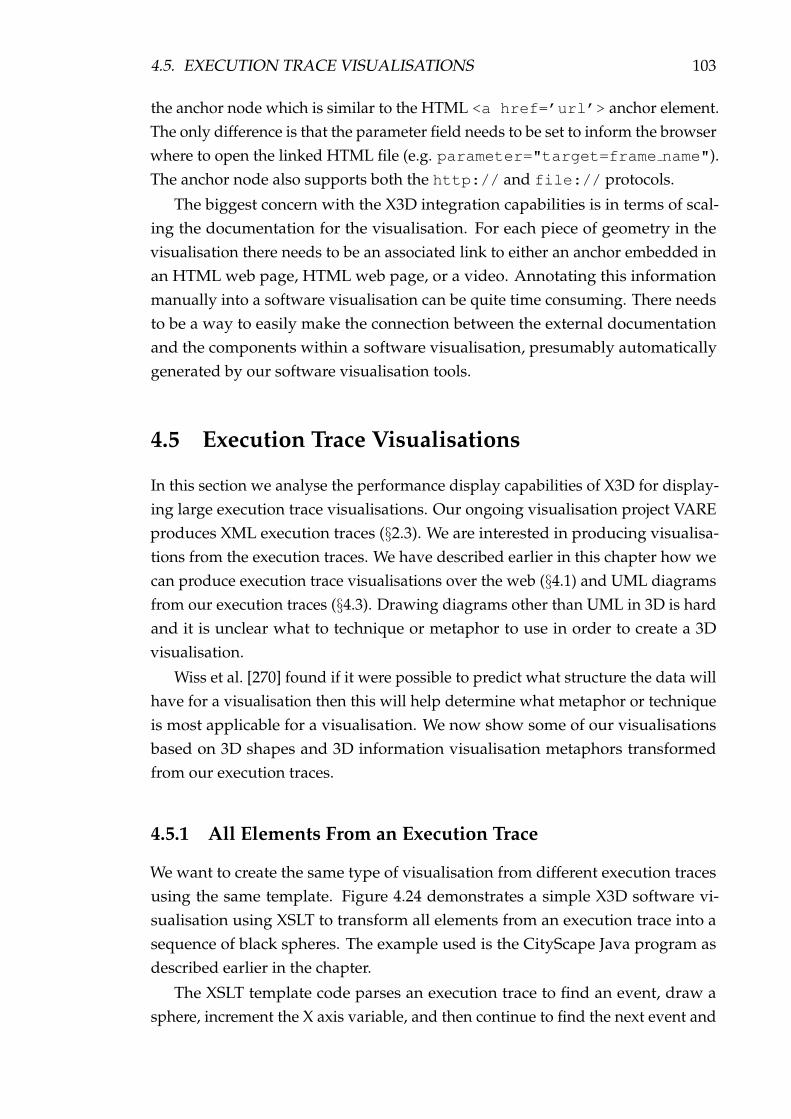
4.5. EXECUTION TRACE VISUALISATIONS 103
the anchor node which is similar to the HTML <a href=’url’> anchor element.The only difference is that the parameter field needs to be set to inform the browserwhere to open the linked HTML file (e.g. parameter="target=frame name").The anchor node also supports both the http:// and file:// protocols.
The biggest concern with the X3D integration capabilities is in terms of scal-ing the documentation for the visualisation. For each piece of geometry in thevisualisation there needs to be an associated link to either an anchor embedded inan HTML web page, HTML web page, or a video. Annotating this informationmanually into a software visualisation can be quite time consuming. There needsto be a way to easily make the connection between the external documentationand the components within a software visualisation, presumably automaticallygenerated by our software visualisation tools.
4.5 Execution Trace Visualisations
In this section we analyse the performance display capabilities of X3D for display-ing large execution trace visualisations. Our ongoing visualisation project VAREproduces XML execution traces (§2.3). We are interested in producing visualisa-tions from the execution traces. We have described earlier in this chapter how wecan produce execution trace visualisations over the web (§4.1) and UML diagramsfrom our execution traces (§4.3). Drawing diagrams other than UML in 3D is hardand it is unclear what to technique or metaphor to use in order to create a 3Dvisualisation.
Wiss et al. [270] found if it were possible to predict what structure the data willhave for a visualisation then this will help determine what metaphor or techniqueis most applicable for a visualisation. We now show some of our visualisationsbased on 3D shapes and 3D information visualisation metaphors transformedfrom our execution traces.
4.5.1 All Elements From an Execution Trace
We want to create the same type of visualisation from different execution tracesusing the same template. Figure 4.24 demonstrates a simple X3D software vi-sualisation using XSLT to transform all elements from an execution trace into asequence of black spheres. The example used is the CityScape Java program asdescribed earlier in the chapter.
The XSLT template code parses an execution trace to find an event, draw asphere, increment the X axis variable, and then continue to find the next event and

104 CHAPTER 4. X3D SOFTWARE VISUALISATIONS
so on. In Figure 4.24 a file called axes.x3d is included to display the different axeswhere the Y axis is green, the X axis red, and the Z axis blue.
Figure 4.25 extends the previous figure by giving each node a different shapeand colour depending upon the event in the execution trace and displayed onseparate lines. Blue spheres are object creations, method calls are green boxes andthe main class is a method call represented as a red box. White cones are methodreturns and also used to represent the end of an object.
Figure 4.26 shows the same information but displayed in a single line whichshows the exact sequence of events that occurred in the execution of the CityScapeprogram. The CityScape program is not multi-threaded.
Figure 4.24: All elements from an execution trace represented as a sequence ofspheres.
Figure 4.25: All elements from an execution trace represented as different shapeson different lines.

4.5. EXECUTION TRACE VISUALISATIONS 105
Figure 4.26: All elements from an execution trace represented as a different shapesand on the same line.
A sequence of shapes does not give that much insight into the execution ofsoftware and it is hard to display all the information on the screen at one time.Exploring more powerful visualisation techniques for laying out the informationabout an execution trace may provide more insight about a program. We nowexplore 3D compound shapes and 3D information visualisation metaphors.
4.5.2 3D Compound Shapes
There are many kinds of 3D shapes that exist which we could implement torepresent our execution traces. We have decided to implement a representativesample of shapes including a cuboid and a 3D spiral cylinder. These kind ofvisualisations could make it easier for the user to analyse and navigate repeatedpatterns of execution of a program as opposed to a long sequence of shapes in a line.We now elaborate on both of these 3D compound shapes showing visualisationsusing the CityScape and Eclipse Java programs.
Figure 4.27 shows 275 events from the CityScape program laid out as a cuboid.We use the same shapes and colours for representing the different events in anexecution trace as the visualisations from the previous subsection. The visuali-sation starts at the main method represented as the red box at the bottom in themiddle of the figure. The next event is displayed along the X axis. After the first 7elements the position of the next element is displayed with a decremented Z axisvalue and so on for the first 49 elements. Each layer of the cuboid has 49 events.The next layer then has the Y axis value increased and so on until all the eventsof the execution trace are displayed. The eventual shape may not end up being acube due to the number of events in the execution trace.
Each event in the execution trace is parsed and then a JavaScript layout functionis called to position the node in the world. Figure 4.28 shows the XSLT template

106 CHAPTER 4. X3D SOFTWARE VISUALISATIONS
Figure 4.27: All elements from the CityScape execution trace represented as a cubelike shape.

4.5. EXECUTION TRACE VISUALISATIONS 107
code for parsing object creation events. The code searches for an event that is oftype xte:objectcreation (line 2), then gets the associated eventid (line 3) and passesit to the layout function (line 6).
Figure 4.29 shows the JavaScript layout function, getTranslation() (lines 4–15) which takes an eventid as a parameter and returns X, Y, and Z translationcoordinates for a transform node. Once the layout function returns with thetranslation values a blue sphere is drawn (lines 7–17 of Figure 4.28). This is thesame for other events such as method calls (green box) and method returns (whitecone), but different shapes and colours are used. The length variable (line 6 ofFigure 4.29) determines what size the cube is going to be.
1 <!-- OBJECT CREATION -->
2 <xsl:template match="xte:objectcreation">
3 <xsl:variable name="eventid" select="@xte:eventid"/>
4 <xsl:text disable-output-escaping="yes"><![CDATA[
5 <Transform translation="]]></xsl:text>
6 <xsl:value-of select="result:getTranslation(string(eventid))"/>
7 <xsl:text disable-output-escaping="yes"><![CDATA[">
8 <Shape>
9 <Appearance>
10 <Material diffuseColor="0 0 1"/>
11 </Appearance>
12 <Sphere radius="1"/>
13 </Shape>
14 </Transform>
15 ]]>
16 </xsl:text>
17 </xsl:template>
Figure 4.28: XSLT code to parse an object creation event from our execution traces
Figure 4.30 shows the end results after applying the cube XSLT transformationcode and the JavaScript layout function (Figure 4.29) to the CityScape executiontrace. The CityScape cube visualisation code shows an object creation (blue spherelines 1–8), method call (green box lines 9–16), and method return (white cone lines17–24) events.
The visualisations in Figures 4.31, and 4.32 show the Eclipse execution traceafter 10,000, and 100,000 events. Despite the large scale of these examples the XSLTtransformation step took less than two minutes and the rendering process 10 sec-onds for 10,000 events and up to 10 minutes for 100,000 events. The rendering andrun-time performance of the 100,000 events visualisation was severely comprised

108 CHAPTER 4. X3D SOFTWARE VISUALISATIONS
1 <xalan:component prefix="result" functions="getTranslation">
2 <xalan:script lang="javascript">
3
4 function getTranslation (id){
5
6 var length = 10;
7 var plane = length * length;
8
9 var x = ((id%length) * 10);
10 var y = (((id - (id%plane)) / plane) * 10);
11 var z = (((id%plane) - ((id%plane)%length)) / length) * -10;
12
13 var result = x + " " + y + " " + z;
14 return result;
15 }
16
17 </xalan:script>
18 </xalan:component>
Figure 4.29: JavaScript layout function that calculates x, y, and z coordinates for anode.
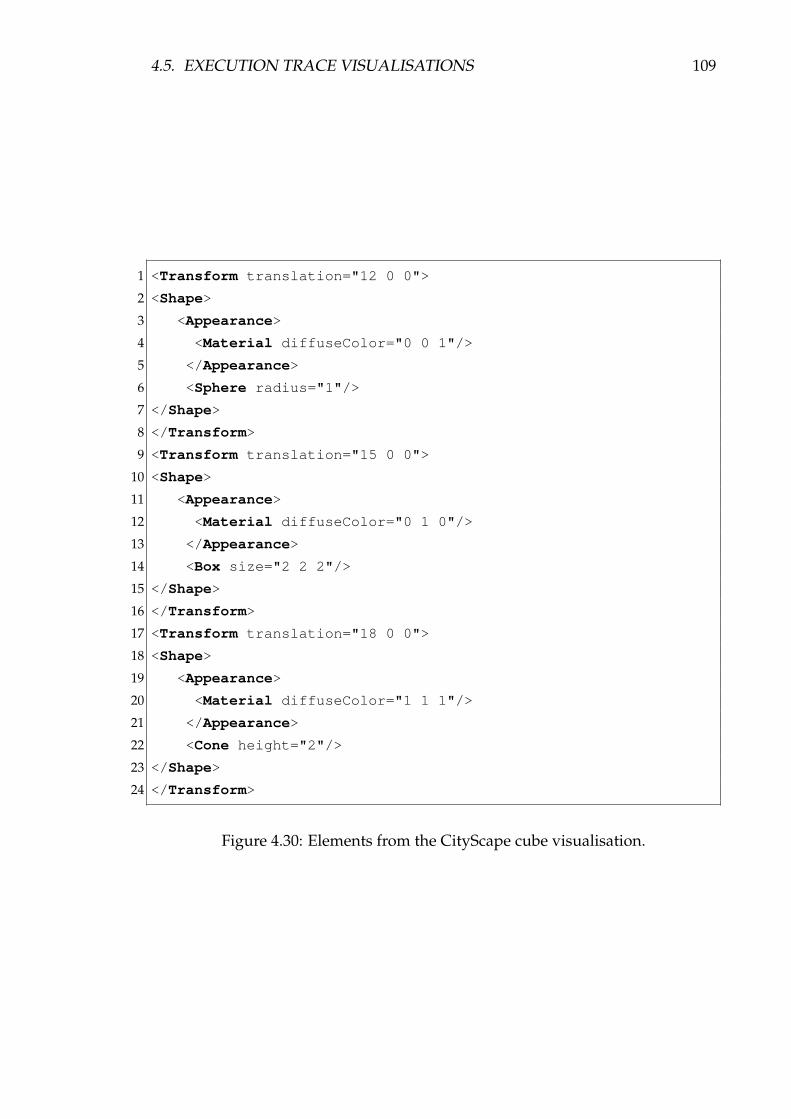
4.5. EXECUTION TRACE VISUALISATIONS 109
1 <Transform translation="12 0 0">
2 <Shape>
3 <Appearance>
4 <Material diffuseColor="0 0 1"/>
5 </Appearance>
6 <Sphere radius="1"/>
7 </Shape>
8 </Transform>
9 <Transform translation="15 0 0">
10 <Shape>
11 <Appearance>
12 <Material diffuseColor="0 1 0"/>
13 </Appearance>
14 <Box size="2 2 2"/>
15 </Shape>
16 </Transform>
17 <Transform translation="18 0 0">
18 <Shape>
19 <Appearance>
20 <Material diffuseColor="1 1 1"/>
21 </Appearance>
22 <Cone height="2"/>
23 </Shape>
24 </Transform>
Figure 4.30: Elements from the CityScape cube visualisation.
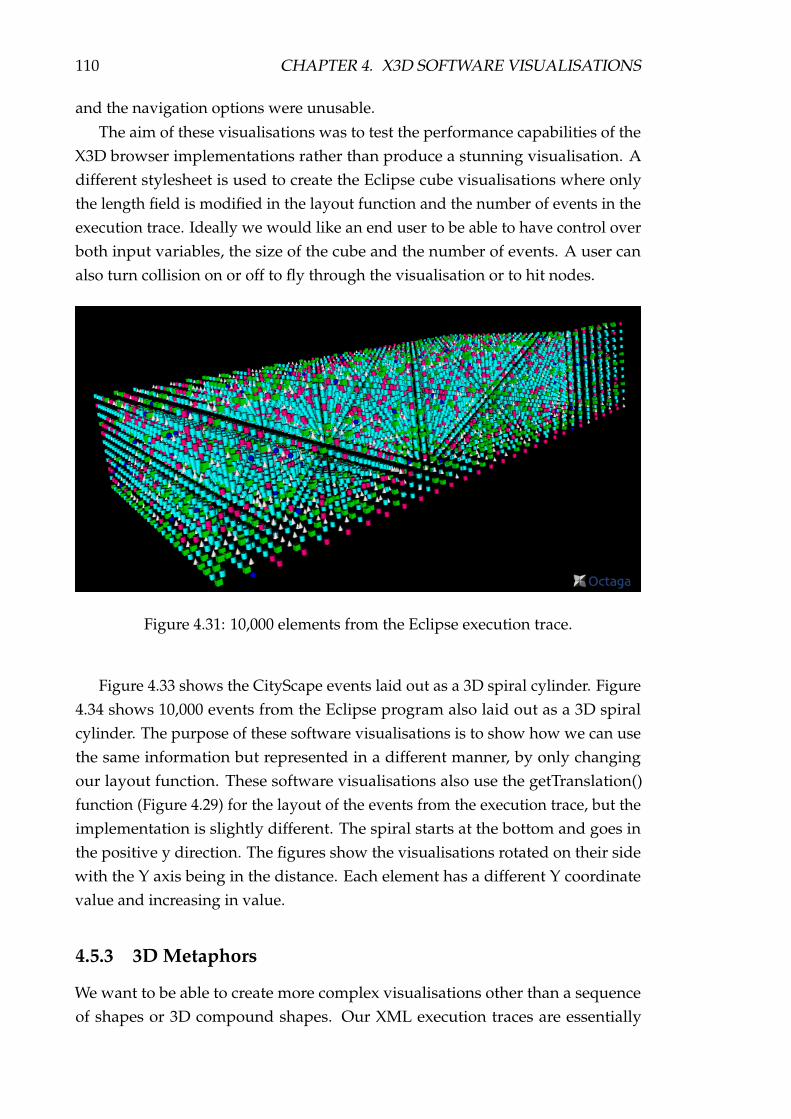
110 CHAPTER 4. X3D SOFTWARE VISUALISATIONS
and the navigation options were unusable.The aim of these visualisations was to test the performance capabilities of the
X3D browser implementations rather than produce a stunning visualisation. Adifferent stylesheet is used to create the Eclipse cube visualisations where onlythe length field is modified in the layout function and the number of events in theexecution trace. Ideally we would like an end user to be able to have control overboth input variables, the size of the cube and the number of events. A user canalso turn collision on or off to fly through the visualisation or to hit nodes.
Figure 4.31: 10,000 elements from the Eclipse execution trace.
Figure 4.33 shows the CityScape events laid out as a 3D spiral cylinder. Figure4.34 shows 10,000 events from the Eclipse program also laid out as a 3D spiralcylinder. The purpose of these software visualisations is to show how we can usethe same information but represented in a different manner, by only changingour layout function. These software visualisations also use the getTranslation()function (Figure 4.29) for the layout of the events from the execution trace, but theimplementation is slightly different. The spiral starts at the bottom and goes inthe positive y direction. The figures show the visualisations rotated on their sidewith the Y axis being in the distance. Each element has a different Y coordinatevalue and increasing in value.
4.5.3 3D Metaphors
We want to be able to create more complex visualisations other than a sequenceof shapes or 3D compound shapes. Our XML execution traces are essentially

4.5. EXECUTION TRACE VISUALISATIONS 111
Figure 4.32: 100,000 elements from the Eclipse execution trace.
Figure 4.33: CityScape 3D Spiral.
112 CHAPTER 4. X3D SOFTWARE VISUALISATIONS
Figure 4.34: Eclipse 3D Spiral.
tree structures. We would like to explore visualising the execution traces as treestructures by replicating some 3D information visualisation metaphors (§2.1.2).Wiss et al. [271] performed an empirical study on three 3D information visualisa-tion designs. The results indicated that subjects were significantly faster with theinformation landscape followed by the cam tree and then the information cube.We have implemented an information landscape and an information cube to showthe flexibility of our visualisation generation approach.
Figure 4.35 shows the layout of all the events from an execution trace of theCityScape Java program as an information landscape [7, 247]. The informationlandscape is essentially 2 1/2 D rather than 3D. The same shapes are used torepresent the same kind of events as in previous sub-sections. The image starts atthe red box (the highest node in the image) and is animated from right to left.
Figure 4.36 shows the same information as Figure 4.35, but displayed as aninformation cube [213]. The information starts with the main method outer redbox, followed by the first object creation blue sphere at the top right of the cubethen continuing along the links to each of the object creation blue spheres. Thespheres are transparent and the events that an object executes or sub-events areenclosed within the sphere.
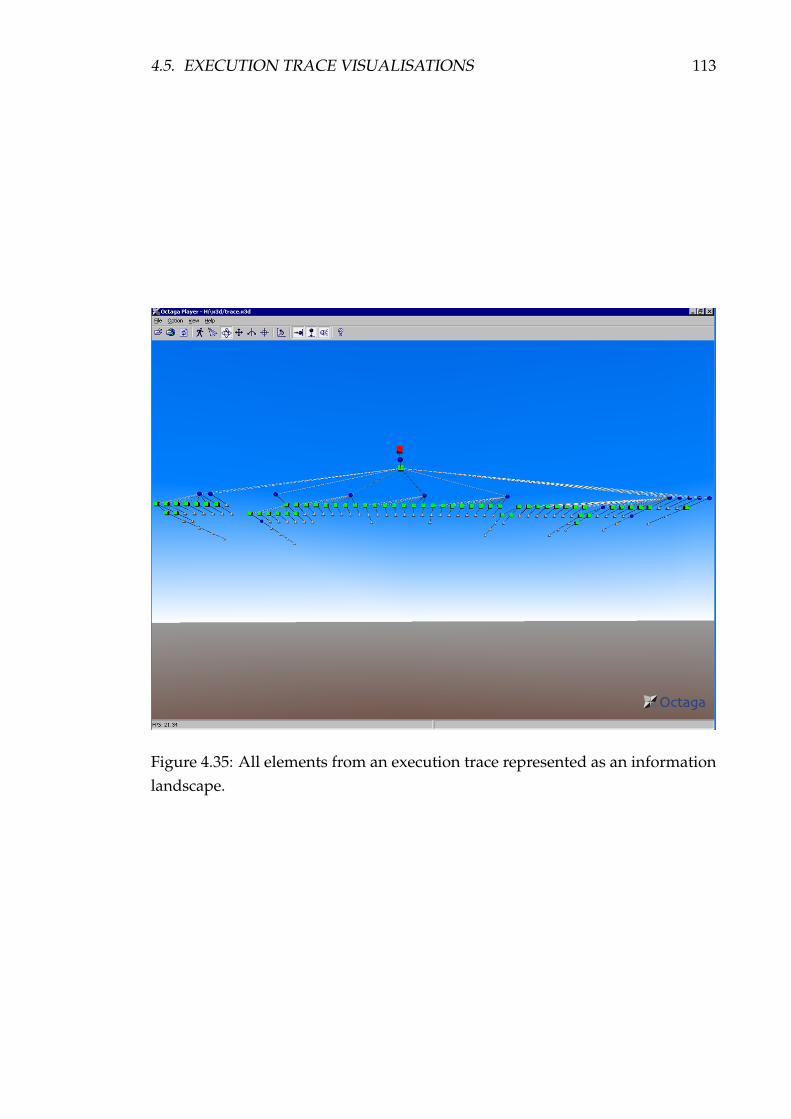
4.5. EXECUTION TRACE VISUALISATIONS 113
Figure 4.35: All elements from an execution trace represented as an informationlandscape.
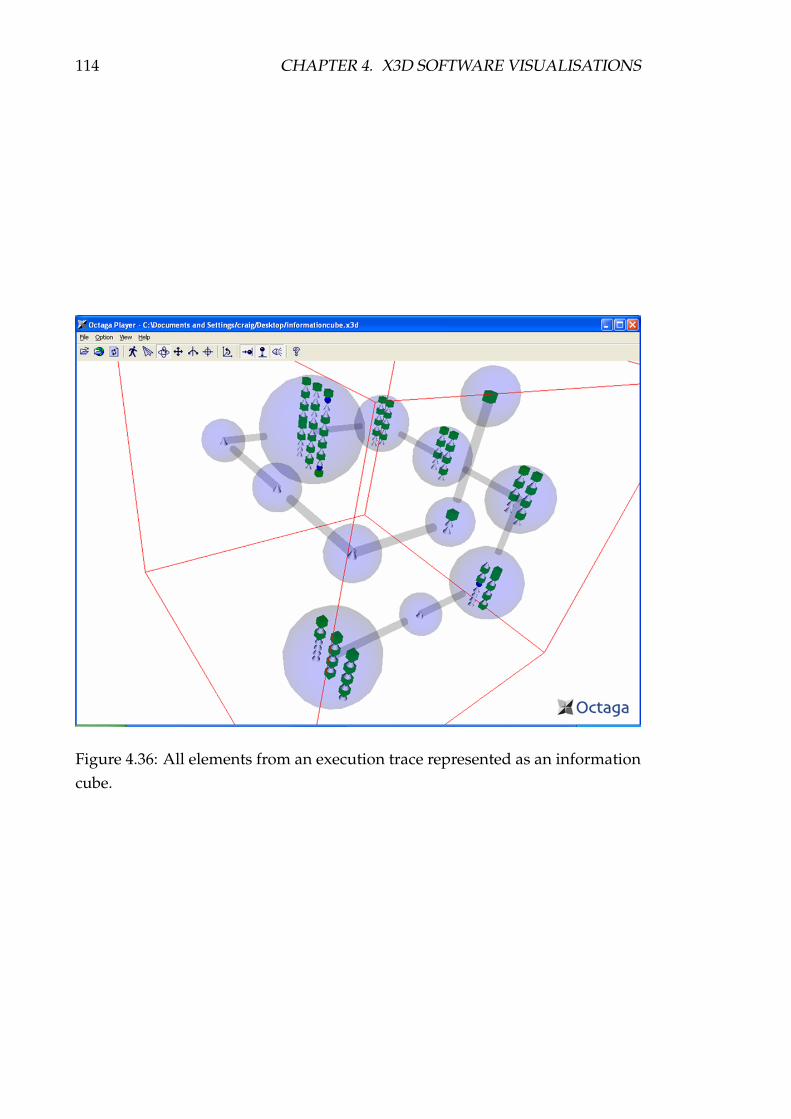
114 CHAPTER 4. X3D SOFTWARE VISUALISATIONS
Figure 4.36: All elements from an execution trace represented as an informationcube.
4.5. EXECUTION TRACE VISUALISATIONS 115
4.5.4 Discussion
The main difference between the information visualisation metaphors and the3D compound shapes is that they show the relationships between the eventsbetter since there are linked edges between the nodes in the visualisations. Bothtypes of visualisations encode the information in the visualisation but could beeasily modified to use prototypes to separate the information similar to our UMLdiagrams (§4.3).
Implementing the information landscape was more difficult than the infor-mation cube as it required more complex calculations for the links between thenodes and the number of lines of code was greater. A linear layout approach wasused. Using graph drawing algorithms [250] as used in graph drawing softwaresystems (§2.3.5) should improve the creation of these 3D information visualisationmetaphors.
Our information landscape does not actually reflect a true information land-scape. We could achieve a true reflection by changing the dimensions of eachobjectcreation and method call event to a size that is proportional to the number ofsub-events. Hence some events would be proportionally larger than other events,which would make them more prominent in the visualisation. We limited thetransparency level in the information cube to only one level to make the visualisa-tion more readable. X3D allows many levels of transparency so long as the nestedlevels are at a lower level of transparency otherwise the inner objects will not bevisible.
A useful feature to add to the execution trace visualisations would be animationand filtering capabilities. Animating the events from an execution trace as a 3Dcompound shape or an information visualisation metaphor could be useful to seethe way the events happen during execution. If this task were implemented itwould not scale well for the larger visualisations since the routing event modelhas a very cumbersome design; see the discussion earlier (§4.2.4).
Filtering could be applied to the events in a visualisation such as remove allmethod returns or just show the objects that get created, by setting or changingthe transparency level to one for a node. For the 3D information visualisationmetaphors this would also have to apply to the relationship edges as well. Addingfilters would again be quite cumbersome since the routing event model wouldhave to be used, once a user selects or clicks a button. There maybe a smarterway to achieve filtering if the data was encoded in a prototype and there was aJavaScript function that was generic enough to simulate the routing event model.
The size of the Eclipse visualisations after 10,000 events was approximately2MB, 50,000 events 10MB, and 100,000 events 18MB. The CityScape visualisations
116 CHAPTER 4. X3D SOFTWARE VISUALISATIONS
were approximately 50KB. It takes less than 10 seconds to render about 10,000events, three minutes for 50,000 events, but up to 10 minutes to render 100,000events. We used the Xj3D converter – a Java application for Windows – to compressthe large Eclipse visualisations into the X3D binary format (.x3db). The resultwas the size of the X3D files were reduced by about 75%. The visualisations onceconverted, however, were only viewable in the Xj3D browser (§3.4.1) since it is theonly X3D browser that currently supports the X3D binary format.
4.6 Summary
In this chapter we have described our tool for automatically creating softwarevisualisations from execution traces over the web. We then described our casestudies which replicated various well known software visualisation techniques inX3D. The case studies evaluated X3D’s animation and interactivity aspects, exam-ined the text, layout, and extensibility features, tested the integration capabilitiesof X3D, and analysed the performance display capabilities.
The case studies included algorithm animations (shortest path, heapsort, andelementary sorting), UML diagrams (package, class, and sequence diagrams),documentation-related visualisations (source code, API, and structured videovisualisations), and execution trace visualisations (3D compound shapes and3D information visualisation metaphors). For each case study we described thevisualisation, how we implemented the visualisation in X3D, discussed the issuesthat arose during the implementation, and how we could improve each of thevisualisations.
The next chapter describes a framework for evaluating X3D as a software visu-alisation medium that makes use of some well known information and softwarevisualisation taxonomies and frameworks. The following chapter then applies theframework to our experience of creating X3D software visualisations as we havedescribed in this chapter.

Chapter 5
Software Visualisation MediaEvaluation Framework
Contents5.1 Differences With Earlier Evaluation Model . . . . . . . . . . . . 118
5.2 Scope∗ . . . . . . . . . . . . . . . . . . . . . . . . . . . . . . . . . . 121
5.2.1 Requirements∗ . . . . . . . . . . . . . . . . . . . . . . . . . 121
5.2.2 Design∗ . . . . . . . . . . . . . . . . . . . . . . . . . . . . . 122
5.2.3 Method∗ . . . . . . . . . . . . . . . . . . . . . . . . . . . . . 123
5.2.4 Performance . . . . . . . . . . . . . . . . . . . . . . . . . . . 123
5.3 Form∗ . . . . . . . . . . . . . . . . . . . . . . . . . . . . . . . . . . . 123
5.3.1 Graphical Capability . . . . . . . . . . . . . . . . . . . . . . 123
5.3.2 Presentation∗ . . . . . . . . . . . . . . . . . . . . . . . . . . 125
5.3.3 Visualisation Techniques∗ . . . . . . . . . . . . . . . . . . . 126
5.4 Interaction∗ . . . . . . . . . . . . . . . . . . . . . . . . . . . . . . . 127
5.4.1 User Controls∗ . . . . . . . . . . . . . . . . . . . . . . . . . 127
5.4.2 User Navigation∗ . . . . . . . . . . . . . . . . . . . . . . . . 127
5.4.3 User Tasks∗ . . . . . . . . . . . . . . . . . . . . . . . . . . . 128
5.5 Discussion . . . . . . . . . . . . . . . . . . . . . . . . . . . . . . . . 128
117

118CHAPTER 5. SOFTWARE VISUALISATION MEDIA EVALUATION FRAMEWORK
As described earlier (§2) there have been many software visualisation tools andsystems that have been developed over many years, but there has been little effortto evaluate the effectiveness and utility of these tools and systems. There is also nosilver bullet for evaluating software visualisations [104] nor any benchmarks [152]to determine how effective a software visualisation is.
There are various information visualisation and software visualisation designguidelines [170, 228], taxonomies [177, 194, 195, 196, 221], models [74, 75], andframeworks [153, 243]. None of this previous research focuses on the actualgraphics technology per se. The primary goal of our work is to evaluate how goodX3D is for use in software visualisation.
In this chapter we present a framework for evaluating software visualisationmedia. The framework significantly extends some previous work by fellow col-leagues in our research group that created a model for the evaluation of softwarevisualisation media [74, 75]. “Software visualisation media” are defined as tech-nologies used in the creation, deployment and display of graphical images to anend-user via a computer display [74, 75]. The definition does not refer to softwarevisualisation media as the tools nor the visualisations, but to the language used toexpress the visualisations.
The previous model was based on the framework by Card et al. [45] whosework was inspired by the seminal work of Jacques Bertin entitled “Semiology ofGraphics” [24]. The previous model evaluated Scalable Vector Graphics (SVG) foruse in software visualisation. Having applied the model to SVG, this chapter nowextends the previous model to become a framework, incorporates new features,and integrates some other researchers’ work. In particular our extensions addressthe needs of 3D software visualisation and other ideas that improve generality.The differences between the new framework in this chapter and the previousmodel [74, 75] are discussed next.
5.1 Differences With Earlier Evaluation Model
We have significantly extended the previous evaluation model [74, 75] whichis now a subset of the framework we present in this chapter. The first majordifference is that we created three top-level categories, scope (§5.2), form (§5.3),and interaction (§5.4), instead of two distinct categories for information andsoftware visualisation. The scope category defines how the visualisation mediumhas been designed, how a user can create visualisations using the medium, andhow well the medium performs. The form category defines what the characteristicsof the output of the software visualisation medium is. Finally, the interaction
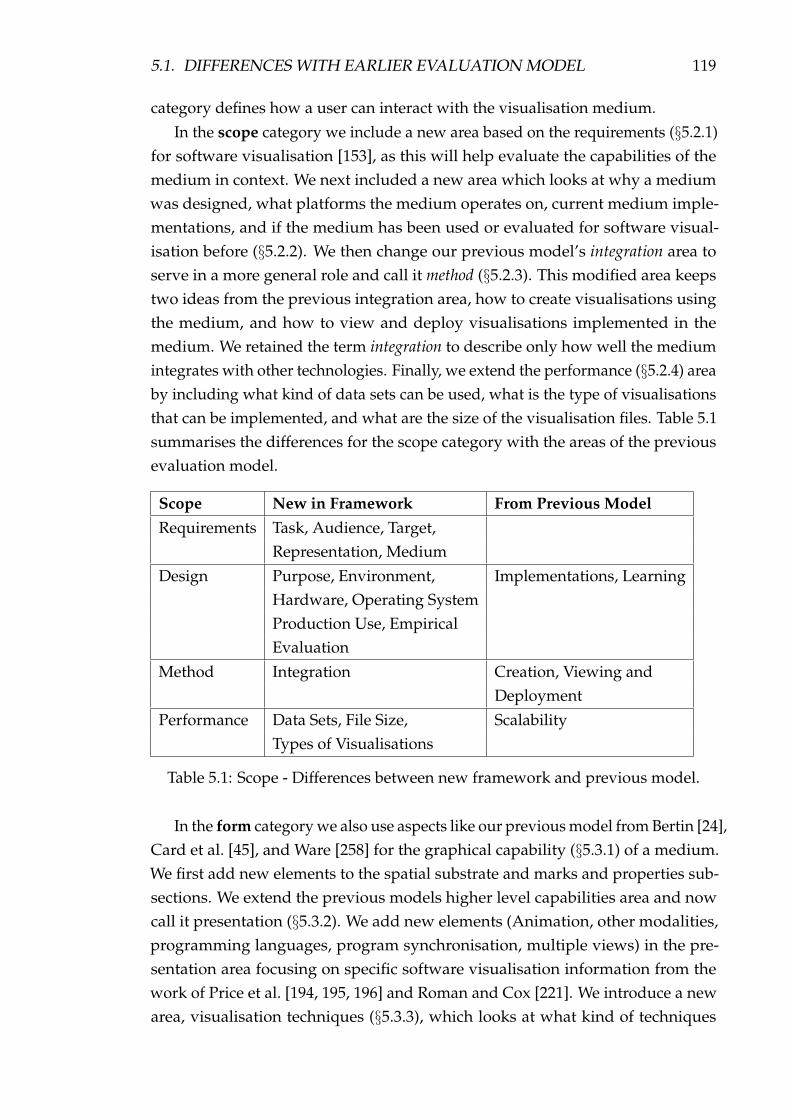
5.1. DIFFERENCES WITH EARLIER EVALUATION MODEL 119
category defines how a user can interact with the visualisation medium.In the scope category we include a new area based on the requirements (§5.2.1)
for software visualisation [153], as this will help evaluate the capabilities of themedium in context. We next included a new area which looks at why a mediumwas designed, what platforms the medium operates on, current medium imple-mentations, and if the medium has been used or evaluated for software visual-isation before (§5.2.2). We then change our previous model’s integration area toserve in a more general role and call it method (§5.2.3). This modified area keepstwo ideas from the previous integration area, how to create visualisations usingthe medium, and how to view and deploy visualisations implemented in themedium. We retained the term integration to describe only how well the mediumintegrates with other technologies. Finally, we extend the performance (§5.2.4) areaby including what kind of data sets can be used, what is the type of visualisationsthat can be implemented, and what are the size of the visualisation files. Table 5.1summarises the differences for the scope category with the areas of the previousevaluation model.
Scope New in Framework From Previous ModelRequirements Task, Audience, Target,
Representation, MediumDesign Purpose, Environment, Implementations, Learning
Hardware, Operating SystemProduction Use, EmpiricalEvaluation
Method Integration Creation, Viewing andDeployment
Performance Data Sets, File Size, ScalabilityTypes of Visualisations
Table 5.1: Scope - Differences between new framework and previous model.
In the form category we also use aspects like our previous model from Bertin [24],Card et al. [45], and Ware [258] for the graphical capability (§5.3.1) of a medium.We first add new elements to the spatial substrate and marks and properties sub-sections. We extend the previous models higher level capabilities area and nowcall it presentation (§5.3.2). We add new elements (Animation, other modalities,programming languages, program synchronisation, multiple views) in the pre-sentation area focusing on specific software visualisation information from thework of Price et al. [194, 195, 196] and Roman and Cox [221]. We introduce a newarea, visualisation techniques (§5.3.3), which looks at what kind of techniques

120CHAPTER 5. SOFTWARE VISUALISATION MEDIA EVALUATION FRAMEWORK
can be represented using the visualisation medium. The techniques include com-pound shapes, information visualisation metaphors [45], software visualisationtechniques [237], pictorial representations [177], and model frameworks [118]. Theprevious model only used pictorial representations. Table 5.2 summarises thedifferences for the form category with the areas of the previous evaluation model.
Form New in Framework From Previous ModelGraphical Capability(Spatial Substrate) Composition, Alignment Dimension Support, Folding
Overloading Recursion, Axis Distortion(Marks and Properties) Value, Texture Marks, Size, Colour,
Connection, Enclosure Orientation, TransparencyText, Advanced Graphics
(Temporal Encoding) Encoding Time, EncodingIdentity, Variation ofRetinal Encoding
Presentation Animation Data Display independenceOther Modalities Referencable ObjectsProgramming Languages Layout ConstraintsProgram SynchronisationMultiple Views
Visualisation Compound Shapes, Pictorial RepresentationsTechniques IV Metaphors,
SV Techniques,Model Frameworks
Table 5.2: Form - Differences between new framework and previous model
In the interaction category we extend our previous models interaction categoryand call it user controls (§5.4.1), and then add a new element, elision control [194] touser controls. We then add a new area in the interaction category, user navigation(§5.4.2), which looks at how a user can navigate within a software visualisationimplemented using the medium. The user tasks (§5.4.3) are also a new area in theinteraction category based on Shneiderman’s [228] seven tasks (overview, zoom,filter, details-on-demand, relate, history, and extract) from the visual informationseeking mantra (§2.1). Table 5.3 summarises the differences for the interactioncategory with the areas of the previous evaluation model.
In the next chapter we will use the framework presented in this chapter toevaluate X3D for use in software visualisation (§6). We now elaborate on thedetails of each of the three categories: scope, form, and interaction.

5.2. SCOPE∗ 121
Interaction New in Framework From Previous ModelUser Controls Elision Control Graphic Changeability,
Input Events, ComputationUser Notation, TemporalControl
User Navigation Navigation Types, NavigationControl, View Refinement,Speed
User Tasks Overview, Zoom, Filter,Details-on-demand, RelateHistory, Extract
Table 5.3: Interaction - Differences between new framework and previous model
Items marked with an asterisk in the framework indicate extensions to theprevious evaluation model.
5.2 Scope∗
We first need to determine what the requirements are for software visualisations,as this will help determine the suitability of the medium. We then look at how thesoftware visualisation medium is designed, how the visualisations are specified us-ing the medium, and how well the medium performs for displaying visualisations,in terms of scalability and range of visualisations.
5.2.1 Requirements∗
Maletic et al. [153] present a framework for the general tasks of understandingand analysis during the development and maintenance of large-scale softwaresystems. They define five dimensions to reflect the why, who, what, where, andhow of software visualisation. We see these dimensions as the requirements forsoftware visualisations and feel that these are important questions to ask whenconducting an evaluation for a software visualisation medium. Answering theserequirements questions will help determine whether or not the medium beingevaluated is suitable for the software visualisations a developer wants to create.The dimensions are as follows:
• Task∗: Why is the visualisation needed?
• Audience∗: Who will use the visualisation?

122CHAPTER 5. SOFTWARE VISUALISATION MEDIA EVALUATION FRAMEWORK
• Target∗: What is the data source to represent?
• Representation∗: How to represent a visualisation?
• Medium∗: Where to represent the visualisation?
5.2.2 Design∗
We propose a new area in the framework, based on how the visualisation mediumhas been designed. How is the software visualisation medium designed in termsof general characteristics. What is the current status of the medium? Have therebeen any evaluations conducted on the medium for software visualisation orother domains? The last two points (production use and empirical evaluation)are similar to ideas by Stasko et al. [194], but we apply them to the softwarevisualisation medium rather than the overall software visualisation system.
• Purpose∗: What is the purpose of the design of the medium?
• Environment∗: What is the primary target environment for the visualisationmedium?
• Implementations: What kind of implementations and how many exist forthe medium?
• Operating System∗: What kind of operating systems is the medium designedfor?
• Hardware∗: What kind of hardware does the medium operate on?
• Learning: How much time is required to learn the medium in order tobecome competent in using the medium to create a substantial softwarevisualisation?
• Production Use∗: Has the medium been used in the production for anysoftware visualisations either in industry or in academia? If so over whattime period?
• Empirical Evaluation∗: Has the medium been subjected to good experimentalsoftware visualisation evaluation?

5.3. FORM∗ 123
5.2.3 Method∗
What kind of tools are used to create and view a software visualisation developedin the medium and how well does the medium integrate with other languages? Theideas in this section are similar to that of the previous evaluation model [74, 75].
• Creation: What tools or technologies exist to create software visualisationsusing the medium?
• Viewing and Deployment: What tools or applications are required to viewthe software visualisations created using the medium?
• Integration∗: Does the medium integrate or have language bindings to othermedia or languages (e.g. scripting languages)?
5.2.4 Performance
To what degrees does the medium scale up to handle large examples? The firsttwo points and the last point are new ideas while the scalability point is a commongeneral issue in software visualisation.
• Data Sets∗: What kind and size of data sets can the medium handle as input?
• Types of Visualisations∗: What are the types of software visualisations themedium can handle? Which type of visualisation is the medium particularlygood at visualising?
• Scalability: How well do current implementations of the medium scale withlarge software visualisations [74, 75]?
• File Size∗: What are the sizes of the files and how do they scale?
5.3 Form∗
What are the characteristics of the output of the software visualisation medium?In particular we want to know what are the graphical capabilities of the medium,how can the visualisations be presented using the medium, and what visualisationtechniques are supported by the medium.
5.3.1 Graphical Capability
We define the graphical capability of a software visualisation medium as the visualencoding, which is how data is mapped to visual structures that can be seen in avisualisation.
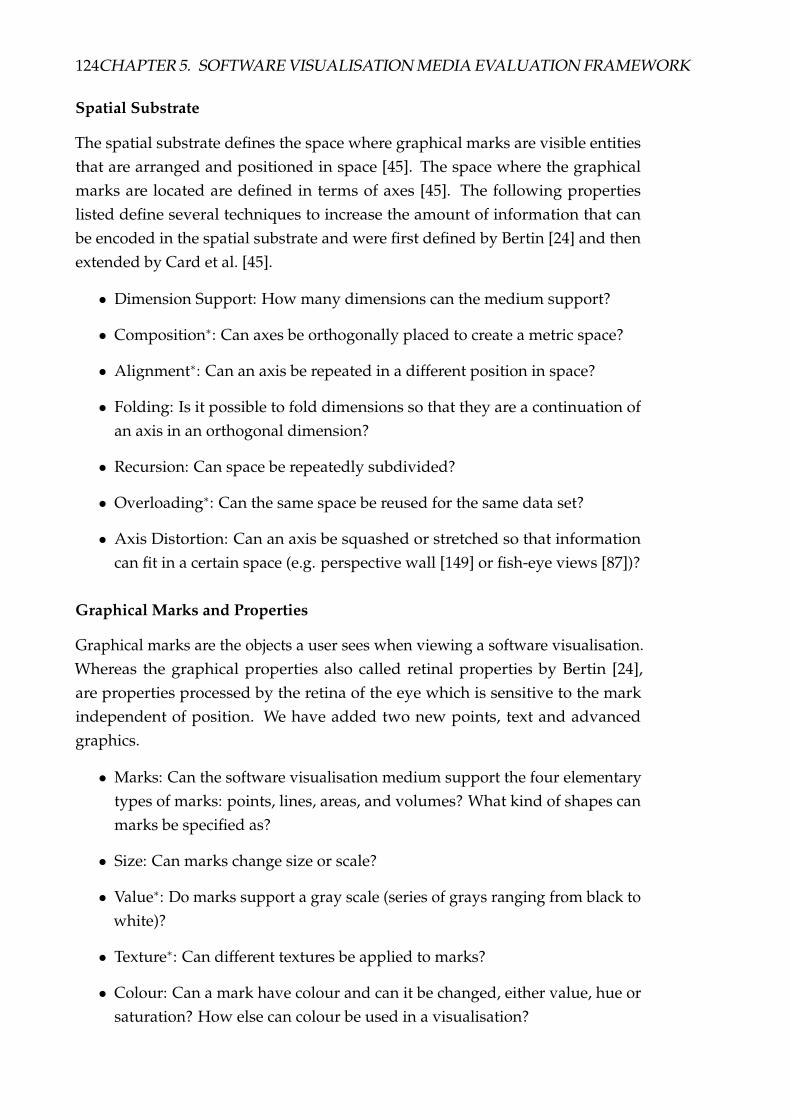
124CHAPTER 5. SOFTWARE VISUALISATION MEDIA EVALUATION FRAMEWORK
Spatial Substrate
The spatial substrate defines the space where graphical marks are visible entitiesthat are arranged and positioned in space [45]. The space where the graphicalmarks are located are defined in terms of axes [45]. The following propertieslisted define several techniques to increase the amount of information that canbe encoded in the spatial substrate and were first defined by Bertin [24] and thenextended by Card et al. [45].
• Dimension Support: How many dimensions can the medium support?
• Composition∗: Can axes be orthogonally placed to create a metric space?
• Alignment∗: Can an axis be repeated in a different position in space?
• Folding: Is it possible to fold dimensions so that they are a continuation ofan axis in an orthogonal dimension?
• Recursion: Can space be repeatedly subdivided?
• Overloading∗: Can the same space be reused for the same data set?
• Axis Distortion: Can an axis be squashed or stretched so that informationcan fit in a certain space (e.g. perspective wall [149] or fish-eye views [87])?
Graphical Marks and Properties
Graphical marks are the objects a user sees when viewing a software visualisation.Whereas the graphical properties also called retinal properties by Bertin [24],are properties processed by the retina of the eye which is sensitive to the markindependent of position. We have added two new points, text and advancedgraphics.
• Marks: Can the software visualisation medium support the four elementarytypes of marks: points, lines, areas, and volumes? What kind of shapes canmarks be specified as?
• Size: Can marks change size or scale?
• Value∗: Do marks support a gray scale (series of grays ranging from black towhite)?
• Texture∗: Can different textures be applied to marks?
• Colour: Can a mark have colour and can it be changed, either value, hue orsaturation? How else can colour be used in a visualisation?

5.3. FORM∗ 125
• Orientation: Can marks be positioned or rotated in space?
• Transparency: Is it possible to make marks partially or fully transparent?
• Connection∗: Can marks be used to signify topological structures like graphsand trees?
• Enclosure∗: Can marks be used to encode hierarchies?
• Text∗: Can text be supported in the medium? What kind of fonts andproperties can be applied to the text?
• Advanced Graphics∗: Does the medium support advanced graphic tech-niques (e.g. Non-Uniform, Rational B-Spline (NURBS))?
Temporal Encoding
Does the medium support changing the visualisation over time to communicateadditional information [45, 74, 75]?
• Encoding Time: Can the medium easily change graphics to show the passageof time?
• Encoding Identity: Can animations be specified on marks to show identity?
• Variation of Retinal Encoding: Can the value of all retinal encodings changeover time?
5.3.2 Presentation∗
We are interested in how the software visualisations can be presented and whatkind of software visualisation specific information can be displayed. The first threepoints are from the previous evaluation model [74, 75]. The last five points arebased on aspects from some software visualisation taxonomies [194], but aimed atif the medium can support these kind of visualisation aspects, rather than can theactual visualisation system do these kind of visualisations.
• Data Display Independence: Is the underlying data structures or informationseparate from the actual display of the data [74, 75]?
• Referencable Objects: Does the medium support being able to referenceobjects in a software visualisation [74, 75]?
• Layout Constraints: Does the medium support basic or advanced layoutconstraints [74, 75]?

126CHAPTER 5. SOFTWARE VISUALISATION MEDIA EVALUATION FRAMEWORK
• Animation∗: Does the medium support animations in the software visualisa-tions?
• Other Modalities∗: Does the medium support other modalities such as theability to play sound [36] and video to convey information and if so howdoes the medium accomplish these tasks?
• Programming Languages∗: What kinds of programming languages andparadigms can the medium support visualisations of?
• Program Synchronisation∗: Can the medium support synchronised visuali-sations of multiple programs simultaneously?
• Multiple Views∗: Can the medium support multiple views of different partsof the software being visualised?
5.3.3 Visualisation Techniques∗
We introduce a new area in the framework which looks at what kind of visualisa-tion techniques does the software visualisation medium support. The previousevaluation model [74, 75] was only concerned with pictorial representations [177]which we also include.
• Compound Shapes∗: Is it possible to create compound shapes using a combi-nation of primitive graphical marks?
• Information Visualisation Metaphors∗: What kind of information visualisa-tion metaphors [45] does the medium support (e.g. Tree Maps [116], ConeTrees [220], Information Cubes [213], Information Landscapes [7, 247])?
• Software Visualisation Techniques∗: What kind of software visualisationmetaphors or displays does the medium support (e.g. UML diagrams [83],algorithm animations [33])?
• Pictorial Representations: Does the medium support the three well-knowntypes of pictorial representations (graph-based displays or node-link dia-grams, statistics-based displays, and source-code-related displays) [177]?
• Model Frameworks∗: Does the medium support the model frameworks forrepresenting object-oriented systems as described by Keown [118]?

5.4. INTERACTION∗ 127
5.4 Interaction∗
What capabilities of the software visualisation medium are supported for a userto interact with the visualisation and control it? The user controls are basedon previous ideas [74, 75], while we add two new areas user navigation andShneiderman’s information visualisation user tasks [228] (§2.1).
5.4.1 User Controls∗
What methods does the software visualisation medium allow a user to employ tointeract or customise a visualisation? The ideas in this section are based on ideasfrom the previous evaluation model [74, 75] and Stasko et al. [194].
• Graphic Changeability: Can a user change the graphic representation ofgraphical marks at run-time?
• Input Events: What kind of input events can the visualisation mediumrecognise (mouse or keyboard)?
• Computation: How does the visualisation medium respond to input events?
• User Notation: Can a user draw or annotate their own notations using thevisualisation medium on screen?
• Elision Control∗: Can a user control the amount of information in a visualisa-tion by using controls to elide information?
• Temporal Control: Does the medium allow a user to control the temporalaspects of a visualisation such as the current position in time of a visualisationby using start, stop, pause, fast-forward, or rewind buttons?
5.4.2 User Navigation∗
We have added a new area for user navigation which looks at to what degree doesthe medium support navigation through a software visualisation and how can auser control the navigation options.
• Navigation types∗: What types of navigation does the medium support?
• Navigation control∗: How can a user control the navigation in a softwarevisualisation?
• View refinement∗: Does the medium support viewpoints and how can a usercontrol them in a software visualisation?
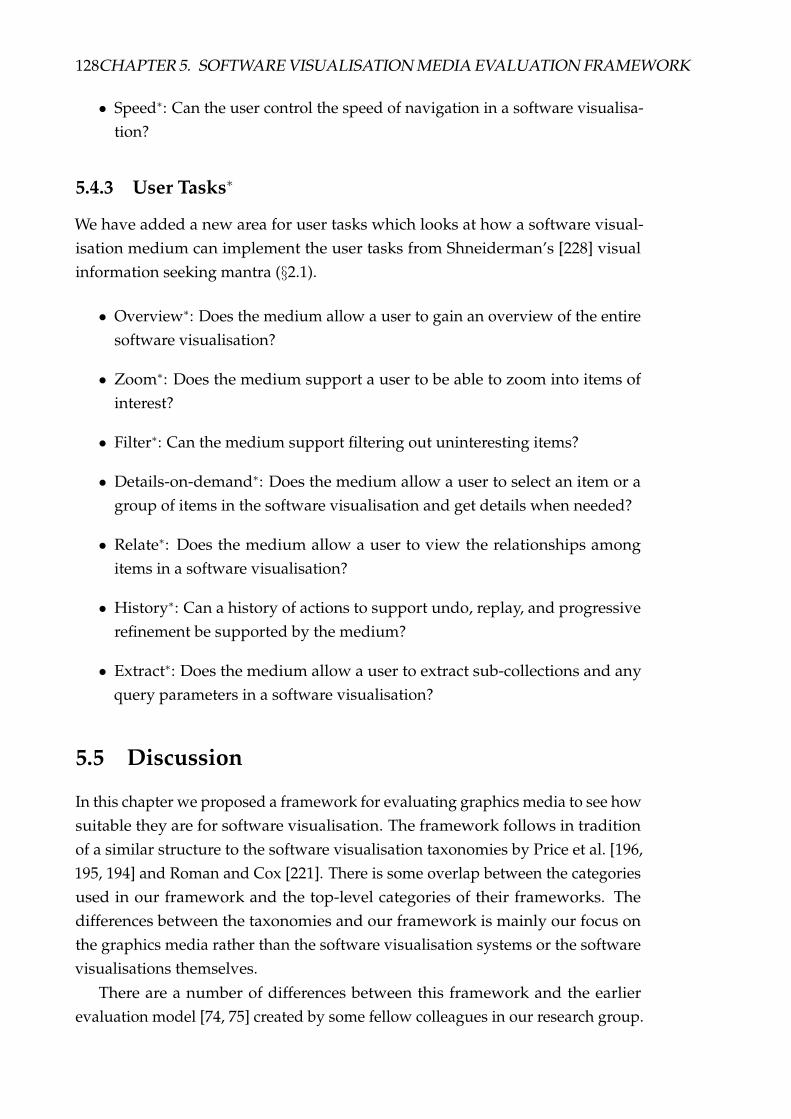
128CHAPTER 5. SOFTWARE VISUALISATION MEDIA EVALUATION FRAMEWORK
• Speed∗: Can the user control the speed of navigation in a software visualisa-tion?
5.4.3 User Tasks∗
We have added a new area for user tasks which looks at how a software visual-isation medium can implement the user tasks from Shneiderman’s [228] visualinformation seeking mantra (§2.1).
• Overview∗: Does the medium allow a user to gain an overview of the entiresoftware visualisation?
• Zoom∗: Does the medium support a user to be able to zoom into items ofinterest?
• Filter∗: Can the medium support filtering out uninteresting items?
• Details-on-demand∗: Does the medium allow a user to select an item or agroup of items in the software visualisation and get details when needed?
• Relate∗: Does the medium allow a user to view the relationships amongitems in a software visualisation?
• History∗: Can a history of actions to support undo, replay, and progressiverefinement be supported by the medium?
• Extract∗: Does the medium allow a user to extract sub-collections and anyquery parameters in a software visualisation?
5.5 Discussion
In this chapter we proposed a framework for evaluating graphics media to see howsuitable they are for software visualisation. The framework follows in traditionof a similar structure to the software visualisation taxonomies by Price et al. [196,195, 194] and Roman and Cox [221]. There is some overlap between the categoriesused in our framework and the top-level categories of their frameworks. Thedifferences between the taxonomies and our framework is mainly our focus onthe graphics media rather than the software visualisation systems or the softwarevisualisations themselves.
There are a number of differences between this framework and the earlierevaluation model [74, 75] created by some fellow colleagues in our research group.

5.5. DISCUSSION 129
We have grouped our ideas in the new framework into three main top-levelcategories rather than just information and software visualisation sections.
These categories are aimed at the scope of the software visualisation media(Scope §5.2), what are the characteristics of the output of the software visualisationmedia (Form §5.3), and what kind of user tasks the software visualisation mediacan support (Interaction §5.4). We have added in the following areas to the scopecategory: requirements, design, and method, and added in new elements to theperformance area. We have added in new points to the spatial substrate and marksand properties areas within the form category. We relabeled the presentationarea and added some new elements. We created a new visualisation techniquesarea in the form category. We comprehensively extended the previous interactioncategory by including two new areas user navigation and and user tasks.
This framework represents an iterative improvement over the earlier model forevaluating graphics technologies. We have used the experience gained at applyingthe first model to SVG [74, 75] in designing this new framework. We are not awareof any other work in the area of evaluating graphics technologies for informationvisualisation or software visualisation to date. Most evaluations of informationvisualisation work focuses on user tasks, the tools to build the visualisations, orthe actual visualisations themselves. We propose that our framework be contin-ually improved and refined as necessary. In the future we would like to see ourframework applied to other graphics technologies for software visualisation tofurther help validate our research methodology.
There are some limitations to our framework. Our framework does not lookat empirical studies, user evaluation, nor usability testing [171]. Conductingempirical studies, user evaluation, or usability testing are out of scope for thisthesis, as we are limiting ourselves to focus only on the graphics technology outputof a visualisation.
A recent survey [81] reviewed 65 papers describing new information visualisa-tion applications or techniques. 11 papers stated that a user evaluation was part offuture work, while 12 papers did some form of evaluation. Of the 12 papers onlytwo user studies were considered successful. A number of papers highlight someof the problems of evaluating information visualisations [8, 132, 190, 230, 251].From these papers it is not clear what the best way forward or which approachis best for software visualisation evaluation and it is something we would like toexplore in the future as a possible extension to our new framework.
We do not consider dealing with senses such as touch or smell as we are primar-ily concerned with the vision and sound senses. The aim of our work is targetedtoward standard computers a software developer would use on a daily basis. Sowe only consider 2D computer display technologies that represent 3D by means

130CHAPTER 5. SOFTWARE VISUALISATION MEDIA EVALUATION FRAMEWORK
of perspective and animation. Other technologies like augmented reality [99] andvirtual reality [214, 244, 259] could be integrated into the framework at a laterdate. Although we are evaluating a new technology we are not predicting wheresoftware visualisation is heading in the future. Instead, we are trying to replicatestandard software visualisation techniques from the literature with a new graphicstechnology.
Holmberg et al. [107] have created a framework for evaluating interactive web-based visualisation technologies and briefly compare SVG, DHTML, VRML, X3D,and Java3D. Their framework considers only generic web-based visualisations,while our framework can cater for any graphics technologies but is aimed atthe domain of software visualisation. Our framework is also not bound to anyparticular platform such as the web. All of their categories and most of theirmeasures are subsets of our framework.
The next chapter applies the evaluation framework presented in this chapterto the X3D software visualisation case studies (§4) and to our use of the X3Dspecification [265].
Chapter 6
Evaluation of X3D
Contents6.1 Scope . . . . . . . . . . . . . . . . . . . . . . . . . . . . . . . . . . . 132
6.1.1 Requirements . . . . . . . . . . . . . . . . . . . . . . . . . . 132
6.1.2 Design . . . . . . . . . . . . . . . . . . . . . . . . . . . . . . 133
6.1.3 Method . . . . . . . . . . . . . . . . . . . . . . . . . . . . . . 134
6.1.4 Performance . . . . . . . . . . . . . . . . . . . . . . . . . . . 137
6.2 Form . . . . . . . . . . . . . . . . . . . . . . . . . . . . . . . . . . . 138
6.2.1 Graphical Capability . . . . . . . . . . . . . . . . . . . . . . 138
6.2.2 Presentation . . . . . . . . . . . . . . . . . . . . . . . . . . . 141
6.2.3 Visualisation Techniques . . . . . . . . . . . . . . . . . . . . 143
6.3 Interaction . . . . . . . . . . . . . . . . . . . . . . . . . . . . . . . . 146
6.3.1 User Controls . . . . . . . . . . . . . . . . . . . . . . . . . . 146
6.3.2 User Navigation . . . . . . . . . . . . . . . . . . . . . . . . 148
6.3.3 User Tasks . . . . . . . . . . . . . . . . . . . . . . . . . . . . 151
6.4 Discussion . . . . . . . . . . . . . . . . . . . . . . . . . . . . . . . . 152
6.4.1 Advantages of X3D . . . . . . . . . . . . . . . . . . . . . . . 153
6.4.2 Disadvantages of X3D . . . . . . . . . . . . . . . . . . . . . 154
6.4.3 Potential Improvements for X3D . . . . . . . . . . . . . . . 156
131
132 CHAPTER 6. EVALUATION OF X3D
We now apply our software visualisation media evaluation framework (§5) toevaluate X3D for software visualisation based on our analysis (§3) and experiencewith X3D (§4). We apply the three categories of the framework: Scope, Form, andInteraction and then summarise our findings.
6.1 Scope
6.1.1 Requirements
We would like to evaluate X3D for use in software visualisation and in particularwith respect to our ongoing software visualisation project (§2.3). We want touse X3D software visualisations over the web and to be able to represent thevisualisations in 3D.
• Task: In this thesis we want to find out if X3D is a suitable medium forrepresenting software as visualisations. Our ultimate goal is to create visual-isations to understand software for the purposes of software reuse, mainte-nance, re-engineering, and reverse engineering (§2.3). The aim of visualisingexisting software components is to understand if and how a given piece ofcode can be reused in a new software program or modified to change thebehaviour [160].
• Audience: The target audience for our software visualisation media evalua-tion research will be developers who want to create software visualisationsand software visualisation tools. The users of our software visualisations aredevelopers that come from the areas of software reuse, software maintenance,re-engineering, and reverse engineering.
• Target: The data source for our software visualisations are XML executiontraces that can gather static or capture dynamic information about a softwarecomponent (§2.3.3). Tracing the execution of a component involves catch-ing information such as method calls, method returns, field accesses, fieldmodifications, object creations, and object deletions. This information canshow potential consequences and alternative executions that can be createdby overloading or replacing certain parts of a component.
• Representation: We would like to be able to implement an exemplary rangeof software visualisation techniques in X3D that can do most things a devel-oper would like to see about a software component. Some example softwarevisualisations that we have implemented include algorithm animations (§4.2),

6.1. SCOPE 133
UML diagrams (§4.3), documentation-related visualisations (§4.4), and exe-cution trace visualisations (§4.5) represented as 3D compound shapes and3D information visualisation metaphors.
• Medium: The aim of our visualisation architecture is to be able to create andview visualisations of remotely executing software over the web (§4.1). Forthe purposes of the architecture we would like to display software visualisa-tions in widely used web browsers such as Microsoft Internet Explorer andMozilla Firefox, and executing on a standard computer a software developerwould use on a daily basis. Colleagues of our research group have previouslylooked at 2D technologies for desktop (Tcl/TK) and web based applications(SVG) (§2.3.4).
6.1.2 Design
X3D has been designed as a lightweight file format for the web and has an XMLencoding. There are a number of X3D implementations that operate on a varietyof operating systems.
• Purpose: The aim of X3D is to provide a royalty-free open standards fileformat (§3.1) and run-time architecture to represent and communicate 3Dscenes and objects using XML (§3.2.2).
• Environment: The target environment of X3D is the web and the Internet(§3.1).
• Implementations: We looked at three of the main X3D browser implementa-tions which were either commercial (BS Contact VRML/X3D Player, FluxPlayer) or free-ware (Octaga Player) (§3.4.1). We also looked at the Xj3Dbrowser which is the open source implementation to experiment with theX3D specification. Finally, there are about 10 other implementations that existand some of them are either one person development teams, beta-versions,designed predominantly for VRML, or do not have plug-ins to widely usedbrowsers.
• Operating System: BS Contact VRML/X3D Player, Flux Player, OctagaPlayer, and Xj3D Browser all operate on Windows. Octaga, Xj3D, andFreeWRL operate on Linux (§3.4.1). FreeWRL is the only other browserwe looked at that operates on MacOSX.
• Hardware: X3D was designed to operate in web browsers on personalcomputers. Our testing was primarily conducted on a Dell Latitude D610
134 CHAPTER 6. EVALUATION OF X3D
laptop running Windows XP with a Intel Pentium 1.86GHz processor and512MB memory. Our aim is to test the media on computers that the averagedeveloper would use on a daily basis when developing software. We alsoused a Dell PowerEdge 1850 Windows server with two Pentium IV Xeon2.8GHz processors and 2GB of memory. When using the server for testingwe did not have any hardware acceleration. We would recommend using adesktop or laptop that has slightly more processing power and at least 1GBof memory as some of our more sophisticated visualisations struggled whendisplayed on our test laptop (§4.3 and 4.5.2).
• Learning: Drawing simple X3D scenes took about a week to accomplishand about a month to produce a reasonable X3D software visualisation byhand. We were finally very competent at using the X3D language after a fewmonths. The hardest part in the learning process for us was knowing how toapply 3D mathematics to create complex visualisations since that is not ourbackground, which is independent of learning X3D.
• Production Use: Our software visualisation prototype tools have only beenused in our research environment. We are yet to use the prototype toolswithin a teaching or an industrial setting. Our aim would be to make ourtools open source to allow other developers to make use of them. We areaware of one other academic research project using X3D for UML classdiagrams (§2.2.4 and Figure 2.11) and their tools are not publicly accessibleeither.
• Empirical Evaluation: Our X3D software visualisation prototype tools andvisualisations have had no empirical evaluation and we wish to considerthis as part of future work. We would like to do some evaluation on whether2D or 3D web based software visualisations is best (§2.1.1). Another areato explore is the cognitive issues [188] for representing software structuresin 3D. We are aware of no other empirical evaluations when using X3D forsoftware or information visualisation.
6.1.3 Method
X3D can be created by hand but for complex software visualisations it is best toautomate the creation process by using XML based languages like XSLT. Some ofthe X3D browsers can be plugged into commercial wide web browsers such asMozilla Firefox and Microsoft Internet Explorer.
• Creation: We found the best way to create basic X3D software visualisations

6.1. SCOPE 135
was to use text editors. Figure 6.1 shows editing the insertion sort algorithmanimation (§4.2.3) in a simple text editor. Creating complex software visu-alisations by hand, however, was incredibly arduous. Instead, we found itbest to use XSLT transformations and wrote the XSLT code in a text editor.We then processed the XSLT stylesheets with the execution traces using anXSLT processor either on the command line or from our web application,VARE-3D (§4.1).
We also experimented with two digital content creation tools X3D-Edit [40]and Flux Studio [180] for editing X3D content but they were more designedfor non-programmers (§3.4.2). The first version of X3D-Edit displays theXML in a graphical tree which required a lot of mouse manipulation by theuser, and was very computer resource hungry possibly due to it being builton top of IBM’s Xeena tool. The second version is a plug-in to the NetbeansIDE and incorporates the Xj3D viewer for previewing X3D content. There isno Eclipse plug-in yet. Flux Studio has a WYSIWYG (What You See Is WhatYou Get) style, designed for non-programmers, and it is hard to get at the rawX3D content. Flux Studio has an option of being able to quickly view an X3Dfile via a preview button which opens the file in the Flux Player. Since oursoftware visualisations are mainly constructed from XML execution tracesthere was no real need to use these kind of digital content creation tools.
Writing X3D by hand was best suited for writing components which couldbe used in applications, XSLT, or adjusting the output from the export ofanother tool.
• Viewing and Deployment: A widely used web browser such as Internet Ex-plorer or Mozilla Firefox can be used to view the X3D software visualisationswith an X3D browser plug-in (§3.4.1). Alternatively a user can use a stand-alone X3D web browser. X3D files can be located on the local file systemor on the web. The National Institute of Standards and Technology (NIST)have a web page1 that detects if any X3D and VRML plug-ins are installedin a user’s web browser. In general we found that when browsing to anexample X3D file on the web using Internet Explorer or Mozilla Firefox, if wedid not already have an X3D browser plug-in installed, that the commercialbrowsers did not understand the X3D file type and did not recommend anyX3D browsers to install.
• Integration: X3D has an XML encoding (§3.2.2) so it can quite easily inte-grate with other XML languages and XML tools such as XSLT. Figure 6.2
1http://cic.nist.gov/vrml/vbdetect.html
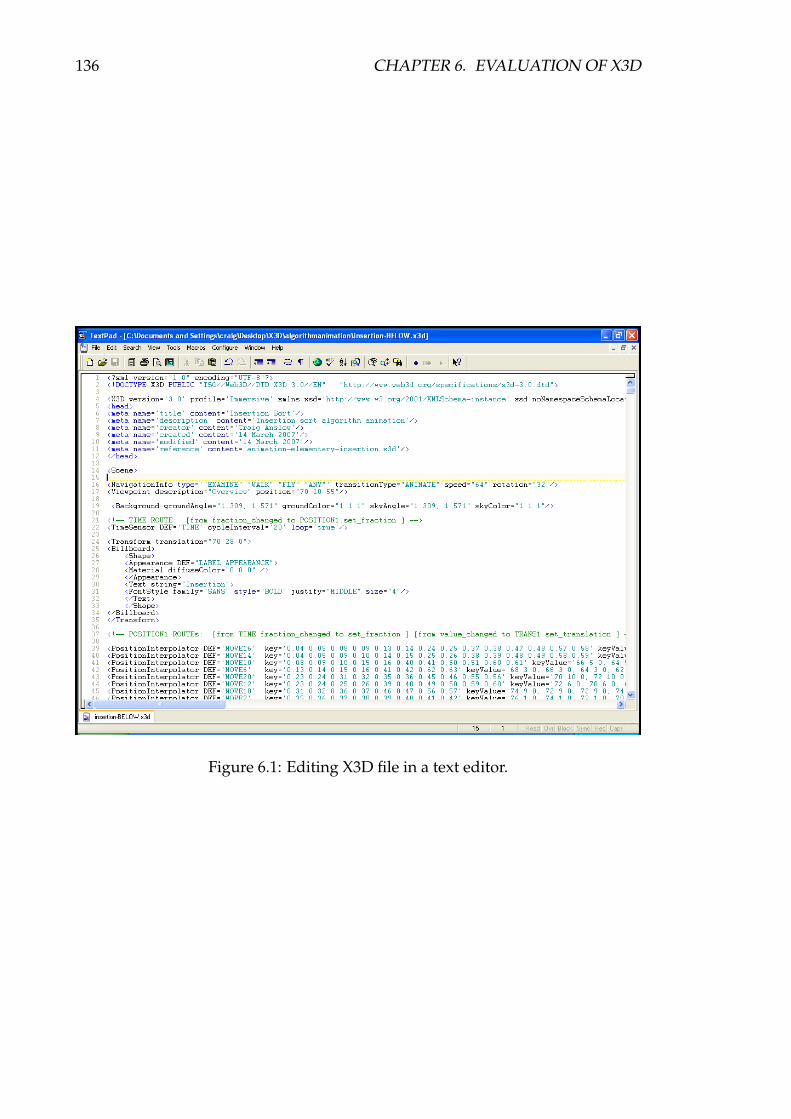
136 CHAPTER 6. EVALUATION OF X3D
Figure 6.1: Editing X3D file in a text editor.

6.1. SCOPE 137
shows creating an X3D file from an XSL stylesheet using the Apache XalanXSLT engine. X3D has specific language bindings for ECMAScript (imple-mented as JavaScript) and Java which allowed us to create complex softwarevisualisations (§4.1, 4.3 and 4.5).
Figure 6.2: Creating an X3D software visualisation from the command line usingthe Apache Xalan XSLT processor.
6.1.4 Performance
We use XML execution traces for our data sets. We can produce a large range ofsoftware visualisations implemented in X3D which can scale to a large number ofnodes and classes.
• Data Sets: Our input data was XML execution traces (§2.3.3). Convertingother text based formats into X3D is also possible, but domain specificapplications or converters would need to be created. X3D also allows otherformats to be converted or exported into X3D including: VRML, KeyholeMarkup Language (KML) (used in Google Earth), COLLADA (§2.3.5), andfrom proprietary applications like 3D Studio Max and Maya (§3.4.3).
• Types of Visualisations: We produced a range of visualisations includingalgorithm animations, UML diagrams, source-code related, and large node-link diagrams from execution traces (§4). A disappointing factor is that whenrendering the same visualisation some of the X3D browsers display a slightlydifferent output as they don’t implement all of the specification. As anexample we found only one browser (BS Contact) that actually implementsthe 2D geometry component of the specification. X3D was best at producingvisualisations represented as compound shapes to show either the structureor the behaviour of software (§4.5).
• Scalability: X3D can safely render 10,000 - 30,000 nodes within 10 seconds,but 100,000 nodes (Figure 4.32) took approximately 10 minutes to renderand the software visualisation was basically unusable in terms of navigationand discovery (§4.5.2). Perhaps this was due to the specific hardware and
138 CHAPTER 6. EVALUATION OF X3D
graphics card we were using or the X3D browser implementation. Moretesting is required on machines with a higher specification to give a moreconclusive result. X3D did not scale well when there was large amountsof text as the rendering speed was severely affected, again navigation anddiscovery were the issues (§4.3 and Figure 4.17).
• File Size: The size of our algorithm animations (§4.2) files were less than100KB. The size of our UML diagrams varied (§4.3). Our large UML classdiagram of Eclipse was 2MB and the other diagrams were less than 100KB.The size of our execution trace visualisations (§4.5) were 2MB (10,000 nodes),10MB (50,000 nodes), and 18MB (100,000 nodes). Our small execution tracestook less than a few seconds to convert into X3D software visualisationsusing XSLT. Our much larger execution traces took no longer than a couple ofminutes when executed by our tool (§4.1) or from the command line (Figure6.2). We also converted our execution trace visualisation files into the X3Dbinary format using the Xj3D converter (§3.4.3), which reduced the size ofthe files by about 75%. Currently only the Xj3D browser (§3.4.1) supportsthe binary encoding. The binary encoding has only just recently become anISO standard and we would expect other X3D browser implementations toadopt this encoding in the future.
6.2 Form
6.2.1 Graphical Capability
X3D performs very well for the graphical capabilities section. X3D has a vastrange of features to support the different facets of the graphical capabilities section.Where X3D does not have built-in support for a certain capability in this section,the capability can often be accomplished using scripting languages.
Spatial Substrate
• Dimension Support: X3D can support both 2D and 3D dimensions for dis-playing software visualisations. We are yet to explore if X3D can supportdimensions greater than 3D, but we have no need for greater than 3D at themoment in our software visualisations.
• Composition: Axes can be placed orthogonally to create a metric spacesimilar to Film Finder [45] and can make use of the third dimension.

6.2. FORM 139
• Alignment: Axes can be repeated at different positions in space. We used theinline node (§3.3.2), which embeds an X3D scene stored at a location on theweb or local file system into the current scene, for repeated axes to displaythree different algorithms all animating at once (§4.2.3).
• Folding: Information can be folded along the X, Y or Z axes since X3D hasthree dimensions, similar to the visualisations produced by SeeSoft [79] fortwo dimensions.
• Recursion: Space can be repeatedly divided like a Tree Map [227]. To im-plement a Tree Map would require using functions in scripting languagessince X3D is primarily a representation file format. There are no X3D built-infeatures for repeatedly subdividing space.
• Overloading: The same space can be reused for the same data set by usinga switch node (§3.3.2). The switch node can be used in conjunction with atouch sensor or a proximity sensor to show different aspects of an elementin the same space within a visualisation. For example we can change ourexecution trace visualisations (§4.5) to show the details of the event (e.g. thename of the method call or object that was created) once a user either touchesthe node or navigates within a certain proximity of the node.
• Axis Distortion: Axes can be distorted. Munzner et al. [166, 167] (see Figure2.4) showed how to visualise the structure of the web in 3D hyperbolic spaceusing VRML and C++. This can now be implemented using X3D and Java.
Graphical Marks and Properties
• Marks: X3D supports: points, lines, areas, and volumes. Points and lines canbe implemented in a software visualisation using 2D geometry, while areasand volumes can be implemented using 3D geometry (§3.3.1).
• Size: Shapes that are not defined by coordinates have size, height, or radiusfields (§3.3.1) which can be set during implementation or animated to changein a software visualisation using the routing event model (§3.3.5).
• Value: The material node supports the gray scale colour range which canadjust the value of a node (§3.3.1).
• Texture: Textures can be applied to nodes and links by either using colour,images, sounds, or video (§3.3.1). We have used all of these kinds of texturesin every one of our software visualisations (§4).

140 CHAPTER 6. EVALUATION OF X3D
• Colour: Colour can be used to reveal the state of an animation, highlightareas of interest, and emphasise visual patterns, as well as colouring of nodesand links. The colour of a node can be specified using the diffuseColor fieldinside the material node or specified as its own node (§3.3.1). Colours aredefined as RGB colours.
• Orientation: Shapes can be positioned and rotated in a visualisation by thetransform node (§3.3.2) and can change position or rotate by the routingevent model (§3.3.5). Shapes can be orientated in any order (e.g. translatedthen rotated and vice versa).
• Transparency: The transparency field in the material node specifies howclear an object is, with 1.0 being completely transparent, and 0.0 completelyopaque (§3.3.1). We used transparency in some of our execution trace visu-alisations (§4.5.3 and Figure 4.36). We found that when nesting transparentobjects the outer levels need to have a higher level of transparency otherwiseinner level objects will not be visible. So multiple levels of transparency areallowed.
• Connection: X3D can represent graph and tree like structures (§4.5.3). X3Dcan only show the graphical representation using geometry primitives. X3Dcan’t show the underlying data relationships very well since there is no sup-port for modeling relationship information. We can encode the relationshipdata in the X3D code but it is hard and time consuming. It is best to representrelationship information using domain specific prototypes (§3.3.6).
• Enclosure: Hierarchies can be encoded such as UML class diagrams or graphlike hierarchies, but again like the connection item above X3D can only showrepresentation. Actual data is hard to encode into the X3D code and it is bestdone with domain specific prototypes (§3.3.6).
• Text: X3D has support for displaying text using standard fonts and thevarious combinations and effects that can be applied, such as font faces,styling, and size. Since text is mainly 2D and read from left to right, wefound the billboard node (§3.3.3) to be very useful when the user rotatedthe Z axis of the viewer which allowed the text to rotate and be read clearly(§4.3.4). Unfortunately, the billboard node does not allow the text to belegible if the animation is turned upside down.
• Advanced Graphics: X3D has special profiles for Non-Uniform, RationalB-Spline (NURBS), representing humans (H-ANIM), and geography specific

6.2. FORM 141
detail (GeoSpatial). These kind of special profiles might be useful if we wereto implement a 3D city metaphor (§2.2.2).
There is no specific software visualisation component or profile. We haveimplemented some domain specific prototypes (§4.3 and 4.5) that could beturned into a software visualisation component in the X3D specification.Having a software visualisation or information visualisation componentin the X3D specification would allow X3D browser vendors to decide ifthey would like to support this component. If the X3D browser vendorsimplemented the visualisation component then this would make it mucheasier for developers to create information or software visualisations usingX3D as they would not have to create their own domain specific prototypes.
Temporal Encoding
• Encoding Time: Graphics can be changed to show the passage of time byusing the X3D routing event model (§3.3.5).
• Encoding Identity: Different properties of a mark can be used to encodeidentity. In our algorithm animations (§4.2) we have used colour and size todistinguish between elements, and shapes and colour to distinguish betweenevent types in our execution trace visualisations (§4.5).
• Variation of Retinal Encoding: Almost all graphical attributes of X3D nodescan be changed using the routing event mode (§3.3.5). In our algorithmanimations and software visualisations examples the target nodes that wechanged were 3D geometry (boxes, spheres), material (colour), and coordi-nate points (inside coordinate nodes).
6.2.2 Presentation
Data can be encoded in X3D software visualisations using three different ap-proaches. X3D does not support layout constraints of the data in a softwarevisualisation, but the data can be animated and supplemented with sound andvideo. X3D can represent software visualisations of various programming lan-guages and can even show program synchronisation and multiple views of thedata in a visualisation.
• Data Display Independence: Data can be encoded into a visualisation likewe have done for our algorithm animations (§4.2), but it would be betterto separate the data from the graphical presentation. Since X3D has anXML encoding it is possible to encode the data in XML and use XSLT to
142 CHAPTER 6. EVALUATION OF X3D
transform the data into X3D nodes before displaying the visualisation. Thetransformation could also happen at run-time by encoding a style-sheet intothe X3D file and using a scripting language function. For our executiontrace visualisations (§4.5) we encoded the data as X3D geometry and usedJavaScript functions for the layout and control of the data. For our UMLdiagrams (§4.3) we encoded the data we wanted to display into domainspecific prototype instances (§3.3.6) and then used an JavaScript function tochange the prototype instances into geometry primitives.
• Referencable Objects: Nodes can have a label using the DEF attribute, whichallows a node to be referenced by other elements in a visualisation by usingthe USE attribute (§3.3.1). The DEF attribute is only a textual description soit is important when implementing a visualisation that all nodes that use theDEF attribute are unique.
• Layout Constraints: Layout constraints and layout algorithms are not sup-ported in X3D. X3D is primarily a graphics representation file format, whichcould be used as the output for the implementation of a layout algorithmin a software visualisation. JavaScript functions can be embedded inside anX3D file to implement a lightweight layout algorithm or constraint system(§4.5.2 and Figure 4.29).
• Animation: Mouse sensors (drag or click) and interpolators (position, coor-dinates, colour) can be used to create motion or animation using the routingevent model. A time sensor can be used to control time cycle intervals thatcan be looped, paused, and restarted (§3.3.5).
• Other Modalities: Sound in X3D allows WAV, MIDI or MP3 files to be played(§3.3.4) and could be used to demonstrate break points, error detection, orsorting in an algorithm animation (§4.2.4). Video is provided through theMPEG-4 profile and we have used video to show people describing softwarealongside a software visualisation (§4.4.3 and Figure 4.23).
• Programming Languages: We can show visualisations of Java and C++programs (§4), but there should be no reason why X3D could not be usedto represent software visualisations of other programming languages andparadigms.
• Program Synchronisation: We have shown multiple simultaneous algorithmanimations (§4.2.3). In the algorithm animation examples the data itself wasencoded into the actual X3D software visualisations. We have not shown anymulti-threaded visualisations or multiple trace visualisations. Our execution

6.2. FORM 143
traces can capture multi-threaded information (§2.3.3). If we transformed amulti-threaded execution trace into a visualisation we could use differentcolours for the different traces and position the information in a differentposition in the scene. Likewise we could show multiple traces of the sameprogram in different colours. Both visualisations would have to be locatedat different places in the X3D scene.
• Multiple Views: We have accomplished multiple views by having multipleframes within the web interface and loading two different visualisationsof the same data source (§4.4). Alternatively multiple views could also beaccomplished within the same X3D software visualisation, but if one of theviews (e.g. source code, API documentation) is inherently designed for 2Dviewing then it maybe be best to show multiple web frames.
6.2.3 Visualisation Techniques
X3D can support a range of visualisation techniques from compound shapes tomore complex visualisation metaphors. There are unfortunately no domain spe-cific components or libraries developers can use to create software visualisations,but it is possible to implement existing software visualisation techniques.
• Compound shapes: We implemented 3D cubes and 3D spirals (§4.5.2). Other3D shapes are definitely possible. We used a JavaScript function to achieveour goals since X3D does not actually support this kind of metaphor, becauseit is primarily a presentation format. Figure 6.3 shows 50,000 elements fromthe Eclipse execution trace represented as a 3D cube.
• Information Visualisation Metaphors: We implemented an InformationLandscape [7, 247], and an Information Cube [213] (§4.5.3). We used someJavaScript function to layout the nodes and edges in the visualisations. Othermetaphors [45] are also possible but we have not explored them yet as weonly had time to implement a sample of information visualisation metaphors.
• Software Visualisation Techniques: X3D can support a range of visualisationsincluding algorithm animations (§4.2), UML diagrams (§4.3), documentation-related visualisations (§4.4), and execution trace visualisations (§4.5). Figure6.4 shows a UML package diagram of the Eclipse Java program which shows257 packages.
• Pictorial Representations: X3D can support all three types of pictorial repre-sentations [177]. We found X3D was excellent for graph-based displays but

144 CHAPTER 6. EVALUATION OF X3D
Figure 6.3: Eclipse execution trace — 50,000 events.
Figure 6.4: Eclipse UML package diagram — 257 packages

6.2. FORM 145
not so good for rendering text for source-code-related displays. We are yetto experiment with statistical based displays for software visualisation.
– Graph Based: The main elements of X3D are nodes and the links be-tween the nodes. Attributes can be added to nodes and links to encodeinformation such as shape, appearance, and behaviour. Edges can becreated between node objects (§4.5.3).
– Statistical Based: We are yet to implement any software visualisationsthat display statistical information. We could create statistics basedsoftware visualisations similar to that of some other work that showsthe citations of String Theory from 1981-2001 [89] and show over 3000nodes. We should note that many statistical graphs require complexlayouts and there is no high level support for these features in X3D.
– Source-Code-Related: X3D has an XML encoding and integrates easilywith HTML. We created a software visualisation which showed thevisualisation in one display and another display displaying source codein HTML (§4.4.1). Showing the actual source code in X3D can be done,but reading the source code when displayed in 3D is a hard task whenthe view rotates. We can also display the source code text in a dashboardso that it would be visible when the viewer rotates.
• Model Frameworks: We can implement all the software visualisation frame-works by Keown [118] in X3D, except the metric centric framework as wedo not focus on metrics. The hierarchy centric framework focuses on theclass hierarchy and uses the majority of available 3D properties to representproperties of the hierarchy. The inheritance centric framework allows a classto be viewed in the context of all classes which it is derived. The methodcentric framework shows a class representation together with representa-tions of its methods. The property centric framework is where a central classis visualised together with representations of the properties that composethe class. Finally, the single class centric framework visualises a single class,from the system showing as much detail as required.

146 CHAPTER 6. EVALUATION OF X3D
6.3 Interaction
6.3.1 User Controls
X3D supports basic user controls, but for more sophisticated software visualisationcontrols scripting is required.
• Graphic Changeability: Graphical elements such as position, coordinates,colour, size, scale, transparency, textures, and visibility can change at run-time via the X3D routing event model with user mouse or keyboard controls(§3.3.5).
• Input Events: Users can interact with a software visualisation by keyboardor mouse input (§3.3.5). Navigation is controlled by mouse input but it ispossible to use game like keyboard controls, ADWS keys for left, right, up,and down. Mouse interaction is usually mouse selecting, mouse overs, ordragging nodes. Users can also type messages to control objects in a sceneas well.
• Computation: X3D detects input events by touch, drag, key, and time sensors(§3.3.5). Graphics can then be changed by interpolators which determinewhat colour, position, orientation, or coordinates of a node changes and atwhat time during the visualisation defined by frames. A time sensor is usedto link the input events and the interpolators. Multiple ROUTE directives areused to link all the different parts of the computation. One thing to note isthat nodes don’t have to be controlled by user input, they can be controlledby just a time sensor, which is what we have implemented for some of ouralgorithm animations.
• Elision Control: X3D supports eliding information or suppressing detailfrom the display by controlling the rendering technique to view vertices,wire-frame, flat, or smooth nodes. Figure 6.5 shows the information cubevisualisation from Figure 4.36 with the graphics rendered as a wireframe.The lighting component allows objects in the world to be illuminated invarious ways (§3.3.4). Some browsers have implemented a headlight controlthat allows a user to make all objects in a world be their defined colour whenthe headlight is turned on and black when the headlight is turned off. Wediscuss more elision type techniques for filtering, in Section 6.3.3.
• Temporal Control: X3D supports start and stop buttons. More complexbuttons such as pause, fast-forward, rewind, step, and speed control requireuse of scripting. Some of these buttons were implemented in our algorithm

6.3. INTERACTION 147
Figure 6.5: Information Cube — wireframe rendering.

148 CHAPTER 6. EVALUATION OF X3D
animations (§4.2 and Figure 6.6). We also had to control the timer by a scriptas once a button was selected by a user the timer kept on going withinthe visualisation. When a user presses the stop button the objects stoppedanimating, but the timer kept on going. When a user then pressed the startbutton the objects would then restart in a different position from where theyhad originally stopped. In order to solve this problem we had to scale thetimer using a script function so that objects did stop, pause, and start as auser would expect when using buttons of this nature.
Figure 6.6: Algorithm animation user controls.
• User Notation: We haven’t created any user notation visualisations, tools,or controls to create software notations in X3D online. User notation hasnot been the focus of our work as we are interested in encoding informationwe already have from our XML execution traces (§2.3.3) into a softwarevisualisation. We would like to explore user notations implemented in X3Din the future and that it would require heavy use of scripting languages andJava.
6.3.2 User Navigation
X3D has very good support for user navigation and can support a range of tech-niques.
• Navigation Types: X3D supports a range of 3D navigation techniques (§3.3.3)for a user to navigate in a scene. We found that not all of the browsersimplemented all of the navigation techniques, and some have differentnames for the same navigation technique.
• Navigation Control: A user can change the navigation type at run-time byeither right clicking in a browser, see Figure 6.7, or using one of the buttonsin the tool bar of a stand-alone X3D browser (§3.4.1). The Flux X3D browserplug-in actually makes their navigation control buttons visible inside widelyused browsers. The navigation info node (§3.3.3) allows a developer to set
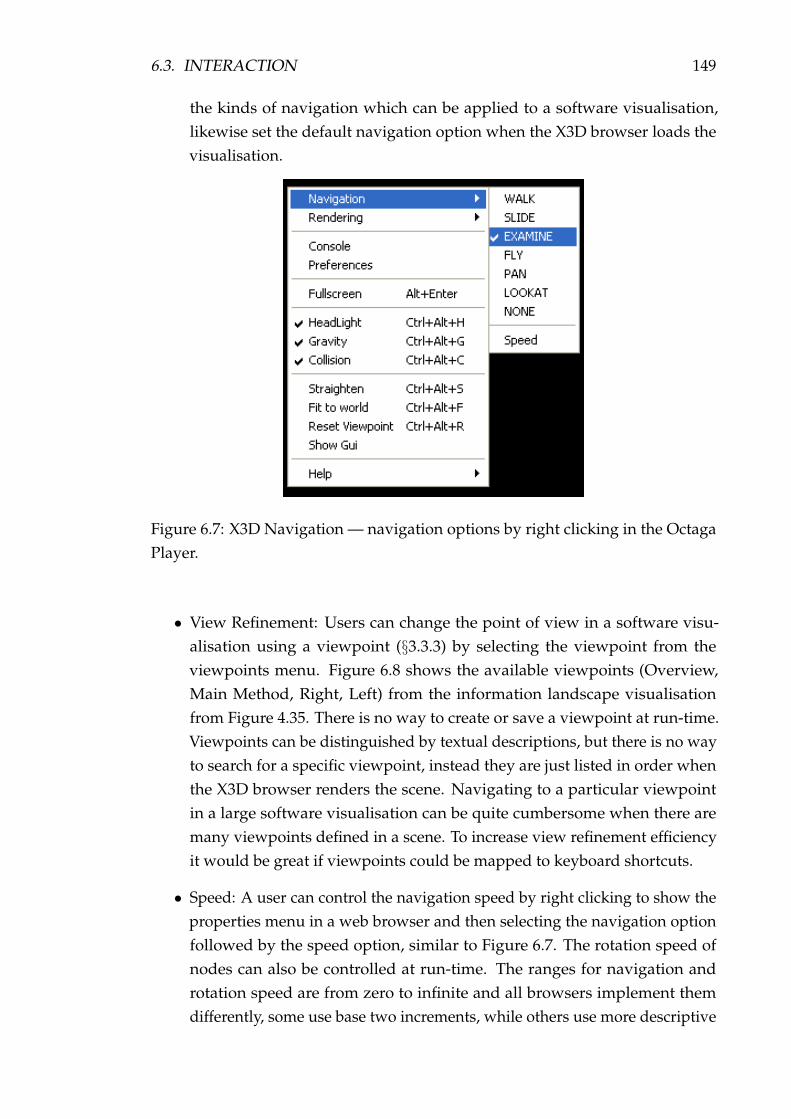
6.3. INTERACTION 149
the kinds of navigation which can be applied to a software visualisation,likewise set the default navigation option when the X3D browser loads thevisualisation.
Figure 6.7: X3D Navigation — navigation options by right clicking in the OctagaPlayer.
• View Refinement: Users can change the point of view in a software visu-alisation using a viewpoint (§3.3.3) by selecting the viewpoint from theviewpoints menu. Figure 6.8 shows the available viewpoints (Overview,Main Method, Right, Left) from the information landscape visualisationfrom Figure 4.35. There is no way to create or save a viewpoint at run-time.Viewpoints can be distinguished by textual descriptions, but there is no wayto search for a specific viewpoint, instead they are just listed in order whenthe X3D browser renders the scene. Navigating to a particular viewpointin a large software visualisation can be quite cumbersome when there aremany viewpoints defined in a scene. To increase view refinement efficiencyit would be great if viewpoints could be mapped to keyboard shortcuts.
• Speed: A user can control the navigation speed by right clicking to show theproperties menu in a web browser and then selecting the navigation optionfollowed by the speed option, similar to Figure 6.7. The rotation speed ofnodes can also be controlled at run-time. The ranges for navigation androtation speed are from zero to infinite and all browsers implement themdifferently, some use base two increments, while others use more descriptive
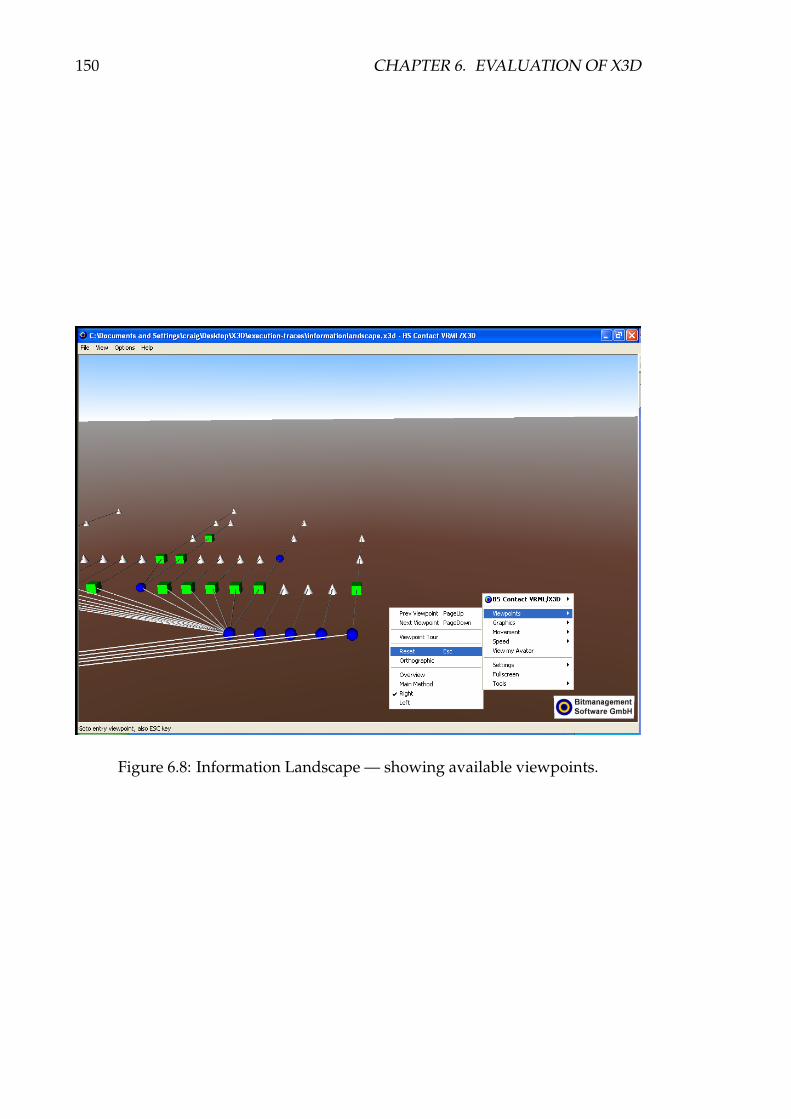
150 CHAPTER 6. EVALUATION OF X3D
Figure 6.8: Information Landscape — showing available viewpoints.

6.3. INTERACTION 151
tags such as slow, fast, fastest, or very fast. The navigation and rotationspeed can also be initially set in the navigation info node (§3.3.3).
6.3.3 User Tasks
X3D supports providing an overview and zooming. X3D has features for filteringand showing details on demand, but both require combining various X3D nodesto produce a good visual effect. Relationships, a history of actions, and extractionof data are not supported, but are possible through the X3D browser run-time API.
• Overview: A user can gain an overview of the entire software visualisation,only if a specific viewpoint is defined which a user can select and that theviewpoint encompasses the whole data set (§3.3.3). Alternatively a user canzoom out to get an overview as well. When creating a software visualisationit is best to make the default viewpoint to be an overview of the completevisualisation.
• Zoom: A user can zoom into items of interest using the built-in X3D browsernavigation controls, or by selecting a pre-defined viewpoint which is locatedat a zoomed in location of a particular item (§6.3.2). The look-at navigationtype allows a user to select a node, then the viewer will zoom immediatelyto some convenient viewing distance from the selected node (§3.3.3).
• Filter: The boolean filter node exists for selective routing of true or falsevalues and negation. For this node to be useful for a software visualisation itneeds to be used with a script to determine what nodes require filtering out.Some of the browser built-in functions, rendering techniques, and lightingare discussed earlier in elision control (§6.3.1). We also found a number ofways to apply filtering to an X3D scene. Transparency can be used to filterout certain nodes, likewise scaling or changing the size of nodes, once auser clicks or moves a user control (§3.3.1). Geometry can also be movedto different parts of a software visualisation which a user can’t see in thecurrent view to give a filtering effect. Alternatively a visibility limit can beset which does not render nodes once they are beyond a specific position ina software visualisation (§3.3.4).
• Details-on-demand: When a user navigates to a certain distance from a nodeor selects a viewpoint the browser can change the physical appearance of anode using the level of detail or switch nodes (§3.3.2). We can show details-on-demand in our execution trace visualisations using these approaches(§4.5). Another approach is to have user controls where a user selects or
152 CHAPTER 6. EVALUATION OF X3D
moves a control and certain properties are shown about a node somewhereelse in the software visualisation or next to the node that requires details.We have done this second approach for our documentation-related softwarevisualisations (§4.4) which uses frames to show the source code, API, or amovie about a particular software component.
• Relate: Viewing the relationships among items could mean many things anddepending on what the relationships were they could all be implementedin different ways. An example from an execution trace visualisation couldbe ”show all the classes that inherit from an abstract class or show all theobjects that call another object”. This could be implemented by modifyingthe colour or size of nodes or edges, but there maybe a need to have textinput. Since X3D is primarily a presentation format there is no method toencode the relationship information about classes or objects in the softwarevisualisations, except if node prototypes (§3.3.6) were used.
• History: There is no built-in support for creating a history of user actions.This can be achieved by exploring the SAI run-time API of an X3D browser(§3.4.1) and capturing the events a user performs and then providing optionsfor a user to go back and repeat those actions. Unfortunately not all X3Dbrowser implementations make the SAI available for X3D content developersto use. There is also no support for creating a bookmark or saving a specificviewpoint once a user finds an interesting view in a software visualisation,but this is possible using the SAI.
• Extract: X3D is predominantly a presentation format and does not providefeatures for extracting sub-collections or query parameters of a visualisation.Extracting information might be able to be accomplished using a much largerJava application and looking at the run-time information or the SAI of thebrowser (§3.4.1).
6.4 Discussion
To summarise the previous evaluation sections of the framework we have capturedthe main points and present them as tables for each of the three categories inAppendix A. We now discuss the advantages and disadvantages of using X3D forsoftware visualisation, and then potential improvements.

6.4. DISCUSSION 153
6.4.1 Advantages of X3D
X3D has a number of features which make it a good medium to use in softwarevisualisation. The advantages are as follows:
Graphics X3D has a number of different graphical elements including 2D geometry,3D geometry, text, textures, lighting, geometry, NURBs, and environmenteffects which provide an excellent set of features to get high quality visualpictures required in software visualisations (§3.3).
Extensibility X3D is designed as a set of components, which are groups of functionalitysuch as geometry or interaction features (§3.2.3). The specification has beendesigned so that it can be extended in the future by adding in new compo-nents when necessary and not affecting already designed components suchas NURBs or representing humans with such schemes as H-Anim. Nodeprototyping can be used to extend X3D features without relying on compo-nents to be created or added to the specification (§3.3.6). Developers specifyprototypes and then use instances of them which are then mapped to existinggeometry primitives or X3D features. Profiles are built from componentsand are a standardised sets of extensions to meet specific application needssuch as immersive virtual reality (§3.2.3).
XML Integration X3D has an XML encoding (§3.2.2) which means it can take advantage ofa wide variety of tools such as XSLT and Java XML libraries to create andmanipulate X3D content. X3D has an accepted DTD and XML Schema.X3D can be embedded in HTML documents. Since XML is very ubiquitousand distributed as ASCII text, learning the syntax and structure of X3Ddocuments is relatively straight forward.
Multimedia Sound (§3.3.4) and video (§3.3.1) can be quite easily included in X3D docu-ments by mapping sound and movie textures to geometry. Using sound andvideo can enhance a software visualisation by providing further information.We used sound to signify ordering of elements in algorithm animations (§4.2)and video for providing information about classes in UML diagrams (§4.4.3).
Deployment X3D is a text file format that can be deployed easily over the web so it makesit accessible to anyone with an Internet connection. Users don’t have toinstall large libraries or implement their own viewer in order to view X3Dcontent. Instead one can just install an X3D browser on their computer orplug-in a number of existing X3D browsers to their web browser (§3.4.1).
Portability Since X3D is a file format it can be rendered in either OpenGL or DirectXso X3D is not reliant on any particular underlying API platform. There

154 CHAPTER 6. EVALUATION OF X3D
are a number of X3D browser implementations that work on the followingdifferent operating systems Windows, Linux, and MacOS X (§3.4.1). Themajority of the X3D browsers are mainly designed for Windows.
Licensing X3D is a royalty free open standard, so it is available for public use (§3.2).
6.4.2 Disadvantages of X3D
X3D does have some disadvantages which make it hard to use for software visual-isation. The most important of these disadvantages are as follows:
User Controls No user controls for software visualisation are included. Geometry can beused to create very basic user controls (§3.3.5). More complicated software vi-sualisation controls such as filtering, or algorithm animation controls requireheavy use of scripting languages (§4.2.4).
Animation X3D relies too heavily on the routing event model (§3.3.5) for animation anduser interactions in X3D software visualisations. The design of the routingevent model is very cumbersome when there are lots of objects that requireanimation or manipulation in a visualisation (§4.2.4, 4.3.4, 4.5.4).
Creation Creating large software visualisations by hand is very time consuming. SinceX3D is predominantly a file format for representing graphics it is better to useother tools and languages like Java and XSLT to create larger X3D softwarevisualisations (§4.1, 4.3, 4.5).
Filtering X3D lacks filtering, search, and query capabilities. Since X3D is declarativein nature we found no specific nodes to delete or hide unwanted objects in asoftware visualisation. Instead we had to hide objects inside other objects,change the scale or size of an object, or use transparency effects (§4.2). Wecould have also used the switch node (§3.3.2) to achieve the same hiddeneffect. Nodes can be labeled with a descriptive text name using the non-unique DEF keyword, however, this is the only feature supported for scriptfunctions to search or query for types of objects (§3.3.1).
Layout Positioning objects in X3D requires using the transform node which has fieldsfor translating an object in the X-Y-Z axes and rotation about an arbitrarypoint and axis (§3.3.2). With our UML diagrams (§4.3) and execution tracevisualisations (§4.5) we have nodes positioned in graph like structures thathave node-link relationships. X3D does not support the layout or adjustingof connected nodes very well. When a user attempts to move a node around
6.4. DISCUSSION 155
a screen or implement more complex layout algorithms such as spring em-bedder [250], there are no X3D features to preserve the node-link relationshipbetween pairs of nodes. This is due to the XML encoding being declarativeand not allowing nodes to have nested grouping relationships overlap. Inorder to preserve the node-link relationships, Java or scripting languageshave to be used, and involves substantial programming.
Conformance No tools or processes exist to determine if an X3D application or softwarevisualisation conforms to an X3D implementation, similar to validatingHTML web pages with the W3C HTML Validation Service2. One could,however, validate X3D content against the X3D XML schema or DTD, butthat would require downloading the X3D content and X3D schema to a usersmachine then opening a separate XML application to validate the file. Weare more concerned that no specific tools or web based services exist for thisprocess. There exists an X3D conformance testing program (§3.5.1) but it onlyintends to promote consistent and reliable tool implementations of the X3Dspecification by many vendors across multiple platforms. There has been noempirical or user evaluation studies on the ease of use of programming inX3D, nor for any systems or visualisations built using X3D.
Installation To view X3D software visualisations in widely used web browsers such asMicrosoft Internet Explorer or Mozilla Firefox an X3D plug-in is required(§3.4.1). We found that neither Microsoft Internet Explorer nor MozillaFirefox detected what kind of plug-in was required when browsing to anX3D software visualisation if no X3D browser plug-in was already installed.Only some of the X3D browser implementations can be plugged into widelyused web browsers. The downloads for the X3D browser plug-ins rangedfrom 1.5MB to 6MB.
Tool Support We found that some of the X3D browsers did not implement all of the X3Dspecification nor do they make the SAI run-time API available. This makes ithard for developers to create X3D software visualisations that are consistentfor all X3D browsers (§4.2, 4.3). The size of most of the development teamsof the X3D browsers range from one person to teams smaller than 10 people.The problem with the development of the X3D browsers and tools is thatthey simply do not have the people to develop tools to meet all user require-ments of functionality. Since 3D graphics is by nature a specialised field,the existence of more markets for X3D on the web may prompt more tool
2http://validator.w3.org

156 CHAPTER 6. EVALUATION OF X3D
development and hence attract more people to using X3D for 3D graphicson the web.
6.4.3 Potential Improvements for X3D
There are a number of potential improvements that are desirable if X3D is to beused in software visualisation.
A significant improvement in X3D would be to have a component dedicated fordomain specific software visualisation features (§4.1.3, 6.2.1). Determining whatthose features are would be the first step. Some work has been done in our casestudies using node prototyping for UML diagrams (§4.3) and the implementationof 3D compound shapes from XML execution traces (§4.5).
There are a number of upcoming community improvements to the X3D speci-fication that look like quite promising features for software visualisation. Theseinclude the layering, layout, followers, texturing 3D, and picking sensor compo-nents. The layering component will allow organising information in a visualisationinto independent, overlapping layers. The layout component will allow content tobe arranged to appear in specific regions of the display surface. The layering andlayout component may help solve some of the current X3D layout issues (§6.4.2).The followers component will allow smooth animations of objects, which maysolve the pausing issue in our algorithm animations for us to create continuoussmooth animations (§4.2.4). 3D textures will be able to be applied to geometryas well environmental shading texturing, which may be useful to show differentaspects of a software visualisation. Finally, picking sensors will allow users toselect specific items in a software visualisation.
A vital step would be to minimise the installation overhead as much as possible.In order to overcome this overheard, widely used web browsers such as MicrosoftInternet Explorer and Mozilla Firefox should implement the X3D specification intotheir browsers rather than relying on end users to install a plug-in or stand-aloneX3D browser. Implementing X3D in the the widely used web browsers will alsofacilitate integration of X3D into web software and services.
After minimising the installation overheard the next step would be to provideconsistency across the main X3D browsers and plug-ins. Even though some X3Dbrowsers only aim to implement certain aspects of the specification it is importantthat the main X3D browsers are consistent so that there is a similar user experience.
The next chapter presents our conclusions, contributions, and future work.

Chapter 7
Conclusions
In this chapter we offer our conclusions. We summarise the contents of eachchapter, outline our contributions, and look at potential work for the future.
In Chapter 2 we gave an introduction to information visualisation, lookedat various ways to display information using different visualisation techniques,described what software visualisation is, followed by a close look at existing 3Dsoftware visualisation systems. Finally, we gave an overview of our ongoingsoftware visualisation architecture project and described our motivation for thisthesis.
In Chapter 3 we gave a brief overview of X3D, described the contents of thespecification, commented on a number of X3D browsers and tools, discussed workin progress to improve the X3D specification, and finally gave our assessment ofthe suitability of X3D for web based software visualisation.
In Chapter 4 we outlined the contribution of a transformer component fromour visualisation architecture project to produce X3D software visualisations fromXML execution traces. We then presented a representative sample of softwarevisualisation techniques which are common throughout the software visualisa-tion literature. The case studies included algorithm animations, UML diagrams,documentation-related visualisations, and software visualisations from XML exe-cution traces.
In Chapter 5 we presented a framework for evaluating software visualisationmedia. The key contribution of this chapter was a major extension to a previousmodel created by colleagues in our research group, by adding in new components,addressing the needs of 3D, and offering a better grouping of key ideas.
In Chapter 6 we applied the software visualisation media evaluation frame-work (§5) to evaluate X3D for software visualisation based on our analysis (§3)and experience with X3D (§4). The results of the evaluation showed X3D to bea useful medium for implementing a large range of 3D software visualisation
157

158 CHAPTER 7. CONCLUSIONS
techniques. Finally, we discussed the advantages and disadvantages for X3D insoftware visualisation.
The goal of this thesis was to evaluate X3D for use in software visualisation.Our detailed evaluation was presented in Chapter 6. The major advantages of X3Dare rich graphics, extensibility, and XML integration. The major disadvantages ofX3D are lack of software visualisation user controls, a primitive animation model,and weak support for filtering and layout. Nonetheless we encourage softwarevisualisation developers to adopt X3D if they need 3D for the web.
7.1 Contributions
The contributions of this thesis are as follows:
• X3D Software Visualisation Case Studies (§4) - we have replicated anddiscussed the implementation of a representative range of software visualisa-tions in X3D including algorithm animations, UML diagrams, documentation-related visualisations, and execution trace visualisations.
• VARE-3D (§4.1) - we have produced a prototype tool which can produceX3D software visualisations from XML execution traces over the web.
• Software Visualisation Media Evaluation Framework (§5) - we have createa framework for evaluating software visualisation media or graphics tech-nologies for use in software visualisation based on a previous evaluationmodel.
• Evaluation of X3D For Use in Software Visualisation (§6) - we have appliedour software visualisation media evaluation framework to evaluate howgood X3D is for software visualisation.
7.2 Future Work
This thesis suggests a number of areas for future work.
Layout information: An area that was exposed during our case studies for pro-ducing visualisations from execution traces (§4.5) is that X3D lacks support forthe layout of information about a program. Exploring the use of graph layoutlanguages such as the Graph eXchange Language (GXL) [269] with our X3D soft-ware visualisations would be worthwhile to see if the layout features could beimproved. GXL is an XML graph exchange format for representing relationships
7.2. FUTURE WORK 159
between nodes and edges. Ideally we would see GXL being an intermediary stepbetween the transformation of our execution traces into X3D software visualisa-tions. Another approach is to create a grammar for representing objects in 3Dsoftware visualisation diagrams, similar to the grammar of node-link diagramsproduced by Ware [258].
Data independence: The data for our algorithm animations (§4.2) was encodedinside the X3D code and the visualisations do not allow a user to change the dataor select the algorithm they want to animate. Making the data independent ofthe presentation of the visualisation (§6.2.2) will allow us to create an interactivesystem where upon users can select the kind of algorithm animation they wantto display and input the data set to use. Another possible avenue for data inputwould be to extract the most appropriate information from our execution traces(§2.3.3). Adding information about the algorithm such as how it works andperformance, as well as stepping through pseudo code as the algorithm animateswould be useful features.
Application of evaluation framework to other media: The software visualisa-tion media evaluation framework (§5) could be expanded by going into moremore detail for other modalities such as sound, video, haptics, or virtual reality.Applying the framework to other media such as Flash, Tcl/Tk, Java3D, COLLADA,other 3D languages (§2.3.5), and augmented reality could increase the usefulnessof the evaluation conducted for X3D and the previous evaluation model [74, 75].
VARE integration There are not many available free software visualisation sys-tems. Most of our previous tools (§2.3.4) have been implementations of differentaspects of our VARE architecture project (§2.3). A good next step would be tointegrate some of our test driving, repository, and visualisation tools together withVARE-3D. Integrating these tools would create an end to end complete visualisa-tion system for users and would test the validity of VARE. Eventually we couldmake the complete system publicly available as a web application.

160 CHAPTER 7. CONCLUSIONS

Appendix A
Evaluation of X3D Summary
The following tables Scope (Table A.1), Form (Tables A.2 and A.3), and Interaction(Table A.4) summarise our evaluation for each of the three categories in Chapter 6.
161

162 APPENDIX A. EVALUATION OF X3D SUMMARY
RequirementsTask understand software for reuse, maintenance,
re-engineering, and reverse engineeringAudience software visualisations for developers in the areas of
reuse, maintenance, re-engineering and reverse engineeringTarget static and dynamic information from software
XML execution tracesRepresentation 3D software visualisationsMedium over the webDesignPurpose 3D graphics open standard for the web that has an
XML encodingEnvironment over the webImplementations four main implementations, about 10 secondary onesOperating System mainly Windows, but some Linux and MacOSXHardware recommend x86 architecture, dedicated video card
greater than 1GB of RAMLearning basic visualisations a few weeks, very competent
after a few monthsProduction Use noneEmpirical Evaluation noneMethodCreation by hand, XSLT, X3D editor, Java applicationViewing and Deployment commercial web browser over the web with X3D plug-in
or stand-alone X3D browserIntegration XML oriented, JavaScript, JavaPerformanceData Sets XML execution tracesTypes of algorithm animation, 3D shapes, 3D informationVisualisations visualisation metaphors, UML diagrams,
documentation-related visualisationsScalability 10K - 30K nodes comfortable and not so good for
large amounts of textFile Size less than 100KB for small files and 10-18MB for
large files
Table A.1: Evaluating X3D — Scope.

163
Graphical CapabilitySpatial SubstrateDimensions 2D and 3DComposition axes can be placed orthogonally to create a metricAlignment axes can be repeated at different positions in spaceFolding along X, Y, or Z axisRecursion requires scriptingOverloading switch nodeAxis Distortion requires scriptingMarks andPropertiesMarks 2D and 3D geometrySize size, height, or radius fieldsValue supports gray scaleTexture images (.png, .gif, and .jpg), sound (.wav, .mp3),
and video (.mpg)Colour colour node or fields of the material nodeOrientation transform node, translation, and rotation attributesTransparency material node field. 1.0 transparent, 0.0 opaqueConnection can represent graph tree like structuresEnclosure can represent hierarchiesText standard fonts and effectsAdvanced Graphics NURBS, H-Anim, GeoSpatial, no software visualisation
componentTemporalEncodingEncoding Time routing event modelEncoding Identity colour, size, shape, and positionVariation of Retinal geometry, material, and coordinate pointsEncoding using routing event model
Table A.2: Evaluating X3D — Form (Part A).

164 APPENDIX A. EVALUATION OF X3D SUMMARY
PresentationData Display independence data can be encoded in X3D visualisations, but is
time consuming to create and causes redundant code,better to separate the data from presentation
Referencable Objects text based DEF and USE fieldsLayout Constraints neither layout constraints or algorithms are supportedAnimation routing event modelOther Modalities sound (.wav, .mp3) and video (.mpg)Programming Languages Java and C++Program Synchronisation algorithm animation, haven’t done any
execution tracesMultiple Views HTML web frames or within the X3D visualisationVisualisation TechniquesCompound Shapes 3D cubes, 3D spiralsIV Metaphors Information Landscape, Information CubeSV Techniques Algorithm animations, UML Diagrams, documentation-related
and execution trace visualisationsPictorial Representations mainly graph based displaysModel Frameworks all except metrics centric
Table A.3: Evaluating X3D — Form (Part B).

165
User ControlsGraphic Changeability routing event model and users controlsInput Events mouse and keyboardComputation detects input events by touch, keyboard, and drag
sensors and initiates a timer, linked by ROUTE directivesElision Control rendering technique, lighting, transparency
changing geometry propertiesTemporal Control start, stop exist. Pause, fast-forward, rewind, step,
and change of speed require scriptingUser Notation not supportedUser NavigationNavigation Types any, walk, examine, fly, look-at, none, slide, and panNavigation Control right click or X3D browser tool bar optionView Refinement descriptive viewpointsSpeed navigation and rotation speed by X3D browser optionUser TasksOverview user navigation or specific overview viewpointZoom user navigation and look-at navigation typeFilter Boolean filter field, user controls but requires heavy
use of scriptingDetails-on-demand level of detail (LOD) or switch nodes, user selectionRelate not supported, requires scripting and node prototypingHistory not supported, requires scripting and using the SAIExtract not supported, requires scripting and using the SAI
Table A.4: Evaluating X3D — Interaction.

166 APPENDIX A. EVALUATION OF X3D SUMMARY

Bibliography
[1] ALFERT, K., AND ENGELEN, F. Three-dimensional visualization of java classrelations. In Proceedings of the World Conference on Integrated Design & ProcessTechnology (IDPT) (2000).
[2] ALFERT, K., AND ENGELEN, F. Experiences in 3-Dimensional visualizationof java class relations. Journal of Design & Process Science 5, 3 (2001), 91–106.
[3] ALFERT, K., AND FRONK, A. Manipulation of three-dimensional visualiza-tion of java class relations. In Proceedings of the World Conference on IntegratedDesign & Process Technology (IDPT) (2002).
[4] AMAR, R., EAGAN, J., AND STASKO, J. Low-level components of analyticactivity in information visualization. In Proceedings of the IEEE Symposiumon Information Visualization (INFOVIS) (2005), IEEE Computer Society Press,pp. 111–117.
[5] AMAR, R., AND STASKO, J. A knowledge task-based framework for designand evaluation of information visualizations. In Proceedings of the IEEESymposium on Information Visualization (INFOVIS) (2004), IEEE ComputerSociety Press, pp. 143–150.
[6] AMES, A., NADEAU, D., AND MORELAND, J. VRML Sourcebook. John Wiley& Sons, 1996.
[7] ANDREWS, K. Visualising cyberspace: information visualisation in the har-mony internet browser. In Proceedings of the IEEE Symposium on InformationVisualization (INFOVIS) (1995), IEEE Computer Society Press, pp. 97–104.
[8] ANDREWS, K. Evaluating information visualisations. In Proceedings ofthe AVI Workshop on BEyond time and errors: novel evaLuation methods forInformation Visualization (BELIV) (2006), ACM Press, pp. 1–5.
[9] ANSLOW, C. XML database support for program trace visualisation. Hon-ours Report, Victoria University of Wellington, March 2003.
167

168 BIBLIOGRAPHY
[10] ANSLOW, C., MARSHALL, S., BIDDLE, R., JACKSON, K., AND NOBLE, J.XML database support for program trace visualisation. In Proceedings of theAustralasian Symposium on Information Visualisation (INVIS) (2004), AustralianComputer Society, Inc, pp. 25–34.
[11] ANSLOW, C., MARSHALL, S., NOBLE, J., AND BIDDLE, R. VET3D: a toolfor execution trace web 3D visualization. In Companion to the ACM SIG-PLAN Conference on Object-Oriented Programming, Systems, Languages, andApplications (OOPSLA) (2006), ACM Press, pp. 655–656.
[12] ANSLOW, C., MARSHALL, S., NOBLE, J., JACKSON, K., MCGAVIN, M.,AND BIDDLE, R. Program trace formats for software visualisation. Tech.Rep. CS-TR-06-1, School of Mathematics, Statistics and Computer Science,Computer Science. Victoria University of Wellington, 2006.
[13] ARENDASH, D. The unreal editor as a Web 3D authoring environment. InProceedings of the ACM International Conference on 3D Web Technology (Web3D)(2004), ACM Press, pp. 119–126.
[14] ARNAUD, R., AND BARNES, M. COLLADA: Sailing the Gulf of 3D DigitalContent Creation. AK Peters, Ltd, 2006.
[15] ARNAUD, R., AND PARISI, T. Developing web applicationswith COLLADA and X3D. Whitepaper, March 2007. http:
//www.khronos.org/collada/presentations/Developing_
Web_Application%s_with_COLLADA_and_X3D.pdf.
[16] ARTHUR, K. W., BOOTH, K. S., AND WARE, C. Evaluating 3D task perfor-mance for fish tank virtual worlds. ACM Transactions on Information Systems(TOIS) 11, 3 (1993), 239–265.
[17] BAECKER, R. Sorting out sorting. 30 minute colour sound videotape, 1981.Presented at ACM SIGGRAPH ’81 and excerpted and reprinted in ACMSIGGRAPH Video Review 7, 1983.
[18] BAECKER, R. Software Visualization. MIT Press, 1998, ch. Sorting Out Sorting:A Case Study of Software Visualisation for Teaching Computer Science,pp. 369–381.
[19] BAECKER, R. Showing instead of telling. In Proceedings of the InternationalConference on Computer Documentation (SIGDOC) (2002), ACM Press, pp. 10–16.

BIBLIOGRAPHY 169
[20] BALZER, M., AND DEUSSEN, O. Hierarchy based 3D visualization of largesoftware structures. In Proceedings of the IEEE Conference on Visualization(VIS) (2004), IEEE Computer Society Press, p. 598.4.
[21] BALZER, M., NOACK, A., DEUSSEN, O., AND LEWERENTZ, C. Softwarelandscapes: Visualizing the structure of large software systems. In VisSym2004, Symposium on Visualization (2004), Eurographics Association, pp. 261–266.
[22] BAXTER, G., FREAN, M., NOBLE, J., RICKERBY, M., SMITH, H., VISSER,M., MELTON, H., AND TEMPERO, E. Understanding the shape of javasoftware. In Proceedings of ACM SIGPLAN Conference on Object-OrientedProgramming, Systems, Languages, and Applications (OOPSLA) (2006), ACMPress, pp. 397–412.
[23] BEDERSON, B. B., AND SHNEIDERMAN, B., Eds. The Craft of InformationVisualization: Readings and Reflections. Morgan Kaufmann, 2003.
[24] BERTIN, J. Semiology of Graphics. University of Wisconsin Press, 1983.
[25] BEYER, D. Co-change visualization. In Proceedings of the IEEE InternationalConference on Software Maintenance (ICSM) (2005), IEEE Computer SocietyPress, pp. 89–92.
[26] BEYER, D. Co-change visualization applied to postgresql and argouml:(msr challenge report). In Proceedings of the International Workshop on MiningSoftware Repositories (MSR) (2006), ACM Press, pp. 165–166.
[27] BEYER, D., AND NOACK, A. Clustering software artifacts based on frequentcommon changes. In Proceedings of the IEEE International Workshop on ProgramComprehension (IWPC) (2005), IEEE Computer Society Press, pp. 259–268.
[28] BLADH, T., CARR, D., AND SCHOLL, J. Extending tree-maps to threedimensions: A comparative study. In Proceedings of the Asia-Pacific Conferenceon Computer-Human Interaction (APCHI) (2004), Springer Verlag, pp. 50–59.
[29] BOWMAN, D., KRUIJFF, E., LAVIOLA, J. J., AND POUPYREV, I. An introduc-tion to 3D user interface design. Presence 10, 1 (2001), 96–108.
[30] BOWMAN, D., KRUIJFF, E., LAVIOLA, J. J., AND POUPYREV, I. 3D UserInterfaces: Theory and Practice. Addison Wesley, 2004.
[31] BRITTLE, J., AND BOLDYREFF, C. Self-organizing maps applied in visualiz-ing large software collections. In Proceedings of the International Workshop on

170 BIBLIOGRAPHY
Visualizing Software for Understanding and Analysis (VISSOFT) (2003), IEEEComputer Society Press, pp. 104–109.
[32] BROOKS, F. P. No silver bullet: essence and accidents of software engineer-ing. IEEE Computer 20, 4 (1987), 10–19.
[33] BROWN, M., AND NAJORK, M. Software Visualization. MIT Press, 1998,ch. Algorithm Animation Using Interactive 3D Graphics, pp. 119–135.
[34] BROWN, M. H. Algorithm Animation. PhD thesis, Brown University, 1987.MIT Press.
[35] BROWN, M. H. Zeus: A system for algorithm animation and multi-viewediting. In Proceedings of the IEEE Workshop on Visual Languages (VL) (1991),IEEE Computer Society Press, pp. 4–9.
[36] BROWN, M. H., AND HERSHBERGER, J. Color and sound in algorithmanimation. IEEE Computer 25, 12 (1992), 52–63.
[37] BROWN, M. H., AND NAJORK, M. A. Algorithm animation using 3Dinteractive graphics. In Proceedings of the ACM Symposium on User InterfaceSoftware and Technology (UIST) (1993), ACM Press, pp. 93–100.
[38] BROWN, M. H., AND SEDGEWICK, R. A system for algorithm animation.In Proceedings of the ACM Conference on Computer Graphics and InteractiveTechniques (SIGGRAPH) (1984), ACM Press, pp. 177–186.
[39] BRUEGGE, B., AND DUTOIT, A. Object-Oriented Software Engineering, Con-quering Complex and Changing Systems. Prentice Hall, 2000.
[40] BRUTZMAN, D. Visualizing Information Using SVG and X3D, XML-basedtechnologies for the XML-based Web. Springer Verlag, 2005, ch. X3D-EditAuthoring Tool for Extensible 3D (X3D) Graphics, pp. 63–84.
[41] BRUTZMAN, D., AND DALY, L. X3D: Extensible 3D Graphics for Web Authors.Morgan Kaufmann, 2007.
[42] BRUTZMAN, D., HARNEY, J., AND BLAIS, C. Visualizing Information UsingSVG and X3D, XML-based technologies for the XML-based Web. Springer Verlag,2005, ch. X3D Fundamentals, pp. 285–292.
[43] BURNETT, M., GOLDBERG, A., AND LEWIS, T., Eds. Visual Object-OrientedProgramming: Concepts and Environments. Manning Publications, 1995.
BIBLIOGRAPHY 171
[44] CALLAGHAN, M., AND HIRSCHMULLER, H. 3D visualisation of designpatterns and Java programs in computer science education. In Proceedings ofthe ACM Conference on Integrating Technology into Computer Science Education(ITiCSE) (1998), ACM Press, pp. 37–40.
[45] CARD, S. K., MACKINLAY, J. D., AND SHNEIDERMAN, B. Readings ininformation visualization: using vision to think. Morgan Kaufmann, 1999.
[46] CARPENDALE, M. S. T., COWPERTHWAITE, D. J., AND FRACCHIA, F. D.Extending distortion viewing from 2D to 3D. IEEE Computer Graphics Appli-cations 17, 4 (1997), 42–51.
[47] CASEY, K., AND EXTON, C. A Java 3D implementation of a geon basedvisualisation tool for UML. In Proceedings of the International Conference onPrinciples and Practice of Programming in Java (PPPJ) (2003), Computer SciencePress, Inc., pp. 63–65.
[48] CHARTERS, S., KNIGHT, C., THOMAS, N., AND MUNRO, M. Visualisationfor informed decision making; from code to components. In Proceedings ofthe ACM Conference on Software Engineering and Knowledge Engineering (SEKE)(2002), ACM Press, pp. 765–772.
[49] CHARTERS, S., THOMAS, N., AND MUNRO, M. The end of the line for soft-ware visualisation? In Proceedings of the International Workshop on VisualizingSoftware for Understanding and Analysis (VISSOFT) (2003), IEEE ComputerSociety Press, pp. 110–112.
[50] CHEN, C. Information Visualization: Beyond The Horizon. Springer Verlag,2006.
[51] CHI, E. H. A taxonomy of visualization techniques using the data state refer-ence model. In Proceedings of the IEEE Symposium on Information Visualization(INFOVIS) (2000), IEEE Computer Society Press, pp. 69–76.
[52] CHITTARO, L., AND RANON, R. Web3D technologies in learning, educationand training: motivations, issues, opportunities. Computers & Education 49, 1(2007), 3–18.
[53] CHURCHER, N., AND CREEK, A. Building virtual worlds with the big-bang model. In Proceedings of the Australasian Symposium on InformationVisualisation (INVIS) (2001), Australian Computer Society, Inc, pp. 87–94.

172 BIBLIOGRAPHY
[54] CHURCHER, N., AND IRWIN, W. Informing the design of pipeline-basedsoftware visualisations. In Proceedings of the Asia-Pacific Symposium on In-formation Visualisation (APVIS) (2005), Australian Computer Society, Inc,pp. 59–68.
[55] CHURCHER, N., IRWIN, W., AND COOK, C. Inhomogeneous force-directedlayout algorithms in the visualisation pipeline: from layouts to visualisa-tions. In Proceedings of the Australasian Symposium on Information Visualisation(INVIS) (2004), Australian Computer Society, Inc, pp. 43–51.
[56] CHURCHER, N., IRWIN, W., AND KRIZ, R. Visualising class cohesion withvirtual worlds. In Proceedings of the Asia-Pacific Symposium on InformationVisualisation (APVIS) (2003), Australian Computer Society, Inc, pp. 89–97.
[57] CHURCHER, N., KEOWN, L., AND IRWIN, W. Virtual worlds for softwarevisualisation. In Proceedings of the Workshop on Software Visualisation Workshop(SoftVis) (1999), pp. 9–16.
[58] COCKBURN, A. Revisiting 2D vs 3D implications on spatial memory. InProceedings of the Australasian Conference on User Interfaces (AUIC) (2004),Australian Computer Society, Inc, pp. 25–31.
[59] COCKBURN, A., AND MCKENZIE, B. An evaluation of cone trees. In Peopleand Computers XIV: British Computer Society Conference on Human ComputerInteraction (2000), Springer Verlag, pp. 425–436.
[60] COCKBURN, A., AND MCKENZIE, B. 3D or not 3D?: evaluating the effectof the third dimension in a document management system. In Proceedingsof the ACM Conference on Human Factors in Computing Systems (CHI) (2001),ACM Press, pp. 434–441.
[61] COCKBURN, A., AND MCKENZIE, B. Evaluating the effectiveness of spatialmemory in 2D and 3D physical and virtual environments. In Proceedingsof the ACM Conference on Human Factors in Computing Systems (CHI) (2002),ACM Press, pp. 203–210.
[62] COCKBURN, A., AND MCKENZIE, B. Evaluating spatial memory in twoand three dimensions. International Journal of Human Computer Studies 61, 3(2004), 359–373.
[63] COX, K. C., AND ROMAN, G.-C. Abstraction in algorithm animation.In Proceedings of the IEEE Workshop on Visual Languages (VL) (1992), IEEEComputer Society Press, pp. 18–24.

BIBLIOGRAPHY 173
[64] CRAFT, B., AND CAIRNS, P. Beyond guidelines: What can we learn from thevisual information seeking mantra? In Proceedings of the IEEE InternationalConference on Information Visualisation (IV) (2005), IEEE Computer SocietyPress, pp. 110–118.
[65] DANN, W., COOPER, S., AND PAUSCH, R. Using visualization to teachnovices recursion. ACM SIGCSE Bulletin 33, 3 (2001), 109–112.
[66] DAVIS, T., AND KENNETH. Kscope: A modularized tool for 3D visualizationof object-oriented programs. In Proceedings of the International Workshop onVisualizing Software for Understanding and Analysis (VISSOFT) (2003), IEEEComputer Society Press, pp. 98–103.
[67] DIEHL, S. Vrml++: A language for object-oriented virtual-reality models.In Proceedings of the IEEE International Conference on Technology of Object-Oriented Languages and Systems (TOOLS) (1997), IEEE Computer SocietyPress, pp. 141–150.
[68] DIEHL, S., Ed. Revised Lectures on Software Visualization, International Seminar.Springer Verlag, 2002.
[69] DIEHL, S. Software Visualization: Visualizing the Structure, Behaviour, andEvolution of Software. Springer Verlag, 2007.
[70] DIGIANO, C. J., AND BAECKER, R. M. Program auralization: sound en-hancements to the programming environment. In Proceedings of the Conferenceon Graphics Interface (GI) (1992), Morgan Kaufmann, pp. 44–52.
[71] DREDGE, S. Web 3D : New Perspectives. Universe, 2002.
[72] DREW, N. S., AND HENDLEY, R. J. Visualisation of complex systems. Tech.rep., University of Birmingham, 1995.
[73] DREW, N. S., AND HENDLEY, R. J. Visualising complex interacting systems.In Proceedings of the ACM Conference on Human Factors in Computing Systems(CHI) (1995), ACM Press, pp. 204–205.
[74] DUIGNAN, M. Evaluating scalable vector graphics for software visualisation.Master’s thesis, Victoria University of Wellington, 2003.
[75] DUIGNAN, M., BIDDLE, R., AND TEMPERO, E. Evaluating scalable vectorgraphics for use in software visualisation. In Proceedings of the AustralasianSymposium on Information Visualisation (INVIS) (2003), Australian ComputerSociety, Inc, pp. 127–136.

174 BIBLIOGRAPHY
[76] DWYER, T. Three dimensional UML using force directed layout. In Proceed-ings of the Australasian Symposium on Information Visualisation (INVIS) (2001),Australian Computer Society, Inc, pp. 77–85.
[77] DWYER, T., AND ECKERSLEY, P. Graph Drawing Software. Springer Verlag,2003, ch. WilmaScope - a 3D graph visualisation system, pp. 55–75.
[78] EADES, P., AND ZHANG, K. Software Visualisation, vol. 7 of Software Engi-neering and Knowledge Engineering. World Scientific, 1996.
[79] EICK, S. G., STEFFEN, J. L., AND ERIC E. SUMNER, J. Seesoft-a tool forvisualizing line oriented software statistics. IEEE Transactions on SoftwareEngineering 18, 11 (1992), 957–968.
[80] ELLERSHAW, S., AND OUDSHOORN, M. Program visualization - the state ofthe art. Tech. Rep. 94-19, Department of Computer Science, University ofAdelaide, 1994.
[81] ELLIS, G., AND DIX, A. An explorative analysis of user evaluation studiesin information visualisation. In Proceedings of the AVI Workshop on BEyondtime and errors: novel evaLuation methods for Information Visualization (BELIV)(2006), ACM Press, pp. 1–7.
[82] FEIJS, L., AND JONG, R. D. 3D visualization of software architectures.Communications of the ACM 41, 12 (1998), 73–78.
[83] FOWLER, M., AND SCOTT, K. UML Distilled: A Brief Guide to the StandardObject Modeling Language, 2nd ed. Addison Wesley, 2000.
[84] FRANCK, G., SARDESAI, M., AND WARE, C. Layout and structuring objectoriented software in three dimensions. In Proceedings of the Conference of theCentre for Advanced Studies on Collaborative Research (CASCON) (1995), IBMPress, pp. 22–31.
[85] FRONK, A. Evaluating 3D-visualisation of code structures in the contextof reverse engineering. In Proceedings of the Workshop on Empirical Studies inReverse Engineering (WESRE) (2006), IEEE Computer Society Press.
[86] FRONK, A., BRUCKHOFF, A., AND KERN, M. 3D visualisation of codestructures in Java software systems. In Proceedings of the ACM Symposium onSoftware Visualization (SOFTVIS) (2006), ACM Press, pp. 145–146.
[87] FURNAS, G. W. Generalized fisheye views. In Proceedings of the ACMConference on Human Factors in Computing Systems (CHI) (1986), ACM Press,pp. 16–23.
BIBLIOGRAPHY 175
[88] GARLAND, K. Mr. Beck’s Underground Map. Capital Transport Publishing,1994.
[89] GEROIMENKO, V., AND CHEN, C., Eds. Visualizing Information Using SVGand X3D, XML-based technologies for the XML-based Web. Springer Verlag,2005.
[90] GIL, J., AND KENT, S. Three dimensional software modelling. In Proceedingsof the International Conference on Software Engineering (ICSE) (1998), IEEEComputer Society Press, pp. 105–114.
[91] GLOOR, P. A. Software Visualization. MIT Press, 1998, ch. User InterfaceIssues for Algorithm Animation, pp. 145–152.
[92] GOGOLLA, M., RADFELDER, O., AND RICHTERS, M. Towards three-dimensional animation of UML diagrams. In Proceedings of the Interna-tional Conference on Unified Modeling Language (UML) (1999), Springer Verlag,pp. 489–502.
[93] GOLDMAN, D., ECKERT, R., AND COHEN, M. Three-dimensional computa-tion visualization for computer graphics rendering algorithms. In Proceedingsof the ACM Symposium on Computer Science Education (SIGCSE) (1996), ACMPress, pp. 358–362.
[94] GORDON, D., BIDDLE, R., NOBLE, J., AND TEMPERO, E. A technologyfor lightweight web-based visual applications. In Proceedings of the IEEESymposium on Human Centric Computing Languages and Environments (HCC)(2003), IEEE Computer Society Press, pp. 245–247.
[95] GRACANIN, D., MATKOVIC, K., AND ELTOWEISSY, M. Software visualiza-tion. Innovations in Systems and Software Engineering, A NASA Journal 1, 2(2005), 221–230.
[96] GRAHAM, H., YANG, H. Y., AND BERRIGAN, R. A solar system metaphorfor 3D visualisation of object oriented software metrics. In Proceedings of theAustralasian Symposium on Information Visualisation (INVIS) (2004), AustralianComputer Society, Inc., pp. 53–59.
[97] GREEVY, O., LANZA, M., AND WYSSEIER, C. Visualizing feature interactionin 3-D. In Proceedings of the International Workshop on Visualizing Software forUnderstanding and Analysis (VISSOFT) (2005), IEEE Computer Society Press,pp. 114–119.
176 BIBLIOGRAPHY
[98] GREEVY, O., LANZA, M., AND WYSSEIER, C. Visualizing live softwaresystems in 3D. In Proceedings of the ACM Symposium on Software Visualization(SOFTVIS) (2006), ACM Press, pp. 47–56.
[99] HALLER, M., BILLINGHURST, M., AND THOMAS, B., Eds. Emerging Tech-nologies of Augmented Reality: Interfaces and Design. IGI Global, 2006.
[100] HANSEN, R. K. Why has Web3D not broken through yet? Honours Report,Cumbria Institute of Arts, February 2005.
[101] HARRIS, R. L. Information graphics a comprehensive illustrated reference: visualtools for analyzing, managing, and communicating. Oxford University Press,1999.
[102] HARTLEY, D., CHURCHER, N., AND ALBERTSON, G. Virtual worlds forweb site visualisation. In Proceedings of the Asia-Pacific Software EngineeringConference (APSEC) (2000), IEEE Computer Society Press, pp. 448–455.
[103] HARTMAN, J., AND WERNECKE, J. The VRML 2.0 Handbook. AddisonWesley, 1996.
[104] HATCH, A., SMITH, M., TAYLOR, C., AND MUNRO, M. No silver bulletfor software visualisation evaluation. In Proceedings of The InternationalConference on Imaging Science, Systems, and Technology (CISST) (2001).
[105] HENDLEY, R. J., DREW, N. S., WOOD, A. M., AND BEALE, R. Case study:Narcissus: visualising information. In Proceedings of the IEEE Symposium onInformation Visualization (INFOVIS) (1995), IEEE Computer Society Press,pp. 90–96.
[106] HICKS, M., O’MALLEY, C., NICHOLS, S., AND ANDERSON, B. Comparisonof 2D and 3D representations for visualising telecommunication usage.Behaviour & Information Technology 22, 3 (2003), 185–201.
[107] HOLMBERG, N., WUENSCHE, B., AND TEMPERO, E. A framework for inter-active web-based visualization. In Proceedings of the Australasian Conferenceon User Interfaces (AUIC) (2006), CRPIT, Australian Computer Society, Inc,pp. 137–144.
[108] HOPKINS, J., AND FISHWICK, P. The rube framework for personalized3-D software visualization. In Revised Lectures on Software Visualization,International Seminar (2002), Springer Verlag, pp. 368–380.
BIBLIOGRAPHY 177
[109] HUBONA, G. S., SHIRAH, G. W., AND FOUT, D. G. 3D object recognitionwith motion. In Proceedings of the ACM Conference on Human Factors inComputing Systems (CHI) (1997), ACM Press, pp. 345–346.
[110] IRANI, P., TINGLEY, M., AND WARE, C. Using perceptual syntax to enhancesemantic content in diagrams. IEEE Computer Graphics Applications 21, 5(2001), 76–85.
[111] IRANI, P., AND WARE, C. Diagrams based on structural object perception.In Proceedings of the Working Conference on Advanced Visual Interfaces (AVI)(2000), ACM Press, pp. 61–67.
[112] IRANI, P., AND WARE, C. Diagramming information structures using 3Dperceptual primitives. ACM Transactions on Computer-Human Interaction(TOCHI) 10, 1 (2003), 1–19.
[113] IRWIN, W., AND CHURCHER, N. XML in the visualisation pipeline. InProceedings of the Pan-Sydney Area Workshop on Visual Information Processing(VIP) (2001), Australian Computer Society, Inc, pp. 59–67.
[114] IRWIN, W., AND CHURCHER, N. Object oriented metrics: Precision toolsand configurable visualisations. In Proceedings of the International Symposiumon Software Metrics (METRICS) (2003), IEEE Computer Society Press, pp. 112–123.
[115] JEFFERY, C. L. Program Monitoring and Visualization: An Exploratory Approach.Springer Verlag, 1999.
[116] JOHNSON, B., AND SHNEIDERMAN, B. Tree-maps: a space-filling approachto the visualization of hierarchical information structures. In Proceedingsof the IEEE Conference on Visualization (VIS) (1991), IEEE Computer SocietyPress, pp. 284–291.
[117] KADMON, N., AND SHLOMI, E. A polyfocal projection for statistical surfaces.Cartograph 15, 1 (1978), 36–41.
[118] KEOWN, L. Virtual 3D worlds for enhanced software visualization. Master’sthesis, University of Canterbury, 2000.
[119] KERREN, A., AND STASKO, J. T. Algorithm animation - introduction. In Re-vised Lectures on Software Visualization, International Seminar (2002), SpringerVerlag, pp. 1–15.

178 BIBLIOGRAPHY
[120] KHALED, R., MACKAY, D., BIDDLE, R., AND NOBLE, J. A lightweight web-based case tool for sequence diagrams. In Proceedings of the ACM SIGCHI NewZealand Conference on Computer-Human Interaction (CHINZ) (2002), pp. 55–60.
[121] KIM, T., AND FISHWICK, P. A. A 3D XML-based customized framework fordynamic models. In Proceedings of the ACM International Conference on 3DWeb Technology (Web3D) (2002), ACM Press, pp. 103–109.
[122] KLEIBERG, E., VAN DE WETERING, H., AND WIJK, J. J. V. Botanical vi-sualization of huge hierarchies. In Proceedings of the IEEE Symposium onInformation Visualization (INFOVIS) (2001), IEEE Computer Society Press,pp. 87–94.
[123] KNIGHT, C., AND MUNRO, M. Using an existing game engine to facilitatemulti-user software visualisation. Tech. Rep. 8/98, University of Durham,1998.
[124] KNIGHT, C., AND MUNRO, M. Comprehension with[in] virtual environmentvisualisations. In Proceedings of the IEEE International Workshop on ProgramComprehension (IWPC) (1999), IEEE Computer Society Press, pp. 4–11.
[125] KNIGHT, C., AND MUNRO, M. Virtual but visible software. In Proceedingsof the IEEE International Conference on Information Visualisation (IV) (2000),pp. 198–205.
[126] KNIGHT, C., AND MUNRO, M. Visualising Java uncertainty. In Java/Jini Tech-nologies, in the Multimedia Networks and Management Program of The Conver-gence of Information Technologies and Communication (ITCOM) (2001), vol. 4521,SPIE.
[127] KNIGHT, C., AND MUNRO, M. Program comprehension experiences withGXL; comprehension for comprehension. In Proceedings of the IEEE Interna-tional Workshop on Program Comprehension (IWPC) (2002), IEEE ComputerSociety Press, pp. 147–156.
[128] KOIKE, H. An application of three-dimensional visualization to object-oriented programming. In Proceedings of the Working Conference on AdvancedVisual Interfaces (AVI) (1992), World Scientific, pp. 180–192.
[129] KOIKE, H. Three-dimensional software visualization: A framework andits applications. In Proceedings of the International Conference of the ComputerGraphics Society on Visual Computing (1992), Springer Verlag, pp. 151–170.
BIBLIOGRAPHY 179
[130] KOIKE, H. The role of another spatial dimension in software visualization.ACM Transactions on Information Systems (TOIS) 11, 3 (1993), 266–286.
[131] KOIKE, H., AND CHU, H.-C. How does 3-D visualization work in softwareengineering?: empirical study of a 3-D version/module visualization system.In Proceedings of the International Conference on Software Engineering (ICSE)(1998), IEEE Computer Society Press, pp. 516–519.
[132] KOSARA, R., HEALEY, C. G., INTERRANTE, V., LAIDLAW, D. H., AND
WARE, C. User studies: Why, how, and when? IEEE Computer 23, 4 (2003),20–25.
[133] KOSCHKE, R. Software visualization for reverse engineering. In Revised Lec-tures on Software Visualization, International Seminar (2002), Springer Verlag,pp. 138–150.
[134] KOSCHKE, R. Software visualization in software maintenance, reverseengineering, and re-engineering: a research survey. Journal of SoftwareMaintenance 15, 2 (2003), 87–109.
[135] KOT, B., WUENSCHE, B., GRUNDY, J., AND HOSKING, J. Information visu-alisation utilising 3D computer game engines - case study: A source codecomprehension tool. In Proceedings of the ACM SIGCHI New Zealand Confer-ence on Computer-Human Interaction (CHINZ) (2005), ACM Press, pp. 53–60.
[136] LAMPING, J., RAO, R., AND PIROLLI, P. A focus+context technique basedon hyperbolic geometry for visualizing large hierarchies. In Proceedings of theACM Conference on Human Factors in Computing Systems (CHI) (1995), ACMPress, pp. 401–408.
[137] LANGELIER, G., SAHRAOUI, H., AND POULIN, P. Visualization-basedanalysis of quality for large-scale software systems. In Proceedings of theIEEE/ACM International Conference on Automated Software Engineering (ASE)(2005), ACM Press, pp. 214–223.
[138] LANGELIER, G., SAHRAOUI, H., AND POULIN, P. Animation coherence inrepresenting software evolution. In Proceedings of the ECOOP Workshop onQuantitative Approaches in Object-Oriented Software Engineering (QAOOSE)(2006), pp. 41–50.
[139] LANZA, M. Codecrawler - lessons learned in building a software visualiza-tion tool. In Proceedings of the European Conference on Software Maintenanceand Reengineering (CSMR) (2003), IEEE Computer Society Press, pp. 409–418.

180 BIBLIOGRAPHY
[140] LANZA, M., AND DUCASSE, S. Tools for Software Maintenance and Reengi-neering. RCOST Software Technology Series, 2005, ch. CodeCrawler - AnExtensible and Language Independent 2D and 3D Software VisualizationTool, pp. 74–94.
[141] LANZA, M., MARINESCU, R., AND DUCASSE, S. Object-Oriented Metrics inPractice. Springer Verlag, 2005.
[142] LEE, B., PLAISANT, C., PARR, C. S., FEKETE, J.-D., AND HENRY, N. Tasktaxonomy for graph visualization. In Proceedings of the AVI Workshop onBEyond time and errors: novel evaLuation methods for Information Visualization(BELIV) (2006), ACM Press, pp. 1–5.
[143] LEUNG, Y. K., AND APPERLEY, M. D. A review and taxonomy of distortion-oriented presentation techniques. ACM Transactions on Computer-HumanInteraction (TOCHI) 1, 2 (1994), 126–160.
[144] LEWERENTZ, C., AND NOACK, A. Graph Drawing Software. Springer Ver-lag, 2003, ch. CrocoCosmos - 3D Visualization of Large Object-OrientedPrograms, pp. 279–297.
[145] LEWERENTZ, C., AND SIMON, F. Metrics-based 3D visualization of largeobject-oriented programs. In Proceedings of the International Workshop onVisualizing Software for Understanding and Analysis (VISSOFT) (2002), IEEEComputer Society Press, pp. 70–77.
[146] LIEBERMAN, H. A three-dimensional representation for program execution.In Proceedings of the IEEE Workshop on Visual Languages (VL) (1989), IEEEComputer Society Press, pp. 111–116.
[147] LOWE, W., ERICSSON, M., LUNDBERG, J., PANAS, T., AND PETTERSSON, N.Vizzanalyzer - a software comprehension framework. In Software EngineeringResearch and Practice (SERPS) (2003).
[148] MACKAY, D., NOBLE, J., AND BIDDLE, R. A lightweight web-based casetool for UML class diagrams. In Proceedings of the Australasian Conference onUser Interfaces (AUIC) (2003), Australian Computer Society, Inc, pp. 95–98.
[149] MACKINLAY, J. D., ROBERTSON, G. G., AND CARD, S. K. The perspectivewall: detail and context smoothly integrated. In Proceedings of the ACMConference on Human Factors in Computing Systems (CHI) (1991), ACM Press,pp. 173–179.

BIBLIOGRAPHY 181
[150] MALETIC, J., LEIGH, J., AND MARCUS, A. Visualizing software in animmersive virtual reality environment. In Proceedings of the ICSE Workshopon Software Visualization (2001), IEEE Computer Society Press, pp. 49–54.
[151] MALETIC, J., LEIGH, J., MARCUS, A., AND DUNLAP, G. Visualizing object-oriented software in virtual reality. In Proceedings of the IEEE InternationalWorkshop on Program Comprehension (IWPC) (2001), IEEE Computer SocietyPress, pp. 26–35.
[152] MALETIC, J., AND MARCUS, A. CFB: a call for benchmarks - for softwarevisualization. In Proceedings of the International Workshop on VisualizingSoftware for Understanding and Analysis (VISSOFT) (2003), IEEE ComputerSociety Press, pp. 113–116.
[153] MALETIC, J., MARCUS, A., AND COLLARD, M. A task oriented viewof software visualization. In Proceedings of the International Workshop onVisualizing Software for Understanding and Analysis (VISSOFT) (2002), IEEEComputer Society Press, pp. 32–40.
[154] MARCUS, A., COMORSKI, D., AND SERGEYEV, A. Supporting the evolutionof a software visualization tool through usability studies. In Proceedingsof the IEEE International Workshop on Program Comprehension (IWPC) (2005),IEEE Computer Society Press, pp. 307–316.
[155] MARCUS, A., FENG, L., AND MALETIC, J. I. 3D representations for softwarevisualization. In Proceedings of the ACM Symposium on Software Visualization(SOFTVIS) (2003), ACM Press, pp. 27–36.
[156] MARCUS, A., FENG, L., AND MALETIC, J. I. Comprehension of softwareanalysis data using 3D visualization. In Proceedings of the IEEE InternationalWorkshop on Program Comprehension (IWPC) (2003), IEEE Computer SocietyPress, pp. 105–114.
[157] MARSHALL, S. Test Driving Reusable Components. PhD thesis, VictoriaUniversity of Wellington, 2006.
[158] MARSHALL, S., BIDDLE, R., AND NOBLE, J. Using software visualisationto enhance online component markets. In Proceedings of the AustralasianSymposium on Information Visualisation (INVIS) (2004), Australian ComputerSociety, Inc, pp. 35–41.
[159] MARSHALL, S., JACKSON, K., ANSLOW, C., AND BIDDLE, R. Aspects tovisualising reusable components. In Proceedings of the Australasian Symposium

182 BIBLIOGRAPHY
on Information Visualisation (INVIS) (2003), Australian Computer Society, Inc,pp. 81–88.
[160] MARSHALL, S., JACKSON, K., BIDDLE, R., MCGAVIN, M., TEMPERO, E.,AND DUIGNAN, M. Visualising reusable software over the web. In Proceed-ings of the Australasian Symposium on Information Visualisation (INVIS) (2001),Australian Computer Society, Inc, pp. 103–111.
[161] MCGAVIN, M. Extracting software reuse information for visualisation tools.Honours Report, Victoria University of Wellington, October 2001.
[162] MCGAVIN, M., WRIGHT, T., AND MARSHALL, S. Visualisations of executiontraces (VET): An interactive plugin-based visualisation tool. In Proceedingsof the Australasian Conference on User Interfaces (AUIC) (2006), AustralianComputer Society, Inc, pp. 153–160.
[163] MCINTOSH, P., HAMILTON, M., AND VAN SCHYNDEL, R. X3D-UML: en-abling advanced UML visualisation through X3D. In Proceedings of the ACMInternational Conference on 3D Web Technology (Web3D) (2005), ACM Press,pp. 135–142.
[164] MESNAGE, C., AND LANZA, M. White coats: Web-visualization of evolvingsoftware in 3D. In Proceedings of the International Workshop on VisualizingSoftware for Understanding and Analysis (VISSOFT) (2005), IEEE ComputerSociety Press, pp. 40–45.
[165] MICROSYSTEMS, S. Java debugger interface API, 2003. http://java.sun.com/j2se/1.4.2/docs/guide/jpda/jdi.
[166] MUNZNER, T. H3: laying out large directed graphs in 3D hyperbolic space.In Proceedings of the IEEE Symposium on Information Visualization (INFOVIS)(1997), IEEE Computer Society Press, pp. 2–10.
[167] MUNZNER, T., AND BURCHARD, P. Visualizing the structure of the worldwide web in 3D hyperbolic space. In Proceedings of the Symposium on VirtualReality Modeling Language (VRML)) (1995), ACM Press, pp. 33–38.
[168] NAJORK, M. Web-based algorithm animation. In Proceedings of the Conferenceon Design Automation (DAC) (2001), ACM Press, pp. 506–511.
[169] NAJORK, M. A., AND BROWN, M. H. Three-dimensional web-based al-gorithm animations. Tech. Rep. SRC-RR-170, Compaq Systems ResearchCentre, 2001.

BIBLIOGRAPHY 183
[170] NESBITT, K. V. Using guidelines to assist in the visualisation design pro-cess. In Proceedings of the Asia-Pacific Symposium on Information Visualisation(APVIS) (2005), Australian Computer Society, Inc, pp. 115–123.
[171] NIELSEN, J. Usability Engineering. Morgan Kaufmann, 1994.
[172] NIELSEN, J. Designing Web Usability : The Practice of Simplicity. New Riders,2000.
[173] NIELSEN, J., AND LORANGER, H. Prioritizing Web Usability. New Riders,2006.
[174] NOBLE, J. Abstract Program Visualisation. PhD thesis, Victoria University ofWellington, 1996.
[175] NOBLE, J., AND GROVES, L. Tarraingı́m - a program animation environment.In Proceedings of the New Zealand Computer Science Conference (1991).
[176] NOBLE, J., GROVES, L., AND BIDDLE, R. Object oriented program visualisa-tion in tarraingı́m. Australian Computing Journal 27, 4 (1995).
[177] OUDSHOORN, M., WIDJAJA, H., AND ELLERSHAW, S. Aspects and taxon-omy of program visualisation. In Software Visualisation. World Scientific,1996, pp. 3–26.
[178] PANAS, T., BERRIGAN, R., AND GRUNDY, J. A 3D metaphor for softwareproduction visualization. In Proceedings of the IEEE Symposium on InformationVisualization (INFOVIS) (2003), IEEE Computer Society Press, pp. 314–319.
[179] PANAS, T., LINCKE, R., AND LOWE, W. Online-configuration of softwarevisualizations with Vizz3D. In Proceedings of the ACM Symposium on SoftwareVisualization (SOFTVIS) (2005), ACM Press, pp. 173–182.
[180] PARISI, T. Flux: lightweight, standards-based web graphics in XML. InSIGGRAPH ’03: ACM SIGGRAPH 2003 Web Graphics (2003), ACM Press,pp. 1–1.
[181] PARKER, G., FRANCK, G., AND WARE, C. Visualization of large nestedgraphs in 3D: navigation and interaction. Journal of Visual Languages andComputing 9, 3 (1998), 299–317.
[182] PAUW, W. D., HELM, R., KIMELMAN, D., AND VLISSIDES, J. Visualizing thebehavior of object-oriented systems. In Proceedings of ACM SIGPLAN Con-ference on Object-Oriented Programming, Systems, Languages, and Applications(OOPSLA) (1993), ACM Press, pp. 326–337.

184 BIBLIOGRAPHY
[183] PAUW, W. D., JENSEN, E., MITCHELL, N., SEVITSKY, G., VLISSIDES, J., AND
YANG, J. Visualizing the execution of Java programs. In Revised Lectures onSoftware Visualization, International Seminar (2002), Springer Verlag, pp. 151–162.
[184] PAUW, W. D., KIMELMAN, D., AND VLISSIDES, J. Modeling object-orientedprogram execution. In Proceedings of European Conference on Object-OrientedProgramming (ECOOP) (1994), Springer Verlag, pp. 163–182.
[185] PAUW, W. D., KIMELMAN, D., AND VLISSIDES, J. Software Visualization. MITPress, 1998, ch. Visualizing Object-Oriented Software Execution, pp. 329–346.
[186] PAUW, W. D., MITCHELL, N., ROBILLARD, M., SEVITSKY, G., AND SRINI-VASAN, H. Drive-by analysis of running programs. In Proceedings of the ICSEWorkshop on Software Visualization (2001), pp. 27–32.
[187] PAUW, W. D., AND SEVITSKI, G. Visualizing reference patterns for solvingmemory leaks in Java. In Proceedings of European Conference on Object-OrientedProgramming (ECOOP) (1999), Springer Verlag, pp. 116–134.
[188] PETRE, M., BLACKWELL, A., AND GREEN, T. Software Visualization. MITPress, 1998, ch. Cognitive Questions in Software Visualization, pp. 453–480.
[189] PETRE, M., AND DE QUINCEY, E. A gentle overview of software visualisa-tion. Psychology of Programming Interest Group (PPIG) Newsletter, Septem-ber 2006. http://www.ppig.org/newsletters/2006-09.html.
[190] PLAISANT, C. The challenge of information visualization evaluation. InProceedings of the Working Conference on Advanced Visual Interfaces (AVI) (2004),ACM Press, pp. 109–116.
[191] POLYS, N. F. Stylesheet transformations for interactive visualization: to-wards a Web3D chemistry curricula. In Proceedings of the ACM InternationalConference on 3D Web Technology (Web3D) (2003), ACM Press, pp. 85–90.
[192] POLYS, N. F. Visualizing Information Using SVG and X3D, XML-based technolo-gies for the XML-based Web. Springer Verlag, 2005, ch. Publishing Paradigmsfor X3D, pp. 153–180.
[193] POULIN, J. S. Measuring Software Reuse: principles, practices, and economicmodels. Addison Wesley, 1997.
[194] PRICE, B., BAECKER, R., AND SMALL, I. Software Visualization. MIT Press,1998, ch. An Introduction to Software Visualization, pp. 3–27.

BIBLIOGRAPHY 185
[195] PRICE, B. A., BAECKER, R. M., AND SMALL, I. S. A principled taxonomy ofsoftware visualization. Journal of Visual Languages and Computing 4, 2 (1993),211–266.
[196] PRICE, B. A., SMALL, I. S., AND BAECKER, R. M. A taxonomy of softwarevisualisation. In Proceedings of the International Conference on System Sciences(1992), pp. 597–606.
[197] RADFELDER, O., AND GOGOLLA, M. On better understanding UML dia-grams through interactive three-dimensional visualization and animation.In Proceedings of the Working Conference on Advanced Visual Interfaces (AVI)(2000), ACM Press, pp. 292–295.
[198] RAO, R., AND CARD, S. K. The table lens: merging graphical and symbolicrepresentations in an interactive focus + context visualization for tabularinformation. In Proceedings of the ACM Conference on Human Factors inComputing Systems (CHI) (1994), ACM Press, pp. 318–322.
[199] REISS, S. P. A framework for abstract 3D visualization. In Proceedings of theIEEE Symposium on Visual Languages (VL) (1993), IEEE Computer SocietyPress, pp. 108–115.
[200] REISS, S. P. 3-D visualization of program information. In Proceedings ofGraph Drawing (1994), Springer Verlag, pp. 12–24.
[201] REISS, S. P. An engine for the 3D visualization of program information.Journal of Visual Languages and Computing 6, 3 (1995), 299–323.
[202] REISS, S. P. Bee/Hive: A software visualization back end. In Proceedings ofthe ICSE Workshop on Software Visualization (2001), IEEE Computer SocietyPress, pp. 44–48.
[203] REISS, S. P. An overview of BLOOM. In Proceedings of the ACM SIGPLAN-SIGSOFT Workshop on Program Analysis for Software Tools and Engineering(PASTE) (2001), ACM Press, pp. 2–5.
[204] REISS, S. P. A visual query language for software visualization. In Pro-ceedings of the IEEE Symposium on Human Centric Computing Languages andEnvironments (HCC) (2002), IEEE Computer Society Press, pp. 80–82.
[205] REISS, S. P. Event-based performance analysis. In Proceedings of the IEEEInternational Workshop on Program Comprehension (IWPC) (2003), IEEE Com-puter Society Press, pp. 74–83.

186 BIBLIOGRAPHY
[206] REISS, S. P. Jive: visualizing Java in action demonstration description. InProceedings of the International Conference on Software Engineering (ICSE) (2003),IEEE Computer Society Press, pp. 820–821.
[207] REISS, S. P. Visualizing Java in action. In Proceedings of the ACM Symposiumon Software Visualization (SOFTVIS) (2003), ACM Press, pp. 57–65.
[208] REISS, S. P. The paradox of software visualization. In Proceedings of theInternational Workshop on Visualizing Software for Understanding and Analysis(VISSOFT) (2005), pp. 59–63.
[209] REISS, S. P., AND RENIERIS, M. Generating Java trace data. In Proceedings ofthe ACM Conference on Java Grande (2000), ACM Press, pp. 71–77.
[210] REISS, S. P., AND RENIERIS, M. Languages for dynamic instrumentation.In Proceedings of the ICSE Workshop on Dynamic Analysis (WODA) (2003),pp. 41–45.
[211] REISS, S. P., AND RENIERIS, M. Software Visualization: From Theory to Practice.Kluwer Academic Publishers, 2003, ch. The Bloom Software VisualizationSystem, pp. 311–357.
[212] REISS, S. P., AND RENIERIS, M. Jove: Java as it happens. In Proceedings ofthe ACM Symposium on Software Visualization (SOFTVIS) (2005), ACM Press,pp. 115–124.
[213] REKIMOTO, J., AND GREEN, M. The information cube: Using transparencyin 3D information visualization. In Proceedings of the Workshop on InformationTechnologies & Systems (WITS) (1993), pp. 125–132.
[214] RHEINGOLD, H. Virtual Reality. Summit Books, 1991.
[215] RILLING, J., AND MUDUR, S. P. On the use of metaballs to visually mapsource code structures and analysis results onto 3D space. In Proceedings ofthe Working Conference on Reverse Engineering (WCRE) (2002), IEEE ComputerSociety Press, pp. 299–308.
[216] RILLING, J., AND MUDUR, S. P. 3D visualization techniques to supportslicing-based program comprehension. Computers & Graphics 29, 3 (2005),311–329.
[217] RILLING, J., WANG, J., AND MUDUR, S. Metaviz - issues in software visual-izing beyond 3D. In Proceedings of the International Workshop on VisualizingSoftware for Understanding and Analysis (VISSOFT) (2003), IEEE ComputerSociety Press, pp. 92–97.
BIBLIOGRAPHY 187
[218] RISDEN, K., CZERWINSKI, M. P., MUNZNER, T., AND COOK, D. An initialexamination of ease of use for 2D and 3D information visualizations of webcontent. International Journal of Human Computer Studies 53, 5 (2000), 695–714.
[219] ROBERTSON, G. G., CZERWINSKI, M., LARSON, K., ROBBINS, D. C., THIEL,D., AND VAN DANTZICH, M. Data mountain: Using spatial memory for doc-ument management. In Proceedings of the ACM Symposium on User InterfaceSoftware and Technology (UIST) (1998), ACM Press, pp. 153–162.
[220] ROBERTSON, G. G., MACKINLAY, J. D., AND CARD, S. K. Cone trees:animated 3D visualizations of hierarchical information. In Proceedings of theACM Conference on Human Factors in Computing Systems (CHI) (1991), ACMPress, pp. 189–194.
[221] ROMAN, G.-C., AND COX, K. C. A taxonomy of program visualizationsystems. IEEE Computer 26, 12 (1993), 11–24.
[222] ROMAN, G.-C., COX, K. C., WILCOX, D., AND PLUN, J. Pavane: A systemfor declarative visualization of concurrent computations. Journal of VisualLanguages and Computing 3, 2 (1992), 161–193.
[223] RYMASZEWSKI, M., AU, W. J., WALLACE, M., WINTERS, C., ONDREJKA,C., AND BATSTONE-CUNNINGHAM, B. Second Life: The Official Guide. Sybex,2006.
[224] SARKAR, M., AND BROWN, M. H. Graphical fisheye views of graphs. InProceedings of the ACM Conference on Human Factors in Computing Systems(CHI) (1992), ACM Press, pp. 83–91.
[225] SELMAN, D. Java 3D Programming. Manning Publications, 2002.
[226] SEVITSKY, G., PAUW, W. D., AND KONURU, R. An information explorationtool for performance analysis of Java programs. In Proceedings of the IEEEInternational Conference on Technology of Object-Oriented Languages and Systems(TOOLS) (March 2001), pp. 85–101.
[227] SHNEIDERMAN, B. Tree visualization with tree-maps: 2-D space-fillingapproach. ACM Transactions on Graphics (TOG) 11, 1 (1992), 92–99.
[228] SHNEIDERMAN, B. The eyes have it: A task by data type taxonomy forinformation visualizations. In Proceedings of the IEEE Symposium on VisualLanguages (VL) (1996), pp. 336–343.
188 BIBLIOGRAPHY
[229] SHNEIDERMAN, B. Why not make interfaces better than 3D reality? IEEEComputer Graphics Applications 23, 6 (2003), 12–15.
[230] SHNEIDERMAN, B., AND PLAISANT, C. Strategies for evaluating informationvisualization tools: multi-dimensional in-depth long-term case studies. InProceedings of the AVI Workshop on BEyond time and errors: novel evaLuationmethods for Information Visualization (BELIV) (2006), ACM Press, pp. 1–7.
[231] SPENCE, R. Information Visualization. Addison Wesley, 2001.
[232] SPENCE, R. Information Visualization: Design For Interaction. Addison Wesley,2007.
[233] SPENCE, R., AND APPERLEY, M. Data base navigation: An office environ-ment for the professional. Behaviour in Information Technology 1, 1 (1982),43–54.
[234] STASKO, J. The path-transition paradigm: A practical methodology foradding animation to program interfaces. Journal of Visual Languages andComputing 1, 3 (1990), 213–236.
[235] STASKO, J. Tango: A framework and system for algorithm animation. IEEEComputer 23, 9 (1990), 27–39.
[236] STASKO, J. Software Visualization. MIT Press, 1998, ch. Smooth, ContinuousAnimations for Portraying Algorithms and Processes, pp. 103–118.
[237] STASKO, J., BROWN, M., AND PRICE, B., Eds. Software Visualization: Pro-gramming as a Multimedia Experience. MIT Press, 1998.
[238] STASKO, J., AND KRAEMER, E. A methodology for building application-specific visualizations of parallel programs. Journal of Parallel and DistributedComputing 18, 2 (1993), 258–264.
[239] STASKO, J. T. Tango: A Framework and System for Algorithm Animation. PhDthesis, Brown University, May 1989.
[240] STASKO, J. T., AND WEHRLI, J. F. Three-dimensional computation visual-ization. In Proceedings of the IEEE Symposium on Visual Languages (VL) (1993),IEEE Computer Society Press, pp. 100–107.
[241] STOECKLE, H., GRUNDY, J., AND HOSKING, J. Approaches to supportingsoftware visual notation exchange. In Proceedings of the IEEE Symposium onHuman Centric Computing Languages and Environments (HCC) (2003), IEEEComputer Society Press, pp. 59–66.

BIBLIOGRAPHY 189
[242] STORER, T., AND DUNCAN, I. 3D animation of Java program executionfor teaching object oriented concepts. In Proceedings of the InternationalConference on Visualisation, Imaging and Image Processing (VIIP) (2007), ACTAPress, pp. 76–81.
[243] STOREY, M.-A. D., CUBRANIC, D., AND GERMAN, D. M. On the use ofvisualization to support awareness of human activities in software develop-ment: a survey and a framework. In Proceedings of the ACM Symposium onSoftware Visualization (SOFTVIS) (2005), ACM Press, pp. 193–202.
[244] SUTHERLAND, I. E. A head-mounted three dimensional display. In Proceed-ings of the Fall Joint Computer Conference (1968), pp. 757–764.
[245] TAVANTI, M., AND LIND, M. 2D vs 3D, implications on spatial memory.In Proceedings of the IEEE Symposium on Information Visualization (INFOVIS)(2001), IEEE Computer Society Press, pp. 139–145.
[246] TELEA, A., MACCARI, A., AND RIVA, C. An open toolkit for prototypingreverse engineering visualizations. In Proceedings of the symposium on DataVisualisation (VISSYM) (2002), Eurographics Association, pp. 241–249.
[247] TESLER, J., AND STRASNICK, S. FSN: the 3D file system navigator. Tech.rep., Silicon Graphics, 1992.
[248] THE OBJECT MANAGEMENT GROUP. Unified Modeling Language (UML),version 2.1.1, 2007. http://www.omg.org/technology/documents/formal/uml.htm.
[249] THORNE, C., AND WEILEY, V. Earth’s avatar: the web augmented virtualearth. In SIGGRAPH ’03: ACM SIGGRAPH 2003 Web Graphics (2003), ACMPress, pp. 1–1.
[250] TOLLIS, I. G., BATTISTA, G. D., EADES, P., AND TAMASSIA, R. GraphDrawing: Algorithms for the Visualization of Graphs. Prentice Hall, 1998.
[251] TORY, M., AND MOLLER, T. Evaluating visualizations: Do expert reviewswork? IEEE Computer 25, 5 (2005), 8–11.
[252] TUDOREANU, M. E., WU, R., HAMILTON-TAYLOR, A., AND KRAEMER,E. Empirical evidence that algorithm animation promotes understandingof distributed algorithms. In Proceedings of the IEEE Symposium on HumanCentric Computing Languages and Environments (HCC) (2002), IEEE ComputerSociety Press, p. 236.

190 BIBLIOGRAPHY
[253] TUFTE, E. R. The visual display of quantitative information. Cheshire: GraphicsPress, 1983.
[254] VALIATI, E. R. A., PIMENTA, M. S., AND FREITAS, C. M. D. S. A taxonomyof tasks for guiding the evaluation of multidimensional visualizations. InProceedings of the AVI Workshop on BEyond time and errors: novel evaLuationmethods for Information Visualization (BELIV) (2006), ACM Press, pp. 1–6.
[255] VAN WIJK, J. J. The value of visualization. In Proceedings of the IEEEConference on Visualization (VIS) (2005), IEEE Computer Society Press, pp. 79–86.
[256] VAN WIJK, J. J., VAN HAM, F., AND VAN DE WETERING, H. Renderinghierarchical data. Communications of the ACM 46, 9 (2003), 257–263.
[257] WALSH, A. E., AND BOURGES-SEVENIER, M. Core Web 3D. Prentice Hall,2000.
[258] WARE, C. Information Visualization: Perception for Design. Morgan Kaufmann,2004.
[259] WARE, C., ARTHUR, K., AND BOOTH, K. S. Fish tank virtual reality. InProceedings of the ACM Conference on Human Factors in Computing Systems(CHI) (1993), ACM Press, pp. 37–42.
[260] WARE, C., AND FRANCK, G. Viewing a graph in a virtual reality display isthree times as good as a 2D diagram. In Proceedings of the IEEE Symposiumon Visual Languages (VL) (1994), IEEE Computer Society Press, pp. 182–183.
[261] WARE, C., AND FRANCK, G. Evaluating stereo and motion cues for visual-izing information nets in three dimensions. ACM Transactions on Graphics(TOG) 15, 2 (1996), 121–140.
[262] WARE, C., FRANCK, G., PARKHI, M., AND DUDLEY, T. Layout for visu-alizing large software structures in 3D. In Proceedings of the InternationalConference on Visual Information Systems (VISUAL) (1997), Springer Verlag,pp. 215–223.
[263] WARE, C., HUI, D., AND FRANCK, G. Visualizing object oriented softwarein three dimensions. In Proceedings of the Conference of the Centre for AdvancedStudies on Collaborative Research (CASCON) (1993), IBM Press, pp. 612–620.
[264] WEB3D CONSORTIUM. Virtual Reality Modelling Language (VRML97)specification. ISO/IEC 14772:1997, 1997. http://www.web3d.org/x3d/specifications/vrml/.
BIBLIOGRAPHY 191
[265] WEB3D CONSORTIUM. Extensible 3D (X3D) Graphics specification. ISO/IEC19775:2004, 2004. http://www.web3d.org/x3d/specifications/
x3d.
[266] WETTEL, R., AND LANZA, M. Visualizing software systems as cities. In Pro-ceedings of the International Workshop on Visualizing Software for Understandingand Analysis (VISSOFT) (2007), IEEE Computer Society Press, pp. 92–99.
[267] WIGGINS, M. An overview of program visualization tools and systems.In Proceedings of the ACM Southeast Regional Conference (1998), ACM Press,pp. 194–200.
[268] WIJK, J. J. V., AND VAN DE WETERING, H. Cushion treemaps: Visualiza-tion of hierarchical information. In Proceedings of the IEEE Symposium onInformation Visualization (INFOVIS) (1999), IEEE Computer Society Press,pp. 73–78.
[269] WINTER, A., KULLBACH, B., AND RIEDIGER, V. An overview of the GXLgraph exchange language. In Revised Lectures on Software Visualization, Inter-national Seminar (2002), Springer Verlag, pp. 324–336.
[270] WISS, U., CARR, D., AND JONSSON, H. Evaluating three-dimensional infor-mation visualization designs: A case study of three designs. In Proceedings ofthe IEEE International Conference on Information Visualisation (IV) (1998), IEEEComputer Society Press, pp. 137–144.
[271] WISS, U., AND CARR, D. A. An empirical study of task support in 3Dinformation visualizations. In Proceedings of the IEEE International Conferenceon Information Visualisation (IV) (1999), IEEE Computer Society Press, pp. 392–399.
[272] WYSSEIER, C. Interactive 3D visualization of feature-traces. Master’s thesis,University of Berne, 2005.
[273] XIE, X., POSHYVANYK, D., AND MARCUS, A. 3D visualization for conceptlocation in source code. In Proceedings of the International Conference onSoftware Engineering (ICSE) (2006), ACM Press, pp. 839–842.
[274] YOUNG, P. Three dimensional information visualisation. Tech. Rep. 12,University of Durham, 1996.
[275] YOUNG, P., AND MUNRO, M. A new view of call graphs for visualisingcode structures. Tech. Rep. 03/97, University of Durham, 1997.

192 BIBLIOGRAPHY
[276] ZHANG, K., Ed. Software Visualization: From Theory to Practice. KluwerAcademic Publishers, 2003.
[277] ZHU, N., GRUNDY, J., AND HOSKING, J. Pounamu: A meta-tool for multi-view visual language environment construction. In Proceedings of the IEEESymposium on Visual Languages - Human Centric Computing (VLHCC) (2004),IEEE Computer Society Press, pp. 254–256.
[278] ZUK, T., AND CARPENDALE, S. Theoretical analysis of uncertainty visu-alizations. In Proceedings of the Visualization and Data Analysis Conference atElectronic Imaging (2006), vol. 6060, SPIE, p. 606007.
[279] ZUK, T., SCHLESIER, L., NEUMANN, P., HANCOCK, M. S., AND CARPEN-DALE, S. Heuristics for information visualization evaluation. In Proceedingsof the AVI Workshop on BEyond time and errors: novel evaLuation methods forInformation Visualization (BELIV) (2006), pp. 1–6.