evaluating evidence on the quality of the correctional … division: compas pilot psychometric...
TRANSCRIPT

Skeem & Eno Louden, COMPAS, page 1
Assessment of Evidence on the Quality of the Correctional Offender
Management Profiling for Alternative Sanctions (COMPAS)
Prepared for the California Department of Corrections and Rehabilitation (CDCR) by:
Jennifer L. Skeem, Ph.D.
Jennifer Eno Louden, M.A.
Disclaimer: This is an independent assessment of evidence on the psychometric properties of the
COMPAS. The authors have no vested interest in commercial risk assessment products,
processes, or services. The authors‟ interpretation of evidence does not necessarily state or
reflect the views of CDCR.
Contact:
Jennifer L. Skeem, Ph.D.
Associate Professor
Psychology and Social Behavior
3311 Social Ecology II
University of California, Irvine
Irvine, California 92697-7085
Tel: (949) 824-3782 (Lab 4-1455)
Fax: (949) 824-3002
Home Page: http://www.soceco.uci.edu/faculty/skeem/
Skeem & Eno Louden, COMPAS, page 2
Table of Contents EXECUTIVE SUMMARY ....................................................................................................... 3
PART I: DESCRIPTION AND ASSESSMENT CONTEXT ................................................... 6
Describing the COMPAS ............................................................................................... 7
Understanding Research that Contextualizes the COMPAS ......................................... 9
Correctional Treatment: The Risk-Needs-Responsivity Model ........................ 9
Risk Assessment: Purposes, Principles, and Tools ............................................ 10
Distilling Desirable Properties of a Risk-Needs Tool for CDCR .................................. 12
Predicting Future Recidivism: Predictive Utility ............................................... 12
Capturing Criminogenic Needs: Construct Validity .......................................... 12
Meeting the Most Basic Requirements: Reliability ........................................... 13
PART II: SUMMARIZING & ANALYZING THE COMPAS REPORTS PROVIDED ........ 15
Northpointe Institute (2002): New York Probation Sample .......................................... 17
Risk Interpretation of Original COMPAS Scales .............................................. 17
General Psychometric Properties of Original COMPAS Scales........................ 18
Newly Developed Recidivism Risk Scales ........................................................ 19
Lin (2007): Parolee Needs in California ........................................................................ 23
Northpointe Institute (2006): California Parole Sample ................................................ 24
Description & Assessment: Issues Overlapping with New York Report .......... 24
Representativeness of Sample............................................................................ 25
PART III: CONCLUSION ........................................................................................................ 26
Summary of Strengths and Weaknesses, in Light of CDCR Needs .............................. 27
Directions for Future Research ...................................................................................... 29
REFERENCES .......................................................................................................................... 30
Skeem & Eno Louden, COMPAS, page 3
EXECUTIVE SUMMARY
Purpose
The Office of Research, Adult Research Branch of the California Department of Corrections and
Rehabilitation (CDCR) commissioned this independent assessment of evidence on the
Correctional Offender Management and Profiling Alternative Sanctions, or COMPAS. The
COMPAS is a commercially available, computerized tool designed to assess offenders‟ needs
and risk of recidivism to inform decisions regarding the placement, supervision, and case
management of offenders in community settings. The department has been using the COMPAS
to assess offenders systematically, 240 days before release to parole (virtually all offenders are
assessed), and less systematically, upon entry into the system at reception centers (only some
offenders are assessed). Ultimately, the department plans to administer the COMPAS to
offenders upon entry into the system, regularly during incarceration, and upon exit to parole.
The goal is to use the tool to summarize offenders‟ needs to guide rehabilitation programming in
prisons and on parole, and to inform decisions about release and placement of individual
offenders.
CDCR provided us with three reports to assess, two of which were produced by the developers
and marketers of the COMPAS, Northpointe Institute for Public Management, Incorporated.
Because these reports omit some methodological and analytic details, we advise readers to
interpret our attempts to extrapolate these details with caution. We could not locate peer-
reviewed or published articles on the development and psychometric properties of the COMPAS,
but obtained the COMPAS user‟s manual from a probation agency.
This report presents an assessment of current evidence on the quality of COMPAS. It is to be
distinguished from an upcoming empirical evaluation of the performance of the COMPAS,
based on CDCR data. That evaluation will be completed by investigators at the University of
California, Los Angeles (UCLA). The present assessment can inform the COMPAS evaluation
(see “Directions for Future Research,” p. 27). We strongly recommend that UCLA investigators
evaluate the utility of the existing COMPAS scales in predicting recidivism. As shown in this
report, investigations conducted to date have altered the COMPAS scales to increase the
measure‟s apparent predictive utility. This will result in “overfitting” (see p. 9) of the risk
formulas to the data, where enhanced predictive utility is more apparent than real.
Overview
In this report, we first describe the COMPAS, present principles from correctional and risk
assessment research relevant to evaluating the tool, and distill the psychometric properties that
the tool should have. Having provided this context, we next individually summarize and
evaluate each of the three reports provided. Finally, we integrate the first two sections to
evaluate the current state of evidence on the quality and utility of this tool. We conclude with
the current suitability of the COMPAS for meeting the department‟s goals, and provide
directions for further evaluation.

Skeem & Eno Louden, COMPAS, page 4
Part I: Principles for Evaluating the COMPAS
We evaluate the COMPAS in light of current research on offenders‟ risk of recidivism and
criminogenic needs, or changeable risk factors for reoffense. Much of this research is
underpinned by the “Risk-Needs-Responsivity” (Andrews, Bonta, & Hoge, 1990) model of
correctional treatment, which focuses on systematically assessing offenders‟ risk and needs,
matching the intensity of services to offenders‟ level of risk, and targeting services to focus on
reducing criminogenic needs and the likelihood of recidivism. Emphasis is placed on risk state
(an offender‟s propensity to commit an offense at a given time) rather than risk status (the
offender‟s risk of offense in comparison to other offenders). Risk state changes over time, and
in response to intervention: risk status does not.
Our review of theory and research indicates that, to be responsive to CDCR‟s needs, the
COMPAS must rest on sound evidence of:
Predictive utility: it must contain a standard scale(s) that has been shown to predict future re-
offending; its actuarial prediction formulae must be cross-validated with independent
samples; and it must emphasize criminogenic needs that predict future reoffense;
Construct validity: it must measure the criminogenic needs it purports to measure; for
example, it should relate coherently to other measures of needs and capture change in risk
state over time;
Reliability: at the most basic level, it should produce scores that are consistent over short
periods of time (test-retest reliability), different items (internal consistency within scales),
and different evaluators (interrater reliability).
Part II: Summary and Evaluation of Three Reports
Having distilled the psychometric properties the COMPAS should possess, we reviewed the
three reports provided by CDCR. In the first report, “Evaluation of reliability and validity of
COMPAS scales: New York Probation Sample (Updated with 24 month outcome study),”
Northpointe authors Brennan and Oliver (2002) analyze data on a sample of approximately 600
probationers. The authors use this sample to (a) describe the scores probationers obtained on the
scales, (b) compute actuarial formulae that maximally correlate some COMPAS items with other
COMPAS items (e.g., whether violence was part of a past offense), and (c) compute an actuarial
formula that combines some COMPAS scales with other items to maximally predict whether
these probationers had a future offense over roughly a two-year follow-up period. Although most
of the report was devoted to (a), this was the only of the three reports that provided any data on
the COMPAS‟s ability to predict future offense (c). However, the report does not indicate
whether the original scales that comprise the COMPAS actually predicted offense in the sample.
Instead, the report describe the creation of new actuarial formulae to predict recidivism in this
particular sample, leaving the questions of whether (a) these new scales now comprise the
COMPAS, or if the COMPAS still consists of the original scales, and (b) these new scales will
cross-validate in an independent sample that was not used to generate the formulae. With respect
to (b), we do not know whether the COMPAS will predict CDCR offenders‟ recidivism.

Skeem & Eno Louden, COMPAS, page 5
In the second report, Parolee Needs in California: A Descriptive Analysis of 2006 COMPAS
Data, the Center for Evidence-Based Corrections author, Jeffrey Lin (2007), uses COMPAS data
to describe parolees‟ criminogenic needs, in an effort to inform CDCR‟s rehabilitative
programming efforts. In March of 2006, parole staff began administering the COMPAS to (a)
prisoners with a new commitment who were soon to be released to parole, and (b) parole
violators with a new court sentence who had served longer than six months. Lin uses COMPAS
data collected between March and July of 2006 on this select group of 11,140 offenders to
estimate their educational, vocational, financial, and substance-related needs. The data provided
in this report are purely descriptive, and provide little information relevant to evaluating the tool.
In the third and final report, California Department of Corrections, Parole and Community
Services Division: COMPAS Pilot Psychometric Report, Northpointe authors Brennan, Dietrich,
and Oliver (2006) analyze data on 1,077 inmates that predate the much larger sample described
by Lin (2007). The authors use this sample to (a) describe the scores that these inmates obtained
on the scales, and how these scores compare with a (largely undefined) COMPAS normative
sample of 7,381 offenders, (b) correlate scores on 11 original COMPAS scales with criminal
history variables available in the CDCR database, (c) correlate the COMPAS scales with one
another, and (d) compute actuarial formulas that maximally correlate some COMPAS items with
other COMPAS items (e.g., whether violence was part of a past offense). Although there is
some data to suggest that the COMPAS scales described in this report are internally consistent (a
form of reliability), this report provides no data about the ability of the COMPAS to predict
offenders‟ future reoffense. Further, as noted in Lin‟s (2007) report, the representativeness of
the sample used in this report is questionable, given that certain groups of offenders (e.g., those
serving less than six months; those not released from these 29 CDCR institutions; those with
identified mental health or substance abuse problems) were excluded altogether from sampling.
Part III: Conclusion and Recommendations
The strengths of the COMPAS are that it appears relatively easy for professionals to apply, looks
like it assesses criminogenic needs, possesses mostly homogeneous scales, and generates reports
that describe how high an offender‟s score is on those scales, relative to other offenders in that
jurisdiction. In short, we can reliably assess something that looks like criminogenic needs and
recidivism risk with the COMPAS. The problem is that there is little evidence that this is what
the COMPAS actually assesses.
On page 27, we summarize the psychometric properties of the COMPAS, based on the three
reports reviewed. As shown in that table, available evidence provides sound support only for the
internal consistency of the COMPAS scales. There is no sound evidence that the COMPAS can
be rated consistently by different evaluators, that it assesses the criminogenic needs it purports to
assess, and (most importantly) that it predicts inmates‟ recidivism for CDCR offenders.
Given the current state of evidence, we cannot recommend that the CDCR utilize the COMPAS
with individual offenders. Although the COMPAS has a number of strengths, we strongly
believe that more research and information are needed before CDCR can rely on this tool to meet
its needs. At the conclusion of the report (pp. 28-29), we provide directions for future research,
including the UCLA evaluation of the COMPAS.

Skeem & Eno Louden, COMPAS, page 6
PART I: DESCRIPTION AND ASSESSMENT CONTEXT
Describing the COMPAS
Understanding Research that Contextualizes the COMPAS
Distilling Desirable Properties of a Risk-Needs Tool for CDCR
Skeem & Eno Louden, COMPAS, page 7
Describing the COMPAS
The Correctional Offender Management Profiling for Alternative Sanctions (COMPAS) is a tool
for assessing risk and needs for offenders in correctional settings developed by Northpointe
Institute for Public Management, Incorporated. Risk may be defined as the likelihood of re-
offending in the future. Criminogenic needs are dynamic factors that, when changed, may or
may not reduce risk of recidivism (see p. 7, below). The COMPAS assesses risk and needs to
inform decisions regarding offender release, placement and management. The description that
appears here is based primarily on the COMPAS manual by Brennan, Fretz, and Wells (2003).
The COMPAS is comprised of five types of scales: basic scales, higher order scales, validity
tests, professional judgments, and risk scales. First, the basic scales tap Criminal Behavior (five
subscales), Needs and Social Factors (eight scales), and Personality, Cognitions, and Social
Isolation (three scales). Second, the higher order scales select items from the basic scales to tap
three concepts deemed particularly relevant to reoffending: Delinquency Problems, Criminal
Opportunity, and Resources/Social Capital. Third, the two validity scales are designed to assess
when offenders respond defensively or carelessly to self report survey questions. Fourth, the
professional judgment scales are criminal justice professionals‟ subjective judgment about the
offender‟s risk. Fifth, risk scales are provided for four “outcomes:” violence, recidivism, failure
to appear, and community non-compliance.
Practically speaking, the COMPAS is software designed for easy and efficient use by such
criminal justice professionals as probation officers and parole agents. It is not clear whether
professionals are trained on the COMPAS, and how intensive that training might be. However,
agencies are permitted to select particular COMPAS scales and leave others out, depending upon
their needs and resources. COMPAS relies upon two types of data: (1) data gathered from an
offenders‟ official record by a criminal justice professional, and (2) offenders‟ responses to
questions that may be administered via either a paper and pencil survey or interview with a
professional.
These data are entered into the COMPAS software. This software appears to compute two main
variables: (1) a description of how high the offender‟s scores are across scales, relative to
normative data, and (2) an estimate of the offender‟s “risk” of violence, recidivism, FTA, and
community non-compliance (note that authors change the number and nature of risk scales over
time). First, the software collects normative data for each agency so that an offender‟s scores on
the scales can be compared with those of other offenders in that agency. Normative data simply
describe the distribution of COMPAS scores in a given sample of people to tell the user whether
the offender‟s score is low, medium, or high, compared to that group of people (COMPAS
attempts to generate deciles and quartiles to convey this information). Second, the software uses
actuarial formulas to compute “risk” scores. Specifically, statistical criteria are applied to select
variables from the COMPAS and attach weights to them to maximally postdict four “outcome”
variables. Most of these outcomes do not occur in the future. Instead, they are variables drawn
from the COMPAS itself. For example, the outcome variable for violence is a COMPAS item
that codes whether the offender‟s past offense was violent, not an independent measure of
whether a violent re-offense occurred in the future, after the COMPAS assessment. These “risk”
variables are normed for the agency and interpreted as low, medium, or high, compared to other
offenders in the agency.

Skeem & Eno Louden, COMPAS, page 8
In addition to providing normed scores across all scales, and “risk” estimates, the COMPAS
yields a case-management plan for each offender. The bases for the plan, or how the plan is
derived, are not described. The COMPAS manual lists four other uses, but they are not
described in the manual or supplementary materials: tracking criminal justice decisions, tracking
treatment and intervention, monitoring outcomes, and monitoring program implementation.
According to the materials provided by Northpointe, the COMPAS was developed based on
criminological theory and empirical research on risk and needs factors for offenders. The manual
asserts that the COMPAS was validated using a three-stage approach described by Millon
(1997), which includes initial item selection, subsequent scale development and scale refinement,
and external criterion-related validation. Although the manual does not detail the development
of the COMPAS, some relevant information is provided in the reports summarized later.

Skeem & Eno Louden, COMPAS, page 9
Understanding Research that Contextualizes the COMPAS
In this section, we summarize two bodies of research that are directly relevant to evaluating the
COMPAS. First, we provide a synopsis of the principles of effective correctional treatment,
given that the CDCR wants to use the COMPAS to improve correctional programming to reduce
recidivism. Second, we define key principles from the risk assessment literature, given that the
COMPAS may essentially be viewed as a tool for assessing and reducing risk.
Correctional Treatment: The Risk-Needs-Responsivity Model
The COMPAS appears derivative of the “Risk-Needs-Responsivity” (RNR; Andrews, Bonta, &
Hoge, 1990) model of effective correctional treatment, and assessment tools specifically
designed to support that model (Andrews & Bonta, 1995; Andrews, Bonta, & Wormith, 2004).
In this section, we define the elements of the well-validated RNR model because (a) the reader
must understand some of these elements to evaluate the COMPAS, and (b) the field‟s awareness
of empirical support for this model largely is responsible for the reintroduction of rehabilitation
efforts in corrections.
The following excerpt from Dowden and Andrews (2000, pp. 451-452, emphasis added)
describes these three principles of effective correctional treatment.
The principles of risk, need, and general responsivity answer questions
relating to the who, the what, and the how of correctional intervention.... The
risk principle states that the level of treatment services must be appropriately
matched to the risk level of the offender. More specifically, higher-risk offenders
should receive more intensive and extensive services whereas lower-risk clients
should receive minimal or no intervention. The risk principle has received some
empirical support from within both primary (Andrews and Kiessling 1980; Baird,
Heinz, and Bemus 1979; O'Donnell, Lydgate, and Fo 1979) and meta-analytic
(Andrews et al. 1990; Dowden and Andrews 1999a; Dowden 1998) studies.
The need principle focuses specifically on offender needs and classifies them into
two separate categories. The first category, criminogenic needs, are defined as
dynamic risk factors that, when changed, are associated with reduced levels of
criminal activity (Andrews and Bonta 1998; Andrews, Bonta, and Hoge 1990;
Andrews et al. 1990). Examples of criminogenic needs include antisocial
attitudes, antisocial feelings, chemical dependencies, and poor parental affective
and supervision skills. The second category, termed noncriminogenic needs, are
also dynamic, but changes in these particular need areas are not associated with
subsequent reductions in criminal activity. Examples of noncriminogenic needs
include level of self-esteem [or] focusing on vague emotional/personal problems
unrelated to criminal activity...
The need principle provides important information regarding the types of offender
needs that should be targeted within a correctional treatment program. More
specifically, the need principle states that if the end goal of treatment is
reduced recidivism, then the criminogenic needs of offenders must be
targeted. Although the need principle recognizes that targeting noncriminogenic
needs of offenders may also be important for reasons other than reducing

Skeem & Eno Louden, COMPAS, page 10
recidivism, it warns that targeting these areas should not be expected to reduce
reoffending. Therefore, when public protection is a goal of correctional
programming, programs should predominantly focus on targeting criminogenic as
opposed to noncriminogenic needs.
The third and final principle of effective correctional treatment, responsivity, has
received the least amount of attention in the research literature. This principle is
directly concerned with the characteristics of program delivery, and it states that
the styles and modes of service used within a treatment program should be
matched to the learning styles of offenders (Andrews and Bonta 1998).
The need principle bears emphasis. The effectiveness of programs is positively associated with
the number of criminogenic needs they target (i.e., dynamic risk factors for crime, like negative
peer associations), relative to noncriminogenic needs (i.e., disturbances that impinge on an
individual‟s functioning in society, like anxiety; Andrews et al., 2006). Thus, a risk-needs tool
should emphasize criminogenic needs that have been shown to predict future re-offense.
Risk Assessment: Purposes, Principles, and Tools
The COMPAS is, in large part, a risk assessment tool. In this section, we review contemporary
risk assessment principles that are directly relevant to evaluating the COMPAS.
Assessing Risk to Reduce Recidivism: The Importance of Risk State
The CDCR intends to use the COMPAS to inform programming and to monitor and reduce
individual offenders‟ risk over time. Given this purpose, it is crucial that COMPAS be sensitive
to relevant intrapersonal and contextual changes that occur during incarceration and community
supervision. In other words, the tool must capture both an offender‟s risk status and risk state
(see Douglas & Skeem, 2005). Risk status is interindividual risk level: it identifies an offender
who is at high risk of recidivism, relative to other offenders. Risk status highlights static,
unchangeable risk factors for recidivism like age of first offense and number of prior offenses.
High risk status gives professionals an idea that supervision and treatment services should be
intensive, thereby providing CDCR with the means to follow the RNR model‟s risk principle in
planning rehabilitation programs (see above). However, risk status does little to direct specific
management or intervention efforts toward meaningful targets. It also provides offenders with
little incentive to participate in programming, engage in pro-social behavior, avoid infractions,
and generally make an effort to change. A parole board cannot advise an inmate to “undo” his
past commission of an assault. They can, however, advise him to work on developing more pro-
social attitudes.
A tool must go beyond risk status to tap risk state (a) to provide offenders with such incentives,
(b) to guide risk management and reduction efforts, and (c) to permit CDCR with the means to
follow the RNR model‟s need principle in planning rehabilitation programs (see above). Risk
state is intraindividual risk level, or an individual‟s propensity to commit an offense at a given
time. Risk state highlights such dynamic risk factors as substance abuse, recognizing that even a
high risk offender’s potential for recidivism ebbs and flows over time. As noted by Dvoskin and
Heilbrun (2001, p. 8):
An individual‟s risk [state] may be seen as changing over time and in response to
interventions, as contrasted with the single, unchanging risk [status] estimate

Skeem & Eno Louden, COMPAS, page 11
yielded under the prediction model by actuarial tools that use static (unchangeable
through planned intervention) risk factors.
Leading risk assessment tools have been shown to overlap in tapping such static factors as
criminal history and problematic personality traits (Kroner, Mills, & Reddon, 2005), and they
possess similar levels of predictive utility (e.g., Douglas & Webster, 1999; Grann, Belfrage, &
Tengstrom, 2000; Kroner & Mills, 2001). To be responsive to CDCR’s needs, the COMPAS
must be capable of capturing change in risk state over time. To do so, the tool must
emphasize dynamic risk factors, also known as criminogenic needs. Any actuarial formulas
must include such factors to capture risk state. To the extent that the COMPAS meets this goal,
it’s classification as a risk assessment tool that can guide supervision is justified (see Andrews,
Bonta, & Wormith, 2006).
Classifying the COMPAS: Basic Types of Risk Assessment Tools
Research robustly indicates that unstructured clinical risk assessments are less accurate than
those that rely upon assessment tools (e.g., Grove & Meehl, 1996). Two basic types of risk
assessment tools have been shown to improve accuracy: actuarial tools and structured
professional judgment (SPJ) tools. SPJ tools focus the evaluators‟ attention on a set of risk
factors that have been shown empirically to relate to recidivism. Evaluators use their judgment
to make final risk decisions of low, moderate, or high for recidivism. Actuarial tools make
decisions mechanically, in the tradition of predicting insurance hazards or tornadoes. Ideally,
information is routinely collected on variables that may predict recidivism, based on a very large
sample of offenders. That information is analyzed statistically using regression-based actuarial
risk assessment models. Items are statistically selected and weighted in a formula that will
optimize the prediction of recidivism in that sample.
It is important to note two things about actuarial tools. First, although these tools could, in
theory, include dynamic risk factors, extant actuarial measures heavily weight static
variables. Second, it is crucial to cross-validate actuarial tools in independent samples.
These actuarial formulas are developed in a manner that will tightly fit (“over fit”) the sample in
which they are developed. The formulas are constructed based on associations between variables
in that particular sample - including chance or error associations - and are apt to lose predictive
power when applied to new samples (Monahan et al., 2005). In other words, the accuracy of the
tool is overestimated in the derivation sample, and prediction error will be underestimated. It is
necessary to determine whether the formula developed in one sample actually generalizes to, and
“works” in, another sample.
The COMPAS is a complex tool that is difficult to classify. First, it has five types of scales and
numerous items, but only a small number of scales and items seem to contribute to risk
estimates. Second, because agencies are allowed to select or omit particular COMPAS scales,
this tool has no standard structure. Leading risk/needs tools have a standard structure and yield
scores that easily can be assessed in independent investigations for predictive utility.
Despite these complications, the chief risk assessment scales of the COMPAS are actuarial.
The COMPAS shares some features of the SPJ approach, including logical item selection and the
inclusion of structured professional judgment scales. However, the available reports cast these
judgments as variables eligible for inclusion in actuarial formulas (see pp. 18-19), rather than
final products of the risk assessment process.

Skeem & Eno Louden, COMPAS, page 12
Distilling Desirable Properties of a Risk-Needs Tool for CDCR
There are a number of properties a risk/needs tool should have, to meet the needs articulated by
CDCR. These include predictive utility, construct validity, and reliability. Each feature is
defined here.
Predicting Future Recidivism: Predictive Utility
The form of validity that dominates the risk assessment enterprise is predictive utility. The
COMPAS must have sound evidence that it predicts future re-offending. Given the parole
release context, the most relevant forms of re-offense include violent recidivism, general
recidivism, and technical violations. If CDCR is interested in using the tool for institutional
placement, the COMPAS should also predict institutional violence and other forms of
infractions.
In evaluating the predictive utility of the COMPAS, two elements are particularly important.
First, the COMPAS should generate a standard score that can be evaluated across studies
as the “predictor.” Second, because a risk assessment tool is only as good as the criterion
against which it is validated (Thorndike, 1949), the outcome variable of recidivism must be
measured in the future. Although some risk assessment studies involve “postdicting” offenses
that occurred prior to the risk assessment, they provide little evidence of a measure‟s predictive
utility. Prediction infinitely is more difficult than postdiction, largely because measuring the
criterion retrospectively can contaminate the criterion and inflate postdiction estimates. Criterion
contamination is exacerbated when the criterion is drawn from the risk assessment tool itself.
Here, the predictor and criterion share method variance: they will be correlated because they
both were measured by the same rater(s), using the same source(s) of information. In essence,
the investigator may be viewed as correlating something (e.g., whether an index offense was
violent) with itself (e.g., other aspects of the index offense and larger criminal history).
To interpret the estimates of the COMPAS‟ postdictive and predictive utility, the reader should
have a conceptual understanding of the statistic most often used, and how it compares with other
leading risk assessment tools. The Area Under the Curve (AUC) describes the chance that a
randomly selected offender who reoffends will obtain a higher score on a risk assessment tool
than a randomly selected offender who does not reoffend. True studies of predictive utility
involving prospective designs and (when relevant) cross-validation samples suggest that leading
risk assessment tools are moderately effective in predicting recidivism, with estimates generally
hovering at hovering at AUC .70 (see Glover, Nicholson, Hemmati, Bernfeld, & Quinsey,
2002; Kroner & Mills, 2005).
Note that the COMPAS has validity scales that are designed to detect when offenders are
distorting their responses. These scales can be evaluated for their utility in predicting whether an
individual is, or is not, distorting responses. Typically, this is done in an experimental design
because it is difficult to determine when offenders are dissimulating.
Capturing Criminogenic Need: Construct Validity
The overriding concern for predictive utility is the degree of successful prediction of recidivism,
regardless of whether one can explain the process that led to the reoffense. If one found that
accuracy in playing street dice correlated highly with reoffense, street dice accuracy would be a

Skeem & Eno Louden, COMPAS, page 13
valid measure for predicting recidivism (see Nunnally, 1978). Predictive utility in a risk
assessment tool will allow the CDCR to follow the risk principle in the RNR model. However,
CDCR wishes to go beyond matching high intensity services to high-risk offenders. The
department also wishes to develop programs that will reduce risk.
To achieve this end, CDCR must use a tool that captures criminogenic needs or dynamic risk
factors for re-offense. The COMPAS must have evidence of construct validity, or evidence
that it measures the criminogenic needs it purports to measure. Construct validity can be
inferred through logical analysis, internal structure analysis, and cross-structure analysis
(Pedhazer & Schmelkin, 1991), each of which is defined below.
Logical analysis involves the selection of items on the COMPAS and the manner in which they
are scored and combined. One may analyze the content of the COMPAS to determine how well
its item content comports with the abstract concepts, or constructs they are designed to measure.
Do the items on the „substance abuse‟ scale comport with the literature on that particular
criminogenic need? One may also assess the extent to which scores obtained may be due to the
measurement procedure used. Does an offender obtain a particular decile score because of the
scaling procedure used?
Internal structure analysis involves determining whether there is correspondence between the
structure of a set of items and the constructs they are said to reflect. One can use confirmatory
factor analytic techniques to test (a) whether the relationships among items selected for the
COMPAS can be explained by the scales they are supposed to reflect, and (b) whether the items
on each of those scales measure the same construct. The latter point is about whether the scales
actually “hang together,” or are homogeneous. It makes little sense to combine a set of
heterogeneous items into a scale because they cannot be measuring the same thing.
Cross-structure analysis is a necessary, and relatively demanding, condition for construct
validity. Finding that the items on a scale are homogeneous does not preclude the possibility that
the single construct being measured is different than the one the investigator meant to tap.
Cross-structure analysis involves examining the relationship between the COMPAS and external
measures of theoretically related constructs. First, there must be evidence of convergent
validity: measures of the same construct obtained through different methods or measures should
correlate with one another. For example, the COMPAS substance abuse scale should converge
with clinicians‟ independent diagnoses of substance abuse disorders. Second, there must be
evidence of discriminant validity: there should be divergence in measures or methods designed
to measure different constructs. For example, COMPAS self report measures of criminogenic
thinking should not be so highly correlated with self report measures of antisocial personality as
to raise doubt about whether distinct criminogenic needs are being assessed.
An important aspect of assessing the construct validity of scales designed to assess criminogenic
need involves determining whether (a) offenders’ scores on these scales change over time,
and (b) whether those changes shift the offenders’ risk of recidivism (see Douglas & Skeem,
2005). These features, in conjunction with those listed above, would provide strong evidence
that the concepts being measured were, in fact, criminogenic needs.
Meeting the Most Basic Requirements: Reliability
Reliability, or low measurement error, is the most basic requirement for a risk assessment tool.
A tool must be reliable to be valid; but the reverse is not true. One can reliably measure

Skeem & Eno Louden, COMPAS, page 14
something other than the criminogenic needs intended, and one can reliably assess something
that does not predict future recidivism. Three forms of reliability are particularly relevant to
assessing the COMPAS: test-retest, internal consistency, and interrater reliability.
Test-retest reliability indicates that an offender is likely to obtain similar scores on the
COMPAS when tested at two different time points. COMPAS scores should be stable over the
short term (i.e., reliable over 6-8 weeks), but not over longer periods of time. As noted earlier, if
the COMPAS assesses criminogenic needs, scores should change over time.
Internal consistency reliability indicates that the items on a given COMPAS scale are
homogeneous. The coefficient alpha often is used to assess internal consistency on scales.
Alpha ranges from 0 to 1.0. Generally, values of .70 and greater may be considered appropriate
for measures that will be applied to make important decisions about offenders (see Pedhazur &
Schmelkin, 1991). It is important to note two things about internal consistency. First, even if the
correlations among items is weak, alpha can be large if the number of items on a scale is large.
Second, a scale that is unidimensional is often interally consistent. However, a scale can be
internally consistent but not unidimensional. To test for dimensionality, internal structure
analyses (see above) or the DIMtest (see Stout, 1987) are required.
Interrater reliability indicates that one criminal justice professional will score an offender on
the COMPAS similarly to another criminal justice professional. It is important to ensure that an
offender‟s score is a function of his or her “true” scores on the COMPAS, rather than the
particular criminal justice professional selected. Interrater reliability is assessed by having the
same offenders rated by different criminal justice professionals, and then assessing their
agreement on offenders‟ COMPAS scores. A variety of statistics (kappa, intraclass correlation)
can be used to do so.

Skeem & Eno Louden, COMPAS, page 15
PART II: SUMMARIZING & ANALYZING THE
COMPAS REPORTS PROVIDED
Northpointe Institute (2002): New York Probation Sample
Lin (2007): Parolee Needs in California
Northpointe Institute (2006): California Parole Sample

Skeem & Eno Louden, COMPAS, page 16
General Overview
We could not locate any peer-reviewed, published articles on development and psychometric
properties of the COMPAS. CDCR provided the authors with three reports, two of which were
produced by the developers and marketers of the COMPAS, Northpointe Institute for Public
Management, Incorporated. We were unable to obtain further information to clarify some
methodological and analytic details. When note when these details are uncertain, and advise
readers to interpret our attempts to extrapolate these details with caution.
CDCR provided us with three reports for this evaluation. In the first report, “Evaluation of
reliability and validity of COMPAS scales: New York Probation Sample (Updated with 24 month
outcome study),” Northpointe authors Brennan and Oliver (2002) (a) present data that describe
the COMPAS scores of a sample of New York probationers and (b) develop an actuarial formula
to predict these probationers‟ future recidivism, using the COMPAS and other variables. In the
second report, “Parolee needs in California: A descriptive analysis of 2006 COMPAS data,”
UCI‟s Center for Evidence-Based Corrections author Lin (2007) presents descriptive data based
on a sample of CDCR inmates who completed the COMPAS in late 2006. The goal was to
distill needs to inform CDCR‟s rehabilitation programming efforts. In the third report,
“California Department of Corrections, Parole, and Community Services Division: COMPAS
pilot psychometric report,” Northpointe authors Brennan, Dietrich, and Oliver (2006) describe
the COMPAS scores of a sample of CDCR offenders. Each of these reports is summarized in
detail in this section.

Skeem & Eno Louden, COMPAS, page 17
Northpointe Institute (2002): New York Probation Sample
Overview
In the first report, “Evaluation of reliability and validity of COMPAS scales: New York
Probation Sample (Updated with 24 month outcome study),” Northpointe authors Brennan and
Oliver (2002) analyze data on a sample of approximately 600 probationers. The authors use this
sample to (a) describe the scores probationers obtained on the scales, (b) compute actuarial
formulas that maximally correlate some COMPAS items with other COMPAS items (e.g.,
whether violence was part of a past offense), and (c) compute an actuarial formula that combines
some COMPAS scales with other items to maximally predict whether these probationers had a
future offense over roughly a two-year follow-up period.
Of the three reports, this report is the only one that provides information on “c” above, the
predictive utility of the COMPAS. However, the bulk of the report is dedicated to “a,” above,
describing the pattern of probationers‟ scores. Specifically, a description is provided
individually for each of 18 COMPAS scales, in nearly identical format. First, a short sketch of
the scale is provided and linked with some criminological literature suggesting that it relates to
recidivism. Second, the scale‟s items are described and listed in a table. Third, the scale‟s items
are subjected to a principal components analysis (a form of factor analysis) that draws out three
components to reflect their associations with one another. Typically, the scale is asserted to be
dimensional because the first component is large, relative to the others. Fourth, the scale‟s
reliability is presented in terms of a coefficient alpha. Fifth, basic statistics that describe how the
sample scored on the scale are presented, and the distribution is cut into ten groups or “deciles,”
as well as larger “quartiles.”
Risk Interpretation of Original COMPAS Scales
The authors suggest these deciles, which are simple normative scores, be interpreted in terms of
“risk,” with 1-4 as low risk, 5-7 as medium risk, and 8 or higher as high risk. As noted on p. 9
(Brennan & Oliver, 2002), the score of 8 or more “indicates that the offender has a high degree
of risk for that construct, and is at the eighty percent level.” Although the authors sometimes
issue caveats (e.g., p. 14), such risk-related interpretations are problematic for the original
COMPAS scale scores because:
(a) There is no evidence that the original COMPAS Basic Scales, Higher Order Scales, or
Risk Scales predict recidivism. These scores merely describe how a given offender
scored, relative to other offenders, on a scale meant to assess needs or to relate to specific
aspects of past offenses (e.g., whether the offense was violent). The only data relevant to
risk of future offense are described in Section 8, and involve newly developed actuarial
scales that include pieces of the COMPAS, along with other variables. These scales are
discussed later.
(b) The “deciles” for COMPAS scales are actually ordinal rather than continuous ones, and
(c) Point predictions about individual offenders (e.g., this client scored in a category with an
“80% risk”) often are inaccurate. This is true of even well-validated actuarial assessment
tools. Tools that estimate risk based on population-averaged estimates often are
uninformative in predicting whether a specific individual will recidivate (see Hart,
Michie, & Cooke, 2007).
Skeem & Eno Louden, COMPAS, page 18
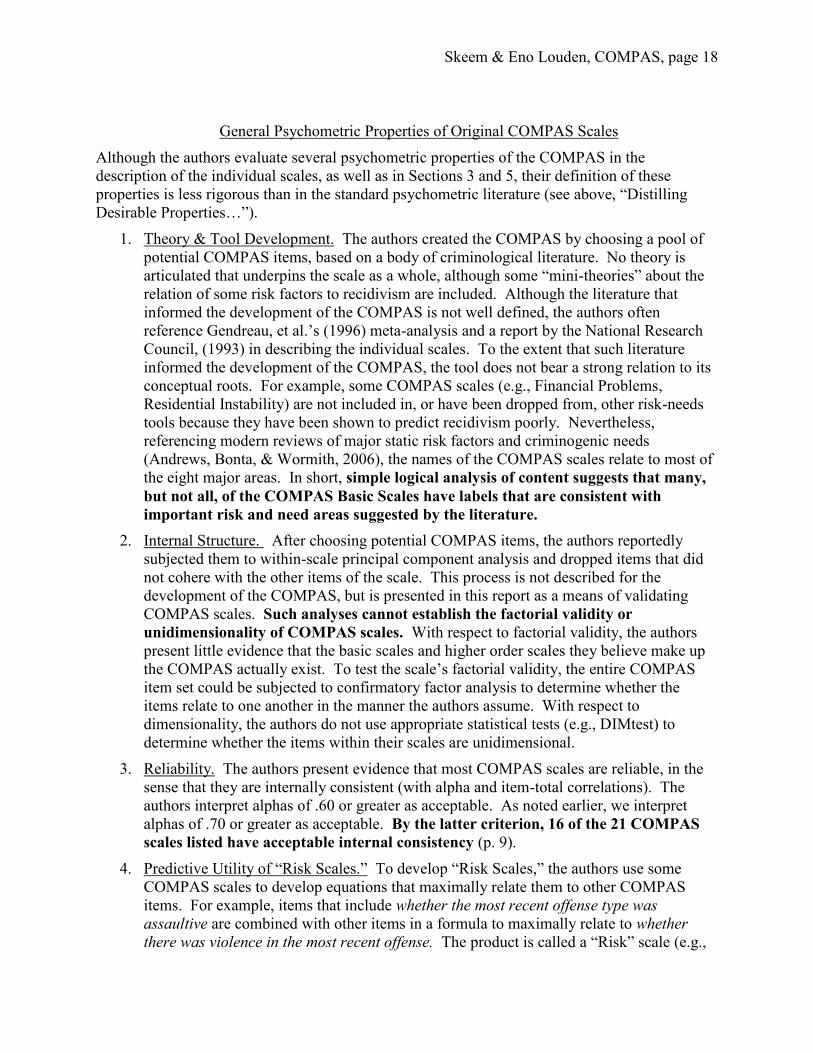
General Psychometric Properties of Original COMPAS Scales
Although the authors evaluate several psychometric properties of the COMPAS in the
description of the individual scales, as well as in Sections 3 and 5, their definition of these
properties is less rigorous than in the standard psychometric literature (see above, “Distilling
Desirable Properties…”).
1. Theory & Tool Development. The authors created the COMPAS by choosing a pool of
potential COMPAS items, based on a body of criminological literature. No theory is
articulated that underpins the scale as a whole, although some “mini-theories” about the
relation of some risk factors to recidivism are included. Although the literature that
informed the development of the COMPAS is not well defined, the authors often
reference Gendreau, et al.‟s (1996) meta-analysis and a report by the National Research
Council, (1993) in describing the individual scales. To the extent that such literature
informed the development of the COMPAS, the tool does not bear a strong relation to its
conceptual roots. For example, some COMPAS scales (e.g., Financial Problems,
Residential Instability) are not included in, or have been dropped from, other risk-needs
tools because they have been shown to predict recidivism poorly. Nevertheless,
referencing modern reviews of major static risk factors and criminogenic needs
(Andrews, Bonta, & Wormith, 2006), the names of the COMPAS scales relate to most of
the eight major areas. In short, simple logical analysis of content suggests that many,
but not all, of the COMPAS Basic Scales have labels that are consistent with
important risk and need areas suggested by the literature.
2. Internal Structure. After choosing potential COMPAS items, the authors reportedly
subjected them to within-scale principal component analysis and dropped items that did
not cohere with the other items of the scale. This process is not described for the
development of the COMPAS, but is presented in this report as a means of validating
COMPAS scales. Such analyses cannot establish the factorial validity or
unidimensionality of COMPAS scales. With respect to factorial validity, the authors
present little evidence that the basic scales and higher order scales they believe make up
the COMPAS actually exist. To test the scale‟s factorial validity, the entire COMPAS
item set could be subjected to confirmatory factor analysis to determine whether the
items relate to one another in the manner the authors assume. With respect to
dimensionality, the authors do not use appropriate statistical tests (e.g., DIMtest) to
determine whether the items within their scales are unidimensional.
3. Reliability. The authors present evidence that most COMPAS scales are reliable, in the
sense that they are internally consistent (with alpha and item-total correlations). The
authors interpret alphas of .60 or greater as acceptable. As noted earlier, we interpret
alphas of .70 or greater as acceptable. By the latter criterion, 16 of the 21 COMPAS
scales listed have acceptable internal consistency (p. 9).
4. Predictive Utility of “Risk Scales.” To develop “Risk Scales,” the authors use some
COMPAS scales to develop equations that maximally relate them to other COMPAS
items. For example, items that include whether the most recent offense type was
assaultive are combined with other items in a formula to maximally relate to whether
there was violence in the most recent offense. The product is called a “Risk” scale (e.g.,
Skeem & Eno Louden, COMPAS, page 19
Risk-Violence). The process for developing these actuarial formulas is not detailed,
including which COMPAS variables were entered into the analyses, what statistical
method was used to generate the equation, and what sample of offenders was used to
develop the formula. With respect to the latter point, it is critical to know whether these
“risk” formulas were derived from an overall COMPAS sample, or were derived
specifically for this New York sample of probationers. A comparison of the variables
included in the Risk-Violence scale for Northpointe‟s New York (Table 75, p. 62) and
California (Table 8.20.4, p. 155) reports suggests that the authors change the scales over
time. As noted earlier, this introduces problems for validating the scale. It may also
exacerbate problems with overfitting, inflating estimates of accuracy (AUC= .71-.82, p.
13). More fundamentally, the label of “Risk Scale” is misleading. Without assessing
something external to the COMPAS, one cannot provide evidence of “external criterion
validation.” Given issues of criterion contamination reviewed earlier, the available
data provide no evidence that the original COMPAS Risk Scales predict reoffending
of any sort (including Violence, FTA, and CNC).
5. Construct Validity. The authors examine the pattern of correlations among the COMPAS
scales and assert that the pattern provides some evidence of construct validity. The
authors do not comprehensively examine the convergent and discriminant validity of
COMPAS. For example, they could use validated measures of substance abuse (e.g., the
SASSI) to determine whether they correlated more strongly with COMPAS substance-
related scales than non-substance related scales. They could use measures of
psychopathy (e.g., the PCL-R) to determine whether it relates as expected to such
COMPAS scales as “Criminal Personality.” They could use a leading risk-needs tool
(e.g., the LSI-R) to determine whether the COMPAS scales relate as they should to the
individual scales of that measure. However, the authors do not include any external,
validated measures to examine the construct validity of COMPAS.
6. Validity Scales. Recall that two COMPAS scales are designed to assess whether
offenders respond to the self report sections of the measure in a manner that is biased (Lie
Scale) or careless (Random Responding). The authors compare probationers‟ responses
with responses generated at random by a simulation program. Although this provides
evidence that the COMPAS is sensitive to careless responding, there is no evidence
that the measure can detect when offenders consciously distort their responses (e.g.,
“fake good,” or minimize their problems).
Newly Developed Recidivism Risk Scales
Description
Genuine outcome data on recidivism are described only in the final section of this report (Section
8, pp. 79-92) for a subsample of probationers. Arguably, this is the most crucial information
provided in this report or any other report provided as part of the present evaluation. The
subsample of New York probationers were followed for about two years after their COMPAS
assessments to determine whether a new crime occurred during that period. Although the
criterion variable is not precisely defined, it appears to reference whether the probationer was
arrested during the follow-up. The subsample includes 375 offenders (of nearly 600 in the larger
sample) who had some access to the community during that two year period.

Skeem & Eno Louden, COMPAS, page 20
The authors do not report tests of whether the original COMPAS scales predict
probationers’ recidivism. For example, they do not test whether the COMPAS Risk-CNC
scale, which is meant to convey risk of probation revocation, actually predicts new crimes.
Instead, the authors use the New York data to create several new actuarial formulas for
predicting these probationers’ recidivism. Rather than relying on the original COMPAS
scales to generate these new formulas, the authors include external variables from the New York
dataset (e.g., “age at first arrest”), and newly created scales, to do so.
The authors describe a multi-stage process for developing the “COMPAS Recidivism Risk
Scales,” which are three scales that each predict the same outcome (new arrest), but use different
sets of predictor variables to do so. First, the authors identify variables that maximally predict
new arrests. Although they indicate that both empirical and theoretical concerns drove their
selection of variables, the specific selection process is not described. To the extent that the
authors relied upon correlations apparent in their data to select variables, this will exacerbate
issues of over-fitting (see above, p. 9). Four sets of variables are selected that maximally predict
new arrests:
1. Three Non-COMPAS variables available in the New York dataset.
Age at sentencing, which predicts recidivism at r= -.18.
Age at first arrest, which predicts recidivism at r=-.28
Arrest rate, which predicts recidivism at r= .29
2. One newly created Drug Problems scale, which is described for the first time in this section
(p. 83). The authors do not describe how this scale was developed, including whether it
contains only COMPAS items. The scale involves summing 7 items. This scale was
probably needed because the original COMPAS Substance Abuse scale did not predict
recidivism (r= .03, see Table 95). The newly created Drug Problems scale predicts
recidivism at r= .22.
3. One apparently newly created Professional Judgments scale, which is described for the first
time in this section (p. 83). To create this scale, the authors average 7 COMPAS items
reflecting the screeners‟ ratings of the likelihood of various negative outcomes into a single
scale. This scale predicts recidivism at r= .34.
4. The original COMPAS Basic Scales (16 of 16) and Higher Order Scales (2 of 3). As shown
in Table 95 (p. 85), the majority of these scales (10 of 18) weakly predict recidivism (r <
.15). In fact, only 11% of the original COMPAS scales predicted recidivism strongly enough
to be included in the final Recidivism Risk Scales: Criminal Involvement (r= .20) and
Vocational Educational (r= .22), and even these correlations are limited.
After identifying these four sets of variables that relate to recidivism, the authors grouped them
into three “candidate sets” of predictors and ran three logistic regressions to create actuarial
formulas to predict new arrests. These Candidate sets were as follow:
Candidate Set A: New York variables (#1 above) + original COMPAS scales (#4 above).
Candidate Set B: New York variables (#1 above) + the new Drug Problems scale (#2
above) + some number of COMPAS scales and items that maximally predicted
recidivism (unspecified).

Skeem & Eno Louden, COMPAS, page 21
Candidate Set C: New York variables (#1 above) + the new Drug Problems scale (#2
above) + some number of COMPAS scales and items that maximally predicted
recidivism (unspecified) + the new Professional Judgments scale (#3 above). Note that
the latter scale often was missing, so analyses with Candidate Set C involved only 255
offenders.
Next, the authors present the predictive utility of the models they created, using Area Under the
Curve (AUC) estimates. Because the authors do not cross-validate their model, they attempt to
correct for overfitting with bootstrap validation. The resulting AUC figures are .70, .72, and .72
for Candidate Set A, B, and C, respectively. First, there is essentially no difference in the
predictive utility of these different variable sets. Second, these figures are comparable to those
often reported for leading risk assessment tools (AUC .70). In essence, the results mean there
is a 72% chance that a randomly selected recidivating probationer will obtain a higher score on
Actuarial Formula B than a randomly selected non-recidivating probationer.
In the COMPAS tradition, the authors conclude by explaining how to compute scores for
Actuarial Formula B and transform them into decile and quartile descriptions, based on the New
York probationers‟ distribution of scores.
Assessment
There are two fundamental issues with this presentation of evidence for the COMPAS‟
predictive utility.
1. What is the COMPAS? The authors do not report the predictive utility of the original
COMPAS Risk Scales. The authors also do not use only the original COMPAS scales to
develop a new formula to predict recidivism. Given that the majority of the COMPAS Basic
Scales and Higher Order Scales do not predict recidivism (see Table 95), we suspect that the
predictive utility of such a COMPAS-based formula would be limited.
The authors have shown that relatively small pieces of the COMPAS can be combined with
other information to predict recidivism. To score their new, Actuarial Formula B, we would
not administer the full COMPAS. Instead, we would administer only 2 of its 19 original
scales (Criminal Involvement and Vocational Educational), administer its newly created
Drug Problems scale, and collect basic information about age at first arrest, age at
sentencing, and arrest rate. This raises a question about what the COMPAS is, as a risk-needs
tool.
In short, it is unclear whether these new scales and formulas should be regarded as “the
COMPAS.” Leading risk assessment (e.g., VRAG, HCR-20) and risk-needs assessment
(e.g., the LSI-R) tools include a set number of items, a standard format for scoring those
items, and a single total score that can be evaluated for predictive utility across sites by
independent investigators. New formulas that combine select pieces of the original
instrument with other variables are not generated and regenerated, largely because this would
raise questions about (a) the instrument (e.g., What is the tool?), and (b) its generalizability to
various groups of offenders.
2. Will the results generalize to other samples? Because the authors do not cross-validate
their newly created scales, there is significant risk of overestimating their accuracy (see
above, p. 9). Although the authors used bootstrapping techniques in an effort to address this
problem, this cannot substitute for genuine cross-validation. For example, the COVR

Skeem & Eno Louden, COMPAS, page 22
showed strong bootstrap-corrected estimates of accuracy in predicting violence in the
derivation sample (AUC= .88; Banks et al., 2004), but this estimate shrunk considerably on
cross validation in a new sample (AUC=.70, or .63, depending on the criterion selected;
Monahan et al., 2005).
Typically, actuarial formulas are generated in samples of thousands of individuals. The
present formulas were developed with fewer than 400 offenders. This greatly increases the
risk that the formula will not generalize to other samples (see Hart et al., 2007). The authors
acknowledge this limitation.
It is particularly important to note that it is unclear whether the formulas will generalize
from this New York sample of probationers to other samples of offenders. Prisoners
were excluded from the authors‟ analyses. To the extent that the predictors of recidivism
differ across groups, these formulas may not work in some of CDCR‟s primary populations
of interest (e.g., inmates, parolees). Given how actuarial formulas are derived and issues of
over-fitting, it is necessary to cross-validate actuarial formulas with a sample of individuals
from the population of interest.

Skeem & Eno Louden, COMPAS, page 23
Lin (2007): Parolee Needs in California
Description
In the second report, Parolee Needs in California: A Descriptive Analysis of 2006 COMPAS
Data, the Center for Evidence-Based Corrections author, Jeffrey Lin (2007), uses COMPAS data
to describe parolees‟ criminogenic needs, in an effort to inform CDCR‟s rehabilitative
programming efforts. In March of 2006, parole staff began administering the COMPAS to (a)
prisoners with a new commitment who were soon to be released to parole, and (b) parole
violators with a new court sentence who had served longer than six months. Lin uses COMPAS
data collected between March and July of 2006 on this select group of 11,140 offenders to
estimate their educational, vocational, financial, and substance-related needs. He does so by
presenting simple descriptive statistics on COMPAS items (not scales) in these need domains.
As shown in Tables 2, 3, and 4 (pp. 12, 13, and 15), the results reflect a CDCR population with
limited education, limited job training or experience, and frequent substance abuse. For
example, only 56% of inmates said they graduated high school or received a GED, and 67% felt
that they needed more job training or a new career skill, and 36% and 17% said they thought
they would benefit from drug treatment or alcohol treatment, respectively. Only a small
proportion of inmates were obtaining services to address such needs. For example, only 14% of
inmates were currently enrolled in treatment for alcohol or drugs. Typically, those receiving
services had characteristics suggesting a lower risk for recidivism (e.g., more likely to be female,
and older) than those who were not receiving such services. This contradicts the RNR Risk
principle of effective correctional treatment (see above, p. 7).
Assessment
Lin observes that the COMPAS represents the first time that CDCR has used a tool to
systematically assess risk and needs among inmates. As such, it is a „welcome improvement.‟
However, Lin notes that the CDCR COMPAS data are “seriously biased” (p. 5) and notes that
the measure omits some crucial variables for analyses (p. 19), like age at first commitment and
number of prior offenses (variables that should be included in the CDCR COMPAS database,
given that Northpointe pulled them from the New York probation database to build new formulas
to predict recidivism)..
As Lin notes, the COMPAS data described in this report cannot be viewed as representative of
the CDCR population of inmates. He estimates that the 2006 data represent fewer than 1 in 3
CDCR releases (31%, p. 7). Several groups of inmates with potentially greater needs were not
assessed, using the COMPAS. For example, inmates with a mental health classification (EOP or
CCCMS) and inmates targeted for the State‟s Substance Abuse Program were among eight
groups who were not included in the CDCR COMPAS sample.
Also as noted by Lin, although the portrait of CDCR inmates presented here is one of needy
offenders, it is not clear how these offenders compare to offenders in other states. Moreover, the
data are largely based on offenders‟ self-report, and there is no protection against reporting
bias, including exaggeration or minimization of needs.
Finally, these data are purely descriptive. They provide no information on the reliability,
construct validity, or predictive utility of the COMPAS.
Skeem & Eno Louden, COMPAS, page 24
Northpointe Institute (2006): California Parole Sample
Overview
In the third report, California Department of Corrections, Parole and Community Services
Division: COMPAS Pilot Psychometric Report, Northpointe authors Brennan, Dietrich, and
Oliver (2006) analyze data on 1,077 inmates that predate the much larger sample described by
Lin (2007). The authors use this sample to (a) describe the scores that these inmates obtained on
the scales, and how these scores compare with a (largely undefined) COMPAS normative sample
of 7,381 offenders, (b) correlate scores on 11 original COMPAS scales with criminal history
variables available in the CDCR database, (c) correlate the COMPAS scales with one another,
and (d) compute actuarial formulas that maximally correlate some COMPAS items with other
COMPAS items (e.g., whether violence was part of a past offense). No data on the predictive
utility of the COMPAS are provided.
Description and Assessment: Issues Overlapping with New York Report
The opening material in, and format of, this report are highly similar to that of the report
provided on the New York probation data. Thus, many of the principles reviewed in detail above
apply to the California data, and will not be detailed here. We note briefly that:
The authors present evidence that many COMPAS scales are reliable, in the sense that
they are internally consistent. In this CDCR sample, 13 of the 20 COMPAS scales listed
have acceptable internal consistency (p. 18).
The bulk of the report focuses on the simple distribution of scores among offenders. The
authors demonstrate that the CDCR sample obtains scores that generally are
comparable to those of offenders in their data store. The fact that CDCR inmates
sometimes obtain higher scores makes sense, as they are deeper end offenders than most
of the offenders in the authors‟ data store (e.g., probationers).
The analyses presented cannot establish the factorial validity or unidimensionality of
COMPAS scales;
The authors do not include any external, validated assessment tools to examine the
construct validity of the COMPAS. The association among the COMPAS scales
themselves provide only limited evidence of convergent and discriminant validity.
Although there is evidence that the COMPAS is sensitive to careless responding, no data
are provided to support the assumption that the measure can detect offenders‟
exaggeration or minimization of risk and needs.
Finally, and perhaps more importantly, the data presented for CDCR provide no evidence that
COMPAS Risk Scales predict reoffending in this sample. For the reasons noted earlier
(criterion contamination), the fact that some COMPAS Scales correlate with indices of past
offending (e.g., see p. 28) provides little compelling evidence of predictive utility. Moreover,
many of these correlations are weak. For example, of the 11 COMPAS scales, the Substance
Abuse scale is the one maximally correlated with past probation revocation, at only r= .19.
Also for the reasons noted earlier, risk-related interpretations of decile scores are misleading
for COMPAS Risk Scale scores, given the lack of cross-validated evidence that they predict
the future behavior of interest (see pp. 19-20). For example, the Risk Potential for Failure to

Skeem & Eno Louden, COMPAS, page 25
Appear Scale uses 22 COMPAS items to develop a formula that maximally relates to another
COMPAS item on whether the offender has ever failed to appear to court on time in the past.
In this report, the authors repeat the description of developing the Risk Scale(s) for Recidivism,
with the sample of about 400 New York probationers. It appears that the authors ultimately
chose “Candidate Set B” to represent this scale (bootstrapped AUC= .72). The scale was not
cross-validated, and no data on the predictive utility of this formula for CDCR inmates are
provided.
Notably, the authors introduce a new “Risk Scale for Technical Violations” here, based on the
single New York sample of about 300 probationers, described earlier. It appears that the authors
were able to access the new criterion of technical violations from New York State. In the
construction sample, the accuracy of this formula was somewhat limited (bootstrapped
AUC=.67). The formula is not cross-validated, and no data on the predictive utility of this
formula for CDCR inmates are provided.
Finally, the authors present a “Risk Matrix” for CDCR, based on the distribution of this sample
of 1,077 inmates on their “Risk of Violence” and “Risk of Recidivism” scores. The matrix is
meant to classify offenders into four risk levels (low to high). No data on the validity of this
matrix in predicting re-offending is provided. The Risk of Violence scale rests on no evidence of
predictive utility. The Risk of Recidivism scale was developed on a single sample of 300
probationers and has not been crossvalidated. For these reasons, whether and how this Risk
Matrix will relate to risk is unclear.
Representativeness of the Sample
Given Lin‟s (2007) concerns about the representativeness of his larger sample, it is important to
examine this smaller set of 1, 077 CDCR inmates. These inmates were assessed in 29 CDCR
facilities between July 2005 and October 2005. It appears that these inmates included the two
groups of inmates in Lin‟s (2007) report, that is, (a) prisoners with a new commitment who were
soon to be released to parole, and (b) parole violators with a new court sentence who had served
longer than six months. These authors added a third group, however: parole violators who were
returned to custody. Recall that Lin (2007) estimated that a similar sample was “seriously
biased,” representing less than 1 in 3 inmates who would be released from CDCR. In this pilot,
Northpointe used a sampling and weighting strategy that may reduce, but not eliminate, bias. It
appears that certain groups of offenders (e.g., those serving less than six months; those not
released from these 29 CDCR institutions; those with identified mental health or substance abuse
problems) were excluded altogether from sampling (see Lin, 2007, Figure 2, p. 8). Moreover, of
those in the Northpointe pilot sampling frame, only two-thirds (68%) were actually assessed.
Given these sampling issues, these data on 1,077 inmates cannot be viewed as
representative of all CDCR releases. In our view, it would be problematic to interpret this
sample as “normative data” for CDCR, particularly when the data are divided by gender (n=291
women, n=786 men). Developing a „risk matrix‟ on this sample that will be used to make crucial
decisions about thousands of offenders seems unwise.

Skeem & Eno Louden, COMPAS, page 26
PART III: CONCLUSION
Summary of Strengths and Weaknesses, in Light of CDCR Needs
Direction for Future Research

Skeem & Eno Louden, COMPAS, page 27
Summary of Strengths and Weaknesses, in Light of CDCR Needs
In Part I, we distilled the desirable properties of a risk-needs tool for CDCR. In the table below,
we summarize these properties for the COMPAS, based on the three reports provided for this
assessment. The rating system is as follows:
sound evidence substantial evidence weak evidence no evidence
Property Evidence (p. of report) Rating
Predictive Utility and Supervision Utility
Emphasizes criminogenic needs that
predict recidivism
Only 1 of 8 original COMPAS “Needs and
Social Factors” scales are predictive
enough to enter actuarial risk scales (see p.
18). For 5 of 8 scales, r < .13 (NY Table
95)
Captures change in risk state over time No evidence.
Predicts future reoffense “Risk Scales” are moving targets, and most
have not been shown to predict recidivism.
The two exceptions were developed on a
small sample of probationers and have not
been cross-validated (pp. 15-20; 22-23)
Validity scales detect careless responding
and response distortion by offenders
Some evidence that the COMPAS detects
random responding, but not “faking good”
or “faking bad” (pp. 10, 17, 22)
Construct Validity
Logical analysis or “eyeball test” suggests
that the tool measures criminogenic needs
suggested by the literature
Basic Scale labels suggest that many, but
not all, tap risk and needs areas suggested
in the literature (p. 16).
Internal structure analysis indicates that
COMPAS items are organized into the
scales the authors assert exist
No evidence (p. 16).
Cross-structure analysis indicates that
COMPAS scales relate as expected with
external measures of theoretically relevant
constructs
No validated measures of relevant
constructs have been examined.
Associations within COMPAS scales and
with impoverished variables available in
databases are provided (pp. 17, 22).
Reliability
Test-retest reliability indicates an offender
will obtain similar scores over short time
intervals
No evidence.
Internal consistency reliability indicates
that scale items are homogeneous.
The majority of scales have acceptable
internal consistency (pp. 16, 22).
Interrater reliability indicates that one
professional will score the offender
similarly to another professional
No evidence.

Skeem & Eno Louden, COMPAS, page 28
The strengths of the COMPAS are that it appears relatively easy for professionals to apply, looks
like it assesses criminogenic needs, possesses mostly homogeneous scales, and generates reports
that describe how high an offender‟s score is on those scales, relative to other offenders in that
jurisdiction. In short, we can reliably assess something that looks like criminogenic needs and
recidivism risk with the COMPAS. The problem is that there is little evidence that this is what
the COMPAS actually assesses.
First, it is not clear that the criminogenic needs that ostensibly are being assessed are being
assessed in reality. For example, the authors created a new Drug Problems scale to predict
recidivism, perhaps because the existing Substance Abuse scale did not do so. Which of these
scales actually assess the criminogenic need of alcohol and drug problems? This question could
be addressed by assessing how these COMPAS scales relate to a validated measure of drug
abuse and dependence. Because no rigorous evidence of construct validity is provided for any of
the scales, it is unclear whether they measure the needs they purport to measure. If CDCR
wishes to use the COMPAS to inform rehabilitation programming in prisons and on
parole, they must have evidence that the tool validly assesses offenders’ criminogenic needs.
This will be key to developing effective rehabilitation programs (see pp. 7-8).
Second, there is little evidence that the COMPAS predicts recidivism. Ideally, the COMPAS
would combine all of the criminogenic needs and static risk factors that it assesses into a single,
total score that would predict recidivism. It does not. In our view, the reader must wonder why
the COMPAS produces no single “risk” score that can be evaluated by independent investigators.
Instead, the authors create various “Risk Scales” that change from evaluation to evaluation, and
often combine parts of the COMPAS with other variables. Although two of these scales were
actually created to predict reoffending that occurred in the future (new arrest or probation
revocation), these scales were created with small samples of probationers and have not been
cross-validated. Whether they will generalize to “deeper end” CDCR inmates and parolees is an
open question. Moreover, no COMPAS scale has been shown to predict violent recidivism, and
no COMPAS scale has been shown to predict violence or other infractions within institutions. If
CDCR wishes to use the COMPAS to inform decisions about release and placement of
individual offenders, they must have evidence that the tool accurately predicts offenders’
institutional infractions and post-release recidivism (see pp. 9-10).
Third, and perhaps most importantly, there is no evidence that the COMPAS assesses risk state,
or change over time in criminogenic needs. Only small parts of its risk scales tap such needs.
There is no evidence that COMPAS scores change over time, and that those changes predict
proximate recidivism. Without such evidence, there is little need to administer the tool to
offenders repeatedly. If the CDCR wishes to use the COMPAS to inform rehabilitation and
supervision of individual offenders over time, they must have evidence that the tool assesses
offenders’ risk state (see pp. 8-9).
In summary, CDCR is to be commended for attempting to assess risk and needs to inform release
and placement decisions about offenders and to guide rehabilitation and supervision efforts.
When validated tools are used to do so, this is a key to evidence-based practice. Given present
limitations in evidence on interrater reliability, predictive utility, and contruct validity, we cannot
recommend the COMPAS for application to individual offenders. As noted earlier, UCLA is
using data from CDCR to empirically evaluate the COMPAS. In the next section, we summarize
some directions for this research in addition to those outlined earlier (Part I).

Skeem & Eno Louden, COMPAS, page 29
Directions for Future Research
As a whole, this report provides a roadmap for future research with the COMPAS, including the
ongoing UCLA evaluation. First, a primary consideration is predictive utility. We strongly
recommend that UCLA investigators evaluate the utility of the existing COMPAS scales in
predicting recidivism. Investigations conducted to date have altered the COMPAS scales to
increase the measure‟s apparent predictive utility. This will result in “overfitting” (see p. 9),
where enhanced predictive utility is more apparent than real. Second, we recommend that
CDCR data be used to examine the construct validity of the COMPAS: are we assessing
criminogenic needs that, if targeted in rehabilitation efforts, would lead to reduced recidivism
risk? Third, we recommend that the department examine the ability of the COMPAS to capture
change in risk state over time. Repeated assessments of offenders are only helpful if the measure
is sensitive to reductions in such risk factors as criminogenic attitudes.
The larger risk-needs assessment literature enhances this roadmap for research, and points
toward alternative instruments that may better meet the needs of the CDCR. Two tools have
particularly promising research bases to model or adopt. The first is the Levels of Services
Inventory-Revised (LSI-R; Andrews & Bonta, 1995), and its modern variant, the Levels of
Services/Case Management Inventory (LS/CMI; Andrews, Bonta, & Wormith, 2004), which has
been shown to predict not only general recidivism, but also violent recidivism. LSI-R and
LS/CMI total scores are computed the same way in every sample, based on a set of risk and
needs factors. LSI-R total scores been shown to change, and changes in scores have been shown
to predict recidivism (Andrews & Robinson, 1984; Motiuk, 1993; see Douglas & Skeem, 2005
for a review). This suggests that the tool taps criminogenic needs and is useful as a whole tool
for monitoring risk of recidivism.
The second tool is the Correctional Assessment and Intervention System (National Council on
Crime and Delinquency, 2007), which is rooted in the Wisconsin system (Baird, 1981), and
shares the COMPAS system‟s ease of use. The CAIS‟s risk scores have been shown to predict
recidivism in two states. More importantly, use of the CAIS has been shown to reduce
recidivism. In Texas, 2,551 parolees were randomly assigned to parole agents who did, or did
not, use the CAIS in supervision, and then followed for one year. Of high risk cases, 23% of
non-CAIS parolees had warrants issued for their arrest during that period, compared to 15% of
CAIS parolees. A similar study conducted with 44,000 offenders in Florida suggests a 29%
reduction in revocation with CAIS supervision. To the extent that the goal is to target
criminogenic needs to reduce recidivism, this provides strong support for a risk-needs tool.
We thank CDCR for the opportunity to review these reports on the quality of the COMPAS and
would be happy to respond to any questions about this evaluation. Although the COMPAS has a
number of strengths, we strongly believe that more research and information are needed before
CDCR can rely on this tool to meet its needs.

Skeem & Eno Louden, COMPAS, page 30
References
Andrews, D. A., Bonta, J., & Hoge, R. D. (1990). Classification for effective rehabilitation:
Rediscovering psychology. Criminal Justice and Behavior, 17(1), 19-52.
Andrews, D. A., Bonta, J., & Wormith, J. S. (2006). The recent past and near future of risk
and/or need assessment. Crime & Delinquency, 52(1), 7-27.
Andrews, D. A., & Bonta, J. (1995). The Level of Service Inventory–Revised. Toronto, Canada:
Multi-Health Systems.
Andrews, D. A., & Bonta, J. (1998). The Level of Service Inventory–Screening Version. Toronto,
Canada: Multi-Health Systems.
Andrews, D. A., Bonta, J., & Wormith, S. J. (2004). The Level of Service/Case Management
Inventory (LS/CMI). Toronto, Canada: Multi-Health Systems.
Andrews, D. A., & Kiessling, J. J. (1980). Program structure and effective correctional practices:
A summary of the CaVIC research. In R.R. Ross & P. Gendreau (Eds.), Effective
correctional treatment. Toronto, Canada: Butterworth.
Andrews, D. A., & Robinson, D. (1984). The Level of Supervision Inventory: Second report
[Report to Research Services]. Toronto, Canada: Ontario Ministry of Correctional
Services.
Baird, C. (1981). Model classification systems in correctional field services. Corrections
Magazine, 43, 36-41.
Baird, C.S., Heinz, R. C., & Bemus, B. J. (1979). The Wisconsin case classification/staff
deployment project: A two year follow-up report. Project Report #14. Madison,
Wisconsin: Wisconsin Division of Corrections.
Banks, S., Robbins, P., Silver, E., et al. (2004). A multiple-models approach to violence risk
assessment among people with mental disorder. Criminal Justice and Behavior, 31, 321-
340.
Brennan, T. Dietrich, W., & Oliver, W. (2006). California Department of Corrections, Parole
and Community Services Division: COMPAS Pilot Psychometric Report. Traverse City,
MI: Northpointe Institute for Public Management, Inc.
Brennan, T., Fretz, R., & Wells, D. (2003). COMPAS user’s case management guide. Traverse
City, MI: Northpointe Institute for Public Management, Inc.
Brennan, T. & Oliver, W. (2002). Evaluation of reliability and validity of COMPAS scales: New
York Probation sample (updated with 24 month outcome study). Traverse City, MI:
Traverse City, MI: Northpointe Institute for Public Management, Inc.
Douglas, K. S. & Skeem, J. L. (2005). Violence Risk Assessment: Getting Specific About Being
Dynamic. Psychology, Public Policy, and Law, 11(3), 347-383.
Douglas, K. S. & Webster, C. D. (1999). The HCR-20 violence risk assessment scheme:
Concurrent validity in a sample of incarcerated offenders. Criminal Justice and Behavior,
26(1), 3-19.
Dowden, C. (1998). A meta-analytic examination of the risk, need and responsivity principles

Skeem & Eno Louden, COMPAS, page 31
and their importance within the rehabilitation debate. Unpublished master‟s thesis,
Carleton University, Ottawa, Canada.
Dowden, C., & Andrews, D. A. (1999). What works for female offenders: A meta-analytic
review. Crime and Delinquency, 45, 438-452.
Dowden, C., & Andrews, D. A. (2000). Effective correctional treatment and violent reoffending:
A meta-analysis. Canadian Journal of Criminology, 42, 449-476.
Dvoskin J.A. & Heilbrun, K. (2001). Risk assessment and release decision-making: toward
resolving the great debate. Journal of the American Academy of Psychiatry and Law,
29(1), 6-10.
Gendreau, P., Little, T., & Goggin, C. (1996). A meta-analysis of the predictors of adult offender
recidivism: What works! Criminology, 34, 575-607.
Glover, A. J., Nicholson, D. E, Hemmati, T., Bernfeld, G. A., & Quinsey, V. L. (2002). A
comparison of predictors of general and violent recidivism among high-risk federal
offenders. Criminal Justice and Behavior, 29(3), 235-249.
Grann, M., Belfrage, H., & Tengstrom, A. (2000). Actuarial assessment of risk for violence:
Predictive validity of the VRAG and the historical part of the HCR-20. Criminal Justice
and Behavior, 27(1), 97-114.
Grove, W. M. & Meehl, P. E. (1996). Comparative efficiency of informal (subjective,
impressionistic) and formal (mechanical, algorithmic) prediction procedures: The
clinical-statistical controversy. Psychology, Public Policy, and Law, 2(2), 293-323.
Hart, S. D., Michie, & Michie, C. (2007). Precision of actuarial risk assessment instruments:
Evaluating the `margins of error' of group v. individual predictions of violence. The
British Journal of Psychiatry, 190, 60-65.
Kroner, D. G. & Mills, J. F. (2001). The accuracy of five risk appraisal instruments in predicting
institutional misconduct and new convictions. Criminal Justice and Behavior, 28, 471-
489.
Kroner, D. G., Mills, J. F., & Reddon, J. R. (2005). A coffee can, factor analysis, and prediction
of antisocial behavior: The structure of criminal risk. International journal of law and
psychiatry, 28(4), 360-374.
Lin, J. (2007). Parolee needs in California: A descriptive analysis of 2006 COMPAS data.
Irvine, CA: Center for Evidence-Based Corrections.
Millon, T. (1997). The Millon inventories: Clinical and personality assessment. New York:
Guilford Press.
Monahan, J., Steadman, H. J., Appelbaum, P., Grisso, T., Mulvey, E. P., Roth, L., Robbins, P.
C., Banks, S., & Silver, E. (2005). The Classification of Violence Risk. Behavioral
Sciences & the Law, 24(6), 721-730.
Motiuk, L. L. (1993). Where are we in our ability to assess risk? Forum on Corrections
Research, 5(2), 12-13.
National Council on Crime and Delinquency (2007). Correctional Assessment and Intervention
System (CAIS). Retrieved 8/23/07 from: http://www.nccd-crc.org/nccd/n_cj_cmain.html

Skeem & Eno Louden, COMPAS, page 32
National Research Council (1993). Understanding and preventing violence. National Academy
Press.
Nunnally, J. C. (1978). Psychometric theory. New York: McGraw-Hill.
O'Donnell, C. R., Lydgate, T., & Fo, W. S. (1979). The Buddy System: Review and follow-up.
Child Behavior Therapy, 1(2), 161-169.
Pedhazur, E. J. & Schmelkin, P. (1991). Measurement, design, and analysis: An integrated
approach. Hillsdale: Erlbaum.
Stout, W. (1987). A non-parametric approach to assessing latent trait unidimensionality.
Psychometrika, 52, 589-617.
Thorndike, R. L. (1949). Personnel selection. New York: Wiley.