evaluating cell identity from transcription profiles · • a curated standard dataset of...
TRANSCRIPT

Evaluating Cell Identity from Transcription Profiles
Nancy Mah1* , Katerina Taškova2,3, Khadija El Amrani1, Krithika Hariharan1, AndreasKurtz1 and Miguel A. Andrade-Navarro2,3
1Berlin-Brandenburg Center for Regenerative Therapies, Charité UniversitätsmedizinBerlin, Campus Virchow Klinikum, Augustenburger Platz 1, 13353 Berlin, Germany
2Faculty of Biology, Johannes-Gutenberg University of Mainz, Gresemundweg 2, 55128Mainz, Germany
3Institute for Molecular Biology gGmbH, Ackermannweg 4, 55128 Mainz, Germany
* Corresponding Author
Contact information for corresponding author:
Dr. rer. nat. Nancy Mah
Charité - Universitätsmedizin Berlin
Campus Virchow-Klinikum
Berlin-Brandenburger Centrum für Regenerative Therapien (BCRT)
Augustenburger Platz 1
13353 Berlin
GERMANY
E-mail: [email protected]
Phone (office): +49 30 450 639 427
Fax: +49 30 450 524 935
Running title: Evaluating Cell Identity
5
10
15
20
25
.CC-BY 4.0 International licensenot peer-reviewed) is the author/funder. It is made available under aThe copyright holder for this preprint (which was. http://dx.doi.org/10.1101/250431doi: bioRxiv preprint first posted online Jan. 19, 2018;
Running title: Evaluating Cell Identity, Mah et al.
Summary
Induced pluripotent stem cells (iPS) and direct lineage programming offer promising
autologous and patient-specific sources of cells for personalized drug-testing and cell-
based therapy. Before these engineered cells can be widely used, it is important to
evaluate how well the engineered cell types resemble their intended target cell types.
We have developed a method to generate CellScore, a cell identity score that can be
used to evaluate the success of an engineered cell type in relation to both its initial and
desired target cell type, which are used as references. Of 20 cell transitions tested, the
most successful transitions were the iPS cells (CellScore > 0.9), while other transitions
(e.g. induced hepatocytes or motor neurons) indicated incomplete transitions (CellScore
< 0.5). In principle, the method can be applied to any engineered cell undergoing a cell
transition, where transcription profiles are available for the reference cell types and the
engineered cell type.
Highlights
• A curated standard dataset of transcription profiles from normal cell types was
created.
• CellScore evaluates the cell identity of engineered cell types, using the curated
dataset.
• CellScore considers the initial and desired target cell type.
• CellScore identifies the most successfully engineered clones for further
functional testing.
Keywords: transcriptome, cell identity, engineered cell types, reference standards
2 of 24
30
35
40
45
50
.CC-BY 4.0 International licensenot peer-reviewed) is the author/funder. It is made available under aThe copyright holder for this preprint (which was. http://dx.doi.org/10.1101/250431doi: bioRxiv preprint first posted online Jan. 19, 2018;
Running title: Evaluating Cell Identity, Mah et al.
Introduction
The discovery that a terminally differentiated cell type could be reverted to a pluripotent
cell state capable of generating all possible cell types from the three germ cell layers
(Takahashi and Yamanaka, 2006) has revolutionized the field of stem cell research and
regenerative medicine. This concept of "reprogramming" one cell type to another has
been further applied to lineage or direct reprogramming (Heinrich et al., 2015), in which
cells are directly reprogrammed from one differentiated cell type to another, without first
passing through a pluripotent state (Kim and Schöler, 2014). The development of these
methods enable the production of patient-specific cells, which could be used for
individualized drug testing and cell replacement therapy.
However, before these pluripotent stem cell-derived or other engineered cell types can
be used for clinical applications, the safety and efficacy of the cells must be proven.
First and foremost comes the patient's safety with regard to oncogenicity and transplant
rejection. For example, the process of creating iPS cells, including the reprogramming
protocol and culture conditions, may introduce genomic aberrations (Lund et al., 2012),
which could potentially render the iPS cells and their derivatives oncogenic. Indeed, the
first phase 1 clinical trial using iPS cells was put on hold after gene mutations that were
not present in the donor fibroblasts were found in the iPS cells used to treat age-related
macular degeneration (Garber, 2015). Strict quality control of each patient-specific iPSC
line for autologous transplantation also increases the cost and time for individualized
treatment. In favor of a faster and more cost-effective way to generate clinical-grade
cells, the suspended clinical trial aimed to resume
(https://ipscell.com/2015/07/firstipscstop/) with the use of quality-controlled, banked,
human leukocyte antigen (HLA)-typed iPS cells for allogeneic transplantation
(Scudellari, 2016), which should reduce the risk of transplant rejection. In addition to
3 of 24
5
55
60
65
70
75
.CC-BY 4.0 International licensenot peer-reviewed) is the author/funder. It is made available under aThe copyright holder for this preprint (which was. http://dx.doi.org/10.1101/250431doi: bioRxiv preprint first posted online Jan. 19, 2018;

Running title: Evaluating Cell Identity, Mah et al.
successful safety trials, the cell-based treatment must demonstrate effectiveness. But
even before the process of human clinical trials starts, engineered cell types that are
destined for cell therapy must be sufficiently characterized. We propose that
characterization of any kind of derived cell type that is intended for clinical use, can be
partly accomplished by analyzing the gene expression profiles, in comparison to their
starting donor cells and desired target cells. The same applies to their use for disease
modelling and drug testing. Before extensive time and effort is spent on functional
testing of engineered cell lines, transcription profiles could already be used as an initial
screen to identify the most promising clones.
Current protocols to reprogram cells from one cell type to another typically involve
forced expression of key factors, modulation of pathways with inhibitors and/or
agonists, and changes in growth conditions. These protocols evolve from informed
guesses tested by trial and error strategies, and even then, the molecular mechanisms
behind cell transition are not completely understood. Parallel to the rise of
reprogramming protocols, technological advancements allowing researchers to
quantitate various cell properties in a high-throughput manner have created golden
opportunities for the integration and analysis of "-omic" data. A large body of
transcriptome data, i.e., quantitative measurements of the mRNA expression levels in a
sample, has accumulated in the public domain, owing to high-throughput technologies
such as microarray expression profiling or deep sequencing technology. Thanks to
these technologies, there are millions of transcriptomic 'snapshots' of cells, which can
be used to define the state of a biological sample by computational means of
determining the cell identity of engineered cell types. For example, Pluritest assesses
the pluripotency of query cells by comparing the query with a standard expression
matrix (of pluripotent stem cells and differentiated cells), using non-negative
4 of 24
80
85
90
95
100
.CC-BY 4.0 International licensenot peer-reviewed) is the author/funder. It is made available under aThe copyright holder for this preprint (which was. http://dx.doi.org/10.1101/250431doi: bioRxiv preprint first posted online Jan. 19, 2018;
Running title: Evaluating Cell Identity, Mah et al.
factorization models (Müller et al., 2011). In another method, CellNet quantifies the
similarity of engineered cells and their target cell types, by extracting gene regulatory
networks from transcriptome data of diverse cell types and further filtering the networks
for regulatory interactions with ChIP-chip/-seq data (Cahan et al., 2014; Morris et al.,
2014). Finally, KeyGenes uses a generalized linear regression model to extract
classifier genes from a panel of transcriptional human fetal tissue, and then uses the
"key genes" to classify query samples (Roost et al., 2015; Takasato et al., 2015).
In the present study, we propose a method to generate the CellScore. Unlike other
computational methods, the CellScore method evaluates the cell identity of an
experimentally derived cell type by taking into account both the initial donor cell type
and the target cell type. First, we manually curated a set of reference transcriptome
profiles from various normal tissues or cell types (Figure 1A). Then, we developed a
method to assess cell identity of engineered cell types, using the expression profiles of
the donor cell type and the desired target cell type as references (Figure 1B). Our
method is targeted towards researchers following the gene expression changes of cells
whereby the cells are expected to change their identity from a starting donor cell type
towards a modified (e.g. reprogrammed or differentiated) cell type. If the desired target
cell type has appropriate gene expression data, our method can be used to evaluate
the “proximity” between an engineered cell type and its desired target cell, in terms of a
CellScore. We can also evaluate whether the changes in gene expression during the
identity change are leading to the desired state, and which genes contribute to this
successful reprogramming. Finally, the method and accompanying reference dataset
have been implemented as R packages that offer functions to calculate and visualize
the cell scoring results for a given cell transition dataset in multiple ways including a
single function call to obtain a detailed summary report in PDF format.
5 of 24
105
110
115
120
125
10
.CC-BY 4.0 International licensenot peer-reviewed) is the author/funder. It is made available under aThe copyright holder for this preprint (which was. http://dx.doi.org/10.1101/250431doi: bioRxiv preprint first posted online Jan. 19, 2018;
Running title: Evaluating Cell Identity, Mah et al.
Results
Transcriptome data across multiple studies defines a consistent expression
space. To obtain a broad representation of expression space, studies involving cell
transitions, as well as studies with normal cells were chosen for analysis. The reference
dataset included over 100 standard cell types, consisting of either tissues, isolated cell
types, or primary cell lines (Figure 1A, Supplementary Data S1). To demonstrate the
utility of the CellScore, we compared over 300 test samples in transitions to over 10
target cell types of interest in regenerative medicine. Visualization of the reference
expression dataset by principal component analysis (PCA; Figure 2) showed clusters of
the same cell types, such as embryonic stem cells (navy blue; bottom left), fibroblasts
(cornflower blue; left side) and brain or nervous tissues (pink and purple; right side),
indicating that the normalization process was able to preserve sample characteristics,
even though the samples originated from different studies.
Similarity scores based on quantitative expression values. To further examine the
similarity between donor, target, and engineered cell types, cells were sub-categorized
according to their donor cell type to yield a cell subtype. From here on, we denote cell
subtypes in the following format: derived cell type, "–", donor cell type. Using the
expression values, cosine similarity was calculated between the centroids of each
subtype (Figure 3A). For the transitions to the ESC (embryonic stem cell) target cell
type (i.e. iPS reprogramming), most of the iPS subtypes were highly similar to ESCs
(Figure 3B). One notable exception were the "iPS-GSC*" cells, which were originally
claimed to be iPS lines derived from spermatogonial cells (GSC), but were later shown
to be more consistent with a fibroblast cell type (Ko et al., 2010). This is clearly visible in
Figure 3B, where "iPS-GSC*" clusters with all other fibroblast cell types. A complete
6 of 24
130
135
140
145
150
.CC-BY 4.0 International licensenot peer-reviewed) is the author/funder. It is made available under aThe copyright holder for this preprint (which was. http://dx.doi.org/10.1101/250431doi: bioRxiv preprint first posted online Jan. 19, 2018;
Running title: Evaluating Cell Identity, Mah et al.
heatmap overview of the average cosine scores of all transitions is available in
Supplementary Data S2 .
Transition progression based on cell type markers. Aside from the expression data
values, "present" calls from the microarray data analysis determine whether a gene was
reliably detected or not. For each experimental cell subtype, we calculated the fraction
of donor cell markers lost and target cell markers gain, to define an on/off score. Ideally,
a successfully transitioned cell should lose all of its donor character and gain all of the
target cell markers. For the most part, cells reprogrammed to iPS underwent a near
complete loss of donor markers and gained at least 50% of the target markers (Figure
4A). Lower scoring transitions included those with transdifferentiation, highlighting the
difficulty of these particular direct lineage reprogramming protocols to effect transition
without first going to pluripotency. Examining the lists of donor and marker genes that
are detected in the test cell types also provides valuable clues as to why a transition
could not be carried to completion. As an example, functional enrichment in Reactome
pathways was carried out on both partially reprogrammed iPS cells (piPS-FIB) and
published iPS-FIB test cell types within the FIB (fibroblast) to ESC transition. The
functional enrichment based only on these on/off genes demonstrated that certain
Reactome categories, such as "Signaling by NODAL" or "Transcriptional regulation of
pluripotent stem cells" were clearly lacking expression in the partially reprogrammed
cells compared to ESCs, whereas the iPS-FIB cells showed an enrichment profile very
similar to that of ESCs (Figure 4B).
Application of the cell scoring method. The CellScore is composed of target- and the
donor-like scores (Figure 1C), which are obtained from the cosine similarity and on/off
(marker gain/loss) score. The CellScore values, including the values of the specific
score components, are shown for 30 selected transitions in Figure 5. The engineered
7 of 24
155
160
165
170
175
.CC-BY 4.0 International licensenot peer-reviewed) is the author/funder. It is made available under aThe copyright holder for this preprint (which was. http://dx.doi.org/10.1101/250431doi: bioRxiv preprint first posted online Jan. 19, 2018;
Running title: Evaluating Cell Identity, Mah et al.
cells with the highest similarity to their desired target cell types are concentrated in the
upper-left corner of Figure 5A, with high target-like scores (>1.5) and low donor-like
scores (< 1.5). The CellScore is simply the difference between the target- and donor-
like scores, as shown in Figure 5B. The CellScore ranges between -1.2 and 1.2. A
highly positive CellScore indicates that the experimental cell is very similar to its target
cell type, while a highly negative score indicates that the experimental cell type has not
successfully transitioned and has remained more donor-like. To visualize the CellScore
and the metrics that contribute to the CellScore of an engineered cell type, a report can
be generated with diagnostic plots as in Figure 5. Reports for all cell transitions in the
test dataset were generated and are available as Supplementary Data S3, and the
complete CellScore values and marker gene lists are available as Supplementary Data
S4. Though many transitions were assessed in the test dataset, we demonstrate the
utility of the approach to score experimental cell types in the following selected
examples:
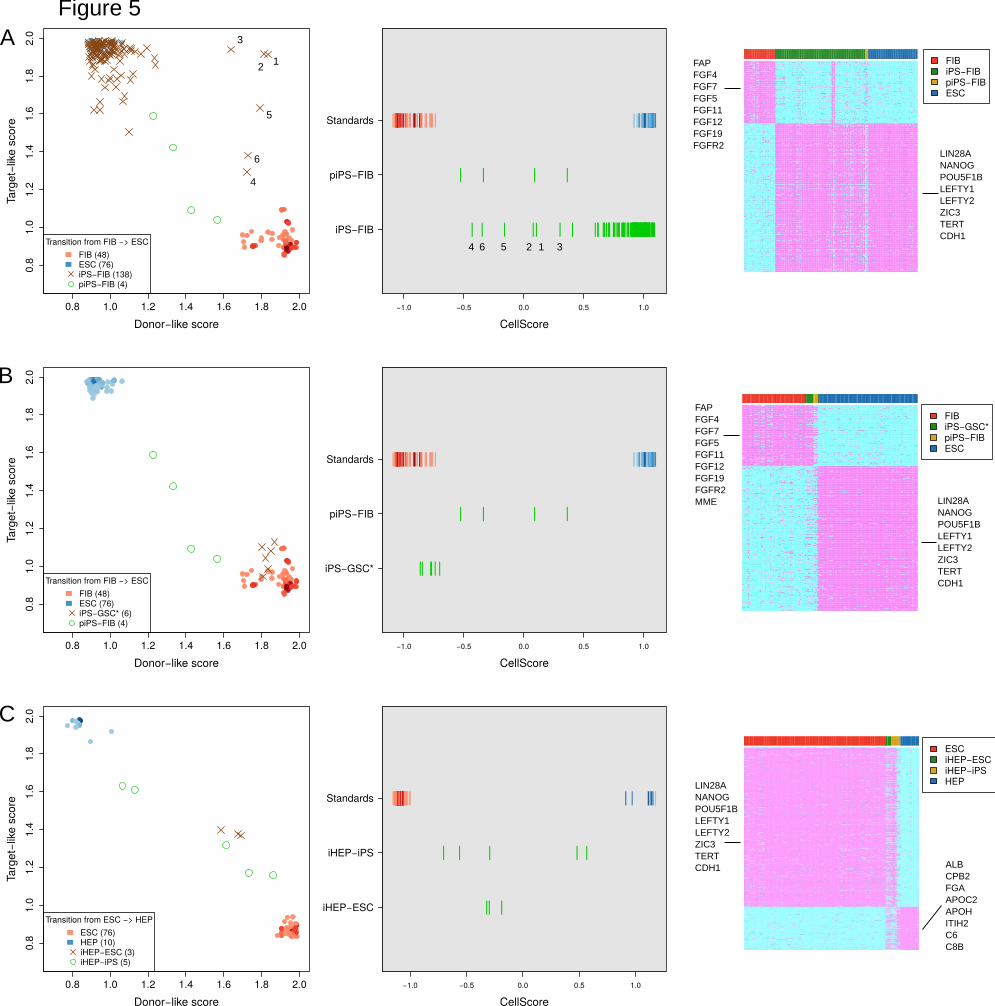
Case 1: FIB to ESC. Within the context of the fibroblast-derived iPS cells, most iPS
cells (iPS-FIB) indeed have target-like scores and low donor scores, leading to high
CellScore values (Figure 5A). Partially reprogrammed iPS cells (piPS-FIB) show
gradual transition to ESC, and have CellScore < 0.5, indicating their incomplete
transition. Notably, there are six outlier iPS-FIB samples from the same study
(GSE27206) (Corti et al., 2012) with high donor-like scores on the right side of Figure
5A, first panel. Their CellScore values range from -0.43 to 0.30, and display both FIB
marker and ESC marker expression (Figure 5A, middle and right panel). Two of the iPS
lines originate from spinal muscular atrophy patients (#1,2 in Figure 5A), one is a wild-
type parent of the patients (#3) and the remaining iPS lines (#4,5,6) were previously
established lines (iPS 19-9; hPSCreg identifier WAi001-A) from the Thomson laboratory
8 of 24
15
180
185
190
195
200
.CC-BY 4.0 International licensenot peer-reviewed) is the author/funder. It is made available under aThe copyright holder for this preprint (which was. http://dx.doi.org/10.1101/250431doi: bioRxiv preprint first posted online Jan. 19, 2018;

Running title: Evaluating Cell Identity, Mah et al.
(Yu et al., 2009). We also have calculated the CellScore for the iPS 19-9 lines in
Supplementary Data S3 (see GSE15176). All iPS 19-9 lines from the original study (Yu
et al., 2009) have high CellScore values (0.96-1.05) and are virtually indistinguishable
from ESC standards. Together these results indicate a potential systematic problem in
the iPS cells profiled in GSE27206. It should be noted these outlier cell lines were in
turn used as starting material for the production of patient-derived motor neurons;
therefore these cells could be considered as transdifferentiation intermediates rather
than fully reprogrammed iPS lines. Overall, of the 138 iPS-FIB samples assessed by
CellScore, 72% had values greater than 0.9, which indicates high transition to an ESC-
like state. The iPS-FIB cell lines with lower CellScore have not silenced the expression
HOX family body patterning genes, which are highly expressed in the donor fibroblasts
(Figure 6). Expression of a higher number of HOX genes in the iPS cell lines tends to
decrease the CellScore and indicates a less successful transition.
Case 2: GSC to ESC. Interestingly, in one well-known controversial case of iPS cells,
which were supposed to have been derived from spermatogonial cells (iPS-GSC*;
GSE11350) (Conrad et al., 2008), the derived cells had a CellScore of about zero in the
transition from spermatogonial germ cells to ESC (Figure 5B). However, when these
iPS-GSC* cells were scored in the FIB to ESC transition, the CellScore values were
very close to values of the fibroblast cell line standards (Figure 5B). These cells have
been shown to be most likely testicular fibroblasts (Ko et al., 2010) and not iPS cells.
Case 3: ESC to HEP. We analyzed three studies of converting pluripotent stem cells to
hepatocyte-like cells (GSE62962, GSE14897, GSE62547). Each study used a different
method to produce the induced hepatocytes (iHEP) and CellScore provides an
objective way to compare their outcomes. The most successful conversion of PSC to
HEP came from GSE62962, where the authors used a micropatterned co-culture
9 of 24
205
210
215
220
225
.CC-BY 4.0 International licensenot peer-reviewed) is the author/funder. It is made available under aThe copyright holder for this preprint (which was. http://dx.doi.org/10.1101/250431doi: bioRxiv preprint first posted online Jan. 19, 2018;
Running title: Evaluating Cell Identity, Mah et al.
platform with stromal fibroblasts to differentiate the cells to iHEP (Berger et al., 2015).
Though the CellScore for these two lines was only 0.57 and 0.48, the lines clearly had
moderate target-like scores and low donor-like scores (Figure 5C). In the microarray
expression data, the iHEPs from this study expressed high levels of albumin, like the
primary hepatocytes that were used as standards. However, a high level of alpha-
fetoprotein gene in the iHEP cells shows that they were still immature hepatocytes and
had not completely converted to the desired target cell type, primary hepatocytes.
Nevertheless, the authors demonstrated that their iHEP cells had hepatocyte
morphology and polarity, as well as drug metabolizing ability (Berger et al., 2015).
Performance of the method. To evaluate the performance of the CellScore method,
we curated an independent dataset of primary cells, cell lines or tissues from 25
studies, which were not previously used as standards for CellScore. ESC, HEP, and
RPE (retinal pigmented epithelium) were then defined as true positives in three
transitions (FIB → ESC, ESC → HEP, ESC → RPE), respectively, to calculate Receiver
Operating Characteristic (ROC) curves (Figure 7). Other cell types within these 25
studies were used as true negatives, with the exception of iPS cells, which were too
similar to ESCs. Within a transition, all samples that were not true positives were used
as true negatives. All three transitions yielded Area Under the Curve (AUC) values
greater than 0.97, which indicates excellent performance in classifying the tested cell
types. Both ESC and RPE cells were classified with very high sensitivity (0.95) and high
specificity (false positive rate – FPR of 0.05), whereas the HEP classification had a
higher FPR (0.14) at 0.95 sensitivity. This higher FPR was partly driven by chemically
treated hepatocyte samples, which were counted as true negatives, but in fact were not
significantly influenced by small molecule treatment.
10 of 24
230
235
240
245
20
.CC-BY 4.0 International licensenot peer-reviewed) is the author/funder. It is made available under aThe copyright holder for this preprint (which was. http://dx.doi.org/10.1101/250431doi: bioRxiv preprint first posted online Jan. 19, 2018;
Running title: Evaluating Cell Identity, Mah et al.
Discussion
In the present study, we propose a new approach, called CellScore, to score
experimental cell types undergoing a transition in cell identity. This is a particularly
emerging current issue as it becomes more routine to engineer an essential cell type
on-demand for disease modelling or patient-specific drug-testing. The CellScore alone
is not intended to wholly replace other cellular and molecular techniques to confirm the
desired cell function, but CellScore results can already provide some information about
the success of engineered cell transition.
We applied the CellScore method to over 20 transitions in cell identity from data
available from one particular microarray platform, including over 1500 samples in 86
studies. Some transitions were very popular and had much data from multiple studies
(e.g. FIB →ESC, PSC → HEP, PSC → MYOC) while others, such as those deriving
cells of the nervous system, only had data from a single study. In three transitions, for
which additional public data was available from the same platform, we were able to
show that the CellScore method was able to classify true positives with high specificity
and low false positive rates. Overall, and probably not surprising, the highest scoring
engineered lines were the iPS lines and other transitions involving cultured cell lines as
standards (e.g. ESC → FIB, FIB → EC). Other transitions did not reach CellScore
values above 0.5. There could be many explanations for these incomplete transitions.
First, there could be experimental inconsistencies in the generation or maintenance of
the derived lines. The meta-analysis of the test iPS samples detected clear outliers: the
known problematic cell lines in the case 3 from above (Conrad et al., 2008) and the
unusual iPS lines of case 1 from above (Corti et al., 2012), in which all six iPS lines
were affected with low CellScore values, including three bona fide iPS lines from
another laboratory. Second, differentiation protocols to produce specialized cell types
11 of 24
250
255
260
265
270
.CC-BY 4.0 International licensenot peer-reviewed) is the author/funder. It is made available under aThe copyright holder for this preprint (which was. http://dx.doi.org/10.1101/250431doi: bioRxiv preprint first posted online Jan. 19, 2018;
Running title: Evaluating Cell Identity, Mah et al.
are constantly being improved, and engineered cells in the current analysis do not
reflect cells generated from the most recent advances in vitro cell differentiation. Finally,
there might not be suitable target cells available for the CellScore method. Engineered
cells are typically grown in culture, and these conditions cannot possibly mimic the cell
types in their native in vivo environments. Many engineered cell types could be
considered more fetal-like, rather than terminally differentiated, and due to ethical and
practical considerations, there is a lack of sufficient numbers of human fetal tissue
samples that could serve as standards. Therefore, the standard target cell type used to
calculate the CellScore is a proxy, and in itself represents an ideal and unattainable
goal. For example, in the PSC → HEP transition, primary hepatocytes were used as the
target; however, the induced hepatocytes were still immature compared to primary
hepatocytes. In spite of their immaturity, these cells already demonstrated sufficient
functionality in terms of metabolic activity and liver marker expression, such that they
could be used in some in vitro toxicity assays (Berger et al., 2015). It may not even be
necessary to derive mature hepatocytes, depending on its downstream use. Immature
hepatocytes could be used as a form of cell replacement therapy by injecting them into
a liver, where the immature hepatocytes could fully differentiate into hepatocytes in situ
(Si-Tayeb et al., 2010). In such cases, the CellScore could still be useful as a guide to
choosing the most differentiated iHEPs and compare outcomes between distinctly
scoring cells.
Beyond the CellScore as a single number to quantify a cell transition, the CellScore
reports give additional information showing the contribution of target-like and donor-like
metrics to the CellScore and diagnostic heatmaps of the markers expressed by
standards and experimentally derived cells. As exemplified by the case of partially
induced iPS cells, the on/off marker lists can be extracted and further analyzed to
12 of 24
275
280
285
290
295
.CC-BY 4.0 International licensenot peer-reviewed) is the author/funder. It is made available under aThe copyright holder for this preprint (which was. http://dx.doi.org/10.1101/250431doi: bioRxiv preprint first posted online Jan. 19, 2018;
Running title: Evaluating Cell Identity, Mah et al.
highlight genes responsible for an incomplete transition, which could be in fact driven by
donor cell type-specific transcription networks (Nefzger et al., 2017) Functional
enrichment analysis could highlight pathways or processes that may be suitable input
for small molecule induction/repression prediction, in an effort to improve differentiation
protocols (Siatkowski et al., 2013).
Other computational methods to evaluate cell identity exist, but mainly these are
restricted in that they perform specific functions and rely on specific technologies.
Pluritest focuses on the scoring of human pluripotent stem cells and is restricted to
using datasets from dedicated microarray platforms, as a means for standard testing on
a web-based platform behind a login-wall (Müller et al., 2011). Keygenes is a
specialized resource for scoring RNA-seq profiles to a fixed panel of human embryonic
tissues, with freely available software (Roost et al., 2015). On the other hand, CellNet is
applicable to microarray data of different platforms, provided that at least 60
microarrays are available for each tissue type. CellNet uses cell or tissue-specific gene
regulatory networks to classify engineered cell types and its software is freely available
(Cahan et al., 2014). None of these methods explicitly takes into consideration the
donor cell type when evaluating the cell identity. We propose the CellScore method as a
freely available method to evaluate any kind of cell identity transition, which could in
principle score any type of cell transition for which donor cell and target cell data are
available, regardless of the platform. The current study has been limited to data from
one platform as a proof-of-principle, but in the future, we aim to leverage the data from
additional microarray platforms, as well as RNA-seq datasets, for a comprehensive
expression database (Mah et al., 2017) to evaluate cell identity.
Experimental Procedures
Data selection and processing. Transcriptome data was collected from published
13 of 24
25
300
305
310
315
320
.CC-BY 4.0 International licensenot peer-reviewed) is the author/funder. It is made available under aThe copyright holder for this preprint (which was. http://dx.doi.org/10.1101/250431doi: bioRxiv preprint first posted online Jan. 19, 2018;
Running title: Evaluating Cell Identity, Mah et al.
studies that involved changes in cell identity, i.e. reprogramming somatic cells to iPS,
directed differentiation of pluripotent cells, or direct lineage reprogramming. Donor cells
were defined to be the starting cell types, whereas target cells were the desired
endpoint cell types. Engineered cell types were defined to be those undergoing the cell
transition from the donor to the target cell type. Further studies were added as
necessary to complement the number of transcription profiles from standard (donor or
target) cell types. This data collection contains pluripotent stem cells, adult stem cells
and differentiated cells, which serve as standard cell types to which the engineered
cells are compared. An overview of the reference samples in the data collection is
shown in Figure 1A and a complete list of all samples is given in Supplementary Data
S1. Samples were manually annotated for their tissue origin and cell types using
ontology terms (Malone et al., 2010; Stachelscheid et al., 2014). Raw microarray data
were obtained from the public repositories Gene Expression Omnibus and
ArrayExpress (Barrett et al., 2009; Rustici et al., 2013). Microarray data was normalized
using the YuGene transform, which allows comparisons between experiments and is
not dependent on the data distribution (Lê Cao et al., 2014). For present/absent calls,
MAS5.0 detection p-values were calculated using the "affy" Bioconductor package for
Affymetrix 3'IVT arrays (Gautier et al., 2004). Probesets in each sample were
considered to be "present" if the detection p-value was less than 0.05. Annotation of
probesets to genes was obtained from the BioC annotation package "hgu133plus2.db"
(Carlson M, 2016). In the case that multiple probesets mapped to one gene, the
probeset with the highest median across all samples was chosen to represent the
expression for that gene.
Cell scoring method. Cell scores for a given cell transition starting from a specific cell
type (defined by the donor cell type) towards a different cell type (defined by the target
14 of 24
325
330
335
340
345
.CC-BY 4.0 International licensenot peer-reviewed) is the author/funder. It is made available under aThe copyright holder for this preprint (which was. http://dx.doi.org/10.1101/250431doi: bioRxiv preprint first posted online Jan. 19, 2018;
Running title: Evaluating Cell Identity, Mah et al.
cell type) were calculated using two independent metrics, the on/off score and the
cosine similarity score (Figure 3A). Both metrics are composite, calculated once with
the respect to the donor and once with the respect the target cell type (Figures 1C). The
first metric was based on the so-called on/off genes, i.e. cell type specific genes that
were uniquely expressed (detected as "present") in either the donor cell type (donor
markers) or the target cell type (target markers) of a particular cell transition. Then the
on/off scores for a query sample i was defined by the fraction of lost donor markers (fD,i)
and the fraction of gained of target markes (fT,i), such that:
fD,i = nD,i / Σ (nD) (1)
fT,i = nT,i / Σ (nT) (2)
where nD,i and nT,i are the numbers of donor or target markers present in the sample i,
and nD and nT are the numbers of donor and target markers, respectively, present in the
standard cell types of a particular cell transition.
In the second metric, cosine similarity of transcription profiles was calculated between
all target, donor and experimental cell types, based on a subset of the most variable
genes from the standard cell types in the normalized expression matrix. By default, the
most variable genes were defined to be those genes whose standard cell type group
medians were in the top 10% of the expression interquartile range. Cosine similarity
was calculated between each query sample and the mean centroid of each standard
cell type. To get an intuitive impression of the cell identity of a query sample i, the
donor-like score (sD,i) and the target-like score (sT,i,) were calculated as follows:
s D,i = fD,i, + cosD,i, (3)
sT,i, = fT,i, + cosT,i, (4)
where cosD,i is the cosine similarity between the query sample i and the centroid of the
15 of 24
350
355
360
365
370
30
.CC-BY 4.0 International licensenot peer-reviewed) is the author/funder. It is made available under aThe copyright holder for this preprint (which was. http://dx.doi.org/10.1101/250431doi: bioRxiv preprint first posted online Jan. 19, 2018;
Running title: Evaluating Cell Identity, Mah et al.
donor cells, and cosT,i is the cosine similarity between the query sample i and the
centroid of the target cells of a given cell transition. As both “on/off” score and the
cosine similarity have values in the range of [0,1], the derived (donor-like and target-
like) scores can have values in the range [0,2]. A successful cell transition will have
samples with very high donor-like scores and very low target-like scores.
Finally, the CellScore of a query sample i for a particular cell transition was defined to
be:
CellScorei = s T,i - s D,i (5)
The CellScore values range between -2 and 2, with negative values indicating that the
query sample is more donor-like (the cell transition was not successful), and positive
values indicating that it is more like the target cell type (meaning a potentially
successful cell transition). The cell scoring method and pre-processed reference and
test data presented in this study is publicly available at
https://github.com/nmah/CellScore.
Functional enrichment and data visualization. The Bioconductor package
"ReactomePA" was used to determine the enrichment of marker genes in Reactome
pathways, using the entire list of genes in the dataset as the background (universe) set
of genes (Yu and He, 2016). Enrichment results were plotted using the Bioconductor
package "clusterProfiler" (Yu et al., 2012). Receiver Operating Characteristic curves
were plotted by the R-package "pROC" (Robin et al., 2011).
Generation of the CellScore Report. Users can produce a report summarizing the
CellScore values for engineered cells in a particular cell transition. The report contains
four diagnostic figures: 1) a scatterplot of the target- and donor-like scores of the
engineered cells; 2) a density plot of the CellScore values for donor, target and
engineered cell types; 3) a rug plot showing a detailed view of the engineered CellScore
16 of 24
375
380
385
390
395
.CC-BY 4.0 International licensenot peer-reviewed) is the author/funder. It is made available under aThe copyright holder for this preprint (which was. http://dx.doi.org/10.1101/250431doi: bioRxiv preprint first posted online Jan. 19, 2018;

Running title: Evaluating Cell Identity, Mah et al.
values in relation to the target cell CellScore values; 4) a heatmap of the on/off marker
expression in the donor, target and derived cell types. Figures can also be plotted
individually using the functions in the CellScore R-package. All calculations and plots
were carried out using R-statistical software version 3.0 or greater (R Core Team,
2017).
Author Contributions
NM, conception and design, collection and curation of data, software coding and
testing, data analysis and interpretation, manuscript writing, and final approval of
manuscript. KT, software coding and testing, software package development,
manuscript writing and final approval of manuscript. KEA, software testing, manuscript
writing and final approval of manuscript. KH, manuscript writing and final approval of
manuscript. AK, manuscript writing and final approval of manuscript. MA, conception
and design, manuscript writing and final approval of manuscript.
Acknowledgements
We acknowledge the generous support from the German Stem Cell Network for travel
awards to NM for stem cell-related meetings. We thank Prof. Petra Reinke for her
continuing support. This work is supported by the European Commission grant no.
334502 (hPSCreg) and the Innovative Medicines Initiative Grant for the European Bank
for induced Pluripotent Stem Cells (EBiSC).
Conflict of Interest
None declared.
References
Barrett, T., Troup, D.B., Wilhite, S.E., Ledoux, P., Rudnev, D., Evangelista, C., Kim, I.F.,Soboleva, A., Tomashevsky, M., Marshall, K.A., et al. (2009). NCBI GEO: archive forhigh-throughput functional genomic data. Nucleic Acids Res. 37, D885-890.
17 of 24
400
405
410
415
420
.CC-BY 4.0 International licensenot peer-reviewed) is the author/funder. It is made available under aThe copyright holder for this preprint (which was. http://dx.doi.org/10.1101/250431doi: bioRxiv preprint first posted online Jan. 19, 2018;
Running title: Evaluating Cell Identity, Mah et al.
Berger, D.R., Ware, B.R., Davidson, M.D., Allsup, S.R., and Khetani, S.R. (2015).Enhancing the functional maturity of induced pluripotent stem cell-derived humanhepatocytes by controlled presentation of cell-cell interactions in vitro. Hepatology 61,1370–1381.
Cahan, P., Li, H., Morris, S.A., Lummertz da Rocha, E., Daley, G.Q., and Collins, J.J.(2014). CellNet: network biology applied to stem cell engineering. Cell 158, 903–915.
Carlson M (2016). hgu133plus2.db: Affymetrix Human Genome U133 Plus 2.0 Arrayannotation data (chip hgu133plus2).
Conrad, S., Renninger, M., Hennenlotter, J., Wiesner, T., Just, L., Bonin, M., Aicher, W.,Bühring, H.-J., Mattheus, U., Mack, A., et al. (2008). Generation of pluripotent stemcells from adult human testis. Nature 456, 344–349.
Corti, S., Nizzardo, M., Simone, C., Falcone, M., Nardini, M., Ronchi, D., Donadoni, C.,Salani, S., Riboldi, G., Magri, F., et al. (2012). Genetic correction of human inducedpluripotent stem cells from patients with spinal muscular atrophy. Sci. Transl. Med. 4,165ra162.
Garber, K. (2015). RIKEN suspends first clinical trial involving induced pluripotent stemcells. Nat. Biotechnol. 33, 890–891.
Gautier, L., Cope, L., Bolstad, B.M., and Irizarry, R.A. (2004). affy--analysis of AffymetrixGeneChip data at the probe level. Bioinforma. Oxf. Engl. 20, 307–315.
Heinrich, C., Spagnoli, F.M., and Berninger, B. (2015). In vivo reprogramming for tissuerepair. Nat. Cell Biol. 17, 204–211.
Kim, K.-P., and Schöler, H.R. (2014). CellNet--where your cells are standing. Cell 158,699–701.
Ko, K., Araúzo-Bravo, M.J., Tapia, N., Kim, J., Lin, Q., Bernemann, C., Han, D.W.,Gentile, L., Reinhardt, P., Greber, B., et al. (2010). Human adult germline stem cells inquestion. Nature 465, E1; discussion E3.
Lê Cao, K.-A., Rohart, F., McHugh, L., Korn, O., and Wells, C.A. (2014). YuGene: asimple approach to scale gene expression data derived from different platforms forintegrated analyses. Genomics 103, 239–251.
Lund, R.J., Närvä, E., and Lahesmaa, R. (2012). Genetic and epigenetic stability ofhuman pluripotent stem cells. Nat. Rev. Genet. 13, 732–744.
Mah, N., El Amrani, K., Zhang, W., Stachelscheid, H., and Kurtz, A. (2017). CellFinder’sMolecular Database and its Application to Stem Cell Research. Genomics Comput. Biol.3, 48.
Malone, J., Holloway, E., Adamusiak, T., Kapushesky, M., Zheng, J., Kolesnikov, N.,Zhukova, A., Brazma, A., and Parkinson, H. (2010). Modeling sample variables with anExperimental Factor Ontology. Bioinforma. Oxf. Engl. 26, 1112–1118.
Morris, S.A., Cahan, P., Li, H., Zhao, A.M., San Roman, A.K., Shivdasani, R.A., Collins,
18 of 24
35
.CC-BY 4.0 International licensenot peer-reviewed) is the author/funder. It is made available under aThe copyright holder for this preprint (which was. http://dx.doi.org/10.1101/250431doi: bioRxiv preprint first posted online Jan. 19, 2018;
Running title: Evaluating Cell Identity, Mah et al.
J.J., and Daley, G.Q. (2014). Dissecting engineered cell types and enhancing cell fateconversion via CellNet. Cell 158, 889–902.
Müller, F.-J., Schuldt, B.M., Williams, R., Mason, D., Altun, G., Papapetrou, E.P.,Danner, S., Goldmann, J.E., Herbst, A., Schmidt, N.O., et al. (2011). A bioinformaticassay for pluripotency in human cells. Nat. Methods 8, 315–317.
Nefzger, C.M., Rossello, F.J., Chen, J., Liu, X., Knaupp, A.S., Firas, J., Paynter, J.M.,Pflueger, J., Buckberry, S., Lim, S.M., et al. (2017). Cell Type of Origin Dictates theRoute to Pluripotency. Cell Rep. 21, 2649–2660.
R Core Team (2017). R: A Language and Environment for Statistical Computing(Vienna, Austria: R Foundation for Statistical Computing).
Robin, X., Turck, N., Hainard, A., Tiberti, N., Lisacek, F., Sanchez, J.-C., and Müller, M.(2011). pROC: an open-source package for R and S+ to analyze and compare ROCcurves. BMC Bioinformatics 12, 77.
Roost, M.S., van Iperen, L., Ariyurek, Y., Buermans, H.P., Arindrarto, W., Devalla, H.D.,Passier, R., Mummery, C.L., Carlotti, F., de Koning, E.J.P., et al. (2015). KeyGenes, aTool to Probe Tissue Differentiation Using a Human Fetal Transcriptional Atlas. StemCell Rep. 4, 1112–1124.
Rustici, G., Kolesnikov, N., Brandizi, M., Burdett, T., Dylag, M., Emam, I., Farne, A.,Hastings, E., Ison, J., Keays, M., et al. (2013). ArrayExpress update--trends in databasegrowth and links to data analysis tools. Nucleic Acids Res. 41, D987-990.
Scudellari, M. (2016). How iPS cells changed the world. Nature 534, 310–312.
Siatkowski, M., Liebscher, V., and Fuellen, G. (2013). CellFateScout – a bioinformaticstool for elucidating small molecule signaling pathways that drive cells in a specificdirection. Cell Commun. Signal. 11, 85.
Si-Tayeb, K., Noto, F.K., Nagaoka, M., Li, J., Battle, M.A., Duris, C., North, P.E., Dalton,S., and Duncan, S.A. (2010). Highly efficient generation of human hepatocyte-like cellsfrom induced pluripotent stem cells. Hepatology 51, 297–305.
Stachelscheid, H., Seltmann, S., Lekschas, F., Fontaine, J.-F., Mah, N., Neves, M.,Andrade-Navarro, M.A., Leser, U., and Kurtz, A. (2014). CellFinder: a cell datarepository. Nucleic Acids Res. 42, D950-958.
Takahashi, K., and Yamanaka, S. (2006). Induction of pluripotent stem cells from mouseembryonic and adult fibroblast cultures by defined factors. Cell 126, 663–676.
Takasato, M., Er, P.X., Chiu, H.S., Maier, B., Baillie, G.J., Ferguson, C., Parton, R.G.,Wolvetang, E.J., Roost, M.S., Chuva de Sousa Lopes, S.M., et al. (2015). Kidneyorganoids from human iPS cells contain multiple lineages and model humannephrogenesis. Nature 526, 564–568.
Yu, G., and He, Q.-Y. (2016). ReactomePA: an R/Bioconductor package for reactomepathway analysis and visualization. Mol BioSyst 12, 477–479.
19 of 24
.CC-BY 4.0 International licensenot peer-reviewed) is the author/funder. It is made available under aThe copyright holder for this preprint (which was. http://dx.doi.org/10.1101/250431doi: bioRxiv preprint first posted online Jan. 19, 2018;

Running title: Evaluating Cell Identity, Mah et al.
Yu, G., Wang, L.-G., Han, Y., and He, Q.-Y. (2012). clusterProfiler: an R Package forComparing Biological Themes Among Gene Clusters. OMICS J. Integr. Biol. 16, 284–287.
Yu, J., Hu, K., Smuga-Otto, K., Tian, S., Stewart, R., Slukvin, I.I., and Thomson, J.A.(2009). Human induced pluripotent stem cells free of vector and transgene sequences.Science 324, 797–801.
Figure Titles and Legends
Figure 1. Reference cell types and the cell scoring strategy. A. The reference
expression dataset consists of samples obtained from various tissues and cells, from
public databases (see Supplementary Data S1 for a detailed list). This includes
common (green) and sex-specific tissues or cells from male (blue) and female (pink)
donors. Image of human body has been adapted from the on-line resource CellFinder
(www.cellfinder.org). B. A derived cell type, X, is evaluated in comparison to its donor
cell type A and target cell type B. C. The CellScore is the difference between the target-
like and the donor-like score components. Each component score is calculated from the
corresponding (either donor or target) marker gene expression and a measure of
expression similarity, which in this study was chosen to be the cosine similarity.
Figure 2. Principal component analysis plot of standard samples. Expression data from
a wide variety of human tissues and cells were used as reference expression profiles
for the cell scoring method.
Figure 3. The use of cosine similarity as a cell scoring metric. A. For simplicity, the
graph represents the gene expression of four samples projected in two-dimensional
space. Point D is a donor cell type used for reprogramming. Point T is the desired cell
type. Points 1 and 2 are engineered cell types, whose aim is point T. We would say that
cells of point 1 are a more successful outcome of the transition from D to T, than cells of
point 3 because cos(ΘT1) < cos(ΘT2). Note that such a comparison is different from
20 of 24
425
430
435
440
40
.CC-BY 4.0 International licensenot peer-reviewed) is the author/funder. It is made available under aThe copyright holder for this preprint (which was. http://dx.doi.org/10.1101/250431doi: bioRxiv preprint first posted online Jan. 19, 2018;

Running title: Evaluating Cell Identity, Mah et al.
using the Euclidean distance (grey circle around point D) to define similarity between
samples. Our comparison takes into account the origin and desired endpoint of the cell
transition. B. Heatmap of cosine similarity scores for all iPS reprogramming transitions.
Average cosine similarity scores (across all cell type specific samples) are shown for
various donor cells (mesenchymal stem cells, myocardium, CD34 positive cells from
umbilical cord, keratinocytes, germ stem cells, neural progenitor cells and fibroblasts
from dermis, lung, testes, gingiva, skin, colon), the target cell type (embryonic stem
cells; ESC) and the iPS cells from each donor subgroup. The iPS cells have high cosine
similarity scores compared to ESCs and cluster together at the top of the heatmap.
Donor cell types originate from highly diverse tissues (bottom half of heatmap). The cell
subtypes are formatted as: cell type, "-", donor cell type or source tissue.
Figure 4. CellScore metrics for selected transitions. A. Barplot of on/off scores for
selected transitions. A complete loss of donor markers (blue) and a gain of target cell
markers (green) indicates the most successful transition between two cell types. Shown
are all derived cell types for transitions targeting embryonic stem cells (ESC),
fibroblasts (FIB), hepatocytes (HEP), keratinocytes (KER), myocardium (MYOC), retinal
pigmented epithelium (RPE), motor neurons (MN), Schwann cells (SCHWN),
endothelial cells (EC) and neuroprogenitor cells (NPC). The experimentally derived cell
types are formatted as: derived cell type, "-", donor cell type. Bars indicate total
fractions of lost (depicted as a negative value for donor markers) or gained markers
(shown as a positive value) for all samples of one derived cell type. B. Functional
enrichment of on/off markers for the transition from donor fibroblasts to target
embryonic stem cells. Functional enrichment for two types of test cells (partially induced
iPS cells and iPS cells, both from fibroblasts) was carried out with the Reactome
pathway set. piPS-FIB cells share an enrichment profile most similar to the donor
21 of 24
445
450
455
460
465
.CC-BY 4.0 International licensenot peer-reviewed) is the author/funder. It is made available under aThe copyright holder for this preprint (which was. http://dx.doi.org/10.1101/250431doi: bioRxiv preprint first posted online Jan. 19, 2018;
Running title: Evaluating Cell Identity, Mah et al.
fibroblast cells. iPS-FIB cells are more similar to the ESCs. Notably, of the 28 target
marker genes in the category 'Developmental Biology', the iPS-FIB cells express 18 of
these, whereas the piPS cells only express four of the target marker genes. Dot size
indicates the proportion of genes present in each cell type per universe set of genes,
which was defined to be the set of all present genes in the standard data matrix.
Enrichment p-values (low to high p-values represented by a gradient of red to blue,
respectively) for each Reactome category were corrected for false discovery rate
(Benjamini and Hochberg method). C. Scatterplot of donor-like and target-like scores is
shown for 30 experimentally derived cell types. Each point represents an individual cell
line. The most successful transitions have low donor-like scores and high target-like
scores. D. Distributions of CellScore values for the same 30 cell transitions are shown
as boxplots. Positive CellScore indicates that the derived cell type is more similar to the
desired target, whereas negative CellScore indicates a higher similarity to the donor cell
type. The experimentally derived cell types are formatted as: derived cell type, "-",
donor cell type. Abbreviations: induced pluripotent stem cell (iPS), embryonic stem cell
(ESC), mesenchymal stem cell (MSC), induced cardiomyocyte (iCM), induced fibroblast
(iFIB), iHEP (induced hepatocyte), skin-derived precursor (SKP), induced keratinocyte
(iKER), induced motor neuron (iMN), induced neuron (iNEUR), induced neural
progenitor cell (iNPC), adipose stem cell (ASC), CD34+ cord blood cell (CD34), germ
stem cell (GSC), induced retinal pigmented epithelium (iRPE), induced Schwann cells
(iSCHWN), partially induced Schwann cells (piSCHWN), expanded islet cells (ISL.e),
re-differentiated expanded islet cells (ISL.d), fresh islet cells (ISL), partially induced iPS
cell (piPS), undifferentiated induced keratinocyte (uiKER).
Figure 5. CellScore case studies. Each row of figures represents a case study, and
each column shows diagnostic plots for the case study. The first column on the left
22 of 24
470
475
480
485
490
.CC-BY 4.0 International licensenot peer-reviewed) is the author/funder. It is made available under aThe copyright holder for this preprint (which was. http://dx.doi.org/10.1101/250431doi: bioRxiv preprint first posted online Jan. 19, 2018;
Running title: Evaluating Cell Identity, Mah et al.
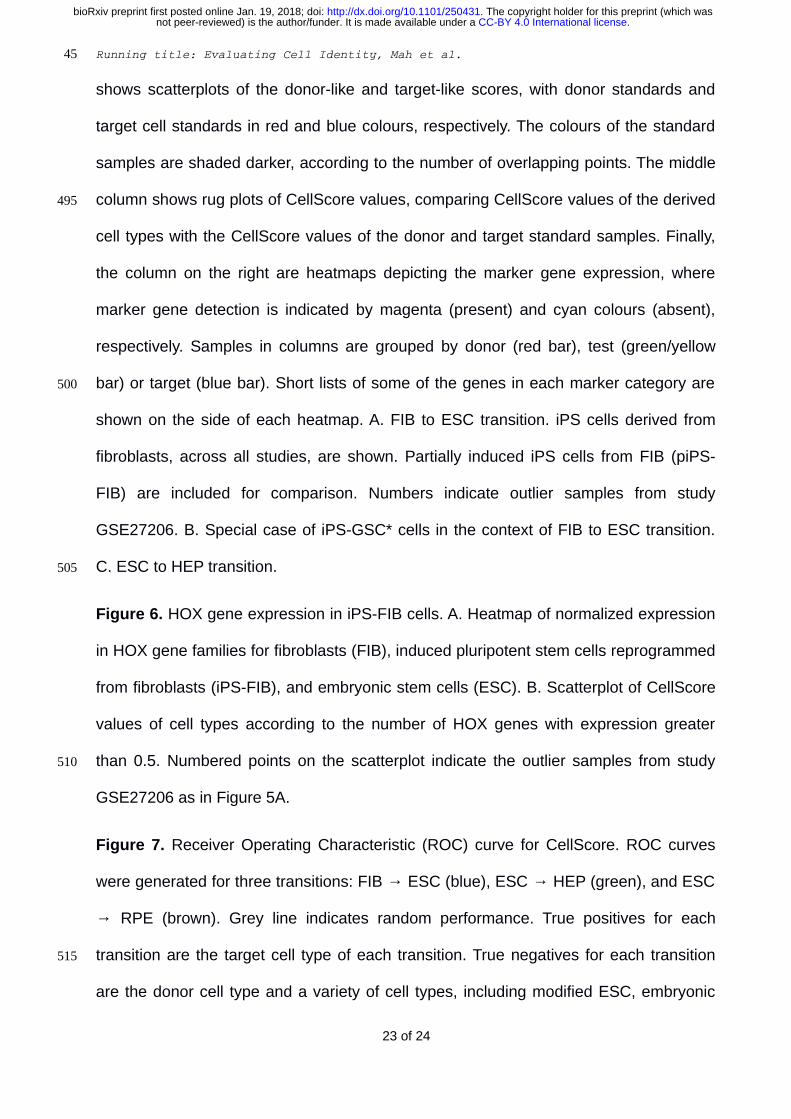
shows scatterplots of the donor-like and target-like scores, with donor standards and
target cell standards in red and blue colours, respectively. The colours of the standard
samples are shaded darker, according to the number of overlapping points. The middle
column shows rug plots of CellScore values, comparing CellScore values of the derived
cell types with the CellScore values of the donor and target standard samples. Finally,
the column on the right are heatmaps depicting the marker gene expression, where
marker gene detection is indicated by magenta (present) and cyan colours (absent),
respectively. Samples in columns are grouped by donor (red bar), test (green/yellow
bar) or target (blue bar). Short lists of some of the genes in each marker category are
shown on the side of each heatmap. A. FIB to ESC transition. iPS cells derived from
fibroblasts, across all studies, are shown. Partially induced iPS cells from FIB (piPS-
FIB) are included for comparison. Numbers indicate outlier samples from study
GSE27206. B. Special case of iPS-GSC* cells in the context of FIB to ESC transition.
C. ESC to HEP transition.
Figure 6. HOX gene expression in iPS-FIB cells. A. Heatmap of normalized expression
in HOX gene families for fibroblasts (FIB), induced pluripotent stem cells reprogrammed
from fibroblasts (iPS-FIB), and embryonic stem cells (ESC). B. Scatterplot of CellScore
values of cell types according to the number of HOX genes with expression greater
than 0.5. Numbered points on the scatterplot indicate the outlier samples from study
GSE27206 as in Figure 5A.
Figure 7. Receiver Operating Characteristic (ROC) curve for CellScore. ROC curves
were generated for three transitions: FIB → ESC (blue), ESC → HEP (green), and ESC
→ RPE (brown). Grey line indicates random performance. True positives for each
transition are the target cell type of each transition. True negatives for each transition
are the donor cell type and a variety of cell types, including modified ESC, embryonic
23 of 24
45
495
500
505
510
515
.CC-BY 4.0 International licensenot peer-reviewed) is the author/funder. It is made available under aThe copyright holder for this preprint (which was. http://dx.doi.org/10.1101/250431doi: bioRxiv preprint first posted online Jan. 19, 2018;

Running title: Evaluating Cell Identity, Mah et al.
carcinoma, induced hepatocytes, treated RPE, Wharton's jelly stem cells and cancer
cell types (brain, bladder, colon, lung, prostate).
Tables
None.
Supplemental Information
Supplementary Data S1. Spreadsheet of all samples used for reference and derived
cell types.
Supplementary Data S2. Cosine similarity score heatmap for engineered cells and all
standard cell types.
Supplementary Data S3. CellScore reports for all cell transitions and studies.
Supplementary Data S4. CellScore values and OnOff marker tables.
24 of 24
520
525
.CC-BY 4.0 International licensenot peer-reviewed) is the author/funder. It is made available under aThe copyright holder for this preprint (which was. http://dx.doi.org/10.1101/250431doi: bioRxiv preprint first posted online Jan. 19, 2018;
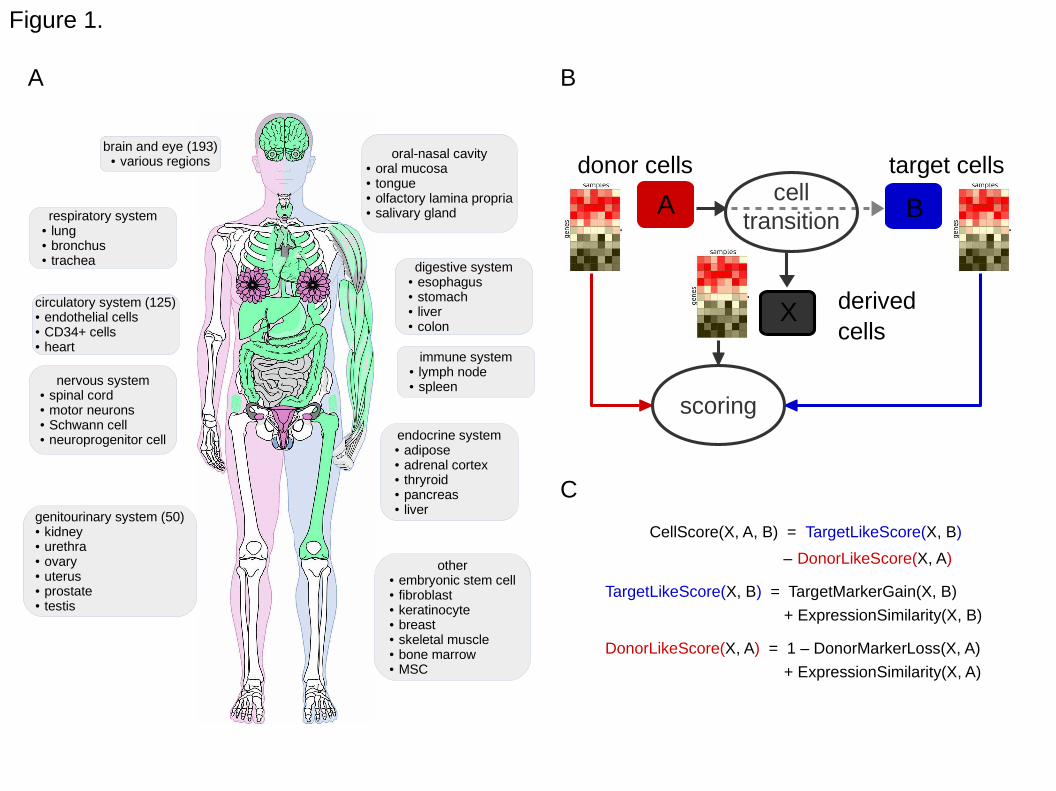
Figure 1.
A B
donor cells target cells
X derived
cells
cell
transition
scoring
A
nervous system● spinal cord● motor neurons● Schwann cell● neuroprogenitor cell
respiratory system● lung● bronchus● trachea
circulatory system (125)● endothelial cells● CD34+ cells● heart
brain and eye (193)● various regions
genitourinary system (50)● kidney● urethra● ovary● uterus● prostate● testis
other● embryonic stem cell● fibroblast● keratinocyte● breast● skeletal muscle● bone marrow● MSC
endocrine system● adipose● adrenal cortex● thryroid● pancreas● liver
immune system● lymph node● spleen
digestive system● esophagus● stomach● liver● colon
oral-nasal cavity● oral mucosa● tongue● olfactory lamina propria● salivary gland
B
CellScore(X, A, B) = TargetLikeScore(X, B)
– DonorLikeScore(X, A)
TargetLikeScore(X, B) = TargetMarkerGain(X, B)
+ ExpressionSimilarity(X, B)
DonorLikeScore(X, A) = 1 – DonorMarkerLoss(X, A)
+ ExpressionSimilarity(X, A)
C
.CC-BY 4.0 International licensenot peer-reviewed) is the author/funder. It is made available under aThe copyright holder for this preprint (which was. http://dx.doi.org/10.1101/250431doi: bioRxiv preprint first posted online Jan. 19, 2018;
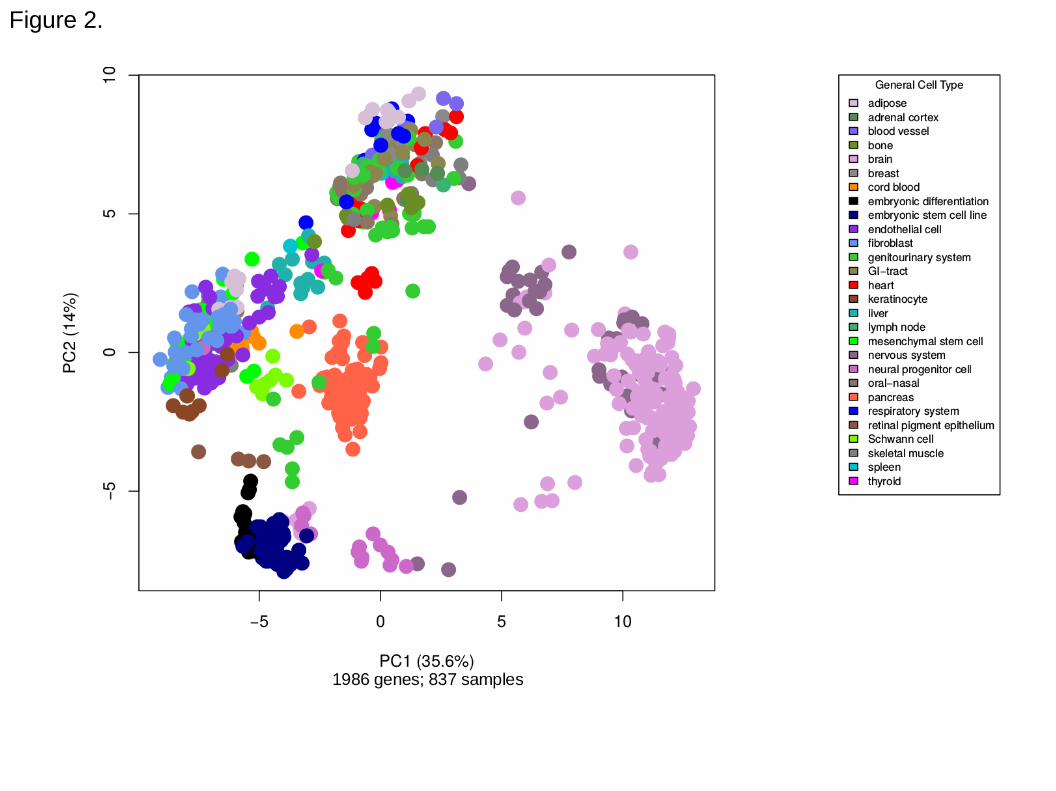
Figure 2.
.CC-BY 4.0 International licensenot peer-reviewed) is the author/funder. It is made available under aThe copyright holder for this preprint (which was. http://dx.doi.org/10.1101/250431doi: bioRxiv preprint first posted online Jan. 19, 2018;
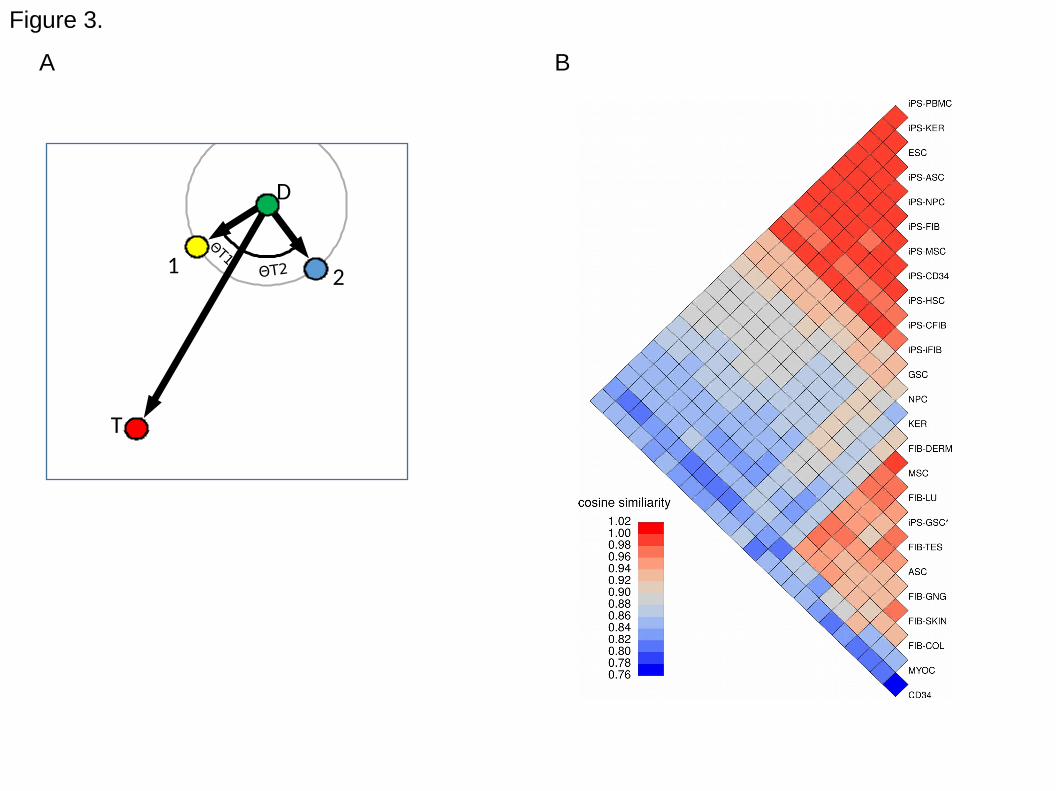
Figure 3.
1
D
2
T
ΘT2
ΘT1
A B
.CC-BY 4.0 International licensenot peer-reviewed) is the author/funder. It is made available under aThe copyright holder for this preprint (which was. http://dx.doi.org/10.1101/250431doi: bioRxiv preprint first posted online Jan. 19, 2018;
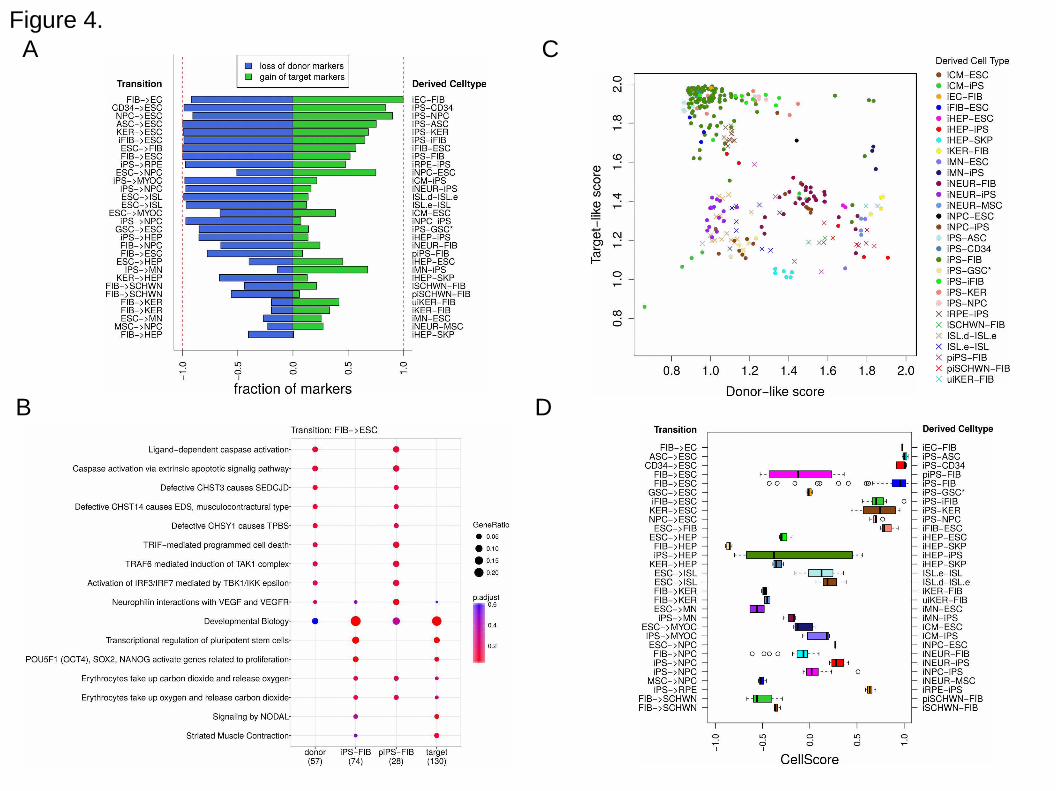
Figure 4.
A
B
C
D
.CC-BY 4.0 International licensenot peer-reviewed) is the author/funder. It is made available under aThe copyright holder for this preprint (which was. http://dx.doi.org/10.1101/250431doi: bioRxiv preprint first posted online Jan. 19, 2018;
0.8 1.0 1.2 1.4 1.6 1.8 2.0
0.8
1.0
1.2
1.4
1.6
1.8
2.0
Donor−like score
Targ
et−
like s
core
●●●
●
●
●●●
●●●● ●
●●
●
●
●●●●
●● ●
●●● ●
●
●●
●
●
●●●
●●●
●●
●
●●
●
●●
●
●
●● ●
●●
●●
●●●●
●●●●●●●●●●●
●●●●●
●●
●●●
●●●●●●●●
●●●●●●
●● ●●●
●
●●●●●
●●●●●
●●●●
●●
●●●●
●●●
Transition from FIB −> ESC
FIB (48)ESC (76)iPS−FIB (138)piPS−FIB (4)
CellScore
−1.0 −0.5 0.0 0.5 1.0
iPS−FIB
piPS−FIB
Standards ||| | ||||| |||| | ||||| ||||||||| |||| |||| |||||||| |||| ||||| | ||||||||||| |||||||||||| ||| |||||||||||||||||| ||| |||||| ||||| ||||| |||||||
|| ||||||||||| || |||||||||||| ||| ||| ||| | || | || || ||| ||||||| |||||||||||||| | |||||| ||||||||||||| || || ||||||||||||||| ||| | |||| | | |||| || |||||| ||| ||| | ||
| || |
0.8 1.0 1.2 1.4 1.6 1.8 2.0
0.8
1.0
1.2
1.4
1.6
1.8
2.0
Donor−like score
Targ
et−
like s
core
●●●
●
●
●●●
●●●● ●
●●
●
●
●●●●
●● ●
●●● ●
●
●●
●
●
●●●
●●●
●●
●
●●
●
●●
●
●
●● ●
●●
●●
●●●●
●●●●●●●●●●●
●●●●●
●●
●●●
●●●●●●●●
●●●●●●
●● ●●●
●
●●●●●
●●●●●
●●●●
●●
●●●●
●●●
Transition from FIB −> ESC
FIB (48)ESC (76)iPS−GSC* (6)piPS−FIB (4)
CellScore
−1.0 −0.5 0.0 0.5 1.0
iPS−GSC*
piPS−FIB
Standards ||| | ||||| |||| | ||||| ||||||||| |||| |||| |||||||| |||| ||||| | ||||||||||| |||||||||||| ||| |||||||||||||||||| ||| |||||| ||||| ||||| |||||||
| |||| |
| || |
0.8 1.0 1.2 1.4 1.6 1.8 2.0
0.8
1.0
1.2
1.4
1.6
1.8
2.0
Donor−like score
Targ
et−
like s
core
●●●●●
●
●●●●● ●●●●
●
●
●●●●●●●
●
●●
●●
●●●
●●●●●
●●●●
●●●●●●
●●
●●
●
●●●●●●●●●●●
●
●●●●
● ●
●●●●●
●
●● ●●●
●
●●
●
●
Transition from ESC −> HEP
ESC (76)HEP (10)iHEP−ESC (3)iHEP−iPS (5)
CellScore
−1.0 −0.5 0.0 0.5 1.0
iHEP−ESC
iHEP−iPS
Standards ||||| ||| |||||||| ||||||||||||||||||||||||| |||||||||||||||||||||| ||||||||||||| |||||| ||||
|||
|| | ||
FIBiPS−FIBpiPS−FIBESC
FIBiPS−GSC*piPS−FIBESC
ESCiHEP−ESCiHEP−iPSHEP
FAP
FGF4
FGF7
FGF5
FGF11
FGF12
FGF19
FGFR2LIN28A
NANOG
POU5F1B
LEFTY1
LEFTY2
ZIC3
TERT
CDH1
LIN28A
NANOG
POU5F1B
LEFTY1
LEFTY2
ZIC3
TERT
CDH1 ALB
CPB2
FGA
APOC2
APOH
ITIH2
C6
C8B
LIN28A
NANOG
POU5F1B
LEFTY1
LEFTY2
ZIC3
TERT
CDH1
FAP
FGF4
FGF7
FGF5
FGF11
FGF12
FGF19
FGFR2
MME
Figure 5
A
C
B
3
21
5
6
4
4 6 5 2 1 3
.CC-BY 4.0 International licensenot peer-reviewed) is the author/funder. It is made available under aThe copyright holder for this preprint (which was. http://dx.doi.org/10.1101/250431doi: bioRxiv preprint first posted online Jan. 19, 2018;
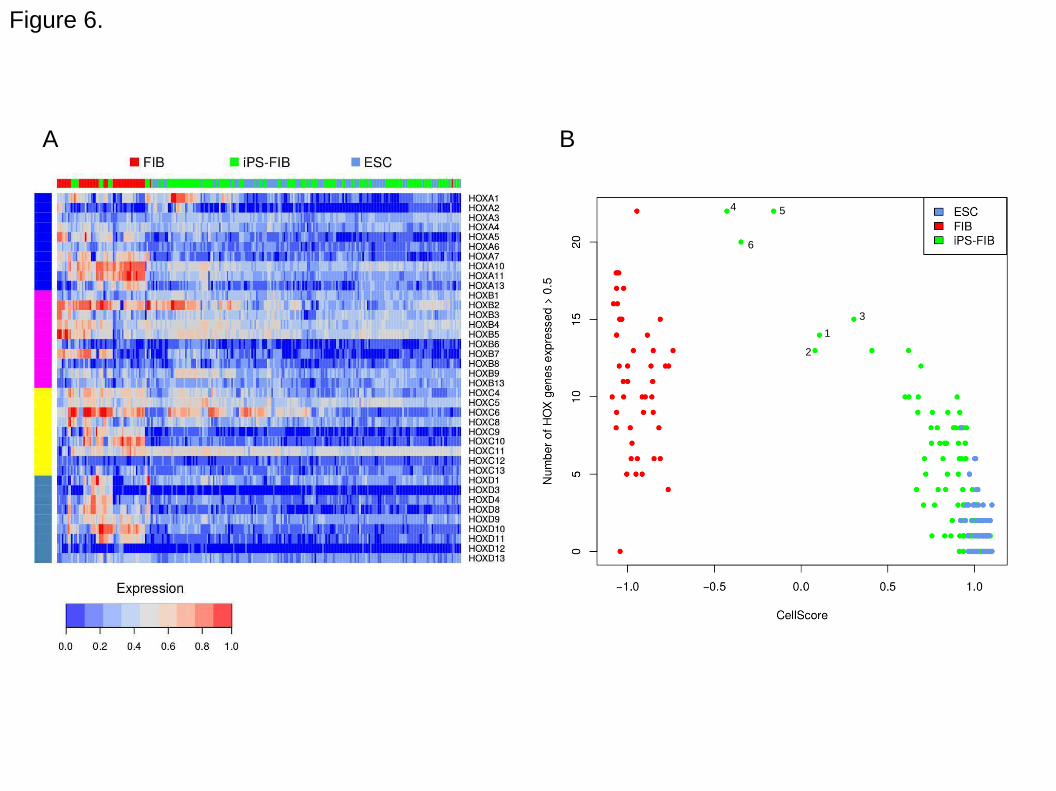
Figure 6.
A B
4 5
6
1
2
3
.CC-BY 4.0 International licensenot peer-reviewed) is the author/funder. It is made available under aThe copyright holder for this preprint (which was. http://dx.doi.org/10.1101/250431doi: bioRxiv preprint first posted online Jan. 19, 2018;
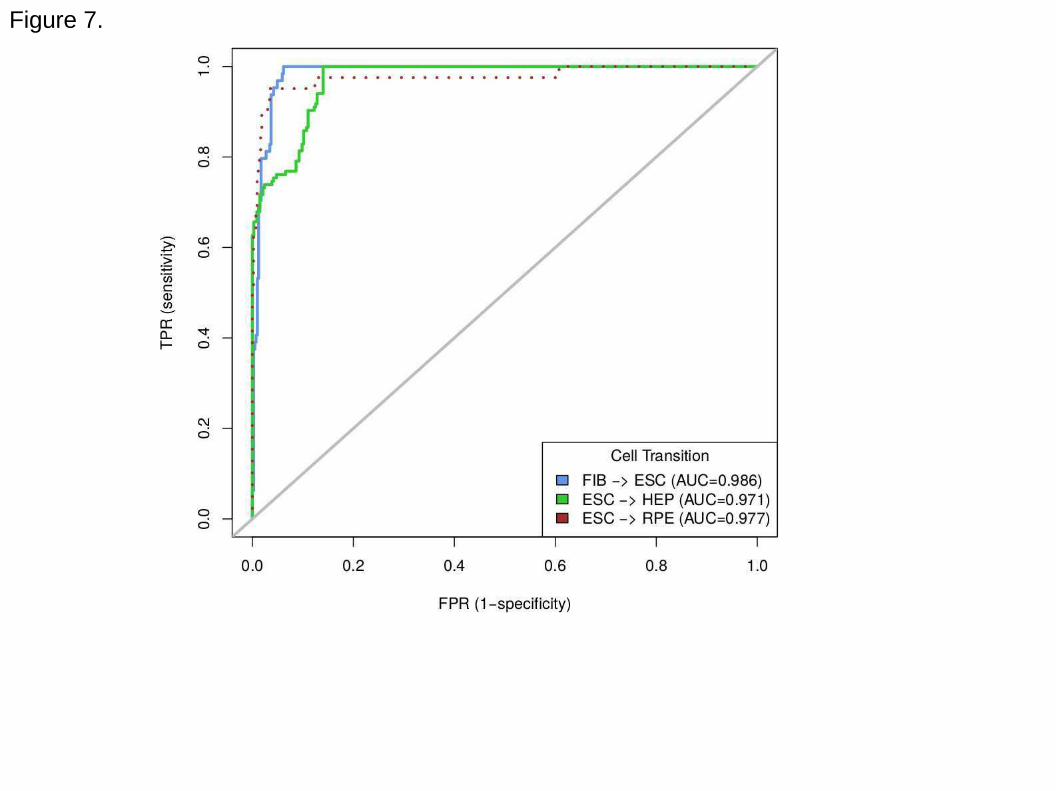
Figure 7.
.CC-BY 4.0 International licensenot peer-reviewed) is the author/funder. It is made available under aThe copyright holder for this preprint (which was. http://dx.doi.org/10.1101/250431doi: bioRxiv preprint first posted online Jan. 19, 2018;