evaluating bearing properties of wood peg connection using four different test … · 2018. 1....
TRANSCRIPT

EVALUATING BEARING PROPERTIES OF WOOD PEG CONNECTIONUSING FOUR DIFFERENT TEST METHODS
G. Y. Jeong*Associate Professor
Department of Wood Science and EngineeringChonnam National University
77 Yongbongro BukguGwangju 500-757, South Korea
E-mail: [email protected]
J. H. KongResearch Assistant
Department of Wood Science and EngineeringChonnam National University
77 Yongbongro BukguGwangju 500-757, South KoreaE-mail: [email protected]
(Received June 2017)
Abstract. The objective of this study was to evaluate appropriate test methods for the bearing properties ofwood peg connection using four different test methods: ASTM D 5764 (2013), the method of Church andTew (1997), the method of Schmidt and Daniels (1999), and the method of Schmidt and Mackay (1997).Bearing properties of wood peg connection were compared using digital image correlation. Although ASTMD 5764 (2013), the method of Church and Tew (1997), or the method of Schmidt and Daniels (1999) couldnot differentiate bearing properties by peg orientation, the method of Schmidt and Mackay (1997) coulddifferentiate such properties by peg orientation. ASTM D 5764 (2013), the method of Church and Tew(1997), and the method of Schmidt and Daniels (1999) created unrealistic strain distributions which affectedyield load determined from the load–displacement curve. The method of Schmidt and Mackay (1997)showed the highest strain distribution at the bearing area between the wood peg and the main member,resulting in load–displacement curve by bearing mainly. These results suggest that the method of Schmidtand Mackay (1997) could determine the bearing properties of wood peg connection.
Keywords: Bearing properties, connection, digital image correlation, stress, strain, wood peg.
INTRODUCTION
Wood peg connections have been used in tradi-tional timber frame buildings for connectingbeam to column, column to column, and beam tobeam. Depending on the bearing strength ofwood materials used for the main member and thewood peg, the bearing strength of wood pegconnection could be determined. To design woodpeg connections, predicting the strength of woodpeg connection associated with failure behaviorand a guideline for determining the end distanceof wood peg are required.
Burnett et al (2003) investigated the effect of enddistance of wood peg on stiffness and strength ofwood peg connections. Double shear test wasconducted for different main members and sidemembers made of Douglas-fir (Pseudotsugamenziesii), eastern white pine (Pinus strobus),and northern red oak (Quercus rubra) usingnorthern red oak peg. The stiffness of wood pegjoint from these three species did not decreasewith a decrement in end distance. The strengthwas decreased with a decrement in end distancewhen Douglas-fir (P. menziesii) was used as themain member for wood peg joint. However, thestrength was not decreased with a decrement ofend distance up to 50% of National DesignSpecification requirement (AWC 2015) when* Corresponding author
Wood and Fiber Science, 50(1), 2018, pp. 1-13© 2018 by the Society of Wood Science and Technology
eastern white pine or northern red oak was used asthe main member.
Shanks and Walker (2009) predicted the strengthand stiffness of wood peg connection using en-ergy approach and a four-point bending analogy.The analytical model assumed that wood pegshowed idealized elastoplastic behavior and theyield load was dependent on shear span and yieldmoment of wood peg. By assuming that mostenergy was absorbed by wood peg, the strengthand stiffness of wood peg connection werepredicted.
Sandberg et al (2000) have developed a pre-diction equation for the bearing strength of woodpeg connection. Red oak (Q. rubra) wood pegand white pine (P. strobus) or sugar maple (Acersaccharum) main members were used in theirstudy. The strength of the wood peg connectionwas determined from six different failure modesfor double shear of wood peg connection. Thefirst four failure modes were similar to the failuremodes shown in NDS. Two additional failuremodes were a bearing failure in the peg anda shear failure in the peg. A prediction equationfor the stiffness of wood peg connection wassuggested. It could be used to predict mortise andtenon joint based on the stiffness of the wood pegand the main member.
Miller et al (2010) suggested a design method forshear yield of wood peg. The predicted equationfor yield stress of peg was developed based on thepeg and base material–specific gravities. A re-duction factor of 3.44 for the shear yield of woodpeg was calculated using the ratio between pre-dicted yield equation from least square regressionand the predicted equation from the Monte Carlosimulation.
Although the bearing strength of wood pegconnection could be predicted based on previousstudies (Sandberg et al 2000; Miller et al 2010)and the end distance of wood peg connection wasguided from Burnet et al (2003), the predictedbearing strength of differently oriented woodpeg and main member should be determinedbased on a reliable experimental test. The stan-dard for designing timber frame structures and
commentary (TFEC 1 2007) has provided designguidelines for wood peg connections and sug-gested three different approaches to determine thebearing properties of wood peg connection inTFEC 1 (2007).
Different approaches can be used to determinethe bearing properties of wood peg connec-tions based on previous studies, including Churchand Tew (1997), Schmidt and Mackay (1997),Schmidt and Daniels (1999), and ASTM (2013).Church and Tew (1997) applied a modifiedbearing strength of wood peg connection. Effectsof peg orientation, peg diameter, orientation ofmain member, main member species, and holeclearance on the bearing strength of woodpeg connection were determined. Their resultsshowed that peg orientation, peg diameter, andhole clearance did not significantly influence thebearing strength of wood peg connection.However, orientations of main member signifi-cantly influenced the bearing strength of woodpeg connection.
Schmidt and Mackay (1997) suggested a dowel-bearing test fixture to determine the bearingproperties of differently oriented wood pegconnections. Schmidt and Daniels (1999) sug-gested a prediction equation to determine thebearing strength of wood peg connection. Thisprediction equation was based on two separateexperimental tests for the stiffness of the woodpeg and the main member. From the sum of theload of the wood peg and the main member at thesame displacement, a load–displacement curve ofwood peg connection was plotted and the yieldload was determined with a 5% offset.
In this study, different test methods including themethod of Schmidt and Mackay (1997), themethod of Church and Tew (1997), the methodof Schmidt and Daniels (1999), and ASTM D5764 (2013) were used to determine the bear-ing properties of differently oriented woodpeg connections. Strain distribution around thebearing area was examined. In addition, statis-tical comparisons of different test methods wereconducted to determine the effect of wood pegorientation on the bearing strength.
WOOD AND FIBER SCIENCE, JANUARY 2018, V. 50(1)2
MATERIAL AND METHODS
Materials
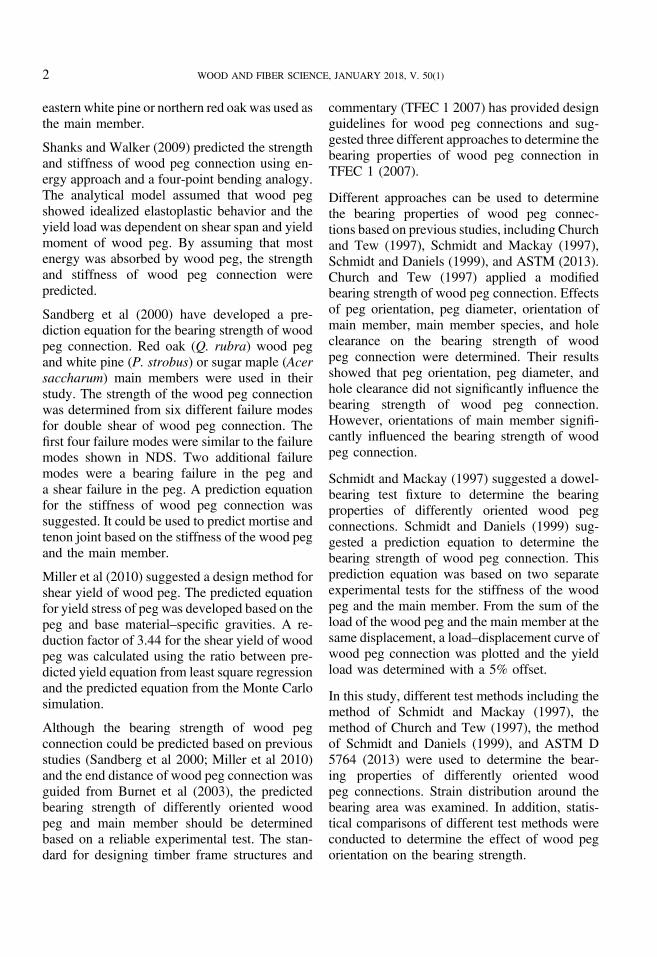
Differently oriented main members and woodpegs made of ash (Fraxinus rhynchophylla) areshown in Fig 1. Main members were fabricatedfrom 120 � 120 � 3600-mm 5-ply glulam madeof Japanese cedar (Cryptomeria japonica) fromKyungmin Co., Ltd (South Korea). Specificgravity of the main member was 0.37. The sizeof the main member was 120 � 120 � 140 mm.A 20-mm half hole was bored using a drill. Tofind a reliable test method for wood peg con-nection, two different orientations of the mainmember (radial-longitudinal [RL] and tangential-longitudinal [TL]) and 20-mm-diameter woodpeg were prepared. The first letter indicated theplane parallel to the length direction of wood pegwhereas the second letter indicated the loadingdirection. Specific gravity of wood peg was 0.63.Two different wood peg grain directions (parallelto the load direction [PA] and perpendicular to theload direction [PE]) were tested with differentorientations of the main member.
Methods
To determine the bearing properties of woodpeg connection, the methods of ASTM D 5764(2013), Church and Tew (1997), Schmidt andDaniels (1999), and Schmidt and Mackay (1997)were compared. For each test method, a minimum
of 20 specimens were conducted. Universaltesting machine equipped with a 150-kN load cellwas used to apply compression load. The loadwas applied at a loading rate of 1 mm/min untilthe load was dropped 60% from the peak load.
Figure 2 shows different testmethods for evaluatingthe bearing properties of wood peg connections.Figure 2(a) shows ASTM D 5764. It applies theload directly to thewood peg. Figure 2(b) shows themethod used by Church and Tew (1997). It ap-plies the load to the main member to avoidcrushing of the wood peg. Figure 2(c) shows themethod of Schmidt and Daniels (1999). For thismethod, two separate bearing tests are conductedfor the main member and the wood peg. Load–displacement curves from the main member andthe wood peg are analytically combined to cal-culate the bearing properties of wood peg con-nection using Eq 1. The bearing strength of woodpeg in PA and PE is then determined (Fig 2(c)).
1Ktotal
¼ 1Kpeg
þ 1Kbase
; (1)
where
Ktotal: stiffness of wood peg connection;Kpeg: stiffness of wood peg;Kbase: stiffness of main member.
Figure 2(d) shows the method of Schmidt andMackay (1997). It uses a metal plate with a
Figure 1. Differently oriented main member (radial-longitudinal [RL] and tangential-longitudinal [TL], the first letterindicates the length direction of wood peg and the second letter indicates the loading direction) and wood peg (parallel to theload direction [PA]: the grain of wood is parallel to the loading direction; perpendicular to the load direction [PE]: the grain ofwood is perpendicular to the loading direction).
Jeong and Kong—BEARING PROPERTIES OF WOOD PEG CONNECTION 3

semicylindrical slot to prevent crushing of woodpeg. The load is applied to the main member. Inthe four different methods, the bearing strength(σb) was determined using Eq 2:
Bearing strength ðMPaÞ ¼ Py
ðT �DÞ; (2)
where
Py: 5% offset yield load (N);T: Thickness of the bearing specimen (mm);D: Diameter of wood peg (mm).
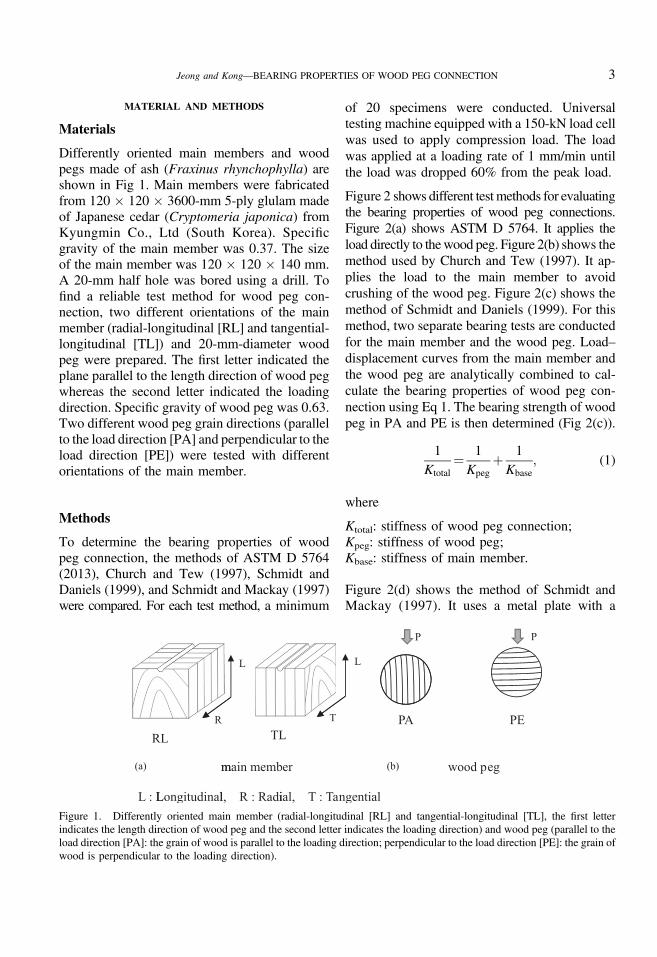
Figure 3 shows experimental test setup associatedwith digital image correlation (DIC) to determinethe bearing strength and strain distributions ofdifferently oriented wood peg connections. Toanalyze strain distribution of wood peg connec-tion, a DIC technique was applied. Two charge-coupled device (CCD) cameras were mounted ona stereo plate with a distance of 35 cm betweenthe two cameras. The angle of the camera wasadjusted to see the same point of view of thespecimen. The distance between the camera andobject was 50 cm to provide enough field of viewto analyze strain distribution of the specimen andobtain clear images. To obtain proper contrast, anLED lamp was used to light the specimen evenly.
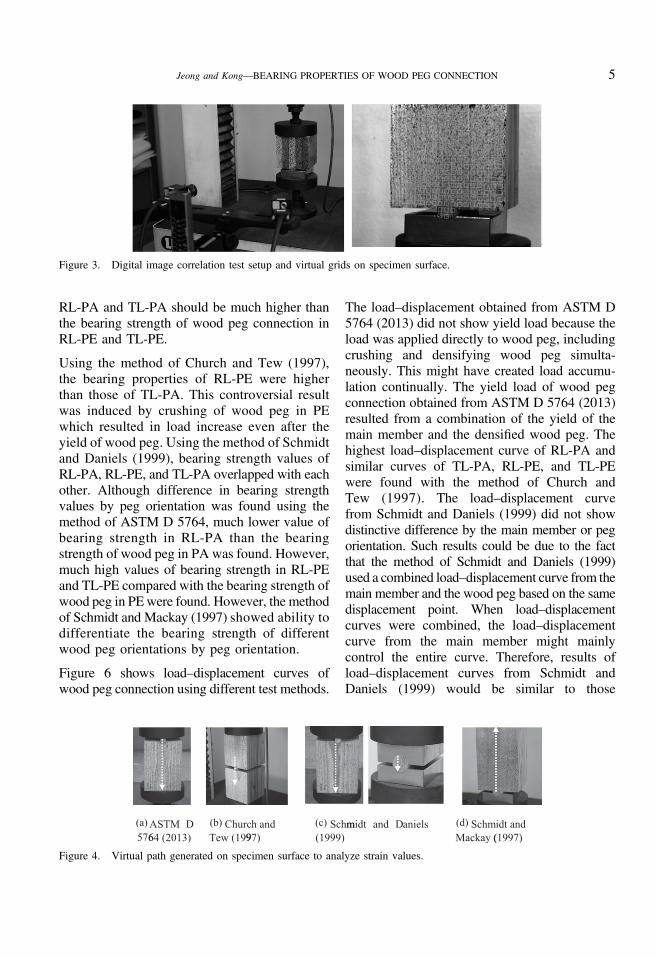
Image of the specimen surface was taken ata rate of 10 frames per second until the specimenfailed or after yield. The resolution of the imagewas 640 � 480 pixel. The pixel dimension was7.4 µm � 7.4 µm. DIC was conducted usingAramis software (GOM). Figure 4 shows a path
definition to analyze strain values along pathdirections. To analyze strain x, strain y, and shearstrain xy along the path, 100 data points weredefined along the path.
Two-way analysis of variance (ANOVA) com-parison with an alpha value of 0.05 was used forstatistical comparisons among bearing strengthvalues of differently oriented bearing specimensusing the four test methods. The null hypothesiswas that all bearing strength means from dif-ferently oriented bearing specimen were equalto each other. Comparisons between RL-PAand RL-PE, TL-PA and TL-PE, RL-PA andTL-PA, RL-PA and TL-PE, RL-PE and TL-PA,and RL-PE and TL-PE were conducted.
RESULTS AND DISCUSSION
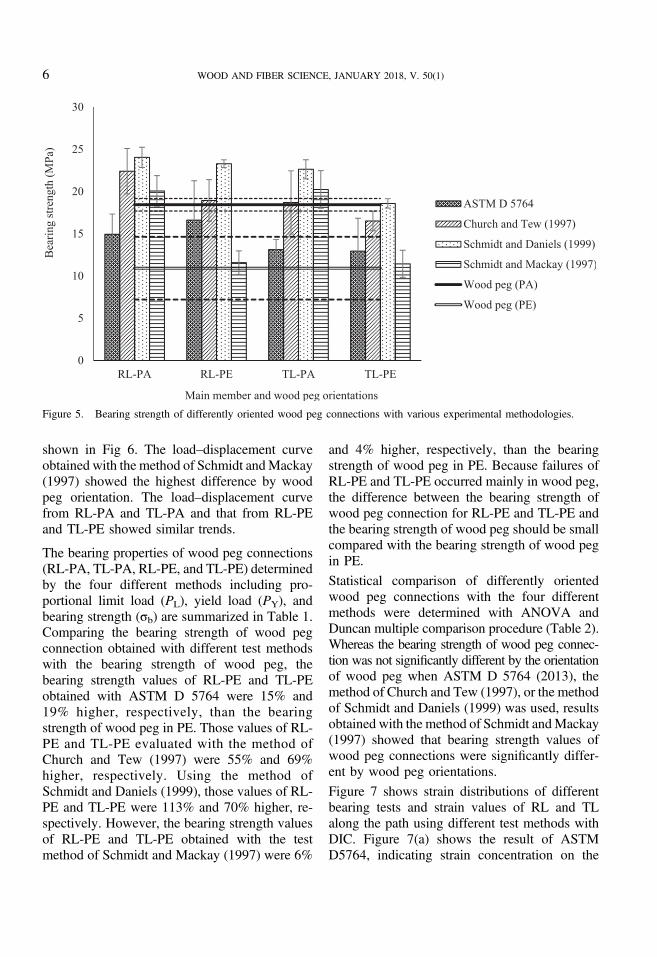
Figure 5 shows the bearing properties of differ-ently oriented specimens determined by the fourtest methods. Two solid lines indicated the av-erage bearing strength of wood pegs in PA andPE. Dotted lines indicated standard deviation ofthe bearing strength of wood pegs. The bearingstrength values of wood peg in PA and PE de-termined from experimental tests were importantbecause these values could show the maximumbearing strength of wood peg connection. Thebearing strength of wood peg connection could bedetermined by either wood peg or the mainmember. For example, because the bearingstrength of wood peg in PAwas much higher thanthe bearing strength of wood peg in PE, thebearing strength of wood peg connection in
Figure 2. Different experimental methodologies used for determination of bearing strength of wood peg connection. (a)ASTM D 5764 (2013), (b) Method of Church and Tew (1997), (c) Method of Schmidt and Daniels (1999), and (d) Method ofSchmidt and Mackay (1997).
WOOD AND FIBER SCIENCE, JANUARY 2018, V. 50(1)4
RL-PA and TL-PA should be much higher thanthe bearing strength of wood peg connection inRL-PE and TL-PE.
Using the method of Church and Tew (1997),the bearing properties of RL-PE were higherthan those of TL-PA. This controversial resultwas induced by crushing of wood peg in PEwhich resulted in load increase even after theyield of wood peg. Using the method of Schmidtand Daniels (1999), bearing strength values ofRL-PA, RL-PE, and TL-PA overlapped with eachother. Although difference in bearing strengthvalues by peg orientation was found using themethod of ASTM D 5764, much lower value ofbearing strength in RL-PA than the bearingstrength of wood peg in PA was found. However,much high values of bearing strength in RL-PEand TL-PE compared with the bearing strength ofwood peg in PEwere found. However, the methodof Schmidt and Mackay (1997) showed ability todifferentiate the bearing strength of differentwood peg orientations by peg orientation.
Figure 6 shows load–displacement curves ofwood peg connection using different test methods.
The load–displacement obtained from ASTM D5764 (2013) did not show yield load because theload was applied directly to wood peg, includingcrushing and densifying wood peg simulta-neously. This might have created load accumu-lation continually. The yield load of wood pegconnection obtained from ASTM D 5764 (2013)resulted from a combination of the yield of themain member and the densified wood peg. Thehighest load–displacement curve of RL-PA andsimilar curves of TL-PA, RL-PE, and TL-PEwere found with the method of Church andTew (1997). The load–displacement curvefrom Schmidt and Daniels (1999) did not showdistinctive difference by the main member or pegorientation. Such results could be due to the factthat the method of Schmidt and Daniels (1999)used a combined load–displacement curve from themain member and the wood peg based on the samedisplacement point. When load–displacementcurves were combined, the load–displacementcurve from the main member might mainlycontrol the entire curve. Therefore, results ofload–displacement curves from Schmidt andDaniels (1999) would be similar to those
Figure 3. Digital image correlation test setup and virtual grids on specimen surface.
Figure 4. Virtual path generated on specimen surface to analyze strain values.
Jeong and Kong—BEARING PROPERTIES OF WOOD PEG CONNECTION 5
shown in Fig 6. The load–displacement curveobtained with the method of Schmidt andMackay(1997) showed the highest difference by woodpeg orientation. The load–displacement curvefrom RL-PA and TL-PA and that from RL-PEand TL-PE showed similar trends.
The bearing properties of wood peg connections(RL-PA, TL-PA, RL-PE, and TL-PE) determinedby the four different methods including pro-portional limit load (PL), yield load (PY), andbearing strength (σb) are summarized in Table 1.Comparing the bearing strength of wood pegconnection obtained with different test methodswith the bearing strength of wood peg, thebearing strength values of RL-PE and TL-PEobtained with ASTM D 5764 were 15% and19% higher, respectively, than the bearingstrength of wood peg in PE. Those values of RL-PE and TL-PE evaluated with the method ofChurch and Tew (1997) were 55% and 69%higher, respectively. Using the method ofSchmidt and Daniels (1999), those values of RL-PE and TL-PE were 113% and 70% higher, re-spectively. However, the bearing strength valuesof RL-PE and TL-PE obtained with the testmethod of Schmidt and Mackay (1997) were 6%
and 4% higher, respectively, than the bearingstrength of wood peg in PE. Because failures ofRL-PE and TL-PE occurred mainly in wood peg,the difference between the bearing strength ofwood peg connection for RL-PE and TL-PE andthe bearing strength of wood peg should be smallcompared with the bearing strength of wood pegin PE.
Statistical comparison of differently orientedwood peg connections with the four differentmethods were determined with ANOVA andDuncan multiple comparison procedure (Table 2).Whereas the bearing strength of wood peg connec-tion was not significantly different by the orientationof wood peg when ASTM D 5764 (2013), themethod of Church and Tew (1997), or the methodof Schmidt and Daniels (1999) was used, resultsobtained with the method of Schmidt andMackay(1997) showed that bearing strength values ofwood peg connections were significantly differ-ent by wood peg orientations.
Figure 7 shows strain distributions of differentbearing tests and strain values of RL and TLalong the path using different test methods withDIC. Figure 7(a) shows the result of ASTMD5764, indicating strain concentration on the
Figure 5. Bearing strength of differently oriented wood peg connections with various experimental methodologies.
WOOD AND FIBER SCIENCE, JANUARY 2018, V. 50(1)6

upper part of the wood peg. When ASTM D5764was used, two peaks were observed in the uppertip of the wood peg near the loading head andbearing area, respectively.
Figure 7(b) shows strain distributions when themethod of Church and Tew (1997) was used.Although two high strain peaks were observed atthe bearing area between the main member andthe wood peg, higher strain peak was constantlyobserved at the upper bearing area close to theload applied. The uneven strain distribution be-tween the upper bearing area and the lowerbearing area created different stress distribution.Whereas crushing of the wood peg occurred at theupper part, bearing of the main member occurredat the lower part. Such uneven strain distributioncreated different stress partitioning at the two bearingareas, resulting in similar load–displacement curvesregardless of peg orientation (Fig 6).
Figure 7(c) shows strain distribution when themethod of Schmidt and Daniels (1999) was used.
Different high strain distributions were observedin different locations for both the main memberand the wood peg. High strain distribution aroundthe bearing area occurred from the main member.For the wood peg in PE, the highest strain oc-curred in the middle of the peg. Using the methodof Schmidt and Daniels (1999), the highest strainoccurred at the bearing area. However, it was thelowest among values obtained from the four testmethods. Because the main member and the woodpeg were tested separately in Fig 7(c), strain dis-tribution from two separate tests could not repre-sent strain distribution of wood peg connection.
Figure 7(d) shows strain distributions when themethod from Schmidt and Mackay (1997) wasused. High strain distribution occurred around thebearing area between the wood peg and the mainmember which dominantly controlled the load–displacement curve in Fig 6. It can be speculatedthat the load–displacement curve occurred mainlyby bearing between the wood peg and the main
Figure 6. Load–displacement curves of differently oriented wood peg connections with various experimentalmethodologies.
Jeong and Kong—BEARING PROPERTIES OF WOOD PEG CONNECTION 7

member. The bearing should be influenced by thecharacteristics of the wood peg and the mainmember. In other words, results from the methodof Schmidt and Mackay (1997) could determinethe effect of peg and main member orientation onthe bearing strength of wood peg connections.
Based on the results obtained with different testmethods, ASTM D 5764 (2013) created stressconcentration and crushing at the top of the woodpeg where the load was applied. This influencedthe load–displacement curve. The bearingstrength obtained with ASTM D 5764 (2013) didnot differ by wood peg orientation. The bearingstrength of wood peg connection obtained withthe method of Church and Tew (1997) showedmuch higher bearing strength values than thebearing strength of wood peg alone. The bearingstrength determined with the method of Churchand Tew (1997) showed that the bearing strengthof RL-PE was higher than the bearing strength ofTL-PA. The method of Schmidt and Daniels
(1999) showed much higher bearing strength ofRL-PA, RL-PE, and TL-PA than the bearingstrength of wood peg. The method of Schmidt andDaniels (1999) did not showdifference bywood pegorientation either. However, the method of Schmidtand Mackay (1997) showed difference in thebearing strength of wood peg connection bywood peg orientation. Strain distribution fromwood peg connection also indicated that thehighest strain occurred at the bearing area be-tween the wood peg and the main member, whichresulted in a load–displacement curve by bearing.Therefore, the method of Schmidt and Mackay(1997) should provide reliable results for thedetermination of wood peg connection.
CONCLUSIONS
Four different test methods were evaluated to findan appropriate test method for the determination ofthe bearing properties of wood peg connections.The bearing properties of wood peg connections
Table 2. Comparison of differently oriented bearing properties (MPa) from various experimental tests by Duncan analysis ofvariance (means with the same letter [A or B] are not significantly different).
Methodology
Orientations
RL-PA RL-PE TL-PA TL-PE p-value
ASTM D 5764 14.93 A 13.12 A 16.62 A 12.92 A 0.443Church and Tew (1997) 22.39 A 18.93 B 18.70 B 16.50 B 0.007Schmidt and Daniels (1999) 22.04 A 23.28 A 22.62 A 18.59 B <0.001Schmidt and Mackay (1997) 20.06 A 11.57 B 20.23 A 11.43 B <0.001
Table 1. Comparison of bearing properties with ASTMD 5764 (2013), the method of Church and Tew (1997), the method ofSchmidt and Daniels (1999), and the method of Schmidt and Mackay (1997).
Orientations Bearing properties ASTM D 5764(2013) Church and Tew (1997) Schmidt and Daniels (1999)Schmidt and
Mackay (1997) Wood peg
RL PA PL (kN) 18.62 (0.28)a
29.59 (0.17) 38.54 (0.09) 34.93 (0.06) 28.89 (0.05)PY (kN) 33.96 (0.16) 45.08 (0.21) 54.80 (0.05) 47.97 (0.10) 44.24 (0.04)σb (MPa) 14.94 (0.16) 22.40 (0.12) 24.04 (0.05) 20.07 (0.09) 18.43 (0.04)
PE PL (kN) 15.70 (0.39) 23.07 (0.15) 38.86 (0.15) 23.66 (0.14) 20.21 (0.19)PY(kN) 29.85 (0.27) 37.21 (0.18) 51.76 (0.07) 27.28 (0.10) 26.21 (0.34)σb (MPa) 13.13 (0.28) 18.94 (0.13) 23.29 (0.02) 11.58 (0.12) 10.92 (0.34)
TL PA PL (kN) 19.24 (0.04) 24.41 (0.20) 38.71 (0.11) 33.55 (0.08) 28.89 (0.05)PY (kN) 37.87 (0.09) 37.04 (0.29) 53.52 (0.06) 48.24 (0.11) 44.24 (0.04)σb (MPa) 16.62 (0.09) 18.71 (0.20) 22.63 (0.05) 20.24 (0.11) 18.43 (0.04)
PE PL (kN) 19.76 (0.14) 22.55 (0.16) 35.14 (0.16) 24.25 (0.12) 20.21 (0.19)PY (kN) 29.64 (0.29) 33.19 (0.10) 49.70 (0.09) 27.22 (0.14) 26.21 (0.34)σb (MPa) 12.95 (0.30) 16.51 (0.07) 18.59 (0.03) 11.44 (0.14) 10.92 (0.34)
RL, radial-longitudinal; TL, tangential-longitudinal; PA, parallel to the load direction; PE, perpendicular to the load direction.a Coefficient of variation.
WOOD AND FIBER SCIENCE, JANUARY 2018, V. 50(1)8

(RL-PA, TL-PA, RL-PE, and TL-PE) determinedfromASTMD 5764 (2013), the method of Churchand Tew (1997), the method of Schmidt andDaniels (1999), and the method of Schmidt andMackay (1997). The bearing strength of wood pegwas 18.43 MPa in PA and 10.92 MPa in PE.
Because failures of RL-PE and TL-PE occurredmainly in wood peg, the difference between thebearing strength of wood peg connection for RL-PE and TL-PE and the bearing strength of woodpeg should be small compared with the bearingstrength of wood peg in PE.
Figure 7. Strain values along the path and strain distributions from differently oriented wood peg connections at yield load.
Jeong and Kong—BEARING PROPERTIES OF WOOD PEG CONNECTION 9

Figure 7. (Continued)
WOOD AND FIBER SCIENCE, JANUARY 2018, V. 50(1)10

Whereas the bearing strength values of RL-PEand TL-PE obtained with the test method ofSchmidt and Mackay (1997) were 6% and 4%higher, respectively, than the bearing strength of
wood peg in PE, those values of RL-PE and TL-PE evaluated with ASTM D 5764 (2013), themethod of Church and Tew (1997), and themethod of Schmidt and Daniels (1999) ranged
Figure 7. (Continued)
Jeong and Kong—BEARING PROPERTIES OF WOOD PEG CONNECTION 11

Figure 7. (Continued)
WOOD AND FIBER SCIENCE, JANUARY 2018, V. 50(1)12

from 15% to 113% higher than the bearingstrength of wood peg in PE.
Although the bearing strength of wood pegconnection should be characterized by eitherbearing strength of the wood peg or bearingstrength of the main member, ASTM D 5764(2013), the method of Church and Tew (1997),and the method of Schmidt and Daniels (1999)failed to show differences in bearing strength bywood peg orientations.
However, the bearing strength obtained with thetest method of Schmidt and Mackay (1997)showed differences by wood peg orientations.The method of Schmidt and Mackay (1997)showed high strain distribution around thebearing area between the wood peg and the mainmember, which resulted in different load–displacement curves by wood peg orientations.
Stress concentration and crushing at the top of thewood peg from ASTM D 5764 (2013) and theuneven strain distribution between the upperbearing area and the lower bearing area from themethod of Church and Tew (1997) and differenthigh strain distributions were observed in dif-ferent locations for both the main member and thewood peg from Schmidt and Daniels (1999)influenced the load–displacement curves, whichresulted in bearing properties regardless of themain member orientation associated with the pegorientation.
These results suggest that the test method ofSchmidt and Mackay (1997) could be used todetermine the bearing properties of wood pegconnection affected by the material properties ofthe main member and the wood peg.
ACKNOWLEDGMENT
This study was financially supported by Chon-nam National University (Grant number: 2016-2641)
REFERENCES
AWC (2015) National design specification for wood con-struction. American Wood Council, Washington, DC.
ASTM(2013) Standard testmethod for evaluating dowel-bearingstrength of wood and wood based products (D5764-97a).Annual book of standards, vol. 04.10. Philadelphia,PA, America Society of Civil Engineer. 1997. NationalDesign and Specification for Timber Construction ofU.S.ASCE.
Burnett DT, Clouston P, Damery DT, Fisette P (2003)Strucutural properties of pegged timber connections asaffected by end distance. Forest Prod J 53(2):50-57.
Church JR, Tew BW (1997) Characterizaion of bearingfactors in pegged timber connections. J Struct Eng 123(3):326-332.
GOMmbH (2007)ARAMIS usermanual—Software. aramis_v6_1st_en_revc, Braunschweig, Germany.
Miller JF, Schmidt RJ, Bulleit WM (2010) New yieldmodel for wood dowel connections. J Struct Eng 126(10):1255-1261.
Sandberg LB, Bulleit WM, Reid EH (2000) Strength andstiffness of oak pegs in traditional timber-frame joints.J Struct Eng 126(6): 171-723.
Schmidt RJ, Daniels CE (1999) Design considerations formortise and tenon connections. Research report, De-partment of Civil and Architectural Engineering, Uni-versity of Wyoming, Laramie, WY.
Schmidt RJ, Mackay RB (1997) Timber frame tensionjoinery. Research report, Department of Civil and Ar-chitectural Engineering, University of Wyoming, Laramie,WY.
Shanks JD, Walker P (2009) Strength and stiffness of all-timber pegged connections. J Mater Civ Eng 21(1):10-18.
Timber Frame Engineering Council (TFEC 1) (2007)Standard for design of timber frame structures and com-mentary. Beckett, MA.
Jeong and Kong—BEARING PROPERTIES OF WOOD PEG CONNECTION 13