evalua&on)of)gridded)historical) climate)data)for)great ... ·...
TRANSCRIPT

Evalua&on)of)Gridded)Historical)Climate)Data)for)Great)Lakes)
Region �
Siyu%Chen�4/26/2016%

• Background�• Methods�• Conclusions�• Acknowledgements��
�
������
������

Background
• ObjecBve�����Evaluate%the%presentaBveness%of%the%gridded%historical%climate%data%for%Great%Lakes%Region��
����
�
%

Background
• Data������Source:%Earth%System%Research%Laboratory%(University%of%Delaware)�����Temporal%Coverage:%Temporal%Monthly%air%temperature%/%precipitaBon%values%%%%%%%%for%1900/01%Q%2010/12%�����SpaBal%Coverage:%0.5°%x%0.5°%global%grid%(720x360).�������������������������������������������������������������������89.75°N%Q%89.75°S,%0.25°E%Q%359.75°E.��%
h[p://www.esrl.noaa.gov/psd/data/gridded/data.UDel_AirT_Precip.html�%
Background
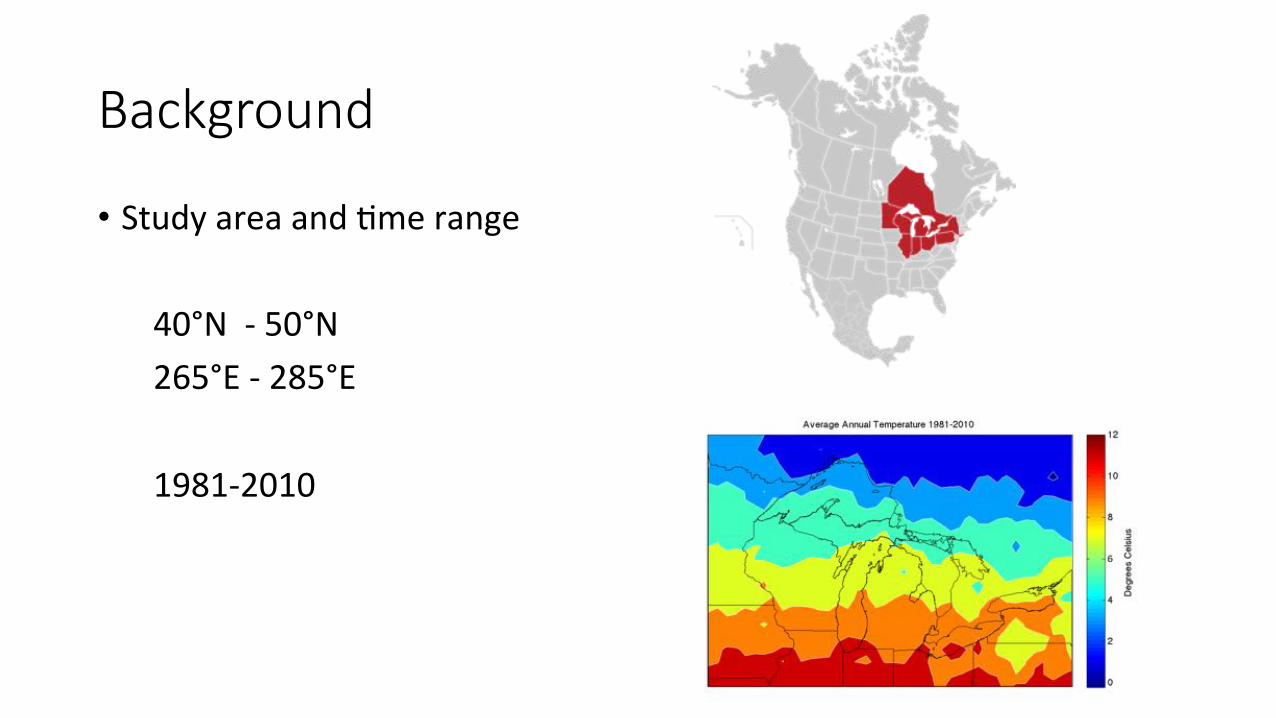
• Study%area%and%Bme%range�
���40°N%%Q%50°N����265°E%Q%285°E����
���1981Q2010��
�
%

• Background�• Methods�• Conclusions�• Acknowledgements��
�
������
������
Methods�
• Analysize%the%temperature%data�
JAN%% FEB% MAR% APR%
MAY% JUN% JUL% AUG%
SEP% OCT% NOV% DEC%
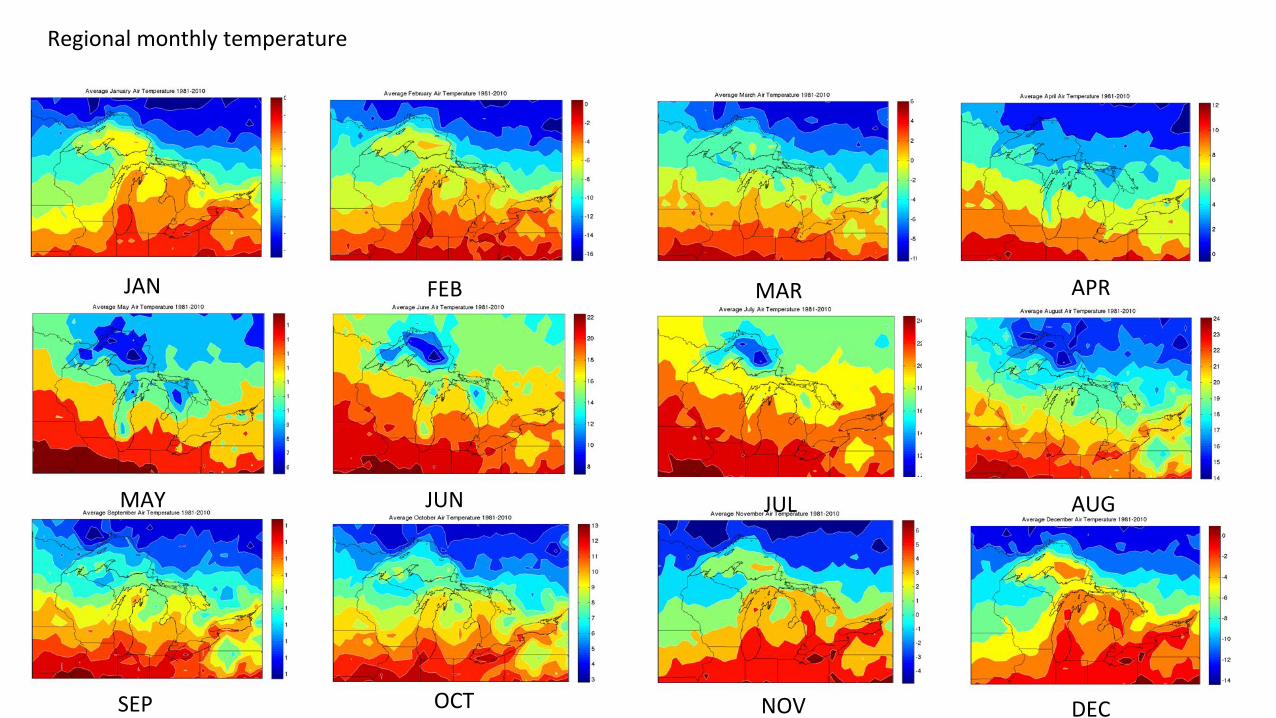
Regional%monthly%temperature%

JAN%% FEB% MAR% APR%
MAY% JUN% JUL% AUG%
SEP% OCT% NOV% DEC%
Regional%monthly%temperature%1981Q2010%

Period% Mean% Maximum% Minimum% Slope%
January% Q9.3040% Q3.2700% Q15.6739% 0.0574%
February% Q7.5171% Q1.8070% Q11.7698% Q0.0226%
March% Q1.8993% 1.9956% Q5.6888% 0.0208%
April% 5.6444% 8.7624% 2.9821% 0.0251%
May% 12.0045% 14.9688% 8.6658% Q0.0048%
June% 17.2104% 19.6185% 14.7338% 0.0238%
July% 19.38404% 21.6249% 17.0180% Q0.0099%
August% 19.0069% 21.1300% 16.7768% 0.0150%
September% 14.6321% 16.7450% 12.1424% 0.0443%
October% 8.0907% 11.1804% 5.7761% 0.0167%
November% 1.0272% 5.1005% Q3.3278% 0.0600%
December% Q6.1673% Q1.9094% Q13.2790% 0.0296%
Annual% 6.5178% 8.4073% 4.9704% 0.0234%
Summary%of%temperature%in%Great%lake%region%1981Q2010%

Average%annual%temperature%

Methods�
• Analysize%the%precipitaBon%data�

Regional%monthly%precipitaBon%
JAN%% FEB% MAR% APR%
MAY% JUN% JUL% AUG%
SEP% OCT% NOV% DEC%
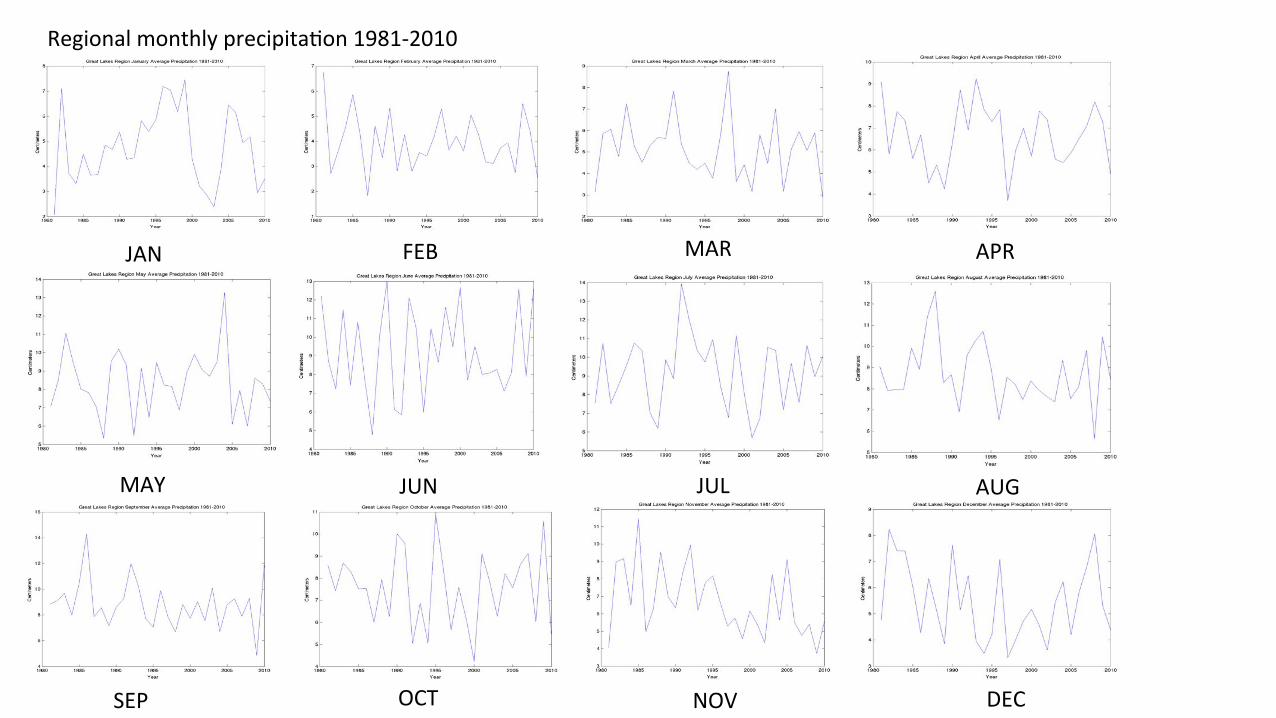
Regional%monthly%precipitaBon%1981Q2010%%
JAN%% FEB% MAR% APR%
MAY% JUN% JUL% AUG%
SEP% OCT% NOV% DEC%
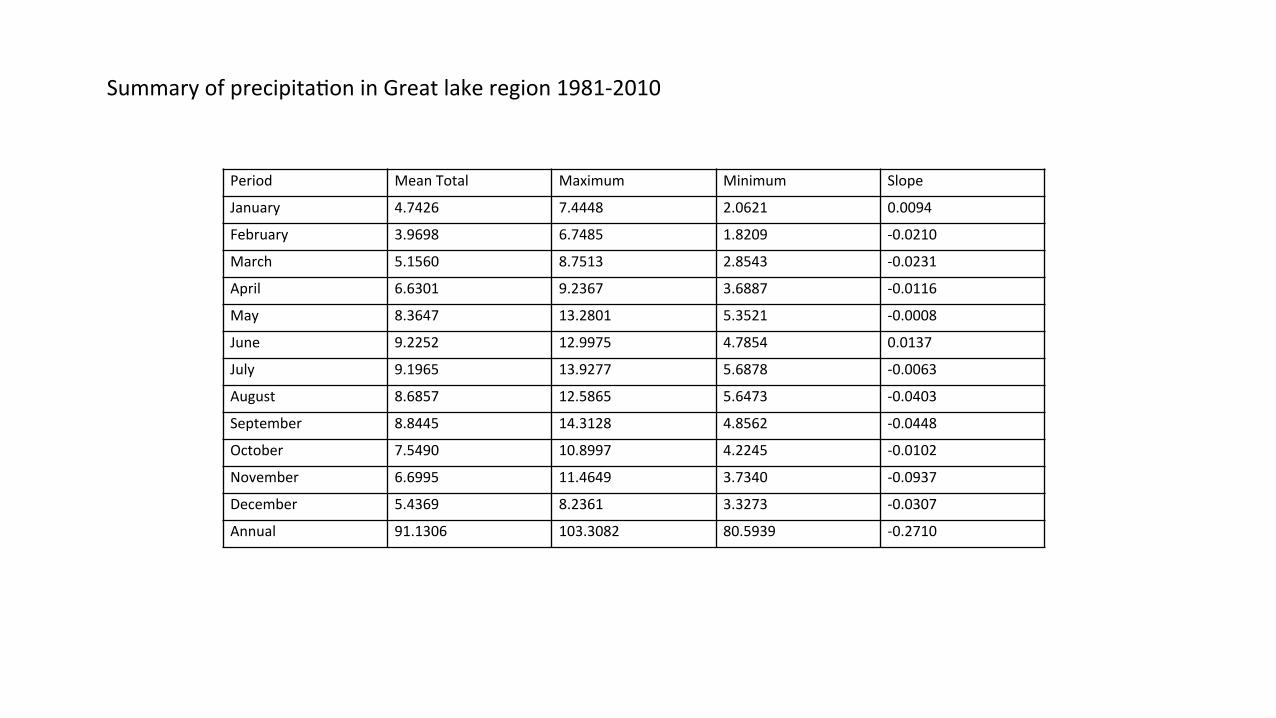
Period% Mean%Total% Maximum% Minimum% Slope%
January% 4.7426% 7.4448% 2.0621% 0.0094%
February% 3.9698% 6.7485% 1.8209% Q0.0210%
March% 5.1560% 8.7513% 2.8543% Q0.0231%
April% 6.6301% 9.2367% 3.6887% Q0.0116%
May% 8.3647% 13.2801% 5.3521% Q0.0008%
June% 9.2252% 12.9975% 4.7854% 0.0137%
July% 9.1965% 13.9277% 5.6878% Q0.0063%
August% 8.6857% 12.5865% 5.6473% Q0.0403%
September% 8.8445% 14.3128% 4.8562% Q0.0448%
October% 7.5490% 10.8997% 4.2245% Q0.0102%
November% 6.6995% 11.4649% 3.7340% Q0.0937%
December% 5.4369% 8.2361% 3.3273% Q0.0307%
Annual% 91.1306% 103.3082% 80.5939% Q0.2710%
Summary%of%precipitaBon%in%Great%lake%region%1981Q2010%

Average%annual%preciptaBon%
Methods�
• Apply%PCA%(principle%component%analysis)%to%the%temperature%data�• Analysis%the%results�

98.62%%
0.47%%
Cycle1=1/0.0833%~%12%(month)�Cycle2=1/0.1666%~%6%(month)%

Methods�
• Detrend�• Deseasonalize��• Take%moving%average�

Methods�
• Apply%PCA%to%the%processed����temperature%data�• Analysis%the%results�
Cycle=1/0.01667%~%60%(month)%
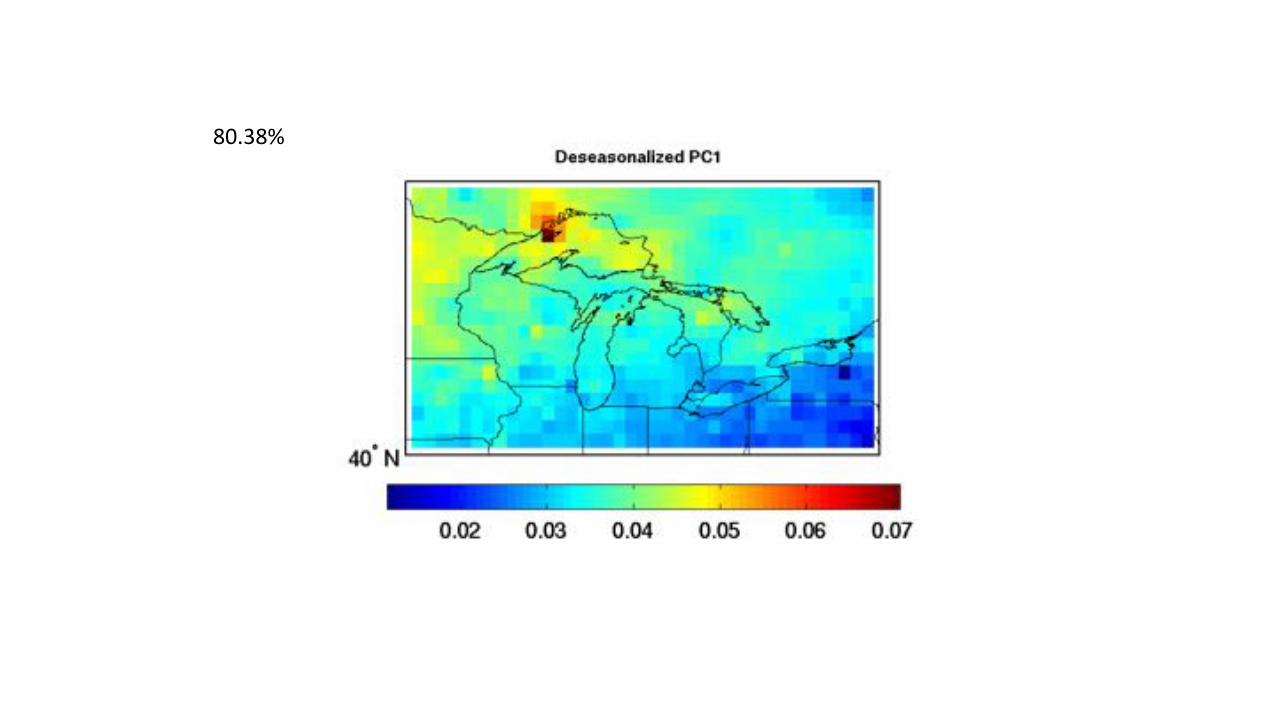
80.38%%

• Background�• Methodology�• Conclusions�• Acknowledgements��
�
������
������

Conclusions��
• Results�����The%data%show%good%representaBve.����ENSO%cycle%plays%an%important%role%in%the%variaBon%of%the%temperature.��• Concerns����There%is%uncertainty%for%the%data%in%the%lakes.��

• Background�• Methodology�• Conclusions�• Acknowledgements��
�
������
������

Acknowledgements��
• William%Baule�• Professor%Huang%Xianglei�

Ques&on?