evaluacion de la suceptibilidad de formacion de fisuras …freirej/publicacoes_pdf/rm.pdf ·...
TRANSCRIPT

EVALUACION DE LA SUCEPTIBILIDAD DE FORMACION DE FISURAS EN FRIO EN
JUNTAS SOLDADAS DE ACEROS DE ALTA RESISTENCIA Y BAJA ALEACION
EVALUATION OF COLD CRACK SUSCEPTIBILITY ON HSLA STEEL WELDED
JOINTS
Raimundo Carlos Silverio Freire Júnior *, Theophilo Moura Maciel **, Paulo Guedes da Silva **
* Federal University of Rio Grande do Norte – Center of Exact Sciences and Earth– Program of Doctorate in Science and Engineering of Materials CEP 59072970, Natal, RN, Brasil – E-mail: [email protected] ** Federal University of Paraiba – Center of Science and Technology – Department of Mechanical Engineering - Campus II CEP 58.109-970, Campina Grande, PB, Brasil - E-mail: [email protected]
Resumen. Este trabajo evalúa la influencia de la variación de temperatura de precalentamiento, del tiempo de secado
del electrodo, de la composición química y del espesor del metal base sobre la formación de fisuras en frío inducidas
por el hidrógeno en juntas soldadas de aceros de alta resistencia y baja aleación y su relación con la microestructura y
dureza resultante. Para esto se analizó la presencia de fisuras en frío en probetas para ensayos Tekken, fabricadas a
partir de chapas de aceros SAR 80 T, 100 T y 120 T, con diferentes espesores y soldados por proceso de arco eléctrico
con electrodo revestido sin precalentamiento y con precalentamiento a 375, 455 y 525 K, empleando electrodos AWS E
12018 G y 11018 G no secados y secados durante 2, 3 y 4 horas. Los resultados obtenidos indicaron la presencia de
fisuras únicamente en la zona de metal de aporte con una combinación de los valores de dureza superiores a 230 Hv y
con porcentajes de Ferrita Acicular superiores al 93 %, obtenidos sin precalentamiento. Además de ello, en las chapas
de mayor espesor, se obtuvo una mayor susceptibilidad a la fisuración en frío, aunque presentasen menor valor de
carbono equivalente.
Palabras Clave: Fisuras en Frío, Aceros de Alta Resistencia y Baja Aleación, Microestructura, Ensayos Tekken.
Abstract. The present study addresses an evaluation of the effect of several welding parameters on cold cracking formation in
welded joints of High Strength and Low Alloy steels, as well as the resulting microstructures and hardness values. The main
parameters studied include the variation of the preheating temperature, drying time of the electrode, chemical composition and
thickness of the base metal. The presence of cold cracking in the joints was analyzed from Tekken tests using steel plates made of
SAR 80 T, 100 T and 120 T with different thickness. The plates were welded by Shielded Metal Arc Welding either with or without
pre-heating. Different preheating temperatures were studied, i.e., 375, 455 and 525 K. AWS E 12018 G and 11018 G electrodes were
used under different conditions, i.e., not dried or dried up to 2, 3 and 4 hours at 515 K. The results indicated the presence of cracks in
the welded metals with the combination of increased hardness 230 HV and the formation of high contents of acicular ferrite (above
93 %) in the welds without preheating. Higher crack susceptibility was also observed in the thickest welded metal plates.
Keywords: Cold Cracking, HSLA steels, Microstructure, Tekken tests.

INTRODUCTION
Relevant technological progress has taken place during the last decades towards the development of new
materials. In particular, steels stand out as the most used globally marketed materials. Consequently, new types of steels
with relatively higher tensile strength and improved toughness have been developed For example, high-strength and
low-alloy steels (HSLA). Nevertheless, one of the main requirements for the commercialization of a new type of steel is
its weldability. Therefore, new technologies have been developed in this area aiming at expanding the range of
applications for new steels.
Hydrogen-induced cold cracking is one of the main problems encountered for welding of high-strength and
low-alloy steels (HSLA). For this reason, at least 20% of the large sum (billions of dollars) spent by industries
worldwide are committed to solve this problem.
The main aspects which contribute to cold cracking are the high contents of diffusive hydrogen, temperature in
the welded joint below 475 K, brittleness and the high levels of residual stresses remaining at the welded joint [1-2]. All
these elements are significantly affected by the variation of cooling time (∆T8/5) at the weld joints, which, in turn, can be
adjusted by changing heat input, preheating temperature or thickness of the plate. In addition, electrode drying and
cooling time play an important role on determining diffusive hydrogen in welded joints. The effect of the
aforementioned issues is intensified in welded joints with elevated hardness. For this reason, hardness tests are widely
used to evaluate the susceptibility of the joints to this type of defect [3].
Usually, hydrogen-induced cold cracking begins and propagates in the heat-affected zone, due to its
microstructure, which results in high hardness and brittleness [4-5]. It can also take place in the welded metal if it
develops high hardness and restriction to dilatation is very high [6].
Cold cracking in HSLA steels welded joints was evaluated in this work. The following parameters were
investigated: preheating temperature, electrode drying, combination between base metal and deposited metal, and
variation of the thickness of the base metal.
MATERIALS AND METHODS
Shield Metal Arc Welding (SMAW) was employed using AWS E 12018 G and AWS E 11018 G consumable
electrodes. The base metal plates consisted of commercially available SAR 120 T (ASTM A 514 B), SAR 100 T
(ASTM A 514 F) and SAR 80 T steel plates 31 mm, 11 mm and 11 mm thick, respectively.
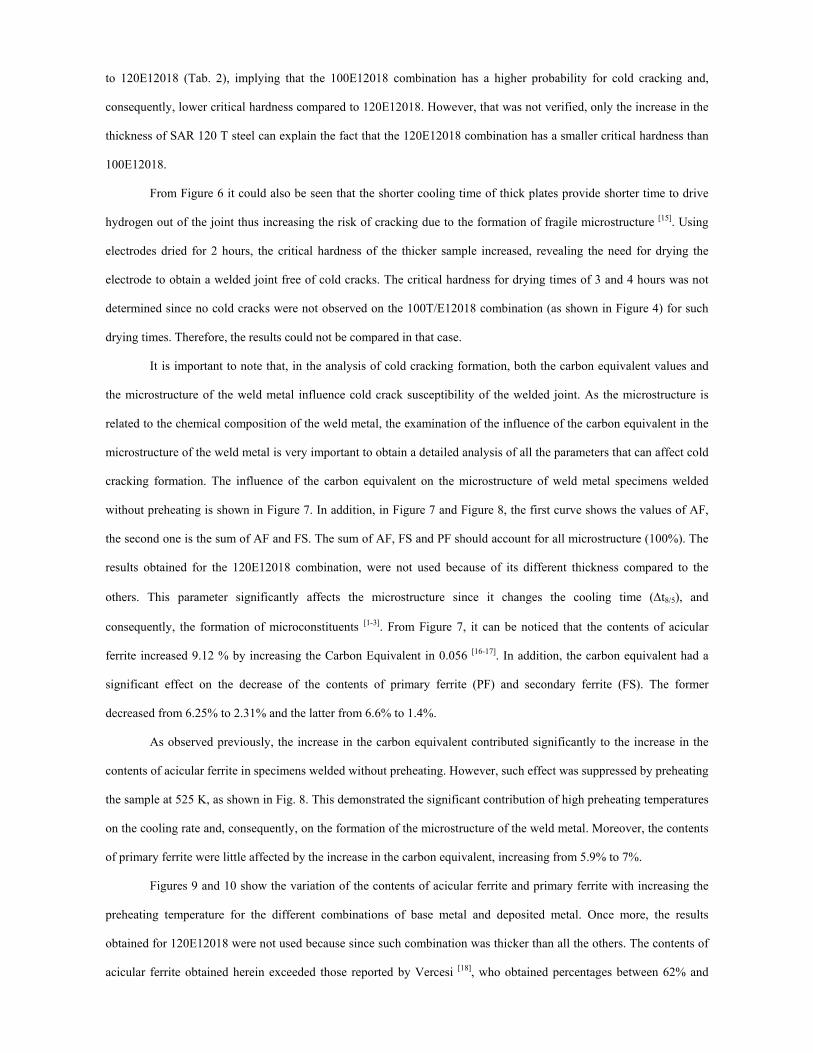
The presence of cracks was evaluated using the Tekken test (JIS-Z-3158 standard). This test consists in
welding specimens with the dimensions indicated in Fig. 1 and observing the presence of cracks 48 hours later. To that
end specimens are cut into eight similar (or identical) parts.
The heat input was calculated from the voltage of the welding equipment and the welding time using Equation
(1). The current was in directly estimated starting from a "shunt" of 200 A / 60 mV in series with the machine.

E f VIv
= × × −10 3 (1)
The values of E, V, I and v represent, respectively, the heat input (kJ/mm), the voltage (Volts), current (A) and
welding speed (mm/s). The value of is 0.8 and represents the arc heat transfer efficiency of Shield Metal Arc Welding.
Welding was carried out with around 2 kJ/mm heat input. The base metal was either pre-heated or not. Pre-
heating temperatures were set to 375, 455 and 525 K. The electrodes were used either without drying or dried up during
2, 3 or 4 hours at 515 K for three combinations of steel/electrode, i.e., SAR 120T steel and AWS E 12018 G electrode,
SAR 100 T steel and AWS E 12018 G electrode, and SAR 80 T steel and AWS E 12018 G electrode. The combination
SAR 100 T steel with AWS E 11018 G electrode was tested only with electrodes that were not dried due to the absence
of cracking in all specimens. This includes those, which were not pre-heated. Three tests were carried out for each
condition, totaling 156 tests. The results obtained for each condition were identical for all three specimens tested.
The following expression was used for the calculation of the Carbon Equivalent (CE), according to guidelines
of the International Institute of Welding (IIW) [7].
15CuNi
5VMoCr
6MnCCE +
+++
++= (2)
To simplify the nomenclature throughout the paper, codes for each combination of base metal and filler metal
were employed. For instance, the combination of SAR 120T steel with AWS E 12018 G electrode was labeled
120T/E12018. Likewise, SAR 100 T and AWS E 12018 G was labeled 100T/E12018, SAR 80 T and AWS E 12018 G,
80T/E12018 and finally, SAR 100 T and AWS E 11018 G, 100T/E11018.
The chemical compositions and tensile strengths of steels and electrodes are shown in Table 1. For the he
chemical analyses of the weld metal each combination of base metal and filler metal was sent to USIMINAS (see Table
2). Both X-ray fluorescence spectrometry and plasma spectrometry were carried out.
Point identification and counting in the microstructures were performed using 400 times magnification. A
screen with 100 points was drawn and positioned on the display of the microscope. The intersections of the lines of the
screens assisted in analyzing the microstructure. After the identification of all areas, the points were counted. Fourteen
areas were analyzed in each weld metal, and since the bars contained 100 points, 1400 points were totalized per sample.
It is important to point out that microstructural analyses were not carried out for welded specimens preheated at 455 K
or dried specimens.
To evaluate the effect of the hardness of the weld metal on cold crack formation, the specimens were submitted
to Vickers hardness tests using a load of 5 kg. Indentations were made on the upper, lower and central areas of the weld
metal. For each region, 5 measurements were made, totaling 15 measurements per sample. It is important to point out
that all the specimens were submitted to hardness tests.

RESULTS AND DISCUSSIONS
No cracks were observed on the heat-affected zone of any sample. In most of the cases, the cracks began at the
root and propagated until the surface of the weld metal. However, two cracks were sometimes observed, as is illustrated
in Fig 2. No cracks were observed in weld metals obtained from the 100T/E11018 combination.
Figures 3 and 4 illustrate the influence of the relationship between preheating temperature and electrode drying
time on cold cracking of weld metals obtained from the 120T/E12018 and 100T/E12018 combinations, respectively.
For 80T/E12018, cracks were only obtained on the specimens without preheating. It could then be established that
welded joints free of cold cracking were only obtained using one or two of these parameters.
The minimum conditions established during the tests to prevent cracks in the welded joints are listed in Table
3. The AWS E 12018 G electrode revealed little weldability if compared with AWS E 11018 G, because whereas AWS
E 12018 G requires extensive caution in its application, regardless of the base metal used, the weld metal obtained with
the SAR 100T plate welded with AWS E 11018 G did not show any cracks, including welds without preheating and
electrodes not dried.
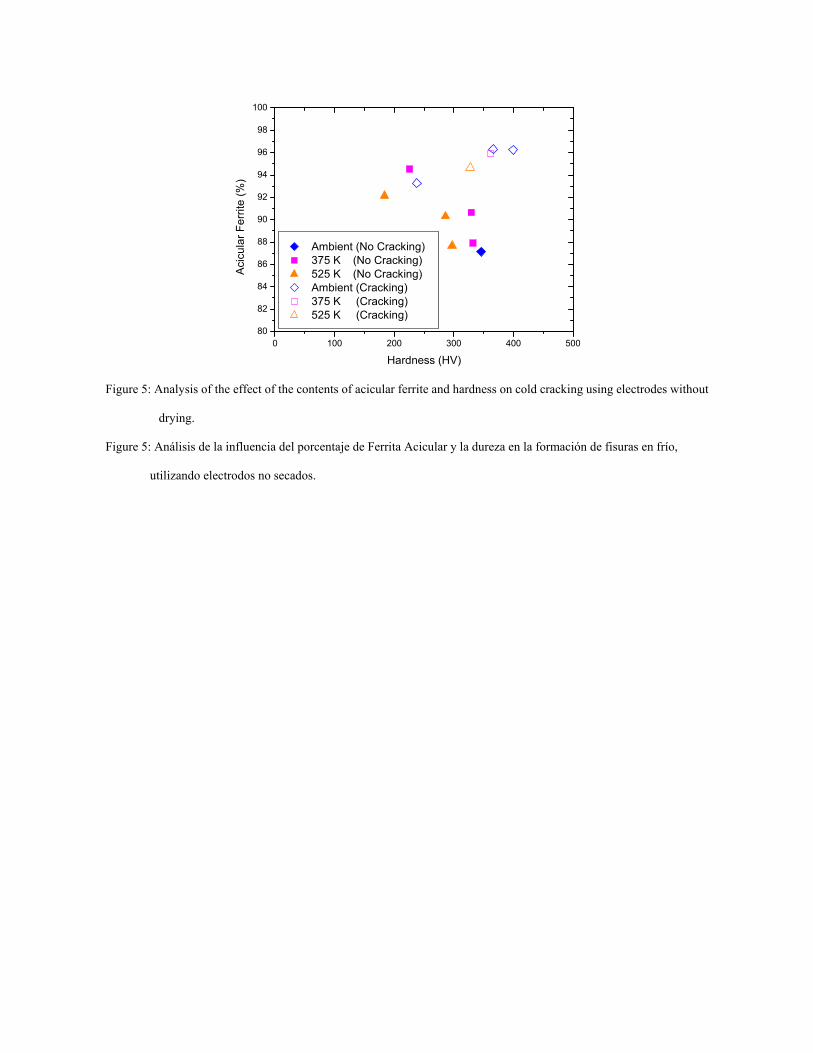
The main microconstituents observed in the weld metals were primary ferrite, secondary ferrite and acicular
ferrite [8]. The presence of this last phase is considered desirable in weld metals to improve toughness and hinder crack
propagation, due to its small grains and high contour angles [1] [9-10]. However, contents of acicular ferrite in excess of
87% can excessively harden the ferritic matrix, harming the weld metals toughness and assisting cold cracking
formation [11]. The effect of hardness and acicular ferrite contents on cold crack formation in welded joints obtained
without drying the electrode can be analyzed from Figure 5. The susceptibility to cracking on the weld drastically
increased as hardness and acicular ferrite contents increase to 300 HV and 93 %, respectively. On the other hand, the
individual action of just one parameter, especially hardness, does not necessarily result in cold cracking, This result is
somehow in good agreement with other studies [6], [12] which reported that susceptibility to cold cracking of the weld
metal increased above 300 HV. Furthermore, it has also been suggested [3] that for high contents of hydrogen, hardness
rules the susceptibility to cold cracking. Such high hardness values of the weld metals and the auto-restriction of the test
can justify cracking only in this region of the welded joint. It can also be observed from Fig. 5 that most of the
conditions that resulted in cracking took place in the weld metals obtained without preheating, demonstrating the
importance such treatment to prevent cracking of welded joints [8], [13-14].
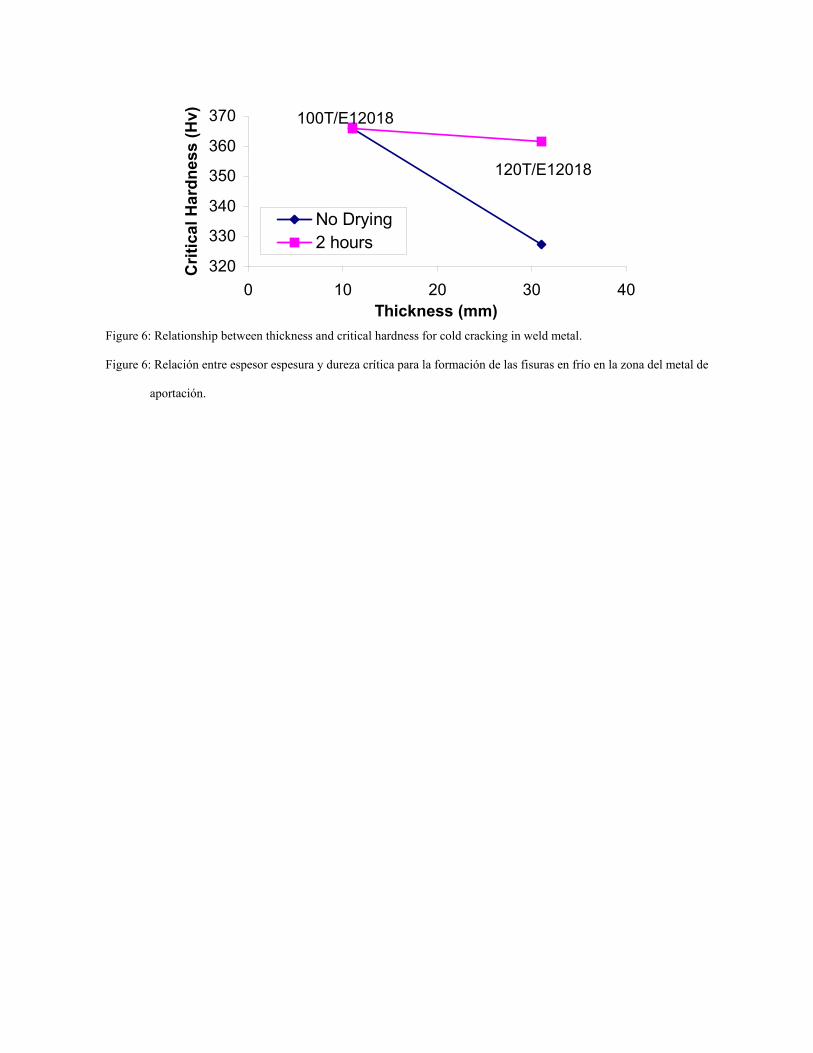
Considering the effect of the thickness of the sample on cold crack formation, welds with electrodes AWS
E12018 using SAR 120 T 31 mm or SAR 100 T 11 mm, were compared. The relationship between thickness and the
smallest value of hardness that resulted in cold cracking (critical hardness) is shown in Figure 6. The results indicated
that the critical hardness for the thicker plate was 327 HV, whereas for the thinner plate, it was 366 HV, for welding
using electrodes without drying. It is important to point out that CE is larger in the 100E12018 combination compared
to 120E12018 (Tab. 2), implying that the 100E12018 combination has a higher probability for cold cracking and,
consequently, lower critical hardness compared to 120E12018. However, that was not verified, only the increase in the
thickness of SAR 120 T steel can explain the fact that the 120E12018 combination has a smaller critical hardness than
100E12018.
From Figure 6 it could also be seen that the shorter cooling time of thick plates provide shorter time to drive
hydrogen out of the joint thus increasing the risk of cracking due to the formation of fragile microstructure [15]. Using
electrodes dried for 2 hours, the critical hardness of the thicker sample increased, revealing the need for drying the
electrode to obtain a welded joint free of cold cracks. The critical hardness for drying times of 3 and 4 hours was not
determined since no cold cracks were not observed on the 100T/E12018 combination (as shown in Figure 4) for such
drying times. Therefore, the results could not be compared in that case.
It is important to note that, in the analysis of cold cracking formation, both the carbon equivalent values and
the microstructure of the weld metal influence cold crack susceptibility of the welded joint. As the microstructure is
related to the chemical composition of the weld metal, the examination of the influence of the carbon equivalent in the
microstructure of the weld metal is very important to obtain a detailed analysis of all the parameters that can affect cold
cracking formation. The influence of the carbon equivalent on the microstructure of weld metal specimens welded
without preheating is shown in Figure 7. In addition, in Figure 7 and Figure 8, the first curve shows the values of AF,
the second one is the sum of AF and FS. The sum of AF, FS and PF should account for all microstructure (100%). The
results obtained for the 120E12018 combination, were not used because of its different thickness compared to the
others. This parameter significantly affects the microstructure since it changes the cooling time (∆t8/5), and
consequently, the formation of microconstituents [1-3]. From Figure 7, it can be noticed that the contents of acicular
ferrite increased 9.12 % by increasing the Carbon Equivalent in 0.056 [16-17]. In addition, the carbon equivalent had a
significant effect on the decrease of the contents of primary ferrite (PF) and secondary ferrite (FS). The former
decreased from 6.25% to 2.31% and the latter from 6.6% to 1.4%.
As observed previously, the increase in the carbon equivalent contributed significantly to the increase in the
contents of acicular ferrite in specimens welded without preheating. However, such effect was suppressed by preheating
the sample at 525 K, as shown in Fig. 8. This demonstrated the significant contribution of high preheating temperatures
on the cooling rate and, consequently, on the formation of the microstructure of the weld metal. Moreover, the contents
of primary ferrite were little affected by the increase in the carbon equivalent, increasing from 5.9% to 7%.
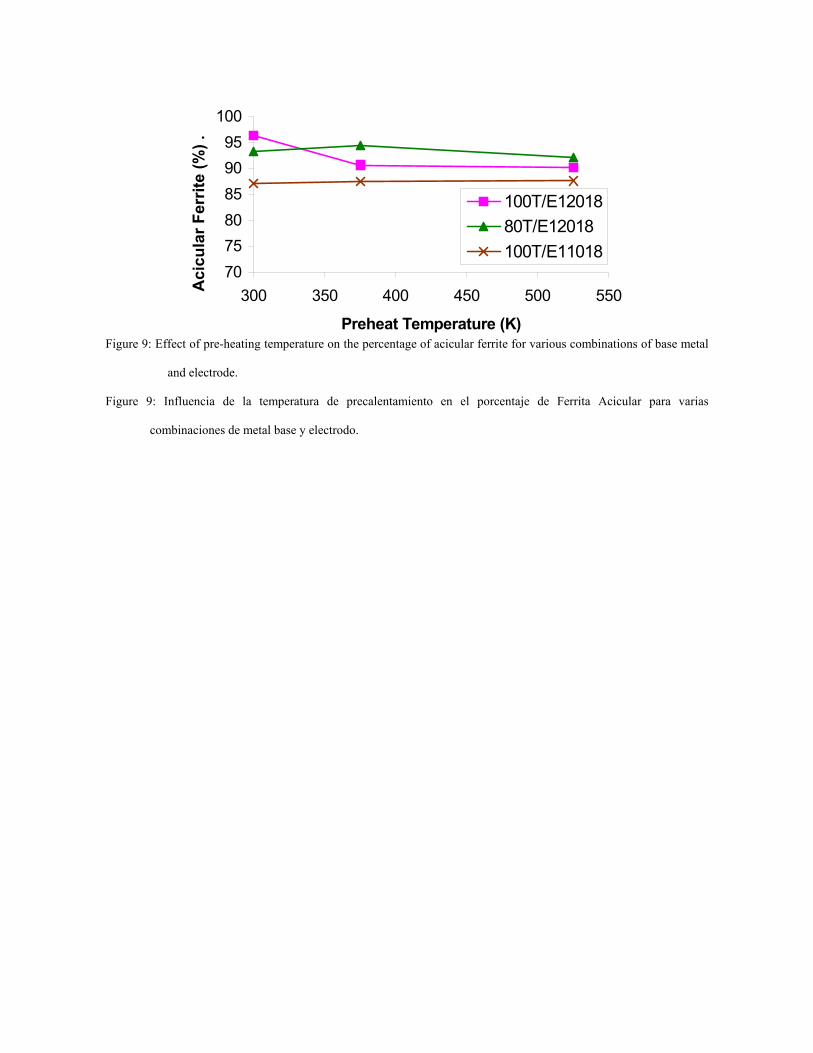
Figures 9 and 10 show the variation of the contents of acicular ferrite and primary ferrite with increasing the
preheating temperature for the different combinations of base metal and deposited metal. Once more, the results
obtained for 120E12018 were not used because since such combination was thicker than all the others. The contents of
acicular ferrite obtained herein exceeded those reported by Vercesi [18], who obtained percentages between 62% and

74% welding AWS A5.5-81 19 mm with AWS E 11018-M and AWS E 12018-M electrodes using heat input around 1.7
kJ/mm. From these figures it could be seen that the 100T/E11018 combination did not reveal significant variation in the
percentage of acicular and primary Ferrite.
Finally, for the 100T/E12018 combination, there was a discrete decrease in the percentage of acicular ferrite
and, consequently, an increase in the percentage of primary ferrite. In addition, the contents of acicular ferrite for the
combinations in which the AWS E 12018 G electrode was used were higher than those for combinations involving
AWS E 11018 G, as shown in the Fig. 9. As this value was around 93 %, it provided excessive hardening in the weld
metal, which certainly contributed to crack formation [11].
CONCLUSIONS
Cracks were not observed in the HAZ. All cracks in the weld metals occurred using the AWS E 12018
electrode as filler metal.
The conditions to prevent cracking in all base and filler metal combinations tested included preheating above
370 K and electrode drying for longer than two hours. Those results demonstrated the importance of these welding
parameters to obtain joints free from cold cracking.
The formation of acicular ferrite contents above 93% combined with hardness values above 300 HV in the
weld metal of HSLA steels increased the susceptibility for cold cracking.
The use of the AWS E12018 G electrode could only be possible after drying it or preheating the base metal.
The variation of the equivalent carbon had an important effect on determining the microstructure of weld
HSLA steel. Increasing the carbon equivalent increased the contents of acicular ferrite in the welded joint.
The effect of the preheating temperature on the microstructure depended on the specific weld joint/base metal
combination, either decreasing or maintain the contents of acicular ferrite.
ACKNOWLEDGMENTS
The authors thank ESAB for the donation of the consumables, USIMINAS (group SIDERBRAS) for the
donation of the plates, CNPQ/PIBIC/UFPB and CAPES for the scholarship grant.
DEDICATORY
We dedicate this work to the memory of Paulo Guedes da Silva, former master's student of our institution that
God be to his side.
REFERENCES
[1] E. Wainer, S. D. Brandi y F. D. H. Mello, “Soldagem Processos e Metalurgia”, Ed. Edgard Blücher LTDA, 1° Ed.,
São Paulo-SP-Brasil, 1992, pp. 419-425.
[2] V. I. Shvachko, International Journal of Hydrogen Energy, 25, 2000, pp. 473-480.
[3] P. H. M. Hart, Welding Journal, 24(9/10), 1986, pp. 190-198.

[4] X. Di-Jing,, Q. Hong, y J. Jianming, Welding Journal, 73(12), 1994, pp. 164s-171s.
[5] B. S. Kasatkin y S. B. Kasatkin, Welding Journal, 77(7), 1998, pp. 299s-306s.
[6] N. G. Alcantara y J. H. Rogerson, Welding Journal, 63(4), 1984, pp. 116-122.
[7] IIW/IIS DOC. 452-74, Welding in the World, 12(3/4), 1974, pp. 65-69.
[8] T. M. Maciel, R. C. S. Freire Júnior y P. G. da Silva, 8° Congr. Chileno de Ingenieria Mecánica, 1998, pp. 575-578.
[9] D. Wang, Tesis Doctoral, School of Industrial Science, Cranfield Institute of Technology, 1990.
[10] S. H. Martins, Dissertação de Mestrado, Prog. Pós-Grad. Ciência Eng. Materiais, Univ. Fed. São Carlos, 1990.
[11] R. A. Farrar y P. L. Harrinson, Journal of Materials Science, 22, 1987, pp. 3812-3820.
[12] W. Garcia, Dissertação de Mestrado, Prog. Pós-Grad. Ciência Eng. Materiais, Univ. Fed. São Carlos, 1994.
[13] T. M. Maciel, P. G. Silva, R. C. S. Freire Júnior y F. V. Souza, 12° CBECIMAT, 1, 1996, pp. 523-526.
[14] N. G. Alcantara, Simpósio de Tecnologia de Soldagem da Região Sul, 1, 1986, pp. 31-50.
[15] C. M. F. Lopes, R. C. S. Freire Júnior y T. M. Maciel, 13° CBECIMAT, 1, 1998, pp. 334-342.
[16] T. M. Maciel, Tesis Doctoral, Prog. Pós-Grad. Ciência Eng. Materiais, Univ. Fed. São Carlos, 1994.
[17] P. L. Harrison y R. A. Farrar, Metal Cons, 1987, 2, pp. 392-399.
[18] J. Vercesi, E. Surian, Welding Journal, 77(4), 1998, pp. 164s-171s.

Table 1: Chemical composition and tensile strength of SAR 80T, SAR 100 T and SAR 120 T steels and AWS E 11018
G and AWS E 12018 G electrodes.
Tabla 1: Composición química y limite de resistencia de los aceros SAR 80T, SAR 100 T y SAR 120 T y de los
electrodos AWS E 11018 G y AWS E 12018 G
Element Steel SAR 80 T
Steel SAR 100 T
Steel SAR 120 T
Electrode AWS E 11018 G
Electrode AWS E 12018 G
C 0.11 0.16 0.16 0.06 0.079 S 0.09 0.04 0.07 0.024 0.0065
Mn 0.98 0.93 0.84 1.6 1.76 Si 0.25 0.26 1.12 0.3 0.28 P 0.21 0.16 0.14 0.018 0.018
Cr 0.61 0.67 0.96 0.35 0.50 Cu 0.24 0.32 0.01 0.011 0.028 Mo 0.48 0.45 0.15 0.4 0.34 V 0.42 0.53 0.06 0.02 0.010 Ni 0.03 1.11 1.27 1.7 1.82 Nb 0.002 0.002 < 0.002 B 0.15 0.0007 0.12 < 0.0002 0.0007
Tensile Strength 887 MPa 1005 MPa 1332 MPa 780 MPa 1053 MPa

Table 2: Chemical composition and carbon equivalent of weld metals.
Tabla 2: Valores de la composición química y Carbono Equivalente en la zona del metal de aportación.
ELEMENT 100T/E12018 120T/E12018 80T/E12018 100T/E11018 C 0.099 0.094 0.087 0.083
Mn 1.552 1.585 1.557 1.446 Cr 0.542 0.587 0.529 0.424 Cu 0.101 0.025 0.083 0.082 Mo 0.368 0.304 0.376 0.412 V 0.140 0.020 0.117 0.137 Ni 1.642 1.716 1.355 1.564 CE 0.684 0.657 0.647 0.628

Table 3: Minimum conditions necessary to prevent cracking of the welded joint.
Tabla 3: Condiciones mínimas mantenidas durante los ensayos en que no se observó ninguna fisura en la juntura
soldada.
Combination base metal - electrode Weldability Minimum condition for joint without cracking
SAR 120 T steel with AWS E 12018 G electrode Bad Pre-heating temperature of at least 455 K and
drying the electrode for at least 3 hours at 515 K
SAR 100 T steel with AWS E 12018 G electrode
Reasonable Pre-heating temperature of at least 375 K or drying the electrode for at least 3 hours at 515 K
SAR 80 T steel with AWS E 12018 G electrode Reasonable Pre-heating temperature of at least 375 K
SAR 100 T steel with AWS E 11018 G electrode Good No Pre-heating and electrode not dried
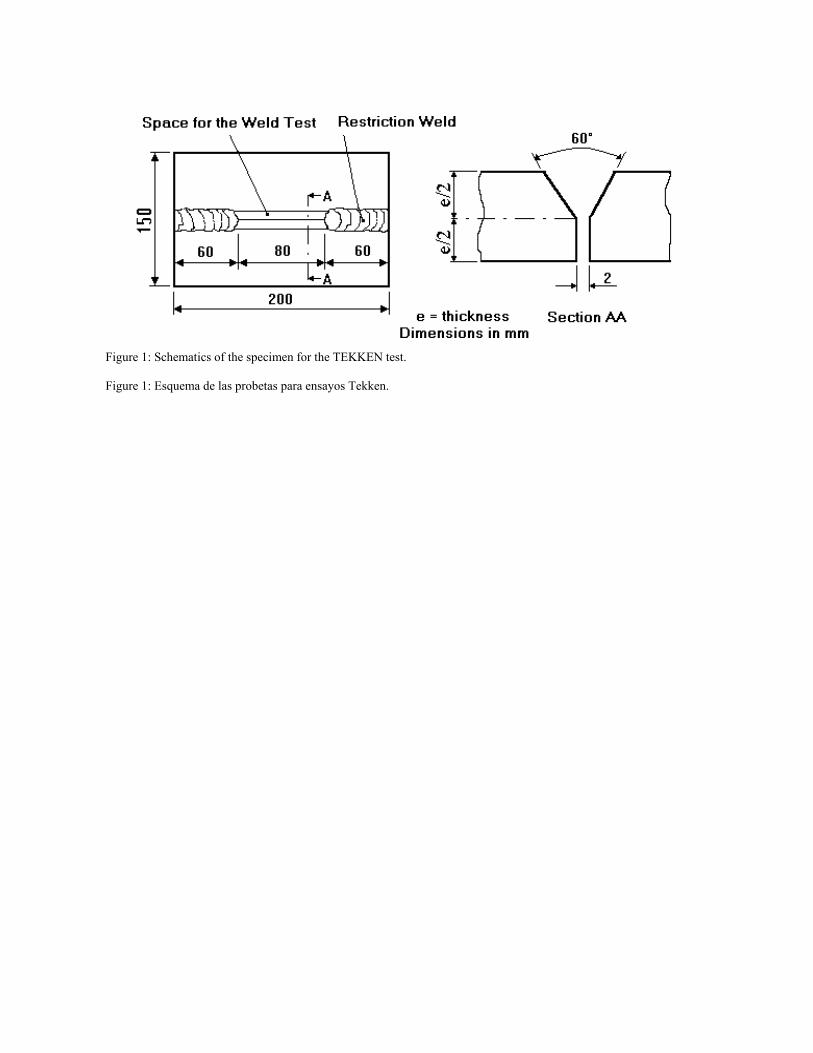
Figure 1: Schematics of the specimen for the TEKKEN test.
Figure 1: Esquema de las probetas para ensayos Tekken.
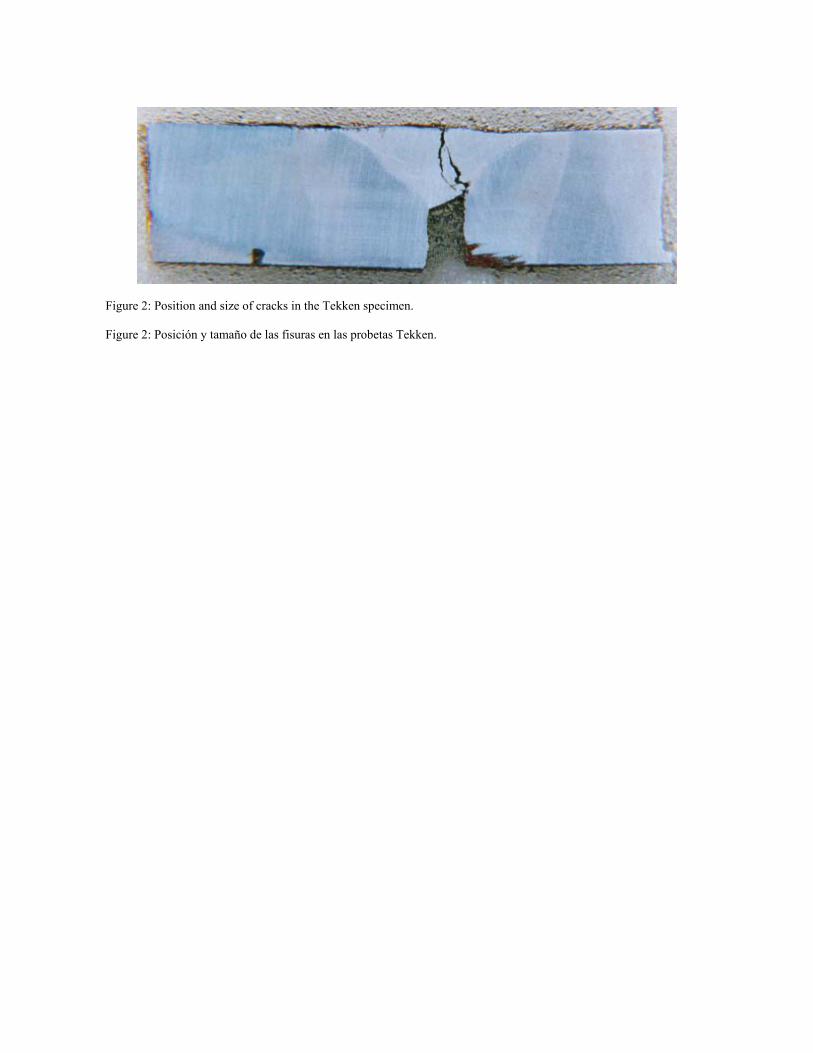
Figure 2: Position and size of cracks in the Tekken specimen.
Figure 2: Posición y tamaño de las fisuras en las probetas Tekken.

012345
290 340 390 440 490 540
Preheating Temperature (K)
Dry
ing
time
(h)
No Cracking Cracking
Figure 3: Influence of preheating temperature and electrode drying time on cold cracking of the combination of base
metal and 120T/E12018 electrode.
Figure 3: Influencia de la variación de la temperatura de precalentamiento y del tiempo de secado del electrodo sobre la
formación de fisuras en frío, para la combinación de metal base y electrodo 120T/E12018.
012345
290 340 390 440 490 540
Preheating Temperature (K)
Dry
ing
Tim
e (h
)
No Cracking Cracking
Figure 4: Influence of preheating temperature and electrode drying time on cold cracking of the combination of base
metal and 100T/E12018 electrode.
Figure 4: Influencia de la variación de la temperatura de precalentamiento y del tiempo de secado del electrodo sobre la
formación de fisuras en frío, para la combinación de metal base y electrodo 100T/E12018.
0 100 200 300 400 50080
82
84
86
88
90
92
94
96
98
100
Acic
ular
Fer
rite
(%)
Hardness (HV)
Ambient (No Cracking) 375 K (No Cracking) 525 K (No Cracking) Ambient (Cracking) 375 K (Cracking) 525 K (Cracking)
Figure 5: Analysis of the effect of the contents of acicular ferrite and hardness on cold cracking using electrodes without
drying.
Figure 5: Análisis de la influencia del porcentaje de Ferrita Acicular y la dureza en la formación de fisuras en frío,
utilizando electrodos no secados.
320
330
340
350
360
370
0 10 20 30 40Thickness (mm)
Crit
ical
Har
dnes
s (H
v)No Drying2 hours
100T/E12018
120T/E12018
Figure 6: Relationship between thickness and critical hardness for cold cracking in weld metal.
Figure 6: Relación entre espesor espesura y dureza crítica para la formación de las fisuras en frío en la zona del metal de
aportación.

AF
FS
PF
80
85
90
95
100
0.628 0.638 0.648 0.658 0.668 0.678
Carbon Equivalent
Mic
rost
ruct
ure
(%)
Figure 7: Effect of carbon equivalent on the microstructure of weld metals welded without preheating.
Figure 7: Influencia del Carbono Equivalente sobre la microstructura de la zona del metal de aportación en probetas
soldadas sin precalentamiento.

AF
FS
PF
80
85
90
95
100
0.628 0.638 0.648 0.658 0.668 0.678Carbon Equivalent
Mic
rost
ruct
ure
(%)
Figure 8: Effect of carbon equivalent on the microstructure of he weld metals welded after preheating at 525 K.
Figure 8: Influencia del Carbono Equivalente sobre la microstructura de la zona del metal de aportación en probetas
soldadas con precalentamiento a 525 K.
707580859095
100
300 350 400 450 500 550
Preheat Temperature (K)
Aci
cula
r Fer
rite
(%) .
100T/E1201880T/E12018100T/E11018
Figure 9: Effect of pre-heating temperature on the percentage of acicular ferrite for various combinations of base metal
and electrode.
Figure 9: Influencia de la temperatura de precalentamiento en el porcentaje de Ferrita Acicular para varias
combinaciones de metal base y electrodo.

012345678
300 350 400 450 500 550
Preheat Temperature (K)
Prim
ary
Ferr
ite (%
)100T/E1201880T/E12018100T/E11018
Figure 10: Effect of pre-heating temperature on the percentage of primary ferrite for various combinations of base metal
and electrode.
Figure 10: Influencia de la temperatura de precalentamiento en el porcentaje de Ferrita Primaria para varias
combinaciones de metal base y electrodo.
FIGURE CAPTIONS
Figure 1: Schematics of the specimen for the TEKKEN test.
Figure 1: Esquema de las probetas para ensayos Tekken.
Figure 2: Position and size of cracks in the Tekken specimen.
Figure 2: Posición y tamaño de las fisuras en las probetas Tekken.
Figure 3: Influence of preheating temperature and electrode drying time on cold cracking of the combination of base
metal and 120T/E12018 electrode.
Figure 3: Influencia de la variación de la temperatura de precalentamiento y del tiempo de secado del electrodo sobre la
formación de fisuras en frío, para la combinación de metal base y electrodo 120T/E12018.
Figure 4: Influence of preheating temperature and electrode drying time on cold cracking of the combination of base
metal and 100T/E12018 electrode.
Figure 4: Influencia de la variación de la temperatura de precalentamiento y del tiempo de secado del electrodo sobre la
formación de fisuras en frío, para la combinación de metal base y electrodo 100T/E12018.
Figure 5: Analysis of the effect of the contents of acicular ferrite and hardness on cold cracking using electrodes without
drying.
Figure 5: Relación entre el porcentaje de Ferrita Acicular y la dureza en la zona del metal de aportación donde se
presentaron fisuras utilizando electrodos no secados.
Figure 6: Relationship between thickness and critical hardness for cold cracking in weld metal.
Figure 6: Relación entre la espesor y dureza crítica para la formación de las fisuras en frío en la zona del metal de
aportación.
Figure 7: Effect of carbon equivalent on the microstructure of weld metals welded without preheating.
Figure 7: Influencia del Carbono Equivalente en el microstructura de la zona del metal de aporte en cuerpos de prueba
soldados sin precalentamiento.
Figure 8: Effect of carbon equivalent on the microstructure of he weld metals welded after preheating at 525 K.
Figure 8: Influencia del Carbono Equivalente sobre la microstructura de la zona del metal de aportación en las probetas
soldados con precalentamiento de 525 K.
Figure 9: Effect of preheating temperature on the percentage of acicular ferrite for various combinations of base metal
and electrode.
Figure 9: Influencia de la temperatura de precalentamiento en el porcentaje de Ferrita Acicular para varias
combinaciones de metal base y electrodo.
Figure 10: Effect of preheating temperature on the percentage of primary ferrite for various combinations of base metal
and electrode.

Figure 10: Influencia de la temperatura de precalentamiento en el porcentaje de Ferrita Primaria para varias
combinaciones de metal base y electrodo.