eutrophication student workbook - cool...
TRANSCRIPT
EUTROPHICATION
Student Lab Workbook
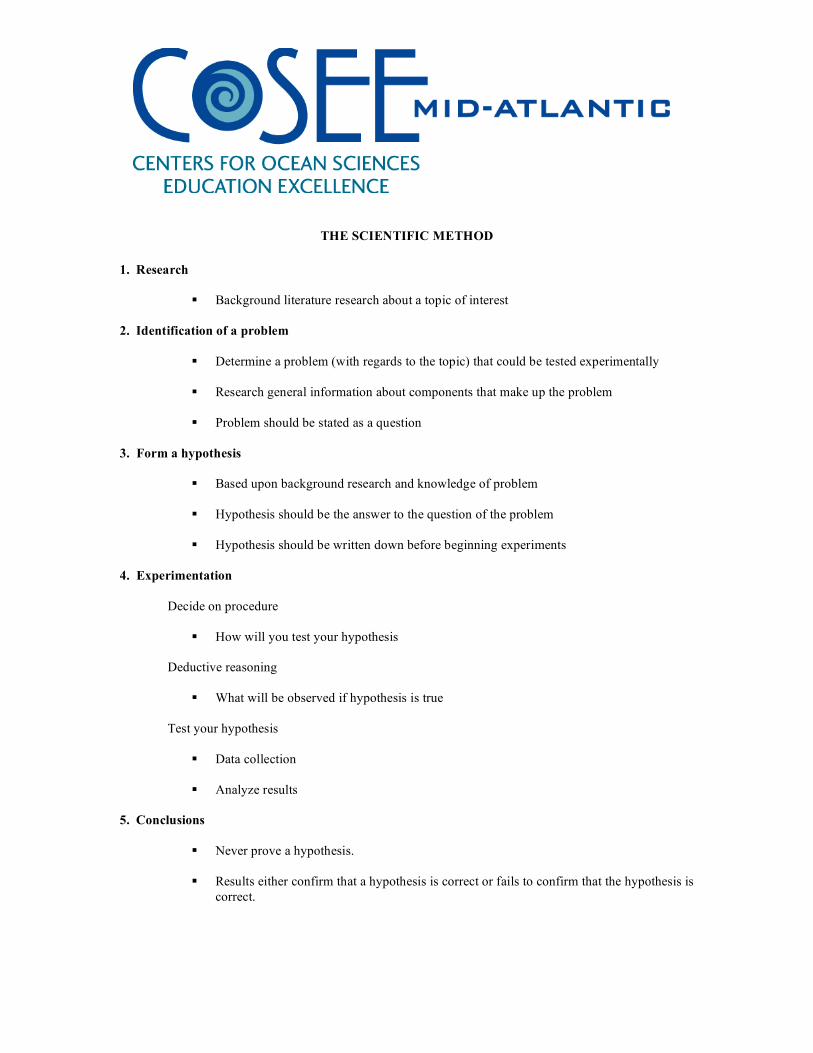
THE SCIENTIFIC METHOD
1. Research
Background literature research about a topic of interest 2. Identification of a problem
Determine a problem (with regards to the topic) that could be tested experimentally
Research general information about components that make up the problem Problem should be stated as a question
3. Form a hypothesis
Based upon background research and knowledge of problem Hypothesis should be the answer to the question of the problem
Hypothesis should be written down before beginning experiments
4. Experimentation
Decide on procedure
How will you test your hypothesis
Deductive reasoning
What will be observed if hypothesis is true
Test your hypothesis
Data collection Analyze results
5. Conclusions
Never prove a hypothesis.
Results either confirm that a hypothesis is correct or fails to confirm that the hypothesis is correct.
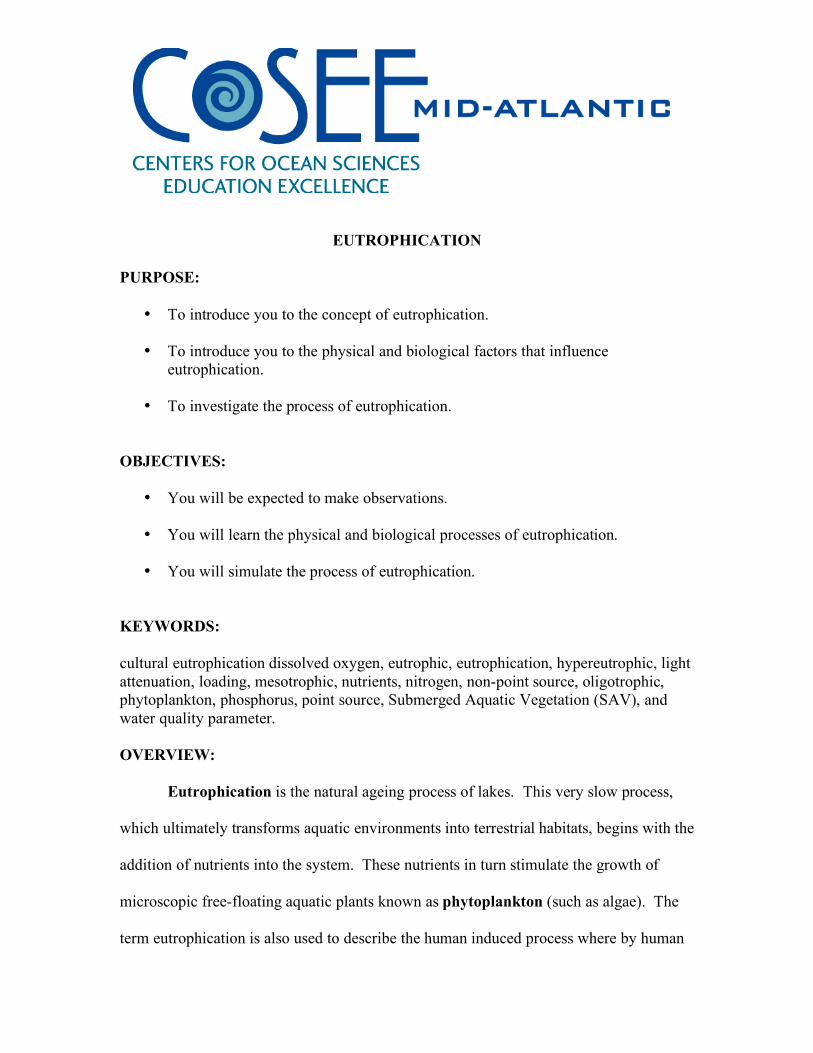
EUTROPHICATION
PURPOSE:
• To introduce you to the concept of eutrophication. • To introduce you to the physical and biological factors that influence
eutrophication.
• To investigate the process of eutrophication. OBJECTIVES:
• You will be expected to make observations.
• You will learn the physical and biological processes of eutrophication.
• You will simulate the process of eutrophication.
KEYWORDS: cultural eutrophication dissolved oxygen, eutrophic, eutrophication, hypereutrophic, light attenuation, loading, mesotrophic, nutrients, nitrogen, non-point source, oligotrophic, phytoplankton, phosphorus, point source, Submerged Aquatic Vegetation (SAV), and water quality parameter. OVERVIEW: Eutrophication is the natural ageing process of lakes. This very slow process,
which ultimately transforms aquatic environments into terrestrial habitats, begins with the
addition of nutrients into the system. These nutrients in turn stimulate the growth of
microscopic free-floating aquatic plants known as phytoplankton (such as algae). The
term eutrophication is also used to describe the human induced process where by human
activity such as agriculture, use of fertilizers, and changes in land surrounding aquatic
environments accelerates the growth of phytoplankton.
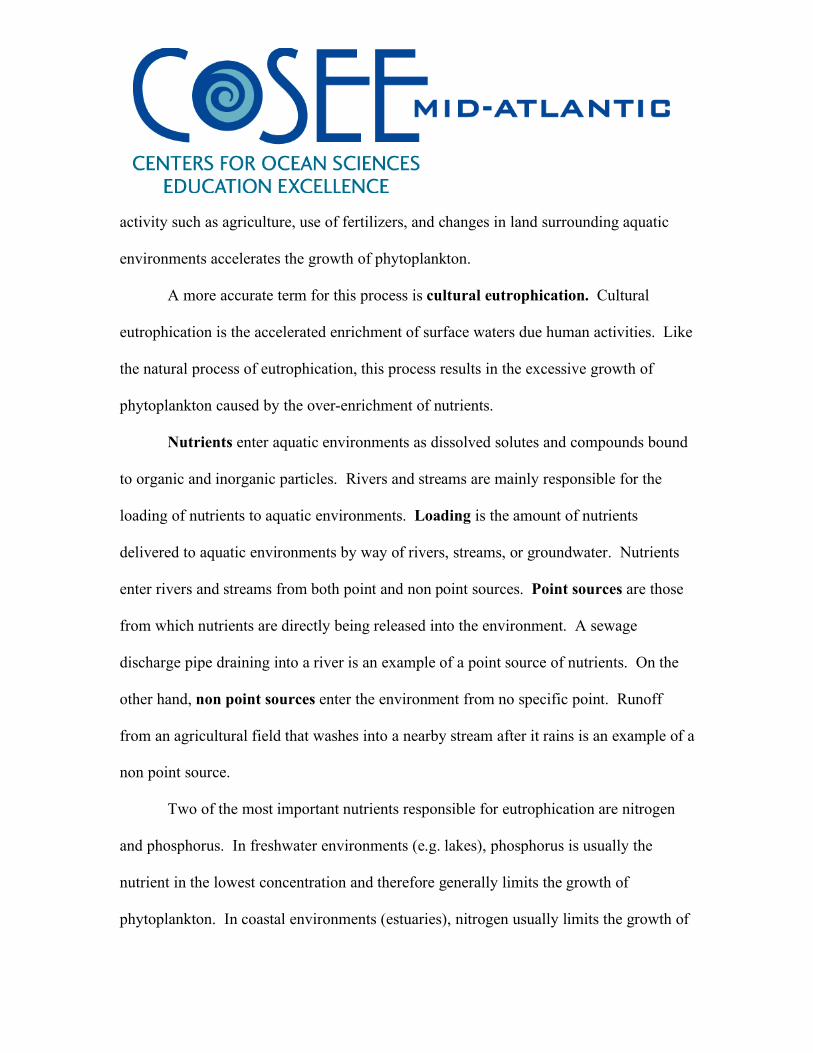
A more accurate term for this process is cultural eutrophication. Cultural
eutrophication is the accelerated enrichment of surface waters due human activities. Like
the natural process of eutrophication, this process results in the excessive growth of
phytoplankton caused by the over-enrichment of nutrients.
Nutrients enter aquatic environments as dissolved solutes and compounds bound
to organic and inorganic particles. Rivers and streams are mainly responsible for the
loading of nutrients to aquatic environments. Loading is the amount of nutrients
delivered to aquatic environments by way of rivers, streams, or groundwater. Nutrients
enter rivers and streams from both point and non point sources. Point sources are those
from which nutrients are directly being released into the environment. A sewage
discharge pipe draining into a river is an example of a point source of nutrients. On the
other hand, non point sources enter the environment from no specific point. Runoff
from an agricultural field that washes into a nearby stream after it rains is an example of a
non point source.
Two of the most important nutrients responsible for eutrophication are nitrogen
and phosphorus. In freshwater environments (e.g. lakes), phosphorus is usually the
nutrient in the lowest concentration and therefore generally limits the growth of
phytoplankton. In coastal environments (estuaries), nitrogen usually limits the growth of
phytoplankton because it is generally the nutrient in the lowest concentration. Nitrogen
is commonly found in aquatic environments as nitrate (NO3-), nitrite (NO2
-), or ammonia
(NH4+ or NH3). Human factors affecting the concentration of nitrogen in aquatic
environments are wastewater and septic system effluent, fertilizer runoff, animal waste,
fossil fuel, and industrial discharge. Phosphorus is commonly found in aquatic
environments as phosphate (PO4-3). Human factors affecting the concentration of
phosphorus in aquatic environments are wastewater and septic system effluent,
detergents, fertilizer runoff, animal waste, development/paved surfaces, industrial
discharge, phosphate mining, drinking water treatment, forest fires, and synthetic
material.
Based on the amount of phytoplankton growth and the concentration of nutrients,
the degree of eutrophication in aquatic environments can be classified as oligotrophic,
mesotrophic, eutrophic, or hypereutrophic. Oligotrophic environments are characterized
by clear waters, little suspended organic matter or sediment, and low primary production
(phytoplankton growth). Mesotrophic environments have higher nutrient inputs and
rates of primary production. Eutrophic environments have extremely high nutrient
concentrations and biological productivity. Hypereutrophic environments are
characterized by murky, highly productive waters in which many clear water species
cannot survive.
The production of harmful algal blooms, low dissolved oxygen concentrations,
and changes in species composition are just a few of the effects of eutrophication.
Harmful algal blooms are usually produced under eutrophic or hypereutrophic conditions.
Cyanobacteria and dinoflagellates are examples of phytoplankton responsible for surface
scum, oxygen depletion, and consequent fish kills. Low dissolved oxygen concentrations
can result from the decomposition of phytoplankton. As bacteria break down and
decompose phytoplankton, they take up dissolved oxygen. Also, the phytoplankton in
the bloom consume dissolved oxygen at night. Dissolved oxygen is essential to many
organisms living in aquatic environments; therefore a decrease in dissolved oxygen
concentrations could affect many aquatic organisms. Changes in the abundance and
species composition of phytoplankton could change the quality of food available to
higher trophic level organisms.
In addition, blooms of phytoplankton can reduce the amount of light available to
organisms and plants beneath the surface layer. Submerged aquatic vegetation (SAV)
can be very sensitive to changes in water clarity. Phytoplankton blooms often make the
surface layer very turbid and attenuate light. Light attenuation is the decrease in light
intensity as a result of absorption of energy and of scattering due to particles (such as
phytoplankton) in the water. Severe eutrophication could therefore affect growth of
SAV. A decrease in SAV can cause a shift in the species composition due to the
important role they play as nursery habitats and refuges for many aquatic organisms.
The management and control of cultural eutrophication is closely related to the
prevention and control of pollution. Many state and federal agencies monitor surface and
groundwater quality with the goal of preventing severe eutrophication. Dissolved
oxygen, pH, nutrients, and chlorophyll a are just a few of the water quality parameters
that are often monitored. There are many things that as individuals we can do to help
prevent human induced eutrophication. Reducing the use of lawn fertilizers and
purchasing household detergents and cleaners with low phosphorus concentrations are
just two actions that could help control of cultural eutrophication.
References: Rast W, and Thornton J., 1996. Trends in eutrophication research and control.
Hydrological Processes 10(2), 295-313.
http://www.epa.gov/maia/html/eutroph.html http://www.unep.or.jp/ietc/Publications/TechPublications/TechPub-12/index.asp http://bcn.boulder.co.us/basin/data/NUTRIENTS/info/index.html http://www.umanitoba.ca/institutes/fisheries/eutro.html

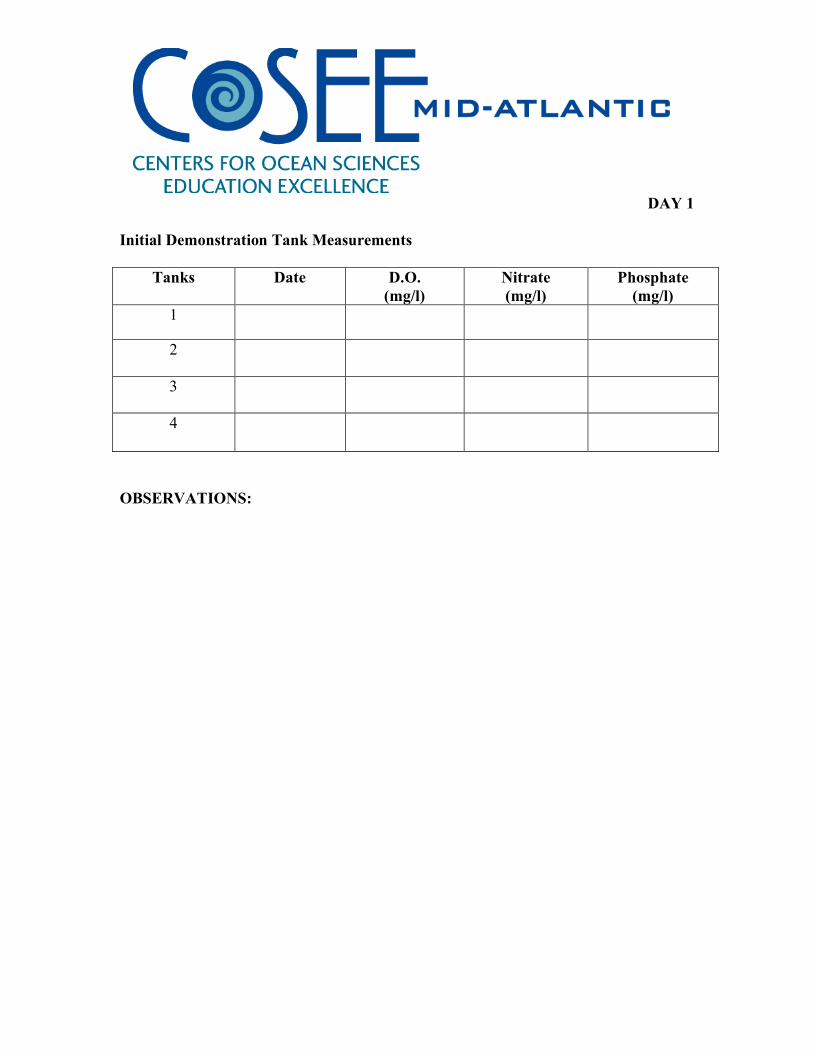
DAY 1
Eutrophication notes:
DAY 1
Initial Demonstration Tank Measurements
Tanks Date D.O. (mg/l)
Nitrate (mg/l)
Phosphate (mg/l)
1
2
3
4
OBSERVATIONS:
DAY 1
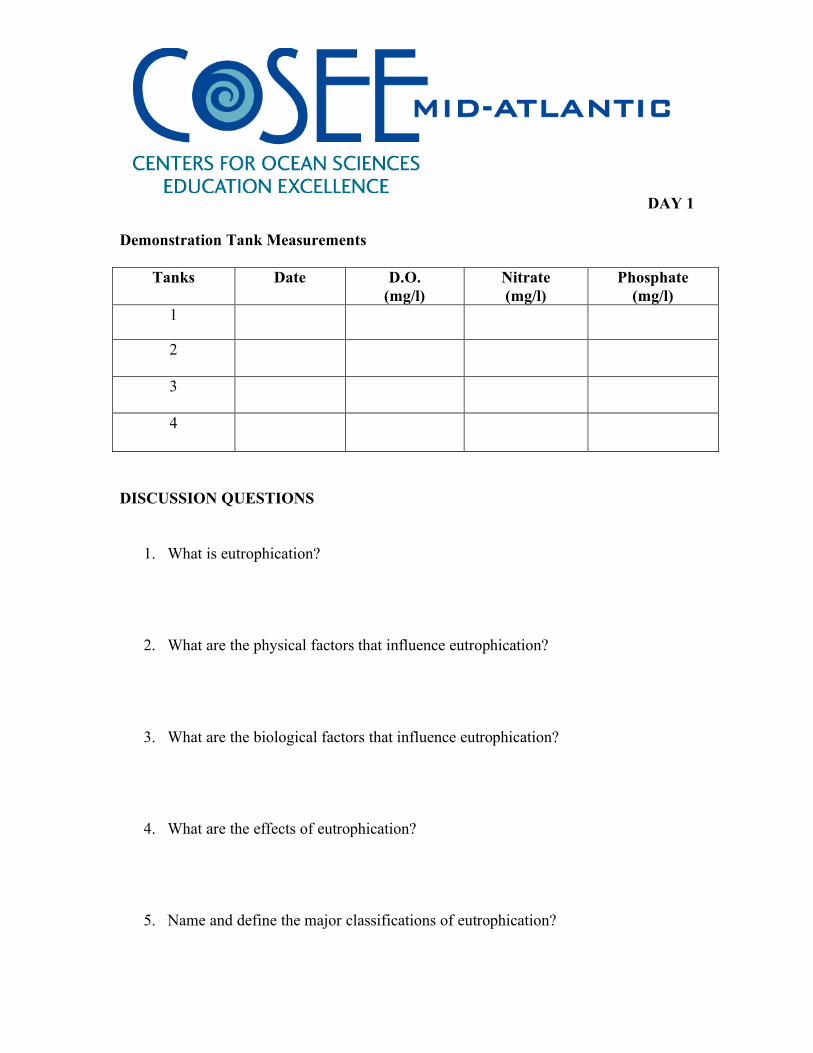
Demonstration Tank Measurements
Tanks Date D.O. (mg/l)
Nitrate (mg/l)
Phosphate (mg/l)
1
2
3
4
DISCUSSION QUESTIONS
1. What is eutrophication? 2. What are the physical factors that influence eutrophication?
3. What are the biological factors that influence eutrophication? 4. What are the effects of eutrophication? 5. Name and define the major classifications of eutrophication?
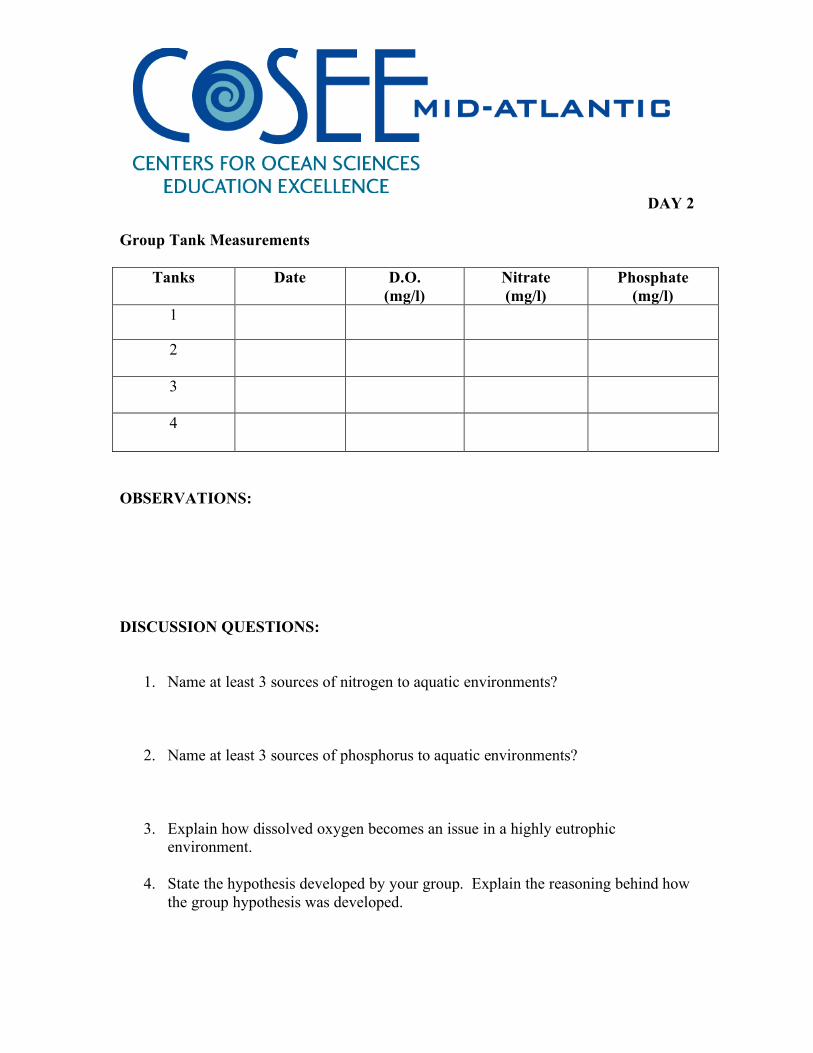
DAY 2
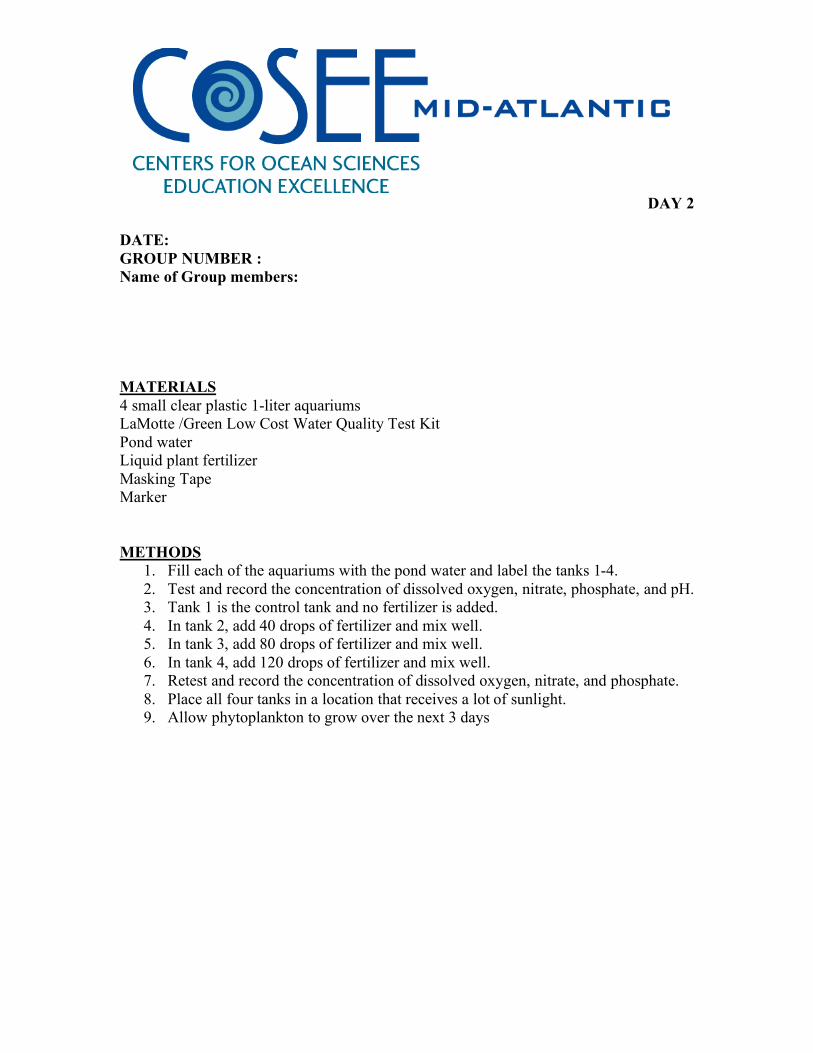
DATE: GROUP NUMBER : Name of Group members: MATERIALS 4 small clear plastic 1-liter aquariums LaMotte /Green Low Cost Water Quality Test Kit Pond water Liquid plant fertilizer Masking Tape Marker METHODS
1. Fill each of the aquariums with the pond water and label the tanks 1-4. 2. Test and record the concentration of dissolved oxygen, nitrate, phosphate, and pH. 3. Tank 1 is the control tank and no fertilizer is added. 4. In tank 2, add 40 drops of fertilizer and mix well. 5. In tank 3, add 80 drops of fertilizer and mix well. 6. In tank 4, add 120 drops of fertilizer and mix well. 7. Retest and record the concentration of dissolved oxygen, nitrate, and phosphate. 8. Place all four tanks in a location that receives a lot of sunlight. 9. Allow phytoplankton to grow over the next 3 days
DAY 2
Demonstration Tank Measurements
Tanks Date D.O. (mg/l)
Nitrate (mg/l)
Phosphate (mg/l)
1
2
3
4
OBSERVATIONS:
DAY 2
DATE: GROUP NUMBER : Name of Group members: HYPOTHESIS: Initial Group Tank Measurements
Tanks Date D.O. (mg/l)
Nitrate (mg/l)
Phosphate (mg/l)
1
2
3
4
DAY 2
Group Tank Measurements
Tanks Date D.O. (mg/l)
Nitrate (mg/l)
Phosphate (mg/l)
1
2
3
4
OBSERVATIONS:
DISCUSSION QUESTIONS:
1. Name at least 3 sources of nitrogen to aquatic environments?
2. Name at least 3 sources of phosphorus to aquatic environments?
3. Explain how dissolved oxygen becomes an issue in a highly eutrophic environment.
4. State the hypothesis developed by your group. Explain the reasoning behind how
the group hypothesis was developed.
DAY 3
DATE: GROUP NUMBER : Name of Group members: Demonstration Tank Measurements
Tanks Date D.O. (mg/l)
Nitrate (mg/l)
Phosphate (mg/l)
1
2
3
4
Group Tank Measurements
Tanks Date D.O. (mg/l)
Nitrate (mg/l)
Phosphate (mg/l)
1
2
3
4
OBSERVATIONS:

DAY 3
BACKGROUND INFORMATION:

DAY 3
BACKGROUND INFORMATION:
DAY 3
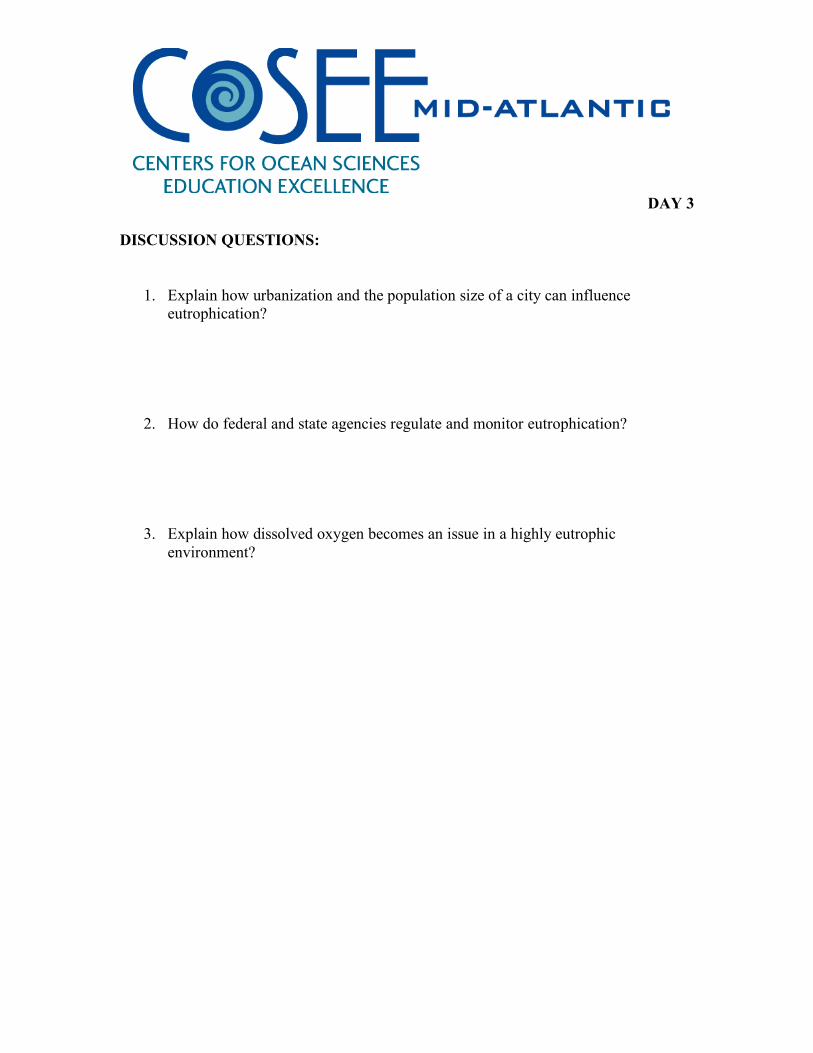
DISCUSSION QUESTIONS:
1. Explain how urbanization and the population size of a city can influence eutrophication?
2. How do federal and state agencies regulate and monitor eutrophication?
3. Explain how dissolved oxygen becomes an issue in a highly eutrophic environment?
DAY 4
DATE: GROUP NUMBER : Name of Group members: Demonstration Tank Measurements
Tanks Date D.O. (mg/l)
Nitrate (mg/l)
Phosphate (mg/l)
1
2
3
4
Group Tank Measurements
Tanks Date D.O. (mg/l)
Nitrate (mg/l)
Phosphate (mg/l)
1
2
3
4
OBSERVATIONS:

DAY 4
DATA ANALYSIS:

DAY 4
DATA ANALYSIS:

DAY 4
CONCLUSIONS:
DAY 4
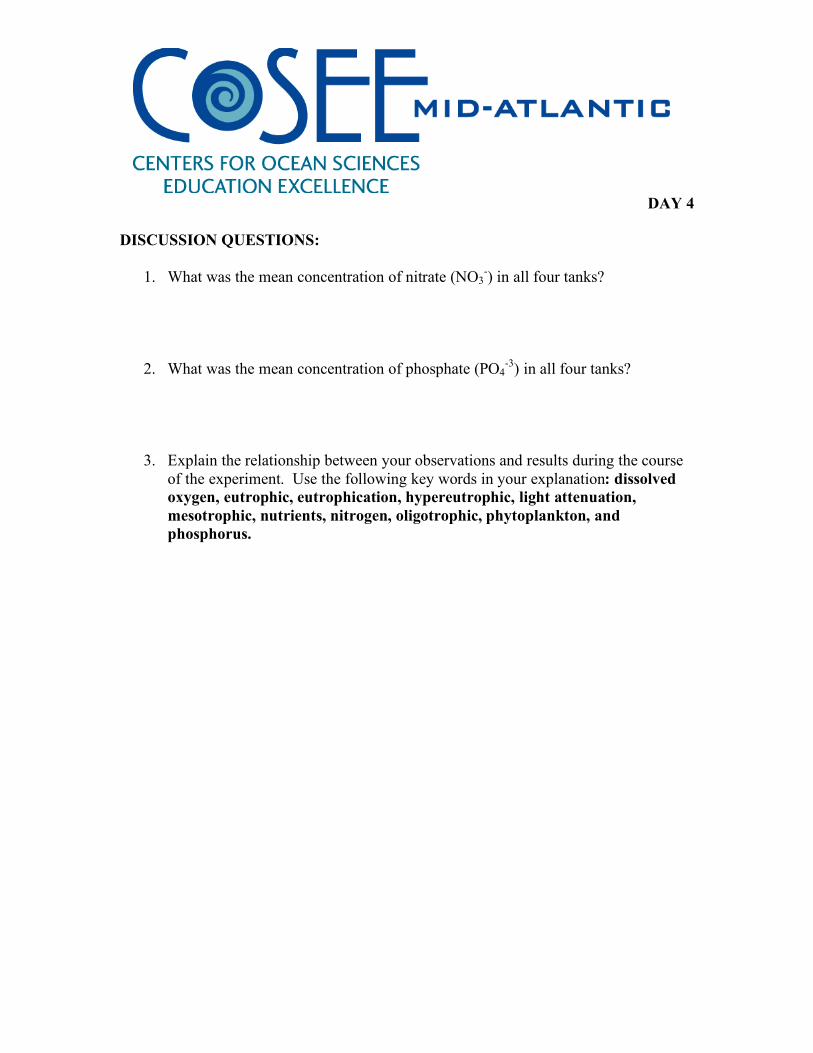
DISCUSSION QUESTIONS:
1. What was the mean concentration of nitrate (NO3-) in all four tanks?
2. What was the mean concentration of phosphate (PO4-3) in all four tanks?
3. Explain the relationship between your observations and results during the course of the experiment. Use the following key words in your explanation: dissolved oxygen, eutrophic, eutrophication, hypereutrophic, light attenuation, mesotrophic, nutrients, nitrogen, oligotrophic, phytoplankton, and phosphorus.
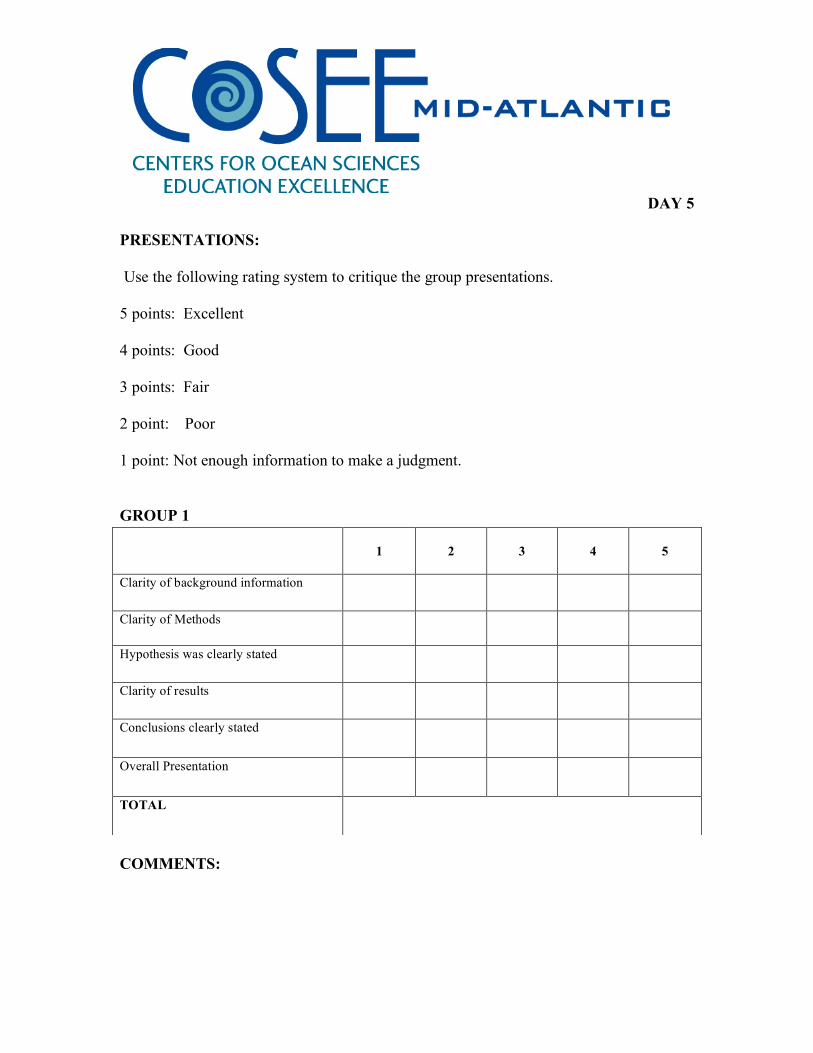
DAY 5
PRESENTATIONS: Use the following rating system to critique the group presentations. 5 points: Excellent 4 points: Good 3 points: Fair 2 point: Poor 1 point: Not enough information to make a judgment. GROUP 1
COMMENTS:
1
2
3
4
5
Clarity of background information
Clarity of Methods
Hypothesis was clearly stated
Clarity of results
Conclusions clearly stated
Overall Presentation
TOTAL
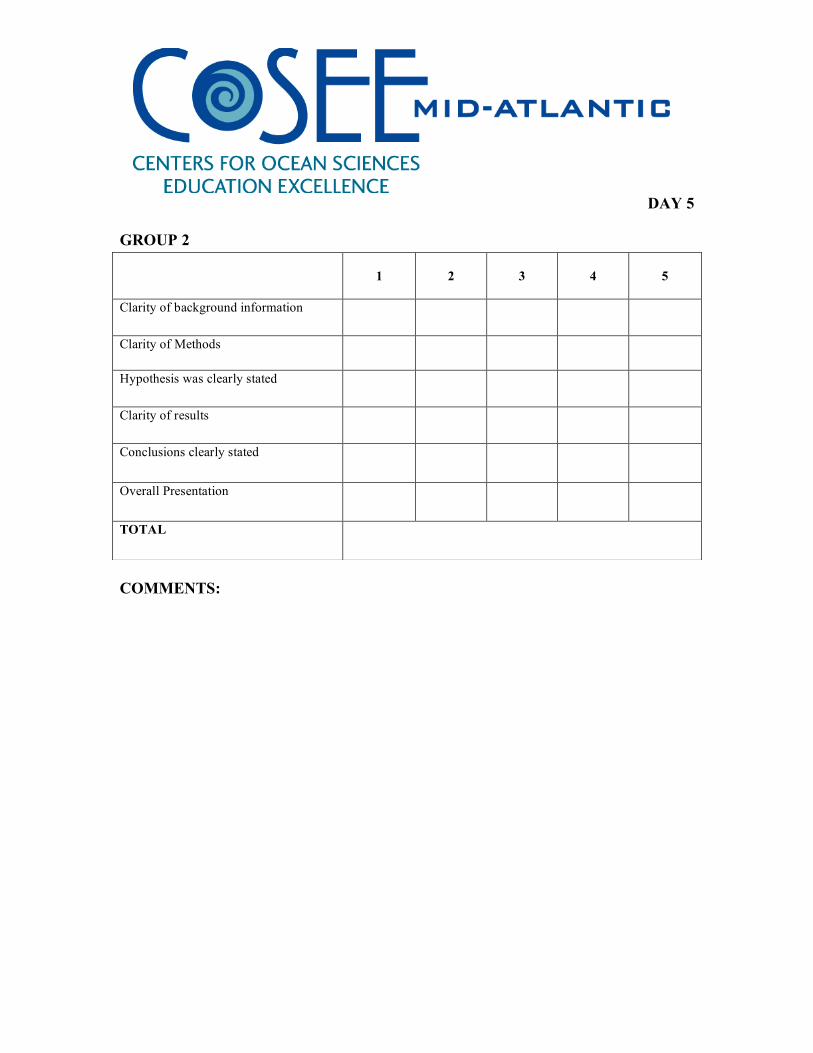
DAY 5
GROUP 2
COMMENTS:
1
2
3
4
5
Clarity of background information
Clarity of Methods
Hypothesis was clearly stated
Clarity of results
Conclusions clearly stated
Overall Presentation
TOTAL
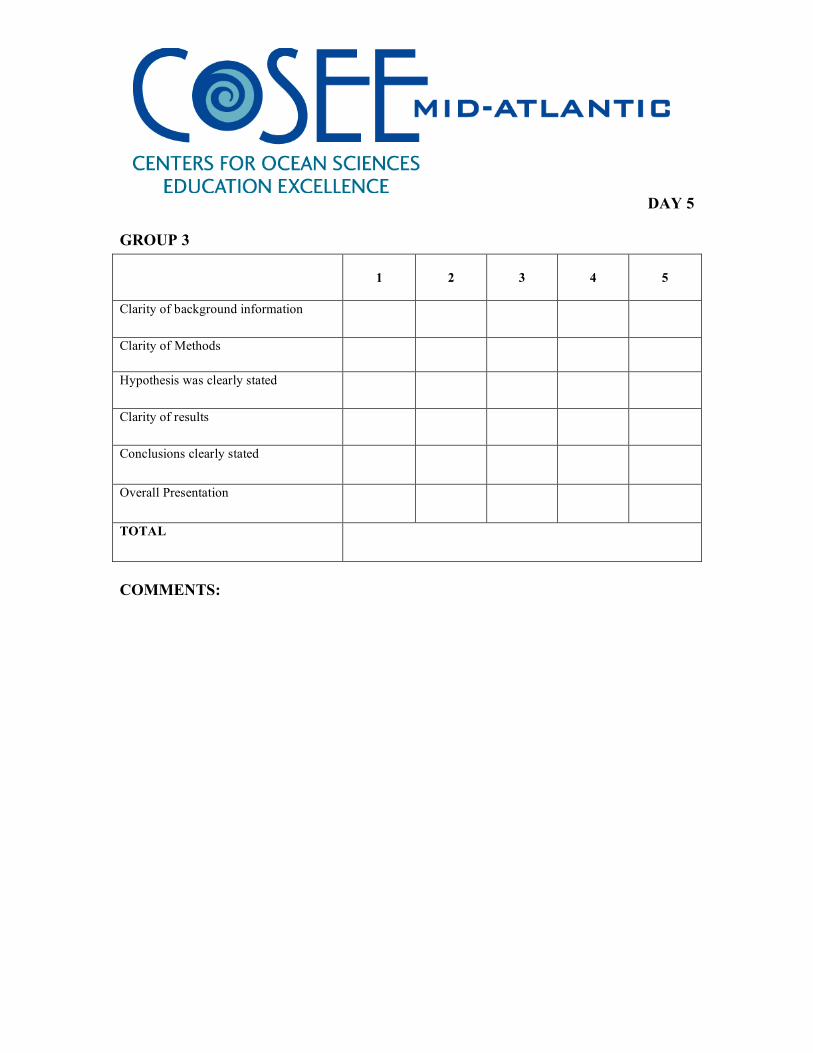
DAY 5
GROUP 3
COMMENTS:
1
2
3
4
5
Clarity of background information
Clarity of Methods
Hypothesis was clearly stated
Clarity of results
Conclusions clearly stated
Overall Presentation
TOTAL

DAY 5
GROUP 4
COMMENTS:
1
2
3
4
5
Clarity of background information
Clarity of Methods
Hypothesis was clearly stated
Clarity of results
Conclusions clearly stated
Overall Presentation
TOTAL

DAY 5
GROUP 5
COMMENTS:
1
2
3
4
5
Clarity of background information
Clarity of Methods
Hypothesis was clearly stated
Clarity of results
Conclusions clearly stated
Overall Presentation
TOTAL
DAY 5
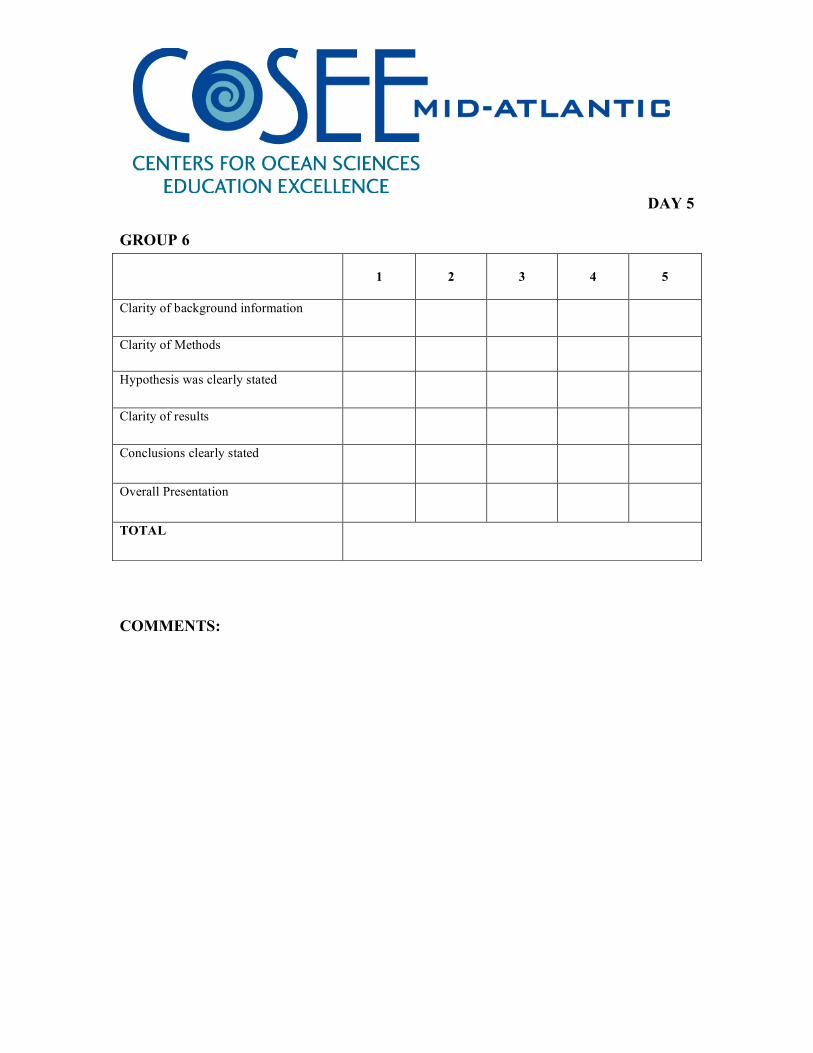
GROUP 6
COMMENTS:
1
2
3
4
5
Clarity of background information
Clarity of Methods
Hypothesis was clearly stated
Clarity of results
Conclusions clearly stated
Overall Presentation
TOTAL