eutrophication 5 case histories alice newton nancy rabalais mingyuan zhu laurence mee
TRANSCRIPT

Eutrophication 5Case Histories
Alice NewtonNancy RabalaisMingyuan ZhuLaurence Mee
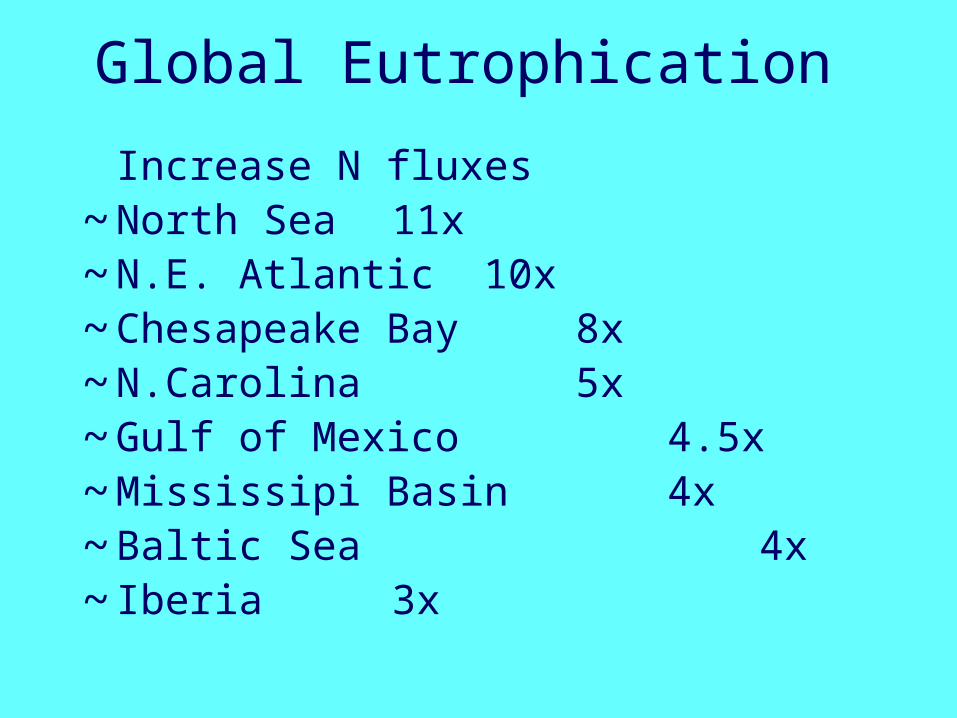
Global Eutrophication Increase N fluxes~ North Sea 11x~ N.E. Atlantic 10x~ Chesapeake Bay 8x~ N.Carolina 5x~ Gulf of Mexico 4.5x~ Mississipi Basin 4x~ Baltic Sea 4x~ Iberia 3x
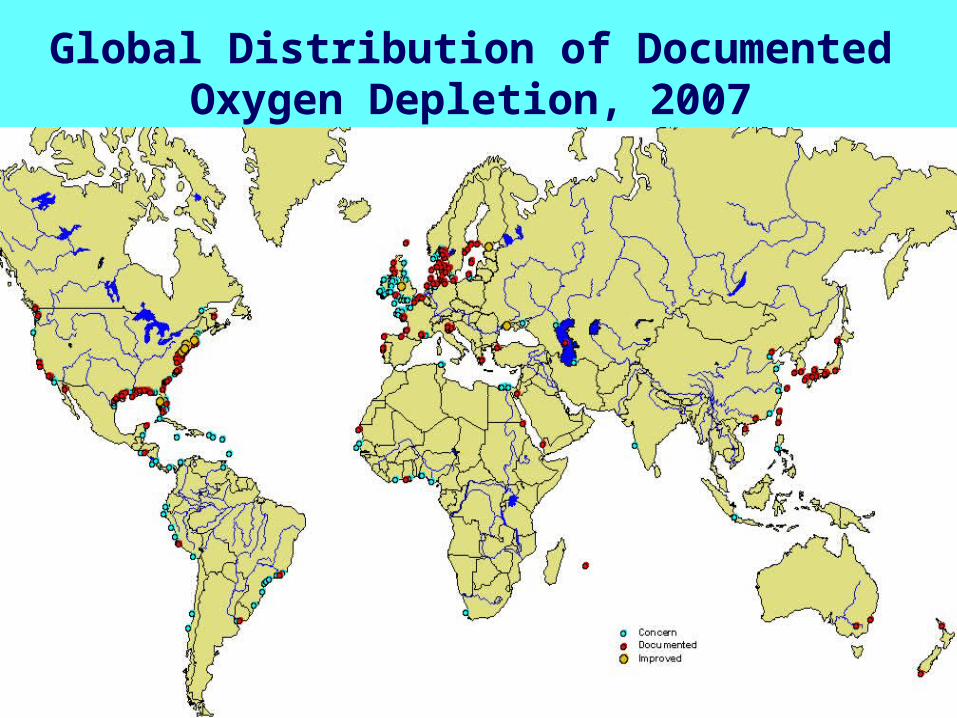
Global Distribution of DocumentedOxygen Depletion, 2007
n = 146
(Diaz et al., 2004)
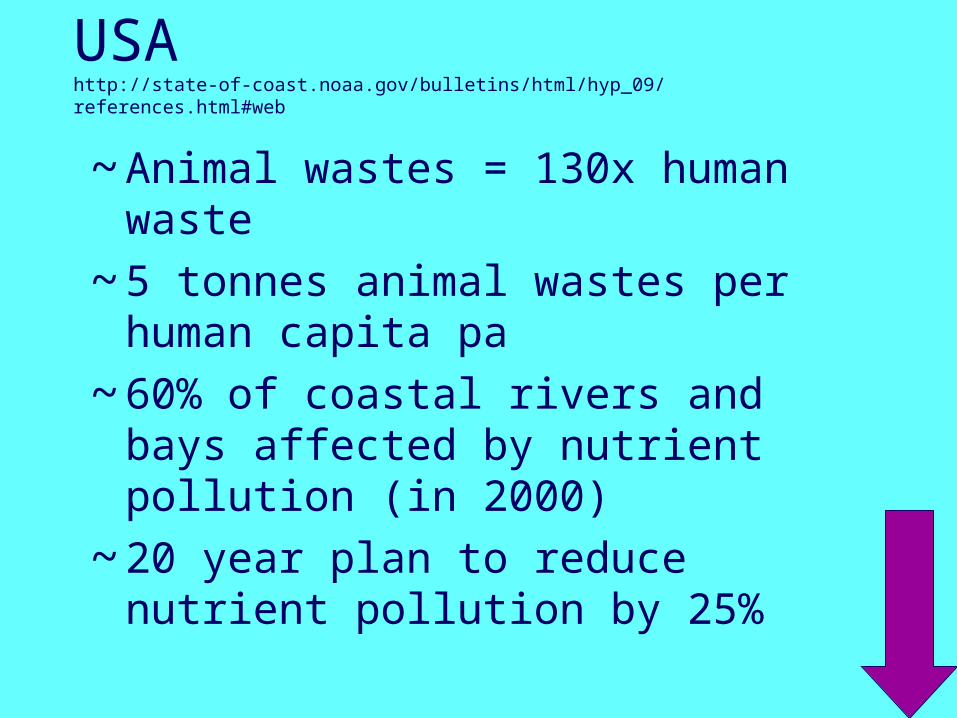
USAhttp://state-of-coast.noaa.gov/bulletins/html/hyp_09/references.html#web
~ Animal wastes = 130x human waste
~ 5 tonnes animal wastes per human capita pa
~ 60% of coastal rivers and bays affected by nutrient pollution (in 2000)
~ 20 year plan to reduce nutrient pollution by 25%

U.S. Coastal ecosystemsexperiencing high levels of
eutrophication
Boesch et al. 2001
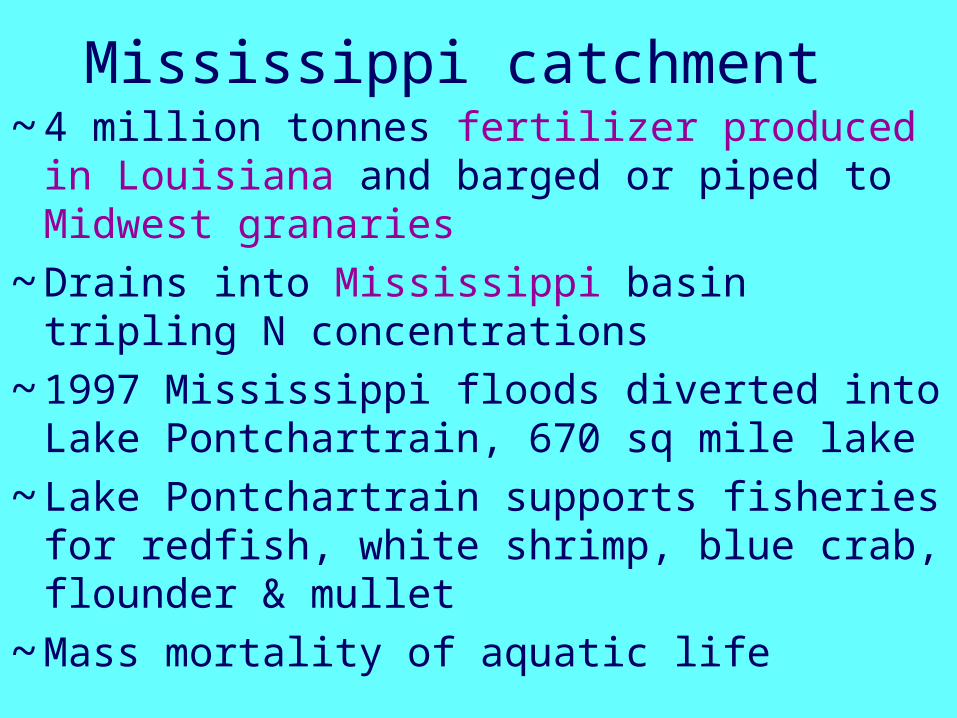
Mississippi catchment~ 4 million tonnes fertilizer produced in
Louisiana and barged or piped to Midwest granaries
~ Drains into Mississippi basin tripling N concentrations
~ 1997 Mississippi floods diverted into Lake Pontchartrain, 670 sq mile lake
~ Lake Pontchartrain supports fisheries for redfish, white shrimp, blue crab, flounder & mullet
~ Mass mortality of aquatic life
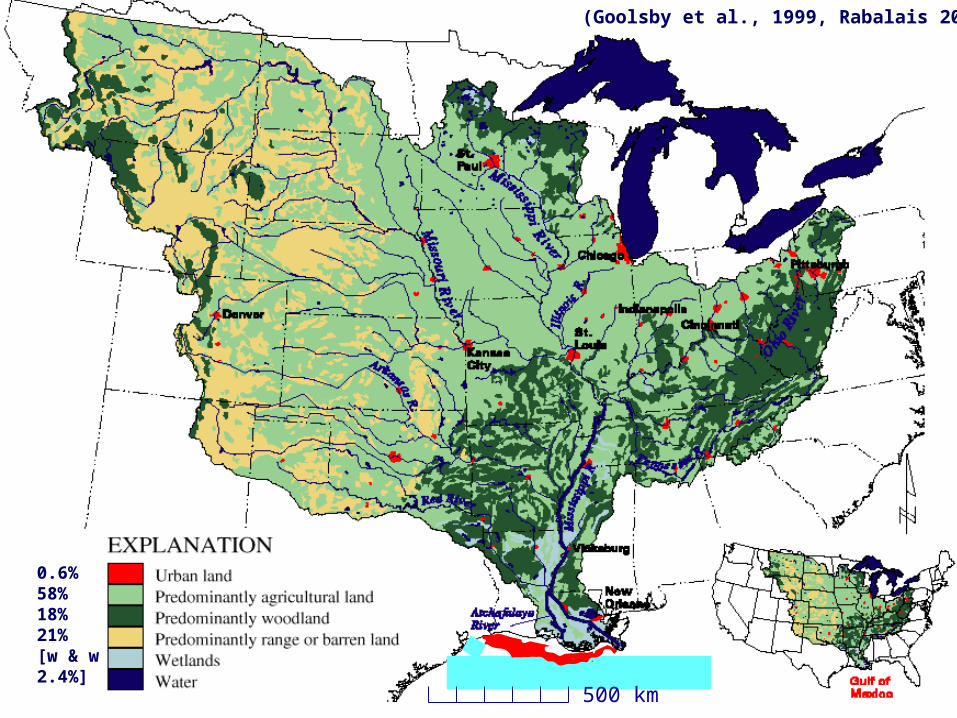
500 km
0.6%58%18%21%[w & w2.4%]
(Goolsby et al., 1999, Rabalais 2002)
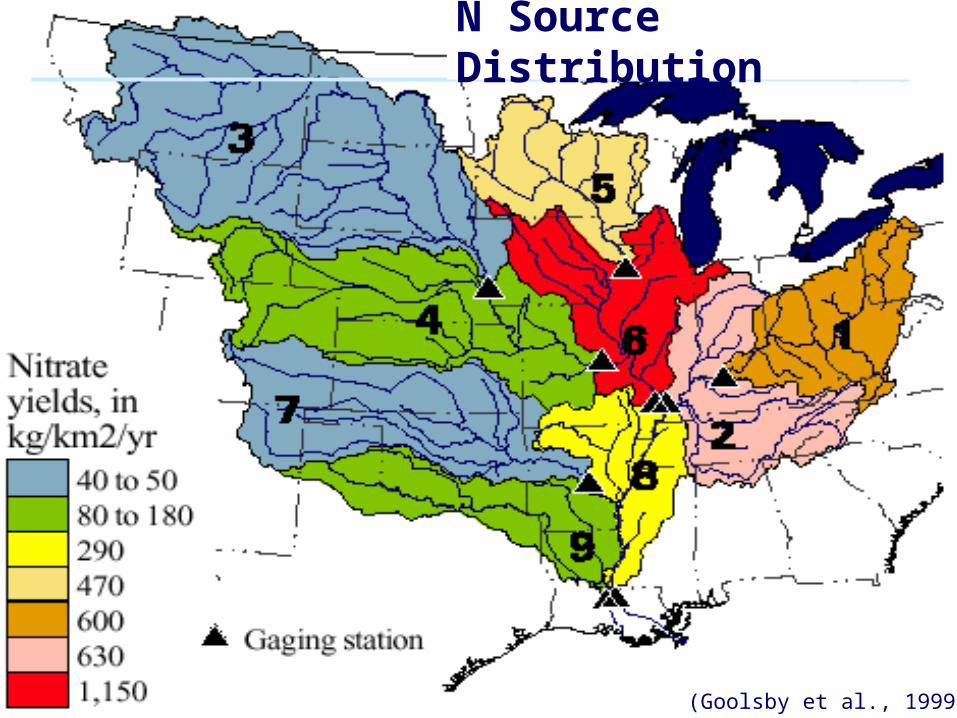
N Source Distribution
(Goolsby et al., 1999)
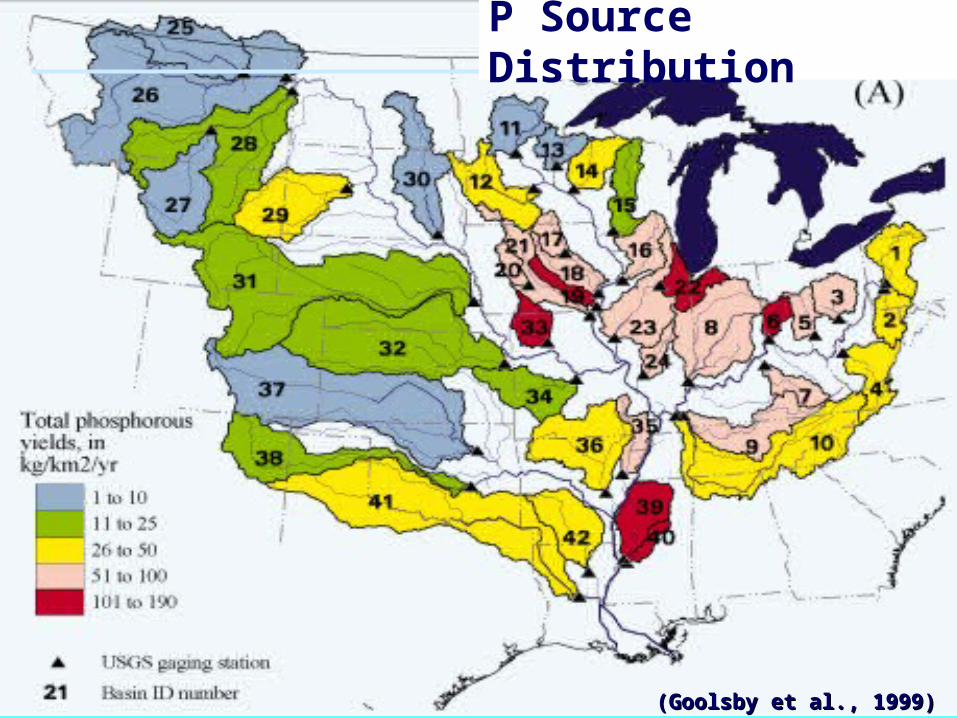
(Goolsby et al., 1999)(Goolsby et al., 1999)
P Source Distribution
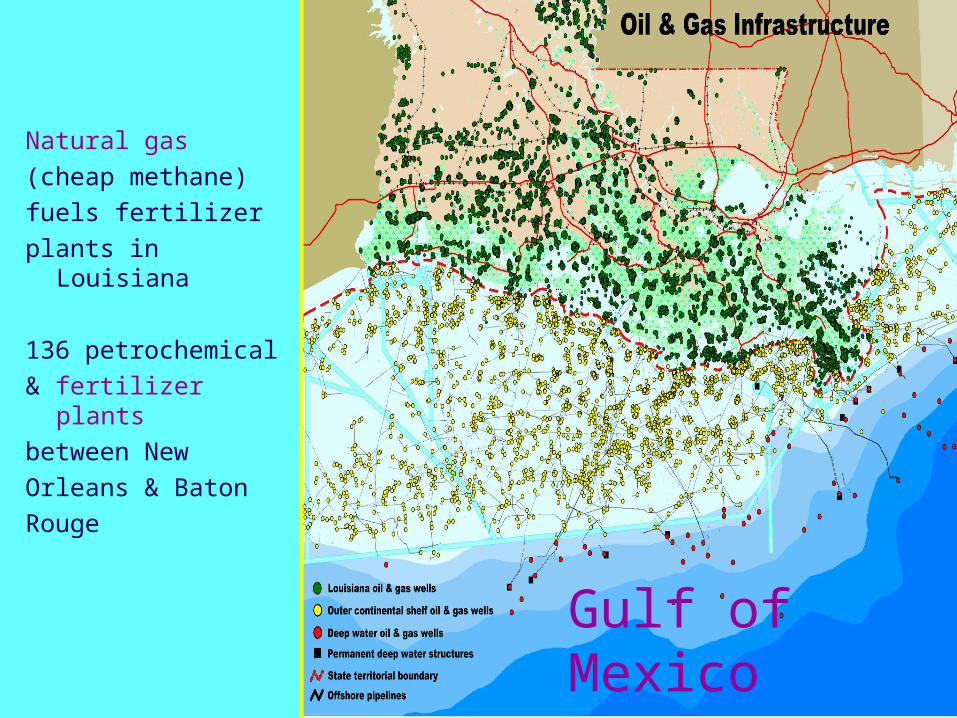
Gulf of Mexico
Natural gas (cheap methane)fuels fertilizerplants in Louisiana
136 petrochemical & fertilizer plantsbetween NewOrleans & BatonRouge
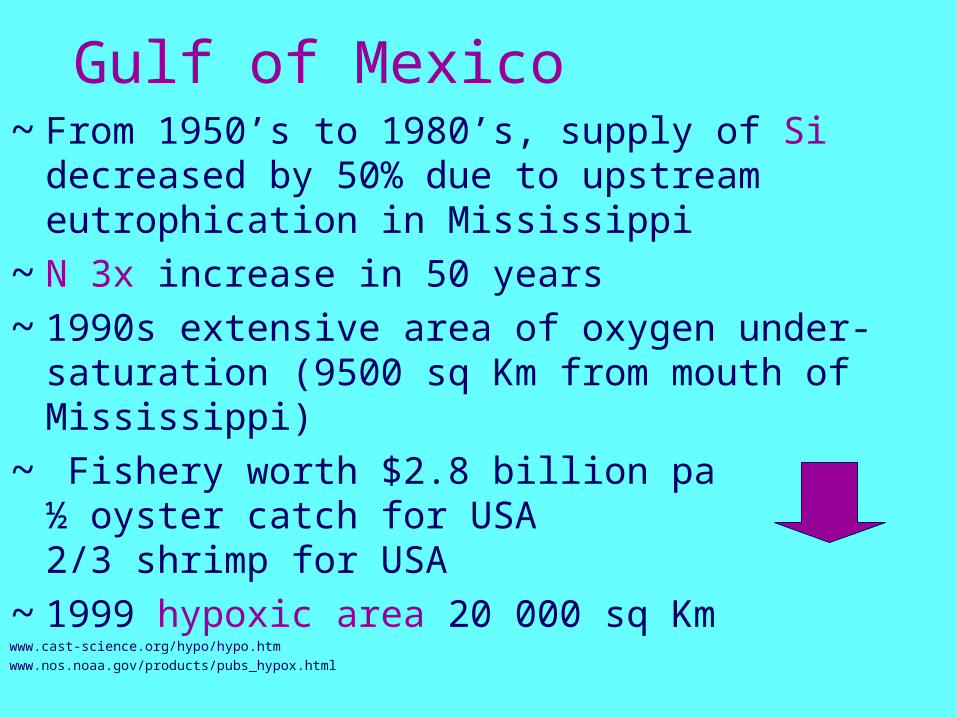
Gulf of Mexico~ From 1950’s to 1980’s, supply of Si decreased
by 50% due to upstream eutrophication in Mississippi
~ N 3x increase in 50 years
~ 1990s extensive area of oxygen under-saturation (9500 sq Km from mouth of Mississippi)
~ Fishery worth $2.8 billion pa½ oyster catch for USA 2/3 shrimp for USA
~ 1999 hypoxic area 20 000 sq Kmwww.cast-science.org/hypo/hypo.htmwww.nos.noaa.gov/products/pubs_hypox.html
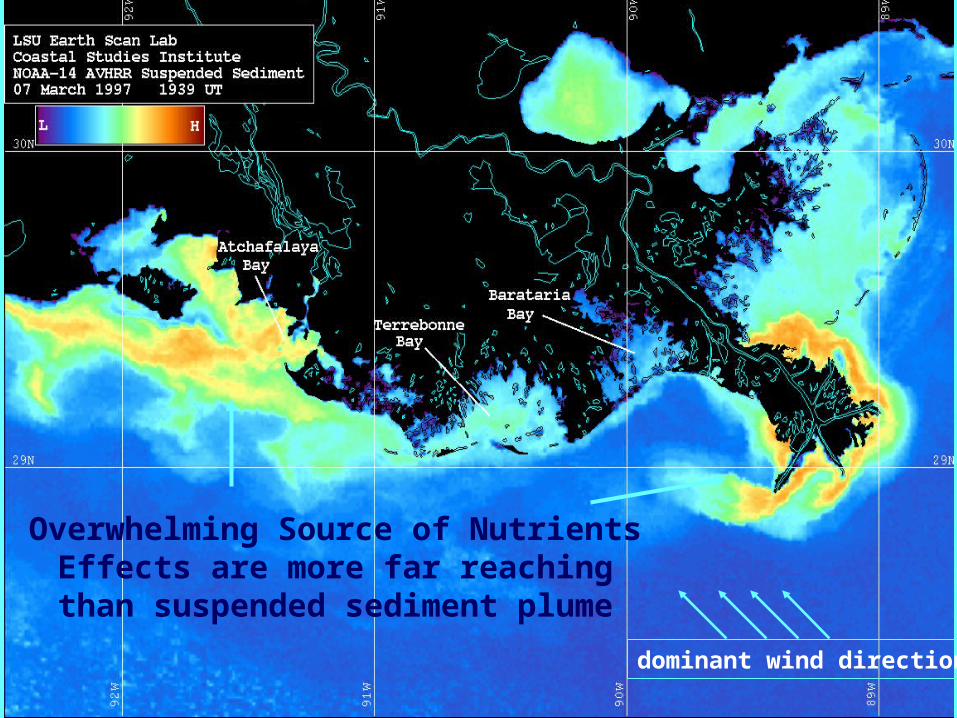
Overwhelming Source of NutrientsEffects are more far reaching
than suspended sediment plume
dominant wind direction
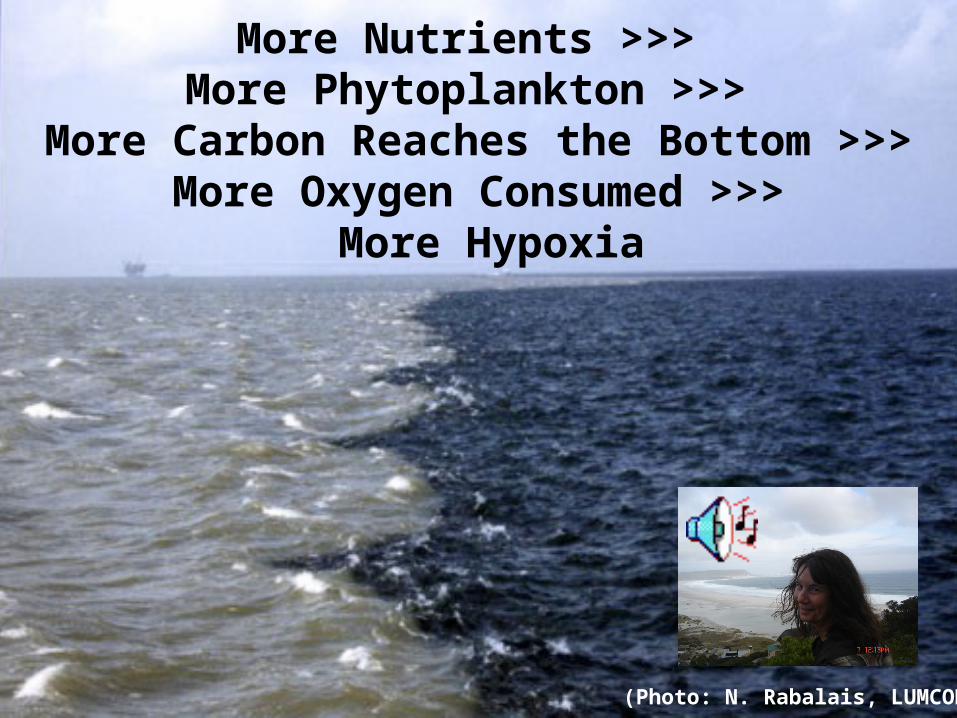
More Nutrients >>> More Phytoplankton >>>
More Carbon Reaches the Bottom >>>More Oxygen Consumed >>>
More Hypoxia
(Photo: N. Rabalais, LUMCON)
-94 -93.5 -93 -92.5 -92 -91.5 -91 -90.5 -90 -89.5
28.5
29
29.5
30L. Calcasieu Atchafalaya R.
Mississippi R.
Terrebonne Bay
Sabine L.
100 km
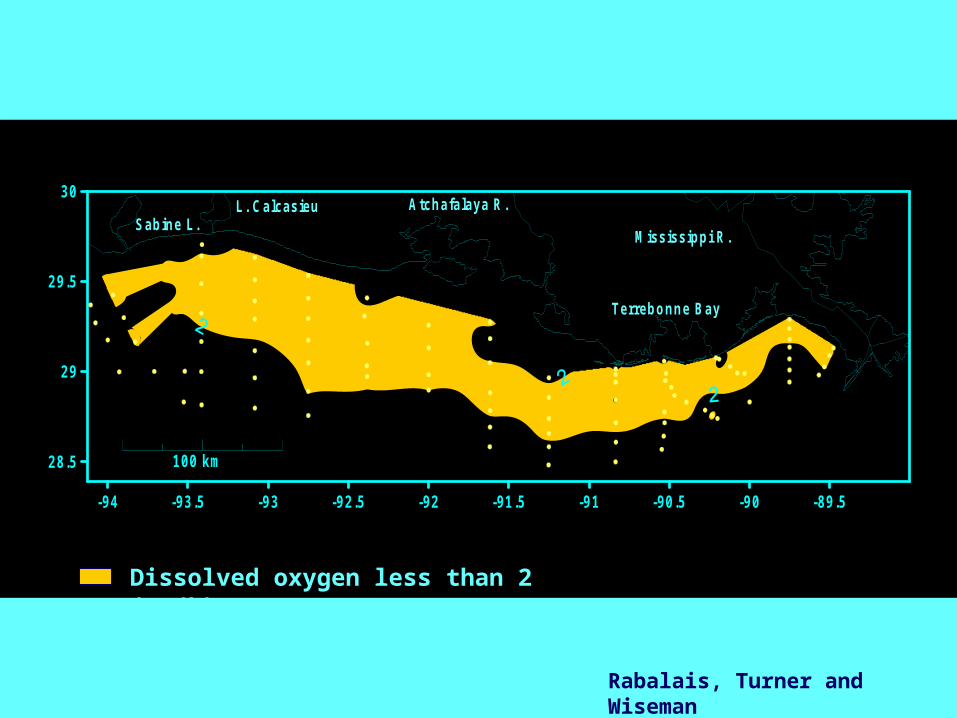
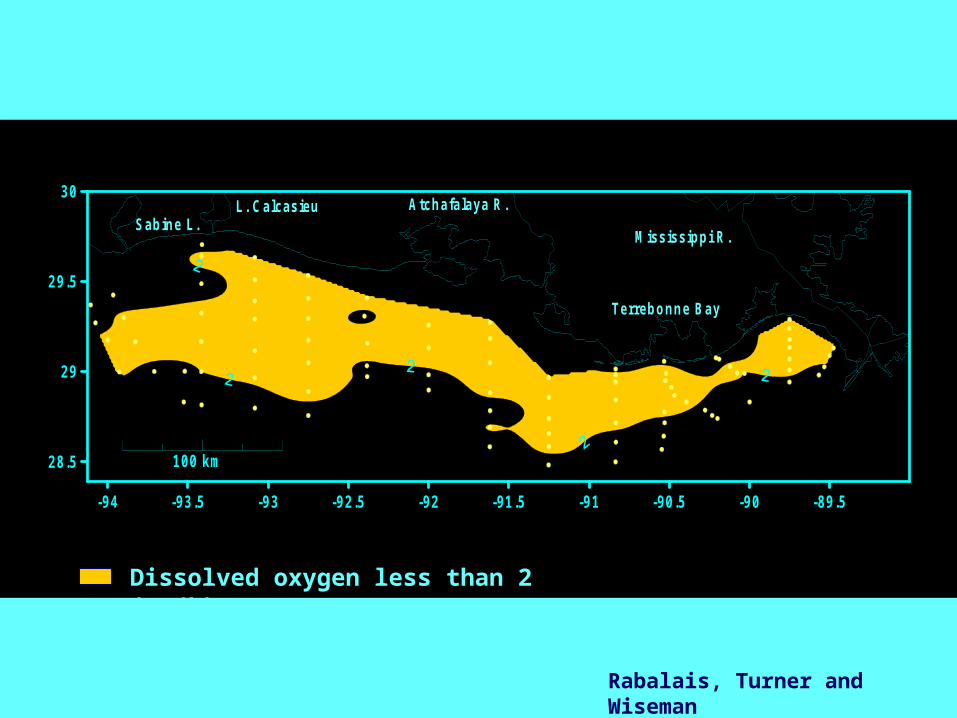
Bottom-Water Hypoxia July 20-25, 2001
Dissolved oxygen less than 2 (mg/L)
Rabalais, Turner and Wiseman
-94 -93.5 -93 -92.5 -92 -91.5 -91 -90.5 -90 -89.5
28.5
29
29.5
30L. Calcasieu Atchafalaya R.
Mississippi R.
Terrebonne Bay
Sabine L.
100 km
Bottom-Water Hypoxia July 21-26, 2002
Dissolved oxygen less than 2 (mg/L)
Rabalais, Turner and Wiseman
-94 -93.5 -93 -92.5 -92 -91.5 -91 -90.5 -90 -89.5
28.5
29
29.5
30L. Calcasieu Atchafalaya R.
Mississippi R.
Terrebonne Bay
Sabine L.
100 km
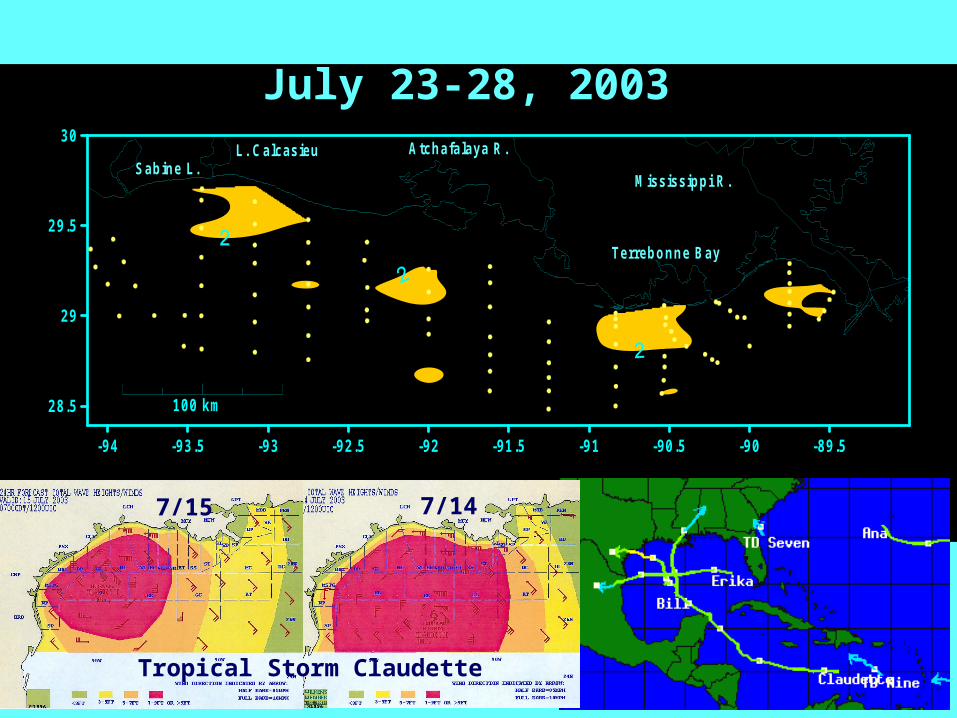
Rabalais, Turner and Wiseman
Bottom-Water Hypoxia July 23-28, 2003
7/15 7/14
Tropical Storm Claudette
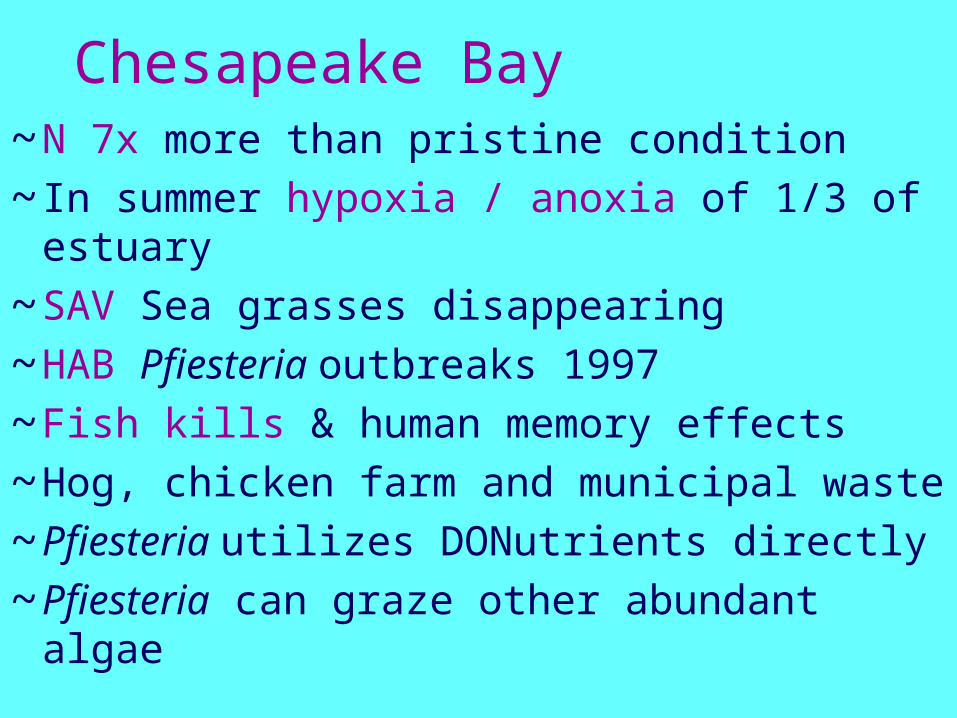
Chesapeake Bay~N 7x more than pristine condition~ In summer hypoxia / anoxia of 1/3 of
estuary~SAV Sea grasses disappearing~HAB Pfiesteria outbreaks 1997~Fish kills & human memory effects~Hog, chicken farm and municipal waste~Pfiesteria utilizes DONutrients directly~Pfiesteria can graze other abundant
algae
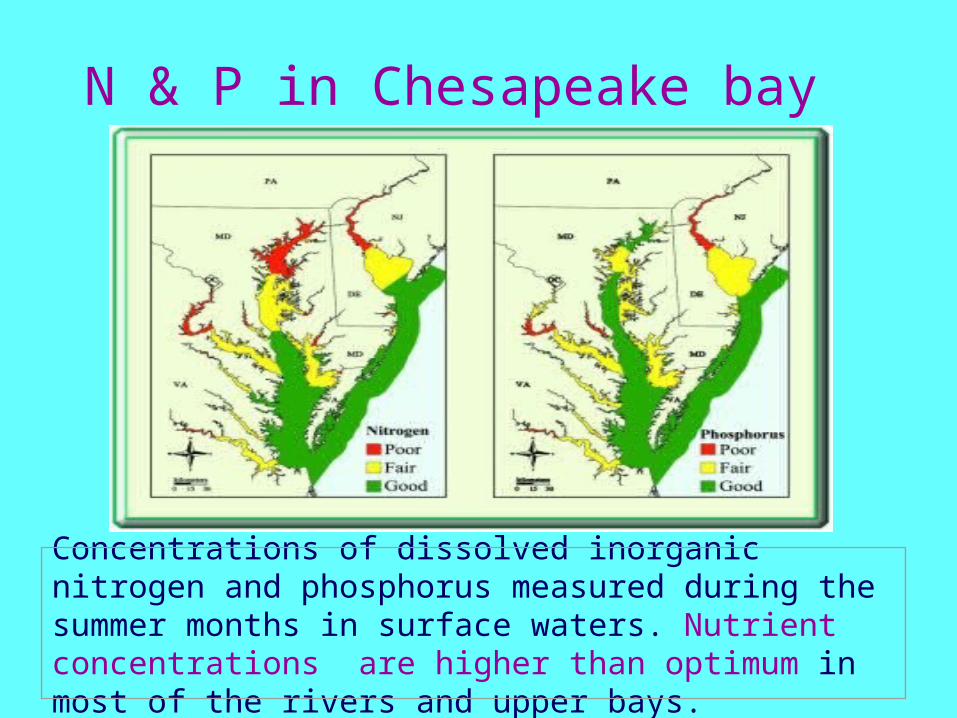
N & P in Chesapeake bay
Concentrations of dissolved inorganic nitrogen and phosphorus measured during the summer months in surface waters. Nutrient concentrations are higher than optimum in most of the rivers and upper bays.
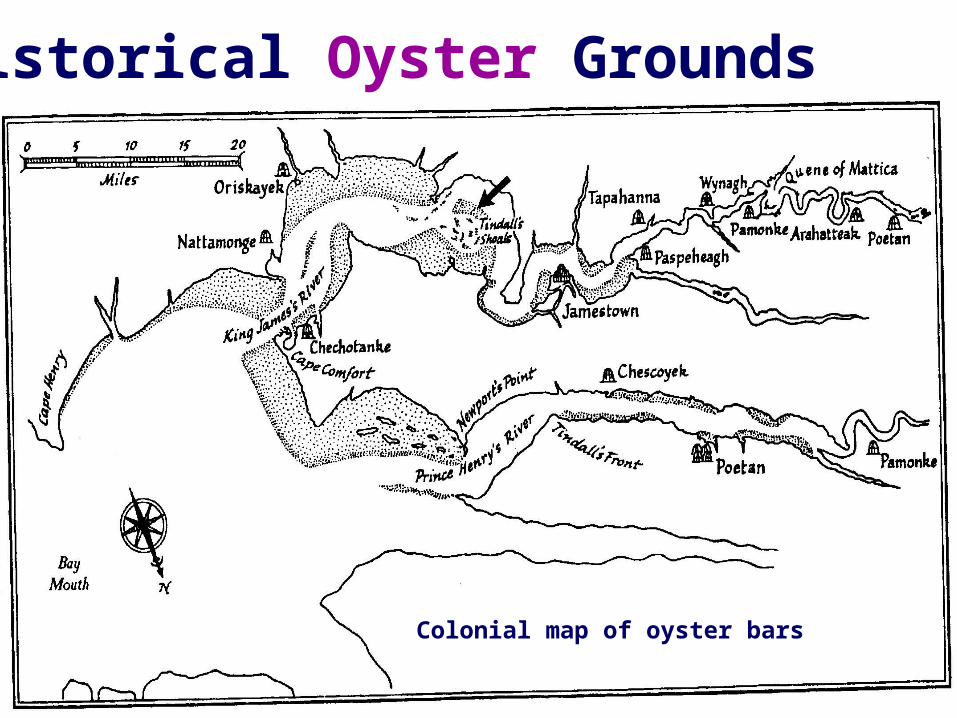
Colonial map of oyster bars
Historical Oyster Grounds
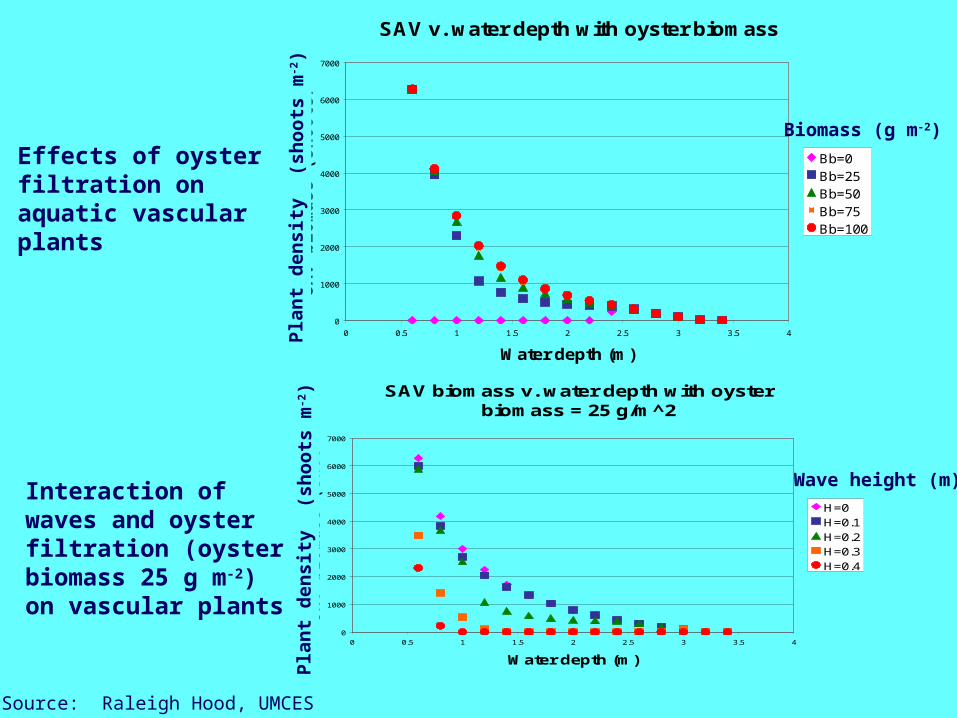
SAV biomass v. water depth with oyster biomass = 25 g/m^2
0
1000
2000
3000
4000
5000
6000
7000
0 0.5 1 1.5 2 2.5 3 3.5 4
Water depth (m)
SA
V b
iom
as
s (
sh
oo
ts/m
^2
)
H=0H=0.1H=0.2H=0.3H=0.4
SAV v. water depth with oyster biomass
0
1000
2000
3000
4000
5000
6000
7000
0 0.5 1 1.5 2 2.5 3 3.5 4
Water depth (m)
SA
V b
iom
as
s (
sh
oo
ts/m
^2
)
Bb=0Bb=25Bb=50Bb=75Bb=100
Biomass (g m-2)
Wave height (m)
Effects of oyster filtration on aquatic vascular plants
Interaction of waves and oyster filtration (oyster biomass 25 g m-2) on vascular plants
Pl a
nt
den
sit y
(s
ho
ot s
m-2)
Pl a
nt
den
sit y
(s
ho
ot s
m-2)
Source: Raleigh Hood, UMCES
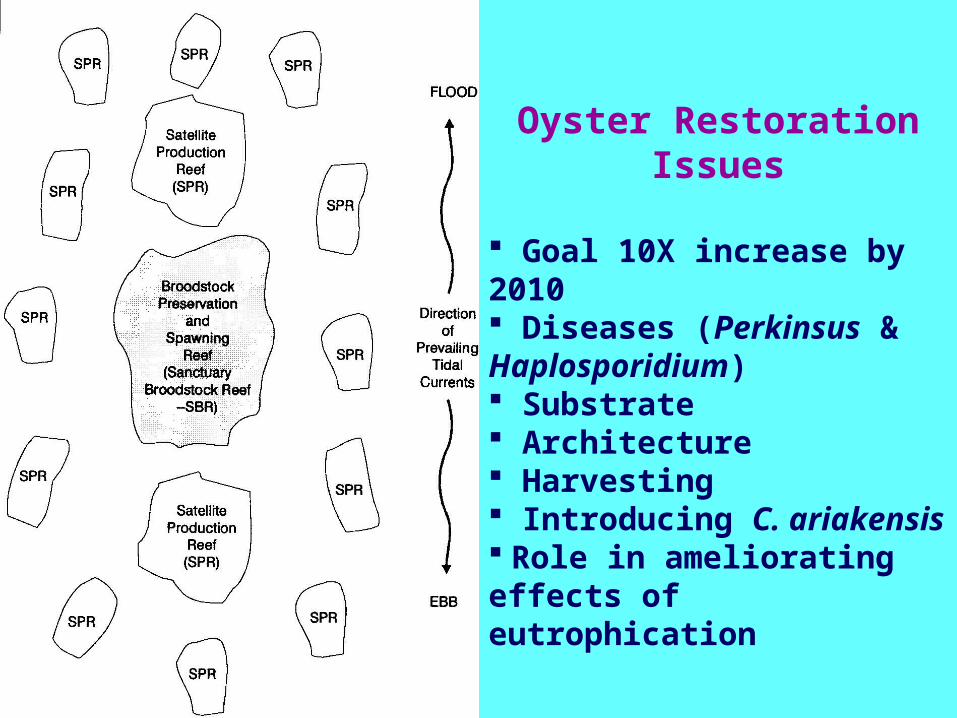
Oyster Restoration Issues
Goal 10X increase by 2010 Diseases (Perkinsus & Haplosporidium) Substrate Architecture Harvesting Introducing C. ariakensis Role in ameliorating effects of eutrophication

North Carolina
~ Waste from hog production is 3x all human sewage output for NewYork city
~ Little or no treatment in the absence of regulations
~ HAB Pfiesteria outbreaks
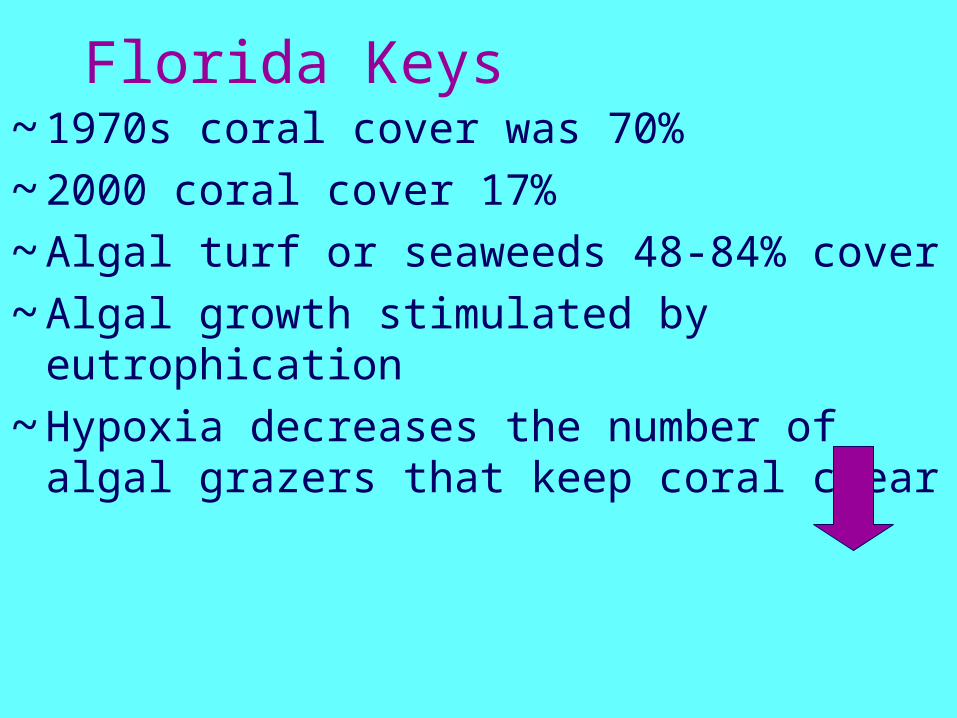
Florida Keys~ 1970s coral cover was 70%
~ 2000 coral cover 17%
~ Algal turf or seaweeds 48-84% cover
~ Algal growth stimulated by eutrophication
~ Hypoxia decreases the number of algal grazers that keep coral clear
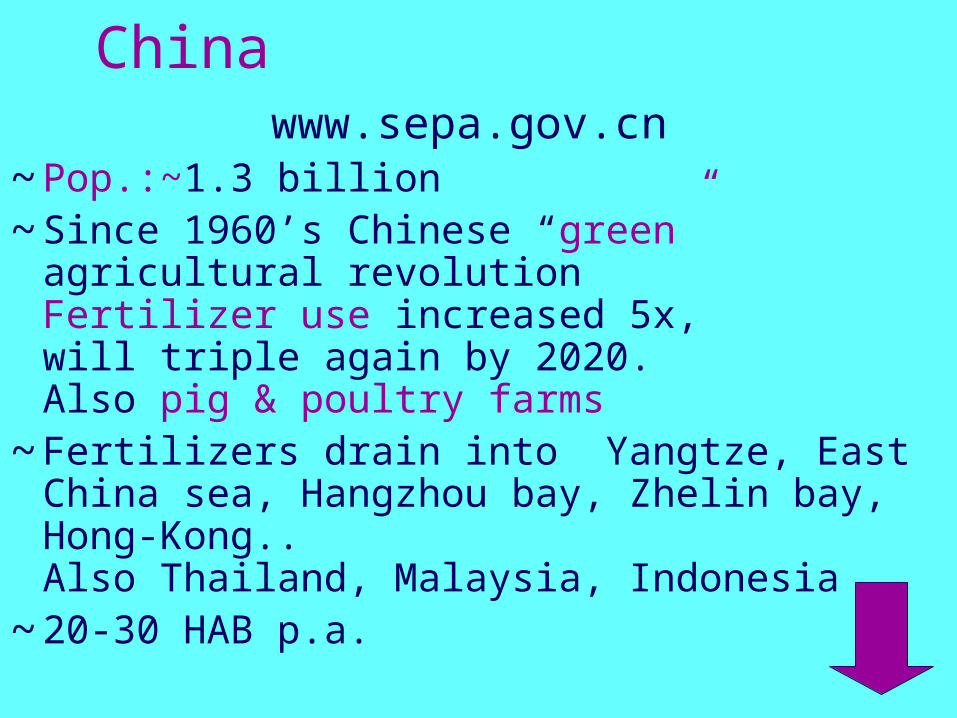
Chinawww.sepa.gov.cn
~ Pop.:~1.3 billion~ Since 1960’s Chinese “green” agricultural
revolution Fertilizer use increased 5x, will triple again by 2020.Also pig & poultry farms
~ Fertilizers drain into Yangtze, East China sea, Hangzhou bay, Zhelin bay, Hong-Kong.. Also Thailand, Malaysia, Indonesia
~ 20-30 HAB p.a.
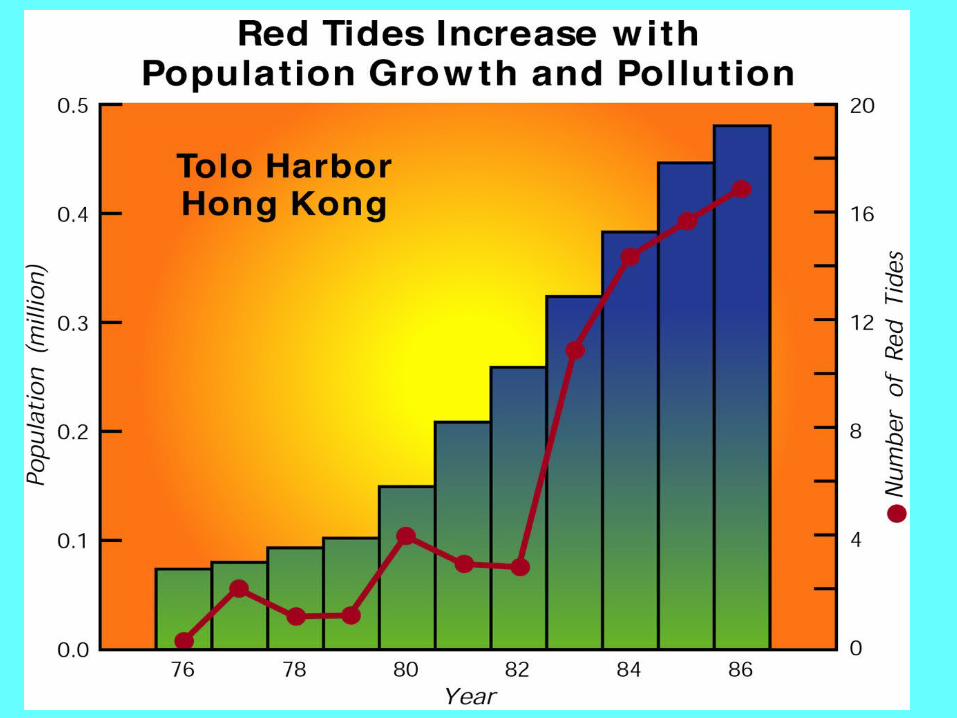

~Main causes ~Increase fertilizer~Reduction of effluent~Reduction of zooplankton
~Main consequences~HABs, some toxic
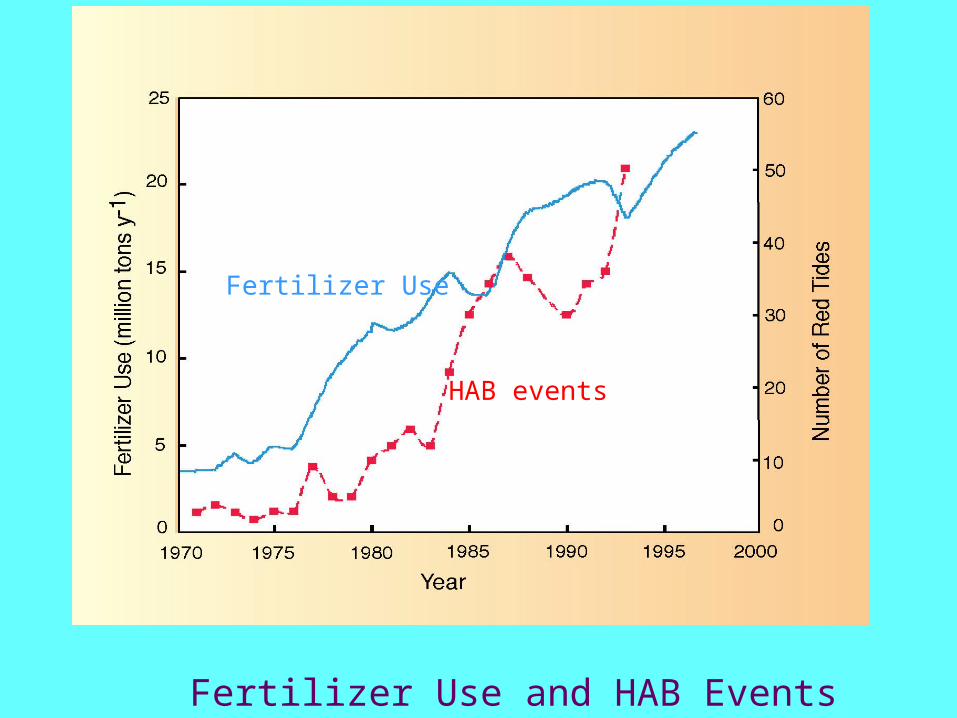
Fertilizer Use and HAB Events in China
Fertilizer Use
HAB events

Increased frequency of HAB’s in China
~1930’s: 1
~1950’s: 1
~1960’s: 2
~1970’s: 6
~1980’s: 30
~1990’s: 229
~2000 - 2005 : 481
#Y
#Y
#Y#Y
#Y
#Y
#Y
#Y
#Y
#Y
#Y
#Y
#Y
#Y
#Y
#Y#Y
#Y
#Y
#Y
#Y
#Y
#Y
#Y #Y
#
#
#
#
#
#
#
#
#
#
# ##
#
#
#
###
#
#
#
##
#
#
#
#
#
##
#
#
#
#
#
#
#
#
#
#
#
#
# #
#
#
#
#
#
#
#
#
#
#
##
#
#
#
##
#
##
###
#
#
##
#
#
####
###
##
######
#
#############
#
#
###
#
###
##
#
##
###
#
#
##
#
#
##
# ##
#
#
#
##
#
#
#
##
#
#
####
#
##
#
#
#
#
#
##
#
#
#
#
#
#
#
#
####
##
#
#
#
#
#
#
###
#
#
#
#
#
#
#
#
#
#
#
#
#
#
#
#
#
#
#
##
#
##
###
#
#
# #
##
#
##
#
#
#
#
#
#
##
#
#
#
#
#
#
#####
##
#
#
#
#
#
#
#
#
#
##
#
#
#
#
####
#
#
#
##
#
#
#
#
###
#
#
#
#
#
#
# ##
#
#
#
#
#
#
#
#
#
#
#
#
#
#
#
##
#
# #
#
#
##
#
#
#
#
#
#
#
#
#
###
#
#
## #
#
#
##
#
#
#
#
#
#####
####
##
# ########
#
# ########
##
#
########
#
#
#
#
## ##
#
#####
#
#
####
# ## ####
####
##
# #
#
##
#
##
###
#
####
#
#####
#
#
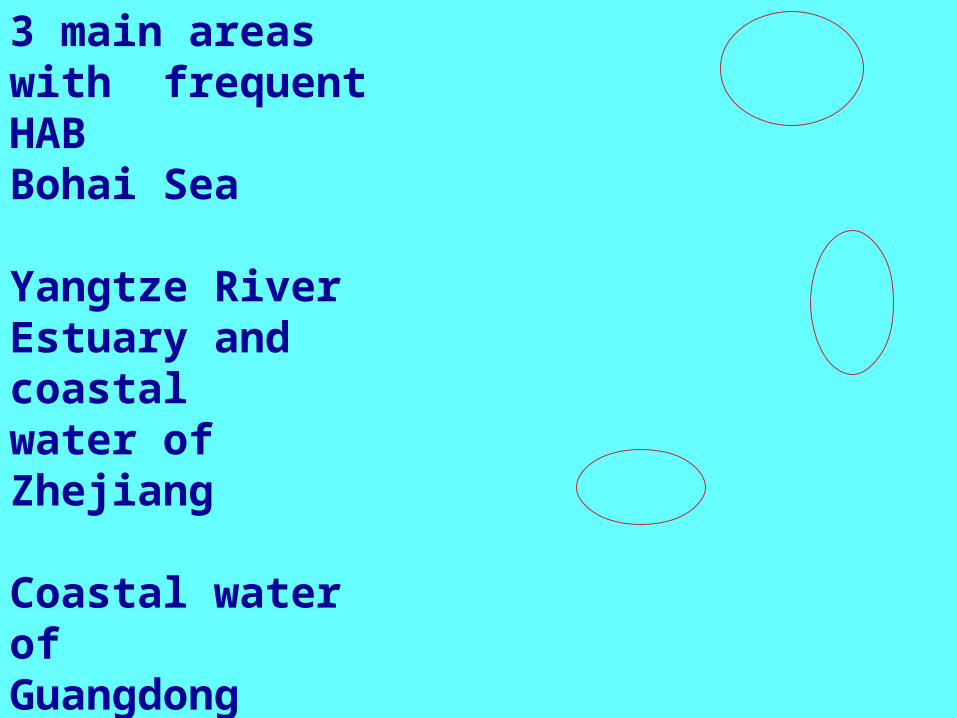
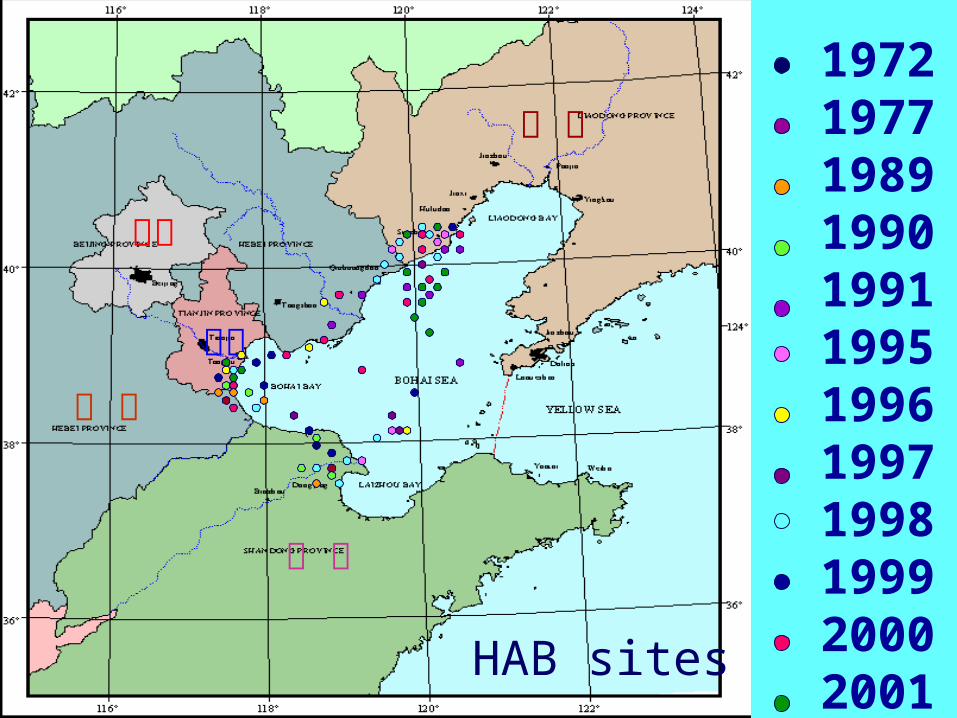
3 main areas with frequent HAB Bohai Sea
Yangtze River Estuary and coastalwater of Zhejiang
Coastal water of Guangdong
0
2
4
6
8
10
12
赤潮
次数
-0.10
-0.05
0.00
0.05
0.10
0.15
0.20
0.25
0.30
污染
物浓
度 (m
g/L
)
赤潮次数
无机氮(mg/L)
磷酸盐(mg/L)
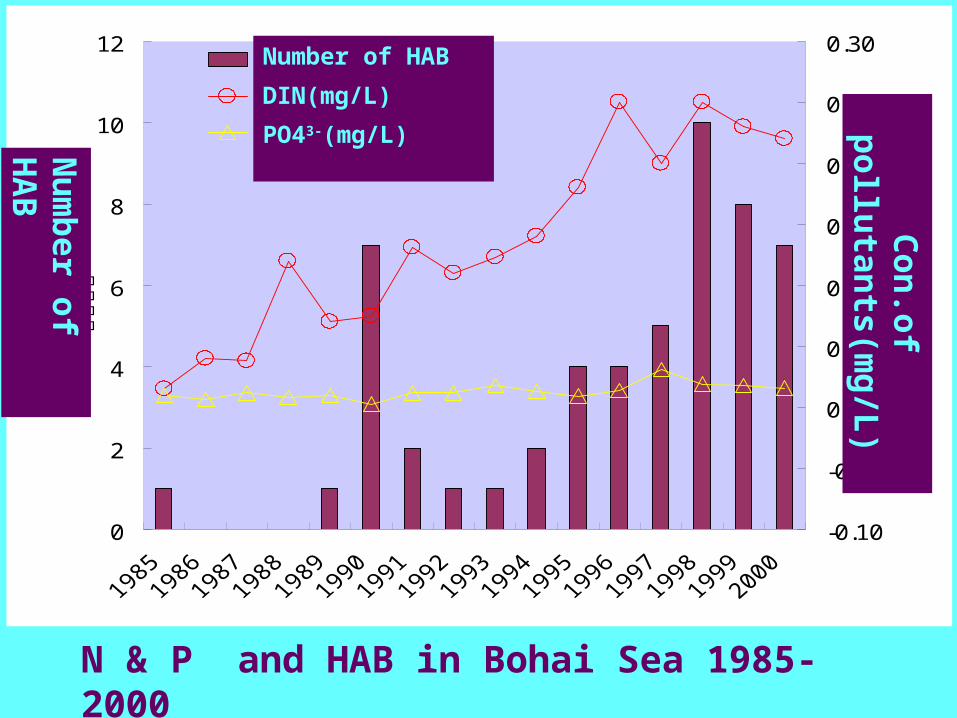
N & P and HAB in Bohai Sea 1985-2000
Number of HAB
DIN(mg/L)
PO43-(mg/L) Nu
mb
er of HA
B
Con
.of pollu
tants(m
g/L)
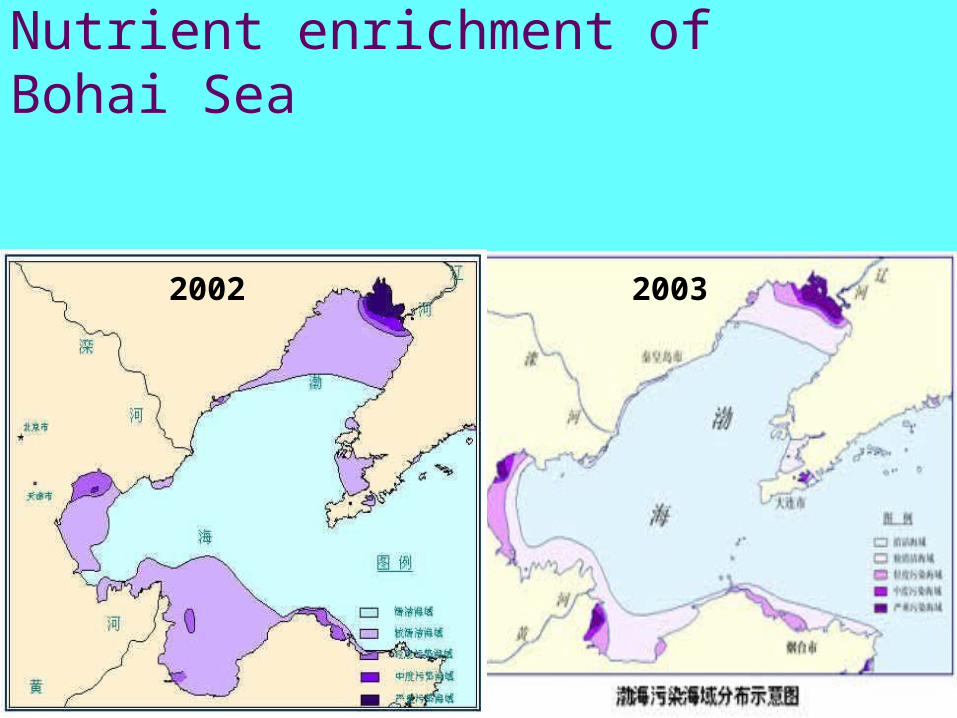
Nutrient enrichment of Bohai Sea
2002 2003
辽 宁
河 北
山 东
天津
北京
197219771989199019911995199619971998199920002001
HAB sites
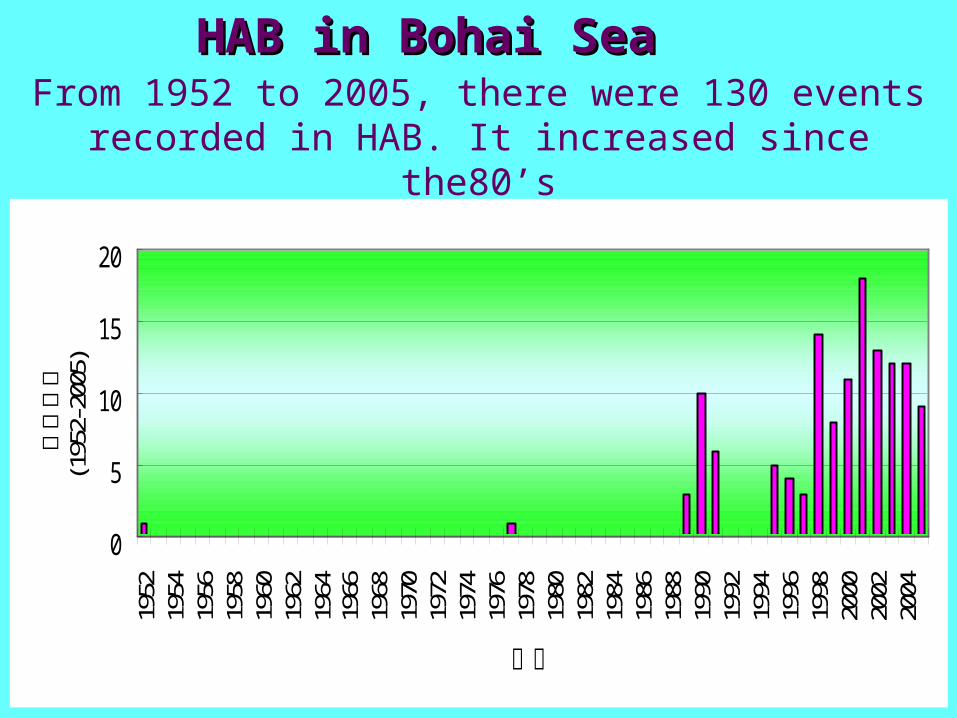
HAB in Bohai SeaHAB in Bohai Sea
0
5
10
15
20
1952
1954
1956
1958
1960
1962
1964
1966
1968
1970
1972
1974
1976
1978
1980
1982
1984
1986
1988
1990
1992
1994
1996
1998
2000
2002
2004
年份
赤潮
次数
(195
2-20
05)
From 1952 to 2005, there were 130 events recorded in HAB. It increased since the80’s
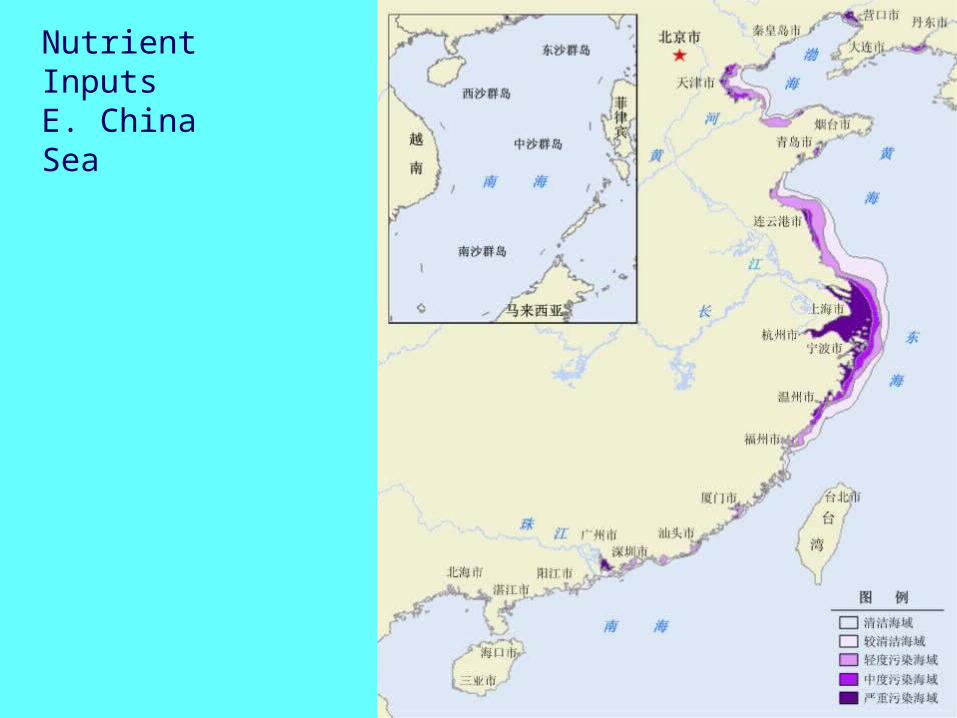
Nutrient InputsE. ChinaSea

Distribution of HABs in East China Sea
HAB Area
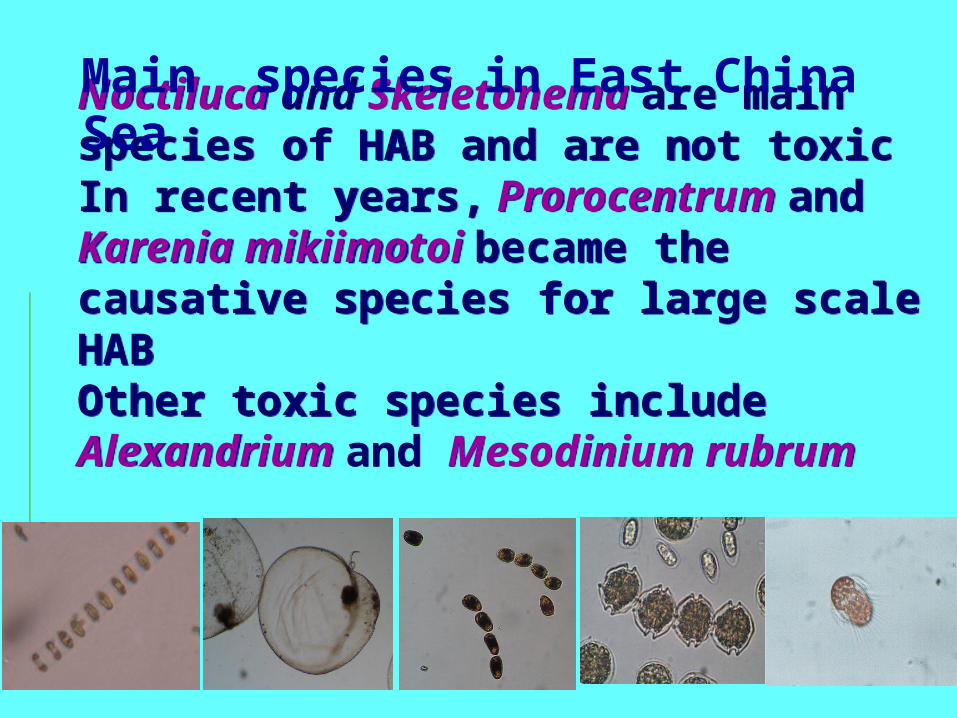
Noctiluca and Skeletonema are main species of HAB and are not toxicIn recent years, Prorocentrum and Karenia mikiimotoi became the causative species for large scale HAB Other toxic species include Alexandrium and Mesodinium rubrum
Noctiluca and Skeletonema are main species of HAB and are not toxicIn recent years, Prorocentrum and Karenia mikiimotoi became the causative species for large scale HAB Other toxic species include Alexandrium and Mesodinium rubrum
Main species in East China Sea

Aquaculture and Eutrophication
~ Nutrients and Organic Matter are elevated near fish cages
~ Dissolved Oxygen is low near fish cages
~ Filter feeding bivalves exert top down control on phytoplankton
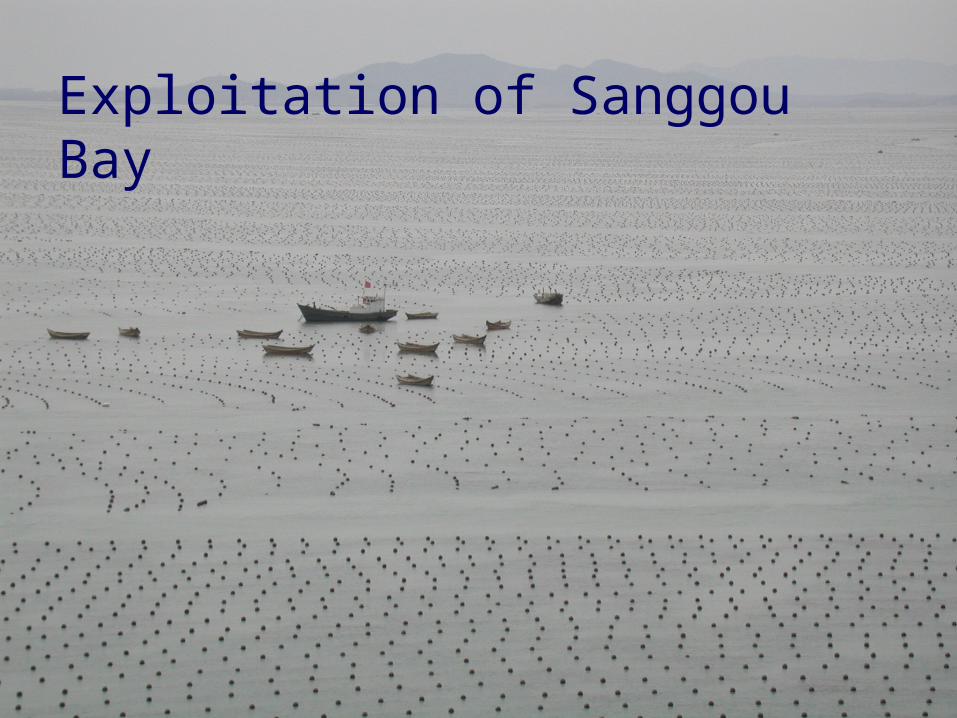
Exploitation of Sanggou Bay

Direct Economic loss
1989: 300 million RMB
(~40 million US$)
1998: 560 million RMB
(~70 million US$)
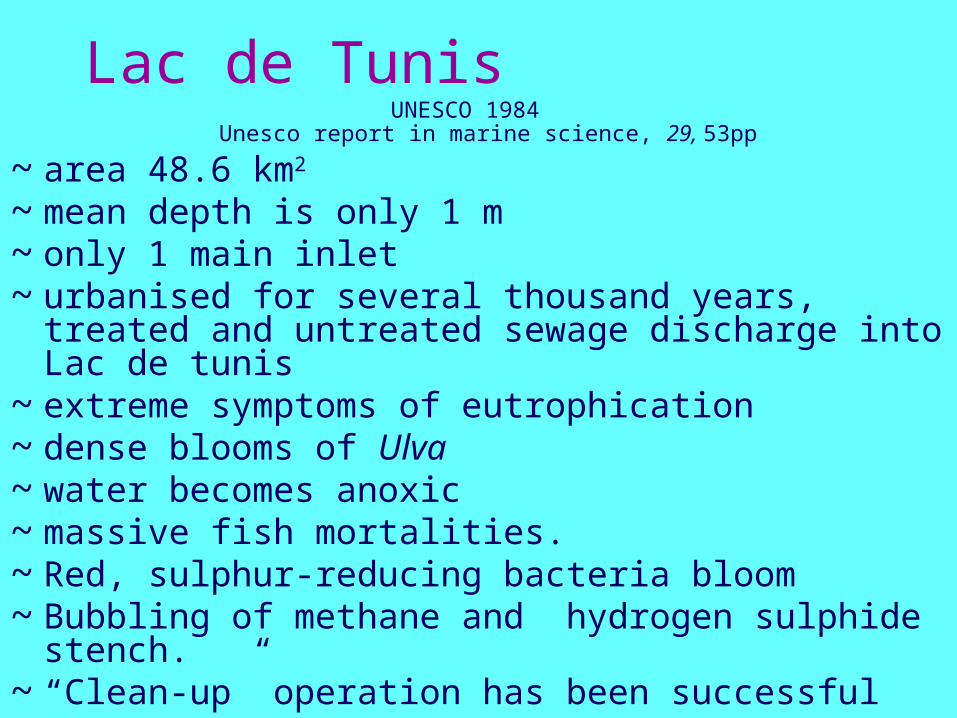
Lac de TunisUNESCO 1984
Unesco report in marine science, 29, 53pp
~ area 48.6 km2 ~ mean depth is only 1 m ~ only 1 main inlet~ urbanised for several thousand years, treated
and untreated sewage discharge into Lac de tunis
~ extreme symptoms of eutrophication~ dense blooms of Ulva ~ water becomes anoxic ~ massive fish mortalities. ~ Red, sulphur-reducing bacteria bloom~ Bubbling of methane and hydrogen sulphide
stench. ~ “Clean-up” operation has been successful
The Black Sea
See text below slides

Black Sea catchment and coastBlack Sea catchment and coast
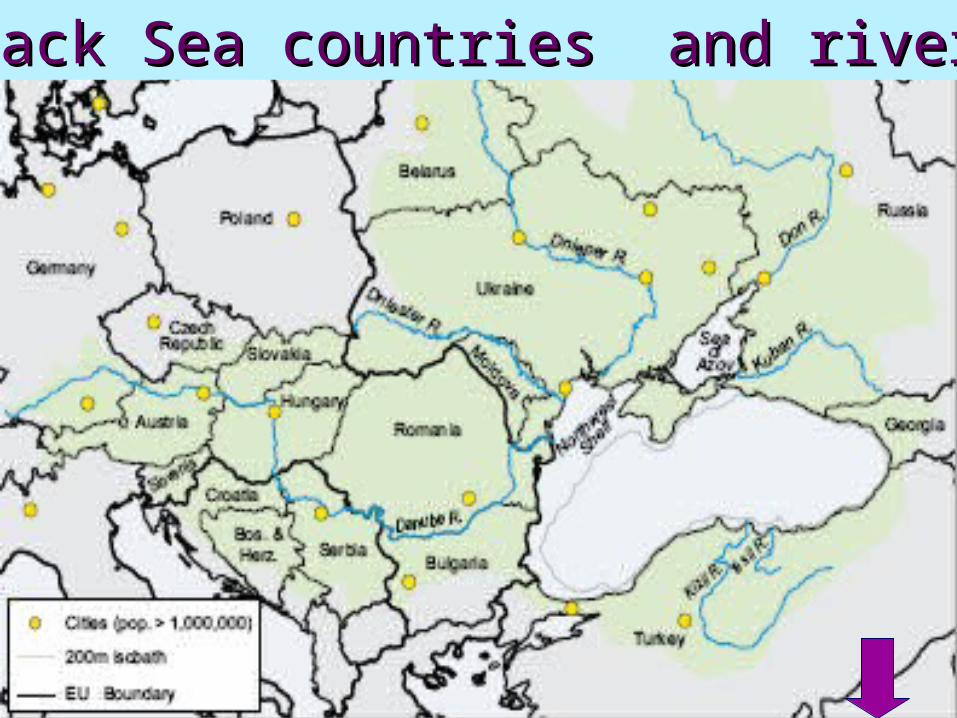
Black Sea countries and riversBlack Sea countries and rivers
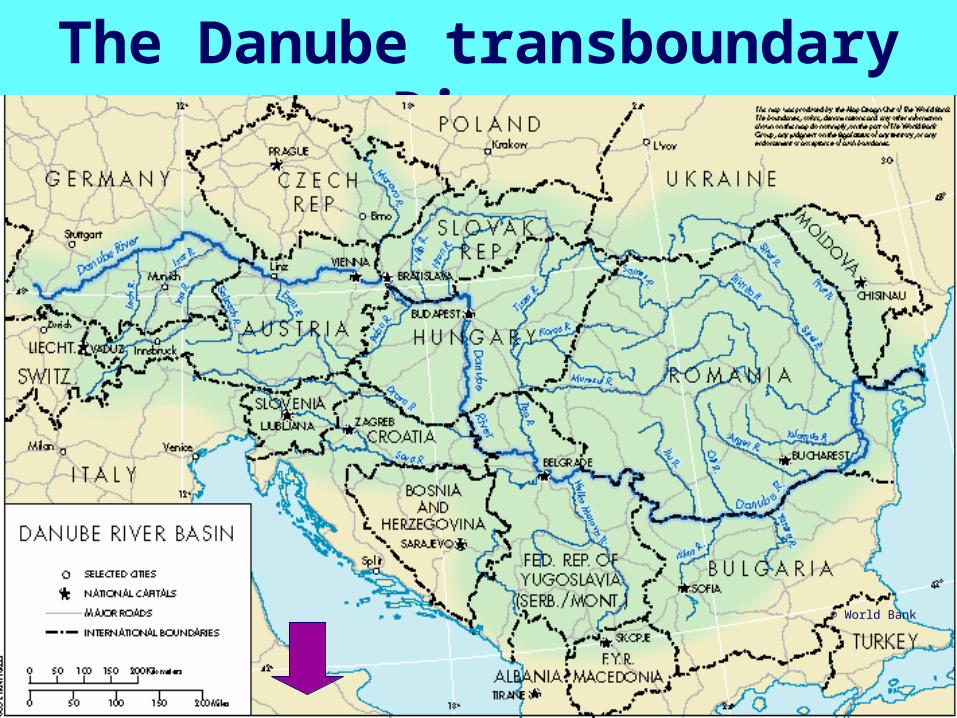
The Danube transboundary River
© World Bank
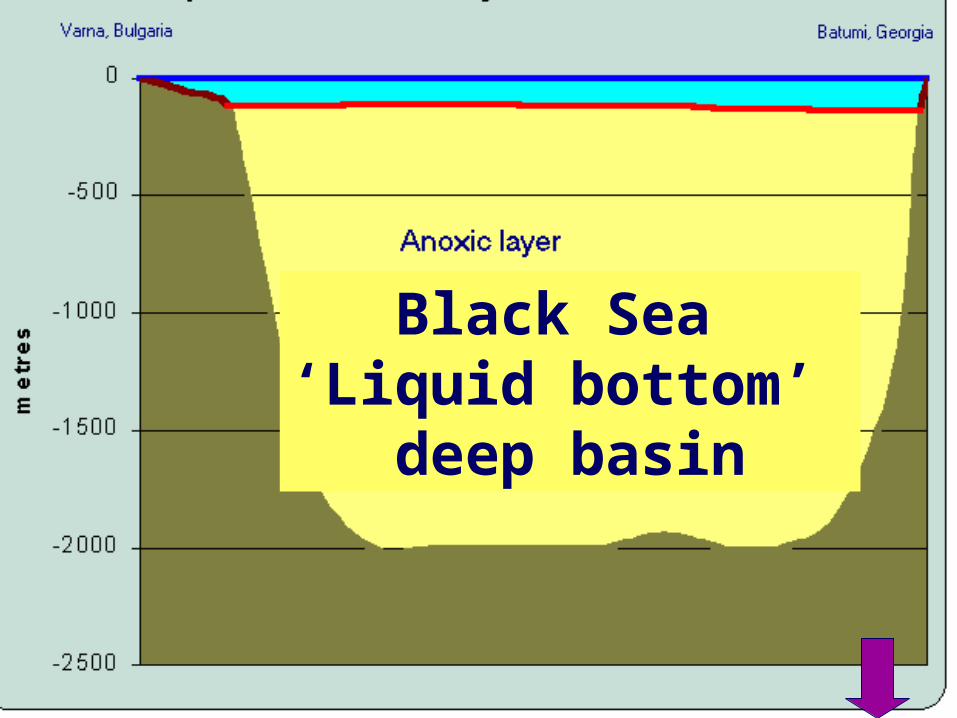
Black Sea ‘Liquid bottom’
deep basin
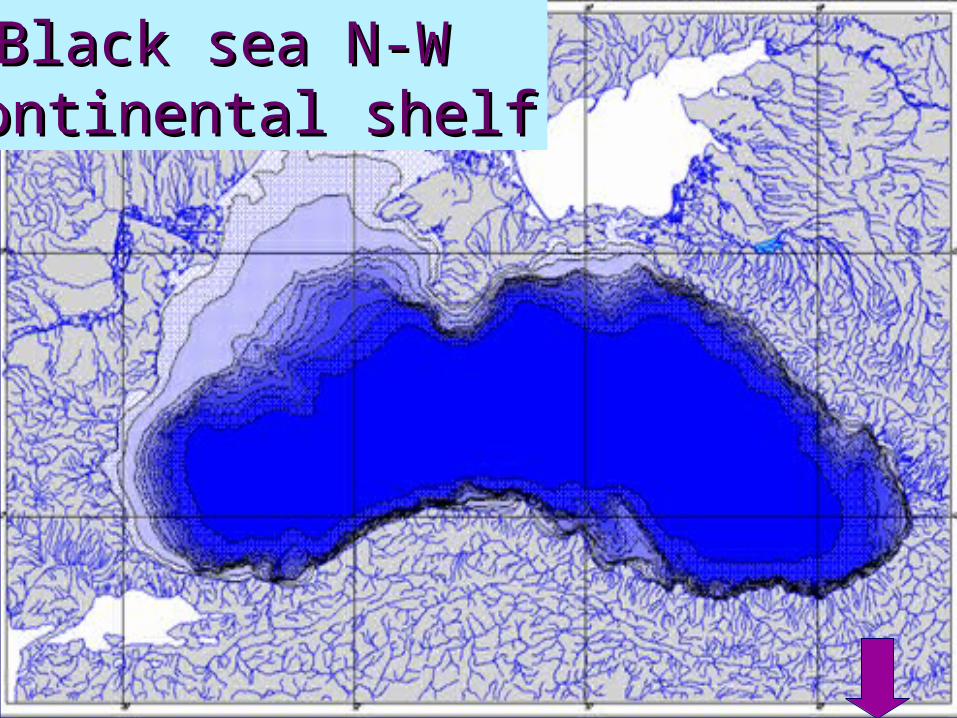
Black sea N-W Black sea N-W continental shelfcontinental shelf
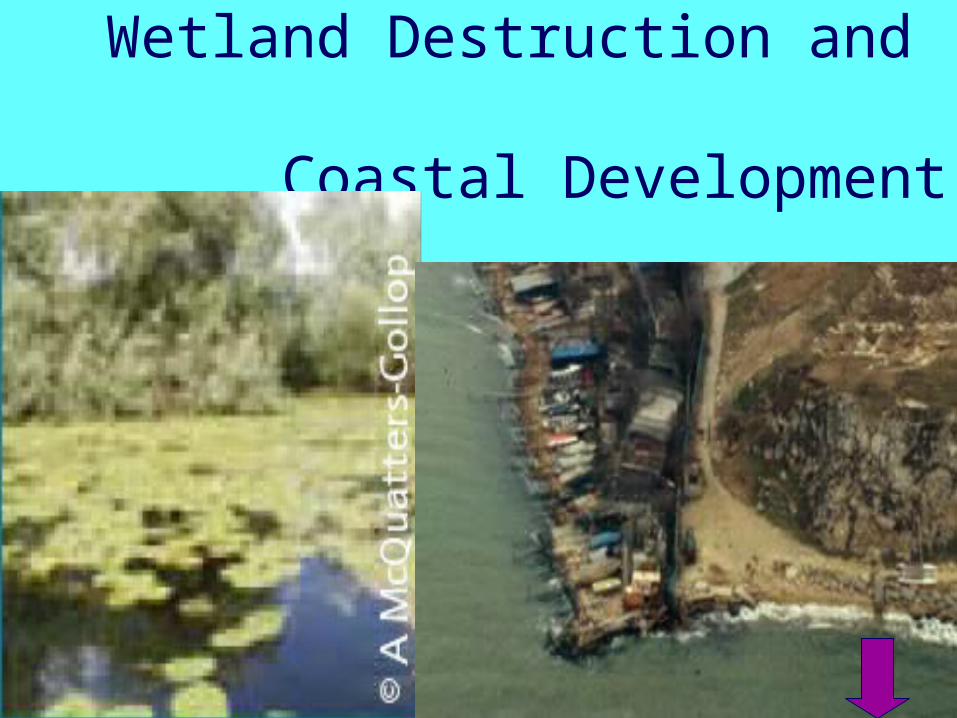
Wetland Destruction and Coastal
Development
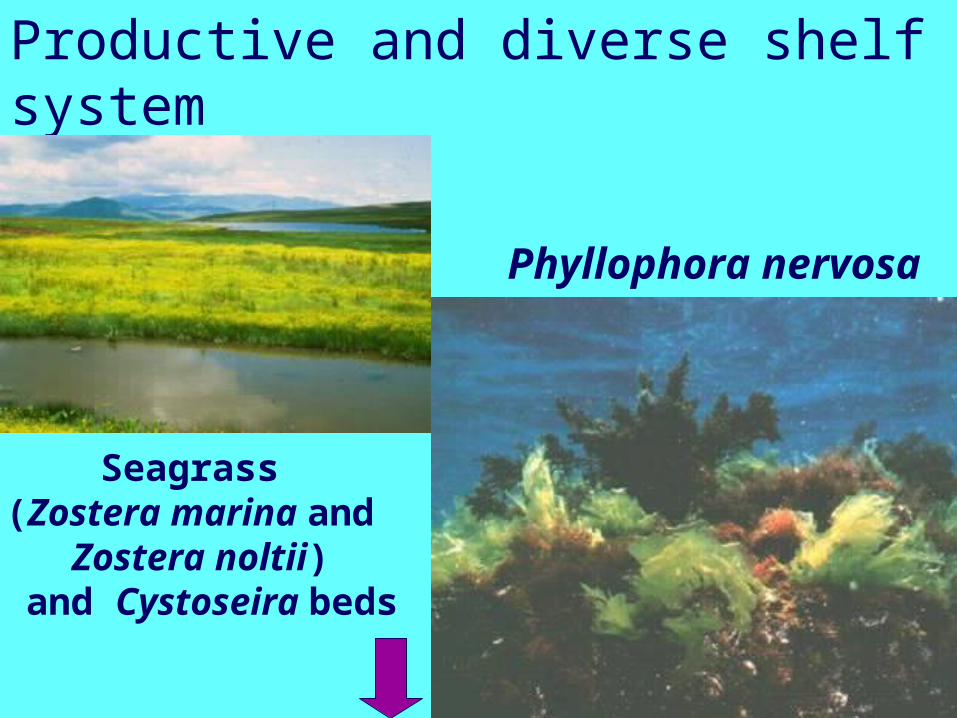
Productive and diverse shelf system
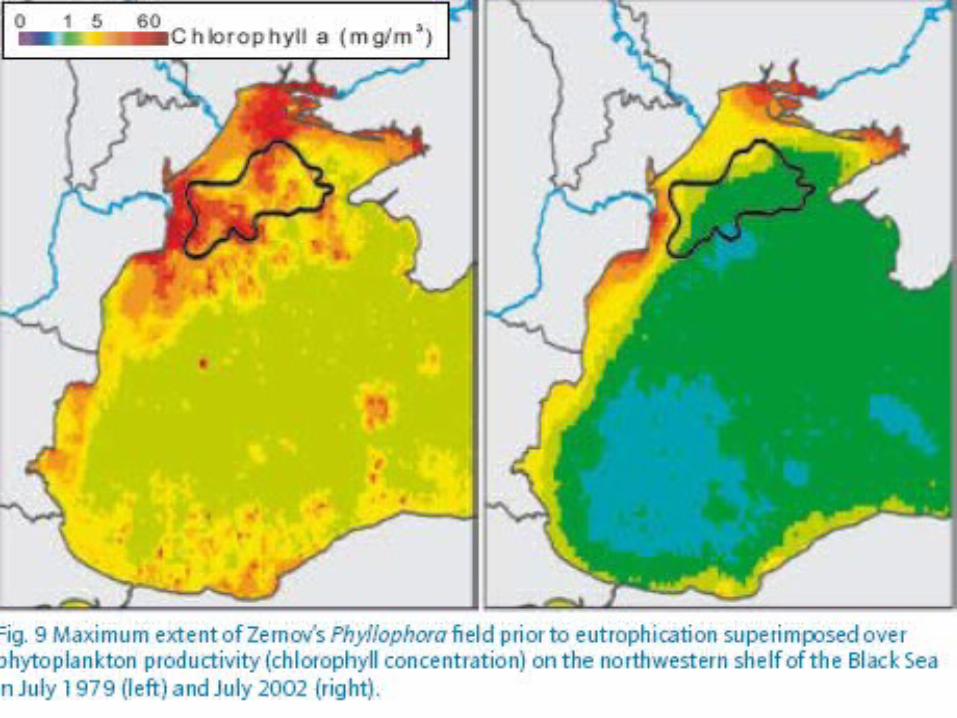
Phyllophora nervosa
Seagrass (Zostera marina and
Zostera noltii) and Cystoseira beds
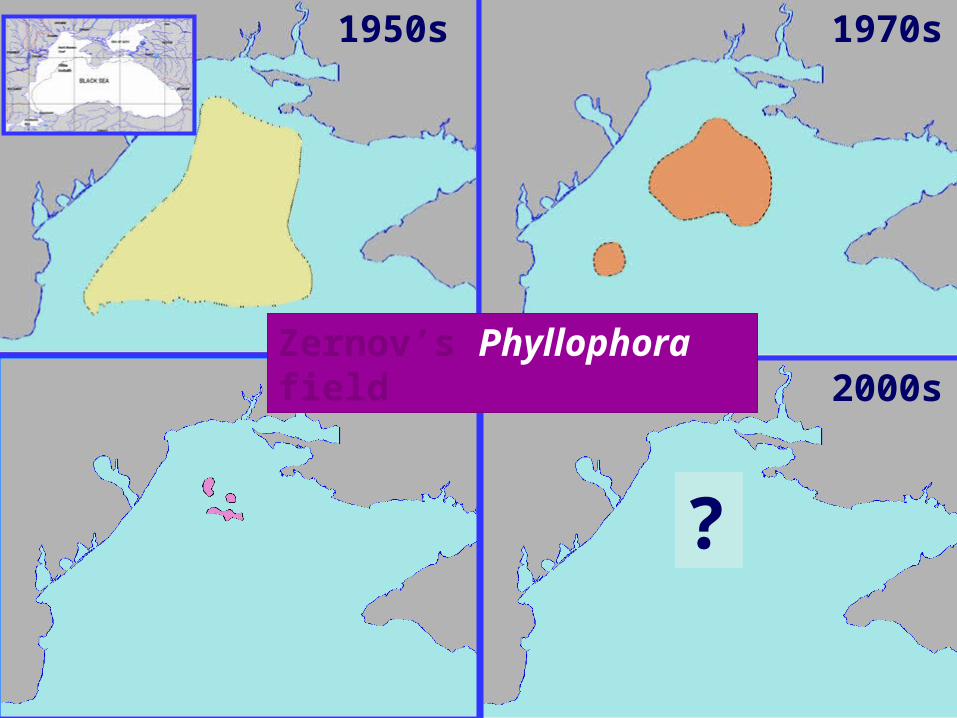
?
1950s 1970s
1980s 2000sZernov’s Phyllophora field
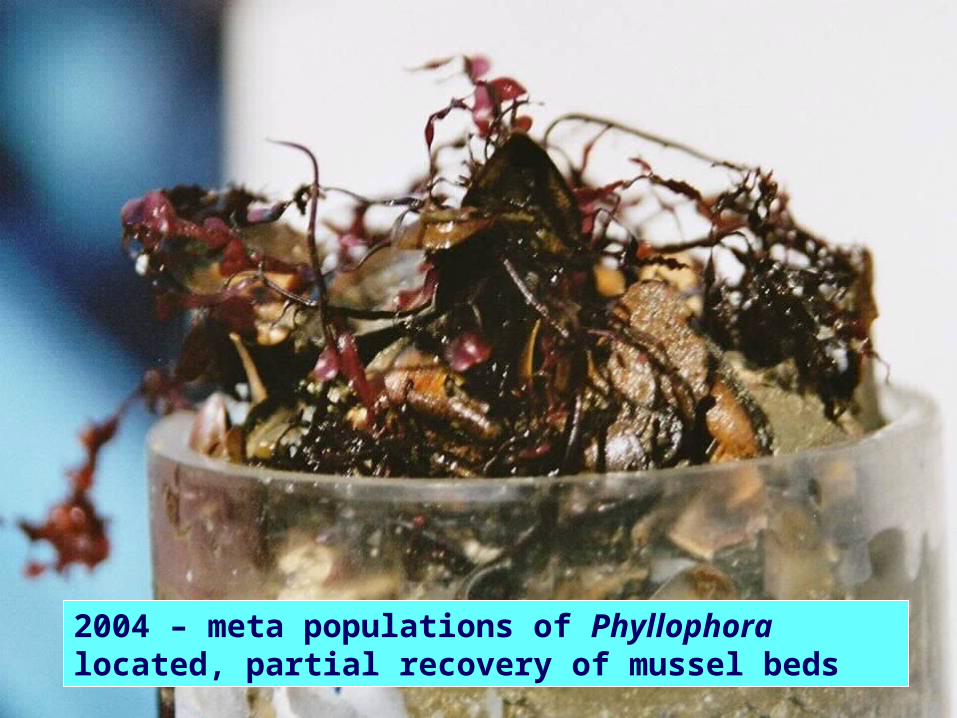
2004 – meta populations of Phyllophora located, partial recovery of mussel beds
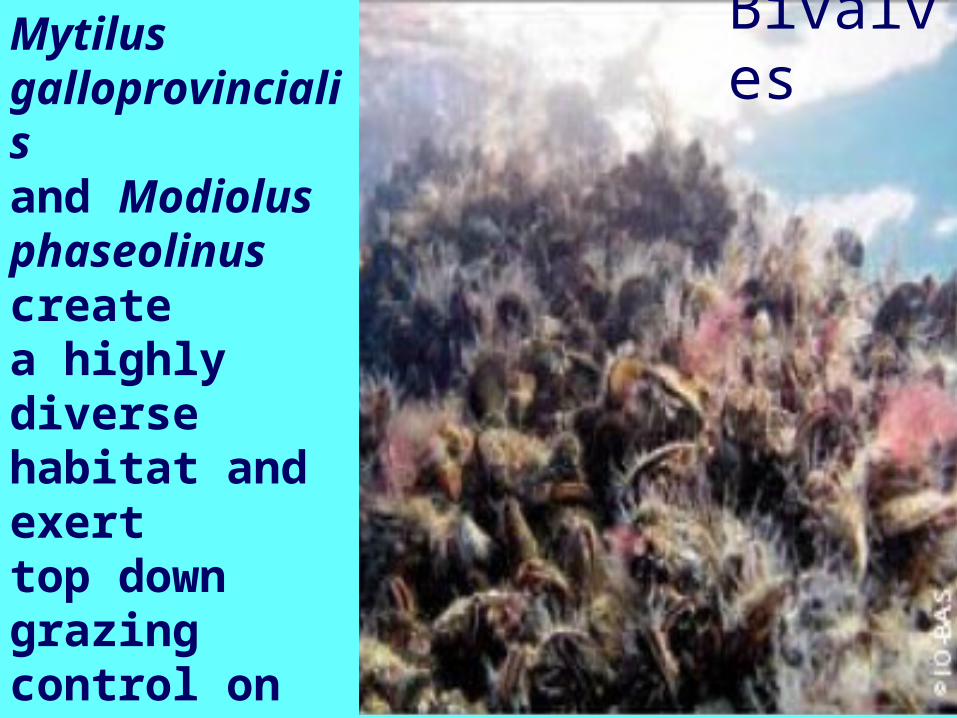
Bivalves
Mytilus galloprovincialis and Modiolus phaseolinus createa highly diverse habitat and exerttop down grazing control on phytoplankton
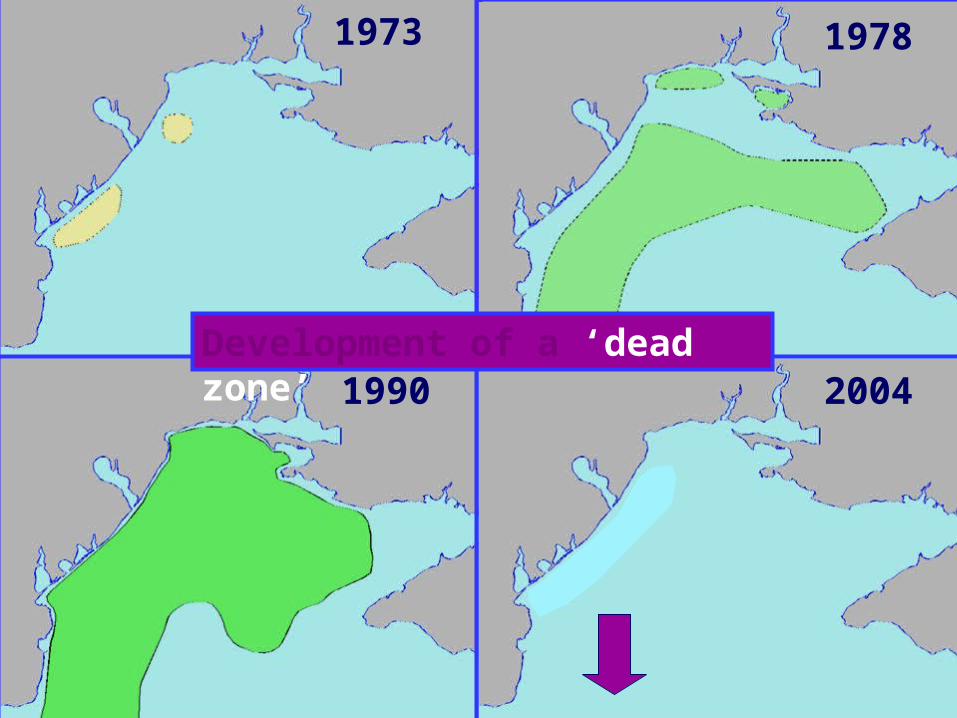
1973 1978
1990 2004Development of a ‘dead zone’
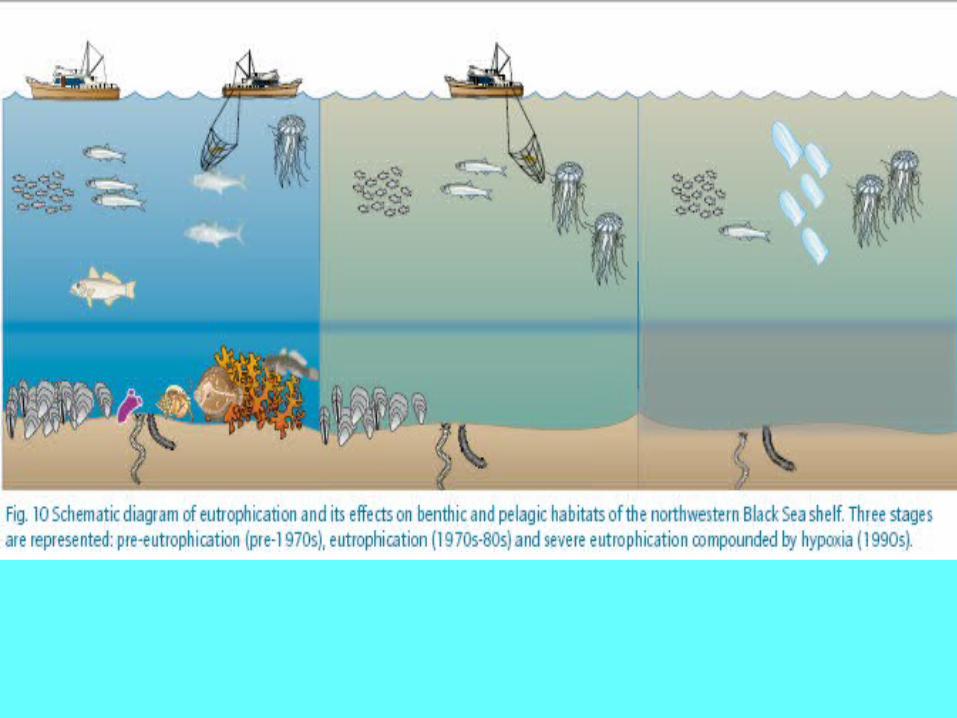
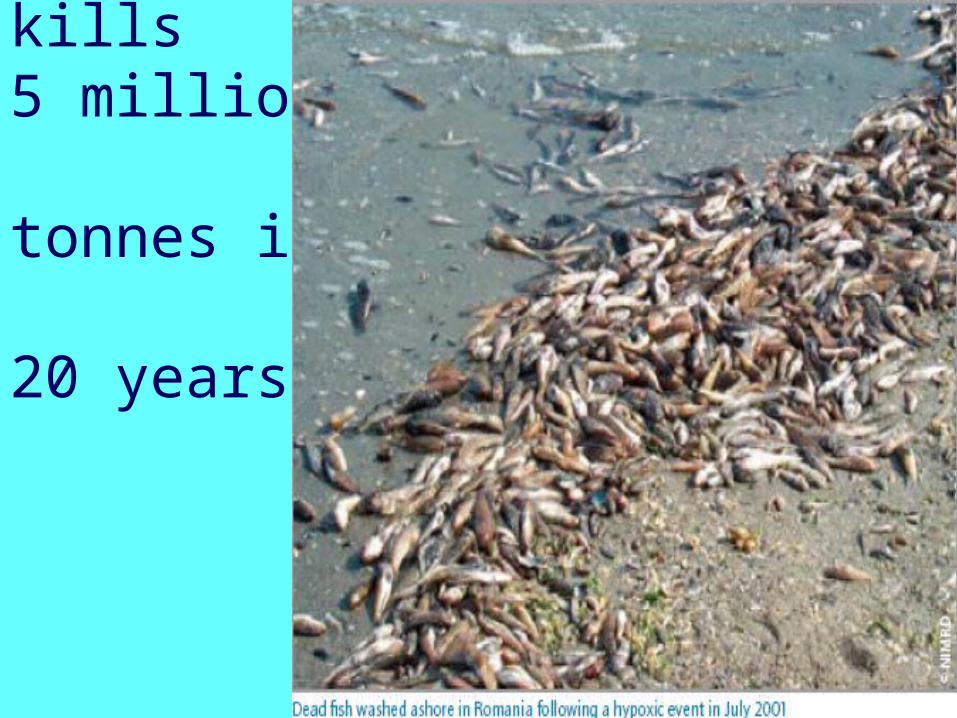
Fish kills 5 million tonnes in 20 years
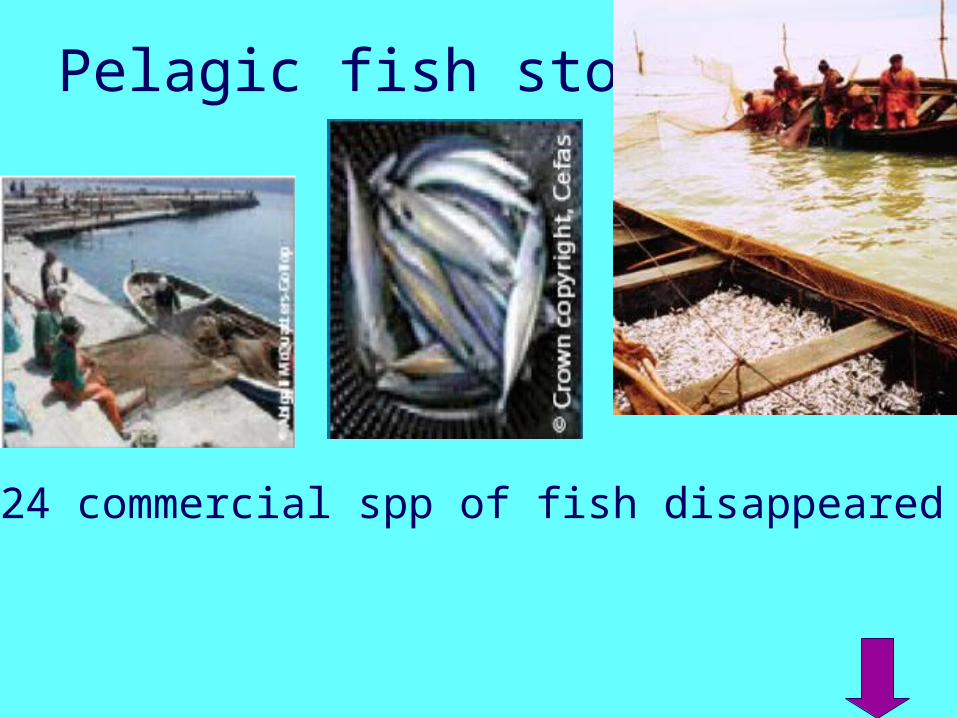
Pelagic fish stocks
24 commercial spp of fish disappeared
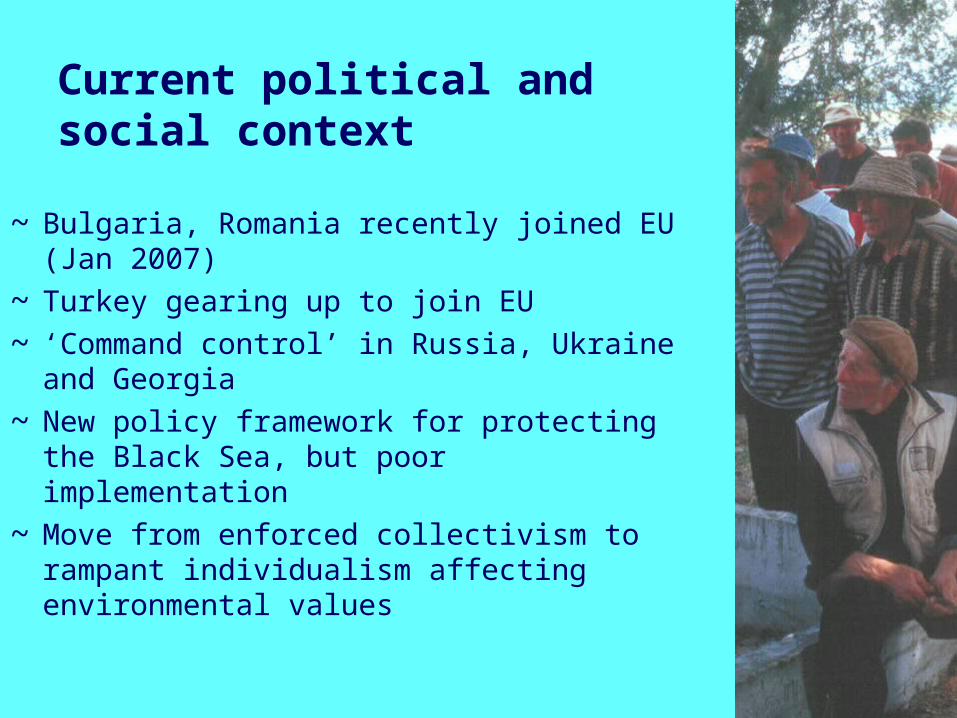
Current political and social context
~ Bulgaria, Romania recently joined EU (Jan 2007)
~ Turkey gearing up to join EU~ ‘Command control’ in Russia, Ukraine
and Georgia ~ New policy framework for protecting the
Black Sea, but poor implementation~ Move from enforced collectivism to
rampant individualism affecting environmental values

Total N & P fertiliser application, Danube Basin
0
500,000
1,000,000
1,500,000
2,000,000
2,500,000
3,000,000
3,500,000
1961
1963
1965
1967
1969
1971
1973
1975
1977
1979
1981
1983
1985
1987
1989
1991
1993
1995
1997
1999
2001
Me
tric
to
ns
Total-P
Total-N
A crisis in agriculture … an opportunity for the Black Sea
The green revolution
End of centrally planned economy
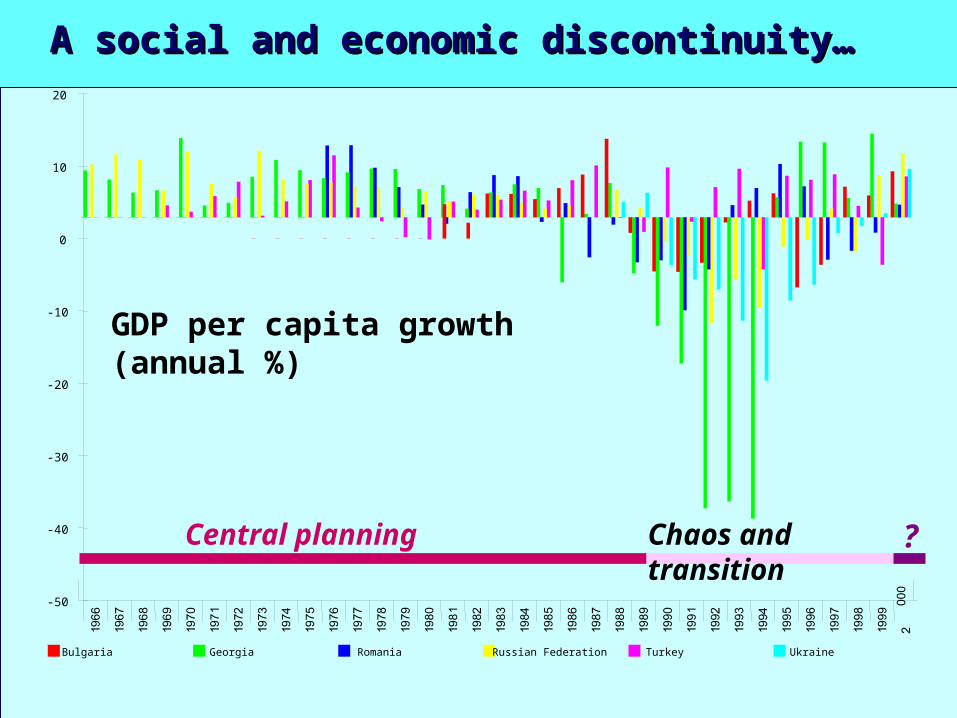
-50
-40
-30
-20
-10
0
10
20
Bulgaria Georgia Romania Russian Federation Turkey Ukraine
Central planning Chaos and transition ?
GDP per capita growth (annual %)
A social and economic discontinuity…A social and economic discontinuity…
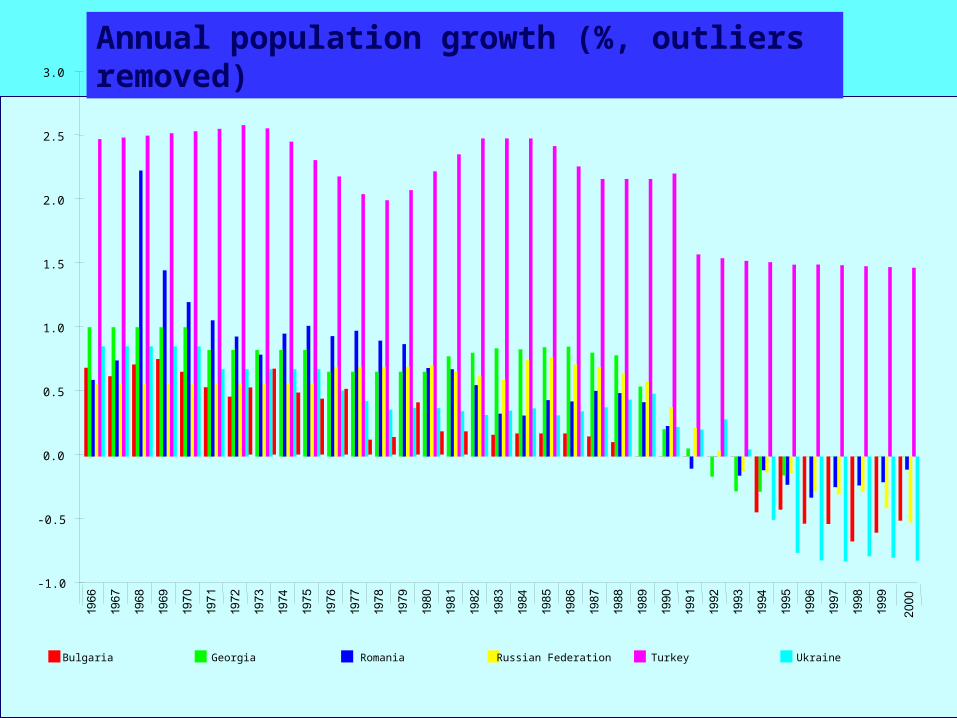
-1.0
-0.5
0.0
0.5
1.0
1.5
2.0
2.5
3.0
Bulgaria Georgia Romania Russian Federation Turkey Ukraine
Population growth (annual %)Annual population growth (%, outliers removed)