eutelsat communications investor presentation … · investor presentation march 2018. agenda 2 3 5...
TRANSCRIPT
EUTELSAT COMMUNICATIONSInvestor PresentationMarch 2018
Agenda
2
3
5
1 FSS Industry
Eutelsat in a snapshot
H1 2017-18 performance
Appendix
4 Outlook
2

The satellite value chain
Satellitemanufacturers
Satellitelaunchers
Satelliteoperators
TVbroadcasters,
Telecoms,Governments
Consumersand businesses
3
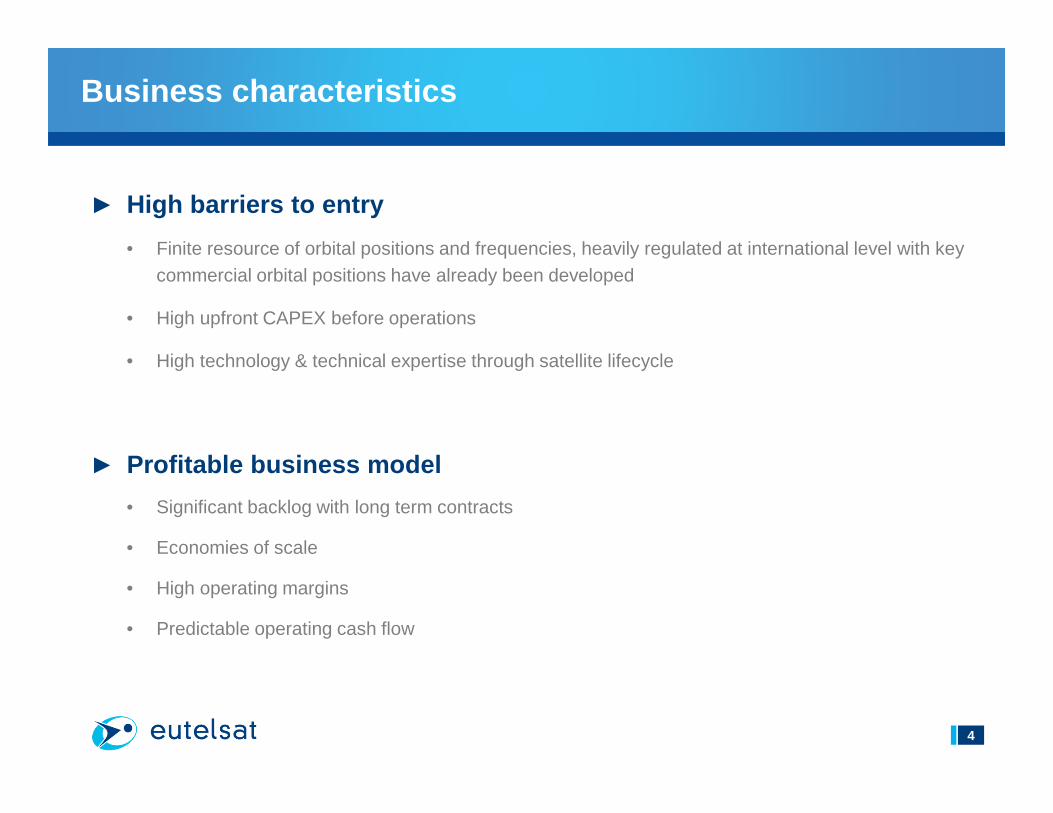
Business characteristics
► High barriers to entry
• Finite resource of orbital positions and frequencies, heavily regulated at international level with key commercial orbital positions have already been developed
• High upfront CAPEX before operations
• High technology & technical expertise through satellite lifecycle
► Profitable business model
• Significant backlog with long term contracts
• Economies of scale
• High operating margins
• Predictable operating cash flow
4
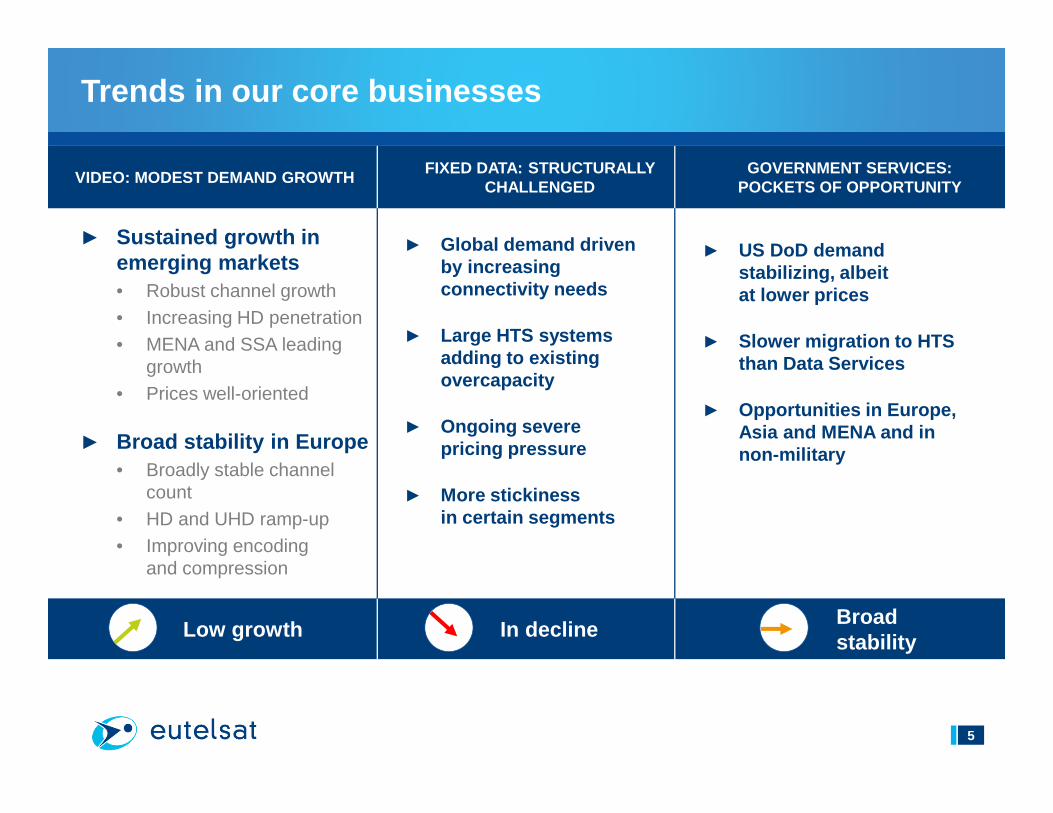
Trends in our core businesses
► Sustained growth in emerging markets• Robust channel growth• Increasing HD penetration• MENA and SSA leading
growth• Prices well-oriented
► Broad stability in Europe• Broadly stable channel
count• HD and UHD ramp-up • Improving encoding
and compression
VIDEO: MODEST DEMAND GROWTH FIXED DATA: STRUCTURALLY
CHALLENGED
► Global demand driven by increasing connectivity needs
► Large HTS systems adding to existing overcapacity
► Ongoing severe pricing pressure
► More stickiness in certain segments
► US DoD demand stabilizing, albeit at lower prices
► Slower migration to HTS than Data Services
► Opportunities in Europe, Asia and MENA and in non-military
GOVERNMENT SERVICES: POCKETS OF OPPORTUNITY
Low growth In declineBroad stability
5
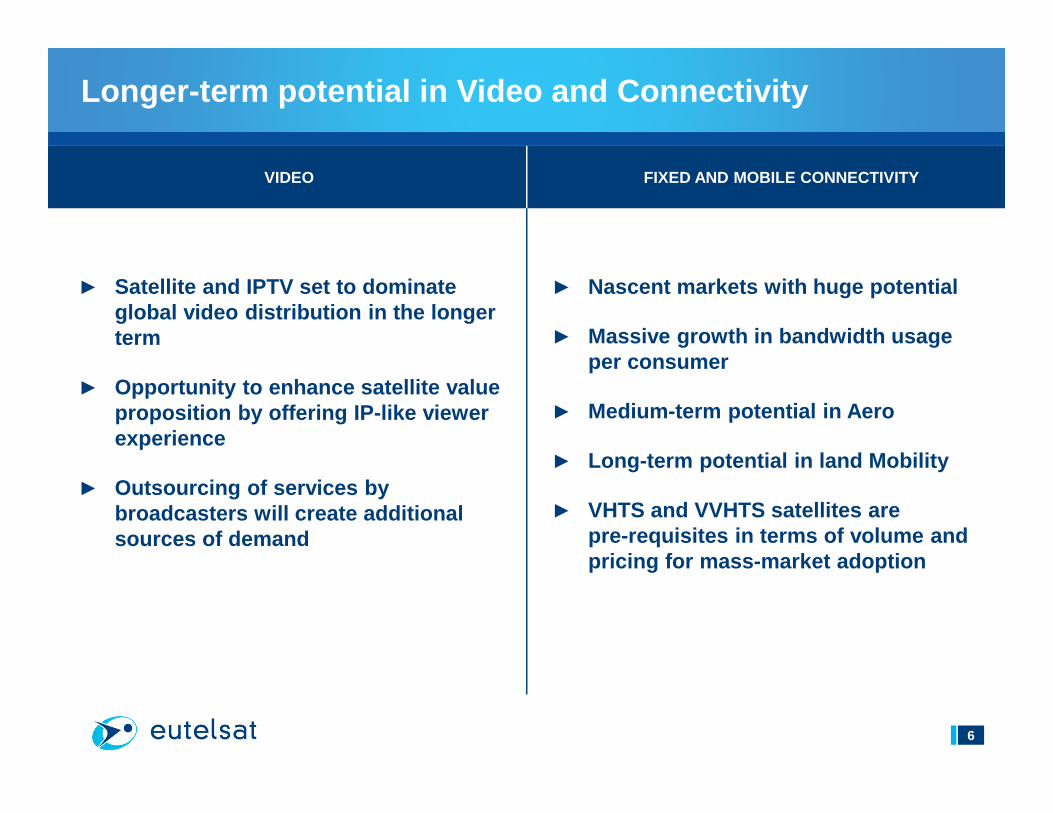
Longer-term potential in Video and Connectivity
6
► Satellite and IPTV set to dominate global video distribution in the longer term
► Opportunity to enhance satellite value proposition by offering IP-like viewerexperience
► Outsourcing of services by broadcasters will create additionalsources of demand
VIDEO FIXED AND MOBILE CONNECTIVITY
► Nascent markets with huge potential
► Massive growth in bandwidth usage per consumer
► Medium-term potential in Aero
► Long-term potential in land Mobility
► VHTS and VVHTS satellites are pre-requisites in terms of volume and pricing for mass-market adoption

Video drivers: Channel growth and image quality
Source: Euroconsult 2017
CHANNEL GROWTH INCREASED IMAGE QUALITY
2016 2017 2018 2019 2020 2021 2022 2023 2024 2025 2026
~20,500
CAGR: +1.5%
Predominantly driven by emerging Video markets
TV Channels in EMEA and LATAM
~24,000
38%
29%
19%
24%
16%
4%
11%
19%
81%
74%
50%
50%
38%
19%
36%
43%
NorthAmerica
WesternEurope
CentralEurope
LATAM
MENA
SSA
Russia andCentral Asia
ETL footprint
2026 2016
HD penetration rate by major region
Everywhere, including mature Video markets
7
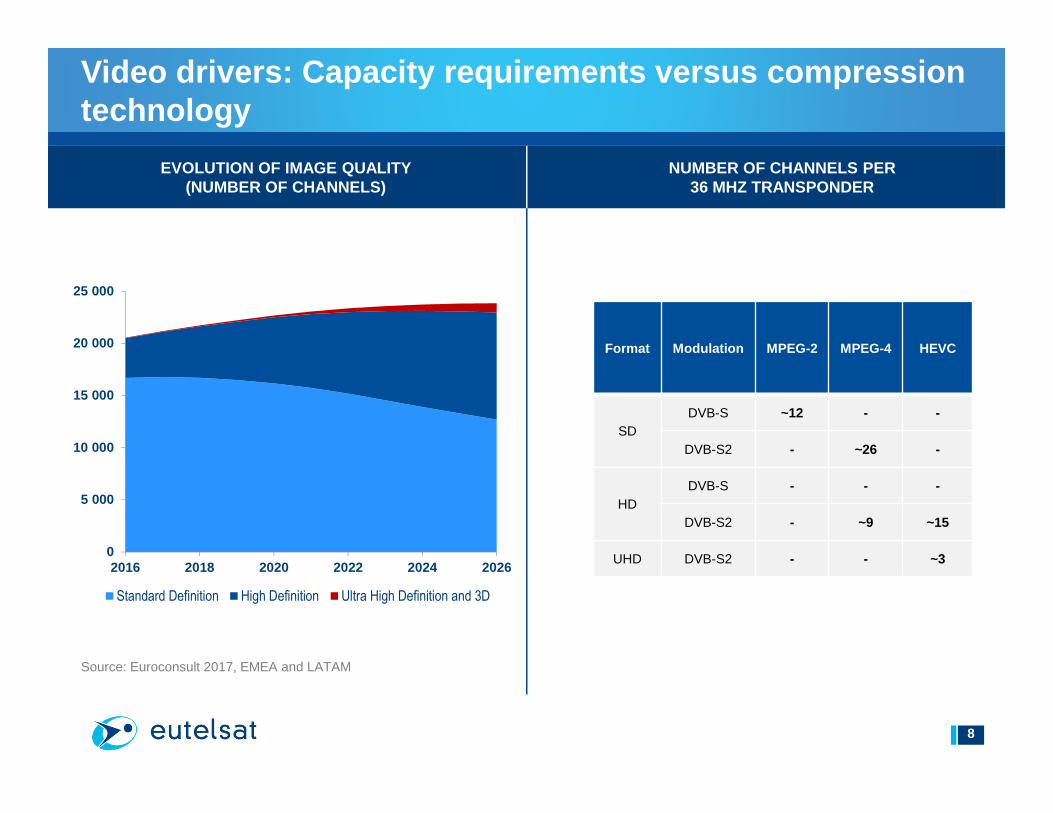
Video drivers: Capacity requirements versus compres sion technology
8
EVOLUTION OF IMAGE QUALITY (NUMBER OF CHANNELS)
NUMBER OF CHANNELS PER 36 MHZ TRANSPONDER
Source: Euroconsult 2017, EMEA and LATAM
Format Modulation MPEG-2 MPEG-4 HEVC
SDDVB-S ~12 - -
DVB-S2 - ~26 -
HDDVB-S - - -
DVB-S2 - ~9 ~15
UHD DVB-S2 - - ~30
5 000
10 000
15 000
20 000
25 000
2016 2018 2020 2022 2024 2026
Standard Definition High Definition Ultra High Definition and 3D

Video: Satellite’s competitive advantage over OTT / IP
Source: Eutelsat analysis, European Commission - Broadband Coverage in Europe 2016, CISCO VNI 2017
► Satellite a fraction of TV platforms operating costs
► CDN costs rise in line with audience growth
► For a large Pay-TV platform, OTT distribution would be much more expensive than satellite
COST-EFFICIENCY UNIVERSAL REACH
► High cost of fibre roll-out
► Terrestrial networks cannot reach entire population
• Lower image quality
• Or even no service
SERVICE QUALITY
BROADBAND COVERAGE
► Higher quality of image leadingto increased bandwidth usage
► Congestion of terrestrial networks
• Video will represent >80% of IP traffic in 2021
72%64%
75%
19% 17%24%
Italy Poland EU Average
> 30 Mbps of which FTTP
3
7
20
1 SD channel in MPEG 2
1 HD channel in MPEG 4
1 UHD channel in HEVC
BANDWIDTH REQUIREMENT (Mbps)
Cost
Satellite
OTT
# viewers
Satellite more cost efficient >50k viewers in Western Europe
Satellite provides full coverage of a market
Satellite and hybrid solutions give unimpaired viewing experience
9
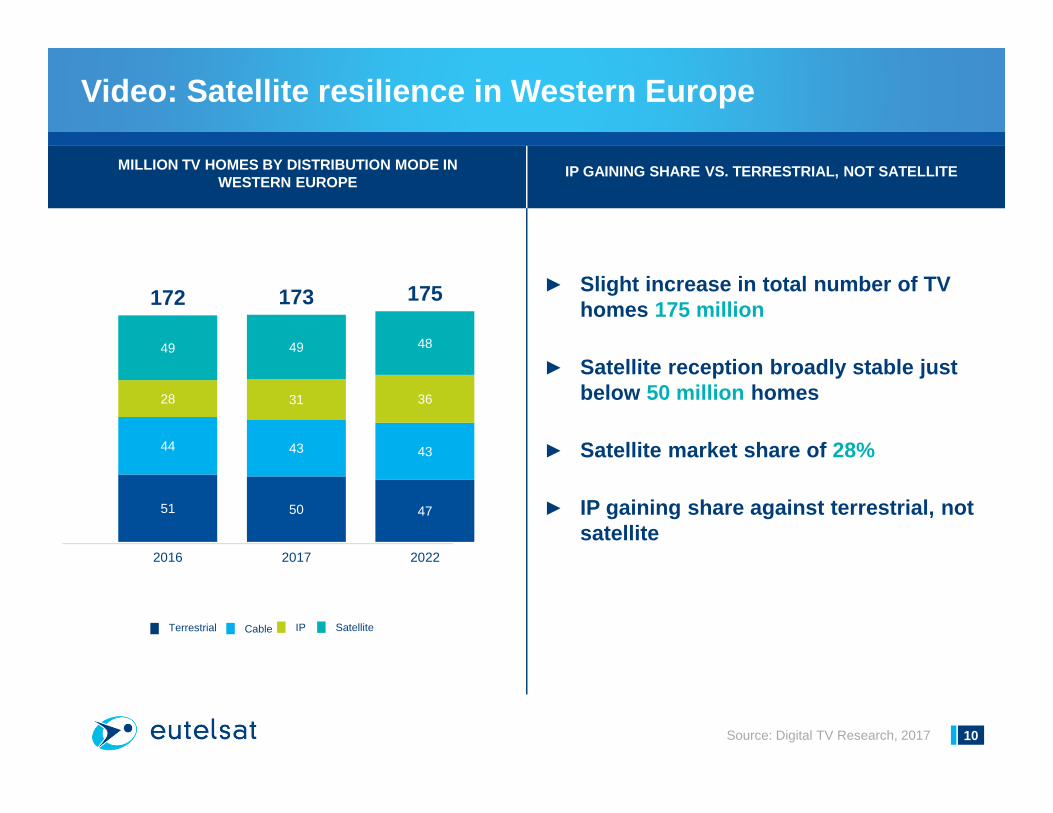
Video: Satellite resilience in Western Europe
► Slight increase in total number of TV homes 175 million
► Satellite reception broadly stable just below 50 million homes
► Satellite market share of 28%
► IP gaining share against terrestrial, not satellite
MILLION TV HOMES BY DISTRIBUTION MODE IN WESTERN EUROPE
51 50 47
44 43 43
28 31 36
49 49 48
172 173 175
2016 2017 2022
Source: Digital TV Research, 2017
Terrestrial Cable SatelliteIP
IP GAINING SHARE VS. TERRESTRIAL, NOT SATELLITE
10

Video: Satellite gaining market share worldwide
► Total number of TV homes to increase by 95 million to 1.7 bn by 2022
► Satellite reception to grow by 50 million homes to 475 million by 2022
► Satellite market share to rise from26% to 28%
MILLION TV HOMES BY DISTRIBUTION MODE - GLOBAL
Source: Digital TV Research, 2017
Terrestrial Cable SatelliteIP
456 448 439
566 555 560
171 195 247
411 426475
1604 1624 1720
2016 2017 2022
11

Agenda
2
3
5
1 FSS Industry
Eutelsat in a snapshot
H1 2017-18 performance
Appendix
4 Outlook
2
12
64%12%
12%
7%5%
Video
Fixed Data
Government Services
Fixed Broadband
Mobile Connectivity
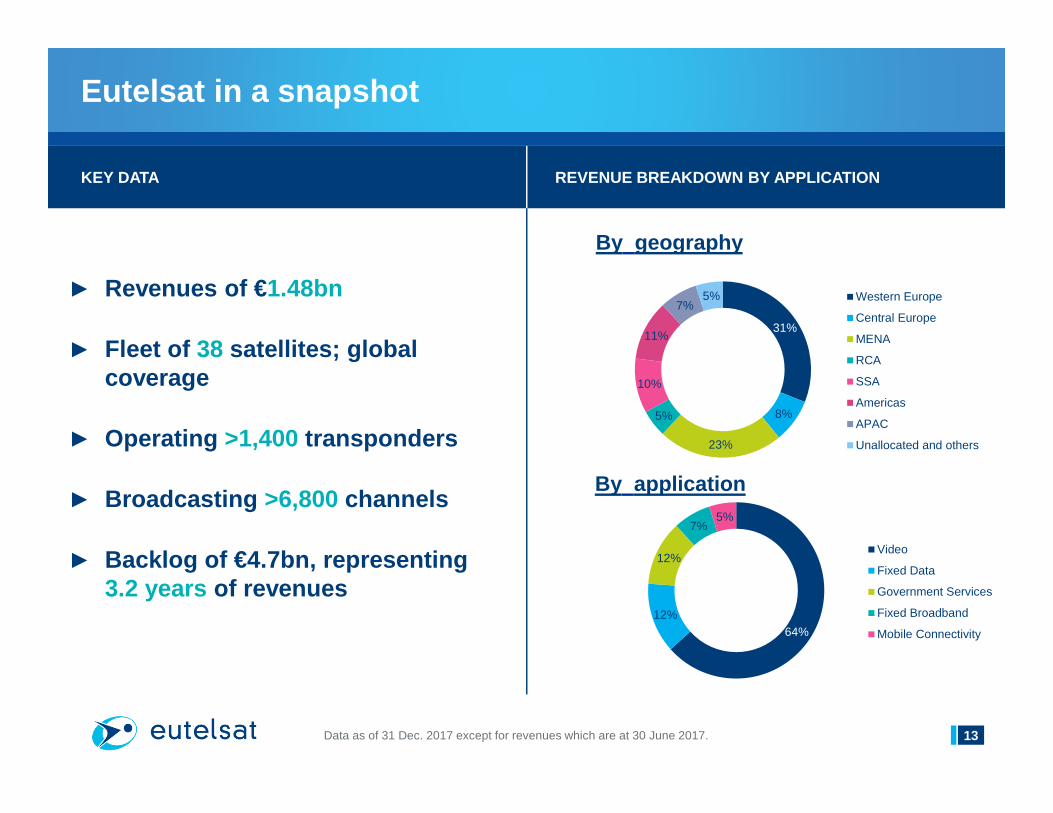
Eutelsat in a snapshot
Data as of 31 Dec. 2017 except for revenues which are at 30 June 2017.
► Revenues of € 1.48bn
► Fleet of 38 satellites; global coverage
► Operating >1,400 transponders
► Broadcasting >6,800 channels
► Backlog of €4.7bn, representing3.2 years of revenues
KEY DATA REVENUE BREAKDOWN BY APPLICATION
31%
8%
23%
5%
10%
11%
7%5% Western Europe
Central Europe
MENA
RCA
SSA
Americas
APAC
Unallocated and others
By geography
By application
13

Breakdown of revenues by Application
Video 66%
Fixed Data 11%
GovernmentServices 12%
FixedBroadband 6%
Mobile Connectivity 5%
CO
RE
BU
SIN
ES
SE
SC
ON
NE
CT
IVIT
Y
Direct-to-Home (DTH)Cable headendsProfessional Video
Mobile backhaulCorporate networks
MilitarySecurity
Internet access for households and corporates
In-flight ConnectivityMaritime Connectivity
As of 31 December 2017. % of revenues excluding Other revenues 14
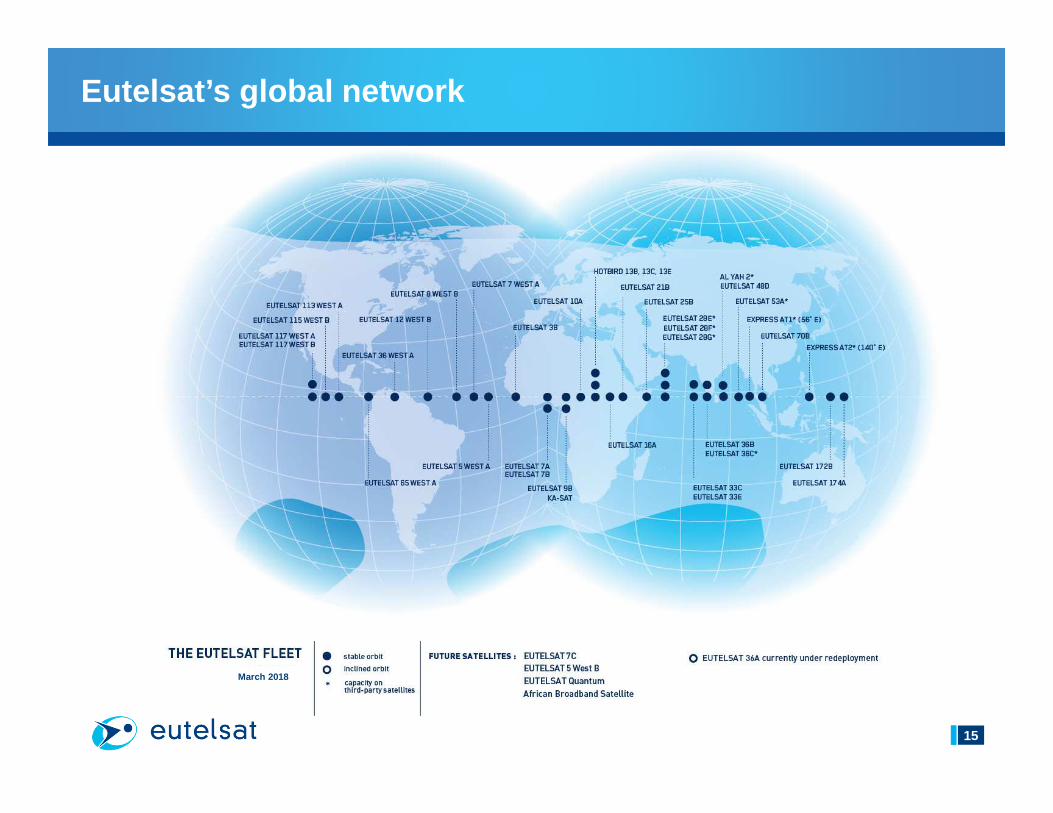
Eutelsat’s global network
15
March 2018

Financial structure
► Net Debt/EBITDA ratio reduced to 3.3x
• versus 3.4x at 31 Dec. 2016
► Average cost of debt after hedging reduced to 2.9%
• versus 3.1% in H1 2016-17
NET DEBT / EBITDA RATIO 1
3.4x 3.3x
31 Dec. 2016 31 Dec. 2017
1Based on net debt at the end of the period and last twelve months’ EBTIDA
16
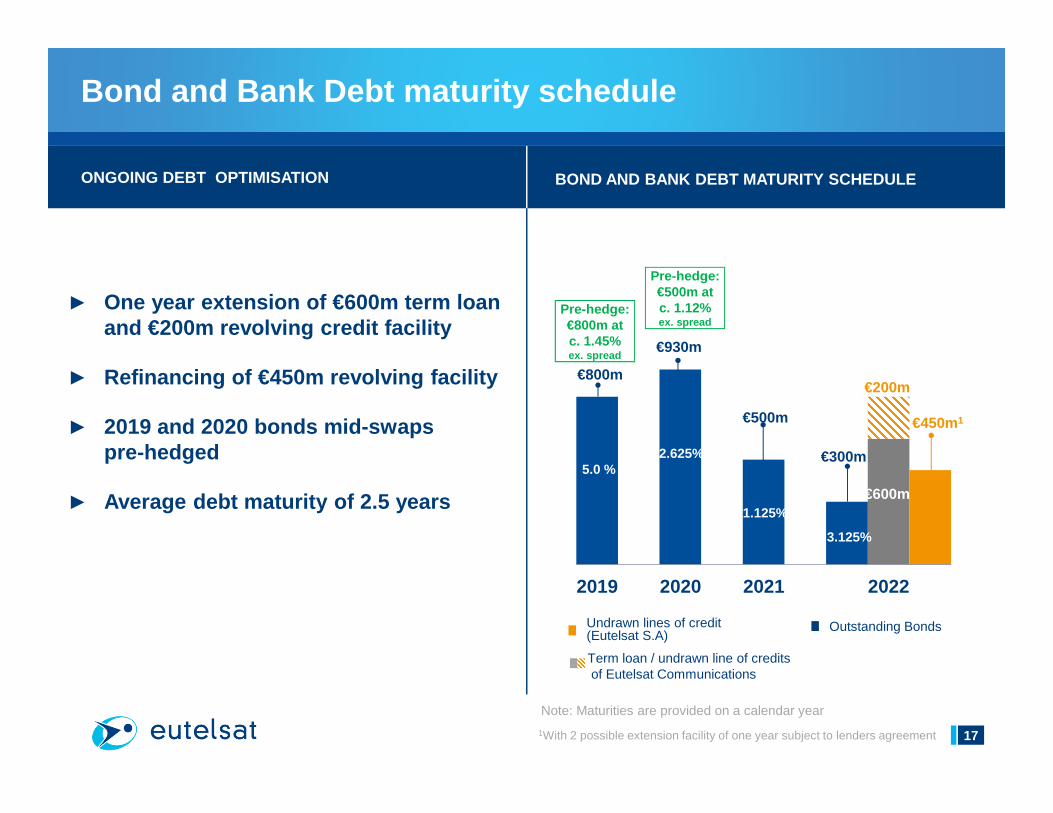
Bond and Bank Debt maturity schedule
1With 2 possible extension facility of one year subject to lenders agreement
2019 2020 2021 2022
ONGOING DEBT OPTIMISATION BOND AND BANK DEBT MATURITY SCHEDULE
► One year extension of €600m term loanand €200m revolving credit facility
► Refinancing of €450m revolving facility
► 2019 and 2020 bonds mid-swaps pre-hedged
► Average debt maturity of 2.5 years
Note: Maturities are provided on a calendar year
Term loan / undrawn line of creditsof Eutelsat Communications
Undrawn lines of credit(Eutelsat S.A)
Outstanding Bonds
€800m
Pre-hedge: €800m at c. 1.45%ex. spread
Pre-hedge: €500m at c. 1.12% ex. spread
€930m
€500m
€300m
€450m1
€600m
€200m
2.625%
3.125%
1.125%
5.0 %
17
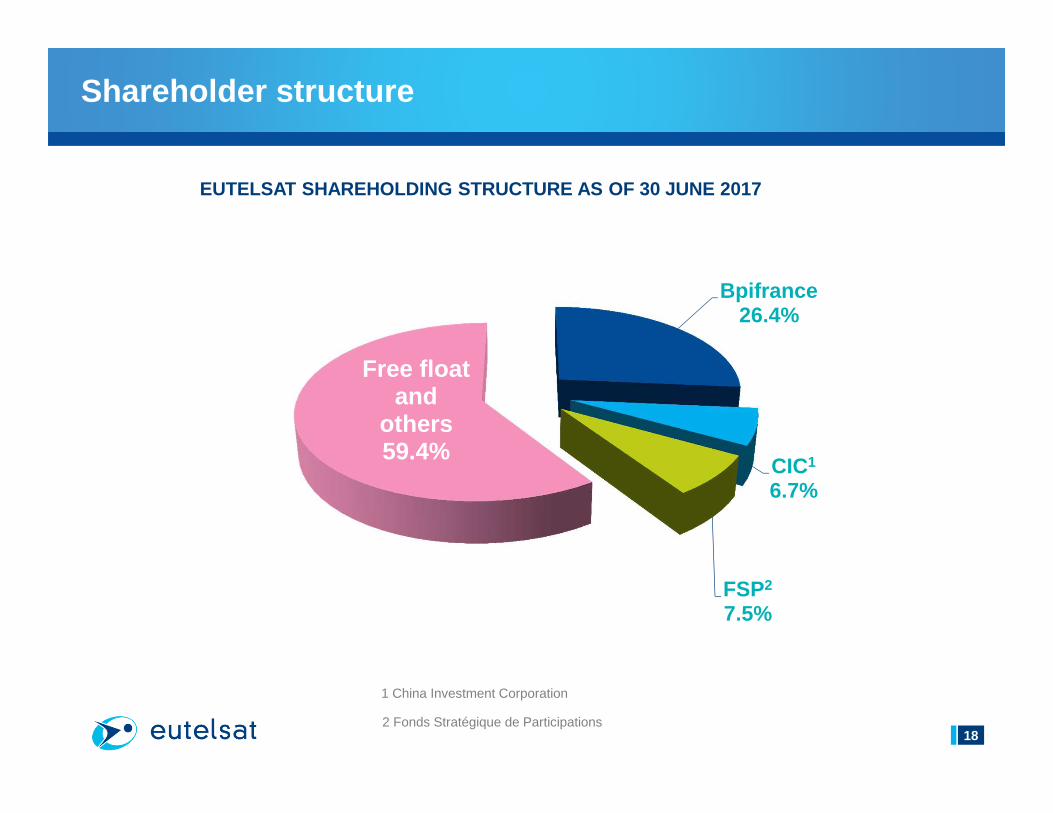
Shareholder structure
EUTELSAT SHAREHOLDING STRUCTURE AS OF 30 JUNE 2017
Bpifrance26.4%
CIC1
6.7%
FSP2
7.5%
Free float and
others59.4%
1 China Investment Corporation
2 Fonds Stratégique de Participations18
Agenda
2
3
5
1 FSS Industry
Eutelsat in a snapshot
H1 2017-18 performance
Appendix
4 Outlook
2
3
19

Key data
REVENUES
1 At constant currency and perimeter. Revenues down 7.7% on a reported basis.2 At constant currency. EBITDA margin up 0.3 pts on a reported basis. Discretionary Free cash-flow up 4% on a reported basis. 3 3-Year CAGR between FY 16 and FY 19. Discretionary Free Cash-flow defined as Net cash-flow from operating activities less Cash Capexless Interest and Other fees paid net of interest received.
Financial outlook
First Half 2017-18
Underlyingperformance
Revenues-2 to -1%
(at constant currency and perimeter)
€697m -5.7%1
(vs. H1 16-17 )
EBITDA margin Above 76%(at constant currency)
78.4%2 +0.5 pts 2
(vs. H1 16-17)
DiscretionaryFree Cash-flow
Mid-single digit3-year CAGR 3
(at constant currency)€339m +8%2
(vs. H1 16-17)
Net Debt / EBITDA Below 3.0x 3.3x -0.1x(vs. Dec. 16)
20
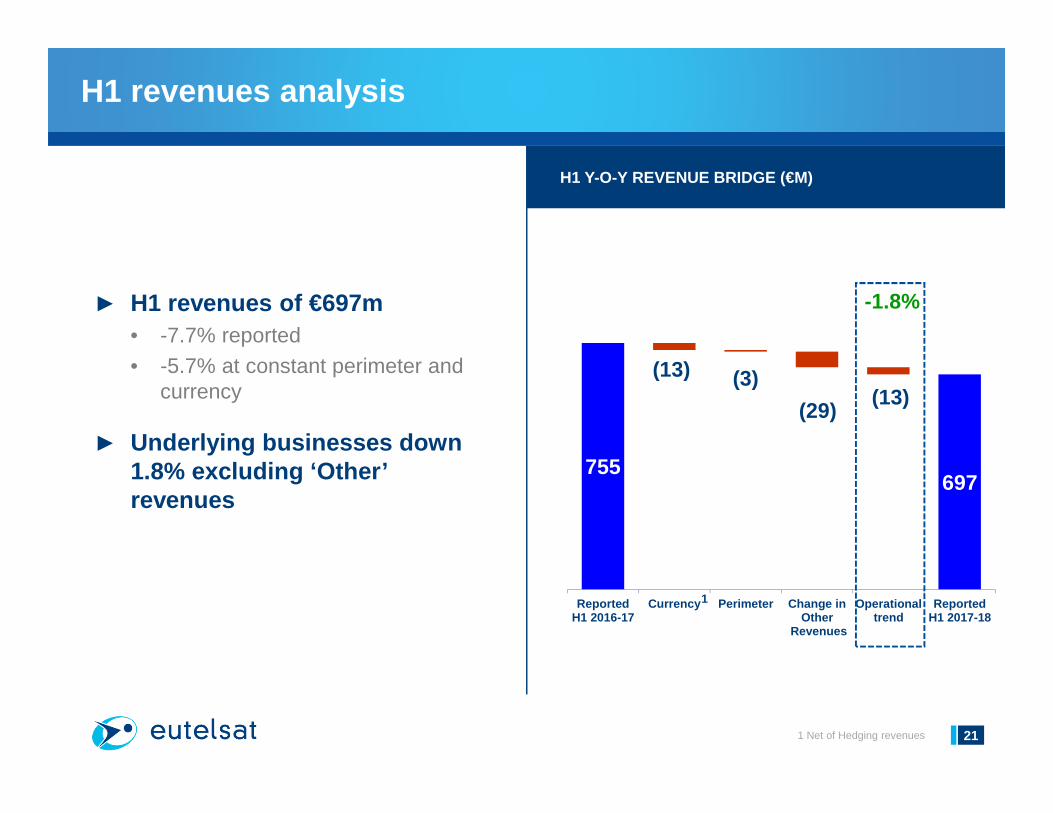
755697
(13) (3)
(29)(13)
ReportedH1 2016-17
Currency Perimeter Change inOther
Revenues
Operationaltrend
ReportedH1 2017-18
H1 revenues analysis
H1 Y-O-Y REVENUE BRIDGE (€M)
► H1 revenues of €697m• -7.7% reported• -5.7% at constant perimeter and
currency
► Underlying businesses down 1.8% excluding ‘Other’ revenues
-1.8%
1 Net of Hedging revenues
1
21
H1 operating Highlights
Solid commercial performance to support revenues in the second half
Acquisition and smooth integration of Noorsat to opt imise Video distribution in the MENA region
Entry into service and ramp-up of EUTELSAT 172B wit h incremental capacity contracted
LEAP cost-savings program ahead of plan
MoU with China Unicom to address satellite communic ations market in the framework of the “Belt and Road” initia tive
Efficient capex containment underpinning 8% 1 rise in DFCF
1 At constant currency. 22

Solid commercial performance
► HOTBIRD• Positive outcome
of contract renewal with Cyfrowy Polsat
• New contract with Mediaset for HD channels
► Contract at 5° West with Altice-SFR
► Multi-year agreements for new DTH platforms in emerging broadcast markets • Fiji on ETL 172B • Caribbean region on ETL 117 WB
IN VIDEO IN OTHER VERTICALS
► Favourable outcome of US Government Autumn renewals
► Incremental business in Government Services at 174° East
► Multi-transponder agreement with Colombian Ministry of Defence for capacity on ETL 115WB
► Incremental capacity for in-flight Mobility at 172 ° East
23

H1 2017-18 Revenues by application
Video
REVENUECONTRIBUTION1
REVENUES2
(€m)LIKE-FOR-LIKE 3
CHANGE
66% 449 -1.2%
1 The share of each application as a percentage of total revenues is calculated excluding “Other revenues”.2 Total revenues of €697m also include Other revenues of €12m. 3At constant currency and perimeter.
Fixed Data 11% 73 -10.6%
GovernmentServices 12% 81 -0.1%
FixedBroadband 6% 44 -8.1%
Mobile Connectivity 5% 37 +20.6%
CO
RE
BU
SIN
ES
SE
SC
ON
NE
CT
IVIT
Y
24

Video
1.
► H1 revenues of €449m, down 1.2% like-for-like
► Broadcast revenues up 0.3% excluding end of TV d’Orangeat HOTBIRD at end-Dec 2016
► Mid-single digit decline in Professional Video
► 6,810 channels at end-Dec 2017• +7.4% y-o-y• HD channels up 28%• 18.7% HD penetration (vs 15.7%
a year earlier)
REPORTED REVENUES1 (€M)
227 228 223
229 224 226
455 452 449
H1 2016-17 H2 2016-17 H1 2017-18
66%
1 Including the contribution of Noorsat
1
Q3
Q4
Q1
Q2
Q1
Q2
25
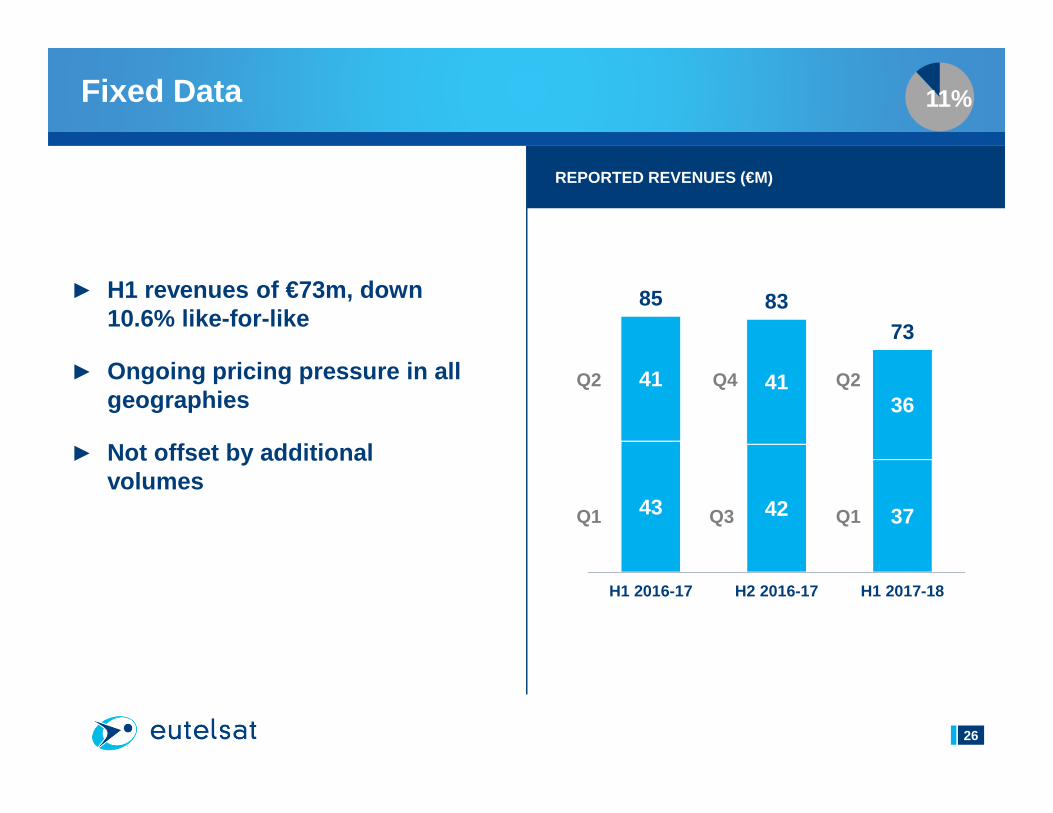
Fixed Data
► H1 revenues of €73m, down 10.6% like-for-like
► Ongoing pricing pressure in all geographies
► Not offset by additional volumes
REPORTED REVENUES (€M)
11%
43 42 37
41 4136
85 8373
H1 2016-17 H2 2016-17 H1 2017-18
Q3
Q4
Q1
Q2
Q1
Q2
26
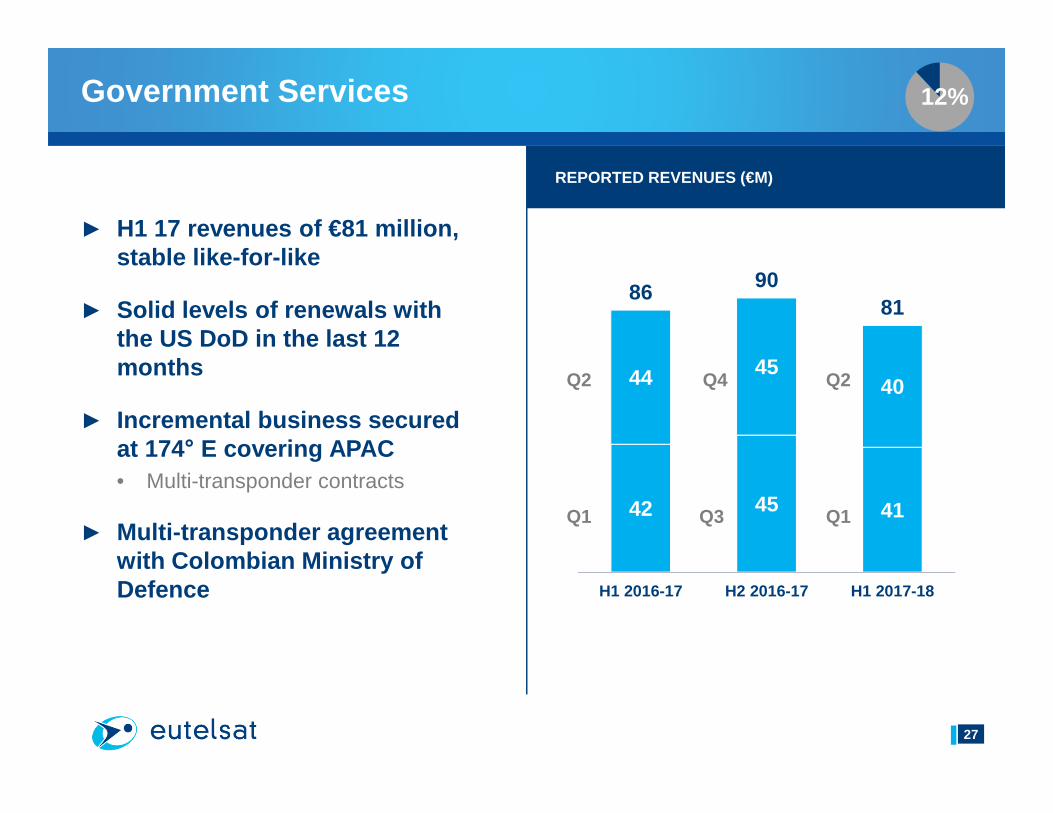
Government Services
► H1 17 revenues of €81 million, stable like-for-like
► Solid levels of renewals with the US DoD in the last 12 months
► Incremental business secured at 174° E covering APAC• Multi-transponder contracts
► Multi-transponder agreement with Colombian Ministry of Defence
REPORTED REVENUES (€M)
12%
42 45 41
44 4540
86 9081
H1 2016-17 H2 2016-17 H1 2017-18
Q3
Q4
Q1
Q2
Q1
Q2
27
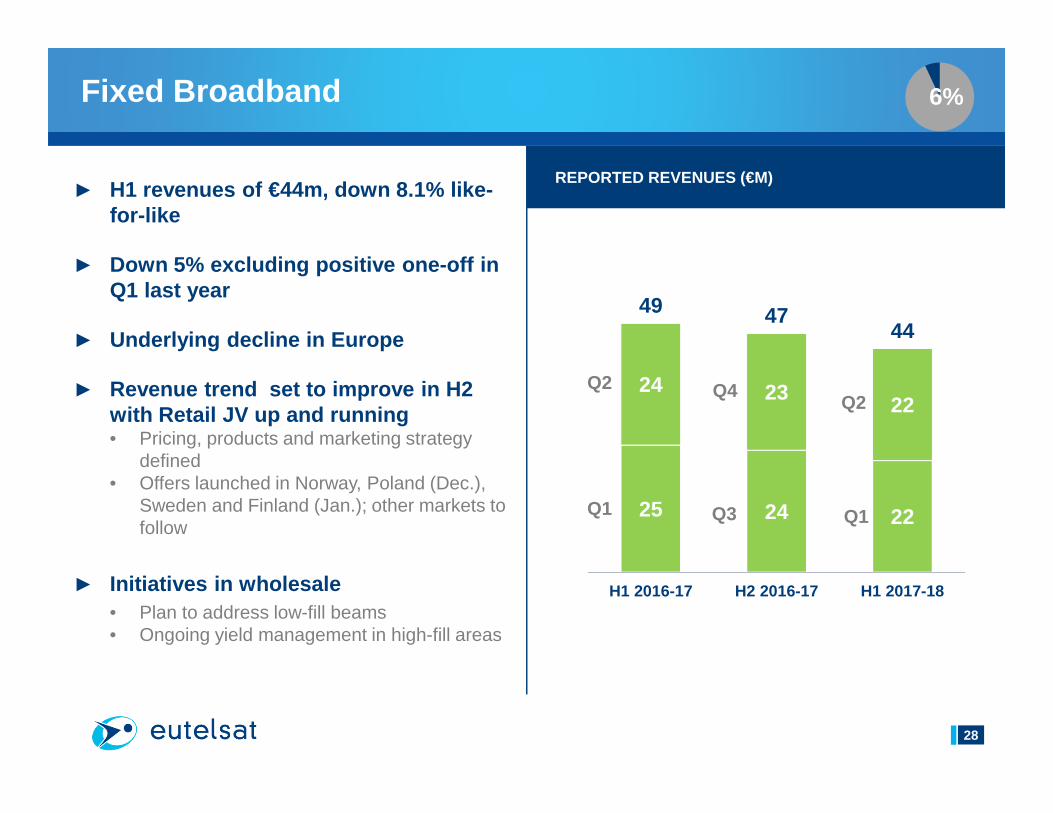
Fixed Broadband
► H1 revenues of €44m, down 8.1% like-for-like
► Down 5% excluding positive one-off in Q1 last year
► Underlying decline in Europe
► Revenue trend set to improve in H2 with Retail JV up and running• Pricing, products and marketing strategy
defined• Offers launched in Norway, Poland (Dec.),
Sweden and Finland (Jan.); other markets to follow
► Initiatives in wholesale• Plan to address low-fill beams• Ongoing yield management in high-fill areas
REPORTED REVENUES (€M)
6%
25 24 22
24 2322
49 4744
H1 2016-17 H2 2016-17 H1 2017-18
Q3
Q4
Q1
Q2
Q1
Q2
28

Mobile Connectivity
► H1 revenues of €37m, up 20.6% like-for-like
► Agreement with Taqnia on the HTS payload of EUTELSAT 3B
► Growing wide-beam capacity sales at several orbital positions:• 172° East• 115° West• 117° West
► EUTELSAT 172B bringing additional dedicated capacity in FY 2017-18• HTS Payload fully contracted • Incremental wide-beam capacity contracted
for in-flight Mobility.
REVENUES1 (€M)
1 Proforma revenues reflecting new applications as well as thedisposal of Wins for H1 2016-17
5%
215 17 19
1819 19
3336 37
H1 2016-17 H2 2016-17 H1 2017-18
Q3
Q4
Q1
Q2
Q1
Q2
29

Backlog and Fill Rate
BACKLOG (€BN) OPERATIONAL AND LEASED TRANSPONDERS
4.5 4.3
4.0
0.8 0.80.7
5.3 5.24.7
31 Dec.2016
30 June 2017 31 Dec. 2017
Video Others
► Backlog evolution reflecting mainly the impact of the integration of Noorsat
► 3.2 years of revenues
► Video accounting for 85%
1,326 1,372 1,416
940 931 949
31 Dec. 16 30 Jun. 2017 31 Dec. 17
Operational transponders
Based on 36 MHz-equivalent transponders (TPE), excluding HTS capacity
70.9% 67.9% 67.0%Fillrate
► OSD of ETL117 WB in Jan 17 and ETL 172B end-Nov 17
► 18 incremental TPE leased since June 17
(0.4)
Noorsat
30

Agenda
2
3
5
1 FSS Industry
Eutelsat in a snapshot
H1 2017-18 performance
Appendix
4 Outlook
2
3
4
31

Reminder: Our strategic roadmap
GROW CASH-FLOW
STEP 1 STEP 2
GROW TOPLINE
2017-19
2019-2025+
Maximise Free Cash-Flow generation
Build on our core video business
to accelerate growth
Capture longerterm potentialin Connectivity
2016-2019
32
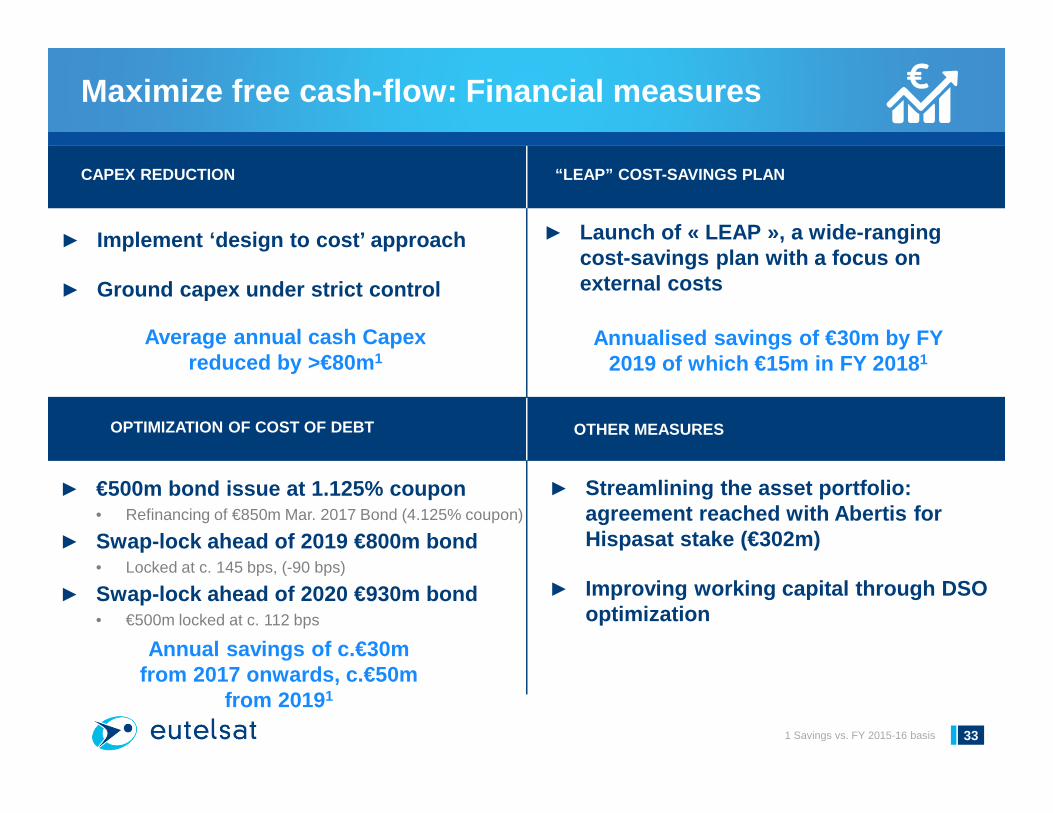
Maximize free cash-flow: Financial measures
1 Savings vs. FY 2015-16 basis
► Implement ‘design to cost’ approach
► Ground capex under strict control
CAPEX REDUCTION
► €500m bond issue at 1.125% coupon• Refinancing of €850m Mar. 2017 Bond (4.125% coupon)
► Swap-lock ahead of 2019 €800m bond• Locked at c. 145 bps, (-90 bps)
► Swap-lock ahead of 2020 €930m bond • €500m locked at c. 112 bps
► Streamlining the asset portfolio: agreement reached with Abertis for Hispasat stake (€302m)
► Improving working capital through DSO optimization
► Launch of « LEAP », a wide-ranging cost-savings plan with a focus on external costs
OTHER MEASURES
“LEAP” COST-SAVINGS PLAN
Average annual cash Capex reduced by >€80m 1
Annual savings of c.€30m from 2017 onwards, c.€50m
from 2019 1
Annualised savings of €30m by FY 2019 of which €15m in FY 2018 1
OPTIMIZATION OF COST OF DEBT
33

Build on our core Video business to accelerate grow th; capture longer term potential in Connectivity
► Optimize existing assets within a limited current addressable market
► Progress on prerequisites for scalability
► Decide on scale and location of investments
► Use existing assetsto anchor footholdin the market
► Selectively investin capacity to improve coverage
► Pave the wayfor Mass market
► Growth potential of Video
► Opportunity for further value creation
► Harnessing technology
VIDEOFIXEDBROADBAND
MOBILECONNECTIVITY
MEDIUM TERM(FROM FY 2019)
LONG TERM(FROM FY 2021)
Build on our core business to accelerate growth
Preparefor scalability
From nicheto mass market
34
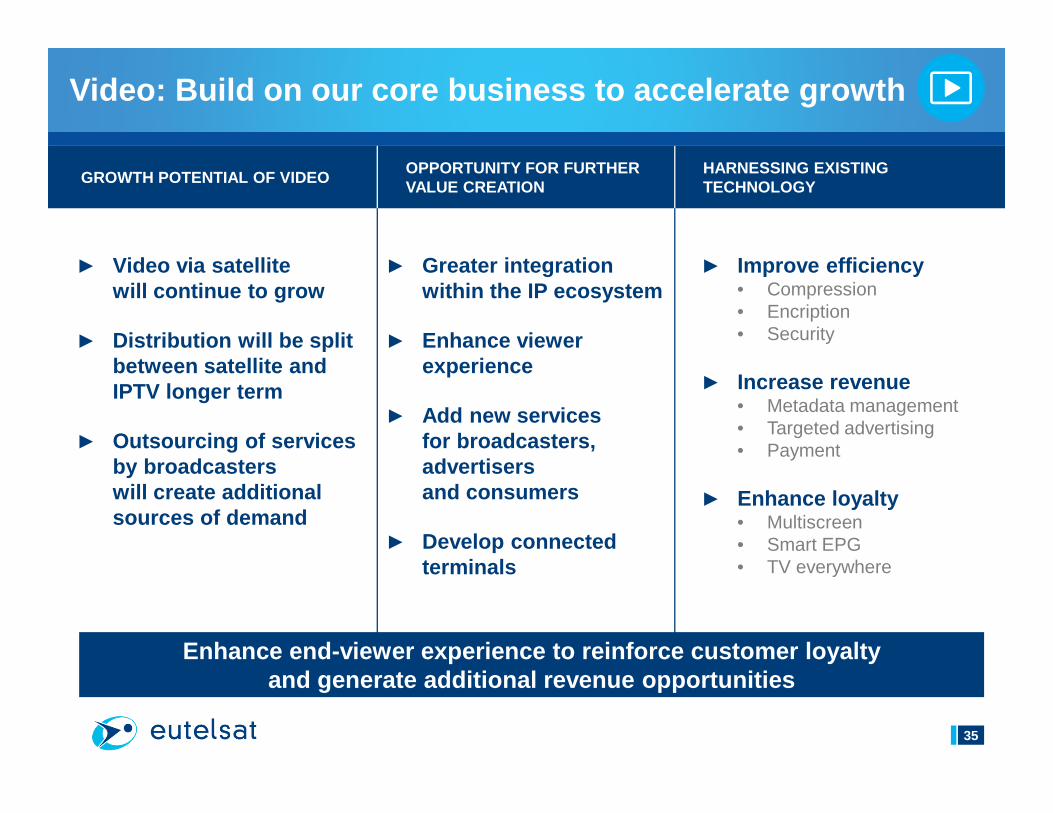
Video: Build on our core business to accelerate gro wth
35
► Video via satellite will continue to grow
► Distribution will be split between satellite and IPTV longer term
► Outsourcing of services by broadcasterswill create additionalsources of demand
GROWTH POTENTIAL OF VIDEOOPPORTUNITY FOR FURTHERVALUE CREATION
► Greater integrationwithin the IP ecosystem
► Enhance viewerexperience
► Add new servicesfor broadcasters, advertisersand consumers
► Develop connectedterminals
► Improve efficiency• Compression• Encription• Security
► Increase revenue• Metadata management• Targeted advertising• Payment
► Enhance loyalty• Multiscreen• Smart EPG• TV everywhere
HARNESSING EXISTING TECHNOLOGY
Enhance end-viewer experience to reinforce customer loyaltyand generate additional revenue opportunities

Connectivity: Agreement with ViaSat…
► Combining Eutelsat’s European broadband business with ViaSat’sexpertise
► Two entities:
• Infrastructure (51% Eutelsat)• Retail (51% ViaSat)
► ViaSat paid €132.5m for 49% of European Broadband business
CLOSING OF JV AGREEMENT WHAT’S NEW?
► Initial JV perimeter extended to include both Fixed Broadband AND in-flight Mobility
► Initial technical assessment of Viasat3 VHTS technology successfullycompleted
► ViaSat-3 EMEA satellite expected to be added to the joint venture
► Platform to drive growth acceleration in Connectivity vertical from early 2020s
36

…paving the way for the longer-term opportunity
► Core market for Fixed Broadband via satellite estimated atc.5m households in Europe in 2030 1
► Global revenues for in-flight Connectivity capacity expec ted toexceed €1bn in 2025
Significant long-term potential
VHTS game-changing
technology
Springboard for growth rebound
from 2020
Managed withincurrent capex and
profitabilityframework
► Provision of fibre-like service
► Production costs enabling transition from niche to mass market
► Early mover advantage
► Strong technology partner
► Combining ViaSat’s distribution know how and Eutelsat ’sestablished positions and ‘go-to-market’ experience
► Shared Investment with ViaSat
► KA-SAT funds earmarked for VHTS investment
► Eutelsat retains an infrastructure business model with noimpact on margins
1 Households with Fixed Broadband connection below 10 Mbps and no indoor LTE coverage 37

Y-o-Y revenue trend to improve in the Second Half
► 2017-18 revenue path back-end loaded
► Comparison base to ease in H2• Lower ‘Other’ revenues• End of TV d’Orange on 31 Dec. • Easier comps for Fixed Data
► H2 benefiting from:• Entry into service of ETL 172B• New business secured at the end of
calendar year 2017
HALF-YEAR PROFORMA REVENUES IN FY 2016-17 AT H1 2017-18 EUR/USD RATE (1.17)
693 686
4113
734
699
H1 H2
Other revenues
Revenues excluding Wins/DHI and DSAT Cinéma at 1.17 EUR/USD rate
38

Financial outlook
391 Based on Proforma revenues of €1472m for FY 2016-17 excluding the contributions of Wins/DHI and DSAT; 2 Inc. cash outflows related to ECA loan repayments and capital lease payments; 3 Net cash-flow from operating activities less Cash Capex less Interestand Other fees paid net of interest received. Three year CAGR calculated on the period FY 2016-17 to FY 2019-20 .
REVENUES(At constant currency, and perimeter)
EBITDA MARGIN(At constant currency)
CAPEX
LEVERAGE
► -1% to -2% in FY 2017-18 1
► Return to slight growth from FY 2018-19
► Above 76% in FY 2017-18 ► Above 77% from FY 2018-19
► FY 2017-18 to FY 2019-20: average of €420m 2 per yearFY 2017-18 expected below €420m average
► Investment grade rating► Net debt / EBITDA below 3.0x
DISTRIBUTION ► Stable to progressing dividend
DISCRETIONARY FREE CASH FLOW 3
(At constant currency)
► FY 2016-17 to FY 2019-20: mid-single digit CAGR
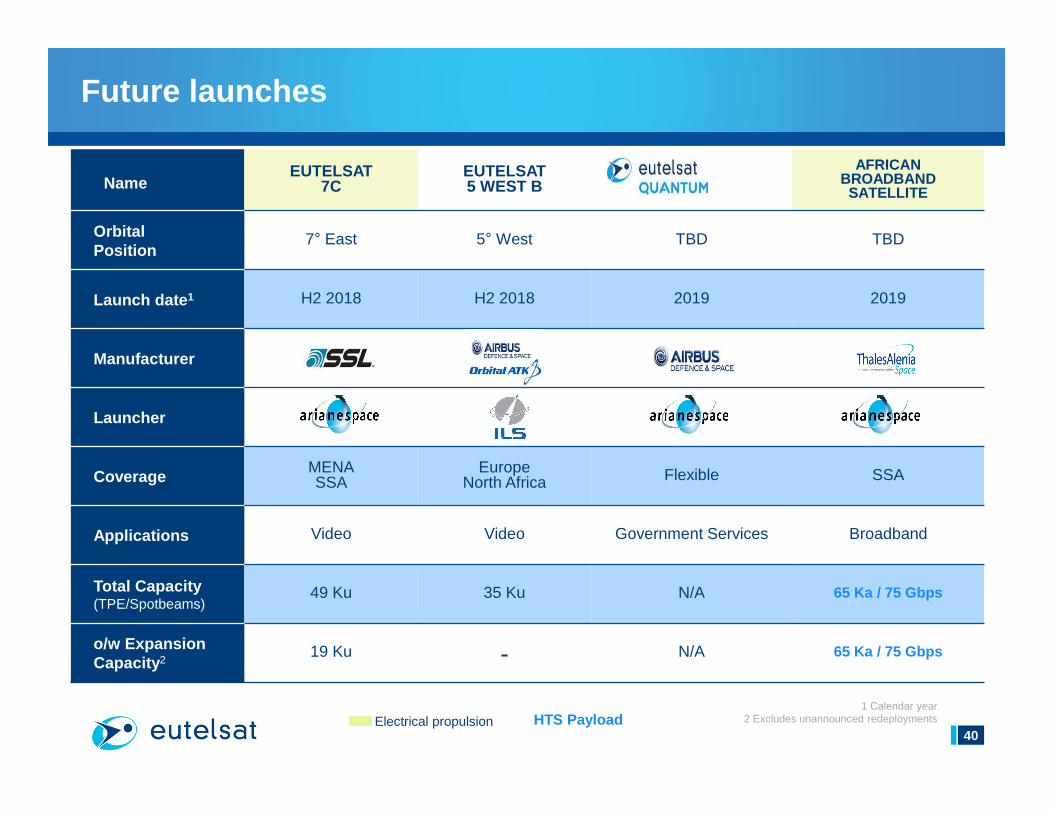
Future launches
40
NameEUTELSAT
7CEUTELSAT5 WEST B
AFRICAN BROADBANDSATELLITE
OrbitalPosition
7° East 5° West TBD TBD
Launch date 1 H2 2018 H2 2018 2019 2019
Manufacturer
Launcher
CoverageMENASSA
EuropeNorth Africa Flexible SSA
Applications Video Video Government Services Broadband
Total Capacity (TPE/Spotbeams)
49 Ku 35 Ku N/A 65 Ka / 75 Gbps
o/w ExpansionCapacity 2
19 Ku - N/A 65 Ka / 75 Gbps
1 Calendar year2 Excludes unannounced redeploymentsElectrical propulsion HTS Payload

Agenda
2
3
5
1 FSS Industry
Eutelsat in a snapshot
Q1 2017-18 performance
Appendix
4 Outlook
2
3
541
Appendix
5
H1 2017-18 financials5.1
Miscellaneous5.2
42

Profitability
► Rise in EBITDA margin to 78.4% at constant currency despite lower ‘Other revenues’• Favourable phasing of certain
operating costs
► Positive impact of “LEAP” cost saving plan• Ahead of plan at the Half Year
EBITDA (€M)
77.4 77.4 77.5
Margin at constant
currency (%)
588 545
H1 2016-17 H1 2017-18
77.9 78.41
1 Reported EBITDA marging stood at 78.2%
43
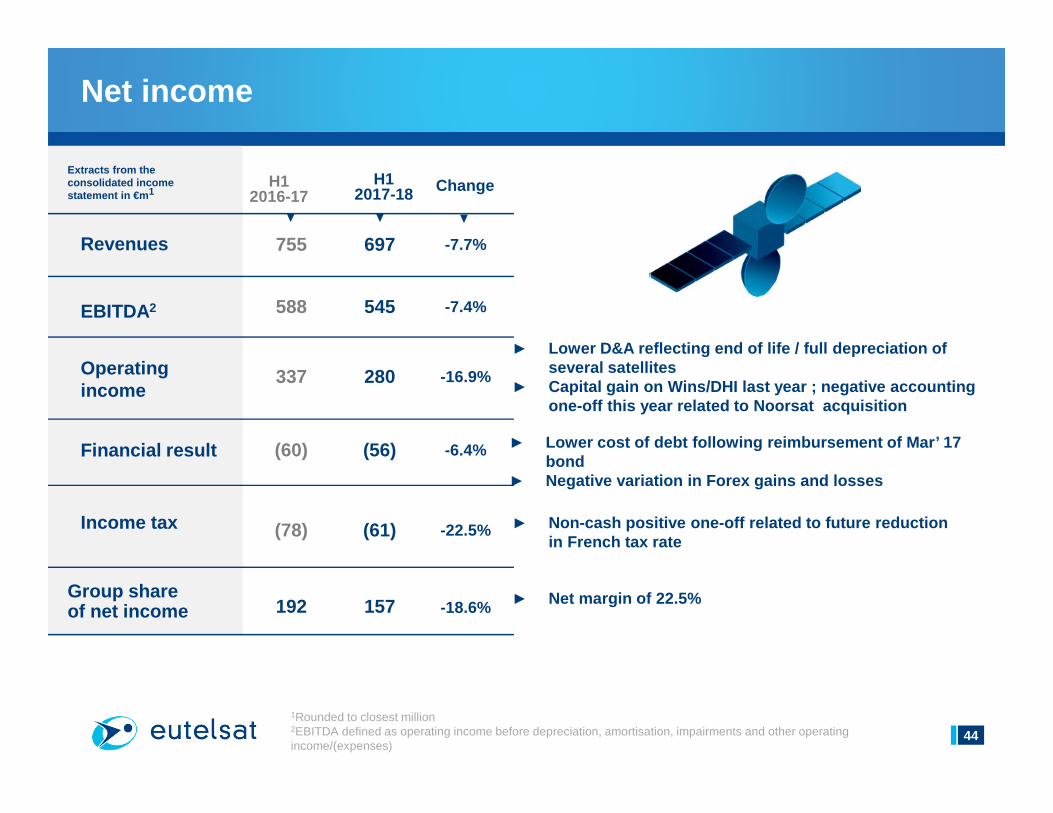
Net income
44
1Rounded to closest million2EBITDA defined as operating income before depreciation, amortisation, impairments and other operating income/(expenses)
H1 2016-17
H1 2017-18 Change
Revenues
EBITDA2
Operating income
Financial result
Income tax
Group share of net income
Extracts from the consolidated income statement in €m 1
755 697 -7.7%
588 545 -7.4%
337 280 -16.9%
(60) (56) -6.4%
(78) (61) -22.5%
192 157 -18.6%
► Lower D&A reflecting end of life / full depreciatio n of several satellites
► Capital gain on Wins/DHI last year ; negative account ingone-off this year related to Noorsat acquisition
► Lower cost of debt following reimbursement of Mar’ 17 bond
► Negative variation in Forex gains and losses
► Non-cash positive one-off related to future reducti on in French tax rate
► Net margin of 22.5%
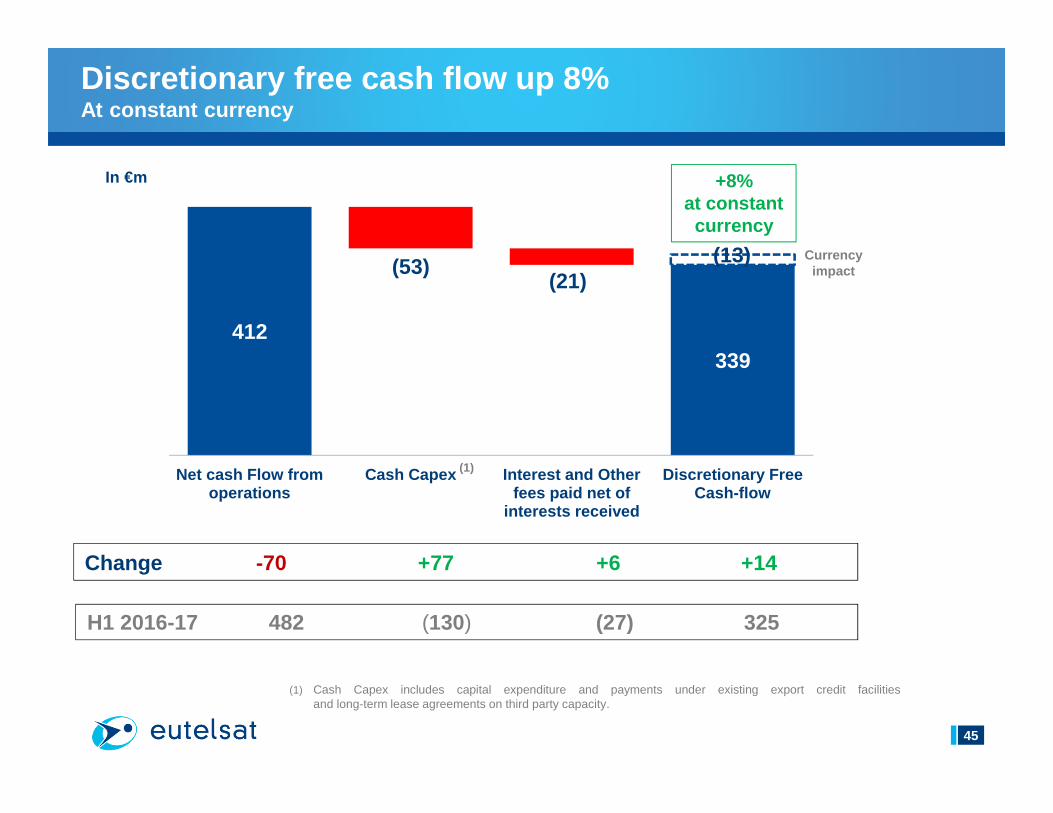
Discretionary free cash flow up 8% At constant currency
1
(1) Cash Capex includes capital expenditure and payments under existing export credit facilitiesand long-term lease agreements on third party capacity.
(1)
412339
(53)(21)
(13)
Net cash Flow from operations
Cash Capex Interest and Other fees paid net of
interests received
Discretionary Free Cash-flow
In €m
(1)
482 (130) (27) 325H1 2016-17
-70 +77 +6 +14Change
+8%at constant
currencyCurrency
impact
45

Net debt stable after dividend payment and Noorsat acqui sition
3,641 3,630
(339) 295
89(32) (24)
-€10m
Net Debt at end- June 17
Net Debt at end-Dec. 17
DiscretionaryFree Cash Flow
Dividendspaid
Change in fin. leases /
ECA and Others
In €m
Equity investments
FX portion of CC Swap
46

Appendix
5
H1 2017-18 financials5.1
Miscellaneous5.2
47

502 548
Dec. 16 Dec. 17
247304
Dec. 16 Dec. 17
HOTBIRD: HD ramp-up continues to outpace MPEG 4 transition ra te
1,0121,002
Dec. 16 Dec. 17
Resilientchannel count
-43
Accelerationin HD ramp-up
+23%
MPEG-4 still risingbut at a lesserpace than HD
+9%
-1%
Figures at end Dec. 16 exclude Orange TV 48

Evolution of used capacity at HOTBIRD
► Positives
• HD penetration to reach 50%
(vs. c. 25% today)
• >20 UHD channels (vs. <5)
► Negatives
• Reduction in simulcast
(from 10% to 5% of total channels)
• Efficiency gains
(coding, modulation, compression)
KEY TRENDS BY FY 2021 EVOLUTION OF CAPACITY USED
100 109(20)
(17)
+37
+9
FY 17 SD channelreduction
Efficiencygains
HD channelincrease
UHDchannelincrease
FY 21
► New pricing model based on ‘Mbps’
Increase in Mbps used => revenues at least stable
Sensitivity: a variation of 10 channels wouldhave a 1 point impact on capacity used
In Mbps (base 100 in FY 2017)
49
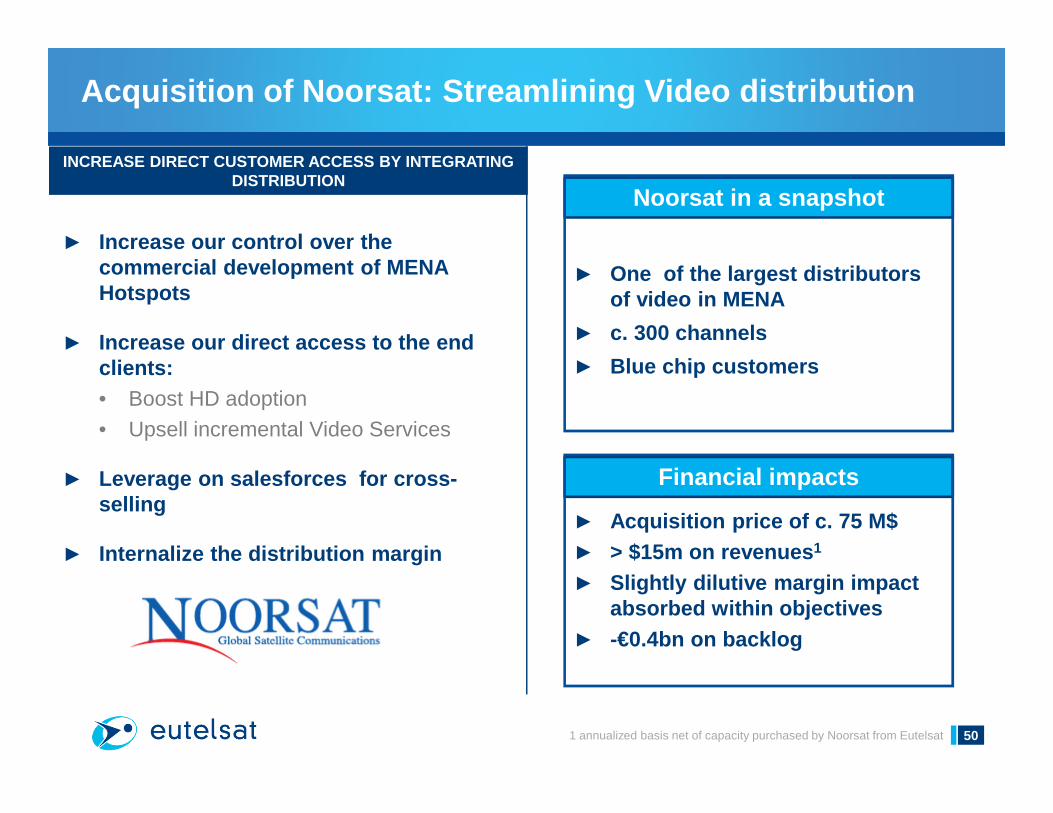
Acquisition of Noorsat: Streamlining Video distributi on
1 annualized basis net of capacity purchased by Noorsat from Eutelsat
► Increase our control over the commercial development of MENA Hotspots
► Increase our direct access to the end clients: • Boost HD adoption • Upsell incremental Video Services
► Leverage on salesforces for cross-selling
► Internalize the distribution margin
Noorsat in a snapshot
INCREASE DIRECT CUSTOMER ACCESS BY INTEGRATING DISTRIBUTION
► One of the largest distributors of video in MENA
► c. 300 channels
► Blue chip customers
Financial impacts
► Acquisition price of c. 75 M$► > $15m on revenues 1
► Slightly dilutive margin impact absorbed within objectives
► -€0.4bn on backlog
50

Video Case study: Development of hybrid offer in South Korea
Source: Eutelsat analysis, company reports
KT MEDIA SUBSCRIBERS (M)
► South Korea is one of the countrieswith the highest fiber penetration
► KT Telecom hybrid offer launched in August 2009 combining IPTV with DTH
• Part of a triple play offer including broadband and Voice over IP
► Differentiated services offering
• Wide range of linear channels including HD channels (from satellite TV)
• Significant VOD contents (from IP offer )
► After adopting the hybrid platform KT was perceived to be superior to cable TV or competitor IPTV
• Became a leading IPTV player
2.15
0.84
1.55
9.71
2.43
1.94
5.35
2011
4.55
2017
Olleh TV(IPTV)
Skylife TV(satellite)
Olleh TV Skylife(hybrid) Satellite
Satellite prospering in the land of fiber
VIDEO
51

► Eutelsat’s number one Video market
► Unrivalled distribution cost
• Eg: Sky It is paying c.€90m /year to distribute260 channels to 4.8 M households
• This represents c.7 cents per channel per household per year
► Low terrestrial infrastructure penetration
► Sky Italia available via Telecom Italiaterrestrial since 2015
► Sky Satellite subscribers have risensince then
SKY ITALIA SATELLITE SUBSCRIBER DEVELOPMENT
Source: OECD, Sky reports
Sky Italia retail customers, in ‘000 subs
Video via satellite: Italian market focus
4,833 4,760 4,734 4,700 4,809 4,768
Dec12 Dec13 Dec14 Dec15 Dec 16 Dec 17
Launch of OTT
52

Fixed Broadband: Preparing for mass market adoption
BRIDGE DIGITAL DIVIDE
IN-MARKET PROPOSITION INDUSTRIAL TRANSLATION TIMING
Use the time to VHTS to prepare for mass market: op timize existing or committed assets(KA-SAT, Russian and African Broaband) and validate go-to-market models
► Deliver fiber-like capacity (30 Mbps)
► Reach fiber-like pricing (€40 / month)
► Lower barrers to adoption
► Assess adressable market
► Develop appropriatedistribution
► VHTS satellites€1m / Gbps
► Terminals < $200
► Refine assessmentof fiber deployment
► Test and validatebusiness models
► 2020-21
► C.2019
► 2018 onwards
► 2016-18
53

Mobile Connectivity: M arket foothold with existing assets
BRING FIBER-LIKE CONNECTIVITY IN MOBILITY
IN-MARKET PROPOSITION INDUSTRIAL TRANSLATION TIMING
Pave the way by leveraging our existing assets in A ero (172° East, 10° East, 117° East, KA-SAT),selectively invest to improve coverage, and seek pa rtnership deals with stakeholders for each vertical
► Deliver streaming-like experience for IFEC
► 1 Mbps / passengerfor 50% of passengers
► Deliver on-the-movefiber-like Connectivityfor ground transportation
► VHTS satellites1 Terabyte satellite
► VVHTS
► Flat terminals
► 2020-21
► 2025-2035+
54

Strong pipeline for in-flight Connectivity
► Several contracts signedusing capacity on KA-SAT over Europe• Finnair
• SAS
• El Al
• Icelandair
► Eutelsat providessatellite capacity, ViaSatis the prime contractor
KA-SAT EUTELSAT 172B
► Customised HTS payload to support IFEC growth over APAC
► Fully sold to 2 major customers• Panasonic• China Unicom
► Panasonic to use alsowidebeam capacity to deliver live TV to aircrafts
► Contract with Taqnia for four HTS Ka-band spotbeams on ETL 3B • Capacity to be used for 100
medium / long-haul aircraft of Saudi Arabian Airlines
► Several contracts for the use of widebeam capacity by major service providers
OTHER RESOURCES
55
Stepping up cooperation with China Unicom
► Historic and strong partner in the region
► New MoU addressing satellite communications market in the framework of the ‘Belt and Road’ initiative
► Remaining HTS capacity on ETL 172B contracted for in-flight Connectivity
► Considering further joint-development of satellite communication services
56

Eutelsat Quantum: Cutting-edge technology
► Software-defined class of satellites
► First satellite to be launched in 2019
• Manufactured by Airbus Defence and Space
► Incomparable flexibility in terms of:• Coverage
• Bandwidth
• Power and frequency configurability
► Premium capacity through footprint shaping and stee ring, power and frequency band pairing that customers will be able to actively define
► Targeting for users operating in Government and Mob ility markets
Most of the capacity is devoted to Cairo, during day-time in Africa
Most of the capacity is devoted to NYC,during day-time in Americas
Example of a coverage hopping between 2 markets
57

Satellite programme capex profile
TYPICAL TIMING OF CAPEXPAYMENTS
► Capex generally split equally over three years prior to launch
► Insurance paid in year three
BREAKDOWN OF CAPEX
30% 30% 40%
YEAR 1 YEAR 2 YEAR 3
Launcher
Insurance
Others
Satellite
58

>30%1 in capex savingsImproved IRREnhanced performance
Design-to-cost: EUTELSAT 5 West B case study
DESIGN-TO-COST
Improved match of coverage with
customer requirements
Lower cost of payload
Smaller platform
Lower launch cost
Lower insurance cost
LAUNCH
Shared launch in a stacked
configuration on a Proton rocket
(1) relative to the theoretical cost of replicating EUTELSAT 5 West A’s Ku band mission 59

Satellite economic model 1: Regular capacity
1 For a greenfield satellite, using chemical propulsion 60
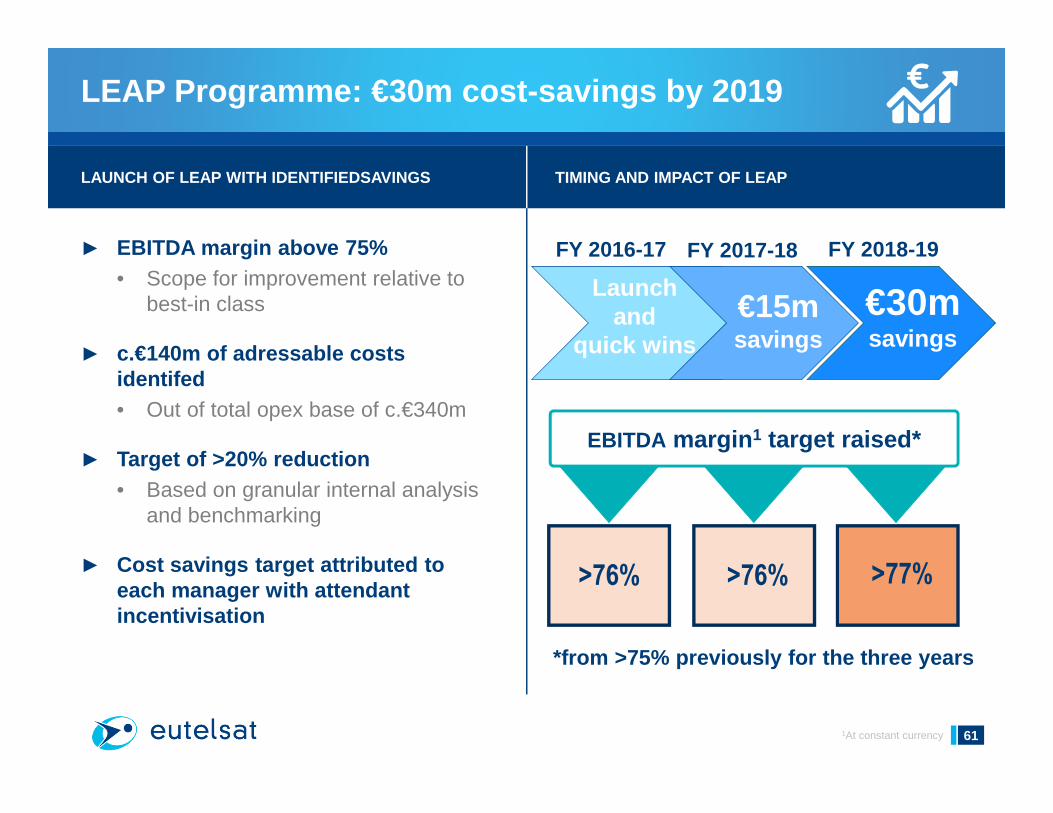
LEAP Programme: €30m cost-savings by 2019
1At constant currency
► EBITDA margin above 75%• Scope for improvement relative to
best-in class
► c.€140m of adressable costsidentifed• Out of total opex base of c.€340m
► Target of >20% reduction• Based on granular internal analysis
and benchmarking
► Cost savings target attributed to each manager with attendant incentivisation
LAUNCH OF LEAP WITH IDENTIFIEDSAVINGS TIMING AND IMP ACT OF LEAP
FY 2016-17 FY 2017-18 FY 2018-19
Launchand
quick wins
€15m savings
€30msavings
EBITDA margin 1 target raised*
>76%>76%
*from >75% previously for the three years
>77%
61

IR Contacts
Joanna DARLINGTONT: +33 1 53 98 31 07 E: [email protected]
Cédric PUGNIT: +33 1 53 98 31 54 E: [email protected]
62