europe’s share of the climate challenge domestic actions and international obligations to protect...
TRANSCRIPT

Europe’s Share of the Climate ChallengeDomestic Actions and International Obligations to Protect the Planet
December 1st, 2009 Charles Heaps, Pete Erickson, Sivan Kartha, Eric Kemp-Benedict
www.ClimateShareEurope.org
www.sei-international.org www.foeeurope.org

Updated Reasons for Concern
Source: Assessing dangerous climate change through an update of the Intergovernmental Panel on Climate Change (IPCC) ‘‘reasons for concern’’ (PNAS, Feb 2009)

The South’s Dilemma

Examines how Europe can show climate leadership…
• …by undertaking domestic actions to rapidly reduce emissions of greenhouse gases (GHGs),
• and by fulfilling its international obligations to help other countries address the twin crises of climate change and development.

Domestic Actions• A detailed sector-by-sector mitigation scenario for all
27 EU countries that can achieve GHG emissions reductions of 40% in 2020 and almost 90% in 2050 relative to 1990 levels.
• Mitigation achieved through a combination of radical improvements in energy efficiency, accelerated retirement of fossil fuels and a dramatic shift toward various types of renewable energy, including wind, solar, wave, geothermal and biomass-based combined heat and power (CHP).

International Obligations• Examines Europe’s international
obligations for assisting the world’s developing nations make a transition to a low-GHG future.
• Uses the Greenhouse Development Rights framework to assess fair contributions to a global climate effort.
• We estimate Europe’s fair share to be between €150 billion and €450 billion in 2020 depending on the cost of mitigation -- approximately 1% to 3% of the EU’s projected 2020 GDP.
www.gdrights.org

Excluded Options• At request of FoEE, certain potentially significant
mitigation options excluded:– No new nuclear power & phase out of existing nuclear
facilities.– No carbon capture and storage (CCS) for fossil generation. – No biofuels.– No offsetting.
• Even without these mitigation options, Europe is still able to meet its target reductions.
Concerns Over Excluded Options:• Nuclear: proliferation; safety; waste disposal & storage; high cost of R&D
may crowd out research into renewables.• CCS: high R&D costs; unlikely to be commercialized anytime soon; unclear
if CO2 storage reliable; “CCS ready” plants (with no storage) may never actually be used to capture CO2; CO2 storage sites likely to be a scarce commodity – may be used to store biomass CO2 – to reduce atmospheric concentrations.
• Biofuels: currently have little if any mitigation benefits; 2nd generation (e.g. woody) biofuels also excluded up to 2050 due to concerns over land-use implications in developing countries, but may be an important option.
• Offsetting: is excluded by definition since the focus of the study is domestic mitigation. Offsetting simply shifts reductions to other locations and would allow the EU to defer the changes described in our scenario.

Sufficiency and Equity• Study examines the role of sufficiency and equity in
helping promote the needed transition to a low GHG future reflected in lower GDP vs. Baseline.
• Mitigation GDP grows by a factor of 1.6 between 2008 and 2050 versus the 1.8 times growth in the Baseline scenario.
• Increased levels of equity among EU countries are also assumed, on the basis that achieving an EU-wide mobilisation on climate will require greater solidarity between nations.

Analysis Developed Using SEI’s LEAP Software.
www.energycommunity.org

Country RCI % MT CO2e% below
1990 MT CO2e% below
1990 MT CO2e
Additional % below
1990
billion €(assuming
€50/tCO2e)
billion €(assuming
€150/tCO2e)
Austria 0.6% 91 118% 30 17% 61 100% 3.0 9.1Belgium 1.0% 140 110% 48 37% 92 73% 4.6 13.8Bulgaria 0.2% 23 95% 11 83% 12 11% 0.6 1.8Cyprus 0.0% 6 -24% 5 -50% 1 26% 0.1 0.2Czech Republic 0.7% 108 82% 69 59% 39 23% 2.0 5.9Denmark 0.6% 81 112% 37 51% 44 61% 2.2 6.6Estonia 0.1% 12 105% 5 81% 7 24% 0.3 1.0Finland 0.4% 63 106% 31 44% 32 61% 1.6 4.8France 4.2% 616 136% 130 33% 486 104% 24.3 72.8Germany 7.3% 1,078 116% 351 51% 727 65% 36.4 109.1Greece 0.5% 81 57% 45 20% 36 36% 1.8 5.4Hungary 0.3% 40 78% 16 50% 24 28% 1.2 3.6Ireland 0.3% 48 48% 25 5% 23 43% 1.1 3.4Italy 3.4% 493 107% 142 18% 351 89% 17.5 52.6Latvia 0.0% 7 327% 3 243% 5 83% 0.2 0.7Lithuania 0.1% 12 92% 6 76% 6 16% 0.3 0.9Luxembourg 0.1% 12 36% 6 -33% 6 69% 0.3 1.0Malta 0.0% 2 73% 1 -5% 1 78% 0.1 0.1Netherlands 1.4% 199 90% 80 30% 120 60% 6.0 18.0Poland 1.1% 159 44% 241 67% -82 -23% -4.1 -12.2Portugal 0.3% 45 64% 14 13% 31 51% 1.5 4.6Romania 0.2% 34 69% 37 71% -3 -1% -0.1 -0.4Slovak Republic 0.2% 30 75% 21 61% 9 14% 0.5 1.4Slovenia 0.1% 16 54% 15 49% 1 5% 0.0 0.1Spain 1.9% 281 49% 116 -16% 165 65% 8.3 24.8Sweden 0.8% 111 239% 25 33% 85 207% 4.3 12.8United Kingdom 5.7% 835 132% 202 41% 633 90% 31.6 94.9Total 31.9% 4,685 103% 1,713 40% 2,972 63% 148.6 445.9
Total Obligation Domestic Reduction International Obligation
Results of the GDRs analysis for each of the EU 27 countries for the year 2020

Population: Same in both scenarios

But Income is More Equal in 2050…
2010 2050 Baseline 2050 Mitigation


Substantial Energy Efficiency Gains In All Sectors…

…and Substantial Switching to Low Carbon Fuels

Key Measures for Buildings• Increased building shell efficiency for both
new buildings and retrofits.• Improved efficiency of heating, cooling and
lighting systems.• Shift from direct use of fossil fuels to
electricity (heat pumps), solar power and CHP. • Sufficiency: after trending up for decades,
home sizes return to 2005 levels by 2050.

Key Policies for Buildings
• EU’s Energy Performance of Buildings Directive extended to all buildings and standards tightened.
• Access to capital needed to finance retrofits and scale-up efficiency measures.
• Performance targets for appliances • New Standards for the use of renewables in
heating and cooling.
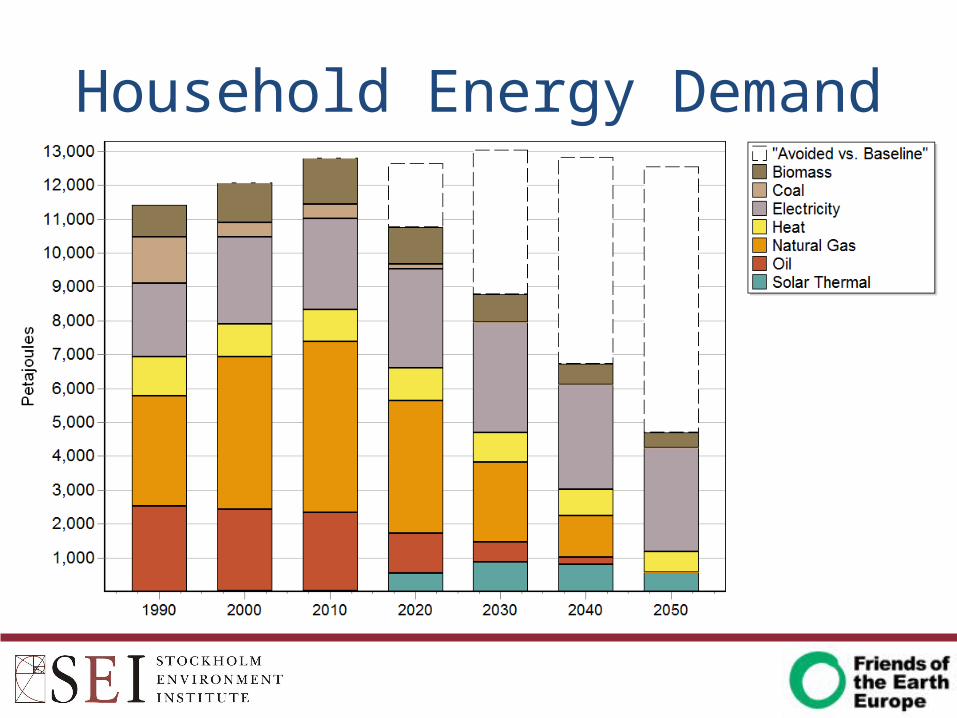
Household Energy Demand

Services Energy Demand

Passive Solar Buildings

Industrial Energy Demand

Key Industry Policies• New regulations and subsidies to change
production techniques.• Accelerated R & D for new techniques, new
materials and alternative chemical feedstocks. • Incentives for fuel switching. • Enhancement of the European Emission
Trading Scheme (ETS) to close loopholes, eliminate auctioning, and set a tighter cap.
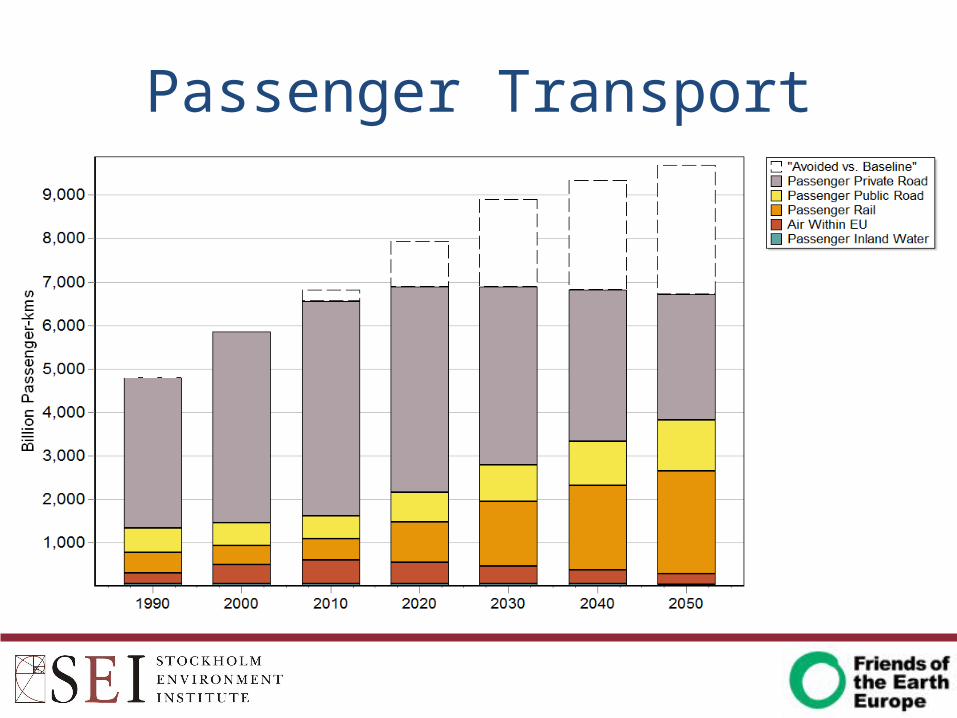
Passenger Transport

Freight Transport
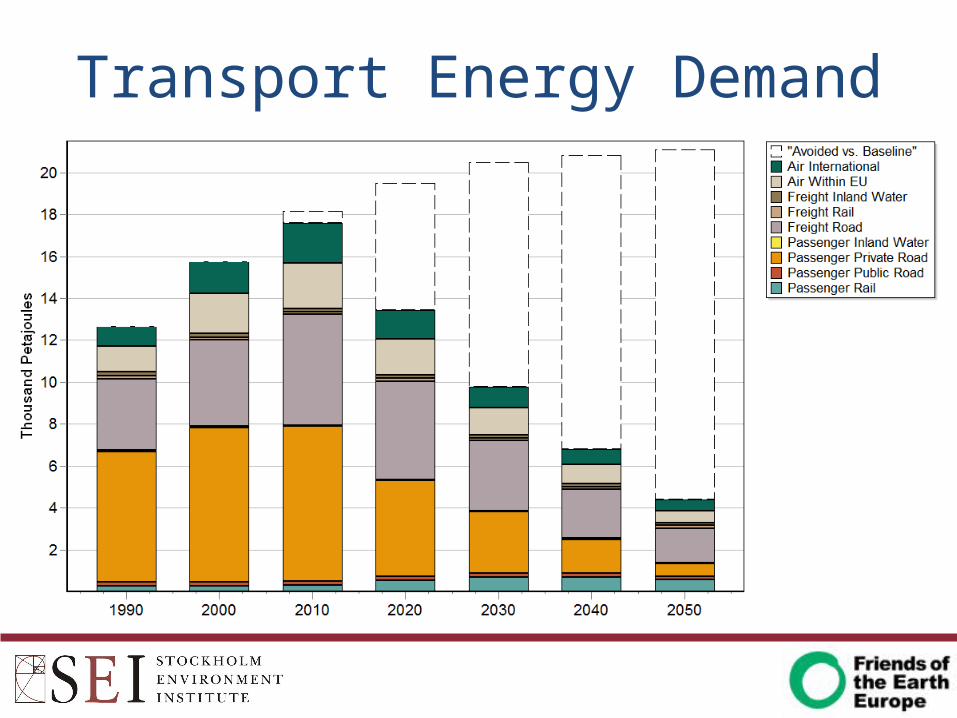
Transport Energy Demand


Key Transport Policies• Aggressive vehicle performance standards• Build-out of electric transportation infrastructure. • Expansion of rail infrastructure. • Removing subsidies (and taxing) air transport. • Better urban and land use planning to support transit-,
bicycle-, and pedestrian-friendly communities. • Congestion charges, car free city zones, road pricing, freight
charges and weight taxes.• Cutting fossil fuel subsidies and introducing carbon taxes.

Switch to Renewables for Electric Generation…
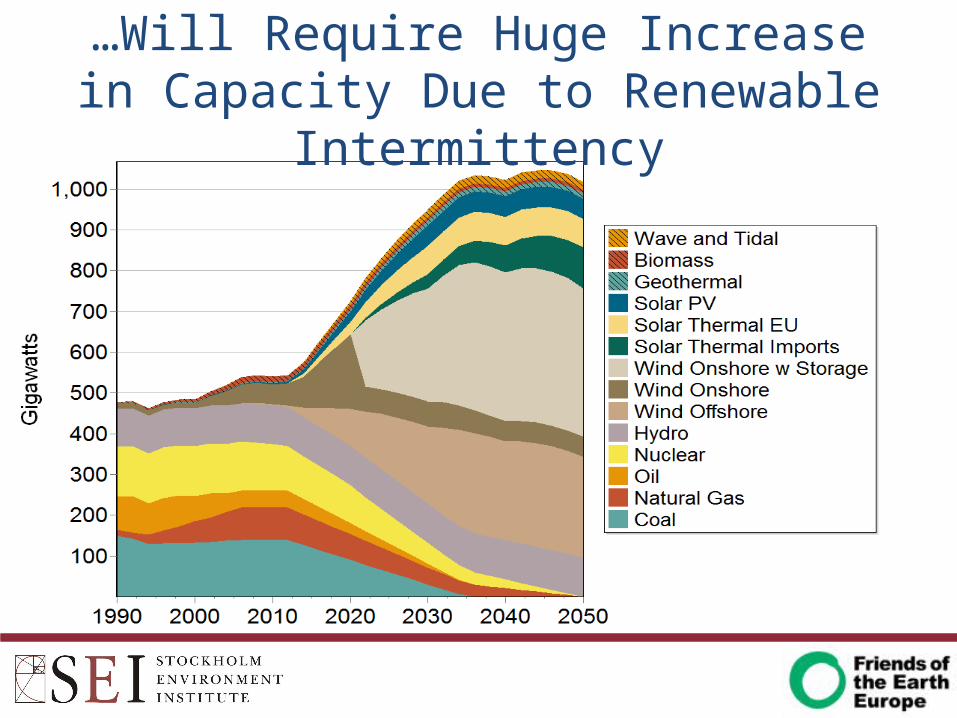
…Will Require Huge Increase in Capacity Due to Renewable Intermittency


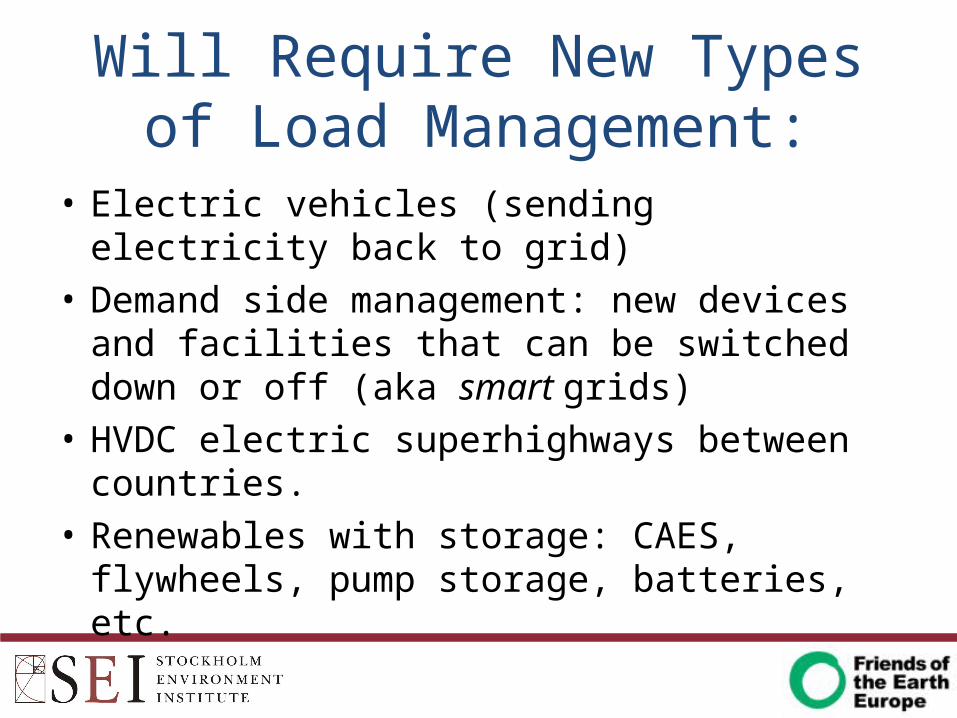
Will Require New Types of Load Management:
• Electric vehicles (sending electricity back to grid)• Demand side management: new devices and
facilities that can be switched down or off (aka smart grids)
• HVDC electric superhighways between countries.• Renewables with storage: CAES, flywheels, pump
storage, batteries, etc.

Primary Requirements Enormously Reduced…
• Coal eliminated• Nuclear phased
out• Oil and gas
massively reduced.• Large increase in
renewables especially wind.
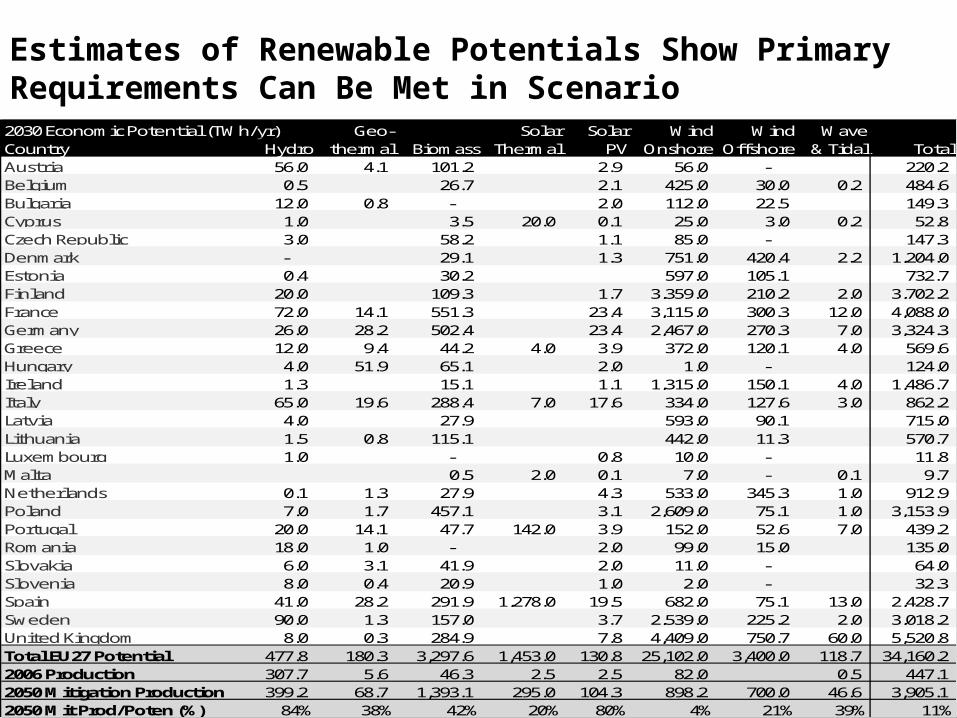
2030 Economic Potential (TWh/yr) Geo- Solar Solar Wind Wind WaveCountry Hydro thermal Biomass Thermal PV Onshore Offshore & Tidal TotalAustria 56.0 4.1 101.2 2.9 56.0 - 220.2 Belgium 0.5 26.7 2.1 425.0 30.0 0.2 484.6 Bulgaria 12.0 0.8 - 2.0 112.0 22.5 149.3 Cyprus 1.0 3.5 20.0 0.1 25.0 3.0 0.2 52.8 Czech Republic 3.0 58.2 1.1 85.0 - 147.3 Denmark - 29.1 1.3 751.0 420.4 2.2 1,204.0 Estonia 0.4 30.2 597.0 105.1 732.7 Finland 20.0 109.3 1.7 3,359.0 210.2 2.0 3,702.2 France 72.0 14.1 551.3 23.4 3,115.0 300.3 12.0 4,088.0 Germany 26.0 28.2 502.4 23.4 2,467.0 270.3 7.0 3,324.3 Greece 12.0 9.4 44.2 4.0 3.9 372.0 120.1 4.0 569.6 Hungary 4.0 51.9 65.1 2.0 1.0 - 124.0 Ireland 1.3 15.1 1.1 1,315.0 150.1 4.0 1,486.7 Italy 65.0 19.6 288.4 7.0 17.6 334.0 127.6 3.0 862.2 Latvia 4.0 27.9 593.0 90.1 715.0 Lithuania 1.5 0.8 115.1 442.0 11.3 570.7 Luxembourg 1.0 - 0.8 10.0 - 11.8 Malta 0.5 2.0 0.1 7.0 - 0.1 9.7 Netherlands 0.1 1.3 27.9 4.3 533.0 345.3 1.0 912.9 Poland 7.0 1.7 457.1 3.1 2,609.0 75.1 1.0 3,153.9 Portugal 20.0 14.1 47.7 142.0 3.9 152.0 52.6 7.0 439.2 Romania 18.0 1.0 - 2.0 99.0 15.0 135.0 Slovakia 6.0 3.1 41.9 2.0 11.0 - 64.0 Slovenia 8.0 0.4 20.9 1.0 2.0 - 32.3 Spain 41.0 28.2 291.9 1,278.0 19.5 682.0 75.1 13.0 2,428.7 Sweden 90.0 1.3 157.0 3.7 2,539.0 225.2 2.0 3,018.2 United Kingdom 8.0 0.3 284.9 7.8 4,409.0 750.7 60.0 5,520.8 Total EU27 Potential 477.8 180.3 3,297.6 1,453.0 130.8 25,102.0 3,400.0 118.7 34,160.2 2006 Production 307.7 5.6 46.3 2.5 2.5 82.0 0.5 447.1 2050 Mitigation Production 399.2 68.7 1,393.1 295.0 104.3 898.2 700.0 46.6 3,905.1 2050 Mit Prod/Poten (%) 84% 38% 42% 20% 80% 4% 21% 39% 11%
Estimates of Renewable Potentials Show Primary Requirements Can Be Met in Scenario

GHG Reductions:40% by 2020, ~ 90% by 2050
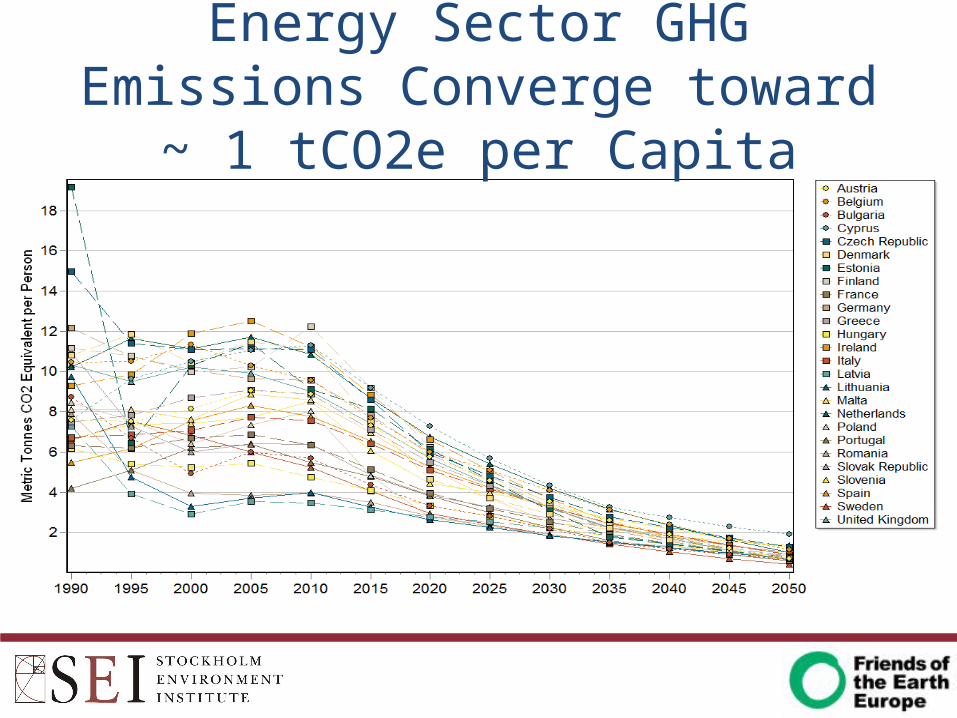
Energy Sector GHG Emissions Converge toward ~ 1 tCO2e per Capita

Costs of Mitigation• A partial estimate of cumulative incremental costs covering households,
services, transport, electric generation and avoided fuel purchases for 2010-2020 comes to €1.94 trillion, or about 1.7% of GDP over the same period (€111tn).
• A fuller accounting including industry and other sectors would be in the range of 1% to 3% of GDP - consistent with other mitigation studies. Roughly equivalent to temporarily holding GDP constant for about one year before resuming normal growth.
• To this must be added Europe’s international obligations for assisting the world’s developing nations make a transition to a low-GHG future. We estimate these to be between €150 billion and €450 billion in 2020 depending on the cost of mitigation, or a further 1% - 3% of GDP.
• Small costs when viewed in the context of the seriousness of the climate crisis.

Going Further:Options If This is Not Enough:
• Second generation biofuels to eliminate remaining oil and gas
• Biomass CHP with carbon capture and storage (CCS) for CO2-negative heat generation
• Enhancing land use sinks• New technologies such as green cements,
hydrogen, etc.

For more information:
Visit ClimateShareEurope.org to access:– The full report.– This presentation.– LEAP software and the LEAP data set for this
analysis.– Detailed results tables as Excel spreadsheets.
Contact the authors at:– [email protected]