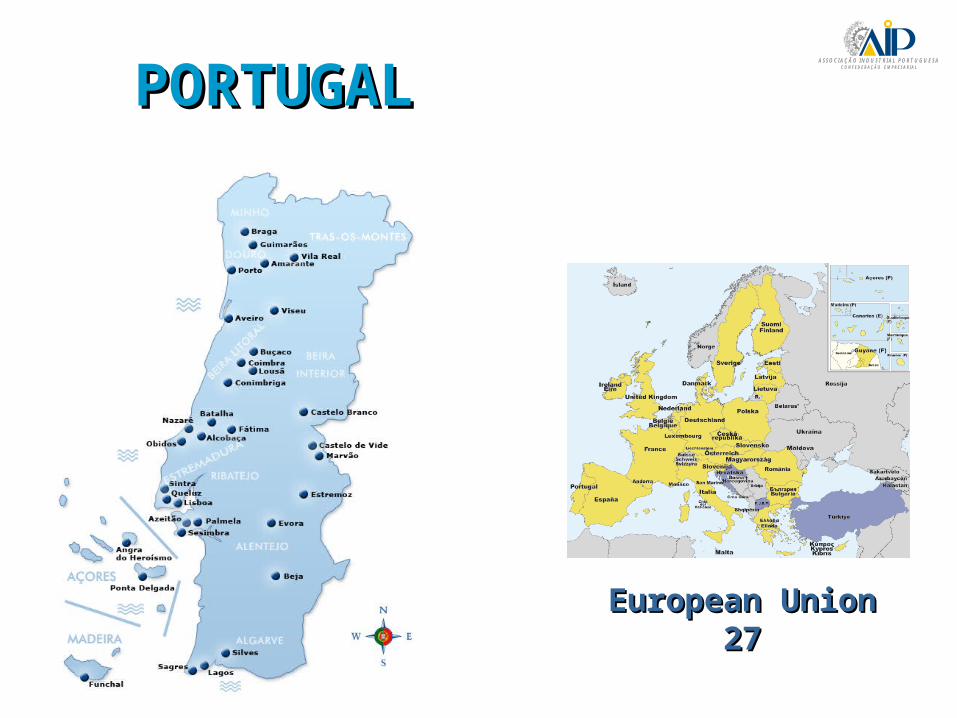
european union 27 portugal portugal economy overview economy overview
TRANSCRIPT

A SSO C I A Ç Ã O I N D U ST R I A L P O R T U G U E SAC O N F E D E R A Ç Ã O E M P R E SA R I A L
A SSO C I A Ç Ã O I N D U ST R I A L P O R T U G U E SAC O N F E D E R A Ç Ã O E M P R E SA R I A L
European Union 27European Union 27
PORTUGALPORTUGAL

PORTUGALPORTUGAL
ECONOMY OVERVIEWECONOMY OVERVIEW
A SSO C I A Ç Ã O I N D U ST R I A L P O R T U G U E SAC O N F E D E R A Ç Ã O E M P R E SA R I A L
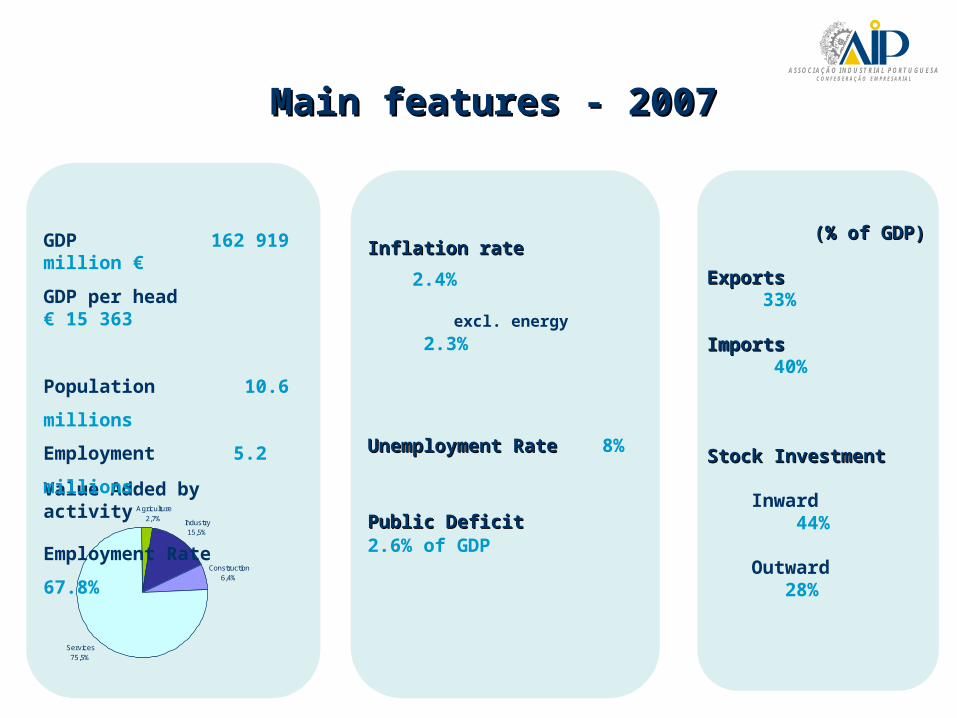
Inflation rateInflation rate 2.4%
excl. energy 2.3%
Unemployment Rate Unemployment Rate 8%
Public DeficitPublic Deficit 2.6% of GDP
(% of GDP)(% of GDP)
ExportsExports 33%
ImportsImports 40%
Stock InvestmentStock Investment
Inward 44%
Outward 28%
Main features - 2007Main features - 2007A SSO C I A Ç Ã O I N D U ST R I A L P O R T U G U E SA
C O N F E D E R A Ç Ã O E M P R E SA R I A L
Services75,5%
Construction 6,4%
Agriculture2,7% Industry
15,5%
Value Added by activity
GDP 162 919 million €
GDP per head € 15 363
Population 10.6 millions
Employment 5.2 millions
Employment Rate 67.8%

GROSS DOMESTIC PRODUCTGROSS DOMESTIC PRODUCTReal growth rateReal growth rate
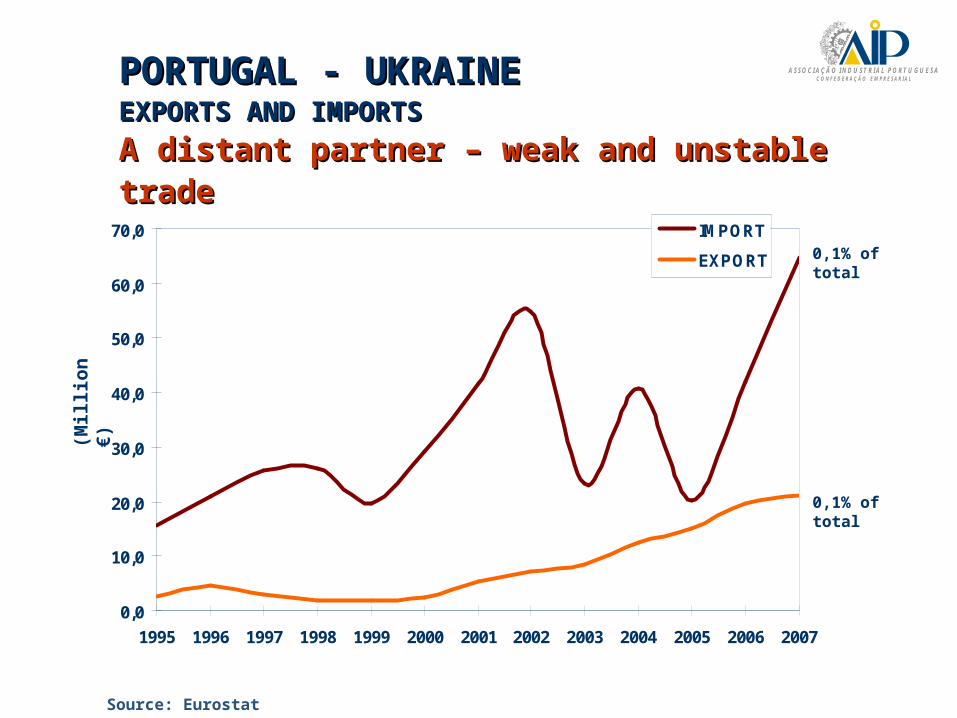
Source: Eurostat
A SSO C I A Ç Ã O I N D U ST R I A L P O R T U G U E SAC O N F E D E R A Ç Ã O E M P R E SA R I A L
-2,0
0,0
2,0
4,0
6,0
19
96
19
97
19
98
19
99
20
00
20
01
20
02
20
03
20
04
20
05
20
06
20
07
Portugal
EU 15

Source: INE
A SSO C I A Ç Ã O I N D U ST R I A L P O R T U G U E SAC O N F E D E R A Ç Ã O E M P R E SA R I A LMain Sectors - 2007 Main Sectors - 2007
EXPORTS AND IMPORTS STRUTUREEXPORTS AND IMPORTS STRUTURE
0% 5% 10% 15% 20%
Footwear
Wood and Cork
Mineral fuels
Paper
Textiles
Food industries
Chemical products
Plastic and Rubber
Clothing
Base metals
Transport Equipment
Machinery
Exports
Imports
(% total)
Automotive
Biotechnology
Forestry
Moulds
Technicalfabrics

Source: Balance of Payments, Banco de Portugal
A SSO C I A Ç Ã O I N D U ST R I A L P O R T U G U E SAC O N F E D E R A Ç Ã O E M P R E SA R I A LEXPORTS OF SERVICES EXPORTS OF SERVICES
... leading niche provider... leading niche provider
3,8
10,0
0,0
2,0
4,0
6,0
8,0
10,0
12,0
1996 2007
(%)
(% GDP)
InformationTechnology
Engineering
CommunicationTechnology
Tourism
Buildingfixtures

RENEWABLE ENERGYRENEWABLE ENERGYA SSO C I A Ç Ã O I N D U ST R I A L P O R T U G U E SA
C O N F E D E R A Ç Ã O E M P R E SA R I A L
Share of renewable energy ingross electric consumption - 2006
1st Austria 53.4%2nd Sweden 46.8%3rd Portugal 30.6%EU 15 14.9%
windwindhydrohydro
solarsolar
wavewave
biomassbiomass
4th world wind energy producer

PORTUGALPORTUGAL
MAIN STRENGHTSMAIN STRENGHTS
A SSO C I A Ç Ã O I N D U ST R I A L P O R T U G U E SAC O N F E D E R A Ç Ã O E M P R E SA R I A L

THE CAPACITY OF CHANGINGTHE CAPACITY OF CHANGING
e-Government availability
e-Government Sophistication
Technological Plan fostering company innovation and broadband Investment
Administrative Simplification – Company on time
ATM - 12 000 equipments 30 services provided
ID Centers of several multinational companies
Portugal Spain Ireland EU 27
70% 50%
90%
59%
Portugal Spain Ireland EU 27
82% 78%
90%
77%
A SSO C I A Ç Ã O I N D U ST R I A L P O R T U G U E SAC O N F E D E R A Ç Ã O E M P R E SA R I A L

A PEACEFUL COUNTRY TO INVESTA PEACEFUL COUNTRY TO INVEST
Source: Global Peace Index 2008 Economist Intelligence Unit Nations considered the most peaceful have lower index scores
• Portugal is the 7th most peacefulcountry in the World
Committed to the European Growth and Stability Pact
Quality of life
Diversity of qualified, multilingual workforce
Suppliers capacity for big corporations
CountryRank Score
Japan
Iceland
Denmark
Norway
New Zeland
Ireland
Portugal
1
2
3
4
5
6
7
1.176
1.333
1.343
1.350
1.358
1.410
1.412
A SSO C I A Ç Ã O I N D U ST R I A L P O R T U G U E SAC O N F E D E R A Ç Ã O E M P R E SA R I A L

A GEOSTRATEGIC LOCATIONA GEOSTRATEGIC LOCATION
• New stage on Globalisation - late 90’s• Main investor in Brazil, Angola…
Source: Bank of Portugal
Portuguese Speaking Countries
Access to 230 Millions Consumers
Logistic Platforms Network and privileged access
Most modern telecom networks
Strong investment in all Portuguese speaking countries
Angola 696,8Brazil 1 210,1Cape Verde 81,8Mozambique 83,2
(Millions € 2004 to 2006)
A SSO C I A Ç Ã O I N D U ST R I A L P O R T U G U E SAC O N F E D E R A Ç Ã O E M P R E SA R I A L

Portugal – UkrainePortugal – Ukraine
Economic PartnersEconomic Partners
A SSO C I A Ç Ã O I N D U ST R I A L P O R T U G U E SAC O N F E D E R A Ç Ã O E M P R E SA R I A L
(Mil
lio
n €
)
Source: Eurostat
PORTUGAL - UKRAINEPORTUGAL - UKRAINE EXPORTS AND IMPORTSEXPORTS AND IMPORTS
0,0
10,0
20,0
30,0
40,0
50,0
60,0
70,0
1995 1996 1997 1998 1999 2000 2001 2002 2003 2004 2005 2006 2007
IMPORT
EXPORT
A SSO C I A Ç Ã O I N D U ST R I A L P O R T U G U E SAC O N F E D E R A Ç Ã O E M P R E SA R I A L
0,1% of total
0,1% of total
A distant partner – weak and unstable trade A distant partner – weak and unstable trade

PORTUGAL – UKRAINEPORTUGAL – UKRAINE
EXPORTS AND IMPORTS - MAIN PRODUCTS - 2007EXPORTS AND IMPORTS - MAIN PRODUCTS - 2007
(% of total)
A SSO C I A Ç Ã O I N D U ST R I A L P O R T U G U E SAC O N F E D E R A Ç Ã O E M P R E SA R I A L
Source: Eurostat
IMPORTSIMPORTS EXPORTSEXPORTS
… … a highly concentrated trade a highly concentrated trade
43,8
13,2
1,41,2 1,0 Oil seeds and
oleaginous fruits
Animal or vegetablefats and oils
Iron and steel
Salt; Sulphur; Earthsand Stone
Fertilisers
29,5
17,7
5,6
7,3
7,3
Cork
Machinery andmechanical appliances
Footwear
Vehicles
Ceramic products

A SSO C I A Ç Ã O I N D U ST R I A L P O R T U G U E SAC O N F E D E R A Ç Ã O E M P R E SA R I A LTRADE AND INVESTMENTTRADE AND INVESTMENT
• low starting pointlow starting point
• recent positive evolutionrecent positive evolution
POTENTIAL IS HIGHPOTENTIAL IS HIGH
WE MUST SEIZE BUSINESS WE MUST SEIZE BUSINESS OPPORTUNITIES OPPORTUNITIES
.... BILATERALLY AND WITH THIRD .... BILATERALLY AND WITH THIRD COUNTRIESCOUNTRIES
PORTUGAL and UKRAINE PORTUGAL and UKRAINE FULL PLAYERS IN THE GLOBAL FULL PLAYERS IN THE GLOBAL ECONOMYECONOMY

A SSO C I A Ç Ã O I N D U ST R I A L P O R T U G U E SAC O N F E D E R A Ç Ã O E M P R E SA R I A L