european lift statistics - asansoristanbul · european lift statistics asansÖr, istanbul ... spain...
TRANSCRIPT
European Lift Statistics
ASANSÖR, Istanbul 24 Mart 2017
Ebru Gemici-Loukas, VDMA
Ebru Gemici-Loukas- ASANSÖR - 24 March 2017, Istanbul
Basic and Industrial Statistics 2015
Ebru Gemici-Loukas- ASANSÖR - 24 March 2017, Istanbul
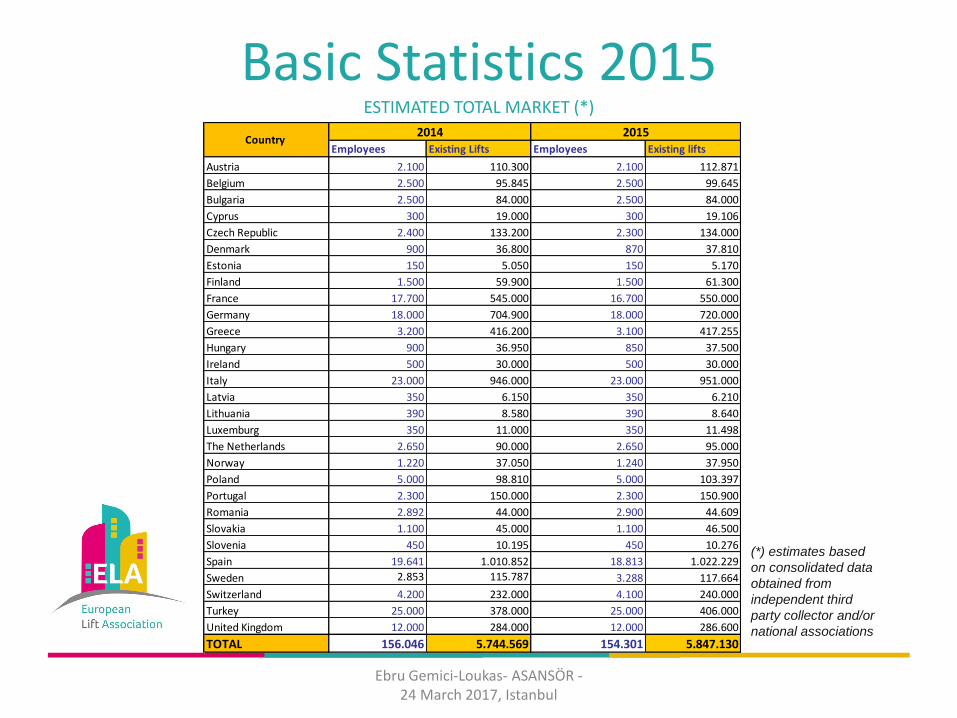
Basic Statistics 2015 ESTIMATED TOTAL MARKET (*)
(*) estimates based
on consolidated data
obtained from
independent third
party collector and/or
national associations
Ebru Gemici-Loukas- ASANSÖR - 24 March 2017, Istanbul
Employees Existing Lifts Employees Existing lifts
Austria 2.100 110.300 2.100 112.871
Belgium 2.500 95.845 2.500 99.645
Bulgaria 2.500 84.000 2.500 84.000
Cyprus 300 19.000 300 19.106
Czech Republic 2.400 133.200 2.300 134.000
Denmark 900 36.800 870 37.810
Estonia 150 5.050 150 5.170
Finland 1.500 59.900 1.500 61.300
France 17.700 545.000 16.700 550.000
Germany 18.000 704.900 18.000 720.000
Greece 3.200 416.200 3.100 417.255
Hungary 900 36.950 850 37.500
Ireland 500 30.000 500 30.000
Italy 23.000 946.000 23.000 951.000
Latvia 350 6.150 350 6.210
Lithuania 390 8.580 390 8.640
Luxemburg 350 11.000 350 11.498
The Netherlands 2.650 90.000 2.650 95.000
Norway 1.220 37.050 1.240 37.950
Poland 5.000 98.810 5.000 103.397
Portugal 2.300 150.000 2.300 150.900
Romania 2.892 44.000 2.900 44.609
Slovakia 1.100 45.000 1.100 46.500
Slovenia 450 10.195 450 10.276
Spain 19.641 1.010.852 18.813 1.022.229
Sweden 2.853 115.787 3.288 117.664
Switzerland 4.200 232.000 4.100 240.000
Turkey 25.000 378.000 25.000 406.000
United Kingdom 12.000 284.000 12.000 286.600
TOTAL 156.046 5.744.569 154.301 5.847.130
2014 2015Country
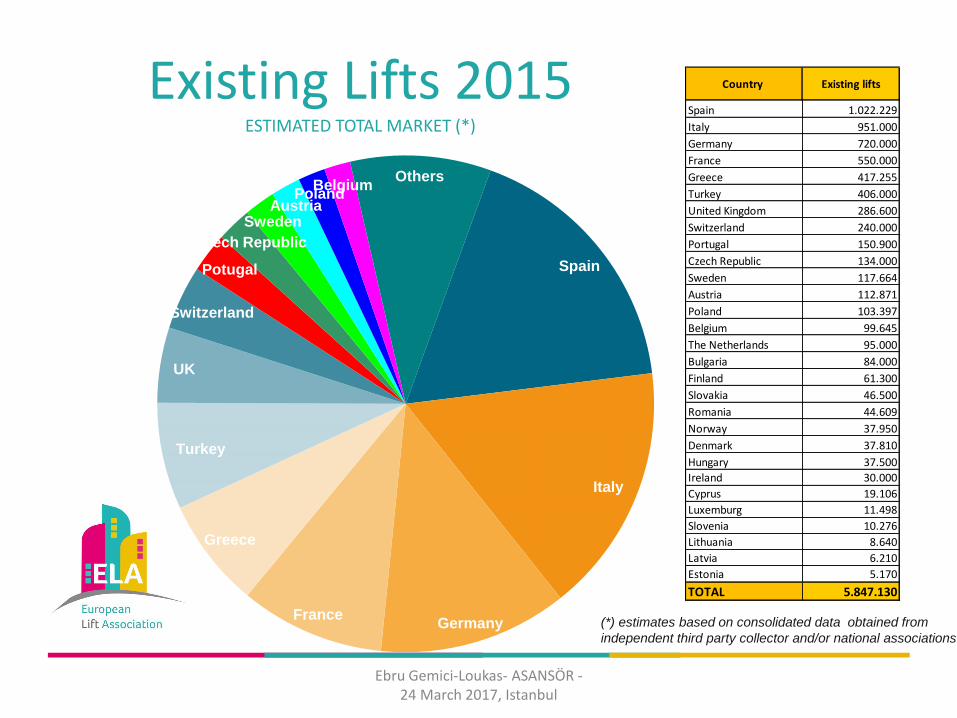
Existing Lifts 2015 ESTIMATED TOTAL MARKET (*)
(*) estimates based on consolidated data obtained from
independent third party collector and/or national associations
Ebru Gemici-Loukas- ASANSÖR - 24 March 2017, Istanbul
Spain
Italy
Germany France
Greece
Turkey
UK
Switzerland
Potugal
Czech Republic
Sweden Austria
Poland Belgium
Others
Spain 1.022.229
Italy 951.000
Germany 720.000
France 550.000
Greece 417.255
Turkey 406.000
United Kingdom 286.600
Switzerland 240.000
Portugal 150.900
Czech Republic 134.000
Sweden 117.664
Austria 112.871
Poland 103.397
Belgium 99.645
The Netherlands 95.000
Bulgaria 84.000
Finland 61.300
Slovakia 46.500
Romania 44.609
Norway 37.950
Denmark 37.810
Hungary 37.500
Ireland 30.000
Cyprus 19.106
Luxemburg 11.498
Slovenia 10.276
Lithuania 8.640
Latvia 6.210
Estonia 5.170
TOTAL 5.847.130
Country Existing lifts

Existing Escalators 2015 ESTIMATED TOTAL MARKET (*)
(*) estimates based
on consolidated data
obtained from
independent third
party collector and/or
national associations
Ebru Gemici-Loukas- ASANSÖR - 24 March 2017, Istanbul
2014 2015
Existing Escalators Existing Escalators
Austria 3.050 3.050
Belgium 2.375 2.450
Bulgaria
Cyprus 170 170
Czech Republic 2.400 2.440
Denmark 880 1.005
Estonia 240 260
Finland 2.100 2.200
France 9.000 9.300
Germany 35.000 35.330
Greece 3.200 3.200
Hungary 1.000 1.020
Ireland 500 500
Italy 10.000 10.000
Latvia 185 185
Lithuania 156 156
Luxemburg 135 135
The Netherlands 3.850 4.050
Norway 1.470 1.545
Poland 2.420 3.237
Portugal 2.780 2.800
Romania
Slovakia 650 650
Slovenia
Spain 14.318 14.583
Sweden 3.136 3.243
Switzerland 4.400 4.500
Turkey 18.300 20.500
United Kingdom 7.600 7.790
TOTAL 129.315 134.299
Country
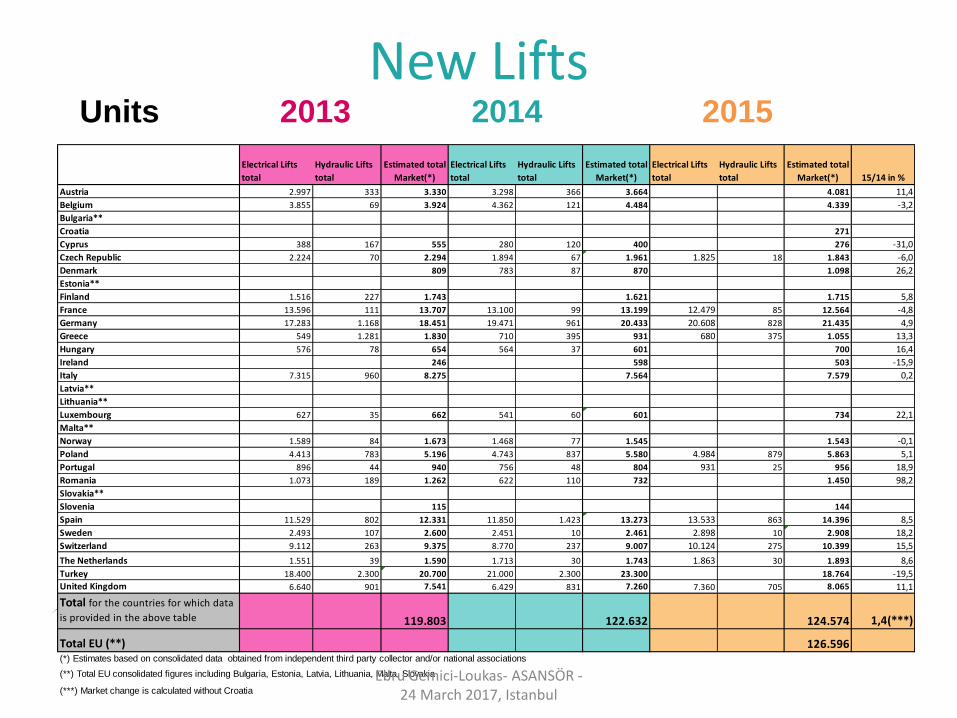
New Lifts Units 2013 2014 2015
Electrical Lifts
total
Hydraulic Lifts
total
Estimated total
Market(*)
Electrical Lifts
total
Hydraulic Lifts
total
Estimated total
Market(*)
Electrical Lifts
total
Hydraulic Lifts
total
Estimated total
Market(*) 15/14 in %
Austria 2.997 333 3.330 3.298 366 3.664 4.081 11,4
Belgium 3.855 69 3.924 4.362 121 4.484 4.339 -3,2
Bulgaria**
Croatia 271
Cyprus 388 167 555 280 120 400 276 -31,0
Czech Republic 2.224 70 2.294 1.894 67 1.961 1.825 18 1.843 -6,0
Denmark 809 783 87 870 1.098 26,2
Estonia**
Finland 1.516 227 1.743 1.621 1.715 5,8
France 13.596 111 13.707 13.100 99 13.199 12.479 85 12.564 -4,8
Germany 17.283 1.168 18.451 19.471 961 20.433 20.608 828 21.435 4,9
Greece 549 1.281 1.830 710 395 931 680 375 1.055 13,3
Hungary 576 78 654 564 37 601 700 16,4
Ireland 246 598 503 -15,9
Italy 7.315 960 8.275 7.564 7.579 0,2
Latvia**
Lithuania**
Luxembourg 627 35 662 541 60 601 734 22,1
Malta**
Norway 1.589 84 1.673 1.468 77 1.545 1.543 -0,1
Poland 4.413 783 5.196 4.743 837 5.580 4.984 879 5.863 5,1
Portugal 896 44 940 756 48 804 931 25 956 18,9
Romania 1.073 189 1.262 622 110 732 1.450 98,2
Slovakia**
Slovenia 115 144
Spain 11.529 802 12.331 11.850 1.423 13.273 13.533 863 14.396 8,5
Sweden 2.493 107 2.600 2.451 10 2.461 2.898 10 2.908 18,2
Switzerland 9.112 263 9.375 8.770 237 9.007 10.124 275 10.399 15,5
The Netherlands 1.551 39 1.590 1.713 30 1.743 1.863 30 1.893 8,6
Turkey 18.400 2.300 20.700 21.000 2.300 23.300 18.764 -19,5
United Kingdom 6.640 901 7.541 6.429 831 7.260 7.360 705 8.065 11,1
Total for the countries for which data
is provided in the above table 119.803 122.632 124.574 1,4(***)
Total EU (**) 126.596
(**) Total EU consolidated figures including Bulgaria, Estonia, Latvia, Lithuania, Malta, Slovakia
(***) Market change is calculated without Croatia
(*) Estimates based on consolidated data obtained from independent third party collector and/or national associations
Ebru Gemici-Loukas- ASANSÖR - 24 March 2017, Istanbul
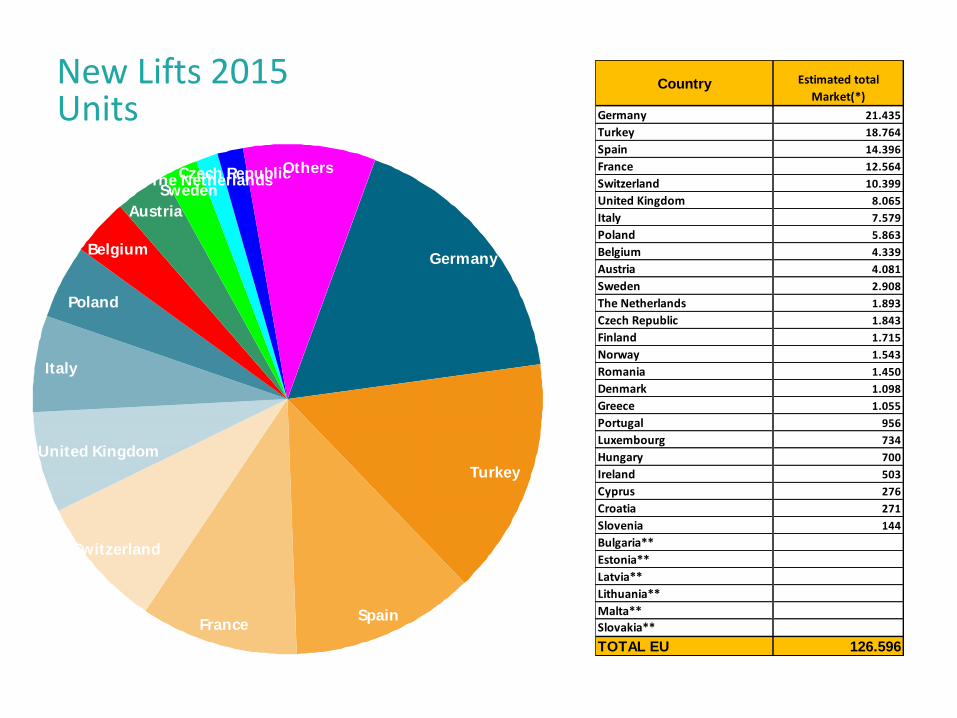
New Lifts 2015 Units
Turkey
SpainFrance
Switzerland
United Kingdom
Italy
Poland
Belgium
Austria
SwedenThe NetherlandsCzech RepublicOthers
Germany
(*) estimates based on consolidated data obtained from
independent third party collector and/or national associations
Country Estimated total
Market(*)
Germany 21.435
Turkey 18.764
Spain 14.396
France 12.564
Switzerland 10.399
United Kingdom 8.065
Italy 7.579
Poland 5.863
Belgium 4.339
Austria 4.081
Sweden 2.908
The Netherlands 1.893
Czech Republic 1.843
Finland 1.715
Norway 1.543
Romania 1.450
Denmark 1.098
Greece 1.055
Portugal 956
Luxembourg 734
Hungary 700
Ireland 503
Cyprus 276
Croatia 271
Slovenia 144
Bulgaria**
Estonia**
Latvia**
Lithuania**
Malta**
Slovakia**
TOTAL EU 126.596
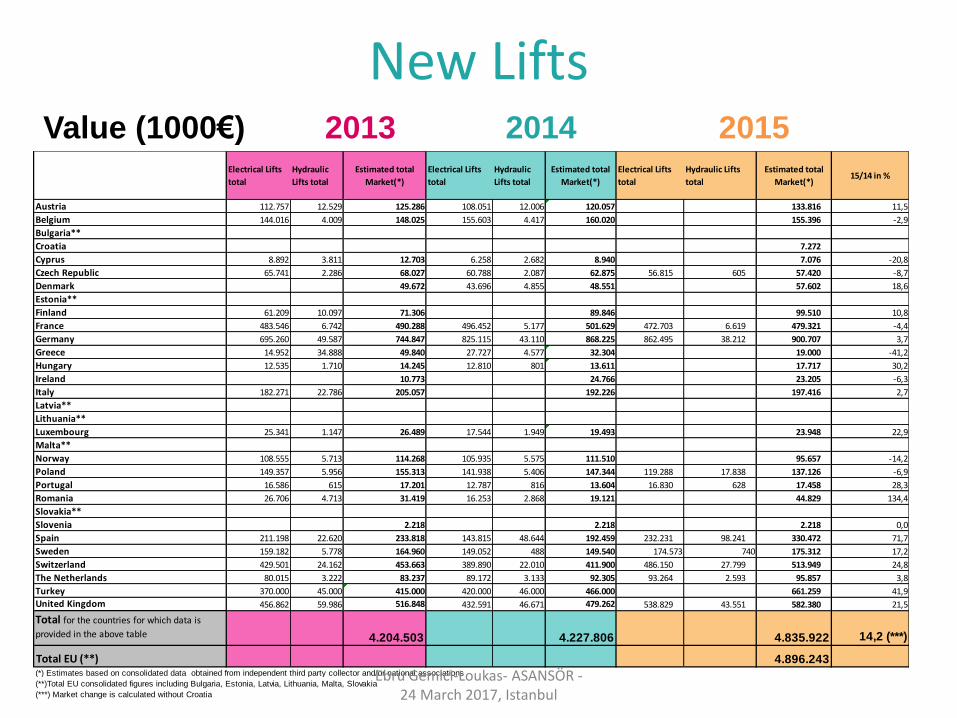
New Lifts Value (1000€) 2013 2014 2015
Electrical Lifts
total
Hydraulic
Lifts total
Estimated total
Market(*)
Electrical Lifts
total
Hydraulic
Lifts total
Estimated total
Market(*)
Electrical Lifts
total
Hydraulic Lifts
total
Estimated total
Market(*)15/14 in %
Austria 112.757 12.529 125.286 108.051 12.006 120.057 133.816 11,5
Belgium 144.016 4.009 148.025 155.603 4.417 160.020 155.396 -2,9
Bulgaria**
Croatia 7.272
Cyprus 8.892 3.811 12.703 6.258 2.682 8.940 7.076 -20,8
Czech Republic 65.741 2.286 68.027 60.788 2.087 62.875 56.815 605 57.420 -8,7
Denmark 49.672 43.696 4.855 48.551 57.602 18,6
Estonia**
Finland 61.209 10.097 71.306 89.846 99.510 10,8
France 483.546 6.742 490.288 496.452 5.177 501.629 472.703 6.619 479.321 -4,4
Germany 695.260 49.587 744.847 825.115 43.110 868.225 862.495 38.212 900.707 3,7
Greece 14.952 34.888 49.840 27.727 4.577 32.304 19.000 -41,2
Hungary 12.535 1.710 14.245 12.810 801 13.611 17.717 30,2
Ireland 10.773 24.766 23.205 -6,3
Italy 182.271 22.786 205.057 192.226 197.416 2,7
Latvia**
Lithuania**
Luxembourg 25.341 1.147 26.489 17.544 1.949 19.493 23.948 22,9
Malta**
Norway 108.555 5.713 114.268 105.935 5.575 111.510 95.657 -14,2
Poland 149.357 5.956 155.313 141.938 5.406 147.344 119.288 17.838 137.126 -6,9
Portugal 16.586 615 17.201 12.787 816 13.604 16.830 628 17.458 28,3
Romania 26.706 4.713 31.419 16.253 2.868 19.121 44.829 134,4
Slovakia**
Slovenia 2.218 2.218 2.218 0,0
Spain 211.198 22.620 233.818 143.815 48.644 192.459 232.231 98.241 330.472 71,7
Sweden 159.182 5.778 164.960 149.052 488 149.540 174.573 740 175.312 17,2
Switzerland 429.501 24.162 453.663 389.890 22.010 411.900 486.150 27.799 513.949 24,8
The Netherlands 80.015 3.222 83.237 89.172 3.133 92.305 93.264 2.593 95.857 3,8
Turkey 370.000 45.000 415.000 420.000 46.000 466.000 661.259 41,9
United Kingdom 456.862 59.986 516.848 432.591 46.671 479.262 538.829 43.551 582.380 21,5
Total for the countries for which data is
provided in the above table 4.204.503 4.227.806 4.835.922 14,2 (***)
Total EU (**) 4.896.243
(**)Total EU consolidated figures including Bulgaria, Estonia, Latvia, Lithuania, Malta, Slovakia
(***) Market change is calculated without Croatia
(*) Estimates based on consolidated data obtained from independent third party collector and/or national associationsEbru Gemici-Loukas- ASANSÖR - 24 March 2017, Istanbul
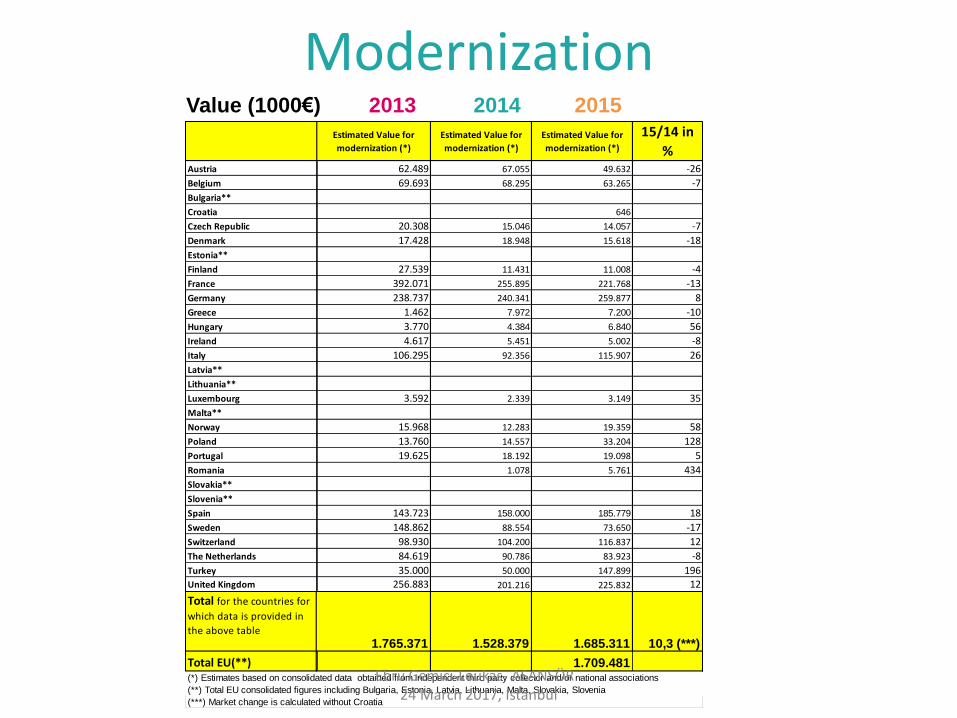
Modernization Value (1000€) 2013 2014 2015
Estimated Value for
modernization (*)
Estimated Value for
modernization (*)
Estimated Value for
modernization (*)
15/14 in
%Austria 62.489 67.055 49.632 -26
Belgium 69.693 68.295 63.265 -7
Bulgaria**
Croatia 646
Czech Republic 20.308 15.046 14.057 -7
Denmark 17.428 18.948 15.618 -18
Estonia**
Finland 27.539 11.431 11.008 -4
France 392.071 255.895 221.768 -13
Germany 238.737 240.341 259.877 8
Greece 1.462 7.972 7.200 -10
Hungary 3.770 4.384 6.840 56
Ireland 4.617 5.451 5.002 -8
Italy 106.295 92.356 115.907 26
Latvia**
Lithuania**
Luxembourg 3.592 2.339 3.149 35
Malta**
Norway 15.968 12.283 19.359 58
Poland 13.760 14.557 33.204 128
Portugal 19.625 18.192 19.098 5
Romania 1.078 5.761 434
Slovakia**
Slovenia**
Spain 143.723 158.000 185.779 18
Sweden 148.862 88.554 73.650 -17
Switzerland 98.930 104.200 116.837 12
The Netherlands 84.619 90.786 83.923 -8
Turkey 35.000 50.000 147.899 196United Kingdom 256.883 201.216 225.832 12
Total for the countries for
which data is provided in
the above table
1.765.371 1.528.379 1.685.311 10,3 (***)
Total EU(**) 1.709.481
(**) Total EU consolidated figures including Bulgaria, Estonia, Latvia, Lithuania, Malta, Slovakia, Slovenia
(*) Estimates based on consolidated data obtained from independent third party collector and/or national associations
(***) Market change is calculated without Croatia
Ebru Gemici-Loukas- ASANSÖR - 24 March 2017, Istanbul

Escalators Units
2013 2014 2015
(**) Total EU consolidated figures including countries for which data is not provided in the table.
(*) Estimates based on consolidated data obtained from independent third party collector and/or national associations.
Escalators Units Estimated total
Market (*)
Estimated total
Market (*)
Estimated total
Market (*)
Austria** 47 136Belgium** 76 70Cyprus**Czech Republic** 97 17Denmark** 168 34Estonia** 38 10Finland** 117 78France 578 582 474Germany 603 500 501Hungary** NAItaly** 325 318Latvia**Lithuania** 9 9Norway** 283 130Poland 231 191 299Portugal**Romania 171 170 323Slovakia** 33 33Spain 256 187 265Sweden 153 160 134Switzerland 152 145 86
The Netherlands 245 147 189
Turkey 2.300 1.400 1.012
United Kingdom 332 271 280
TOTAL for the countries for which
data is provided in the above table 6.214 4.587 3.563
TOTAL EU (**) 4.719
Ebru Gemici-Loukas- ASANSÖR - 24 March 2017, Istanbul

Escalators Value
Ebru Gemici-Loukas- ASANSÖR - 24 March 2017, Istanbul
(*) Estimates based on consolidated data obtained from independent third party collector and/or national associations.
(**) Total EU consolidated figures including countries for which data is not provided in the table.
2014 2015
Escalators Value (1000 €) Estimated total Market
(*) Estimated total Market (*)
Austria** 7.834
Belgium** 4.546
Czech Republic** 786
Denmark** 2.460
Estonia** 500
Finland** 5.165
France 69.775 54.622
Germany 41.051 73.172
Italy** 23.782
Latvia**
Lithuania** 300
Norway** 20.635
Poland 9.614 12.557
Romania 8.167 18.880
Spain 8.302 22.801
Sweden 26.142 25.766
Switzerland 11.836 7.276
The Netherlands 10.444 10.728
Turkey 60.000 41.227
United Kingdom 27.884 25.479
TOTAL for the countries for which
data is provided in the above table 339.223 292.508
TOTAL EU (**) 373.325
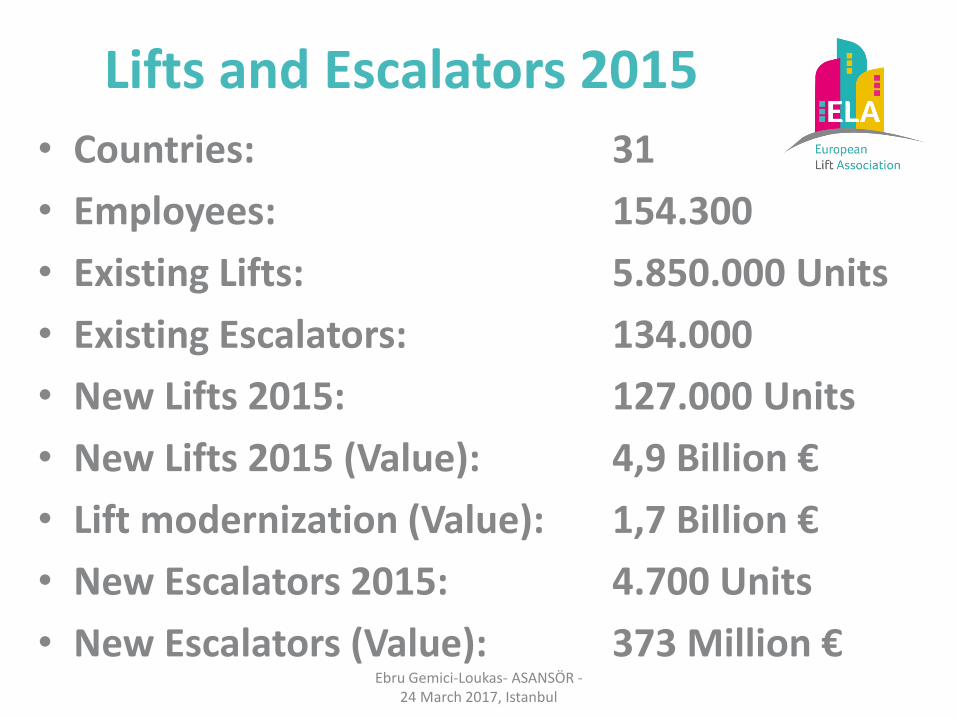
Lifts and Escalators 2015 • Countries: 31
• Employees: 154.300
• Existing Lifts: 5.850.000 Units
• Existing Escalators: 134.000
• New Lifts 2015: 127.000 Units
• New Lifts 2015 (Value): 4,9 Billion €
• Lift modernization (Value): 1,7 Billion €
• New Escalators 2015: 4.700 Units
• New Escalators (Value): 373 Million €
Ebru Gemici-Loukas- ASANSÖR - 24 March 2017, Istanbul
Accidents of Lifts and Escalators 2015
Ebru Gemici-Loukas- ASANSÖR - 24 March 2017, Istanbul
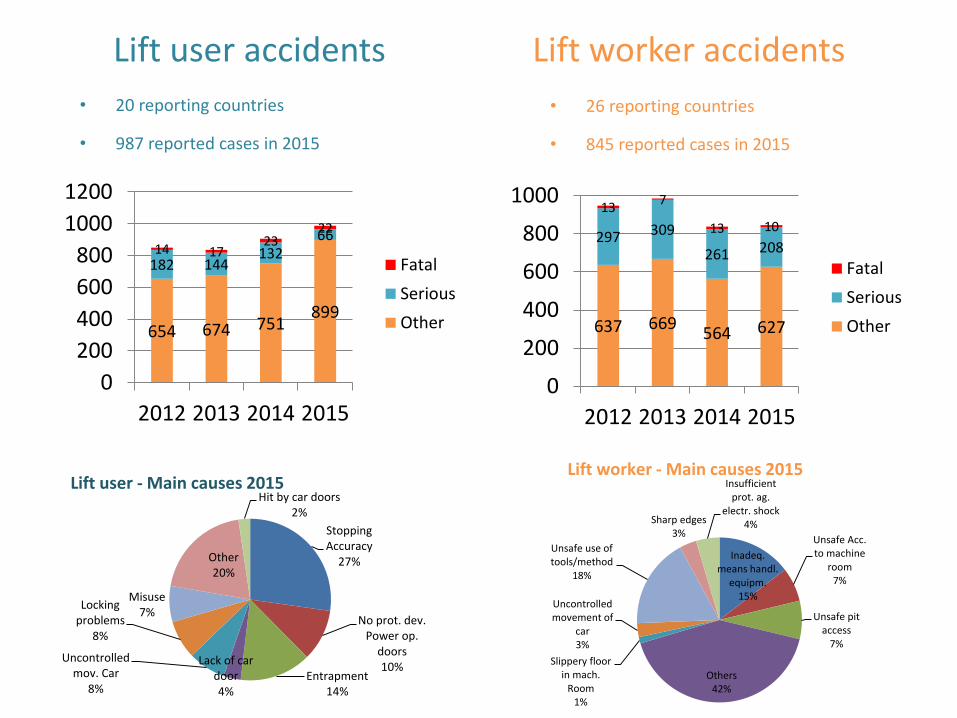
Lift user accidents
• 20 reporting countries
• 987 reported cases in 2015
654 674 751 899
182 144 132
66 14 17
23 22
0
200
400
600
800
1000
1200
2012 2013 2014 2015
Fatal
Serious
Other
Stopping Accuracy
27%
No prot. dev. Power op.
doors 10%
Entrapment 14%
Lack of car door 4%
Uncontrolled mov. Car
8%
Locking problems
8%
Misuse 7%
Other 20%
Hit by car doors 2%
Lift user - Main causes 2015
Lift worker accidents
• 26 reporting countries
• 845 reported cases in 2015
637 669 564 627
297 309
261 208
13 7
13 10
0
200
400
600
800
1000
2012 2013 2014 2015
Fatal
Serious
Other
Inadeq. means handl.
equipm. 15%
Unsafe Acc. to machine
room 7%
Unsafe pit access
7%
Others 42%
Slippery floor in mach.
Room 1%
Uncontrolled movement of
car 3%
Unsafe use of tools/method
18%
Sharp edges 3%
Insufficient prot. ag.
electr. shock 4%
Lift worker - Main causes 2015
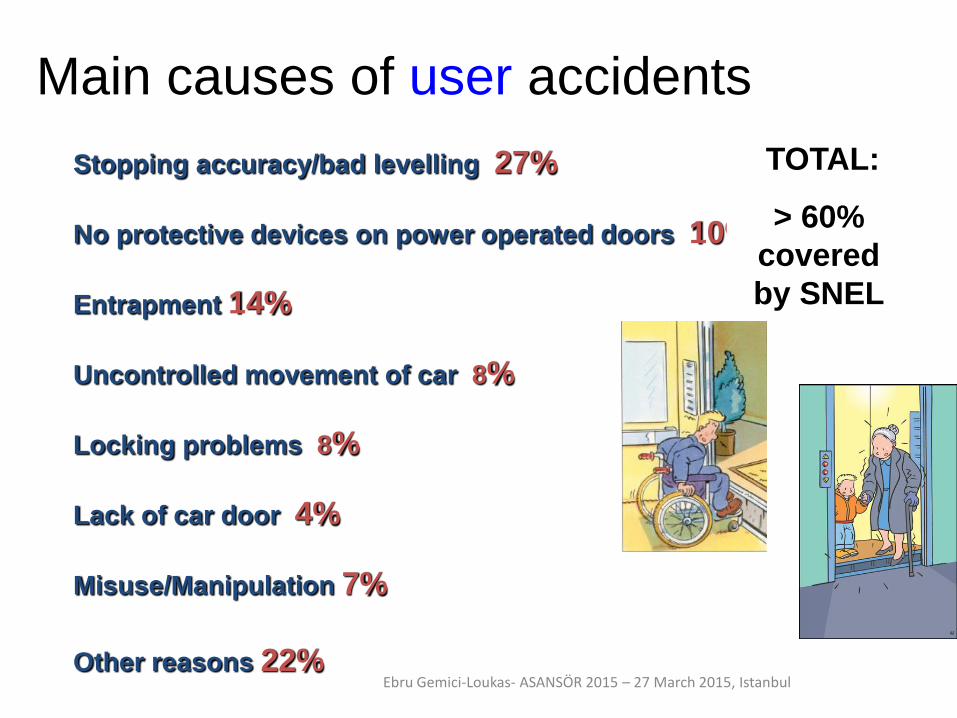
Main causes of user accidents
Stopping accuracy/bad levelling 27%
No protective devices on power operated doors 10%
Entrapment 14%
Uncontrolled movement of car 8%
Locking problems 8%
Lack of car door 4%
Misuse/Manipulation 7%
Other reasons 22%
TOTAL:
> 60%
covered
by SNEL
Ebru Gemici-Loukas- ASANSÖR 2015 – 27 March 2015, Istanbul
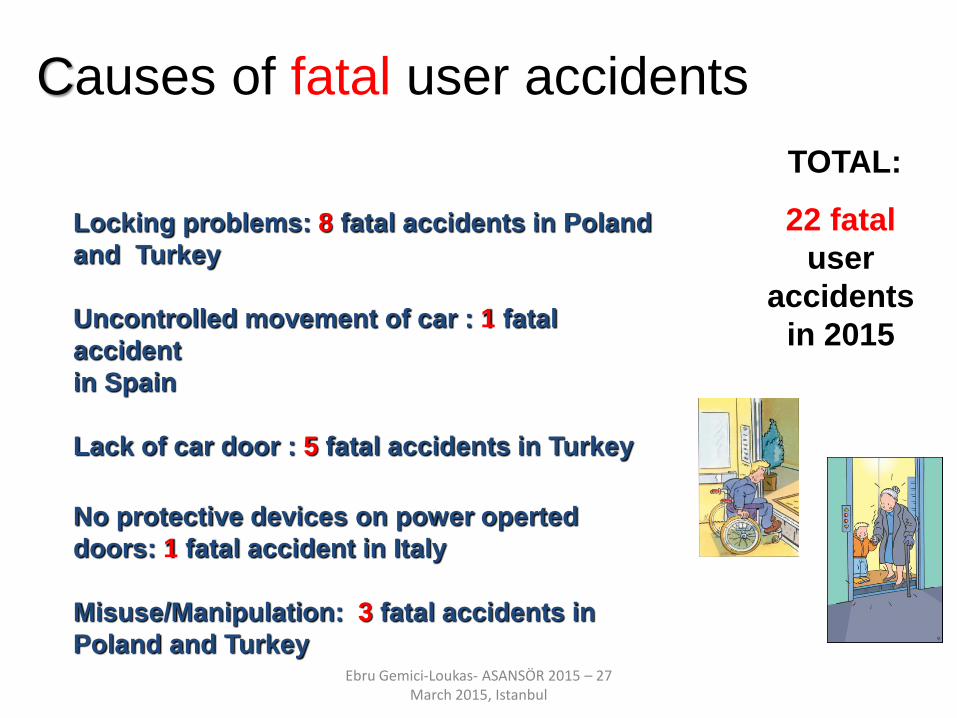
Causes of fatal user accidents
Locking problems: 8 fatal accidents in Poland
and Turkey
Uncontrolled movement of car : 1 fatal
accident
in Spain
Lack of car door : 5 fatal accidents in Turkey
No protective devices on power operted
doors: 1 fatal accident in Italy
Misuse/Manipulation: 3 fatal accidents in
Poland and Turkey
TOTAL:
22 fatal
user
accidents
in 2015
Ebru Gemici-Loukas- ASANSÖR 2015 – 27 March 2015, Istanbul

17
User Lift Accidents in Turkey
13 fatal accidents
27 serious accidents
20 minor accidents
Ebru Gemici-Loukas- ASANSÖR 2015 – 27 March 2015, Istanbul

Lift user accidents
• 20 reporting countries
• 987 reported cases in 2015
654 674 751 899
182 144 132
66 14 17
23 22
0
200
400
600
800
1000
1200
2012 2013 2014 2015
Fatal
Serious
Other
Stopping Accuracy
27%
No prot. dev. Power op.
doors 10%
Entrapment 14%
Lack of car door 4%
Uncontrolled mov. Car
8%
Locking problems
8%
Misuse 7%
Other 20%
Hit by car doors 2%
Lift user - Main causes 2015
Lift worker accidents
• 26 reporting countries
• 845 reported cases in 2015
637 669 564 627
297 309
261 208
13 7
13 10
0
200
400
600
800
1000
2012 2013 2014 2015
Fatal
Serious
Other
Inadeq. means handl.
equipm. 15%
Unsafe Acc. to machine
room 7%
Unsafe pit access
7%
Others 42%
Slippery floor in mach.
Room 1%
Uncontrolled movement of
car 3%
Unsafe use of tools/method
18%
Sharp edges 3%
Insufficient prot. ag.
electr. shock 4%
Lift worker - Main causes 2015
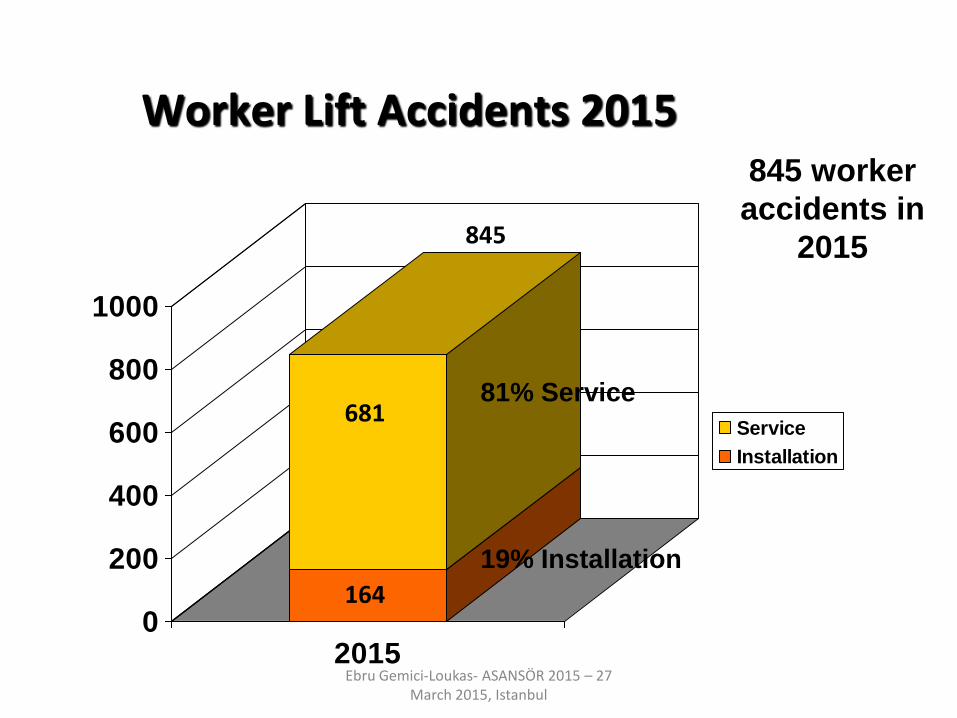
0
200
400
600
800
1000
2015
Service
Installation
845 worker
accidents in
2015
681
164
19% Installation
81% Service
845
Worker Lift Accidents 2015
Ebru Gemici-Loukas- ASANSÖR 2015 – 27 March 2015, Istanbul
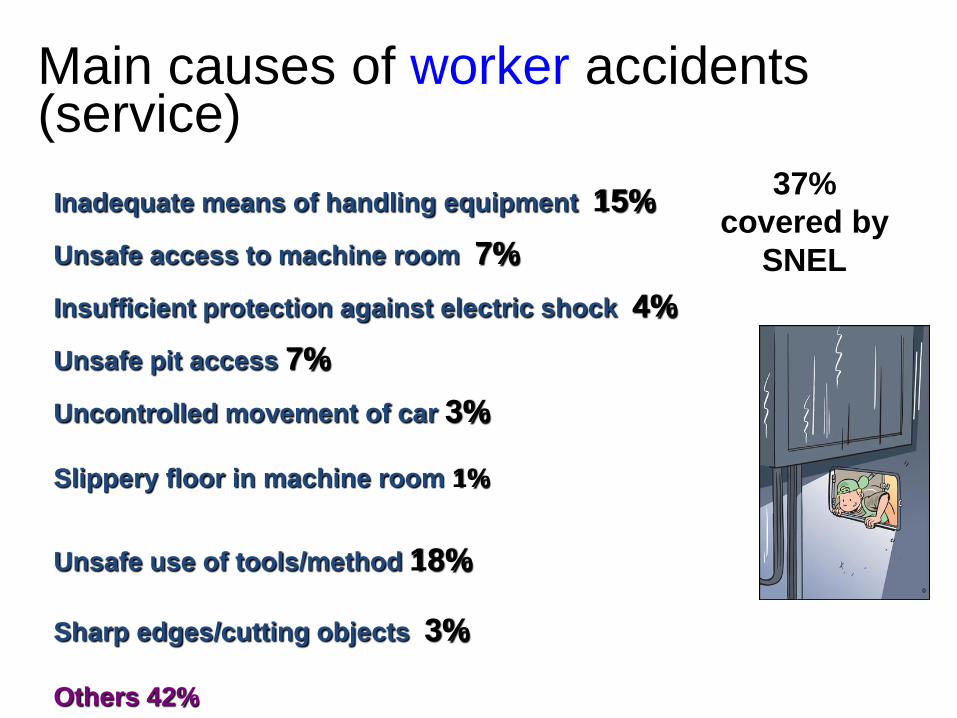
Main causes of worker accidents (service)
Inadequate means of handling equipment 15%
Unsafe access to machine room 7%
Insufficient protection against electric shock 4%
Unsafe pit access 7%
Uncontrolled movement of car 3%
Slippery floor in machine room 1%
Unsafe use of tools/method 18%
Sharp edges/cutting objects 3%
Others 42%
37%
covered by
SNEL

21
Worker Lift Accidents in Turkey
8 fatal accidents
10 serious accidents
22 minor accidents
Ebru Gemici-Loukas- ASANSÖR 2015 – 27 March 2015, Istanbul
Thank you for your attention!
Ebru Gemici-Loukas- ASANSÖR - 24 March 2017, Istanbul
Ebru Gemici-Loukas
Chairwoman Statistical Committee