european journal of political economy
TRANSCRIPT
European Journal of Political Economy 61 (2020) 101815
Contents lists available at ScienceDirect
European Journal of Political Economy
journal homepage: www.elsevier.com/locate/ejpe
Quality of judicial institutions, crimes, misdemeanors,and dishonesty
Naci Mocan a,*, Samantha Bielen b, Wim Marneffe b
a Louisiana State University and NBER, USAbHasselt University, Belgium
A B S T R A C T
We investigate the extent to which quality of judicial institutions has an impact on individuals’ propensity for criminal and dishonest behavior and ontheir views regarding the acceptability of dishonesty and law-breaking. We use micro data on residents of 25 European countries and employalternative measures of judicial quality as perceived by the residents of these countries. As an instrument for judicial quality we employ the pro-cedures with which prosecutors and judges are appointed to their posts in each country. As alternative instruments, we employ an index of de jureinstitutional quality as well as its components, which provide similar results. The findings show that an increase in the perception of the quality ofjudicial institutions, such as an improvement in judicial independence or the impartiality of the courts, has a deterrent effect on dishonest andcriminal acts. A higher perceived quality of the judicial system also makes individuals less likely to find acceptable a variety of dishonest and illicitbehaviors, suggesting that institutions help shape the beliefs of the society. We obtain the same results when we analyze the sample of immigrants,whose cultural attributes should be (more) related to their countries of origin, rather than their countries of residence, and thus should be arguablyuncorrelated with the factors that can impact the instrument. We show that people’s beliefs in the importance of the family, in the fairness of others,and the importance of being rich are not impacted by judicial quality, suggesting that judicial quality is not a blanket representation of underlyingcultural norms and beliefs in the society.
1. Introduction
There are substantial differences between countries in the extent to which people consider illegal or dishonest behavior acceptable.For example, to the question “How wrong is it to buy something you thought might be stolen?” only 3.8 percent of people in Denmarkrespond to indicate that it is “Not wrong at all” or “A bit wrong”. The approval rate of the act of buying a stolen good is 12.4 percent inthe Netherlands, 18.1 percent in Bulgaria, 22.4 percent in France, and 30.4 percent in Russia. While 13.2 percent of Ukrainians find thatbribery is “not wrong at all”, or “a bit wrong”, only less than one percent of people in Iceland think that bribery is acceptable behavior.The approval rate of bribery is 3.2 percent in Germany, 5.7 percent in Belgium, and 6.8 percent in Spain.1
As there are significant differences between countries in the rate at which people tolerate dishonesty, there is a similarly sizablebetween-country variation in crime rates, corruption, and other illegal activity. There were 1750 reported thefts per 100,000 inhabitantsin Italy in 2011, but the rate was 931 in Portugal, and 605 in Poland.2 The murder rate was 0.88 in Denmark, 1.08 in Portugal, and 2.29in Turkey in that same year. While some of these differences in crime rates can be explained by variations in deterrence, labor market
* Corresponding author.E-mail addresses: [email protected] (N. Mocan), [email protected] (S. Bielen), [email protected] (W. Marneffe).
1 These statistics are calculated using the data employed in this paper. The details of the data are provided in Section III.2 The crime statistics are obtained from Eurostat. Statistics are reported for 2011 because that is the last year which is covered in our analysis
sample.
https://doi.org/10.1016/j.ejpoleco.2019.101815Received 24 November 2018; Received in revised form 27 August 2019; Accepted 28 August 2019Available online 12 September 20190176-2680/© 2019 Published by Elsevier B.V.

N. Mocan et al. European Journal of Political Economy 61 (2020) 101815
conditions, and income levels between countries, a significant amount of variation in illegal activity remains unexplained.3
Motivated by these observations, and to provide new insights into the question of “Why does illegal activity and its acceptability vary somuch between countries?”, in this paper we investigate the extent to which differences in the perceived quality of judicial institutionsbetween countries help explain the differences in criminal and dishonest behavior, as well as the acceptability of such behavior. Specifically,we analyze whether the quality perception of a country’s legal institutions has an impact on individuals’ propensity to engage in illicitactivity in that country, ranging from falsifying official documents to buying stolen goods to concealing the defects of a second-handproduct when selling it. We also investigate whether people’s beliefs about the appropriateness of dishonesty are impacted by thequality of judicial institutions to which they are exposed. Examples of such beliefs are the extent to which people agree or disagree withsuch statements as “If you want to make money, you can’t always act honestly”, “Citizens should not cheat on their taxes”, “It is wrong to sellsomeone something second-hand and conceal some or all of its faults”, “It is wrong to make an exaggerated or false insurance claim”. The full listof the variables used in the analyses and their definitions are provided in Table 1.
We use micro data on the residents of 25 European countries who are surveyed between 2004 and 2011 to investigate whetherindicators of perceived judicial quality, such as the independence of the country’s judiciary, the impartiality of the courts, or theprotection of property rights have an impact on citizens’ proclivity to break the law or to engage in dishonest activity, and on the extentto which people believe that dishonest behavior is acceptable.
The paper contributes to the economics of crime literature by adding the quality of the judicial system to the economic analysis ofcriminal decision-making. Research in economics has produced a significant amount of credible information regarding the causal impactof key determinants of criminal activity (Mocan and Bali, 2010; Drago et al., 2009; Corman and Mocan 2000, 2005; Machin andMeghir,2004; Di Tella and Schargrodsky, 2004; Raphael and Winter-Ebmer, 2001). The variation in crime rates between countries, however,cannot be fully explained by making use of the causal estimates of the determinants of crime obtained from existing studies. Thus,between-country variation in judicial quality might help improve the understanding of the variation in illicit activity between countries.
The paper also contributes to the literature that investigates the determinants and the evolution of culture. Cultural beliefs and valuesof a society, even those that are based on superstition, can be persistent across generations (Mocan and Yu, 2017). Yet, cultural beliefsare also malleable and they react to the economic and social environment.4 Specifically, institutions can impact individual behavior andthe beliefs and cultural values of the society because institutions can create incentives/disincentives for people to behave in certainways, and common behavioral patterns lead to the formation of cultural norms in the society. For example, it has been hypothesized thatthe creation of modern states in Europe was the conduit through which the citizens of those states adopted the norms of law-abiding andcivility (Elias, 1994), and modern societies can be defined as those in which citizens abide by the rules of law, because these rules ofbehavior, produced by institutions, have become a cultural norm (Foucault, 1995). More formally, building on the work of Bisin andVerdier (2000, 2001) and Bisin et al. (2004), Tabellini (2008) developed a model to analyze the endogenous evolution of norms andvalues, where parents choose the values to pass on their offspring and they assess their children’s welfare using their own values. Themodel generates strategic complementarity between behavior and norms. In this setting, well-functioning legal institutions generategood values in society, implying that institutional quality and culture are complements. On the other hand, the model of Aghion et al.(2010) suggests that formal institutions and heavy regulations can diminish the marginal returns to being honest and trustworthy. Thus,institutions can crowd out honesty. It is therefore theoretically unclear whether high quality institutions would foster or impede honestbehavior and better values.
1.1. Judicial quality perceptions, judicial independence in practice, and de jure judicial independence
As described in the empirical framework section in detail, we employ four different indicators of judicial quality for each country.Two of these are measured by people’s perceptions and evaluations of actual judicial practices. They are the perceptions of judicialindependence, and the impartiality of the courts. The third measure is an indicator of the protection of property rights, and the fourthone is an index that combines the first three measures.
We consider these measures of judicial quality as endogenous. The endogeneity may arise for a number of reasons. For example,institutional quality (actual or perceived) can emerge as an equilibrium outcome in the model of Aghion et al. (2010), and it can beinfluenced by general attitudes towards dishonesty prevailing in the society. Similarly, reverse causality from dishonest behavior to
3 Some of these differences in crime rates may be attributed to dissimilarities in the classification of crimes and in the reporting rates betweencounties (Soares, 2004). Because murder is a crime which is reported accurately in most countries, cross-country comparisons based on murdershould be more reliable.4 Di Tella, Galiani and Schargrodsky (2007) find that following the passage of an expropriation law, which intended to grant private land to
squatters, some squatter families obtained property rights to the land they occupied, while others could not do so because the original ownerscontested the law in court. The authors show that this differential experience of being able to obtain the title of the land as opposed to being unable todo so altered the beliefs of the squatters about the merits of the free market, and in favor of materialistic and individualistic beliefs. That is, those whoended up with weak property rights and those who obtained full property rights developed very different beliefs about free markets. Along the samelines, people’s beliefs are influenced by the political regime in which they live. Alesina and Fuchs-Schündeln (2007) show that the difference inpreferences between former East and West Germans is mostly because of the direct influence of communism. Ariely et al. (forthcoming) find dif-ferences in honesty between Germans whose family background is the communist former East Germany vs. capitalist West Germany. Even feelingsthat can be thought of as having been deeply engrained in the fabric of culture, or in human psyche, respond to economic and social environment. Forexample, people’s racist, xenophobic and anti-Semitic attitudes (Mocan and Raschke, 2016) and even vengeful feelings (Mocan, 2013) are influencedby economic and social circumstances.
2

Table 1Descriptive statistics of crimes, misdemeanors and dishonest attitudes.
Variable Description Mean (Std.Dev.)
Misused or altered a document Equals 1 if in the last 5 years the respondent misused or altered a card or document to pretend to beeligible for something he or she was not, 0 otherwise
0.027(0.161)
Falsely claimed government benefits Equals 1 if in the last 5 years the respondent over-claimed or falsely claimed government benefits such associal security or other benefits, 0 otherwise
0.016(0.124)
Offered a bribe Equals 1 if in the last 5 years the respondent offered a favor or a bribe to a public official in return fortheir services, 0 otherwise
0.019(0.136)
Concealed faults of a second-handproduct
Equals 1 if in the last 5 years the respondent sold something second-hand and concealed some or all of itsfaults, 0 otherwise
0.034(0.182)
Bought possibly stolen goods Equals 1 if in the last 5 years the respondent bought something he or she thought might be stolen,0 otherwise
0.065(0.246)
Exaggerated an insurance claim Equals 1 if in the last 5 years the respondent made an exaggerated or false insurance claim, 0 otherwise 0.027(0.163)
Cannot always act honestly if you wantto make money
Equals 1 if the respondent replied “Agree strongly”, “Agree” or “Neither Agree nor Disagree” with thestatement “If you want to make money, you can’t always act honestly.“, 0 otherwise
0.508(0.500)
Cheating on taxes is not wrong Equals 1 if the respondent replied “Disagree strongly”, “Disagree” or “Neither Agree nor Disagree” withthe statement “Citizens should not cheat on their taxes.“, 0 otherwise
0.176(0.381)
Bribery is not wrong Equals 1 if the respondent replied “Not wrong at all” or “A bit wrong” for the question “How wrong is apublic official asking someone for a favor or bribe in return for their services?“, 0 otherwise
0.035(0.183)
Concealing faults of a second-handproduct is not wrong
Equals 1 if the respondent replied “Not wrong at all” or “A bit wrong” for the question “How wrong issomeone selling something second-hand and concealing some or all of its faults?“, 0 otherwise
0.062(0.241)
Buying possibly stolen goods is notwrong
Equals 1 if the respondent replied “Not wrong at all” or “A bit wrong” for the question “How wrong is it tobuy something you thought might be stolen?", 0 otherwise
0.140(0.348)
Exaggerating an insurance claim is notwrong
Equals 1 if the respondent replied “Not wrong at all” or “A bit wrong” for the question “How wrong is it tomake an exaggerated or false insurance claim?", 0 otherwise
0.124(0.329)
Note: Number of observations ranges from 25,314 to 54,043.
N. Mocan et al. European Journal of Political Economy 61 (2020) 101815
institutional quality cannot be ruled out. This can happen if more dishonest behavior and the ensuing overload of the criminal justicesystem impact the quality of judicial decisions.
Therefore, we estimate the regression models by instrumental variables, utilizing the process through which judges and districtattorneys are appointed to their posts as an instrument for the perceptions of judicial quality.5 The manner in which judges andprosecutors are appointed are indicators of de jure judicial independence. More generally, the structure of a legal system and theprovisions listed in its fundamental texts, such as the constitution, establish the components of de jure judicial independence. Examplesinclude the provisions in the law that protect the independence of judges, provisions about the selection and removal procedures ofjudges to insulate them from short-term political pressures, adequate salaries for judges to protect their independence, and judicialtenure for judges (appointments for life).6 In addition to using appointment procedures of judges and prosecutors as a measure of de jurejudicial independence, we employ an index of de jure quality, as well as the components of this index (Melton and Ginsburg, 2014). Thedetails are provided in the data section.
De facto judicial independence is related to de jure judicial independence. That is, the quality provisions which are written in legaldocuments (de jure quality) have an impact on their factual implementations (de facto quality) (Melton and Ginsburg, 2014; Hayo andVoigt, 2007). It is reasonable to assume that the actual experience of a country regarding the independence of its judiciary (de factojudicial independence) shapes citizens’ perceptions of judicial quality. This implies that de jure judicial independence would influencepeople’s perceptions of judicial independence through its impact on de facto judicial independence.7
Thus, we hypothesize that (1) people’s propensity for dishonesty and their views regarding the acceptability of dishonest behaviorare impacted by their perception of the judicial quality in their country. (2) The perception of judicial quality is influenced by de factojudicial quality (by what is actually happening in the judicial system). (3) De facto judicial quality is determined, at least in part, by whatis written in legal texts and in the constitution (de jure judicial independence). (4) De jure judicial independence cannot impact people’sbehavior or attitudes directly.
In summary, de jure judicial independence can influence dishonest behavior through its impact on de facto judicial independence,but the components of de jure judicial independence (what is written in legal documents) cannot have a direct influence on individuals’behavior. In this framework, de jure judicial independence would be a valid instrument for the perceived judicial quality.
5 There is variation across countries in this process. Judges and prosecutors can be appointed by the government with no prerequisites or norequirements other than a law degree and some work experience, or they can be appointed based on an exam in addition to the required workexperience. In the former case, the government has full control on who gets appointed as a judge or as a prosecutor, while in the latter case thegovernment has much less influence. If the government has the legal authority to appoint judges and prosecutors at will, those judges and prosecutorsare more likely to be biased towards the government in comparison to the judges and prosecutors who are appointed to their positions following awritten exam, who would be more independent.6 Indicators of de jure judicial independence are listed, among others, in Feld and Voigt (2003) and Melton and Ginsburg (2014).7 De jure judicial independence → de facto judicial independence→perceptions about judicial independence and judicial quality.
3

N. Mocan et al. European Journal of Political Economy 61 (2020) 101815
We find that the quality of the judicial system has a significant impact on people’s propensity to break the law in a number ofdomains such as making an exaggerated or false insurance claim, offering a bribe to a public official, falsely claiming governmentbenefits, buying something knowing that it might be a stolen good, or selling something second-hand by concealing its faults. We alsofind that low quality of the judicial system makes it more likely for people to consider a variety of dishonest behaviors as acceptable,suggesting that institutions help shape the beliefs of the society.
When we investigate people’s responses on issues such as the importance of family, believing in the fairness of people, believing infair treatment of others, and the importance of being rich, we find that judicial quality does not impact these beliefs. This suggests thatjudicial quality is not a blanket representation of the underlying cultural norms and beliefs in the society.
We provide some evidence on the validity of the instrument by showing that unobserved factors that impact the behavior and thebeliefs of individuals are unlikely to be related to the instrument. For this analysis we use the sample of immigrants. To the extent thatimmigrants embody cultural characteristics of their countries of origin that influence their behavior and their attitudes, and that thesecultural characteristics are also transmitted to their offspring (Mocan forthcoming, Alesina et al., 2015; Alesina and Giuliano, 2010,Fern�andez and Fogli, 2009), there should not exist a significant correlation between the instrument (e.g. the procedures with which thejudges/prosecutors are appointed) and the unobservable cultural attributes among immigrants. We find that the results obtained fromthe immigrant sample are similar to those obtained from the whole sample, providing evidence for conditional independence of theinstrument and the reliability of the results.
Section 2 presents the empirical framework. Section 3 describes the data set and the variables. Sections 4 and 5 present the resultsand some extensions, respectively; and Section 6 is the conclusion.
2. Empirical framework
Consider Equation (1) below.
Dict ¼ β0 þ β1Jc þ X0ictΦþ C
0ctΩþ δt þ εict (1)
where Dict is an indicator of dishonest behavior of person iwho is a resident of country c, surveyed at time t. Alternatively, Dict stands forindicators that represent individuals’ dishonest attitudes, measured by their approval of dishonest behavior. As explained in the datasection, we employ repeated cross-sections. Thus, different individuals (i) are surveyed in different years (t) in a given country (c). Thetypes of dishonest behavior we analyze in the paper could be classified as felony (major) crimes, or they could be misdemeanors (minorcrimes), depending on the country in which the individual resides. For example, one of the dishonesty indicators we employ is theresponse to the question “In the last five years have you sold something second-hand and concealed some or all of its faults?“. This particularact could be punishable by law in some countries, but it may not be punishable in some others. Furthermore, depending on the prioritiesand resources of the judicial system, the police and prosecutors may decide not to press charges for this offense even if it is a criminal actin that country. Another indicator of dishonest behavior is whether the individual falsely claimed government benefits, such as socialsecurity payments. This act is a crime in most countries, although the severity of punishment may differ across countries. In summary,the first group of dependent variables include six dishonest and criminal behaviors which differ in their severity of criminality, rangingfrom offering a bribe to a public official to buying a stolen good.
The dependent variables in the second group gauge people’s attitudes towards dishonesty. These variables measure individuals’feelings about the acceptability of some dishonest and illicit behaviors. For example, survey respondents are asked to evaluate “howwrong it is” to sell a second-hand good and conceal its defects or to make a false insurance claim. They are also asked whether they agreeor disagree with such statements as “a public official asking for bribe is wrong”, “it is wrong for citizens to cheat on their taxes”, and “ifyou want to make money you cannot always act honestly”. The 12 variables that make up the set of dependent variables (D) in Equation(1) and their definitions are discussed in Section 3.
Equation (1) includes personal attributes of the respondents such as age, years of education, ethnic minority status, marital status,labor market activity, household income, location of residence, religiosity, and home ownership. These control variables, represented byX in Equation (1), are included to account for differences between individuals regarding their propensity to commit crime, stemmingfrom the relative returns to crime and legal work (e.g. education, labor market activity, income). Other control variables, such as sex andreligiosity, intend to capture the impact of personal attributes such as preferences and risk aversion.8
The model cannot include country fixed effects because the indicators of judicial quality exhibit negligible within-country variationover the short time period analyzed. To account for country differences that may impact criminal proclivity and the tolerance fordishonesty, the model includes country attributes, represented by Cct. These variables also help absorb some of the deep impacts on ourkey explanatory variable, judicial quality, that may be driven by country attributes. For example, judicial quality may be systematicallydifferent between countries based on legal origins, the extent of their ethno-linguistic fragmentation, or the level of education. Thus,vector C includes such variables as per capita GDP, average country education, the size of the population, ethno-linguistics fragmen-tation and individualism indexes of the country, legal origin of the country, and the proportion of government spending in nationalincome. Despite the subscript (t) in the notation, the following country attributes are time-invariant: legal origin, the extent of eth-nolinguistic fragmentation, the index of individualism, number of democratic years, and population.
The variable of interest, Jc, which represents the time-invariant perceived quality of judicial institutions in the country, is measured
8 See Lago-Pe~nas and Lago-Pe~nas (2010) and Orviska and Hudson (2003) on the impact of personal characteristics on attitudes towards tax evasion.
4

N. Mocan et al. European Journal of Political Economy 61 (2020) 101815
in different ways. This first measure, Judicial Independence, ranges from 0 to 10. It captures the extent to which the judiciary is inde-pendent from the influence of politics, the government, citizen, or the firms. The second variable, Impartial Courts, also ranges from 0 to10. It measures whether the legal framework of the country is not subject to manipulation and it is based on a clear and neutral process.Following previous work (Acemoglu et al., 2001; Knack and Keefer, 1995), we employ Protection of Property Rights as the third measureof institutional quality. This variable provides a score that ranges from 0 to 10 for each country to indicate the extent to which citizens’property rights and assets are protected by law. Finally, we use the average value of the three quality measures described above to createan index of institutional quality.9 The component δt represents fixed effects for survey years, and εict is a white noise error term. Becausecultural beliefs, preferences, as well as attitudes towards crime and dishonesty may be correlated within regions in a country, we clusterthe standard errors by country regions. Alternatively, we report the standard errors clustered at the country-level. Because we employ anumber of different outcomes that aim to gauge dishonest behavior and dishonest attitudes, we adjust the standard errors for multiplehypothesis testing (Newson, 2010; Benjamini and Yekutieli, 2001).
Our main interest is the coefficient β1 in Equation (1). As described in Section 2, Estimation of Equation (1) is complicated becauseinstitutional quality, J, may be endogenous. For example, reverse causality from dishonest behavior to institutional quality cannot beruled out. This can happen if more dishonest behavior and the ensuing overload of the criminal justice system impact the quality of thejudicial decisions. To account for this potential effect, we control for the effectiveness of the courts in keeping up with the incomingcaseload, measured by clearance rate for criminal cases in the country.
Institutional quality arguably evolves slowly, but it may be a function of the prevailing attitudes towards dishonesty. A tolerantcultural attitude in the country towards dishonesty would generate a higher propensity for dishonest acts, and it can also lead to poorinstitutional quality. Put differently, a “culture of dishonesty” can have an impact on both institutional quality and individual criminalpropensity. Also, as mentioned earlier, increased dishonest and illicit behavior of individuals may generate an overload of the criminaljustice system, which in turn may create inefficiencies in the judicial system. To get around this potential confounding, we estimateEquation (1) with instrumental variables as shown in Equation (2) below.
Jc ¼ α0 þ α1Lc þ X0ictΨþ C
0ctΓ þ μt þ ξict (2)
where the quality of the judicial institutions (real or perceived), Jc, is instrumented with the appointment procedures of judges andprosecutors in the country, represented by L.Note that Jc does not have a subscript of (i) or (t) as it does not vary between individuals in agiven country, nor does it vary over time. As discussed in Section 1, these appointment procedures are indicators of de jure judicialindependence. Although most countries require some prior experience as a legal professional before being appointed as a judge orprosecutor, in some countries judges and prosecutors are appointed by the government without taking a competitive exam. In othercountries, judges or prosecutors qualify for their posts based on a formal written exam. This means that in some countries the gov-ernment can have complete control over who gets appointed andwho does not without relying on exam scores, but in other countries theappointments to these positions are arguably more objective andmerit-based. As explained in the data section, we classify countries intothree groups based on procedural differences in how judges and prosecutors are appointed. The country-specific guidelines and pro-cedures of these appointments are based on law, and in some countries they are written in the constitution. Assuming that the pro-cedures used to appoint judges and prosecutors have no direct influence on people’s criminal proclivity or on their beliefs, appointmentprocedure of judges/prosecutors is a valid instrument. 10
We also employ other measures of de jure judicial independence (L) as alternative instruments. We use three components of de jureindependence created by Melton and Ginsburg (2014). These components measure the independence of the selection and removalprocesses of judges and whether judges have lifelong appointments. Finally, we employ an aggregate index created by these and threeadditional measures proposed by Melton and Ginsburg (2014, pp. 195-6). These variables are described in the data section below.
In a recent paper, Gutmann and Voigt show that de jure independence of the judiciary and de facto independence are negativelycorrelated in EU countries (Gutmann and Voigt, forthcoming, Table 1, Fig. 1). The authors also show that cultural attributes of countriesare correlated with both de facto and de jure judicial independence. Specifically, the extent of individualism and the level of generalizedtrust are negatively correlated with de jure judicial independence, but they are positively correlated with de facto judicial independence(Gutmann and Voight, forthcoming, Table 2, Figs. 5–8). The authors correctly point out that these correlations can help explain the
9 Trial delays and the inefficiency of the courts in resolving cases can impact criminal propensity because such inefficiency may alter marginalcriminal’s perception of risk and deterrence (Du�sek, 2015; Pellegrina, 2008). Such court delays, as an indicator of low judicial ineffectiveness,constitute one dimension of low judicial quality. However, in this paper we focus on low judicial quality as an institution, measured by such aspectsas the lack of judicial independence, and lack of impartiality of the courts.10 Equation (1) reflects the assumption that individual behavior is impacted by the perceived quality of the judiciary in the country. Equation (2) isbased on the assumption that, although endogenous, the quality of the judicial system is, at least in part, determined by structural attributes such asde jure judicial independence. The justification of these assumptions is provided by theoretical work (e.g.Tabellini, 2008; Aghion et al., 2010). Inequations (1) and (2) we do not employ individual-specific beliefs about the quality of the judiciary. That is, variable J varies between countries, butit does not vary between individuals of a given country. There are two reasons for this formulation; one is conceptual, the other one is empirical. First,consistent with theoretical work, it is important to analyze how the institutional quality of the country impacts the beliefs and the behaviors of thecitizens of that country. Second, it is a challenging task to find a valid individual-level instrument that would influence individual beliefs of judicialquality, but that would have no impact on individual dishonest attitudes and behaviors. Finally, even if one were to empirically identify a causal linkbetween individual beliefs about judicial quality and individual behavior, the important left-out question would be the extent to which country-leveljudicial quality is related to individuals’ beliefs about it.
5
N. Mocan et al. European Journal of Political Economy 61 (2020) 101815
negative association between de jure independence of the judiciary and its actual independence in a cross-country analysis. This point isone of the key predictions of the model in Aghion at al. (2010).11 At the onset, countries with high levels of trust and individualism, ascultural attributes, demand less regulation. Thus, individualism (or trust) and de jure judicial independence are negatively correlated ina cross-country regression. If less de jure independence leads to the formation of more trust and more individualism as predicted by themodel in Aghion et al. (2010), and if these cultural attributes are positively correlated with actual judicial independence, this impliesthat individualism and trust will be positively correlated with de facto judicial independence. The upshot is that, regressions that explainthe relationship between de facto and de jure independence need to control for cultural attributes such as the extent of individualism.12
Thus, our equation (1) and therefore our first-stage regressions shown in Equation (2) include individualism index as a cultural attribute.In addition, these equations include other cultural attributes such as ethnolinguistic fragmentation and legal origin of countries.
3. Data and descriptive statistics
The data are obtained from a variety of sources. The main data source is Economic Morality Module and the Justice Module of theEuropean Social Survey in Rounds 2 and 5, conducted between 2004 and 2006, and 2010–2011. There are 25 countries surveyed.13
Depending on the outcome variable, sample sizes range from 25,314 to 54,034. Table 1 displays the definitions and the descriptivestatistics of the dependent variables. The variables are dichotomous indicators that take the value of 1 if the survey respondent indicatedthat he/she has engaged in the behavior listed during the last five years (1-Misusing or altering a document, 2-Falsely claiming gov-ernment benefits, 3-Offering a bribe, 4-Conceiling the faults of a second-hand product when selling, 5-Buying stolen goods, 6-Filing falseor exaggerated insurance claims). Only 2.7 percent of the individuals indicated that they misused or altered a card or a document topretend to be eligible for something they were not eligible. Similarly, only 1.6 percent indicated that they falsely claimed governmentbenefits, such as social security, when they were not entitled to. The highest rate pertains to buying something that might have been astolen good. Six-and-a half percent of the respondents indicated that they engaged in this behavior. These relatively low rates, however,disguise a rather significant between-country variation. Panel A of Table 2 displays country averages for dishonest behaviors in selectedcountries of the analysis sample to display the between-country variation in these behaviors. While the proportion of respondents whoindicated that they misused or altered a document is 0.7 percent in Hungary, the rates are 2.3 percent in Switzerland, 4.3 percent inSpain, and 5.8 percent in Czech Republic and Austria. Similar variation exists between countries regarding the intensity of otherdishonest behavior. For example, the proportion of individuals who offered a bribe is only 0.2 percent in Iceland, while it is 2.8 percentin Estonia, 5.3 percent in Poland, and 8.5 percent in Slovakia.
The bottom part of Panel A in Table 2 presents the country averages of the remaining three dishonest behaviors in selected countriesand shows significant variation between countries. For example, while only 1.1 percent of Hungarians conceal the defects of the second-hand goods they sell, the rate is 4.6 percent in the Netherlands, and 5.3 percent in Finland. Only 1.5 percent of people in Lithuaniaindicate that they made a false insurance claim, but the rate is 2.7 percent in Italy, and 7.2 percent in Austria.
It is clear that some of these differences could be the result of country attributes, such as the level of economic development. Forexample, individuals who live in developed countries with mature financial and insurance markets have more opportunities to interactwith insurers, which increases the possibility to file an insurance claim. Similarly, for those who live in countries where the governmentis more engaged in the economy, the frequency of interaction with a government agency and the opportunity to claim a governmentbenefit (accurately or falsely) is higher. To account for such country differences, the regressions control for a number of country at-tributes, as displayed in Table 3.
To assess whether the responses reported by the individuals in our data are similar to other available information, we comparedcountry-specific bribery rates that can be calculated using the individuals in our data to outside sources. There is a high degree ofconsistency between the extent of bribery revealed by the respondents in our data (i.e. their own bribery activity) and corruptionperception indexes of other sources, such as Transparency International (TI). For example, as shown in the top panel of Table 2, only 0.2percent of Icelandic and Finnish people report having paid a bribe during the last five years. The Corruption Perception index valuesassigned to these countries by Transparency International (ranging from 1 to 10; 10 signifying lowest corruption) are 8.5 and 9.2,respectively. Based on our data, the rate of bribery in Norway is 0.7 percent, and 5.3 percent of the Polish people paid a bribe during thelast five years. The Transparency International corruption perception index for these countries is 8.6 for the former, and 5.3 for thelatter. As Table 2 shows, the bribery rates are 9.3 percent in the Czech Republic and 8.5 percent in Slovakia. Their TI index values are 4.6and 4.3, respectively. More generally, the correlation between the country-specific bribery-giving rates obtained from our data and the
11 In that model, distrust generates demand for regulation, while regulation in turn discourages formation of trust, generating multiple equilibria.The authors argue that France and England developed different legal systems because of different levels of disorder that existed in the two countries,where England was much more peaceful than France. Put differently, France, with a lower level of trust created a legal tradition that emphasizedmore regulation. These legal systems were transmitted to colonies of these two countries. The model in Aghion et al. (2010) suggests that the moreheavily regulated French colonies (in comparison to English colonies) have developed lower levels of trust, which then created continued demand forgovernment regulation (Aghion et al., page 1046).12 More formally, consider the regression DF ¼ αþβ DJþ γ INDIVþ ε, where DF is de facto independence, DJ stands for de jure independence, INDIVrepresents the level of individualism in the country, and ε is the error term. The coefficients of β and γ are expected to be positive. Now consider theregression that omits individualism: DF ¼ λþδ DJþν. Here, δ will underestimate β, and δ can be even negative (as shown by Gutmann and Voight,forthcoming) because γ > 0 and Cov(DJ, INDIV) < 0.13 The countries in the data set are: Austria, Bulgaria, Croatia, Czech Republic, Denmark, Estonia, Finland, France, Germany, Hungary, Iceland, Italy,Lithuania, Luxembourg, Netherlands, Norway, Poland, Portugal, Russia, Slovakia, Slovenia, Spain, Sweden, Switzerland, and Turkey.
6

Table 2Country averages of crimes, misdemeanors and dishonest attitudes.
A: Crimes and Misdemeanors
Misused or altered a document Falsely claimed government benefits Offered a bribe
Hungary 0.7% Netherlands 0.1% Iceland 0.2%Sweden 1.7% Hungary 0.1% Finland 0.2%Finland 2.2% Turkey 1.1% Norway 0.7%Switzerland 2.3% Germany 1.5% Hungary 1.6%Estonia 3.4% Norway 1.8% Estonia 2.8%Spain 4.3% Iceland 2.6% Poland 5.3%Czech Republic 5.8% Austria 3.3% Czech Republic 9.3%Austria 5.8% Czech Republic 4.2% Slovakia 8.5%
Sample Average 2.7% Sample Average 1.6% Sample Average 2.4%
Concealed faults of a second-hand product Bought possibly stolen goods Exaggerated an insurance claim
Hungary 1.1% Portugal 1.8% Turkey 0.5%Portugal 1.9% Slovenia 2.9% Slovenia 1.1%Luxemburg 2.0% Switzerland 3.6% Lithuania 1.5%Norway 2.2% Poland 4.5% Luxembourg 2.5%Italy 3.9% Bulgaria 4.7% Italy 2.7%Netherlands 4.6% Spain 7.5% Czech Republic 5.2%Finland 5.3% Slovakia 12.5% Iceland 6.0%Estonia 5.7% Czech Republic 15.0% Austria 7.2%
Sample Average 3.3% Sample Average 6.0% Sample Average 2.4%
B: Dishonest Attitudes
Cannot always act honestly if you want to make money Cheating on taxes is not wrong Bribery is not wrong
Portugal 31.7% Turkey 5.9% Iceland 0.9%Sweden 42.4% Estonia 9.2% Denmark 1.8%France 49.3% Poland 12.0% Germany 2.1%Czech Republic 54.2% Hungary 13.8% Netherlands 2.4%Turkey 58.7% Spain 15.8% Poland 3.9%Estonia 58.9% Denmark 17.8% Slovenia 4.7%Hungary 65.5% Sweden 21.7% Austria 4.8%Italy 69.5% Germany 25.2% Spain 6.4%
Sample Average 54.1% Sample Average 19.7% Sample Average 4.0%
Concealing faults of a second-hand product is not wrong Buying possibly stolen goods is not wrong Exaggerating an insurance claim is not wrong
Iceland 1.1% Denmark 3.3% Turkey 1.6%Norway 2.7% Sweden 5.4% Norway 3.8%Luxembourg 3.4% Netherlands 12.0% Portugal 7.7%Estonia 5.7% Croatia 15.4% Italy 12.6%Netherlands 6.2% Bulgaria 17.8% Poland 15.0%Germany 7.0% Slovakia 21.2% Germany 16.8%Spain 8.5% France 22.3% France 22.8%Austria 12.5% Russia 30.1% Russia 40.4%
Sample Average 6.7% Sample Average 13.2% Sample Average 11.7%
The entries are country averages that are obtained from the ESS surveys round 2 and round 5. Sample Average refers to the average value of therelevant variable (using all countries in the sample).
N. Mocan et al. European Journal of Political Economy 61 (2020) 101815
corruption perception index of the TI is �0.65, indicating reasonably strong correlation. Alternatively, we obtained country averages ofthe proportion of residents who gave a bribe from TI’s corruption barometer. The correlation between country-specific bribery activitybased on the respondents in our data and TI’s corruption barometer measure is 0.69.
The lower panel of Table 1 presents the definitions and the descriptive statistics of the variables that measure the attitudes towarddishonesty. For example, the variable “Cannot always act honestly if you want to make money” takes the value of one if the individualstrongly agrees, agrees, or remains neutral when presented with the statement that “If you want to make money, you can’t always acthonestly”. Although Table 1 shows that about 51 percent of the respondents agree with this statement, Panel B of Table 2 shows thatthere is significant variation between countries. For example, while about 32 percent of Portuguese believe that one cannot always acthonestly if one wants to make money, 49 percent of the French and almost 70 percent of Italians think that this statement is true.
The dichotomous variable “Cheating on taxes is not wrong” takes the value of one if the respondent does not disagree or does notstrongly disagree with the statement that “Citizens should not cheat on their taxes”, and zero otherwise. More than 17 percent of thesample thinks that cheating on taxes is acceptable. Table 2 shows that 6 percent of Turks believe tax evasion is okay, while the rate is 12percent in Poland, 18 percent in Denmark, and 25 percent in Germany.
Table 1 displays that 3.5 percent of the sample believe that bribery is not wrong. This variable takes the value of one if the re-spondents indicated that “a public official asking someone for a favor or bribe in return for their services” is not wrong at all, or a bit
7

Table 3Descriptive statistics of personal attributes and country characteristics.
Variable Description Mean
(Std. Dev.)
Personal characteristicsAge Age of the respondent 45.966
(17.344)Male Equal to 1 if the respondent is male, 0 otherwise 0.483
(0.500)Ethnic minority Equal to 1 if the respondent belongs to minority ethnic group in country, 0 otherwise 0.042
(0.201)Years of schooling Number of years of full-time education completed 11.789
(4.033)Working Equal to 1 if the respondent is working, 0 otherwise 0.530
(0.500)Married Equal to 1 if the respondent is married, 0 otherwise 0.573
(0.495)Born in the country Equal to 1 if the respondent was born in the country, 0 otherwise 0.921
(0.269)City Equal to 1 if the respondent lives in a big city, 0 otherwise 0.201
(0.400)Suburb Equal to 1 if the respondent lives in a suburb or an outskirt of a big city, 0 otherwise 0.117
(0.322)1st Quintile of household income Equal to 1 if the respondent is in the 1st quintile of country-specific household income distribution, 0 otherwise 0.127
(0.332)2nd Quintile of household income Equal to 1 if the respondent is in the 2nd quintile of country-specific household income distribution, 0 otherwise 0.182
(0.386)3rd Quintile of household income Equal to 1 if the respondent is in the 3rd quintile of country-specific household income distribution, 0 otherwise 0.136
(0.343)4th Quintile of household income Equal to 1 if the respondent is in the 4th quintile of country-specific household income distribution, 0 otherwise 0.227
(0.419)5th Quintile of household income Equal to 1 if the respondent is in the 5th quintile of country-specific household income distribution, 0 otherwise 0.329
(0.470)Low religiosity Equal to 1 if the respondent reports his or her religiosity below 4 on a scale from 0 to 10, 0 otherwise 0.352
(0.478)Medium religiosity Equal to 1 if the respondent reports his or her religiosity 4, 5, or 6 on a scale from 0 to 10, 0 otherwise 0.342
(0.474)High religiosity Equal to 1 if the respondent reports his or her religiosity above 6 on a scale from 0 to 10, 0 otherwise 0.306
(0.461)Own dwelling Equal to 1 if the dwelling is owned by any household member, 0 otherwise 0.725
(0.447)# Rooms Number of rooms the household has use of (not kitchens/bathrooms/toilets) 3.926
(1.681)
Country characteristicsClearance ratea The number of all resolved criminal cases divided by the number of incoming criminal cases in the country. 0.918
(0.234)GDP per capitab PPP-adjusted GDP per capita in constant 2011 US$ 36,851
(15,246)Educationc Average educational attainment in the country for population 15 and over. 10.589
(1.452)
Individualisme Hofstede Individualism Index 61.738(13.848)
Ethno-linguistic fragmentationd Roeder’s 1985 Index of Ethno-Linguistic Fragmentation 0.209(0.170)
Democratic yearsg Number of democratic years from 1930 to 1995 40.607(26.374)
Populationb Country population in millions 22.875(26.649)
Government consumptionf Government share of real GDP per capita in current PPPs 0.188(0.051)
French legal origing Equal to 1 if the legal origin is French commercial code, 0 otherwise 0.298(0.457)
Socialist/communist legal origing Equal to 1 if the legal origin is socialist/communist, 0 otherwise 0.251(0.434)
German legal origing Equal to 1 if the legal origin is German commercial code, 0 otherwise 0.182(0.386)
Scandinavian legal origing Equal to 1 if the legal origin is Scandinavian commercial code, 0 otherwise 0.269(0.443)
Quality of Judicial Institutions
(continued on next page)
N. Mocan et al. European Journal of Political Economy 61 (2020) 101815
8

Table 3 (continued )
Perception of JudicialIndependenceh
Index on the scale of 0–10. “Is the judiciary in the country independent from political influences of members ofgovernment, citizens, or firms?”
6.990(1.611)
Impartial courtsh Index on the scale of 0–10. “Is the legal framework in the country for private businesses to settle disputes andchallenge the legality of government actions and/or regulations inefficient and subject to manipulation or is it efficientand follows a clear, neutral process?”
6.730(1.749)
Protection of property rightsh Index on the scale of 0–10. “Property rights, including over financial assets, are poorly defined and not protected bylaw (¼ 1) or are clearly defined and well protected by law (¼ 7).”
7.261(1.484)
Judicial Quality Average The average of Perception of Judicial Independence, Impartial Courts, and Protection of Property Rights 6.994(1.546)
Alternative Instruments for Quality of Judicial institutionsJudge & prosecutor appointment
procedureaEqual to 0 if there is no exam to appoint either the judges or the prosecutors. Equal to 1 if there is a competitiveexam for either judges or prosecutors. Equal to 2 if there is a competitive exam for both judges or prosecutors.
0.720(0.843)
Selectioni A dichotomous indicator (¼1) if the appointment to the highest court in the land involves a judicial council orat least two actors.
0.480(0.510)
Removali A dichotomous indicator (¼1) if the constitution regulates judicial removal and if so, whether removal requiresthe proposal of a supermajority in the legislature or if only the public or judicial council can propose removaland another political actors is required to approve such a proposal.
0.320(0.476)
Tenurei A dichotomous indicator (¼1) if judges are appointment is for the rest of their lives. 0.480(0.510)
Index of de jure judicialindependencei
The sum of six indicators: (1) Selection, (2) Removal, (3) Tenure, as described above; and (4) whether theconstitution explicitly mentions judicial independence, (5) whether judge salaries are protected from politicalpressure, and (6) whether removal conditions of judges are limited to crimes, issue of misconduct, treason orthe violation of the constitution.
0.640(0.490)
a The Council of Europe, Division of Human Rights and Rule of Law, the European Commission for the Efficiency of Justice. https://www.coe.int/t/dghl/cooperation/cepej/evaluation/archives_en.asp.
b The World Bank, World Development Indicators data base. https://data.worldbank.org/data-catalog/world-development-indicators.c : Barro-Lee data set. www.Barrolee.com.d Roeder’s 1985 index of the extent of ethnolinguistic fragmentation in the country. http://pages.ucsd.edu/~proeder/elf.htm.e Hofstede, Cultural Dimensions. http://geert-hofstede.com/countties.html.f Penn World Tables.g Teorell, Jan, Nicholas Charron, Stefan Dahlberg, S€oren Holmberg, Bo Rothstein, Petrus Sundin & Richard Svensson, 2013. “The Quality of Gov-
ernment Dataset” version qog_std_cs_20dec13 http://www.qog.pol.gu.se.h Cato Institute, “Economic Freedom of the World" based on Global Competitiveness Reports, World Economic Forum. Reports.weforum.org.i Melton and Ginsburg (2014). Data are retrieved from http://comparativeconstitutionsproject.org/download-data/.
N. Mocan et al. European Journal of Political Economy 61 (2020) 101815
wrong. Other variables, that gauge the extent to which people find various other dishonest behavior acceptable, are measured similarly.These variables indicate whether the individual believes that “Concealing the faults of a second-hand product is not wrong”, “Buying apossibly stolen good is not wrong”, and “Making a false insurance claim” is not wrong. Table 2 shows that countries differ substantiallyin the propensity of their citizens’ agreement with these responses. For example, while less than 4 percent of the respondents in Norwaythink that making a false or exaggerated insurance claim is acceptable behavior, the rate is about 13 percent in Italy, 23 percent inFrance, and 40 percent in Russia.
The top panel of Table 3 displays the descriptive statistics of personal attributes of the respondents and the middle panel presents thedescriptive statistics of country characteristics.14
The bottom section of Table 3 shows the definitions and the descriptive statistics of the indicators of the perceptions of judicialquality. Judicial Independence and Impartial Courts are based on the evaluations of more than 15,000 business executives around theworld of the business environment in the country in which they operate. Data sources are listed in the footnote to Table 3. Higher valuessignify a more independent judiciary. The sample mean of Judicial Independence is about 7, but there is significant variation betweencountries. For example, the value of Judicial Independence is 2.7 in Russia, 3.2 in Bulgaria, 4.7 in Italy, 5.5 in Turkey, 6.3 in Portugal,7.9 in Luxembourg, and 9.0 in Denmark. The same variation exists in Impartial Courts and Protection of Property Rights. For example, thevalue of Impartial Courts is 2.8 in Croatia, 2.9 in Russia, 3.3 in Italy, 4.4 in Hungary, 6.6 in France, 7.5 in Germany, 8.0 in Sweden, and 8.6in Austria.
The bottom section of Table 3 also displays information about the instrument: Judge and Prosecutor Appointment Procedure is an indexthat classifies countries into three groups. The value of the index is 0 if the appointment procedure does not use a combination of examand experience to appoint either judges or prosecutors. This group of countries include Austria, Bulgaria, Croatia, Cyprus, Czech Re-public, Denmark, Finland, France, Greece, Iceland, Ireland, Italy, Luxembourg, Portugal, Spain, Switzerland, and Ukraine. The index
14 The descriptive statistics of these country attributes are based on individuals used in the estimation sample. For example, per capita GDP is 36,851in Table 3, which is obtained by averaging the country GDPs associated with more than 27,000 people used in the regressions. Alternatively, percapita GDP can be calculated where each country-year contributes one observation. In this calculation, per capita GDP is $34,335. Similarly, usingeach country-year as one observation, we calculate the clearance rate as 0.96, and average country education as 10.77 years. The means of othercountry attributes, calculated this way, are as follows. Individualism index: 57.12, Ethno-linguistic Fragmentation: 0.23, Democratic years: 31.76,Population: 24.41, Government consumption: 0.20, Socialist/communist legal origin: 0.40, German legal origin: 0.08, Scandinavian legal origin:0.20.
9

N. Mocan et al. European Journal of Political Economy 61 (2020) 101815
takes the value of 1 if the appointment procedure uses a competitive exam to appoint either judges or prosecutors, and the index is equalto 2 if the appointment procedure uses a competitive exam to appoint both judges and prosecutors. Countries with index value of 1 areEstonia, Hungary, Norway, Russia, Slovak Republic, and Sweden. Countries with index value of 2 include Germany, Lithuania, theNetherlands, Poland, Slovenia, and Turkey. In this last group of countries both judges and prosecutors have to take an exam to qualify fortheir posts. The source of this information is the European Commission for the Efficiency of Justice (CEPEJ) 2014 Reports.
Other variables that are used as alternative instruments are obtained from Melton and Ginsburg (2014).15 They are variousdichotomous indicators of de jure judicial independence. Selection is a dummy variable that takes the value of one if the appointment tothe highest court in the country involves a judicial council or at least two actors. Removal is a dummy that takes the value of one if theconstitution regulates judicial removal and if so, whether removal requires the proposal of a supermajority in the legislature or if onlythe public or judicial council can propose removal and another political actors is required to approve such a proposal. Tenure takes thevalue of one if the appointment is for the life of the judge. In addition to these three indicators, Melton and Ginsburg (2014) list threeother indicators of de jure judicial independence. They are: whether the constitution explicitly mentions judicial independence, whetherjudge salaries are protected from political pressure, and whether removal conditions of judges are limited to crimes, issue of misconduct,treason, or the violation of the constitution. We add all these six indicators to create an index to represent the extent of de jure judicialindependence, and use it as an alternative instrument.
4. Results
Table 4 presents instrumental variable results for all 12 regressions. Panel A contains the results of six regressions where thedependent variables represent various dishonest and criminal behaviors. In the regressions reported in this table the quality of judicialinstitutions is measured by Perception of Judicial Independence, instrumented with the judge and prosecutor appointment procedures. Inthe interest of space, we report only the coefficients of this variable.16 The table contains three sets of p-values. Those that are in(parentheses) are based on clustering at the region (NUTS1 or NUTS2) level. Because we use as outcomes multiple variables that gaugesimilar aspects of dishonest behavior and attitudes, we adjusted the p-values for multiple hypothesis testing (Newson, 2010). Theadjusted p-values are reported in [brackets]. We also report p-values in {curly brackets} based on clustering the standard errors at thecountry level.
The results in Panel A of Table 4 reveal that an improvement in people’s perceptions of judicial independence has no impact on thepropensity to conceal the faults of a second-hand product when selling it. On the other hand, an improvement in this perception reducesthe proclivity to misuse or alter a document. It also reduces the propensity to falsely claim a government benefit, to offer a bribe, to buystolen goods and to make an exaggerated or false insurance claim. The results imply that if the perception of judicial independence of thecourts is improved by one unit (e.g. an improvement from the level of Lithuania to Poland {an increase of the index from 4 to 5}, or fromthe level of Turkey to about the level of France {from 5.5 to 6.7}), this would lower the propensity to engage in these acts by 2-to-3percentage points.
Panel B of Table 4 displays the instrumental variables results related to dishonest attitudes. The dependent variables in this groupmeasure people’s approval of dishonest behavior. For example, the outcome in cell (1) is an indicator that identifies if the respondentindicated that “if you want to make money, you can’t always act honestly”. Other outcomes in this group include the approval of suchacts as cheating on taxes, bribing a government official, concealing the faults of a product when selling, buying a stolen good, andmaking a false insurance claim. Panel B shows that an increase in institutional quality, measured by people’s perceptions of judicialindependence, mitigates these attitudes. In other words, an improvement in people’s assessment of judicial independence makes themless likely to declare that dishonest acts are acceptable. For example, an improvement in perceived judicial quality from the level ofHungary to the level of France lowers the propensity to believe that “you cannot always act honestly if you want to make money” by 10percentage points, or by 20 percent from the baseline. The same improvement in perceived judicial quality lowers the propensity todeclare that “cheating on taxes is not wrong” by 32 percent.
Table 4 also reports the F-statistics of the instruments in each first-stage regression.17 The F-values are large, indicating significantfirst-stage relationship between the instrument and the endogenous variable. In Appendix Table A1 we report some first-stage re-gressions related to models presented in Table 4. The instrumental variables regressions reported in Table 4 all have the same first-stage,but they differ in the sample size. Thus, we only report the first-stage results from models (1) and (6) of panel A, where the sample sizesare 25,770 and 52,656, respectively, and the first stage results pertaining to models (1) and (6) of Panel B with sample sizes of 27,165and 54,043, respectively. As Appendix Table A1 shows, the instrument is positively and highly statistically significantly (with p-values of0.000) related to the endogenous variable in all cases. The other first-stages provide almost identical results, as expected.
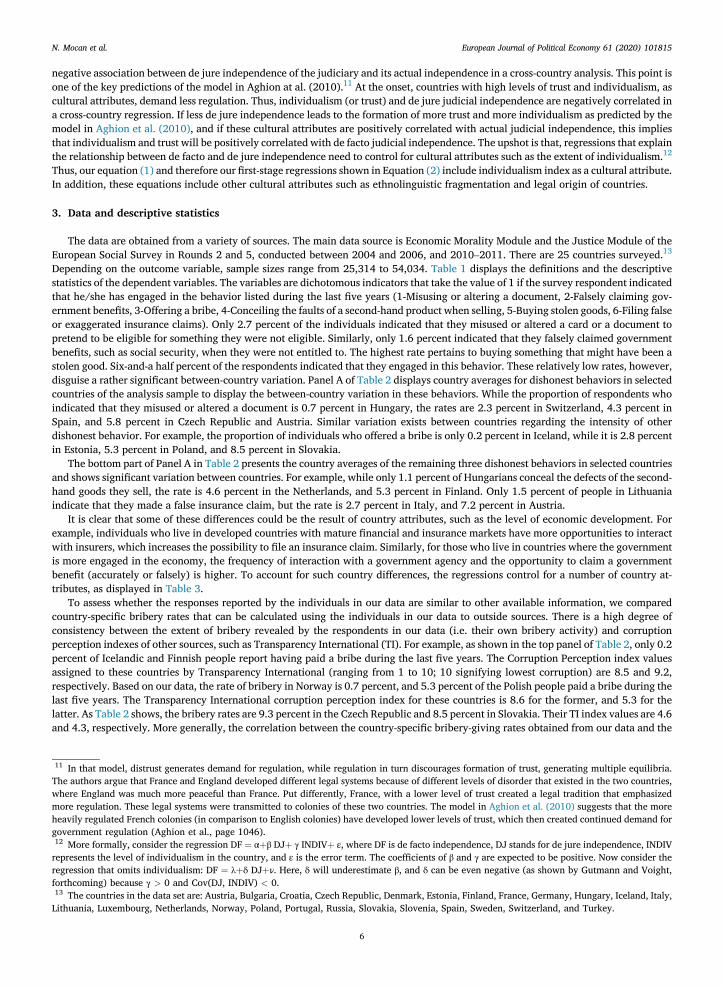
Table 5 presents the results of the same regressions with one difference: judicial quality is measured by the variable Impartial Courts.The inference is not altered. An increase in the quality of judicial institutions, measured by the extent to which courts are impartial andnot subject to manipulation, lowers both propensity to engage in criminal acts (the top panel of Table 5), and it also lowers the pro-pensity to find dishonesty acceptable (the bottom panel of Table 5). Selected first-stage regressions of Table 5 are reported inAppendix Table A2.
We repeat the same analysis using the protection of property rights as a measure of institutional quality. The results, reported in
15 Data are retrieved from the website: http://comparativeconstitutionsproject.org/download-data/.16 Full set of results are available upon request.17 They are the Kleibergen-Paap F-statistics based on clustered standard errors.
10

Table 4The impact of judicial independence on crimes, misdemeanors and dishonest attitudes (IV results).
A: The Impact of Perceived Judicial Independence on Crimes and Misdemeanors
(1) (2) (3)
¼ ¼ 1 if in the last 5 years the respondent at least once …
…Misused or altered a document …Falsely claimed governmentbenefits
…Offered a bribe
Perception ofJudicial
Independence
�0.025*** �0.024*** �0.028***(0.028) (0.006) (0.022){0.195} {0.140} {0.151}[0.031] [0.012] [0.026]
N 25,770 25,801 25,825First stage (F-stat.) 18.32 18.74 18.84
(4) (5) (6)
¼ ¼ 1 if in the last 5 years the respondent at least once …
…Concealed faults when selling a second-handproduct
…Bought possibly stolen goods …Exaggerated an insurance claim
Perception ofJudicial
Independence
�0.000 �0.020*** �0.024***(0.994) (0.001) (0.000){0.994} {0.005} {0.016}[0.994] [0.002] [0.000]
N 25,314 26,623 52,655First stage (F-stat.) 18.26 369.5 55.85
B: The Impact of Judicial Independence on Dishonest Attitudes
(1) (2) (3)
Cannot always act honestly if you want to makemoney
Cheating on taxes is not wrong Bribery is not wrong
Perception ofJudicial
Independence
�0.071*** �0.038*** �0.034***(0.008) (0.013) (0.001){0.088} {0.051} {0.029}[0.012] [0.017] [0.002]
N 27,165 27,332 27,365First stage (F-stat.) 18.43 18.15 18.19
(4) (5) (6)
Concealing faults of a second-hand product is notwrong
Buying possibly stolen goods is notwrong
Exaggerating an insurance claim is notwrong
Perception ofJudicial
Independence
�0.030*** �0.063*** �0.060***(0.007) (0.000) (0.000){0.046} {0.000} {0.001}[0.012] [0.000] [0.000]
N 27,417 26,818 54,043First stage (F-stat.) 17.99 367.5 55.74
Standard errors are clustered at the region level (NUTS1 or NUTS2). The p-values are reported in (parentheses). P-values related to standard errorsclustered at the country level, are reported in {curly brackets}. The p-values adjusted for multiple hypothesis testing are reported in [brackets]. *:significant at 10 percent level, **: significant at 5 percent level and ***: significant at 1 percent level. The instrument is the appointment procedures ofjudges and prosecutors.
N. Mocan et al. European Journal of Political Economy 61 (2020) 101815
Appendix Table A3, are similar to those reported in Tables 4 and 5. Using the three measures of institutional quality employed in theregressions so far (Judicial independence, Impartial Courts, Protection of Property Rights), we obtained their mean value, which is thenemployed as a summary measure of institutional quality. The results of the instrumental variables regressions that use this judicialquality average, reported in Appendix Table A4, are consistent with previous results.18 In summary, the results reveal that the perceivedquality of judicial institutions has a deterrent effect on dishonest and criminal acts, and it also reduces people’s propensity to havedishonest attitudes.19
Appendix Tables A7-A10 display the OLS counterparts of the instrumental variables regressions reported in Tables 4 and 5, A3 andA4. The signs and the statistical significance of the coefficients are consistent between the OLS and IV specification with a couple of
18 The correlations between the four measures of institutional quality are very high, ranging from 0.93 to 0.98.19 The first-stage results (the coefficient and p-value of the instrument in each first-stage) related to models of Appendix A3 and A4 are displayed inAppendix A5 and A6.
11
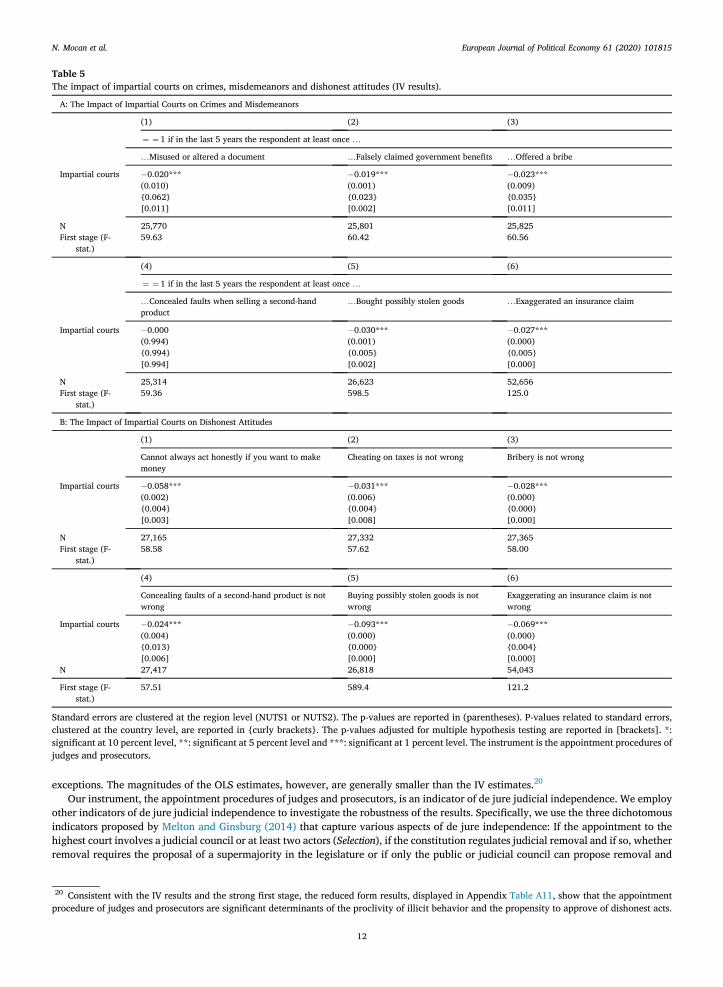
Table 5The impact of impartial courts on crimes, misdemeanors and dishonest attitudes (IV results).
A: The Impact of Impartial Courts on Crimes and Misdemeanors
(1) (2) (3)
¼ ¼ 1 if in the last 5 years the respondent at least once …
…Misused or altered a document …Falsely claimed government benefits …Offered a bribe
Impartial courts �0.020*** �0.019*** �0.023***(0.010) (0.001) (0.009){0.062} {0.023} {0.035}[0.011] [0.002] [0.011]
N 25,770 25,801 25,825First stage (F-
stat.)59.63 60.42 60.56
(4) (5) (6)
¼ ¼ 1 if in the last 5 years the respondent at least once …
…Concealed faults when selling a second-handproduct
…Bought possibly stolen goods …Exaggerated an insurance claim
Impartial courts �0.000 �0.030*** �0.027***(0.994) (0.001) (0.000){0.994} {0.005} {0.005}[0.994] [0.002] [0.000]
N 25,314 26,623 52,656First stage (F-
stat.)59.36 598.5 125.0
B: The Impact of Impartial Courts on Dishonest Attitudes
(1) (2) (3)
Cannot always act honestly if you want to makemoney
Cheating on taxes is not wrong Bribery is not wrong
Impartial courts �0.058*** �0.031*** �0.028***(0.002) (0.006) (0.000){0.004} {0.004} {0.000}[0.003] [0.008] [0.000]
N 27,165 27,332 27,365First stage (F-
stat.)58.58 57.62 58.00
(4) (5) (6)
Concealing faults of a second-hand product is notwrong
Buying possibly stolen goods is notwrong
Exaggerating an insurance claim is notwrong
Impartial courts �0.024*** �0.093*** �0.069***(0.004) (0.000) (0.000){0.013} {0.000} {0.004}[0.006] [0.000] [0.000]
N 27,417 26,818 54,043
First stage (F-stat.)
57.51 589.4 121.2
Standard errors are clustered at the region level (NUTS1 or NUTS2). The p-values are reported in (parentheses). P-values related to standard errors,clustered at the country level, are reported in {curly brackets}. The p-values adjusted for multiple hypothesis testing are reported in [brackets]. *:significant at 10 percent level, **: significant at 5 percent level and ***: significant at 1 percent level. The instrument is the appointment procedures ofjudges and prosecutors.
N. Mocan et al. European Journal of Political Economy 61 (2020) 101815
exceptions. The magnitudes of the OLS estimates, however, are generally smaller than the IV estimates.20
Our instrument, the appointment procedures of judges and prosecutors, is an indicator of de jure judicial independence. We employother indicators of de jure judicial independence to investigate the robustness of the results. Specifically, we use the three dichotomousindicators proposed by Melton and Ginsburg (2014) that capture various aspects of de jure independence: If the appointment to thehighest court involves a judicial council or at least two actors (Selection), if the constitution regulates judicial removal and if so, whetherremoval requires the proposal of a supermajority in the legislature or if only the public or judicial council can propose removal and
20 Consistent with the IV results and the strong first stage, the reduced form results, displayed in Appendix Table A11, show that the appointmentprocedure of judges and prosecutors are significant determinants of the proclivity of illicit behavior and the propensity to approve of dishonest acts.
12

Table 6The Impact of Perceived Judicial Independence on Crimes, Misdemeanors. and Dishonest Attitudes (IV Results using de jure independence indicatorsas Instruments).
A: The Impact of Judicial Independence on Crimes and Misdemeanors
(1) (2) (3)
¼ ¼ 1 if in the last 5 years the respondent at least once …
…Misused or altered a document …Falsely claimed governmentbenefits
…Offered a bribe
(A) Selection �0.037* (0.084) {0.389} �0.027* (0.070) {0.311} �0.021 (0.254) {0.331}(B) Removal 0.020*** (0.000) {0.015} 0.013*** (0.002) {0.037} 0.007 (0.271) {0.386}(C) Tenure �0.010*** (0.008) {0.043} �0.012*** (0.000) {0.001} �0.009*** (0.008) {0.008}(D) Aggregate de jure �0.029** (0.017) {0.202} �0.026*** (0.007) {0.136} �0.018* (0.060) {0.141}
N 25,770 25,801 25,825
(4) (5) (6)
¼ ¼ 1 if in the last 5 years the respondent at least once …
…Concealed faults when selling a second-handproduct
…Bought possibly stolen goods …Exaggerated an insurance claim
(A) Selection �0.010 (0.523) {0.676} �0.010 (0.419) {0.459} �0.030** (0.018) {0.210}(B) Removal 0.016*** (0.002) {0.017} �0.026 (0.257) {0.081} 0.013** (0.021) {0.215}(C) Tenure 0.005 (0.318) {0.429} �0.032*** (0.000) {0.001} �0.009*** (0.001) {0.000}(D) Aggregate de jure �0.010 (0.325) {0.535} �0.020** (0.010) {0.020} �0.021*** (0.001) {0.021}N 25,314 26,623 52,655B: The Impact of Judicial Independence on Dishonest Attitudes
(1) (2) (3)
Cannot always act honestly if you want to makemoney
Cheating on taxes is not wrong Bribery is not wrong
(A) Selection �0.132* (0.070) {0.392} �0.051 (0.116) {0.332} �0.050** (0.036) {0.238}(B) Removal �0.003 (0.855) {0.870} 0.006 (0.489) {0.488} 0.006 (0.146) {0.337}(C) Tenure �0.030* (0.098) {0.023} �0.026** (0.020) {0.010} �0.033*** (0.000) {0.001}(D) Aggregate de jure �0.066* (0.061) {0.102} �0.037 (0.106) {0.163} �0.049*** (0.006) {0.115}
N 27,165 27,332 27,365
(4) (5) (6)
Concealing faults of asecond-hand product isnot wrong
Buying possibly stolen goods is notwrong
Exaggerating an insurance claim is notwrong
(A) Selection �0.026 (0.189) {0.161} �0.095*** (0.000) {0.001} �0.101*** (0.004) {0.156}(B) Removal 0.005 (0.260) {0.398} �0.018 (0.541) {0.411} 0.017 (0.200) {0.511}(C) Tenure �0.031*** (0.000) {0.002} �0.051*** (0.000) {0.000} �0.059*** (0.000) {0.000}(D) Aggregate de jure �0.039** (0.025) {0.138} �0.072*** (0.000) {0.000} �0.094*** (0.000) {0.008}
N 27,417 26,818 54,043
In row (A) the instrument for judicial independence is the selection procedure to the highest court (Selection). In row (B), the instrument is the removalconditions of judges (Removal). In row (C) the instrument is the existence of tenure for judges (Tenure). They are obtained from Melton and Ginsburg(2014). In row (D) the instrument is the sum of the six indicators listed in Melton and Ginsburg (2014). They are the three indicators listed earlier(Selection, Removal, Tenure) and three others, which are: whether the constitution explicitly mentions judicial independence, whether judge salaries areprotected from political pressure, and removal procedures of judges. The details are provided in the data section. Standard errors are clustered at theregion level (NUTS1 or NUTS2). The p-values are reported in (parentheses). P-values related to standard errors, clustered at the country level, arereported in {curly brackets}. *: significant at 10 percent level, **: significant at 5 percent level and ***: significant at 1 percent level.
N. Mocan et al. European Journal of Political Economy 61 (2020) 101815
another political actor is required to approve such a proposal (Removal), and if judges have lifetime appointment (Tenure). We also usean index (the sum of all six items proposed by Melton and Ginsburg, 2014). Descriptive statistics of these variables are provided at thebottom of Table 3, and Table 6 summarizes the results. In these regressions, judicial quality is measured by judicial independence, whichis instrumented by either Selection (reported in row A), by Removal (reported in row B), by Tenure (reported in row C), or by theaggregate index of de jure independence (reported in row D). The results show that regardless of what specific indicator of de jurejudicial independence is used as the instrument, an improvement in the Perception of Judicial Independence reduces both the propensityfor dishonest behavior and the tendency to approve such behavior. When we use Impartiality of the Courts, Protection of Property Rights orthe Judicial Quality Average as alternative measures of judicial quality instead of Perception of Judicial Independence, we obtain verysimilar results to those reported in Table 6. These results are provided in Appendix Tables A12, A13 and A14.
13

N. Mocan et al. European Journal of Political Economy 61 (2020) 101815
5. Extensions and evidence from immigrants
We have employed four alternative measures of judicial independence in the paper. The results, based on these indicators of judicialquality are reported in Tables 4 and 5, A3 and A4. We also employed a fifth indicator of judicial quality: the rule of law index reported bythe World Bank. The instrumental variables results, using this measure as an indicator of judicial quality, provided the same inference.These results are reported in Appendix Table A15.
Although we cannot identify the exact mechanism through which people’s perceptions of the quality of judicial institutions in-fluences the propensity for dishonest actions and the tendency to approve of dishonest acts, an obvious pathway, as described in theintroduction, could be the relationship between perceived certainty of sanctions and the quality of judicial institutions. More specif-ically, a decay in the quality of institutions is expected to reduce the perceived certainty of punishment if a deterioration in judicialquality leads to inefficiency and uncertainty in the criminal justice system.
In the ESS data, the survey respondents are asked “How successful do you think police are at preventing crimes in your country?“.Options given ranged from 0 (extremely unsuccessful) to 10 (extremely successful). Calculating the proportion of individuals (weightedby survey weights) in each country who answered these questions as “Successful” (choosing a rating of 6 or higher) shows that people’sbeliefs about the effectiveness of the police in crime prevention is positively correlated with perceived judicial quality of the country(correlation coefficient¼ 0.55) as well as with the impartiality of the courts (correlation coefficient¼ 0.58).21
Although we demonstrate that judicial quality of the country has an impact on people’s propensity for dishonest behavior and ontheir dishonest attitudes, it can be argued that the indicators of judicial quality may capture (or represent) cultural/moral/ethical di-mensions of the society. More specifically, cultural norms and beliefs, which have an impact on individuals’ behaviors and attitudes,could also influence the level of judicial quality in the country. Under this scenario, actual and perceived judicial quality would berelated to society’s general attitudes towards such concepts as fairness, equal opportunity, trust, income/wealth, and family values. Totest this conjecture, we chose questions from the ESS that were posed to the respondents to gauge their attitudes towards wealth, theirbeliefs in whether people try to take advantage of them (being suspicious of others), attitudes towards equality, and the belief in familybeing the main priority in life. Specifically, we used the question in which the survey respondents were asked: “How much is the person inthis description like you? It is important for him/her to be rich. He/she wants to have a lot of money and expensive things”. Possible responsesrange from 1 (very much like me) to 6 (not like me at all). We created a dummy variable that takes the value of 1 if the responded chose avalue of 1–4 for this question, and zero otherwise, to represent the belief that it is important to be rich. This variable is called It isimportant to have money. Similarly, we used the question: “How much is the person in this description like you? He/she thinks it is importantthat every person in the world be treated equally. She/he believes everyone should have equal opportunities in life” to create a dichotomousindicator to represent the survey respondent’s belief in equal treatment of others. This variable is titled It is important that people aretreated equally.
We also employed the question: “Do you think most people would try to take advantage of you if they got the chance, or would they try to befair?” to create a dummy variable to indicate the belief that most people wouldn’t try to take advantage of others.22 Finally, we usedpeople’s responses to the statement: “A person’s family ought to be his or her main priority in life”, and coded as 1 those responses thatindicated agreement or strong agreement with the statement. This variable is called Family is Priority in Life.
Employing the same instrument used in Tables 4 and 5 (appointment procedures of judges and prosecutors) and using these fourdummy variables as outcomes, we find that indicators of institutional quality have no statistically significant impact on these beliefs. Theresults are displayed in Table 7. These findings taken together demonstrate that although perceived judicial quality has an influence onthe proclivity of illicit behavior and that it impacts dishonest attitudes (shows in Tables 4 and 5 A3, A4), judicial quality does not impactother beliefs such as the importance of the family, believing in the fairness of people, believing in fair treatment of others, and theimportance of being rich.
It can be argued that the instrument used in the paper (country-specific procedures with which judges are prosecutors are appointed)can be altered by governments, and that such modifications could be reflections of current cultural characteristics of the country. Moregenerally, indicators of de jure judicial independence (what is written in fundamental legal documents) can be altered as a function ofthe changes in the current cultural environment of the country. Alternatively, culture may be extremely stable, which implies that anylong-standing cultural attributes of the society that have produced a certain level de jure judicial independence a long time ago (e.g.particular judge/prosecutor appointment procedure), may still be prevailing in the society today. If this is the case, some contemporarycultural attributes of the country would be correlated with the instrument, and these cultural attributes would also impact individuals’dishonest actions and attitudes, violating the conditional independence assumption of the instrument.
To investigate the validity of this conjecture, we focus on immigrants and estimate the samemodels using the sub-sample of first- andsecond-generation immigrants. Following the large literature on the transmission of cultural attributes (Mocan, forthcoming, Alesinaet al., 2015; Alesina and Giuliano, 2010, Fern�andez and Fogli, 2009), we assume that the first-generation immigrants brought with themtheir ancestral cultural attributes when they migrated from their countries of origin to the destination countries, and that these valuesare transmitted to the second-generation. These cultural attributes of immigrants’ country of origin should not be strongly correlated
21 The correlation between perceived police effectiveness and other indicators of judicial quality used in the paper is also high. It is 0.63 in case ofthe Protection of Property Rights, and 0.60 in case of the Judicial Quality Average.22 Possible answers ranged from 0 (most people would try to take advantage of me) to 10 (most people would try to be fair). A dichotomous in-dicator is created which takes the value of 1 if the respondent chose a value of 5 or higher to answer this question. This variable is called Most Peopletry to be fair.
14

Table 7The impact of judicial quality on beliefs regarding the importance of family, being rich, fairness and equal treatment (IV estimates).
A: The Impact of Judicial Independence
(1) (2) (3) (4)
¼ ¼ 1 if the respondent believes …
…It is important to havemoney
…Most people try to befair
…It is important people are treatedequally
…Family is priority inlife
Perception of JudicialIndependence
�0.020 0.020 0.001 0.015(0.425) (0.301) (0.912) (0.566){0.568} {0.412} {0.929} {0.681}
N 26,195 26,041 25,924 24,769
B: The Impact of Protection of Property Rights
(1) (2) (3) (4)
…It is important to havemoney
…Most people try to befair
…It is important people are treatedequally
…Family is priority inlife
Protection of property rights �0.029 0.029 0.001 0.020(0.388) (0.348) (0.911) (0.563){0.460} {0.543} {0.927} {0.675}
N 26,195 26,041 25,924 24,769
C: The Impact of Impartial Courts
(1) (2) (3) (4)
…It is important to havemoney
…Most people try to befair
…It is important people are treatedequally
…Family is priority inlife
Impartial courts �0.017 0.017 0.001 0.014(0.404) (0.327) (0.911) (0.562){0.523} {0.478} {0.928} {0.670}
N 26,195 26,041 25,924 24,769
D: The Impact of Judicial Quality Average
(1) (2) (3) (4)
…It is important to havemoney
…Most people try to befair
…It is important people are treatedequally
…Family is priority inlife
Judicial Quality Average �0.021 0.021 0.001 0.016(0.407) (0.322) (0.911) (0.563){0.525} {0.474} {0.928} {0.673}
N 26,195 26,041 25,924 24,769
Standard errors are clustered at the region. The p-values are reported in (parentheses). P-values related to standard errors that are clustered at thecountry level, are reported in {curly brackets}.*: significant at 10 percent level, **: significant at 5 percent level and ***: significant at 1 percent level.The instrument in these regressions is the appointment procedures of judges and prosecutors.
N. Mocan et al. European Journal of Political Economy 61 (2020) 101815
with the current cultural values of the destination countries. This means that the instrument (measures of de jure judicial independence)in a given country is unlikely to be correlated with cultural attributes of the immigrants who have migrated to that country fromdifferent countries of origin.23
Tables 8 and 9 present the results obtained from the sample of immigrants using judicial independence and impartial courts,respectively, as indicators of judicial quality. The protection of property rights index and the average of the three quality indicatorsprovided very similar results. The sample contains both the first-generation and the second-generation immigrants.24 An individual isidentified as a second-generation immigrant if he/she was born in the country but at least one parent was born in some other country.The first-stage F-statistics are large, indicating the strength of the instrument. As in previous tables, we also report p-values related tostandard errors that are clustered at the country level in {curly brackets} and p-values [in brackets] that adjust for multiple hypothesistesting. The results show that an increase in the quality of judicial institutions, represented by an improvement in court impartiality orjudicial independence, has a negative impact on dishonest behaviors and on the beliefs regarding the appropriateness of these behaviorsin the sample of immigrants. Furthermore, the point estimates indicate that the estimated marginal impacts are similar in this sample to
23 The lack of (or low) correlation between cultural attributes of immigrants and the native population of the receiving country could be moreprevalent for immigrants from Muslim countries. In the data set, however, there are only about 300 first- and second-generation of such immigrants,which makes a separate analysis infeasible.24 Regressions include an indicator for the first-generation.
15

Table 8The impact of perceived judicial independence on crimes, misdemeanors and dishonest attitudes among immigrants (IV results).
A: The Impact of Judicial Independence on Crimes and Misdemeanors
(1) (2) (3)
¼ ¼ 1 if in the last 5 years the respondent at least once …
…Misused or altered a document …Falsely claimed governmentbenefits
…Offered a bribe
Perception of JudicialIndependence
�0.023* �0.014** �0.032**(0.072) (0.029) (0.035){0.103} {0.012} {0.055}[0.123] [0.084] [0.084]
N 3711 3730 3726First stage (F-stat.) 36.18 38.27 37.98Mean dependent variable 0.032 0.018 0.021
(4) (5) (6)
¼ ¼ 1 if in the last 5 years the respondent at least once …
…Concealed faults when selling a second-hand product
…Bought possibly stolen goods …Exaggerated an insurance claim
Perception of JudicialIndependence
0.023*** �0.003 �0.017**(0.009) (0.803) (0.012){0.001} {0.825} {0.026}[0.048] [0.876] [0.048]
N 3649 3831 7560First stage (F-stat.) 35.23 158.1 49.24Mean dependent variable 0.028 0.073 0.028
B: The Impact of Judicial Independence on Dishonest Attitudes
(1) (2) (3)
Cannot always act honestly if you want tomake money
Cheating on taxes is not wrong Bribery is not wrong
Perception of JudicialIndependence
0.025 �0.019 �0.034**(0.374) (0.411) (0.049){0.092} {0.050} {0.033}[0.493] [0.493] [0.098]
N 3938 3947 3956First stage (F-stat.) 38.72 38.06 38.72Mean dependent variable 0.538 0.192 0.040
(4) (5) (6)
Concealing faults of a second-hand product isnot wrong
Buying possibly stolen goods is notwrong
Exaggerating an insurance claim is notwrong
Perception of JudicialIndependence
0.000 �0.042*** �0.018(0.985) (0.007) (0.231){0.967} {0.000} {0.284}[0.985] [0.048] [0.347]
N 3970 3842 7758First stage (F-stat.) 38.00 156.7 49.54Mean dependent variable 0.076 0.136 0.128
Standard errors are clustered at the region level (NUTS1 or NUTS2). The p-values are reported in (parentheses). P-values related to standard errors thatare clustered at the country level, are reported in {curly brackets}. The p-values adjusted for multiple hypothesis testing are reported in [brackets]. *:significant at 10 percent level, **: significant at 5 percent level and ***: significant at 1 percent level. The instrument in these regressions is theappointment procedures of judges and prosecutors.
N. Mocan et al. European Journal of Political Economy 61 (2020) 101815
16

Table 9The impact of impartial courts on crimes, misdemeanors and dishonest attitudes. Among immigrants (IV results).
A: The Impact of Impartial Courts on Crimes and Misdemeanors
(1) (2) (3)
¼ ¼ 1 if in the last 5 years the respondent at least once …
…Misused or altered a document …Falsely claimed governmentbenefits
…Offered a bribe
Impartial courts �0.024* �0.015** �0.033**(0.062) (0.022) (0.027){0.053} {0.001} {0.018}[0.106] [0.065] [0.065]
N 3711 3730 3726First stage (F-stat.) 74.36 78.04 76.81Mean dependent
variable0.032 0.018 0.021
(4) (5) (6)
¼ ¼ 1 if in the last 5 years the respondent at least once …
…Concealed faults when selling a second-handproduct
…Bought possibly stolen goods …Exaggerated an insurance claim
Impartial courts 0.024*** �0.004 �0.020**(0.007) (0.803) (0.014){0.000} {0.827} {0.026}[0.042] [0.876] [0.056]
N 3649 3831 7560First stage (F-stat.) 71.94 406.9 129.1Mean dependent
variable0.028 0.073 0.028
B: The Impact of Impartial Courts on Dishonest Attitudes
(1) (2) (3)
Cannot always act honestly if you want to makemoney
Cheating on taxes is not wrong Bribery is not wrong
Impartial courts 0.026 �0.020 �0.035**(0.372) (0.408) (0.045){0.100} {0.023} {0.009}[0.490] [0.490] [0.090]
N 3938 3947 3956First stage (F-stat.) 76.91 75.30 76.64Mean dependent
variable0.538 0.192 0.040
(4) (5) (6)
Concealing faults of a second-hand product is notwrong
Buying possibly stolen goods is notwrong
Exaggerating an insurance claim is notwrong
Impartial courts 0.000 �0.051*** �0.022(0.985) (0.006) (0.248){0.967} {0.000} {0.342}[0.985] [0.042] [0.372]
N 3970 3842 7758First stage (F-stat.) 75.88 416.9 127.2Mean dependent
variable0.076 0.136 0.128
Standard errors are clustered at the region level (NUTS1 or NUTS2). The p-values are reported in (parentheses). P-values related to standard errorsclustered at the country level, are reported in {curly brackets}. The p-values adjusted for multiple hypothesis testing are reported in [brackets]. *:significant at 10 percent level, **: significant at 5 percent level and ***: significant at 1 percent level. The instrument in these regressions is theappointment procedures of judges and prosecutors.
N. Mocan et al. European Journal of Political Economy 61 (2020) 101815
those obtained from the whole sample, although there are some differences. The average proclivity of dishonest behavior and theaverage propensity of the approval of such behavior in this immigrant sample are also similar to those obtained from the entire sample,reported in Table 4, implying that the magnitudes in percentage terms are similar between the immigrant sample and the whole sample.Thus, the results of Tables 8 and 9 indicate that the conclusions of the paper are not due to the correlation between the instrument andunobserved personal attributes of individuals.
17

N. Mocan et al. European Journal of Political Economy 61 (2020) 101815
6. Summary and conclusion
Institutions have an impact on economic interactions between agents, they are strongly related to economic performance of countries(Acemoglu et al., 2011; Knack and Keefer, 1995; North, 1991, 1981), and there exist a number of pathways through which institutionalquality can interact with government policy to impact economic development (Acemoglu and Johnson, 2005; Rodrik et al., 2004; Halland Jones, 1999).25 Judicial system is an important component of the body of institutions in a country, and North (1990) underlines theimportance of the judicial system in the enforcement of contracts to facilitate transactions to foster economic activity.
Institutions can also alter individual behavior to the extent that they determine part of the landscape of incentives, and that behaviorsrespond to incentives. For example, judicial system’s lack of independence and courts’ lack of impartiality may provide a signal to thecitizens about the ambiguity of judicial decisions. This may, in turn, lead to an increased propensity to disregard the rule of law.Furthermore, increased and wide-speared disregard of the rule of law and the ensuing illicit behavior maymodify the social norms in thesociety regarding the acceptability of unlawful and dishonest behavior.
We use micro data on residents of 25 European countries and employ alternative measures of judicial quality as perceived by theresidents (e.g. judicial independence, or the impartiality of the courts) to investigate the extent to which the quality of judicial in-stitutions has an impact on individuals’ propensity for criminal and dishonest behavior and on their views regarding the acceptability ofsuch behavior. Acknowledging that the quality of judicial institutions (actual or perceived) is endogenous, we employ as an instrumentthe procedures used in each country with which prosecutors and judges are appointed to their posts.
The manner in which judges are prosecutors are appointed are indicators of de jure judicial independence. The structure of a legalsystem and the provisions listed in its fundamental laws establish the components of de jure judicial independence. Examples includelaws that guarantee the independence of judges, provisions about the selection and removal procedures of judges to insulate them fromshort-term political pressures, and provisions for the duration of judicial appointments (e.g. lifelong appointments).
The components of de jure judicial independence (i.e. the provisions in the legal documents) influence their factual implementations(de facto quality). It is reasonable to assume that the actual experience of a country regarding the independence of its judiciary (de factojudicial independence) is what shapes the citizens’ perceptions of judicial quality. This implies that de jure judicial independence wouldimpact people’s perceptions of judicial quality through its impact on de facto judicial independence. But de jure judicial quality (what iswritten in the legal documents) cannot have a direct impact on people’s beliefs and behaviors.
In this framework, indicators of de jure judicial independence would be a valid instrument for perceived judicial quality. In additionto using appointment procedures of judges and prosecutors as a measure of de jure judicial independence, we also employ alternativeindicators of de jure quality (Melton and Ginsburg, 2014) as instruments.
Empirical analyses show that perceived quality of the judicial institutions has a significant impact on people’s propensity to break thelaw and on their propensity to declare dishonest behavior acceptable. An improvement in the quality of judicial institutions, related tothe variation in the manner judges and prosecutors are appointed to their posts, reduces people’s propensity to falsely claim a gov-ernment benefit, to offer a bribe, to buy stolen goods, to misuse or alter a document, and to make an exaggerated or false insuranceclaim. In addition, we find that judicial quality alters people’s beliefs about the acceptability of dishonesty and illegal behavior. Animprovement in judicial quality reduces people’s tendency to agree with the statement that “You cannot always act honestly if you wantto make money”. It also makes it less likely to find acceptable acts such as buying stolen goods, concealing the faults of a good whenselling it, making an exaggerated insurance claim, cheating on taxes, and bribery. The findings are robust to using alternative measuresof de jure judicial independence as instruments.
Low judicial quality could be a symptom of underlying cultural norms and beliefs. In other words, judicial quality could be related togeneral attitudes in the society towards concepts and beliefs such as fairness, equal opportunity, importance of income/wealth, and soon. Using additional questions from the same survey, however, we find that judicial quality does not impact other beliefs such as theimportance of the family, believing in the fairness of people, believing in fair treatment of others, and the importance of being rich.
More formally, unobserved factors that impact the behavior and the beliefs of individuals are captured by the error term in Equation(1). The instrument (components of de jure judicial independence, such as the procedures with which the judges/prosecutors areappointed) might be invalid if those cultural attributes (that are included in the error term) also influence the instrument. For example, ifhonesty is a strong cultural attribute that impacts most people in the society, this would reduce the propensity for dishonest behavior ofindividuals, but it could also make it more likely for the country to write to its constitution an honest and transparent procedure toappoint judges. Given that immigrants might have unobservable characteristics that reflect cultural values of their countries of origin,potential correlation between individual unobservables (the error term) and the instrument is less likely in the sample of immigrants.Thus, the validity of the instrument is stronger in an analysis of immigrants. We find, however, that the results obtained from theimmigrant sample are very similar to those obtained from the whole sample, providing evidence for conditional independence of theinstrument and the reliability of the results.
In summary, the results reveal that the quality of judicial institutions has a deterrent effect on dishonest and criminal acts, and it alsoreduces the propensity to have dishonest attitudes, indicating that institutions help shape the beliefs of the society.
Acknowledgements
We thank Luiza Pogorelova for outstanding research assistance. Janet Bentzen, Anastasia Litina, Andreas Ek, Jonathan Klick,
25 See Glaeser et al. (2004) on the difficulties in establishing a causal link from institutions to economic development.
18

N. Mocan et al. European Journal of Political Economy 61 (2020) 101815
Andreas Irmen, Marco Vannini, Claudio Detotto, Brian McCannon and participants of ASREC Europe 2018 Conference in LuxembourgCity, the LACEA-AL CAPONEWorkshop on Economics of Crime in Montevideo, Uruguay, CRENoS Workshop on Institutions, IndividualBehavior and Economic Outcomes, the SEA Meetings in New Orleans, Louisiana and two anonymous referees provided helpful com-ments. Bielen acknowledges the financial support from Research Foundation Flanders, grant number 12S3117N.
APPENDIX
Table A1First Stage Results of IV Estimates Reported in Table 4
(1) (2) (3) (4)
19
Judge & prosecutor appointment procedure
0.344***(0.000)0.440***(0.000)
0.343***(0.000)
0.439***(0.000)
Clearance rate
1.523***(0.002)2.181***(0.000)
1.569***(0.002)
2.147***(0.000)
GDP per capita
0.000***(0.000)0.000***(0.000)
0.000***(0.000)
0.000***(0.000)
Country Education
�0.268**(0.038)�0.152*(0.095)
�0.263**(0.035)
�0.152*(0.094)
Individualism
0.007(0.329)0.018***(0.001)
0.006(0.380)
0.018***(0.002)
Ethno-linguistic fragmentation
�0.133(0.861)0.369(0.516)
0.227(0.742)
0.523(0.346)
Democratic years
�0.002(0.908)�0.005(0.501)
�0.004(0.786)
�0.006(0.384)
Population
�0.004(0.350)�0.006***(0.000)
�0.004(0.364)
�0.006***(0.000)
Government consumption
9.286***(0.005)9.661***(0.000)
10.533***(0.001)
10.422***(0.000)
French legal origin
�0.334(0.369)�0.731***(0.002)
�0.435(0.222)
�0.766***(0.001)
Socialist/communist legal origin
�2.113***(0.002)�2.909***(0.000)
�2.289***(0.001)
�2.987***(0.000)
German legal origin
1.662***(0.000)1.586***(0.000)
1.652***(0.000)
1.599***(0.000)
Age
0.007***(0.001)0.000(0.968)
0.007***(0.001)
0.000(0.867)
Age2
0.000(0.138)0.000(0.368)
0.000(0.203)
0.000(0.354)
Male
�0.056***(0.000)�0.020*(0.054)
�0.062***(0.000)
�0.026*(0.010)
Ethnic minority
0.250**(0.011)0.090(0.184)
0.256***(0.007)
0.101(0.148)
Working
�0.021(0.309)0.013(0.452)
�0.020(0.288)
0.015(0.378)
Years of schooling
0.013**(0.013)0.005(0.168)
0.013**(0.011)
0.004(0.207)
Married
�0.001(0.969)�0.014(0.351)
�0.001(0.953)
�0.017(0.253)
Low religiosity
0.120***(0.007)0.170***(0.001)
0.149***(0.001)
0.185***(0.000)
Medium religiosity
0.048*(0.089)0.072**(0.019)
0.066**(0.015)
0.077**(0.011)
Born in the country
0.013(0.756)�0.082***(0.008)
0.005(0.907)
�0.084***(0.009)
N
25,770 52,656 27,165 54,043P-values related to standard errors, clustered at the region level, are reported in (parentheses). Standard errors clustered at the country level did notchange the inference that the instrument is significant. To conserve space, the coefficients of household income, the location and the attributes of theresidence are not reported.
Table A2First Stage Results of IV Estimates reported in Table 5
(1) (2) (3) (4)
Judge & prosecutor appointment procedure
0.425***(0.000)0.385***(0.000)
0.423***(0.000)
0.382***(0.000)
Clearance rate
�0.423(0.164)0.247(0.269)
�0.415(0.168)
0.228(0.288)
GDP per capita
0.000***(0.000)0.000***(0.000)
0.000***(0.000)
0.000***(0.000)
(continued on next page)
N. Mocan et al. European Journal of Political Economy 61 (2020) 101815
Table A2 (continued )
(1)
20
(2)
(3) (4)Education
�0.281***(0.000)�0.217***(0.000)
�0.276***(0.000)
�0.213***(0.000)
Individualism
0.003(0.668)0.014***(0.000)
0.002(0.705)
0.013***(0.000)
Ethno-linguistic fragmentation
1.638***(0.000)2.548***(0.000)
1.820***(0.000)
2.597***(0.000)
Democratic years
0.032***(0.000)0.024***(0.000)
0.031***(0.000)
0.024***(0.000)
Population
�0.007***(0.004)�0.003***(0.000)
�0.007***(0.005)
�0.004***(0.000)
Government consumption
13.146***(0.000)9.577***(0.000)
13.747***(0.000)
9.927***(0.000)
French legal origin
�1.193***(0.000)�1.465***(0.000)
�1.255***(0.000)
�1.482***(0.000)
Socialist/communist legal origin
�1.460***(0.001)�2.045***(0.000)
�1.541***(0.000)
�2.084***(0.000)
German legal origin
1.126***(0.000)0.516***(0.000)
1.114***(0.000)
0.524***(0.000)
Age
0.004**(0.012)0.000(0.677)
0.003**(0.019)
0.000(0.762)
Age2
0.000(0.132)0.000(0.338)
0.000(0.197)
0.000(0.360)
Male
�0.022***(0.009)�0.012**(0.039)
�0.025***(0.003)
�0.013**(0.014)
Ethnic minority
0.125**(0.016)0.054*(0.098)
0.133***(0.008)
0.057*(0.087)
Working
�0.029**(0.029)0.002(0.832)
�0.029**(0.014)
0.003(0.775)
Years of schooling
0.015***(0.000)0.010***(0.000)
0.015***(0.000)
0.010***(0.000)
Married
0.008(0.498)�0.009(0.303)
0.008(0.466)
�0.010(0.279)
Low religiosity
0.048(0.192)0.126***(0.000)
0.065*(0.070)
0.131***(0.000)
Medium religiosity
0.027(0.280)0.060***(0.007)
0.038*(0.099)
0.062***(0.004)
Born in the country
0.041(0.175)�0.015(0.424)
0.038(0.214)
�0.015(0.469)
N
25,770 52,656 27,165 54,043P-values related to standard errors, clustered at the region level, are reported in (parentheses). Standard errors clustered at the country level did notchange the inference that the instrument is significant. To conserve space, the coefficients of household income, the location and the attributes of theresidence are not reported.
Table A3The Impact of Protection of Property Rights on Crimes, Misdemeanors and Dishonest Attitudes. (IV Results)
A: The Impact of Protection of Property Rights on Crimes and Misdemeanors
(1)
(2) (3) ¼ ¼ 1 if in the last 5 years the respondent at least once ……Misused or altered a document
…Falsely claimed governmentbenefits…Offered a bribe
Protection of propertyrights
�0.035***
�0.033*** �0.040*** (0.006) (0.000) (0.005) {0.006} {0.001} {0.000} [0.007] [0.000] [0.007]N
25,770 25,801 25,825 First stage F 79.33 79.71 80.77(4)
(5) (6)¼ ¼ 1 if in the last 5 years the respondent at least once …
…Concealed faults when selling a second-handproduct
…Bought possibly stolen goods
…Exaggerated an insurance claimProtection of propertyrights
�0.000
�0.032*** �0.041*** (0.994) (0.001) (0.000) {0.994} {0.008} {0.014} [0.994] [0.002] [0.000](continued on next page)

N. Mocan et al. European Journal of Political Economy 61 (2020) 101815
Table A3 (continued )
N
25,3142
26,623
1
52,656
First stage F 78.41 389.2 44.72B: The Impact of Protection of Property Rights on Dishonest Attitudes
(1)
(2) (3)Cannot always act honestly if you want to makemoney
Cheating on taxes is not wrong
Bribery is not wrongProtection of propertyrights
�0.098***
�0.053*** �0.047*** (0.002) (0.007) (0.000) {0.001} {0.007} {0.011} [0.003] [0.008] [0.000]N
27,165 27,332 27,365 First stage F 78.44 78.27 79.60(4)
(5) (6)Concealing faults of a second-hand product is notwrong
Buying possibly stolen goods is notwrong
Exaggerating an insurance claim is notwrong
Protection of propertyrights
�0.041***
�0.099*** �0.106*** (0.006) (0.000) (0.000) {0.053} {0.000} {0.052} [0.007] [0.000] [0.000]N
27,417 26,818 54,043 First stage F 78.78 387.5 43.51Standard errors are clustered at the region level (NUTS1 or NUTS2). The p-values are reported in (parentheses). The p-values related to standard errors,clustered at the country level, are reported in {curly brackets}. The p-values adjusted for multiple hypothesis testing are reported in [brackets]. *:significant at 10 percent level, **: significant at 5 percent level and ***: significant at 1 percent level.
Table A4The Impact of Judicial Quality Average on Crimes, Misdemeanors and Dishonest Attitudes(IV Results)
A: The Impact of Perceived Judicial Independence on Crimes and Misdemeanors
(1)
(2) (3) ¼ ¼ 1 if in the last 5 years the respondent at least once ……Misused or altered a document
…Falsely claimed governmentbenefits…Offered a bribe
Judicial QualityAverage
�0.026**
�0.024*** �0.029** (0.012) (0.001) (0.010) {0.073} {0.032} {0.039} [0.013] [0.002] [0.012]N
25,770 25,801 25,825 First stage (F-stat.) 45.56 46.24 46.54(4)
(5) (6)¼ ¼ 1 if in the last 5 years the respondent at least once …
…Concealed faults when selling a second-handproduct
…Bought possibly stolen goods
…Exaggerated an insurance claimJudicial QualityAverage
�0.000
�0.027*** �0.029*** (0.994) (0.001) (0.000) {0.994} {0.004} {0.003} [0.994] [0.002] [0.000]N
25,314 26,623 52,656 First stage (F-stat.) 45.36 1013.3 105.1B: The Impact of Judicial Independence on Dishonest Attitudes
(1)
(2) (3)Cannot always act honestly if you want to makemoney
Cheating on taxes is not wrong
Bribery is not wrongJudicial QualityAverage
�0.072***
�0.039*** �0.034*** (0.003) (0.007) (0.000) {0.010} {0.005} {0.001} [0.005] [03009] [0.000]N
27,165 27,332 27,365(continued on next page)

N. Mocan et al. European Journal of Political Economy 61 (2020) 101815
Table A4 (continued )
First stage (F-stat.)
45.37 44.6522
44.95
(4)
(5) (6)Concealing faults of a second-hand product is notwrong
Buying possibly stolen goods is notwrong
Exaggerating an insurance claim is notwrong
Judicial QualityAverage
�0.030***
�0.082*** �0.074*** (0.004) (0.000) (0.000) {0.017} {0.000} {0.002} [0.006] [0.000] [0.000]N
27,417 26,818 54,043 First stage (F-stat.) 44.48 1001.1 102.4Standard errors are clustered at the region level (NUTS1 or NUTS2). The p-values are reported in (parentheses). The p-values related to standard errors,clustered at the country level, are reported in {curly brackets}. The p-values adjusted for multiple hypothesis testing are reported in [brackets]. *:significant at 10 percent level, **: significant at 5 percent level and ***: significant at 1 percent level.
Table A5First stage results of IV estimates in Table A3
A: The Impact of Protection of Property Rights on Crimes and Misdemeanors
(1)
(2) (3)Judge & prosecutor appointment procedure
0.248***(0.000)0.248***(0.000)
0.249***(0.000)
N
25,770 25,801 25,825(4)
(5) (6) Judge & prosecutor appointment procedure 0.247***(0.000)
0.570***(0.000)0.255***(0.000)
N
25,314 26,623 52,656B: The Impact of Protection of Property Rights on Dishonest Attitudes
(1)
(2) (3)Judge & prosecutor appointment procedure
0.248***(0.000)0.248***(0.000)
0.250***(0.000)
N
27,165 27,332 27,365 (4) (5) (6)Judge & prosecutor appointment procedure
0.249***(0.000)0.569***(0.000)
0.251***(0.000)
N
27,417 26,818 54,043Only the coefficient and the (p-value) of the instrument are reported. These first-stage regressions contain all variables dis-played in Tables A1, A2 and their footnotes. Standard errors are clustered at the region level. Standard errors, clustered at thecountry level, did not change the inference that the instrument is significant.
Table A6First Stage Results of IV Estimates in Table A4
A: The Impact of Judicial Quality Average on Crimes and Misdemeanors
(1)
(2) (3)Judge & prosecutor appointment procedure
0.339*** 0.340*** 0.341*** (0.000) (0.000) (0.000)N
25,770 25,801 25,825(4)
(5) (6)Judge & prosecutor appointment procedure
0.338*** 0.691*** 0.360*** (0.000) (0.000) (0.000)N
25,314 26,623 52,656B: The Impact of Judicial Quality Average on Dishonest Attitudes
(1)
(2) (3)Judge & prosecutor appointment procedure
0.338*** 0.338*** 0.339*** (0.000) (0.000) (0.000)N
27,165 27,332 27,365(4)
(5) (6)Judge & prosecutor appointment procedure
0.338*** 0.690*** 0.358*** (0.000) (0.000) (0.000)N
27,417 26,818 54,043
N. Mocan et al. European Journal of Political Economy 61 (2020) 101815
Only the coefficient and the (p-value) of the instrument are reported. These first-stage regressions contain all variables dis-played in Tables A1, A2 and their footnotes. Standard errors are clustered at the region level. Standard errors, clustered at thecountry level, did not change the inference that the instrument is significant.
Table A7The Impact of Judicial Independence on Crimes, Misdemeanors and Dishonest Attitudes(OLS Results)
A: The Impact of Judicial Independence on Crimes and Misdemeanors
(1)
23
(2)
(3)¼ ¼ 1 if in the last 5 years the respondent at least once …
…Misused or altered a document
…Falsely claimed governmentbenefits…Offered a bribe
Perception of Judicialindependence
0.001
�0.002* �0.005*** (0.002) (0.001) (0.002) {0.002} {0.002} {0.003}N
25,770 25,801 25,825(4)
(5) (6)¼ ¼ 1 if in the last 5 years the respondent at least once …
…Concealed faults when selling a second-hand product
…Bought possibly stolen goods
…Exaggerated an insurance claimPerception of Judicialindependence
0.005***
�0.021*** �0.004*** (0.002) (0.005) (0.002) {0.003} {0.004} {0.002}N
25,314 26,623 52,656 B: The Impact of Judicial Independence on Dishonest Attitudes(1)
(2) (3)Cannot always act honestly if you want tomake money
Cheating on taxes is not wrong
Bribery is not wrongPerception of Judicialindependence
�0.016***
�0.008** �0.007*** (0.007) (0.005) (0.002) {0.007} {0.005} {0.003}N
27,165 27,332 27,365(4)
(5) (6)Concealing faults of a second-hand product isnot wrong
Buying possibly stolen goods is notwrong
Exaggerating an insurance claim is notwrong
Perception of Judicialindependence
�0.010***
�0.051*** �0.021*** (0.003) (0.006) (0.004) {0.004} {0.007} {0.007}N
27,417 26,818 54,043Standard errors are clustered at the region level (NUTS1 or NUTS2). The p-values are reported in (parentheses). P-values, related to clustered at thecountry level, are reported in {curly brackets}.*: significant at 10 percent level, **: significant at 5 percent level and ***: significant at 1 percent level.
Table A8The Impact of Protection of Property Rights on Crimes, Misdemeanors and Dishonest Attitudes (OLS Results)
A: The Impact of Protection of Property Rights on Crimes and Misdemeanors
(1)
(2) (3)¼ ¼ 1 if in the last 5 years the respondent at least once …
…Misused or altered a document
…Falsely claimed governmentbenefits…Offered a bribe
Protection of propertyrights
�0.007**
�0.010*** �0.021*** (0.004) (0.003) (0.004) {0.005} {0.003} {0.004}N
25,770 25,801 25,825 (4) (5) (6)¼ ¼ 1 if in the last 5 years the respondent at least once …
…Concealed faults when selling a second-handproduct
…Bought possibly stolen goods
…Exaggerated an insurance claim�0.003
�0.017** �0.004(continued on next page)

N. Mocan et al. European Journal of Political Economy 61 (2020) 101815
Table A8 (continued )
Protection of propertyrights
(0.005)
2
(0.007)
4
(0.002)
{0.006} {0.011} {0.003}N
25,314 26,623 52,656B: The Impact of Protection of Property Rights on Dishonest Attitudes
(1)
(2) (3)Cannot always act honestly if you want to makemoney
Cheating on taxes is not wrong
Bribery is not wrongProtection of propertyrights
�0.005
�0.005 �0.010** (0.010) (0.008) (0.004) {0.012} {0.007} {0.005}N
27,165 27,332 27,365(4)
(5) (6)Concealing faults of a second-hand product is notwrong
Buying possibly stolen goods is notwrong
Exaggerating an insurance claim is notwrong
Protection of propertyrights
�0.011**
�0.063*** �0.014** (0.005) (0.011) (0.006) {0.006} {0.016} {0.013}N
27,417 26,818 54,043Standard errors are clustered at the region level (NUTS1 or NUTS2). The p-values are reported in (parentheses). P-values, related to clustered at thecountry level, are reported in {curly brackets}.*: significant at 10 percent level, **: significant at 5 percent level and ***: significant at 1 percent level.
Table A9The Impact of Impartial Courts on Crimes, Misdemeanors and Dishonest Attitudes(OLS Results)
A: The Impact of Impartial Courts on Crimes and Misdemeanors
(1)
(2) (3)¼ ¼ 1 if in the last 5 years the respondent at least once …
…Misused or altered a document
…Falsely claimed government benefits …Offered a bribeImpartialcourts
0.001
�0.004*** �0.010*** (0.002) (0.002) (0.002) {0.003} {0.002} {0.003}N
25,770 25,801 25,825(4)
(5) (6)¼ ¼ 1 if in the last 5 years the respondent at least once …
…Concealed faults when selling a second-handproduct
…Bought possibly stolen goods
…Exaggerated an insurance claimImpartialcourts
0.006**
�0.027*** �0.004* (0.003) (0.008) (0.002) {0.003} {0.006} {0.003}N
25,314 26,623 52,656 B: The Impact of Impartial Courts on Dishonest Attitudes(1)
(2) (3)Cannot always act honestly if you want to makemoney
Cheating on taxes is not wrong
Bribery is not wrongImpartialcourts
�0.021**
�0.006 �0.012*** (0.008) (0.005) (0.002) {0.009} {0.005} {0.003}N
27,165 27,332 27,365 (4) (5) (6)Concealing faults of asecond-hand product is not wrong
Buying possibly stolen goods is notwrong
Exaggerating an insurance claim is notwrong
Impartialcourts
�0.008**
�0.064*** �0.019*** (0.003) (0.010) (0.005) {0.004} {0.013} {0.009}N
27,417 26,818 54,043Standard errors are clustered at the region level (NUTS1 or NUTS2). The p-values are reported in (parentheses). P-values, related to clustered at thecountry level, are reported in {curly brackets}.*: significant at 10 percent level, **: significant at 5 percent level and ***: significant at 1 percent level.

N. Mocan et al. European Journal of Political Economy 61 (2020) 101815
Table A10The Impact of Judicial Quality Average on Crimes, Misdemeanors and Dishonest Attitudes(OLS Results)
A: The Impact of Judicial Quality Average on Crimes and Misdemeanors
(1)
(2)25
(3)
¼ ¼ 1 if in the last 5 years the respondent at least once …
…Misused or altered a document
…Falsely claimed governmentbenefits…Offered a bribe
Judicial QualityAverage
�0.001
�0.005** �0.011*** (0.002) (0.002) (0.003) {0.004} {0.003} {0.004}N
25,770 25,801 25,825(4)
(5) (6)¼ ¼ 1 if in the last 5 years the respondent at least once …
…Concealed faults when selling a second-handproduct
…Bought possibly stolen goods
…Exaggerated an insurance claimJudicial QualityAverage
0.005
�0.029*** �0.005** (0.003) (0.008) (0.002) {0.004} {0.007} {0.003}N
25,314 26,623 52,656 B: The Impact of Judicial Quality Average on Dishonest Attitudes(1)
(2) (3)Cannot always act honestly if you want to makemoney
Cheating on taxes is not wrong
Bribery is not wrongJudicial QualityAverage
�0.019**
�0.008 �0.011*** (0.009) (0.006) (0.003) {0.010} {0.005} {0.004}N
27,165 27,332 27,365(4)
(5) (6)Concealing faults of a second-hand product is notwrong
Buying possibly stolen goods is notwrong
Exaggerating an insurance claim is notwrong
Judicial QualityAverage
�0.012***
�0.074*** �0.025*** (0.004) (0.009) (0.005) {0.005} {0.010} {0.010}N
27,417 26,818 54,043Standard errors are clustered at the region level (NUTS1 or NUTS2). The p-values are reported in (parentheses). P-values, related to clustered at thecountry level, are reported in {curly brackets}.*: significant at 10 percent level, **: significant at 5 percent level and ***: significant at 1 percent level.
Table A11The Impact of Judge & Prosecutor Appointment Procedure on Crimes, Misdemeanors and Dishonest Attitudes (Reduced Form Results)
A: The Impact of Judge & Prosecutor Appointment Procedure on Crimes and Misdemeanors
(1)
(2) (3)¼ ¼ 1 if in the last 5 years the respondent at least once …
…Misused or altered a document
…Falsely claimed government benefits …Offered a bribeInstrument
�0.009*** �0.008*** �0.010*** (0.003) (0.002) (0.004) {0.002} {0.001} {0.003}N
25,770 25,801 25,825(4)
(5) (6)¼ ¼ 1 if in the last 5 years the respondent at least once …
…Concealed faults when selling a second-hand product
…Bought possibly stolen goods …Exaggerated an insurance claimInstrument
�0.000 �0.018*** �0.010*** (0.003) (0.005) (0.002) {0.003} {0.006} {0.002}N
25,314 26,623 52,656 B: The Impact of Judge & Prosecutor Appointment Procedure on Dishonest Attitudes(1)
(2) (3)(continued on next page)

N. Mocan et al. European Journal of Political Economy 61 (2020) 101815
Table A11 (continued )
Cannot always act honestly if you want to make money
Cheating on taxes is not wrong26
Bribery is not wrong
Instrument �0.024*** �0.013*** �0.012***(0.008)
(0.005) (0.003) {0.006} {0.003} {0.003}N
27,165 27,332 27,365(4)
(5) (6)Concealing faults of a second-hand product is notwrong
Buying possibly stolen goods is notwrong
Exaggerating an insurance claim is notwrong
Instrument
�0.010*** �0.056*** �0.026*** (0.004) (0.006) (0.004) {0.004} {0.009} {0.007}N
27,417 26,818 54,043Standard errors are clustered at the region level (NUTS1 or NUTS2). The p-values are reported in (parentheses). P-values, related to clustered at thecountry level, are reported in {curly brackets}.*: significant at 10 percent level, **: significant at 5 percent level and ***: significant at 1 percent level.The instrument in these regressions is the appointment procedures of judges and prosecutors.
Table A12The Impact of Impartial Courts on Crimes, Misdemeanors and Dishonest Attitudes(IV Results using de jure independence indicators as Instruments)
A: The Impact of Impartial Courts on Crimes and Misdemeanors
(1)
(2) (3)¼ ¼ 1 if in the last 5 years the respondent at least once …
…Misused or altered a document
… Falsely claimed government benefits …Offered a bribe(A) Selection
�0.019** (0.017) {0.103} �0.014** (0.014) {0.024} �0.011 (0.217) {0.164} (B) Removal 0.046*** (0.007) {0.184} 0.029** (0.016) {0.214} 0.016 (0.303) {0.476} (C) Tenure �0.009*** (0.006) {0.017} �0.010*** (0.000) {0.000} �0.008*** (0.007) {0.004} (D) Aggregate de jure �0.018*** (0.002) {0.030} �0.016*** (0.000) {0.003} �0.011** (0.043) {0.049}N
25,770 25,801 25,825(4)
(5) (6)¼ ¼ 1 if in the last 5 years the respondent at least once …
…Concealed faults when selling a second-handproduct
…Bought possibly stolen goods
…Exaggerated an insurance claim(A) Selection
�0.005 (0.488) {0.602} �0.017 (0.426) {0.475} �0.025*** (0.003) {0.073} (B) Removal 0.039** (0.015) {0.177} 0.078 (0.512) {0.778} 0.042* (0.086) {0.439} (C) Tenure 0.004 (0.324) {0.456} �0.245 (0.200) {0.596} �0.015*** (0.001) {0.001} (D) Aggregate de jure �0.006 (0.284) {0.445} �0.029** (0.011) {0.029} �0.022*** (0.000) {0.011}N
25,314 26,623 52,655B: The Impact of Impartial Courts on Dishonest Attitudes
(1)
(2) (3)Cannot always act honestly if you want to makemoney
Cheating on taxes is not wrong
Bribery is not wrong(A) Selection
�0.061*** (0.004) {0.032} �0.023* (0.053) {0.019} �0.023*** (0.001) {0.000} (B) Removal �0.006 (0.855) {0.867} 0.014 (0.504) {0.545} 0.014 (0.188) {0.458} (C) Tenure �0.025 (0.102) {0.024} �0.022** (0.020) {0.015} �0.028*** (0.000) {0.000} (D) Aggregate de jure �0.037** (0.049) {0.016} �0.020* (0.085) {0.049} �0.027*** (0.000) {0.000} N 27,165 27,332 27,365(4)
(5) (6)Concealing faults of a second-hand product isnot wrong
Buying possibly stolen goods is notwrong
Exaggerating an insurance claim is notwrong
(A) Selection
�0.012 (0.172) {0.195} �0.163*** (0.000) {0.023} �0.079*** (0.000) {0.048} (B) Removal 0.013 (0.276) {0.474} 0.058 (0.661) {0.820} 0.053 (0.255) {0.582} (C) Tenure �0.026*** (0.000) {0.001} �0.390 (0.131) {0.541} �0.093*** (0.000) {0.017} (D) Aggregate de jure �0.021*** (0.005) {0.018} �0.103*** (0.000) {0.000} �0.092*** (0.000) {0.008}N
27,417 26,818 54,043In row (A) the instrument judicial independence is the selection procedure to the highest court (Selection). In row (B), the instrument is the removalconditions of judges (Removal). In row (C) the instrument is the existence of tenure for judges (Tenure). They are obtained from Melton and Ginsburg(2014). In row (D) the instrument is the sum of the six indicators listed in Melton and Ginsburg (2014). They are the three indicators listed earlier(Selection, Removal, Tenure) and three others, which are: whether the constitution explicitly mentions judicial independence, whether judge salaries areprotected from political pressure, and removal procedures of judges. The details are provided in the data section. Standard errors are clustered at the

N. Mocan et al. European Journal of Political Economy 61 (2020) 101815
region level (NUTS1 or NUTS2). The p-values are reported in (parentheses). P-values, related to clustered at the country level, are reported in {curlybrackets}. *: significant at 10 percent level, **: significant at 5 percent level and ***: significant at 1 percent level.Table A13The Impact of Protection of Property Rights on Crimes, Misdemeanors and Dishonest Attitudes(IV Results using de jure independence indicators as Instruments)
A: The Impact of Protection of Property Rights on Crimes and Misdemeanors
(1)
(2)27
(3)
¼ ¼ 1 if in the last 5 years the respondent at least once …
…Misused or altered a document
… Falsely claimed government benefits …Offered a bribe(A) Selection
�0.052** (0.024) {0.151} �0.038** (0.018) {0.047} �0.029 (0.207) {0.024} (B) Removal 0.262 (0.476) {0.729} 0.154 (0.447) {0.710} 0.087 (0.577) {0.768} (C) Tenure �0.024*** (0.007) {0.012} �0.027*** (0.000) {0.000} �0.021*** (0.006) {0.000} (D) Aggregate de jure �0.041*** (0.002) {0.017} �0.036*** (0.000) {0.001} �0.026** (0.035) {0.001} N 25,770 25,801 25,825(4)
(5) (6)¼ ¼ 1 if in the last 5 years the respondent at least once …
…Concealed faults when selling a second-handproduct
…Bought possibly stolen goods
…Exaggerated an insurance claim(A) Selection
�0.014 (0.490) {0.592} �0.010 (0.422) {0.527} �0.033*** (0.002) {0.027} (B) Removal 0.227 (0.491) {0.734} 0.014 (0.290) {0.460} �0.058* (0.067) {0.281} (C) Tenure 0.011 (0.330) {0.494} 0.111** (0.011) {0.232} �3.698 (0.960) {0.984} (D) Aggregate de jure �0.014 (0.278) {0.412} �0.037** (0.018) {0.057} �0.038*** (0.002) {0.039}N
25,314 26,623 52,655B: The Impact of Protection of Property Rights on Dishonest Attitudes
(1)
(2) (3)Cannot always act honestly if you want to makemoney
Cheating on taxes is not wrong
Bribery is not wrong(A) Selection
�0.175** (0.015) {0.171} �0.067* (0.066) {0.144} �0.065*** (0.009) {0.091} (B) Removal �0.028 (0.856) {0.866} 0.062 (0.590) {0.703} 0.062 (0.424) {0.691} (C) Tenure �0.070 (0.106) {0.037} �0.060** (0.023) {0.038} �0.077*** (0.000) {0.002} (D) Aggregate de jure �0.087* (0.059) {0.038} �0.048* (0.087) {0.082} �0.064*** (0.000) {0.011}N
27,165 27,332 27,365(4)
(5) (6)Concealing faults of a second-hand product isnot wrong
Buying possibly stolen goods is notwrong
Exaggerating an insurance claim is notwrong
(A) Selection
�0.034 (0.189) {0.265} �0.091*** (0.000) {0.000} �0.107*** (0.000) {0.077} (B) Removal 0.056 (0.451) {0.687} 0.010 (0.573) {0.656} �0.095 (0.235) {0.526} (C) Tenure �0.073*** (0.000) {0.009} 0.179** (0.040) {0.370} �15.936 (0.942) {0.978} (D) Aggregate de jure �0.050*** (0.008) {0.049} �0.132*** (0.000) {0.000} �0.165*** (0.000) {0.082}N
27,417 26,818 54,043In row (A) the instrument judicial independence is the selection procedure to the highest court (Selection). In row (B), the instrument is the removalconditions of judges (Removal). In row (C) the instrument is the existence of tenure for judges (Tenure). They are obtained from Melton and Ginsburg(2014). In row (D) the instrument is the sum of the six indicators listed in Melton and Ginsburg (2014). They are the three indicators listed earlier(Selection, Removal, Tenure) and three others, which are: whether the constitution explicitly mentions judicial independence, whether judge salaries areprotected from political pressure, and removal procedures of judges. The details are provided in the data section. Standard errors are clustered at theregion level (NUTS1 or NUTS2). The p-values are reported in (parentheses). P-values, related to clustered at the country level, are reported in {curlybrackets}.*: significant at 10 percent level, **: significant at 5 percent level and ***: significant at 1 percent level.
Table A14The Impact of the Judicial Quality Average on Crimes, Misdemeanors and Dishonest Attitudes (IV Results using de jure independence indicators asInstruments)
A: The Impact of Judicial Quality Average on Crimes and Misdemeanors
(1)
(2) (3)¼ ¼ 1 if in the last 5 years the respondent at least once …
…Misused or altered a document
… Falsely claimed government benefits …Offered a bribe(A) Selection
�0.031** (0.027) {0.181} �0.022** (0.021) {0.074} �0.017 (0.220) {0.156} (B) Removal 0.039*** (0.003) {0.103} 0.025*** (0.009) {0.140} 0.014 (0.297) {0.453} (C) Tenure �0.012*** (0.006) {0.020} �0.013*** (0.000) {0.000} �0.010*** (0.007) {0.002}(continued on next page)

N. Mocan et al. European Journal of Political Economy 61 (2020) 101815
Table A14 (continued )
(D) Aggregate de jure
�0.026*** (0.003) {0.058} �0.023***28
(0.000)
{0.012} �0.016** (0.042) {0.039}N
25,770 25,801 25,825(4)
(5) (6)¼ ¼ 1 if in the last 5 years the respondent at least once …
…Concealed faults when selling a second-handproduct
…Bought possibly stolen goods
…Exaggerated an insurance claim(A) Selection
�0.008 (0.497) {0.622} �0.011 (0.420) {0.486} �0.029*** (0.003) {0.062} (B) Removal 0.033*** (0.008) {0.101} 0.070 (0.456) {0.742} 0.035* (0.061) {0.374} (C) Tenure 0.005 (0.322) {0.451} �0.114** (0.017) {0.247} �0.017*** (0.001) {0.000} (D) Aggregate de jure �0.009 (0.294) {0.467} �0.027** (0.012) {0.026} �0.025*** (0.000) {0.008}N
25,314 26,623 52,655 B: The Judicial Quality Average on Dishonest Attitudes(1)
(2) (3)Cannot always act honestly if you want to makemoney
Cheating on taxes is not wrong
Bribery is not wrong(A) Selection
�0.101** (0.010) {0.126} �0.039* (0.059) {0.071} �0.038*** (0.003) {0.003} (B) Removal �0.005 (0.855) {0.869} 0.012 (0.498) {0.517} 0.012 (0.169) {0.403} (C) Tenure �0.034* (0.100) {0.020} �0.030** (0.020) {0.011} �0.038*** (0.000) {0.000} (D) Aggregate de jure �0.056** (0.049) {0.018} �0.031* (0.085) {0.059} �0.041*** (0.000) {0.002}N
27,165 27,332 27,365(4)
(5) (6)Concealing faults of a second-hand product isnot wrong
Buying possibly stolen goods is notwrong
Exaggerating an insurance claim is notwrong
(A) Selection
�0.019 (0.169) {0.140} �0.108*** (0.000) {0.000} �0.094*** (0.000) {0.038} (B) Removal 0.011 (0.270) {0.440} 0.051 (0.641) {0.799} 0.044 (0.233) {0.556} (C) Tenure �0.036*** (0.000) {0.001} �0.182*** (0.001) {0.084} �0.108*** (0.000) {0.004} (D) Aggregate de jure �0.032*** (0.007) {0.028} �0.096*** (0.000) {0.000} �0.109*** (0.000) {0.007}N
27,417 26,818 54,043In row (A) the instrument judicial independence is the selection procedure to the highest court (Selection). In row (B), the instrument is the removalconditions of judges (Removal). In row (C) the instrument is the existence of tenure for judges (Tenure). They are obtained from Melton and Ginsburg(2014). In row (D) the instrument is the sum of the six indicators listed in Melton and Ginsburg (2014). They are the three indicators listed earlier(Selection, Removal, Tenure) and three others, which are: whether the constitution explicitly mentions judicial independence, whether judge salaries areprotected from political pressure, and removal procedures of judges. The details are provided in the data section. Standard errors are clustered at theregion level (NUTS1 or NUTS2). The p-values are reported in (parentheses). P-values, related to clustered at the country level, are reported in {curlybrackets}.*: significant at 10 percent level, **: significant at 5 percent level and ***: significant at 1 percent level.
Table A15The Impact of Rule of Law on Crimes, Misdemeanors and Dishonest Attitudes (IV Results)
A: The Impact of Rule of Law on Crimes and Misdemeanors
(1)
(2) (3)¼ ¼ 1 if in the last 5 years the respondent at least once …
…Misused or altered a document
…Falsely claimed government benefits …Offered a bribeRule of Law
�0.398* �0.378** �0.449** (0.066) (0.028) (0.043) {0.283} {0.244} {0.217} [0.072] [0.045] [0.057]N
25,770 25,801 25,825 First stage (F-stat.)
7.819 7.866 7.995(4)
(5) (6)¼ ¼ 1 if in the last 5 years the respondent at least once …
…Concealed faults when selling a second-handproduct
…Bought possibly stolen goods
…Exaggerated an insurance claimRule of Law
�0.001 �0.076*** �0.136*** (0.994) (0.003) (0.001) {0.994} {0.027} {0.131} [0.994] [0.009] [0.004]N
25,314 26,623 52,655(continued on next page)

N. Mocan et al. European Journal of Political Economy 61 (2020) 101815
Table A15 (continued )
First stage (F-stat.)
7.783
132.329
17.73
B: The Impact of Rule of Law on Dishonest Attitudes
(1)
(2) (3)Cannot always act honestly if you want to makemoney
Cheating on taxes is not wrong
Bribery is not wrongRule of Law
�1.084** �0.577** �0.511** (0.024) (0.049) (0.011) {0.164} {0.212} {0.157} [0.045] [0.059] [0.026]N
27,165 27,332 27,365 First stage (F-stat.)
8.651 8.709 8.869(4)
(5) (6)Concealing faults of a second-hand product is notwrong
Buying possibly stolen goods is notwrong
Exaggerating an insurance claim is notwrong
Rule of Law
�0.454** �0.235*** �0.350*** (0.030) (0.000) (0.001) {0.205} {0.002} {0.171} [0.045] [0.000] [0.004]N
27,417 26,818 54,043 First stage (F-stat.)
8.654 131.2 17.69Standard errors are clustered at the region level (NUTS1 or NUTS2). The p-values are reported in (parentheses). P-values related to standard errorsclustered at the country level, are reported in {curly brackets}. The p-values adjusted for multiple hypothesis testing are reported in [brackets]. *:significant at 10 percent level, **: significant at 5 percent level and ***: significant at 1 percent level. The instrument is the appointment procedures ofjudges and prosecutors.
References
Acemoglu, D., Cantoni, D., Johnson, S., Robinson, J.A., 2011. The consequences of radical reform: the French Revolution. Am. Econ. Rev. 101 (7), 3286–3307.Acemoglu, D., Johnson, S., 2005. Unbundling institutions. J. Political Econ. 113 (5), 949–995.Acemoglu, D., Johnson, S., Robinson, J., 2001. The colonial origins of comparative development: an empirical investigation. American Economics ReviewEconomy 91
(5), 1369–1401.Aghion, P., Algan, Y., Cahuc, P., Schleifer, A., 2010. Regulation and distrust. Q. J. Econ. 125, 1015–1049.Alesina, A., Fuchs-Schündeln, N., 2007. Goodbye Lenin (or not?): the effect of communism on people’s preferences. Am. Econ. Rev. 97 (4), 1507–1528.Alesina, A., Giuliano, P., 2010. The power of the family. J. Econ. Growth 15 (2), 93–125.Alesina, A., Algan, Y., Cahuc, P., Giuliano, P., 2015. Family ties and the regulation of labor. J. Eur. Econ. Assoc. 13 (4), 599–630.Ariely, Dan, Garcia-Rada, X., Gӧdker, K., Hornuf, L., Mann, H., 2019. The impact of two different economic systems and dishonesty. Eur. J. Political Econ.
(forthcoming).Benjamini, Y., Yekutieli, D., 2001. The control of the false discovery rate in multiple testing under dependency. Ann. Stat. 1165–1188.Bisin, A., Topa, G., Verdier, T., 2004. Cooperation as a transmitted cultural trait. Ration. Soc. 16, 477–507.Bisin, A., Verdier, T., 2001. The economics of cultural transmission and the dynamics of preferences. J. Econ. Theory 97, 298–319.Bisin, A., Verdier, T., 2000. Beyond the melting pot: cultural transmission, marriage and the evolution of ethnic and religious traits. Q. J. Econ. 955–988.Corman, H., Mocan, N., 2000. A time-series analysis of crime, deterrence, and drug abuse in New York city. Am. Econ. Rev. 90 (3), 584–604.Corman, H., Mocan, N., 2005. Carrots, sticks, and broken windows. J. Law Econ. 48 (1), 235–266.Di Tella, R., Galiant, S., Schargrodsky, E., 2007. The formation of beliefs: evidence from the allocation of land titles to squatters. Q. J. Econ. 122 (1), 209–241.Di Tella, R., Schargrodsky, E., 2004. Do police reduce crime? Estimates using the allocation of police forces after a terrorist attack. Am. Econ. Rev. 94 (1), 115–133.Drago, F., Galbiati, R., Vertova, P., 2009. The deterrent effects of prison: evidence from a natural experiment. J. Political Econ. 117 (2), 257–280.Du�sek, L., 2015. Time to punishment: the effects of a shorter criminal procedure on crime rates. Int. Rev. Law Econ. 43, 134–147.Elias, N., 1994. The Civilizing Process. Blackwell, Oxford.Feld, L.P., Voigt, S., 2003. Economic Growth and Judicial Independence: cross-country evidence using a new set of indicators. Eur. J. Political Econ. 19, 497–527.Fern�andez, R., Fogli, A., 2009. Culture: an empirical investigation of beliefs, work and fertility. Am. Econ. J. Macroecon. 1 (1), 146–177.Foucault, M., 1995. Discipline and Punish: the Birth of the Prison. Vintage Books, New York.Glaeser, E.L., La Porta, R., Lopez-de-Silanes, F., Shleifer, A., 2004. Do institutions cause growth? J. Econ. Growth 9 (3), 271–303.Gutmann, J. and S. Voigt (forthcoming). “Judicial independence in the EU: a puzzle.” Eur. J. Law Econ..Hall, R.E., Jones, C.I., 1999. Why do some countries produce so much more output per worker than others? Q. J. Econ. 114 (1), 83–116.Hayo, B., Voigt, S., 2007. Explaining de facto judicial independence. Int. Rev. Law Econ. 20, 269–290.Knack, S., Keefer, P., 1995. Institutions and economic performance: cross-country tests using alternative institutional measures. Econ. Pol. 7 (3), 207–227.Lago-Pe~nas, Ignacio, Lago-Pe~nas, S., 2010. The determinants of tax morale in comparative perspective: evidence from european countries. Eur. J. Political Econ. 26 (4),
441–453.Machin, S., Meghir, C., 2004. Crime and economic incentives. J. Hum. Resour. 39 (4), 958–979.Melton, J., Ginsburg, T., 2014. Does de jure judicial independence really matter? J. Law Courts 2, 187–217.Mocan, N.H., Yu, H., 2017. Can Superstition Create a Self-Fulfilling Prophecy? School Outcomes of Dragon Children of China. National Bureau of Economic Research.Mocan, N. (forthcoming). “The impact of taxes, and culture of leisure on labor supply in Europe”. J. Comp. Econ..Mocan, N., Raschke, C., 2016. Economic well-being and anti-semitic, xenophobic, and racist attitudes in Germany. Eur. J. Law Econ. 41 (1), 1–63.

N. Mocan et al. European Journal of Political Economy 61 (2020) 101815
Mocan, N., 2013. Vengeance. Rev. Econ. Stat. 95 (3), 969–982.Mocan, H.N., Bali, T.G., 2010. Asymmetric crime cycles. Rev. Econ. Stat. 92 (4), 899–911.Newson, R.B., 2010. Frequentist Q-values for multiple-test procedures. STATA J. 10 (4), 568.North, D.C., 1991. Institutions. J. Econ. Perspect. 5 (1), 97–112.North, D.C., 1990. Institutions, Institutional Change, and Economic Performance. Camebridge University Press, Camebridge.North, D.C., 1981. Structure and Change in Economic History. W.W. Norton & Co, New York.Orviska, Marta, Hudson, J., 2003. Tax evasion, civic duty and the law abiding citizen. Eur. J. Law Econ. 19 (1), 83–102.Pellegrina, L.D., 2008. Court delays and crime deterrence. Eur. J. Law Econ. 26 (3), 267–290.Raphael, S., Winter-Ebmer, R., 2001. Identifying the effect of unemployment on crime. J. Law Econ. 44 (1), 259–283.Rodrik, D., Subramanian, A., Trebbi, F., 2004. Institutions rule: the primacy of institutions over geography and integration in economic development. J. Econ. Growth 9
(2), 131–165.Soares, R.R., 2004. Development, crime and punishment: accounting for the international differences in crime rates. J. Dev. Econ. 73 (1), 155–184.Tabellini, Guido, 2008. The scope of cooperation: norms and incentives. Q. J. Econ. 123, 905–950.
30