european - departement ewi...1.3 data sources and data availability 12 2. innovation performance and...
TRANSCRIPT

EuropeanInnovation Scoreboard
2018
Innovation Leaders
Strong Innovators
Moderate Innovators
Modest Innovators
Innovation

Manuscript completed in May 2018Neither the European Commission nor any person acting on behalf of the Commission is responsible for the use that might be made of the following information.Luxembourg: Publications Office of the European Union, 2018© European Union, 2018Reuse is authorised provided the source is acknowledged. The reuse policy of European Commission documents is regulated by Decision 2011/833/EU (OJ L 330, 14.12.2011, p. 39).For any use or reproduction of photos or other material that is not under the EU copyright, permission must be sought directly from the copyright holders.
This report was prepared by:
Hugo Hollanders and Nordine Es-SadkiMaastricht University
(Maastricht Economic and Social Research Institute on Innovation and Technology – MERIT)Section 6.5 was prepared by: Juan Mateos-Garcia (Nesta) and Raphaële Moeremans (Deloitte)
as part of the European Innovation Scoreboards (EIS) project for the European Commission,Directorate-General for Internal Market, Industry, Entrepreneurship and SMEs.
Jointly coordinated and guided by:Mark Nicklas, Head of Unit, Daniel Bloemers, Alberto Licciardello, and Marshall Hsia
Directorate-General for Internal Market, Industry, Entrepreneurship and SMEsDirectorate F – Innovation and Advanced ManufacturingUnit F1 – Innovation Policy and Investment for Growth
andRomán Arjona, Chief Economist, Marnix Surgeon, Deputy Head of Unit, and Richard Deiss
Directorate-General for Research and InnovationUnit A4 – Analysis and monitoring of national research policies
Design, typeset and pre-press production: Aileen Orate, United Nations University
Acknowledgements:We thank the European Union Intellectual Property Office for sharing data on Design applications
and Invest Europe for sharing data on Venture capital expenditures.We also thank all statistical offices that shared fast-track CIS 2016 data.
The European Innovation Scoreboard report and annexes, and the indicators database are available at:http://ec.europa.eu/growth/industry/innovation/facts-figures/scoreboards/index_en.htm
Print ISBN 978-92-79-77623-6 ISSN 2467-4427 doi:10.2873/447902 ET-AY-18-001-EN-C
PDF ISBN 978-92-79-77622-9 ISSN 2467-4435 doi:10.2873/66501 ET-AY-18-001-EN-N

European Innovation Scoreboard 2018

European Innovation Scoreboard 2018

European Innovation Scoreboard 2018
Foreword“Society can only move forward as fast as it innovates. It can only provide lasting prosperity if it makes the most of the knowledge, entrepreneurial spirit and productivity of its people.”
(Commission Communication “A renewed European Agenda for Research and Innovation - Europe’s chance to shape its future”; contribution to the Informal EU Leaders’ meeting on innovation in Sofia on 16 May 2018)
With only 7% of the world’s population, Europe has a leading position in industrial sectors such as pharmaceuticals, mechanical engineering and fashion, accounts for 20% of global R&D investments, and yields one third of high-quality scientific publications. It is strong in incremental innova-tion and moving ahead in Key Enabling Technologies such as photonics and biotechnology.
The European Innovation Scoreboard 2018 shows improving performance and accelerating progress for Europe, and a positive outlook. However, while the Union’s innovation gap with the United States, Japan and Canada is foreseen to diminish, South Korea leads and China is catching up very fast. Europe needs to reinforce its efforts to ride the next wave of innovation and move towards cleaner and smarter industry and higher competi-tiveness, well-being and cohesion.
EU companies spend less on innovation. While business investments and venture capital investments increased in recent years, the EU lags be-hind the United States in this respect and is home to only a handful of Unicorn start-ups. Digitisation and fast-pace megatrends such as artificial intelligence and the circular economy offer huge opportunities, but also new challenges. As global competition intensifies, Europe must deepen its innovation edge to ensure success.
This is at the heart of the Commission’s Communication ‘A renewed European agenda for research and innovation - Europe’s chance to shape its future’, which highlights that Europe needs to step up its efforts in support of the creation and scale-up of breakthrough and disruptive innovations. A European Innovation Council will be piloted by Horizon 2020. The Internal Market and competition policies will be strengthened.
The EU budget for the future (2021-2027) includes EUR 100 billion for Horizon Europe, a sharp increase of resources for the successor of our highly successful Horizon 2020. This will accelerate innovation along the full value chain and support the identification and scale-up of the most promising breakthrough innovations, while connecting science and innovation better with citizens’ needs through missions. It will be important to integrate all European regions into innovation-led value chains by helping the wide diffusion of innovation.
In this respect, the Scoreboard reveals that innovation performance strongly diverges across the EU, with uneven progress. Since 2010, it improved in 18 EU Member States and declined in 10.
Small and medium-sized enterprises (SMEs) are engines of innovation, employment and cohesion, and they deserve special attention. Preliminary data suggest that for the EU as a whole, the decreasing trend in the share of SMEs that introduce innovations has recently been reversed. However, in many Member States, SMEs performance is still at pre-crisis levels.
The recently launched VentureEU fund of funds shall boost business investments. Many Member States need to increase their public research and innovation investments and reform their national innovation systems to make them more impactful. The Commission will support them through the Horizon 2020 Policy Support Facility. Equipping Europe for the era of deep-tech innovation requires joint efforts of EU, national, regional, and local actors.
We count on you – researchers, innovators, investors, and policy-makers – to accelerate innovation in Europe. And we are confident that the analysis in the European Innovation Scoreboard 2018 will support the development of policies to enhance innovation in Europe.
Elżbieta BieńkowskaEuropean Commissioner for Internal Market, Industry, Entrepreneurship and SMEs
Carlos MoedasEuropean Commissioner for Research, Science and Innovation

European Innovation Scoreboard 2018European Innovation Scoreboard 2018

European Innovation Scoreboard 2018
TABLE OF CONTENTS
Executive summary 6
1. Introduction 8
1.1 Measurement framework 8
1.2 Additional contextual analysis on the impact of structural differences between countries 10
1.3 Data sources and data availability 12
2. Innovation performance and trends 13
2.1 Most recent innovation performance 13
2.2 Performance changes 15
3. Performance of the EU innovation system 18
4. Innovation dimensions 20
5. Benchmarking innovation performance with non-EU countries 26
5.1 Benchmarking against other European countries and regional neighbours 26
5.2 Prospect for including Western Balkan countries 28
5.3 Benchmarking against global competitors 30
6. Expected short-term changes in EU innovation performance 38
6.1 Looking back at last year’s estimates 40
6.2 EU trend performance compared to China, Japan, South Korea, and the United States 41
6.3 Provisional CIS 2016 data 42
6.4 Short-term changes in EU innovation performance by indicator 44
6.5 Big data as a statistical source for innovation indicators 46
7. Country profiles 49
8. European Innovation Scoreboard methodology 86
Annex A: Country abbreviations 88
Annex B: Performance per indicator 88
Annex C: Current performance 89
Annex D: Performance change 91
Annex E: Definitions of indicators 93
Annex F: Summary Innovation Index (SII) time series 98
Annex G: Performance scores per dimension 99
Annex H: International data 100

6 European Innovation Scoreboard 2018
Executive summary
The annual European Innovation Scoreboard (EIS) provides a compara-tive assessment of the research and innovation performance of the EU Member States and selected third countries, and the relative strengths and weaknesses of their research and innovation systems. It helps coun-tries assess areas in which they need to concentrate their efforts in order to boost their innovation performance.
This year’s EIS reveals that the EU’s innovation performance continues to increase and that progress has accelerated in recent years. Further im-provement is expected for the near future, but progress remains uneven within the EU.
The EU is catching up with the United States, while it is losing ground vis-à-vis South Korea
At the global level, the EU continues to improve its position vis-à-vis the United States, Japan, and Canada. Relative to South Korea, the EU has been falling behind, but a gradual catch-up process is expected over the coming years. China is catching up at three times the EU’s innovation performance growth rate. The EU’s performance lead over Brazil, India, Russia, and South Africa remains considerable (Figure 1).
Figure 1: Global performance
Bars show countries’ performance in 2017 relative to that of the EU in 2017. The dashed
lines show the threshold values of the performance groups in 2017.
Innovation performance has increased for the EU but not for all Member States
On average, the innovation performance of the EU has increased by 5.8 percentage points since 2010. However, there has been no convergence between EU countries performing at lower levels and those performing at higher levels. Since 2010, innovation performance increased in 18 EU countries and decreased in 10. Performance has increased most in Lith-uania, Malta, the Netherlands, and the United Kingdom, and decreased most in Cyprus and Romania.
Member States are classified into four performance groups based on their average performance scores
Based on their average performance scores as calculated by a compos-ite indicator, the Summary Innovation Index, Member States fall into four different performance groups (Figure 2). Denmark, Finland, Luxem-bourg, the Netherlands, Sweden, and the United Kingdom are Innovation Leaders with innovation performance well above the EU average. Austria, Belgium, France, Germany, Ireland, and Slovenia are Strong In-novators with performance above or close to the EU average. The per-formance of Croatia, Cyprus, the Czech Republic, Estonia, Greece, Hun-gary, Italy, Latvia, Lithuania, Malta, Poland, Portugal, Slovakia, and Spain is below the EU average. These countries are Moderate Innovators. Bul-garia and Romania are Modest Innovators with performance well below the EU average.
In this year’s edition, Luxembourg (previously a Strong Innovator) joins the group of Innovation Leaders, while Germany (in previous editions classified as an Innovation Leader) drops to the group of Strong Innova-tors. However, overall performance differences between some Innova-tion Leaders and the top Strong Innovators are small.
0 25 50 75 100 125
South Korea
Canada
Australia
Japan
United States
EU
China
Brazil
South Africa
Russia
India

7European Innovation Scoreboard 2018
Performance of innovation systems is measured by average performance on 27 indicators
The EIS measurement framework distinguishes between four main types of indicators and ten innovation dimensions, capturing in total 27 different indicators. Framework conditions capture the main drivers of innovation performance external to the firm and cover three innovation dimensions: Human resources, Attractive research systems, as well as Innovation-friendly environment. Investments capture public and pri-vate investment in research and innovation and cover two dimensions: Finance and support and Firm investments. Innovation activities cap-ture the innovation efforts at the level of the firm, grouped in three inno-vation dimensions: Innovators, Linkages, and Intellectual assets. Im-pacts cover the effects of firms’ innovation activities in two innovation dimensions: Employment impacts and Sales impacts.
Since 2010, progress has been strongest in the Innovation-friendly en-vironment (notably Broadband penetration), Human resources (notably Doctorate graduates), and Attractive research systems (notably Inter-national co-publications). It is also encouraging that Firm investments and Venture capital expenditures have increased significantly. By con-trast, Public R&D expenditures as a share of GDP remain below their 2010 level.
The share of SMEs introducing innovations has decreased over the past decade, but preliminary data from the Community Innovation Survey suggest a positive trend reversal more recently. Along with further in-creases in Broadband penetration and Venture capital expenditures, business innovation activities are expected to drive an accelerated growth in EU innovation performance in the coming years.
Methodological continuity and refinement
For the 2017 edition of the European Innovation Scoreboard, the main measurement framework was significantly modified. For this year’s edi-tion, no changes have been made to the main measurement framework. However, due to data revisions for some indicators, the results for earlier years in this report are not comparable to those reported in the 2017 edition of the EIS. Following a need for additional contextual analyses to better understand performance differences on the innovation indicators used in the main measurement framework, a set of contextual indica-tors was introduced to the country profiles in the 2017 edition. For this year’s report, this list has been modified based on additional analyses and interactions with different stakeholders.
As regards country coverage, this year’s report includes for the first time available data for additional Western Balkan countries, which cannot yet be included in the extended European benchmarking (Albania, Bosnia and Herzegovina, Kosovo, and Montenegro).
0
20
40
60
80
100
120
140
160
Figure 2: Performance of EU Member States’ innovation systems
RO BG HR PL LV SK EL HU LT IT CY EE ES MT PT CZ SI EU FR AT IE BE DE LU UK NL FI DK SE
MODEST INNOVATORS MODERATE INNOVATORS STRONG INNOVATORS INNOVATION LEADERS 2010
Coloured columns show Member States’ performance in 2017, using the most recent data for 27 indicators, relative to that of the EU in 2010. Grey columns show Member States’ performance in 2010 relative to that of the EU in 2010. For all years, the same measurement methodology has been used. The dashed lines show the threshold values between the performance groups in 2017, comparing Member States’ performance in 2017 relative to that of the EU in 2017.

8 European Innovation Scoreboard 2018
1. Introduction
1 The EIS reports have been published under the name “European Innovation Scoreboard” until 2009, as “Innovation Union Scoreboard” between 2010 and 2015, and again as “European Innovation Scoreboard” from 2016 onwards.
The annual European Innovation Scoreboard (EIS) provides a compara-tive assessment of the research and innovation performance of the EU Member States and the relative strengths and weaknesses of their re-
search and innovation systems. It helps Member States assess areas in which they need to concentrate their efforts in order to boost their inno-vation performance.
1.1 Measurement framework
The European Innovation Scoreboard 20181, the 17th edition since the introduction of the EIS in 2001, follows the methodology of the previous EIS 2017 report. Innovation performance is measured using a composite indicator – the Summary Innovation Index – which summarises the per-formance of a range of different indicators. The EIS distinguishes be-tween four main types of indicators – Framework conditions, Invest-ments, Innovation activities, and Impacts – and ten innovation dimensions, capturing in total 27 indicators. The measurement frame-work is presented in Table 1.
Framework conditions captures the main drivers of innovation perfor-mance external to the firm and differentiates between three innovation dimensions: The Human resources dimension includes three indicators
and measures the availability of a high-skilled and educated workforce. Human resources captures New doctorate graduates, Population aged 25-34 with completed tertiary education, and Population aged 25-64 involved in education and training. Attractive research systems includes three indicators and measures the international competitiveness of the science base by focusing on International scientific co-publications, Most cited publications, and Foreign doctorate students. Innova-tion-friendly environment captures the environment in which enterpris-es operate and includes two indicators, Broadband penetration among enterprises and Opportunity-driven entrepreneurship, measuring the degree to which individuals pursue entrepreneurial activities as they see new opportunities, for example resulting from innovation.
FRAMEWORK CONDITIONSHuman resources1.1.1 New doctorate graduates1.1.2 Population aged 25-34 with tertiary education1.1.3 Lifelong learning
Attractive research systems1.2.1 International scientific co-publications1.2.2 Top 10% most cited publications1.2.3 Foreign doctorate students
Innovation-friendly environment1.3.1 Broadband penetration1.3.2 Opportunity-driven entrepreneurship
INVESTMENTSFinance and support2.1.1 R&D expenditure in the public sector2.1.2 Venture capital expenditures
Firm investments2.2.1 R&D expenditure in the business sector2.2.2 Non-R&D innovation expenditures2.2.3 Enterprises providing training to develop or upgrade ICT skills of their personnel
INNOVATION ACTIVITIESInnovators3.1.1 SMEs with product or process innovations3.1.2 SMEs with marketing or organisational innovations3.1.3 SMEs innovating in-house
Linkages3.2.1 Innovative SMEs collaborating with others3.2.2 Public-private co-publications3.2.3 Private co-funding of public R&D expenditures
Intellectual assets3.3.1 PCT patent applications3.3.2 Trademark applications3.3.3 Design applications
IMPACTS Employment impacts4.1.1 Employment in knowledge-intensive activities4.1.2 Employment fast-growing enterprises of innovative sectors
Sales impacts4.2.1 Medium and high-tech product exports4.2.2 Knowledge-intensive services exports4.2.3 Sales of new-to-market and new-to-firm product innovations
Table 1: Measurement framework of the European Innovation Scoreboard

9European Innovation Scoreboard 2018
Investments captures investments made in both the public and busi-ness sector and differentiates between two innovation dimensions: Fi-nance and support includes two indicators and measures the availabil-ity of finance for innovation projects by Venture capital expenditures, and the support of governments for research and innovation activities by R&D expenditures in universities and government research organisa-tions. Firm investments includes three indicators of both R&D and Non-R&D investments that firms make to generate innovations and the ef-forts enterprises make to upgrade the ICT skills of their personnel.
Innovation activities captures different aspects of innovation in the business sector and differentiates between three dimensions: Innova-tors includes three indicators measuring the share of firms that have introduced innovations onto the market or within their organisations, covering both product and process innovators, marketing and organisa-tional innovators, and SMEs that innovate in-house. Linkages includes three indicators measuring innovation capabilities by looking at collabo-ration efforts between innovating firms, research collaboration between the private and public sector, and the extent to which the private sector finances public R&D activities. Intellectual assets captures different forms of Intellectual Property Rights (IPR) generated in the innovation process, including PCT patent applications, Trademark applications and Design applications.
Impacts captures the effects of firms’ innovation activities and differen-tiates between two innovation dimensions. Employment impacts mea-sures the impact on employment and includes two indicators measuring Employment in knowledge-intensive activities and Employment in fast-growing firms in innovative sectors. Sales impacts measures the economic impact of innovation and includes three indicators measuring Exports of medium and high-tech products, Exports of knowledge-inten-sive services and Sales due to innovation activities.
2 A more detailed explanation of these changes is provided in the EIS 2018 Methodology Report, available at https://ec.europa.eu/docsroom/documents/29402
Data revisions and changes to the normalisation process
For the 2017 edition of the European Innovation Scoreboard, the main measurement framework was significantly modified. For this year’s edi-tion, no changes have been made to the main measurement framework. However, the results in this year’s edition are not comparable to the 2017 edition due to data revisions made by the suppliers of the data. Compared to last year’s edition, the following are the most prominent changes:2
For 11 indicators, data have been revised for all Member States for at least one year. For nine more indicators, data have been revised for at least one Member State for at least one year. For seven indicators, data have not been revised.
Another change is that for most indicators, the period underlying the time series used in the analysis has changed. As explained in Section 8 on the methodology of the EIS, the innovation index is the unweighted average of normalised scores for all indicators. For the calculation of normalised scores, first the lowest value of an indicator across all coun-tries and all years is deducted from the value in a particular year for each country. This re-calculated value is then divided by the difference between the highest and lowest value across all countries and all years. Compared to the EIS 2017, for most indicators the time period consid-ered has moved forward at least one year, by adding a more recent value at the end of the time series and by removing the oldest value used in the EIS 2017 from the beginning of the time series. A direct re-sult is that for many indicators, the highest (observed in the newly added most recent year) and lowest observed values (observed in the removed oldest year) have changed compared to the EIS 2017. By changing the highest and/or lowest values, even with no data revisions, the nor-malised scores will be different compared to those in the EIS 2017.

10 European Innovation Scoreboard 2018
1.2 Additional contextual analysis on the impact of structural differences between countries
3 More details on the process of revising the contextual indicators are provided in the EIS Exploratory report “Supplementary analyses and contextualisation of innovation performance data”, written by Vladimir Cvijanović, Sirin Elci, Alasdair Reid (EFIS Centre), and Hugo Hollanders (MERIT, Maastricht University). The report is available at https://ec.europa.eu/docsroom/documents/29306
4 The purchasing power standard, abbreviated as PPS, is an artificial currency unit. Theoretically, one PPS can buy the same amount of goods and services in each country. However, price differences across borders mean that different amounts of national currency units are needed for the same goods and services depending on the country. PPS are derived by dividing any economic aggregate of a country in national currency by its respective purchasing power parities. PPS is the technical term used by Eurostat for the common currency in which national accounts aggregates are expressed when adjusted for price level differences using PPPs. Thus, PPPs can be interpreted as the exchange rate of the PPS against the Euro.
In response to a need for contextual analyses to better understand per-formance differences on the innovation indicators used in the main measurement framework, a set of contextual indicators was introduced to the country profiles in the 2017 edition. For this year’s report, this list has been modified based on additional analyses and interactions with different stakeholders.3 The analysis of structural differences by country will be performed in the country profiles. As an introduction, the follow-ing sections discuss the relevance of these structural aspects to provide for a better understanding of differences between countries in the per-formance of particular indicators. Full definitions of all performance in-dicators and contextual indicators are provided in the EIS 2018 Method-ology Report. The list of contextual indicators, the years for which average performance has been calculated, and data sources used are shown in Table 2.
Performance and structure of the economy
GDP per capita in purchasing power standards4 is a measure for inter-preting real income differences between countries. Higher income can increase the demand for new innovative goods and services. Economic growth is captured by the average annual growth rate of GDP for 2015-2017. In economies that grow faster, expanding markets may provide more favourable conditions for enterprises to sell their goods and ser-vices.
Of particular importance are differences in economic structures, with differences in the share of manufacturing industry in GDP and in so-called high-tech activities in manufacturing and services being import-ant factors that explain why countries can perform better or worse on indicators like business R&D expenditures, PCT patents, and innovative enterprises. Medium-high and high-tech industries have higher techno-logical intensities than other industries. These industries, on average, will have higher R&D expenditures, more patent applications, and higher
Table 2: Contextual indicators in the European Innovation Scoreboard
Period Source
PERFORMANCE AND STRUCTURE OF THE ECONOMY
GDP per capita (PPS) Average 2014-2016 Eurostat
Average annual GDP growth (%) 2015-2017 Eurostat
Employment share Manufacturing (NACE C) (%) Average 2014-2016 Eurostat
of which High and Medium high-tech (%) Average 2014-2016 Eurostat
Employment share Services (NACE G-N) (%) Average 2014-2016 Eurostat
of which Knowledge-intensive services (%) Average 2014-2016 Eurostat
Turnover share SMEs (%) Average 2013-2015 Eurostat
Turnover share large enterprises (%) Average 2013-2015 Eurostat
Foreign-controlled enterprises – share of value added (%) Average 2013-2015 Eurostat
BUSINESS AND ENTREPRENEURSHIP
Enterprise births (10+ employees) (%) Average 2013-2015 Eurostat
Total Entrepreneurial Activity (TEA) (%) Average 2015-2017 Global Entrepreneurship Monitor
FDI net inflows (% GDP) Average 2014-2016 World Bank: World Development Indicators
Top R&D spending enterprises per 10 mln population Average 2014-2016 EU Industrial R&D Investment Scoreboard
Buyer sophistication (1 to 7 best) Average 2015-2017 World Economic Forum
GOVERNANCE AND POLICY FRAMEWORK
Ease of starting a business (0 to 100 best) Average 2015-2017 World Bank: Doing Business
Basic-school entrepren. education and training (1 to 5 best) Average 2015-2017 Global Entrepreneurship Monitor
Govt. procurement of advanced tech products (1 to 7 best) Average 2014-2016 World Economic Forum
Rule of law (-2.5 to 2.5 best) Average 2014-2016 World Bank: Worldwide Governance Indicators
DEMOGRAPHY
Population size (millions) Average 2015-2017 Eurostat
Average annual population growth (%) 2015-2017 Eurostat
Population density (inhabitants/km2) Average 2014-2016 Eurostat

11European Innovation Scoreboard 2018
shares of innovating enterprises. Countries with above-average shares of these industries are expected to perform better on several EIS indica-tors. For example, for the EU28 on average, 85% of R&D expenditures in manufacturing are accounted for by medium-high and high-technology manufacturing industries5. Also, the share of enterprises that introduced a product and/or process innovation is higher in medium-high and high-technology manufacturing industries compared to all core indus-tries covered in the Community Innovation Survey6. Foreign ownership, including ownership from both other EU Member States and non-Mem-ber States, is important as on average about 40% of business R&D ex-penditures in EU Member States is made by foreign affiliates, which is significantly higher compared to major international competitors. The indicator measuring the share of foreign-controlled enterprises in val-ue-added serves as a proxy for differences in the impact of foreign own-ership on the economy.
Business and entrepreneurship
Opportunity-driven entrepreneurship provides a measure of opportuni-ties for engaging in new business. The EIS indicator is complemented by two contextual indicators measuring the share of new enterprise births in the economy and Total early-stage Entrepreneurial activity (TEA), which measures the share of the adult population aged 18–64 years who are in the process of starting a business (a nascent entrepreneur) or who started a business which is not older than 42 months at the time of the respective survey (owner-manager of a new business).
Inflows of new technologies are important as they add to a country’s economic and technological capacities. Inward Foreign direct invest-ment (FDI) can have a positive impact on innovation performance, al-though there are differences depending on the complexity of the receiv-ing industry, political and economic framework conditions as well as the quality of the institutions of the receiving countries. Inward FDI flows are measured over a three-year period, as average net inflows of invest-ments to acquire a lasting management interest (10 percent or more of
5 Based on NACE Rev. 2 3-digit level, manufacturing industries can be classified as follows: High-technology (HT): Basic pharmaceutical products and pharmaceutical preparations (21); Computer, electronic and optical products (26); Air and spacecraft and related machinery (30.3*); Medium-high-technology (MHT): Chemicals and chemical products (20); Weapons and ammunition (25.4**); Electrical equipment (27); Machinery and equipment not elsewhere classified (28); Motor vehicles, trailers and semi-trailers (29); Other transport equipment (30) excluding Building of ships and boats (30.1) and excluding Air and spacecraft and related machinery (30.3); Medical and dental instruments and supplies (32.5***); Medium-low-technology (MLT): Reproduction of recorded media (18.2***); Coke and refined petroleum products (19); Rubber and plastic products (22); Other non-metallic mineral products (23); Basic metals (24); Fabricated metal products, except machinery and equipment (25) excluding Manufacture of weapons and ammunition (25.4); Building of ships and boats (30.1*); Repair and installation of machinery and equipment (33); Low-technology (LT): Food products (10); Beverages (11); Tobacco products (12); Textiles (13); Wearing apparel (14); Leather and related products (15); Wood and products of wood and cork, except furniture; articles of straw and plaiting materials (16); Paper and paper products (17); Printing and reproduction of recorded media (18) excluding Reproduction of recorded media (18.2); Furniture (31); Other manufacturing (32) excluding Medical and dental instruments and supplies (32.5). If data are only available at the NACE Rev. 2 2-digit level, industries identified with an * are classified as medium-high-technology, industries identified with an ** are classified as medium-low-technology, and industries identified with an *** are classified as low-technology (Source: http://ec.europa.eu/eurostat/statistics-explained/index.php/Glossary:High-tech_classification_of_manufacturing_industries).
6 In accordance with Commission Regulation No 995/2012, the following industries and services are included in the Core target population to be covered in the CIS: Core Industry (excluding construction): Mining and quarrying (B), Manufacturing (C) (10-12: Manufacture of food products, beverages and tobacco; 13-15: Manufacture of textiles, wearing apparel, leather and related products; 16-18: Manufacture of wood, paper, printing and reproduction; 20: Manufacture of chemicals and chemical products; 21: Manufacture of basic pharmaceutical products and pharmaceutical preparations; 19-22 Manufacture of petroleum, chemical, pharmaceutical, rubber and plastic products; 23: Manufacture of other non-metallic mineral products; 24: Manufacture of basic metals; 25: Manufacture of fabricated metal products, except machinery and equipment; 26: Manufacture of computer, electronic and optical products; 25-30: Manufacture of fabricated metal products (except machinery and equipment), computer, electronic and optical products, electrical equipment, motor vehicles and other transport equipment; 31-33: Manufacture of furniture; jewellery, musical instruments, toys; repair and installation of machinery and equipment, Electricity, gas, steam and air conditioning supply (D), Water supply, sewerage, waste management and remediation activities (E) (36: Water collection, treatment and supply; 37-39: Sewerage, waste management, remediation activities). Core Services: Wholesale trade, except of motor vehicles and motorcycles (46), Transport and storage (H) (49-51: Land transport and transport via pipelines, water transport and air transport; 52-53: Warehousing and support activities for transportation and postal and courier activities); Information and communication (J) (58: Publishing activities; 61: Telecommunications; 62: Computer programming, consultancy and related activities; 63: Information service activities), Financial and insurance activities (K) (64: Financial service activities, except insurance and pension funding; 65: Insurance, reinsurance and pension funding, except compulsory social security; 66: Activities auxiliary to financial services and insurance activities), Professional, scientific and technical activities (M) (71-73: Architectural and engineering activities; technical testing and analysis; Scientific research and development; Advertising and market research).
7 http://iri.jrc.ec.europa.eu/scoreboard.html
8 The Oslo Manual is the foremost international source of guidelines for the collection and use of data on innovation activities in industry. OECD/Eurostat (2005), Oslo Manual: Guidelines for Collecting and Interpreting Innovation Data, 3rd Edition, OECD Publishing, Paris. DOI: http://dx.doi.org/10.1787/9789264013100-en
voting stock) in an enterprise operating in an economy other than that of the investor.
Enterprise characteristics are important for explaining differences in R&D spending and innovation activities. Large enterprises, defined as enterprises with 250 or more employees, account for almost four-fifths of EU business R&D expenditures, whereas SMEs, defined as enterprises with 10 to 249 employees, account for only one-fifth. The presence of large R&D spending enterprises is captured by the EU Industrial R&D Investment Scoreboard, which provides economic and financial data and analysis of the top corporate R&D investors from the EU and abroad7.
Demand is an important driver of innovation. According to the Oslo Man-ual (2005)8, demand factors shape innovation activity in two major ways: for the development of new products, as firms modify and differ-entiate products to increase sales and market share; and for the im-provement of the production and supply processes in order to reduce costs and lower prices. A robust indicator measuring the demand for in-novation is currently not available. The Executive Opinion Survey of the World Economic Forum includes an indicator that provides a measure of the preferences of individual consumers for innovative products. The de-gree of Buyer sophistication measures, on a scale from 1 (low) to 7 (high), whether buyers focus more on price or quality of products and services.
Governance and policy framework
Institutional and legal differences between countries may make it more difficult to engage in business activities. The World Bank’s Doing Busi-ness report provides an index, Ease of starting a business, which mea-sures the distance of each economy to the “frontier” economy providing the most lenient regulatory framework for doing business. Countries with more favourable regulatory environments will obtain scores closer to the maximum score of 100. This indicator complements the EIS indi-cators covering new business activities or perceived possibilities for new

12 European Innovation Scoreboard 2018
business activities: Employment of fast-growing firms in innovative sec-tors and Opportunity-driven entrepreneurship.
Entrepreneurial skills are important for successfully transforming ideas and inventions into innovations. These skills can be acquired on the job but also by formal schooling. Basic-school entrepreneurial education and training measures the extent to which training in creating or manag-ing SMEs is incorporated within the education and training system at primary and secondary levels.
Governments play an important role in enhancing the innovation capac-ities of an economy. Government procurement of advanced technology products measures the extent to which government procurement deci-sions foster technological innovation – from 1 (not at all) to 7 (extreme-ly effectively). Trust is important for creating a business environment for undertaking risky innovative activities. Rule of law captures differences in the extent to which people have confidence in and abide by the rules of society. Rule of law measures differences in the quality of contract
enforcement, property rights, the police, and the courts, as well as the likelihood of crime and violence.
Demography
Structural data also include population size and the average annual growth rate of population for 2015-2017. Increasing demand following an increasing population may provide more favourable conditions for enterprises to sell their goods and services. Densely populated areas are more likely to be more innovative for several reasons. Firstly, knowledge diffuses more easily when people and enterprises are located closer to each other. Secondly, in more densely populated areas there tends to be a concentration of government and educational services. Densely popu-lated areas provide better training opportunities and employ above-av-erage shares of highly educated people. Furthermore, the amount of natural assets per capita tends to decline with population density. This positively impacts on the share of MHT exports and the share of em-ployment in knowledge intensive activities.
1.3 Data sources and data availability
The EIS uses the most recent statistics from Eurostat and other interna-tionally recognised sources such as the OECD and the United Nations available at the time of analysis, with the cut-off day of 25 April 2018. International sources have been used wherever possible to improve comparability between countries. The data relates to actual perfor-mance in 2017 for 12 indicators, 2016 for five indicators, 2015 for four indicators, and 2014 for six indicators (these are the most recent years for which data are available, cf. Annex E).
Data availability is complete for 26 Member States, with data being available for all 27 indicators. For Malta, data is missing for Opportuni-ty-driven entrepreneurship as the Global Entrepreneurship Monitor is not carried out in Malta. For Greece, data is missing for the indicators For-eign doctorate students and Employment in fast-growing enterprises in innovative sectors.

13European Innovation Scoreboard 2018
2. Innovation performance and trends
2.1 Most recent innovation performance
9 Section 8.1 gives a brief explanation of the calculation methodology. The EIS 2018 Methodology Report provides a detailed explanation.
10 The EIS performance groups are relative performance groups with countries’ group membership depending on their performance relative to that of the EU. With a growing EU innovation performance, the absolute thresholds between these groups will also be increasing over time.
The performance of EU national innovation systems is measured by the Summary Innovation Index, which is a composite indicator obtained by taking an unweighted average of the 27 indicators (cf. Table 1)9. Fig-ure 3 shows the scores for the Summary Innovation Index for all EU Member States in 2017, i.e. the most recent or ‘this year’, 2016 (referred to as ‘last year’), and the reference year 2010. Based on this year’s re-sults, the Member States fall into four performance groups10:
• The first group of Innovation Leaders includes Member States where performance is more than 20% above the EU average. The Innovation Leaders are Denmark, Finland, Luxembourg, the Nether-lands, Sweden, and the United Kingdom;
• The second group of Strong Innovators includes Member States with a performance between 90% and 120% of the EU average. Austria, Belgium, France, Germany, Ireland, and Slovenia are Strong Innovators;
• The third group of Moderate Innovators includes Member States where performance is between 50% and 90% of the EU average. Croatia, Cyprus, the Czech Republic, Estonia, Greece, Hungary, Italy, Latvia, Lithuania, Malta, Poland, Portugal, Slovakia, and Spain be-long to this group;
• The fourth group of Modest Innovators includes Member States that show a performance level below 50% of the EU average. This group includes Bulgaria and Romania.
Figure 3 illustrates that performance in 2017 compared to 2010 is higher for 18 Member States. Compared to 2016, performance in 2017 has increased for 20 Member States. Section 2.2 discusses performance changes in more detail.
As shown on the map in Figure 4, the performance groups tend to be geographically concentrated. Their average performance decreases with increasing geographical distance from the Innovation Leaders.
0
20
40
60
80
100
120
140
160
RO BG HR PL LV SK EL HU LT IT CY EE ES MT PT CZ SI EU FR AT IE BE DE LU UK NL FI DK SE
2010INNOVATION LEADERSSTRONG INNOVATORSMODERATE INNOVATORSMODEST INNOVATORS 2016
Figure 3: Performance of EU Member States’ innovation systems
Coloured columns show Member States’ performance in 2017, using the most recent data for 27 indicators, relative to that of the EU in 2010. The horizontal hyphens show performance in 2016, using the next most recent data for 27 indicators, relative to that of the EU in 2010. Grey columns show Member States’ performance in 2010 relative to that of the EU in 2010. For all years, the same measurement methodology has been used. The dashed lines show the threshold values between the performance groups in 2017, comparing Member States’ performance in 2017 relative to that of the EU in 2017.

14 European Innovation Scoreboard 2018
Figure 4: Map showing the performance of EU Member States’ innovation systems

15European Innovation Scoreboard 2018
2.2 Performance changes
11 The correlation coefficient between the change and the levels in both 2010 and 2017 is statistically not significant.
This section discusses performance changes over time for each of the innovation performance groups and the Member States included in each of the groups.
For the EU, performance between 2010 and 2017 improved by 5.8 per-centage points. Performance improved for 18 Member States and wors-ened for ten Member States (Figure 5):
• For six Member States, performance improved by ten percentage points or more: Lithuania (20.1%), the Netherlands (15.9%), Malta (15.2%), United Kingdom (14.0%), Latvia (11.6%), and France (10.1%);
• For six Member States, performance improved between 5 and 10 percentage points: Austria (9.0%), Ireland (8.5%), Spain (7.5%), Bel-gium (6.8%), Luxembourg (6.6%), and Sweden (5.5%);
• For six Member States, performance improved by less than 5 per-centage points: Slovakia (4.8%), Poland (3.2%), Finland (2.8%), Italy (2.0%), Slovenia (1.4%), and Denmark (0.7%);
• For eight Member States, performance declined by up to 5 percent-age points: Hungary (-0.1%), Greece (-0.9%), Germany (-1.3%), Por-tugal (-1.5%), Bulgaria (-1.5%), Croatia (-2.0%), the Czech Republic (-2.9%), and Estonia (-3.2%);
• For two Member States, performance declined by more than 5 per-centage points: Cyprus (-9.2%), and Romania (-14.0%).
In the past, less innovative countries tended to improve their perfor-mance faster than more innovative countries. There was thus a negative link between the level of and the change in performance. This year’s report shows once again that, more recently, the change in performance is generally not related to the level of performance any longer11. Be-tween 2010 and 2017, there has been no convergence in innovation performance between Member States performing at lower levels in 2010 and those performing at higher levels.
Compared to 2016, performance in 2017 has improved for 20 Member States, most notably for Spain, Malta, and the Netherlands. Performance has declined for eight Member States, most notably for Luxembourg, Slovakia, and Lithuania.
DKLU NLFI
SE
UK
BEDE IE
FRAT
SICZ
EE
EL
ESITCY
LV
LTHU
MT
PL
PT
SK
HR
BGRO
20
40
60
80
100
120
140
160
-16 -12 -8 -4 0 4 8 12 16 20 24
Change in innovation index between 2010 and 2017 (both relative to EU in 2010)
Figure 5: Performance and change of EU Member States’ innovation systems
The vertical axis shows Member States’ performance in 2017 relative to that of the EU in 2010. The horizontal axis shows the change in performance between 2010 and 2017 relative to that of the EU in 2010. The dashed lines show the respective scores for the EU.
Inno
vatio
n in
dex
2017
rela
tive
to E
U in
201
0
Change in innovation index between 2010 and 2017 (both relative to EU in 2010)

16 European Innovation Scoreboard 2018
Innovation Leaders
Performance of the Innovation Leaders improved until 2013, after which it declined in 2014. Performance improved again in 2015 to 2017, with performance in 2017 being at a peak level. Performance has improved most in the Netherlands and the United Kingdom, with increases of more than 10 percentage points. Strong annual increases are observed for 2012 and 2017 for the Netherlands. Strong annual increases in the United Kingdom are observed in 2014 and 2016. Performance also im-proved for Luxembourg and Sweden, but at a lower rate of 5 to 7 per-
centage points. For Sweden, performance improved almost every year, with the exception of a decline in 2014. For Luxembourg, performance improved strongly in 2012 and 2015, but declined strongly in 2014 and 2017. For Finland, performance has improved by almost 3 percentage points, with annual performance increases since 2014. For Denmark, performance increased by less than 1 percentage point. Danish perfor-mance improved until 2013, after which it almost declined to its 2010 performance level.
Strong Innovators
For the Strong Innovators, performance remained stable until 2014, af-ter which it improved annually, raising average performance by 5.7 per-centage points compared to 2010. The performance gap to the Innova-tion Leaders slightly increased between 2010 and 2017. Performance has improved for all Strong Innovators, except Germany. Performance improved most strongly for France (10.1 percentage points), in particular due to strong increases in 2014-2016. For Austria, performance be-tween 2010 and 2017 increased strongly (9.0 percentage points), in particular due to a strong performance increase in 2016. For Ireland, performance increased strongly in 2016, leading to an overall perfor-mance increase compared to 2010 of 8.6 percentage points. For Bel-
gium, performance compared to 2010 increased by 6.8 percentage points, resulting from annual performance increases since 2014 and a strong increase in 2016. For France, performance compared to 2010 increased by 2.6 percentage points, with a strong increase in 2016 being followed by a moderate decline in 2017. For Slovenia, the performance increase compared to 2010 is rather moderate at 1.4 percentage points. For Germany, performance has declined by more than 1 percentage point. Here, a pattern is observed of annual increases followed by annu-al decreases, which are directly linked to the biennial update of innova-tion survey data. In 2017, performance once again increased.
105
115
125
135
145
155Sweden
Denmark
Finland
Netherlands
United Kingdom
Luxembourg
20172016201520142013201220112010105
115
125
135
145
155
20172016201520142013201220112010
INNOVATION LEADERS
85
95
105
115
125
135Germany
Ireland
Austria
Belgium
France
Slovenia
2017201620152014201320122011201085
95
105
115
125
135
20172016201520142013201220112010
STRONG INNOVATORS
Figure 7: Performance Strong Innovators
Figure 6: Performance Innovation Leaders
Performance is relative to that of the EU in 2010. The graph on the left shows the average performance of the Innovation Leaders, calculated as the unweighted average of the respective Member States.
Performance is relative to that of the EU in 2010. The graph on the left shows the average performance of the Innovation Leaders, calculated as the unweighted average of the respective Member States.

17European Innovation Scoreboard 2018
Moderate Innovators
For the Moderate Innovators, performance has been increasing in a cy-clical pattern, with performance increases in odd-numbered years and performance decreases in even-numbered years. The performance gap to the Strong Innovators did not change between 2010 and 2017. For six Moderate Innovators, performance has increased. For Lithuania, per-formance improved very strongly by 20.1 percentage points, with perfor-mance improvements in most years, in particular in 2015 and 2016. Performance also increased strongly for Malta between 2010 and 2017 (15.2 percentage points), in particular in 2013, 2014 and 2017. For Lat-via, performance increased by 11.6 percentage points, with strong per-formance increases in 2014 and 2015. For Spain, performance in-creased by 7.5 percentage points, with strong increases in 2016 and 2017. For Slovakia, performance increased by 4.8 percentage points, with performance increasing strongly until 2013, and at more moderate rates in 2015 and 2016. For Poland, annual performance increases since 2015 have led to an overall performance increase of 3.2 percent-age points compared to 2010. For Italy, performance increased by 2.0 percentage points, with annual performance increases in 2012, 2014, 2015 and 2017.
For seven Moderate Innovators, performance has declined. For Hungary, the performance decline is marginal at -0.1% percentage point, and per-formance has been increasing annually since 2013. For Greece, the per-formance decline is -0.9 percentage points, which is the result of a very strong decline in 2014. For Croatia, performance declined by 2.0 per-centage points, with strong performance declines in 2012 and 2014 and a strong increase in 2015. For Portugal, performance declined by 2.8 percentage points, with declining performance between 2010 and 2014 not being fully compensated by increasing performance between 2015 and 2017. For both the Czech Republic and Estonia, performance de-creased by 3.1 percentage points. For the Czech Republic, annual perfor-mance decreased strongly in 2012. For Estonia, performance improved until 2015, but a strong performance decline in 2016 has lowered the performance level in 2017 below that in 2010. For Cyprus, performance has declined strongly by 9.2 percentage points, with a very strong per-formance decline in 2014. More recently, performance improved in 2015 and 2017.
Modest Innovators
For the Modest Innovators, performance declined between 2010 and 2017, leading to a widening of the performance gap to the Moderate Innovators. For Bulgaria, performance in 2017 is still below the perfor-mance level in 2010, where declining performance in 2011 and 2012
has only partially been met by annual performance increases since 2013. For Romania, performance has declined strongly by 14.0 percent-age points but, after five years of declining performance, performance increased again in 2016 and 2017.
50
60
70
80
90
100
20172016201520142013201220112010
MODERATE INNOVATORS
50
60
70
80
90
100Czech Republic
Portugal
Malta
Spain
Estonia
Cyprus
Italy
Lithuania
20172016201520142013201220112010
30
40
50
60
70
80
20172016201520142013201220112010
MODEST INNOVATORS
30
40
50
60
70
80Hungary
Greece
Slovakia
Latvia
Poland
Croatia
Bulgaria
Romania
20172016201520142013201220112010
Figure 8: Performance Moderate and Modest Innovators
Performance is relative to that of the EU in 2010. The graph on the top-left shows the average performance of the Moderate Innovators, calculated as the unweighted average of the respective Member States. The graph on the bottom-right shows the average performance of the Modest Innovators, calculated as the unweighted average of the respective Member States.

18 European Innovation Scoreboard 2018
3. Performance of the EU innovation system
12 The provisional CIS 2016 data, however, show improved expected performance on these indicators (cf. Section 6.3).
Performance of the EU innovation system, measured as the weighted average of the performance of the innovation systems of all 28 Member States, has improved by 5.8 percentage points between 2010 and 2017. There are differences in performance changes for the different dimensions and indicators. Figure 9 shows the change for each dimen-sion and indicator compared to the 2010 performance level in 2017 (the blue coloured bars) and 2016 (the dark coloured bars). The differ-ence between the respective blue and dark coloured bar thus illustrates the change in the most recent year. Performance has improved most (33.8 percentage points) in Innovation-friendly environment, with strongly increasing performance in Broadband penetration. Performance has also increased in Human resources (19.3 percentage points) with increasing performance for all three indicators. A strong increase in In-ternational scientific co-publications has led to a 13.6 percentage point increase for Attractive research systems. Performance has also in-creased strongly in Firm investments (11.8 percentage points) with in-creasing performance for all three indicators. Performance in Finance and support has increased (7.7 percentage points) as a result of in-creasing Venture capital expenditures. Performance has increased more moderately for Sales impacts (4.1 percentage points). Performance has almost not changed for Linkages, Intellectual assets, where a strong increase in Trademark applications has been offset by declining perfor-mance in PCT patent applications and Design applications, and Employ-ment impacts, where an increase in Employment in knowledge-inten-sive activities has been offset by a decline in Employment in fast-growing firms in innovative sectors. Performance in Innovators has declined, due to declining performance in all three indicators12.

19European Innovation Scoreboard 2018
2016INDICATORSDIMENSIONS
40 60 80 100 120 140 160 180 200
Sales of new to market & firm products
Knowledge-intensive services exports
Medium & high tech product exports
SALES IMPACTS
Empl. fast-growing firms inn. sectors
Employment in knowledge-intensive act.
EMPLOYMENT IMPACTS
Design applications
Trademark applications
PCT patent applications
INTELLECTUAL ASSETS
Private co-funding public R&D
Public-private co-publications
Innovative SMEs collaborating with others
LINKAGES
SMEs innovating in-house
Organisational/marketing innovators
Product/process innovators
INNOVATORS
Upgrading ICT skills
Non-R&D Innovation expenditure
Business R&D expenditure
FIRM INVESTMENTS
Venture capital expenditures
Public R&D expenditure
FINANCE AND SUPPORT
Opportunity-driven entrepreneurship
Broadband penetration
INNOVATION-FRIENDLY ENVIRONMENT
Foreign doctorate students
Most cited publications
International co-publications
ATTRACTIVE RESEARCH SYSTEMS
Lifelong learning
Tertiary education
Doctorate graduates
HUMAN RESOURCES 119.3
139.4
113.4
102.1
162.7
103.8
110.7
177.8
107.7
122.0
111.4
109.3
100.5
100.9
101.4
113.0
110.4
105.9
104.9
101.1
104.1
100.6
100.9
114.3
96.5
81.8
82.8
93.3
95.8
96.5
93.5
86.0
107.7
111.8
101.0
113.6
133.8
Figure 9: EU Performance change between 2010 and 2017 by dimension and indicator
Normalised scores in 2017 (blue coloured bars) and 2016 (grey coloured bars) relative to those in 2010 (=100)

20 European Innovation Scoreboard 2018
4. Innovation dimensions
The order of performance groups observed for the Summary Innovation Index also applies to most dimensions. The Innovation Leaders perform best in seven dimensions, followed by the Strong Innovators, the Moder-ate Innovators and the Modest Innovators (Figure 10). In the Firm in-vestments, Innovators and Sales impacts dimensions, the Strong Inno-vators show the best performance. In other dimensions, performance differences can be small between the country groups. In Linkages, the performance difference between the Innovation Leaders and the Strong Innovators is relatively small, compared to the average difference across all dimensions. Between the Strong and Moderate Innovators, performance differences are relatively small for Innovation-friendly en-vironment and Employment impacts. Between the Moderate and Mod-est Innovators, performance differences are relatively small for Innova-tion-friendly environment, Intellectual assets, Employment impacts, and Sales impacts. Performance differences between the Innovation Leaders and Strong Innovators are relatively high for Research systems, Innovation-friendly environment and Intellectual assets. Performance differences between the Strong Innovators and Moderate Innovators are
relatively high for Firm investments, Innovators, and Linkages. Perfor-mance differences between the Moderate Innovators and Modest Inno-vators are relatively high for Innovators.
The country rankings in Human resources and Attractive research sys-tems come close to the overall classification of performance groups. This also holds, although to a lesser extent, for Finance and support, Innovators and Linkages. The dimensions Innovation-friendly environ-ment and Sales impacts deviate most from the overall classification. The dimensions Employment impacts, Intellectual assets and Firm in-vestments also deviate from the overall classification, but to a lesser extent. These deviations demonstrate that countries can perform well in particular dimensions, while their overall performance is lower, resulting in becoming a member of a lower innovation performance group. Anal-ogously, a Leading Innovator can perform poorly in particular dimen-sions, but compensate such relative weaknesses with stronger perfor-mance in other dimensions.
0 20 40 60 80 100 120 140 160 180 200
HUMAN RESOURCES
ATTRACTIVE RESEARCH SYSTEMS
INNOVATION-FRIENDLY ENVIRONMENT
FINANCE AND SUPPORT
FIRM INVESTMENTS
INNOVATORS
LINKAGES
INTELLECTUAL ASSETS
EMPLOYMENT IMPACTS
SALES IMPACTS
INNOVATION LEADERS STRONG INNOVATORS MODERATE INNOVATORS MODEST INNOVATORS
Average scores for each performance group equal the unweighted average of the relative-to-EU scores of the Member States within that group. As these unweighted averages do not take
into account differences in country size, results are not directly comparable. Average scores for the performance groups have been adjusted such that their average equals 100 for each
dimension.
Figure 10: Performance groups: innovation performance per dimension

21European Innovation Scoreboard 2018
Human resources
Performance in Human resources reflects (well) the overall classifica-tion into four performance groups. The Innovation Leaders are the best performing countries taking all top 5 positions, with only Luxembourg performing relatively less well. All Strong Innovators, except Germany, perform above the EU average. Most of the Moderate Innovators per-form below the EU average, with only Spain and Estonia performing above this average. The Modest Innovators perform least well, with Ro-mania being the worst performer but with Bulgaria performing better than two Moderate Innovators.
For 24 Member States, performance has improved between 2010 and 2017. The highest rate of performance increase is for Slovenia (51.8%), followed by Spain (46.0%) and Denmark (40.9%). For Poland (-2.9%), Hungary (-4.6%), Romania (-18.3%) and Portugal (-23.1%), perfor-mance has decreased. The EU average increased by 19.3% between 2010 and 2017.
Compared to 2016, performance has improved for 18 Member States, with the highest rate of performance increase for Spain (24.3%). Perfor-mance declined for ten Member States, with the strongest declines for Romania (14.8%) and Croatia (13.1%). The EU average increased by 2.4% between 2016 and 2017.
Attractive research systems
Performance in Attractive research systems also reflects (well) the overall classification into four performance groups with Innovation Leaders taking all top 5 positions. All Strong Innovators perform above the EU average, except for Germany and Slovenia. Most of the Moderate Innovators perform below the EU average, where only Cyprus, Portugal, and Malta perform above the EU average. The Modest Innovators per-form least well, taking the last two positions in the performance ranking.
For all Member States, performance has improved between 2010 and 2017. The highest rate of performance increase is for Malta (110.1%), followed by Luxembourg (61.1%), Sweden (51.7%), and Cyprus (51.3%). The EU average increased by 13.6% between 2010 and 2017.
Compared to 2016, performance has improved for 26 Member States, with the highest rate of performance increase for Malta (71.6%). Perfor-mance declined for two Member States: France (-0.9%) and Austria (-0.3%). The EU average increased by 1.2% between 2016 and 2017.
0
50
100
150
200
250
RO HR HU BG IT MT PL LV EL SK CZ PT DE CY LT EU EE BE AT ES FR LU IE SI NL UK FI SE DK
Coloured columns show Member States’ performance in 2017, using the most recent data for the indicators in this dimension, relative to that of the EU in 2010. The horizontal hyphens
show performance in 2016, using the next most recent data for the indicators in this dimension, relative to that of the EU in 2010. Grey columns show performance in 2010 relative to that
of the EU in 2010.
0
50
100
150
200
250
RO BG PL LT HR LV SK HU CZ ES IT EE EL SI DE EU CY PT FR FI AT IE MT BE UK SE DK NL LU
Coloured columns show Member States’ performance in 2017, using the most recent data for the indicators in this dimension, relative to that of the EU in 2010. The horizontal hyphens
show performance in 2016, using the next most recent data for the indicators in this dimension, relative to that of the EU in 2010. Grey columns show performance in 2010 relative to that
of the EU in 2010.

22 European Innovation Scoreboard 2018
Innovation-friendly environment
Performance in Innovation-friendly environment reflects (well) the overall classification into four performance groups. The Innovation Leaders are the best performing countries taking all top 5 positions, with only the United Kingdom performing below the EU average. The Strong Innovators are more dispersed, with Belgium, France and Germany per-forming above the EU average, and Austria, Ireland and Slovenia below the EU average. The Moderate Innovators show a strong performance on this dimension, in particular Portugal, Malta, Lithuania, Spain, Latvia, and Estonia perform above the EU average. For the Modest Innovators, this is a relatively strong innovation dimension, with Bulgaria outper-forming three and Romania five Moderate Innovators.
For 24 Member States, performance has improved between 2010 and 2017. The highest rate of performance increase is observed in Finland (96.5%), Poland (88.1%), and Portugal (74.2%). Performance decreased for Slovenia (-3.8%), Austria (-4.2%), Italy (-14.6%) and Belgium (-20.4%). The EU average increased by 33.8% between 2010 and 2017.
Compared to 2016, performance has improved for 26 Member States, with the highest rate of performance increase for Malta (66.2%), the Netherlands (46.5%), and Poland (44.9%). Performance declined for two Member States: Latvia (-20.0%) and Sweden (-3.8%). The EU average increased by 15.6% between 2016 and 2017.
Finance and support
Performance in Finance and support reflects (well) the overall classifi-cation into four performance groups. The Innovation Leaders are the best performing countries behind France, the overall best performing country. Four Strong Innovators perform below the EU average. All Mod-erate Innovators perform below the EU average. Bulgaria and Romania, both Modest Innovators, close the ranking at the bottom, only Malta is performing worse.
Performance has increased for only 13 Member States. The highest rate of performance increase between 2010 and 2017 is observed in Latvia (70.7%), followed by France (45.2%), the Netherlands (22.6%), and Lux-
embourg (19.9%). For 15 Member States, performance has decreased, in particular for Finland (-57.9%), the Czech Republic (-65.2%), and Bul-garia (-68.0%). The EU average increased by 7.7% between 2010 and 2017.
Compared to 2016, performance has improved for only ten Member States, with the highest rate of performance increase for the United Kingdom (11.7%) and the Netherlands (10.4%). Performance declined for 18 Member States, with the strongest declines for Slovakia (-45.8%), Estonia (-33.9%), and Lithuania (-31.2%). The EU average increased by 3.6% between 2016 and 2017.
0
50
100
150
200
250
300
EL HR CY BG SK IT RO CZ AT SI HU UK PL IE EU DE FR EE LV ES BE LT MT PT LU NL FI SE DK
Coloured columns show Member States’ performance in 2017, using the most recent data for the indicators in this dimension, relative to that of the EU in 2010. The horizontal hyphens
show performance in 2016, using the next most recent data for the indicators in this dimension, relative to that of the EU in 2010. Grey columns show performance in 2010 relative to that
of the EU in 2010.
0
50
100
150
200
MT RO BG SK PL SI HR EL CY HU CZ IT LT PT IE ES EE AT BE LV EU DE DK UK FI SE LU NL FR
Coloured columns show Member States’ performance in 2017, using the most recent data for the indicators in this dimension, relative to that of the EU in 2010. The horizontal hyphens
show performance in 2016, using the next most recent data for the indicators in this dimension, relative to that of the EU in 2010. Grey columns show performance in 2010 relative to that
of the EU in 2010.

23European Innovation Scoreboard 2018
Firm investments
13 The provisional CIS 2016 data, however, show improved expected performance on these indicators for most countries leading to improved performance in the Innovators dimension in the EIS 2019 (cf. Section 6.3).
Performance in Firm investments reflects to some extent the overall classification into four performance groups with two Innovation Leaders in the top 5. The best performing countries are Innovation Leaders and Strong Innovators, together with the Czech Republic, a Moderate Innova-tor. Sweden is the overall leader, Germany ranks second, and Austria third. Luxembourg and the Netherlands, both Innovation Leaders, per-form below the EU average.
For 16 Member States, performance increased between 2010 and 2017. The highest rate of performance increase is observed in Lithuania
(55.3%), followed by Germany (33.4%), Belgium (25.2%), and Sweden (24.7%). The EU average increased by 11.8% between 2010 and 2017. For 12 Member States, performance decreased, most notably in Finland (-36.8%), Estonia (-40.6%), Romania (-51.6%), and Cyprus (-75.9%).
Compared to 2016, performance has improved for only 12 Member States, with the highest rate of performance increase for Malta (12.0%) and Cyprus (11.8%). Performance declined for 16 Member States, with the strongest decline for Austria (-14.1%). The EU average declined by -2.1% between 2016 and 2017.
Innovators
Performance in the Innovators dimension reflects to some extent the overall classification into four performance groups. Among Innovation Leaders and Strong Innovators, only the United Kingdom and Slovenia perform below the EU average. Ireland is the overall leader, Belgium ranks second, and Germany third; all three countries are Strong Innova-tors. There are four Moderate Innovators that perform above the EU av-erage on this indicator: Greece, Portugal, Italy, and Cyprus.
For only nine Member States, performance increased between 2010 and 2017. The highest rate of performance increase is observed in Lithuania
(36.2%), followed by the Netherlands (33.7%), the United Kingdom (24.4%), and Ireland (21.4%). For 19 Member States, performance de-clined, most notably in Romania (-39.1%), Germany (-42.4%), Cyprus (-48.9%), and Estonia (-86.7%). The EU average decreased by 14.0% between 2010 and 2017.13
Compared to 2016, performance is the same for all Member States as CIS 2014 data has been used to measure performance in both 2016 and 2017.
0
50
100
150
200
RO LV BG CY EL SK IT EE ES LU MT PT NL HU PL FR LT IE HR EU UK CZ DK SI FI BE AT DE SE
Coloured columns show Member States’ performance in 2017, using the most recent data for the indicators in this dimension, relative to that of the EU in 2010. The horizontal hyphens
show performance in 2016, using the next most recent data for the indicators in this dimension, relative to that of the EU in 2010. Grey columns show performance in 2010 relative to that
of the EU in 2010.
0
50
100
150
200
RO PL BG LV HU EE SK ES HR MT CZ LT SI UK EU CY IT DK PT EL FR SE NL FI AT LU DE BE IE
Coloured columns show Member States’ performance in 2017, using the most recent data for the indicators in this dimension, relative to that of the EU in 2010. The horizontal hyphens
show performance in 2016, using the next most recent data for the indicators in this dimension, relative to that of the EU in 2010. Grey columns show performance in 2010 relative to that
of the EU in 2010.

24 European Innovation Scoreboard 2018
Linkages
Performance in Linkages reflects (very) well the overall classification into four performance groups. The Innovation Leaders are represented amongst the top group of countries, together with Strong Innovator countries Belgium, Austria, Germany, and Slovenia. Luxembourg, an In-novation Leader, performs well below the EU average. Ireland, a Strong Innovator, also performs below the EU average. Moderate Innovator Lithuania shows a strong performance above the EU average.
For ten Member States, performance increased between 2010 and 2017. The highest rate of performance increase is observed in Austria
(23.1%), Lithuania (19.6%), and Ireland (17.1%). For 18 Member States, performance declined, in particular for Croatia (-24.5%), Denmark (-31.5%), Cyprus (-38.0%), and Estonia (-42.7%). The EU average in-creased by 1.0% between 2010 and 2017.
Compared to 2016, performance has improved for only ten Member States, with the highest rate of performance increase for Spain (4.4%). Performance declined for 18 Member States, with the strongest declines for Malta (-10.4%) and Luxembourg (-9.3%). The EU average declined by -1.9% between 2016 and 2017.
Intellectual assets
Performance in Intellectual assets reflects the overall classification into four performance groups less well. Malta, a Moderate Innovator, is the overall best performing country. Three Innovation Leaders and Germany, a Strong Innovator, take up the other top 5 positions, with Denmark ranking second and Sweden third. The United Kingdom, one of the Inno-vation Leaders, performs below the EU average. Four of the Moderate Innovators perform above the EU average: Malta, Cyprus, Estonia, and Italy. Bulgaria, a Modest Innovator, is performing at a level close to that of the EU average.
For 21 Member States, performance has increased between 2010 and 2017. The highest rate of performance increase is observed in Malta (95.2%), followed by Cyprus (46.1%), Estonia (43.5%), and Bulgaria (40.0%). Performance decreased for seven Member States, most nota-
bly for Latvia (-12.0%), Germany (-15.7%), and Ireland (-20.5%). The EU average has increased by 0.9% between 2010 and 2017.
Compared to 2016, performance has improved for only 14 Member States, with the highest rate of performance increase for Estonia (16.2%) and the Czech Republic (10.4%). Performance declined for 14 Member States, with the strongest declines for Luxembourg (-19.6%) and Bulgaria (-12.2%). The EU average increased by 0.2% between 2016 and 2017.
0
50
100
150
200
MT BG PL RO LV PT IT CY LU HR SK ES HU EE CZ IE EL EU FR LT SI DE SE DK FI UK AT NL BE
Coloured columns show Member States’ performance in 2017, using the most recent data for the indicators in this dimension, relative to that of the EU in 2010. The horizontal hyphens
show performance in 2016, using the next most recent data for the indicators in this dimension, relative to that of the EU in 2010. Grey columns show performance in 2010 relative to that
of the EU in 2010.
0
50
100
150
200
RO HR EL SK HU IE LV LT CZ ES PT PL SI UK BE BG FR EU IT EE CY NL AT FI DE LU SE DK MT
Coloured columns show Member States’ performance in 2017, using the most recent data for the indicators in this dimension, relative to that of the EU in 2010. The horizontal hyphens
show performance in 2016, using the next most recent data for the indicators in this dimension, relative to that of the EU in 2010. Grey columns show performance in 2010 relative to that
of the EU in 2010.

25European Innovation Scoreboard 2018
Employment impacts
14 Compared to the other dimensions, the EU’s rank position is relatively high in this dimension. This can be explained by the strong performance of France, Germany and the United Kingdom, which are among the biggest Member States, and which have a strong positive impact on the EU average in Sales impacts.
Performance in Employment impacts reflects the overall classification into four performance groups less well with only three Innovation Lead-ers in the top 5 positions. Ireland, a Strong Innovator, is the best per-forming country, followed by the United Kingdom and Malta, a Moderate Innovator. Most of the Innovation Leaders, except Finland, perform above the EU average. Bulgaria, a Modest Innovator, shows a strong performance above the EU average. Strong Innovators Austria, Slovenia, Belgium, and France all perform below the EU average.
For 19 Member States, performance has increased between 2010 and 2017. The highest rate of performance increase is observed in Latvia
(42.6%), Croatia (41.6%), and Portugal (33.6%). Performance has de-clined in nine Member States, most notably in Germany (-19.8%), Lithu-ania (-22.7%), and Denmark (-27.0%). The EU average has increased by 0.6% between 2010 and 2017.
Compared to 2016, performance has improved for 18 Member States, with the highest rate of performance increase for the Czech Republic (23.6%). Performance declined for ten Member States, with the stron-gest declines for Lithuania (-23.4%) and Malta (-16.8%). The EU aver-age increased by 1.9% between 2016 and 2017.
Sales impacts
Performance in Sales impacts reflects the overall classification of per-formance groups less well. Just one Innovation Leader is in the top 5, while Denmark, Finland, Sweden, Luxembourg, and the Netherlands per-form below the EU average.14 The Strong Innovators are also dispersed: Ireland, Germany, and France are amongst the top 5, whereas Slovenia, Belgium, and Austria perform below the EU average. Of the Moderate Innovators, Slovakia performs above the EU average, and the Czech Re-public and Hungary perform just below the EU average.
Performance between 2010 and 2017 has increased for ten Member States. The highest rate of performance increase is observed in the Unit-ed Kingdom (42.0%) and Ireland (26.8%). For 18 Member States, perfor-
mance has declined, most notably for Croatia (-34.2%), Greece (-40.1%), and Malta (-48.3%). The EU average has increased by 4.1% between 2010 and 2017.
Compared to 2016, performance has improved for only 12 Member States, with the highest rate of performance increase for Ireland (2.7%). Performance declined for 16 Member States, with the strongest declines for Malta (-6.8%) and Cyprus (-6.0%). The EU average declined by -0.5% between 2016 and 2017.
0
50
100
150
200
RO LT CY AT HR EL IT EE SI BE PT FI ES PL FR LV EU DE DK BG CZ NL SK HU SE LU MT UK IE
Coloured columns show Member States’ performance in 2017, using the most recent data for the indicators in this dimension, relative to that of the EU in 2010. The horizontal hyphens
show performance in 2016, using the next most recent data for the indicators in this dimension, relative to that of the EU in 2010. Grey columns show performance in 2010 relative to that
of the EU in 2010.
0
50
100
150
200
HR BG LT PT LV EL PL MT EE RO CY ES IT SI DK BE FI AT SE LU NL CZ HU EU SK FR DE UK IE
Coloured columns show Member States’ performance in 2017, using the most recent data for the indicators in this dimension, relative to that of the EU in 2010. The horizontal hyphens
show performance in 2016, using the next most recent data for the indicators in this dimension, relative to that of the EU in 2010. Grey columns show performance in 2010 relative to that
of the EU in 2010.

26 European Innovation Scoreboard 2018
5. Benchmarking innovation performance with non-EU countries
5.1 Benchmarking against other European countries and regional neighbours
15 Average data availability for this year’s report is good with data available for 27 indicators for Norway, 25 indicators for Switzerland, 24 indicators for the Former Yugoslav Republic of Macedonia and Turkey, 22 indicators for Iceland and Serbia, 21 indicators for Ukraine, and 20 indicators for Israel. Data availability for Israel is below the threshold of 75%, which has been used in previous years to decide whether or not to include a European country in the EIS. In the interest of continuity, Israel is included in the EIS 2018.
16 For Norway, the sharp increase can largely be explained by a change in the collection of Community Innovation Survey (CIS) data. The average percentage increase over the previous year for the indicators using CIS data is 125%, for the other indicators it is 0.5%. The strong increase in the results for the six indicators using CIS data is caused by the fact that CIS 2014 data were collected in a separate innovation survey, whereas CIS data up until the CIS 2012 were collected in a combined innovation and R&D survey.
This section discusses the results for eight more European countries or regional neighbours using the same methodology as used for the EU Member States.15
Switzerland is the overall Innovation Leader in Europe, outperforming all EU Member States (Figure 11). Switzerland’s strong performance re-sults from being the best performer on nine indicators, in particular in Attractive research systems, where it has the best performance on all three indicators, Human resources, where it has best performance on two indicators (New doctorate graduates and Lifelong learning), and In-novators, where it has best performance on two indicators (SMEs with marketing or organisational innovations and SMEs innovating in-house). Switzerland’s performance relative to the EU in 2010 has improved strongly by 10.1%-points.
Iceland, Israel, and Norway are Strong Innovators. Iceland’s performance relative to the EU in 2010 has declined (-0.9%). The performance of Norway relative to the EU in 2010 has increased strongly by 19.5%16, whereas the relative performance of Israel has declined (-4.5%). Serbia and Turkey are Moderate Innovators, and for both countries performance relative to the EU has increased strongly by 13.3% and 15.1%, respec-tively. The Former Yugoslav Republic of Macedonia and Ukraine are Modest Innovators. Performance relative to the EU has increased strong-ly for the Former Yugoslav Republic of Macedonia (12.1%) but de-creased for Ukraine (-1.8%). The performance groups for all countries are also shown on the map in Figure 12.
0
20
40
60
80
100
120
140
160
180
UA RO MK BG HR PL LV TR SK EL HU RS LT IT CY EE ES MT PT CZ SI EU IL FR NO IS AT IE BE DE LU UK NL FI DK SE CH
2010INNOVATION LEADERSSTRONG INNOVATORSMODERATE INNOVATORSMODEST INNOVATORS 2016
Figure 11: Performance of European and neighbouring countries’ systems of innovation
Coloured columns show countries’ performance in 2017, using the most recent data for 27 indicators, relative to that of the EU in 2010. The horizontal hyphens show performance in 2016, using the next most recent data for 27 indicators, relative to that of the EU in 2010. Grey columns show countries’ performance in 2010 relative to that of the EU in 2010. For all years, the same measurement methodology has been used. The dashed lines show the threshold values between the performance groups in 2017, comparing countries’ performance in 2017 relative to that of the EU in 2017.
European and neighbouring countries include: Iceland (IS), Israel (IL), the Former Yugoslav Republic of Macedonia (MK), Norway (NO), Serbia (RS), Switzerland (CH), Turkey (TR) and Ukraine (UA).

27European Innovation Scoreboard 2018
Figure 12: Map showing the performance of European and neighbouring countries’ innovation systems

28 European Innovation Scoreboard 2018
5.2 Prospect for including Western Balkan countries
17 https://ec.europa.eu/commission/news/strategy-western-balkans-2018-feb-06_en
18 This designation is without prejudice to positions on status, and is in line with UNSCR 1244/1999 and the ICJ Opinion on the Kosovo declaration of independence.
19 http://www.instat.gov.al/en/about-us/activities/other/survey-on-scientific-research-development/
In February 2018, the European Commission adopted a strategy for ‘A credible enlargement perspective for and enhanced EU engagement with the Western Balkans’, confirming the European future of the region as a geostrategic investment in a stable, strong and united Europe based on common values.17 The Strategy spells out the priorities and areas of joint reinforced cooperation, addressing the specific challenges facing the Western Balkans, in particular the need for fundamental re-forms and good neighbourly relations. The Strategy sets out an Action Plan with six concrete flagship initiatives targeting specific areas of common interest: rule of law, security and migration, socio-economic development, transport and energy connectivity, digital agenda, recon-ciliation and good neighbourly relations.
Following the adoption of this Strategy, the inclusion of all Western Bal-kan countries in the European Innovation Scoreboard is foreseen. Three of these countries are already included: Croatia, as one of the 28 Mem-ber States, as well as the Former Yugoslav Republic of Macedonia and Serbia. As a rule, countries can only be included if data are available for at least 20 indicators. Table 3 shows that current data availability from international sources is insufficient to include Albania, Bosnia and Her-zegovina, Kosovo18 or Montenegro. For Bosnia and Herzegovina and Montenegro, data availability from national sources has been checked in detail following official requests from both countries to be included in the European Innovation Scoreboard. For the other three countries, na-tional sources will be checked for the 2019 edition of the EIS.
For Albania, currently data are available from international data sources for eight indicators, but for R&D expenditure in the public sector, the 2008 data available from the UNESCO Institute for Statistics are be-coming too old. No additional data are expected to become available from international data sources, and national data sources have not yet been explored. Albania has an innovation survey covering innovation ac-tivities in 2011-201219, and for the six indicators using innovation sur-vey data, results might become available. The innovation survey data for Albania would, however, be difficult to compare with those of other countries as the CIS covers a three-year reference period, whereas the Albanian innovation survey covers two years only, thereby reducing the share of enterprises with innovation activities.
For Bosnia and Herzegovina, currently data are available from interna-tional data sources for 10 indicators. No additional data are expected to become available from international data sources, and national data sources have not yet been explored. Bosnia and Herzegovina has intro-duced its first innovation survey for the years 2014-2016, and for the six indicators using innovation survey data, results are expected to become available for the EIS 2019, increasing the number of indicators for which data would be available next year to at least 16.
For Kosovo, almost no data are currently available. No additional data are expected to become available from international data sources, and national data sources have not yet been explored. Kosovo has no inno-vation survey, and for the six indicators using innovation survey data, no results are expected to become available.
For Montenegro, currently data are available from international and na-tional data sources for 15 indicators. No additional data are expected to become available from international data sources. Montenegro has in-troduced its first innovation survey for the years 2014-2016, and for the six indicators using innovation survey data, results are expected to be available for the EIS 2019, increasing the number of indicators for which data would be available next year to 21, which would be sufficient to include Montenegro in the EIS 2019.

29European Innovation Scoreboard 2018
Table 3: Data availability Western Balkan countries
ALBANIA BOSNIA AND HERZEGOVINA KOSOVO MONTENEGRO
HUMAN RESOURCES
1.1.1 New doctorate graduates Not available Not available Not available 0.3 (2016)g
1.1.2 Population aged 25-34 with tertiary education Not available Not available Not available 34.3 (2016)g
1.1.3 Lifelong learning Not available Not available Not available 2.8 (2017)a
ATTRACTIVE RESEARCH SYSTEMS
1.2.1 International scientific co-publications 46.0 (2015)h 94.0 (2015)h Not available 266.8 (2015)h
1.2.2 Top 10% most cited publications 2.1 (2014)h 3.3 (2014)h Not available 3.2 (2014)h
1.2.3 Foreign doctorate students as a percentage of all doctorate students Not available Not available Not available Not available
INNOVATION-FRIENDLY ENVIRONMENT
1.3.1 Broadband penetration Not available Not available Not available 10.5 (2017)g
1.3.2 Opportunity-driven entrepreneurship Not available 1.2 (2017)i 1.3 (2014)i 1.0 (2010)i
FINANCE AND SUPPORT
2.1.1 R&D expenditure in the public sector 0.15 (2008)e 0.21 (2014)a Not available 0.24 (2015)a
2.1.2 Venture capital expenditures Not available Not available Not available Not available
FIRM INVESTMENTS
2.2.1 R&D expenditure in the business sector Not available 0.05 (2014)a Not available 0.11 (2015)a
2.2.2 Non-R&D innovation expendituresPossibly avail. from innovation survey
Expected from first innovation survey
Not available, no innovation survey
Expected from first innovation survey
2.2.3 Enterprises providing training to develop or upgrade ICT skills of their personnel Not available Not available Not available Not available
INNOVATORS
3.1.1 SMEs with product or process innovationsPossibly avail. from innovation survey
Expected from first innovation survey
Not available, no innovation survey
Expected from first innovation survey
3.1.2 SMEs with marketing or organisational innovations
Possibly avail. from innovation survey
Expected from first innovation survey
Not available, no innovation survey
Expected from first innovation survey
3.1.3 SMEs innovating in-housePossibly avail. from innovation survey
Expected from first innovation survey
Not available, no innovation survey
Expected from first innovation survey
LINKAGES
3.2.1 Innovative SMEs collaborating with othersPossibly avail. from innovation survey
Expected from first innovation survey
Not available, no innovation survey
Expected from first innovation survey
3.2.2 Public-private co-publications 0.35 (2013)h 1.05 (2014)h Not available Not available
3.2.3 Private co-funding of public R&D expenditures Not available 0.016 (2014)a Not available 0.001 (2015)a
INTELLECTUAL ASSETS
3.3.1 PCT patent applications Not availablec Not availablec Not availablec Not availablec
3.3.2 Trademark applications (absolute numbers)10 (2017)b
6 (2017)f
9 (2017)b
31 (2017)fNot available
10 (2017)b
7 (2017)f
3.3.3 Design applications (absolute numbers) 1 (2016)b 1 (2014)b Not available 0 (all years)b
EMPLOYMENT IMPACTS
4.1.1 Employment in knowledge-intensive activities Not available Not available Not available 11.4 (2016)a
4.1.2 Employment fast-growing enterprises of innovative sectors Not available Not available Not available Not available
SALES IMPACTS
4.2.1 Medium and high-tech product exports 11.2 (2016)d 22.4 (2017)d Not available 17.2 (2016)d
4.2.2 Knowledge-intensive services exports 22.6 (2016)d 14.9 (2015)d Not available 19.8 (2015)d
4.2.3 Sales of new-to-market and new-to-firm product innovations
Possibly avail. from innovation survey
Expected from first innovation survey
Not available, no innovation survey
Expected from first innovation survey
a Eurostat; b EUIPO; c OECD; d UN Comtrade; e UNESCO Institute for Statistics (UIS); f WIPO; g Monstat (Statistical Office of Montenegro); h European Commission: Science, Research and Innovation Performance of the EU (SRIP) report 2018: https://ec.europa.eu/info/support-policy-making-eu-and-horizon-2020-associated-countries/srip-report_en; i GEM (Global Entre pre-neur ship Monitor).

30 European Innovation Scoreboard 2018
China
South Korea
Australia
EU
Russia
United States
India
South Africa
Japan
Brazil
Canada
13.4
5.8
5.7
4.5
3.4
2.6
2.5
1.2
2.2
-2.9
2.3
-8 -6 -4 -2 0 2 4 6 8 10 12 14
Figure 14: Change in global performance
Figure 13: Global performance
5.3 Benchmarking against global competitors
This section provides a comparison of the EU to some of its main global economic competitors including Australia, the BRICS countries (Brazil, Russia, India, China, and South Africa), Canada, Japan, South Korea, and the United States. South Korea is the most innovative country perform-ing almost 24 per cent above the performance score of the EU in 2017 (Figure 13). Canada, Australia, Japan, and the United States also maintain a performance lead over the EU, while the EU has a perfor-mance lead over China, Brazil, South Africa, Russia, and India.
Based on relative-to-EU performance in 2017, South Korea would be an Innovation Leader, Canada, Australia, Japan, and the United States would be Strong Innovators, China and Brazil would be Moderate Inno-
vators, and South Africa, Russia, and India would be Modest Innovators. Performance has increased most in China, South Korea, and Australia, and for all three countries, performance has increased at a higher rate compared to the EU. For all other countries, performance has increased at a lower rate compared to the EU (Figure 14). For Canada, perfor-mance has decreased. Combining current and growth performance shows that South Korea and Australia have an increasing performance lead over the EU, while Canada, Japan, and the United States have a decreasing performance lead. The EU has a decreasing performance lead over China, and an increasing performance lead over Brazil, India, Russia, and South Africa.
129.2
122.5
116.9
107.4
105.2
104.5
79.4
51.0
51.9
44.3
56.2
South Korea
Canada
Australia
Japan
United States
EU
China
Brazil
South Africa
Russia
India
0 25 50 75 100 125 150
Bars show countries’ performance in 2017 relative to that of the EU in 2010.
Change in performance is measured as the difference between the performance in 2017 relative to the EU in 2010 and the performance in 2010 relative to the EU in 2010.
South Korea
Canada
Australia
Japan
United States
EU
China
Brazil
South Africa
Russia
India
123.7
117.2
111.9
102.8
100.7
100.0
76.0
48.8
49.6
42.4
53.8
0 25 50 75 100 125 150
Bars show countries’ performance in 2017 relative to that of the EU in 2017.

31European Innovation Scoreboard 2018
Methodology
The economic and population size of most global competitors out-weighs that of many of the individual EU Member States, and innovation performance is therefore compared to the aggregate of the Member States, i.e. the EU. Data availability is more limited for global competi-tors than for European countries. Therefore, a more restricted set of 16 indicators (Table 4) has been used for the international comparison of the EU with its global competitors.
For some indicators, different definitions have been used as compared to the previous chapters20:
• For Trademark applications, comparable data on resident and non-resident applications have been used from the World Develop-ment Indicators;
• For Design applications, comparable data on resident and non-resi-dent applications have been used from the World Development In-dicators;
20 Aggregate results for the EU are therefore not comparable to those used in the European benchmarking analysis.
• For Medium and high-tech product exports and Knowledge-inten-sive services exports, the data for the EU exclude trade between Member States (so-called intra-EU trade), and only include exports to non-Member States (so-called extra-EU trade);
• For Knowledge-intensive services exports, data have been used from the UN Comtrade database using an older EBOPS classifica-tion.
For each of the international competitors, the following pages very brief-ly discuss the performance of their innovation system compared to the EU, and relative strengths and weaknesses for the different indicators. For each country, a table with structural data is included comparable to those for the European and neighbouring countries in Chapter 7. The countries are ordered according to their performance rank order (cf. Fig-ure 13).
Data have been extracted from various sources including Eurostat, OECD (MSTI, Education at a Glance), different UN data sources including UNESCO Institute for Statistics, United Nations (Comtrade) and UNIDO,
* Data provided by CWTS (Leiden University) as part of a contract to the European Commission (DG Research and Innovation)
DATA SOURCE YEAR
FRAMEWORK CONDITIONS
HUMAN RESOURCES1.1.1 New doctorate graduates (per 1000 population aged 25-34) OECD 20151.1.2 Population aged 25-64 having completed tertiary education OECD 2016ATTRACTIVE RESEARCH SYSTEMS1.2.1 International scientific co-publications (per million population) Web of Science* 20171.2.2 Scientific publications among the top 10% most cited publications worldwide (share of total scientific publications of the country) Web of Science* 2015
INNOVATION-FRIENDLY ENVIRONMENT No indicator included in international comparison
INVESTMENTS
FINANCE AND SUPPORT2.1.1 R&D expenditure in the public sector (percentage of GDP) OECD, UIS 2016FIRM INVESTMENTS2.2.1 R&D expenditure in the business sector (percentage of GDP) OECD, UIS 2016
INNOVATION ACTIVITIES
INNOVATORS3.1.1 SMEs introducing product or process innovations (%-share) OECD 20143.1.2 SMEs introducing marketing or organisational innovations (%-share) OECD 2014LINKAGES3.2.1 Innovative SMEs collaborating with others (%-share) OECD 20143.2.2 Public-private co-publications (per million population) Web of Science* 20173.2.3 Private co-funding of public R&D expenditures (percentage of GDP) OECD 2016INTELLECTUAL ASSETS
3.3.1 PCT patent applicationsPatents: OECD
GDP: World Bank2014
3.3.2 Trademark applications (per billion GDP) World Bank 20163.3.3 Design applications (per billion GDP) World Bank 2016
IMPACTS
EMPLOYMENT IMPACTSNo indicator included in international comparisonSALES IMPACTS4.2.1 Medium and high-tech product exports (share of total product exports) United Nations 20174.2.2 Knowledge-intensive services exports (share of total service exports) United Nations 2016
Table 4: Indicators used in the international comparison

32 European Innovation Scoreboard 2018
Web of Science, World Bank (World Development Indicators), and Na-tional Statistical Offices of the countries included in this international comparison.
For the international benchmarking, a comparable list of contextual indi-cators has been used, but for most indicators measuring Performance and structure of the economy and Demography, data have been re-trieved from other data sources (cf. Table 5). For the international com-parison, the number of so-called Unicorns is included. Unicorns are start-ups with a value of more than US$1 billion.
The contextual indicators on the following pages show the following dif-ferences with the EU: The relative size of South Korea’s manufacturing industry is twice that of the EU. Top R&D spending firms in South Korea spend almost twice as much on R&D, FDI net inflows as a percentage of GDP are much lower, while entrepreneurial activities are at a higher lev-el. Canada’s economy shows a lower employment share for industry, and a higher employment share for services. Entrepreneurial activities are also at a higher level. The relative size of Australia’s manufacturing in-dustry is less than half that of the EU, while entrepreneurial activities
are at a higher level. Japan’s top R&D spending firms spend about 50% more on R&D as compared to EU top R&D spending firms. FDI net in-flows as a percentage of GDP are much lower, and Japan is also facing a declining population size. For the United States, entrepreneurial activ-ities are at a higher level, and top R&D spending firms spend almost 80% more on R&D. The number of Unicorns is more than four times that of the EU. China’s agricultural sector accounts for almost 30% of total employment, while also the relative size of the manufacturing industry is more than twice that of the EU. Entrepreneurial activities in China are at a higher level. Brazil has a relatively high share of employment in agriculture. Entrepreneurial activities are at a higher level, and top R&D spending firms spend more on R&D. The structure of South Africa’s economy as measured by employment shares is comparable to that of the EU. FDI net inflows as a percentage of GDP and R&D spending from Top R&D enterprises are relatively low. The structure of Russia’s econo-my is comparable to that of the EU. Top R&D spending firms spend less on R&D. India’s agricultural sector accounts for almost 50% of total employment, and entrepreneurial activities are at a higher level.
* Database from the World Bank ** Value added data are used in the international comparison as employment data are not available.
Table 5: Contextual indicators in the international comparison
Period Source
PERFORMANCE AND STRUCTURE OF THE ECONOMY
GDP per capita, PPP (international dollars) Average 2014-2016 World Development Indicators*
Average annual GDP growth (%) 2014-2016 World Development Indicators*
Employment share in Agriculture (%) Average 2014-2016 World Development Indicators*
Employment share in Industry (%) Average 2014-2016 World Development Indicators*
Employment share in Services (%) 2016 World Development Indicators*
Manufacturing – share in total value added ** Average 2013-2015 World Development Indicators*
BUSINESS AND ENTREPRENEURSHIP
Total early-stage Entrepreneurial Activity (TEA) (%) Average 2015-2017 Global Entrepreneurship Monitor
FDI net inflows (% GDP) Average 2014-2016 World Development Indicators*
Top R&D spending enterprises per 10 million population Average 2015-2017 EU Industrial R&D Investment Scoreboard
Top R&D spending enterprises, average R&D spending, million Euros Average 2015-2017 EU Industrial R&D Investment Scoreboard
Number of Unicorns Total CB Insights (https://www.cbinsights.com/research-unicorn-companies)
Buyer sophistication (1 to 7 best) Average 2015-2017 World Economic Forum
GOVERNANCE AND POLICY FRAMEWORK
Ease of starting a business (0 to 100 best) Average 2015-2017 Doing Business*
Basic-school entrepreneurial education and training (1 to 5 best) Average 2015-2017 Global Entrepreneurship Monitor
Government procurement of advanced technology products (1 to 7 best) Average 2014-2016 World Economic Forum
Rule of law (-2.5 to 2.5 best) Average 2014-2016 Worldwide Governance Indicators*
DEMOGRAPHY
Population size (millions) Average 2014-2016 World Development Indicators*
Average annual population growth (%) 2014-2016 World Development Indicators
Population density (inhabitants / km2) Average 2014-2016 World Development Indicators*

33European Innovation Scoreboard 2018
Performance in 2010 and 2017 relative to EU in 2010
South Korea 2010 2017 2010-2017
Doctorate graduates 73.5 83.8 10.3Tertiary education 143.9 143.2 -0.7International co-publications 106.5 104.6 -2.0Most cited publications 63.6 62.5 -1.0R&D expenditure public sector 117.9 129.8 12.0R&D expenditure business sector 231.1 240.1 9.0Product/process innovators 104.4 96.4 -8.0Marketing/organisational innovators 34.7 84.8 50.1Innovation collaboration 131.9 21.4 -110.5Public-private co-publications 143.6 156.4 12.8Private co-funding public R&D exp. 117.8 131.8 14.0PCT patent applications 129.6 161.7 32.1Trademark applications 238.4 233.3 -5.0Design applications 215.3 229.9 14.6Medium & high tech product exports 117.8 119.8 2.0Knowledge-intensive services exports 91.6 44.8 -46.9
Performance in 2010 and 2017 relative to EU in 2010
Canada 2010 2017 2010-2017
Doctorate graduates 77.4 78.4 1.0Tertiary education 183.3 171.9 -11.4International co-publications 189.6 183.0 -6.6Most cited publications 116.3 115.0 -1.3R&D expenditure public sector 126.0 115.5 -10.5R&D expenditure business sector 84.7 65.7 -19.0Product/process innovators 166.6 172.2 5.7Marketing/organisational innovators 136.0 154.7 18.7Innovation collaboration n/a n/a n/aPublic-private co-publications 129.7 104.7 -25.0Private co-funding public R&D exp. 120.1 109.9 -10.2PCT patent applications 85.9 86.1 0.2Trademark applications 190.8 178.8 -12.0Design applications 68.9 73.9 5.0Medium & high tech product exports 57.2 67.8 10.6Knowledge-intensive services exports 87.1 82.2 -4.9
Structural differences KR EUPerformance and structure of the economyGDP per capita, PPP (international $) 35,100 38,500Average annual GDP growth, % 2.8 2.1Employment share in Agriculture 5.3 4.6Employment share in Industry 24.9 24.1Employment share in Services 69.8 71.3Manufacturing - share in total value added 29.0 14.1Business and entrepreneurshipTotal Entrepreneurial Activity (TEA) 9.6 6.6FDI net inflows (% GDP) 0.57 3.60Top R&D spending firms per 10 mln population 14.7 19.7 - average R&D spending, mln Euros 337.0 175.6Number of Unicorns (April 2018) 3 25Buyer sophistication 1-7 (best) 5.0 3.7Governance and policy frameworkEase of starting a business 83.9 76.9Basic-school entrepren. education and training (1 to 5 best) 1.8 1.9Govt. procurement of advanced tech products (1 to 7 best) 3.9 3.5Rule of law (-2.5 to 2.5 best) 1.0 1.2DemographyPopulation size, mln 51.0 509.8Average annual population growth, % 0.5 0.3Share of population aged 15-64 73.1 65.4Population density (inhabitants / km2) 523.2 117.1
Structural differences CA EUPerformance and structure of the economyGDP per capita, PPP (international $) 44,800 38,500Average annual GDP growth, % 1.2 2.1Employment share in Agriculture 2.1 4.6Employment share in Industry 19.7 24.1Employment share in Services 78.2 71.3Manufacturing - share in total value added 9.7 14.1Business and entrepreneurshipTotal Entrepreneurial Activity (TEA) 16.7 6.6FDI net inflows (% GDP) 3.07 3.60Top R&D spending firms per 10 mln population 8.0 19.7 - average R&D spending, mln Euros 158.9 175.6Number of Unicorns (April 2018) 1 25Buyer sophistication 1-7 (best) 4.4 3.7Governance and policy frameworkEase of starting a business 78.9 76.9Basic-school entrepren. education and training (1 to 5 best) 2.3 1.9Govt. procurement of advanced tech products (1 to 7 best) 3.5 3.5Rule of law (-2.5 to 2.5 best) 1.8 1.2DemographyPopulation size, mln 35.9 509.8Average annual population growth, % 1.0 0.3Share of population aged 15-64 67.9 65.4Population density (inhabitants / km2) 3.9 117.1
The performance of South Korea is well above that of the EU, and the country is an Innovation Leader. Performance has increased since 2010. South Korea’s relative strengths are in Business R&D expenditures and
Intellectual Property applications.
The performance of Canada is well above that of the EU, and the country is a Strong Innovator. Performance has decreased since 2010. Canada’s relative strengths are in International co-publications, Product and
process innovation, and Trademark applications.
2010 2011 2012 2013 2014 2015 2016 20170
20406080
100120140160
123 124 125 130 123 125 129 129
124
Relative to EU in 2010 Relative to EU in 2017
2010 2011 2012 2013 2014 2015 2016 20170
20406080
100120140160
125 123 123 124 121 120 122 122
117
Relative to EU in 2010 Relative to EU in 2017
Columns show performance relative to EU in 2010. The red triangle shows performance relative to EU in 2017.
Best three and worst three indicators highlighted. Best three and worst three indicators highlighted.
Columns show performance relative to EU in 2010. The red triangle shows performance relative to EU in 2017.

34 European Innovation Scoreboard 2018
Performance in 2010 and 2017 relative to EU in 2010
Australia 2010 2017 2010-2017
Doctorate graduates 114.7 123.8 9.1Tertiary education 136.2 133.7 -2.6International co-publications 206.5 183.9 -22.6Most cited publications 115.1 117.1 2.1R&D expenditure public sector 122.7 120.6 -2.2R&D expenditure business sector 113.5 80.8 -32.7Product/process innovators 157.0 181.1 24.0Marketing/organisational innovators 110.0 136.7 26.6Innovation collaboration 149.8 131.0 -18.7Public-private co-publications 97.9 80.0 -17.9Private co-funding public R&D exp. 98.8 108.0 9.2PCT patent applications 87.9 78.0 -9.9Trademark applications 260.9 228.3 -32.6Design applications 92.3 96.7 4.4Medium & high tech product exports 14.1 19.0 4.9Knowledge-intensive services exports 29.1 33.4 4.4
Performance in 2010 and 2017 relative to EU in 2010
Japan 2010 2017 2010-2017
Doctorate graduates 68.8 61.5 -7.3Tertiary education 162.3 154.3 -8.0International co-publications 85.6 80.5 -5.1Most cited publications 63.1 59.4 -3.8R&D expenditure public sector 99.4 92.4 -7.0R&D expenditure business sector 213.9 199.1 -14.9Product/process innovators 76.7 80.2 3.5Marketing/organisational innovators 82.0 95.2 13.2Innovation collaboration 120.9 164.7 43.8Public-private co-publications 146.4 118.4 -28.0Private co-funding public R&D exp. 26.0 34.6 8.6PCT patent applications 145.5 161.7 16.2Trademark applications 90.7 158.6 67.8Design applications 94.3 91.0 -3.3Medium & high tech product exports 123.0 118.8 -4.2Knowledge-intensive services exports 123.5 66.5 -57.0
Structural differences AU EUPerformance and structure of the economyGDP per capita, PPP (international $) 46,200 38,500Average annual GDP growth, % 2.6 2.1Employment share in Agriculture 2.8 4.6Employment share in Industry 21.8 24.1Employment share in Services 75.4 71.3Manufacturing - share in total value added 6.1 14.1Business and entrepreneurshipTotal Entrepreneurial Activity (TEA) 13.2 6.6FDI net inflows (% GDP) 3.14 3.60Top R&D spending firms per 10 mln population 6.3 19.7 - average R&D spending, mln Euros 207.1 175.6Number of Unicorns (April 2018) 1 25Buyer sophistication 1-7 (best) 3.9 3.7Governance and policy frameworkEase of starting a business 80.2 76.9Basic-school entrepren. education and training (1 to 5 best) 2.1 1.9Govt. procurement of advanced tech products (1 to 7 best) 3.4 3.5Rule of law (-2.5 to 2.5 best) 1.8 1.2DemographyPopulation size, mln 23.8 509.8Average annual population growth, % 1.4 0.3Share of population aged 15-64 66.2 65.4Population density (inhabitants / km2) 3.1 117.1
Structural differences JP EUPerformance and structure of the economyGDP per capita, PPP (international $) 40,700 38,500Average annual GDP growth, % 1.1 2.1Employment share in Agriculture 3.8 4.6Employment share in Industry 26.8 24.1Employment share in Services 69.4 71.3Manufacturing - share in total value added 18.8 14.1Business and entrepreneurshipTotal Entrepreneurial Activity (TEA) 4.7 6.6FDI net inflows (% GDP) 0.41 3.60Top R&D spending firms per 10 mln population 28.3 19.7 - average R&D spending, mln Euros 268.6 175.6Number of Unicorns (April 2018) 1 25Buyer sophistication 1-7 (best) 5.0 3.7Governance and policy frameworkEase of starting a business 75.4 76.9Basic-school entrepren. education and training (1 to 5 best) 1.6 1.9Govt. procurement of advanced tech products (1 to 7 best) 4.0 3.5Rule of law (-2.5 to 2.5 best) 1.5 1.2DemographyPopulation size, mln 127.1 509.8Average annual population growth, % -0.1 0.3Share of population aged 15-64 61.0 65.4Population density (inhabitants / km2) 348.7 117.1
The performance of Australia is above that of the EU, and the country is a Strong Innovator. Performance has increased since 2010. Australia’s strengths are in International co-publications, Product and process innovation,
and Trademark applications.
The performance of Japan is above that of the EU, and the country is a Strong Innovator. Performance has increased since 2010. Japan’s relative strengths are in Business R&D expenditures, Innovation collaboration,
and Patent applications.
2010 2011 2012 2013 2014 2015 2016 20170
20406080
100120140160
111 116 112 116 114 116 116 116
112
Relative to EU in 2010 Relative to EU in 2017
2010 2011 2012 2013 2014 2015 2016 20170
20406080
100120140160
105 104 106 107 107 107 107 107
103
Relative to EU in 2010 Relative to EU in 2017
Columns show performance relative to EU in 2010. The red triangle shows performance relative to EU in 2017.
Best three and worst three indicators highlighted. Best three and worst three indicators highlighted.
Columns show performance relative to EU in 2010. The red triangle shows performance relative to EU in 2017.

35European Innovation Scoreboard 2018
Performance in 2010 and 2017 relative to EU in 2010
United States 2010 2017 2010-2017
Doctorate graduates 96.9 80.8 -16.0Tertiary education 150.9 139.5 -11.4International co-publications 128.9 126.6 -2.3Most cited publications 139.7 130.8 -8.8R&D expenditure public sector 108.8 100.7 -8.1R&D expenditure business sector 166.2 157.2 -9.0Product/process innovators 66.4 72.6 6.2Marketing/organisational innovators n/a n/a n/aInnovation collaboration n/a n/a n/aPublic-private co-publications 179.2 169.2 -10.0Private co-funding public R&D exp. 40.9 42.3 1.4PCT patent applications 105.2 111.8 6.6Trademark applications 53.0 55.2 2.2Design applications 49.4 58.8 9.4Medium & high tech product exports 84.3 85.7 1.5Knowledge-intensive services exports 82.6 86.4 3.8
Performance in 2010 and 2017 relative to EU in 2010
China 2010 2017 2010-2017
Doctorate graduates 13.0 10.8 -2.1Tertiary education 36.5 39.5 3.0International co-publications 27.6 36.4 8.8Most cited publications 68.4 77.4 9.0R&D expenditure public sector 65.8 70.7 4.9R&D expenditure business sector 111.9 132.0 20.1Product/process innovators n/a n/a n/aMarketing/organisational innovators n/a n/a n/aInnovation collaboration n/a n/a n/aPublic-private co-publications 7.8 16.7 8.9Private co-funding public R&D exp. 126.0 119.8 -6.1PCT patent applications 43.8 67.4 23.5Trademark applications 181.8 266.0 84.2Design applications 205.8 208.6 2.8Medium & high tech product exports 95.3 91.7 -3.6Knowledge-intensive services exports 91.8 49.4 -42.4
Structural differences US EUPerformance and structure of the economyGDP per capita, PPP (international $) 56,200 38,500Average annual GDP growth, % 2.2 2.1Employment share in Agriculture 1.5 4.6Employment share in Industry 17.4 24.1Employment share in Services 81.1 71.3Manufacturing - share in total value added 11.8 14.1Business and entrepreneurshipTotal Entrepreneurial Activity (TEA) 12.7 6.6FDI net inflows (% GDP) 2.24 3.60Top R&D spending firms per 10 mln population 25.8 19.7 - average R&D spending, mln Euros 312.8 175.6Number of Unicorns (April 2018) 114 25Buyer sophistication 1-7 (best) 4.8 3.7Governance and policy frameworkEase of starting a business 82.3 76.9Basic-school entrepren. education and training (1 to 5 best) 2.1 1.9Govt. procurement of advanced tech products (1 to 7 best) 4.3 3.5Rule of law (-2.5 to 2.5 best) 1.6 1.2DemographyPopulation size, mln 320.9 509.8Average annual population growth, % 0.7 0.3Share of population aged 15-64 66.1 65.4Population density (inhabitants / km2) 35.1 117.1
Structural differences CN EUPerformance and structure of the economyGDP per capita, PPP (international $) 14,500 38,500Average annual GDP growth, % 6.8 2.1Employment share in Agriculture 28.8 4.6Employment share in Industry 23.8 24.1Employment share in Services 47.3 71.3Manufacturing - share in total value added 32.8 14.1Business and entrepreneurshipTotal Entrepreneurial Activity (TEA) 11.0 6.6FDI net inflows (% GDP) 2.09 3.60Top R&D spending firms per 10 mln population 2.4 19.7 - average R&D spending, mln Euros 147.1 175.6Number of Unicorns (April 2018) 64 25Buyer sophistication 1-7 (best) 4.3 3.7Governance and policy frameworkEase of starting a business 63.4 76.9Basic-school entrepren. education and training (1 to 5 best) 1.8 1.9Govt. procurement of advanced tech products (1 to 7 best) 4.3 3.5Rule of law (-2.5 to 2.5 best) -0.4 1.2DemographyPopulation size, mln 1371.4 509.8Average annual population growth, % 0.5 0.3Share of population aged 15-64 72.6 65.4Population density (inhabitants / km2) 146.1 117.1
The performance of the United States is just above that of the EU, and the country is a Strong Innovator. Performance has increased since 2010. Relative strengths are in Tertiary education, Business R&D expenditures, and
Public-private co-publications.
The performance of China is below that of the EU, and the country is a Moderate Innovator. Performance has increased strongly since 2010. Relative strengths are in Business R&D expenditures and Trademark and Design
applications.
2010 2011 2012 2013 2014 2015 2016 20170
20406080
100120140160
102 101 102 101 103 102 103 105
101
Relative to EU in 2010 Relative to EU in 2017
2010 2011 2012 2013 2014 2015 2016 20170
20406080
100120140160
66 70 74 79 77 77 76 79
76
Relative to EU in 2010 Relative to EU in 2017
Columns show performance relative to EU in 2010. The red triangle shows performance relative to EU in 2017.
Best three and worst three indicators highlighted. Best three and worst three indicators highlighted.
Columns show performance relative to EU in 2010. The red triangle shows performance relative to EU in 2017.

36 European Innovation Scoreboard 2018
Performance in 2010 and 2017 relative to EU in 2010
Brazil 2010 2017 2010-2017
Doctorate graduates 24.0 23.4 -0.5Tertiary education 46.0 43.8 -2.2International co-publications 46.1 51.5 5.4Most cited publications 46.0 49.8 3.7R&D expenditure public sector 91.2 93.3 2.2R&D expenditure business sector 46.3 41.9 -4.5Product/process innovators 109.6 114.8 5.3Marketing/organisational innovators 146.9 181.8 34.9Innovation collaboration 62.6 52.8 -9.8Public-private co-publications 5.5 5.6 0.1Private co-funding public R&D exp. n/a n/a n/aPCT patent applications 26.0 28.0 2.0Trademark applications 95.7 99.8 4.0Design applications 52.0 52.4 0.4Medium & high tech product exports 39.3 47.3 8.1Knowledge-intensive services exports 103.9 78.3 -25.5
Performance in 2010 and 2017 relative to EU in 2010
South Africa 2010 2017 2010-2017
Doctorate graduates 8.5 11.0 2.5Tertiary education 40.5 36.8 -3.7International co-publications 63.4 68.1 4.7Most cited publications 67.2 71.6 4.4R&D expenditure public sector 57.3 57.5 0.3R&D expenditure business sector 44.8 27.8 -16.9Product/process innovators n/a n/a n/aMarketing/organisational innovators 125.5 158.9 33.3Innovation collaboration 200.1 168.9 -31.2Public-private co-publications 8.7 6.9 -1.8Private co-funding public R&D exp. 42.3 58.5 16.2PCT patent applications 48.1 41.4 -6.7Trademark applications 106.8 96.7 -10.1Design applications 0.0 65.2 65.2Medium & high tech product exports 47.1 63.5 16.4Knowledge-intensive services exports 19.7 20.6 0.9
Structural differences BR EUPerformance and structure of the economyGDP per capita, PPP (international $) 15,600 38,500Average annual GDP growth, % -3.7 2.1Employment share in Agriculture 14.9 4.6Employment share in Industry 21.8 24.1Employment share in Services 63.3 71.3Manufacturing - share in total value added 12.2 14.1Business and entrepreneurshipTotal Entrepreneurial Activity (TEA) 20.3 6.6FDI net inflows (% GDP) 4.15 3.60Top R&D spending firms per 10 mln population 0.4 19.7 - average R&D spending, mln Euros 205.6 175.6Number of Unicorns (April 2018) 1 25Buyer sophistication 1-7 (best) 3.4 3.7Governance and policy frameworkEase of starting a business 56.9 76.9Basic-school entrepren. education and training (1 to 5 best) 1.4 1.9Govt. procurement of advanced tech products (1 to 7 best) 3.2 3.5Rule of law (-2.5 to 2.5 best) -0.1 1.2DemographyPopulation size, mln 205.9 509.8Average annual population growth, % 0.8 0.3Share of population aged 15-64 69.5 65.4Population density (inhabitants / km2) 24.6 117.1
Structural differences SA EUPerformance and structure of the economyGDP per capita, PPP (international $) 13,100 38,500Average annual GDP growth, % 0.8 2.1Employment share in Agriculture 6.0 4.6Employment share in Industry 26.8 24.1Employment share in Services 67.2 71.3Manufacturing - share in total value added 12.5 14.1Business and entrepreneurshipTotal Entrepreneurial Activity (TEA) 9.0 6.6FDI net inflows (% GDP) 0.96 3.60Top R&D spending firms per 10 mln population 0.3 19.7 - average R&D spending, mln Euros 66.1 175.6Number of Unicorns (April 2018) 2 25Buyer sophistication 1-7 (best) 4.0 3.7Governance and policy frameworkEase of starting a business 64.8 76.9Basic-school entrepren. education and training (1 to 5 best) 1.8 1.9Govt. procurement of advanced tech products (1 to 7 best) 2.9 3.5Rule of law (-2.5 to 2.5 best) 0.1 1.2DemographyPopulation size, mln 55.0 509.8Average annual population growth, % 1.6 0.3Share of population aged 15-64 65.5 65.4Population density (inhabitants / km2) 45.6 117.1
The performance of Brazil is below that of the EU, and the country is a Moderate Innovator. Performance has decreased recently. Brazil’s relative strengths are in the share of enterprises introducing innovations
and Trademark applications.
The performance of South Africa is below that of the EU, and the country is a Modest Innovator. Performance has increased since 2010. Relative strengths are in the share of enterprises introducing innovations and
Trademark applications.
2010 2011 2012 2013 2014 2015 2016 20170
20406080
100120140160
55 55 56 57 57 59 60 5676
54
Relative to EU in 2010 Relative to EU in 2017
2010 2011 2012 2013 2014 2015 2016 20170
20406080
100120140160
49 44 48 48 51 50 51 52
50
Relative to EU in 2010 Relative to EU in 2017
Columns show performance relative to EU in 2010. The red triangle shows performance relative to EU in 2017.
Best three and worst three indicators highlighted. Best three and worst three indicators highlighted.
Columns show performance relative to EU in 2010. The red triangle shows performance relative to EU in 2017.

37European Innovation Scoreboard 2018
Performance in 2010 and 2017 relative to EU in 2010
Russia 2010 2017 2010-2017
Doctorate graduates 85.2 60.6 -24.6Tertiary education 192.5 169.9 -22.6International co-publications 53.2 54.8 1.5Most cited publications 28.1 34.0 5.9R&D expenditure public sector 59.7 66.8 7.1R&D expenditure business sector 56.6 51.8 -4.8Product/process innovators 11.4 15.4 4.1Marketing/organisational innovators 6.1 7.8 1.6Innovation collaboration 7.8 9.8 2.0Public-private co-publications 6.1 5.4 -0.7Private co-funding public R&D exp. 129.7 124.4 -5.3PCT patent applications 29.8 33.6 3.8Trademark applications 148.0 130.3 -17.7Design applications 49.1 50.9 1.8Medium & high tech product exports 13.4 21.1 7.7Knowledge-intensive services exports 94.1 95.6 1.5
Performance in 2010 and 2017 relative to EU in 2010
India 2010 2017 2010-2017
Doctorate graduates 6.9 5.7 -1.2Tertiary education 35.5 29.9 -5.6International co-publications 19.0 20.0 1.0Most cited publications 61.2 60.7 -0.4R&D expenditure public sector 79.7 78.6 -1.1R&D expenditure business sector 22.0 23.5 1.5Product/process innovators 51.7 58.4 6.6Marketing/organisational innovators 106.2 134.4 28.2Innovation collaboration n/a n/a n/aPublic-private co-publications 1.8 2.0 0.1Private co-funding public R&D exp. n/a n/a n/aPCT patent applications 31.3 33.6 2.2Trademark applications 75.1 67.9 -7.3Design applications 40.8 41.9 1.1Medium & high tech product exports 40.0 51.7 11.7Knowledge-intensive services exports 119.5 119.1 -0.4
Structural differences RU EUPerformance and structure of the economyGDP per capita, PPP (international $) 25,100 38,500Average annual GDP growth, % -1.5 2.1Employment share in Agriculture 6.7 4.6Employment share in Industry 27.3 24.1Employment share in Services 65.9 71.3Manufacturing - share in total value added 13.1 14.1Business and entrepreneurshipTotal Entrepreneurial Activity (TEA) 6.3 6.6FDI net inflows (% GDP) 1.37 3.60Top R&D spending firms per 10 mln population 0.2 19.7 - average R&D spending, mln Euros 120.9 175.6Number of Unicorns (April 2018) 0 25Buyer sophistication 1-7 (best) 3.7 3.7Governance and policy frameworkEase of starting a business 72.5 76.9Basic-school entrepren. education and training (1 to 5 best) 2.1 1.9Govt. procurement of advanced tech products (1 to 7 best) 3.3 3.5Rule of law (-2.5 to 2.5 best) -0.8 1.2DemographyPopulation size, mln 144.1 509.8Average annual population growth, % 0.2 0.3Share of population aged 15-64 69.6 65.4Population density (inhabitants / km2) 8.8 117.1
Structural differences IN EUPerformance and structure of the economyGDP per capita, PPP (international $) 6,100 38,500Average annual GDP growth, % 7.6 2.1Employment share in Agriculture 45.9 4.6Employment share in Industry 24.2 24.1Employment share in Services 29.9 71.3Manufacturing - share in total value added 12.7 14.1Business and entrepreneurshipTotal Entrepreneurial Activity (TEA) 10.2 6.6FDI net inflows (% GDP) 1.92 3.60Top R&D spending firms per 10 mln population 0.2 19.7 - average R&D spending, mln Euros 169.1 175.6Number of Unicorns (April 2018) 10 25Buyer sophistication 1-7 (best) 4.4 3.7Governance and policy frameworkEase of starting a business 54.0 76.9Basic-school entrepren. education and training (1 to 5 best) 2.3 1.9Govt. procurement of advanced tech products (1 to 7 best) 3.8 3.5Rule of law (-2.5 to 2.5 best) -0.1 1.2DemographyPopulation size, mln 1309.0 509.8Average annual population growth, % 1.2 0.3Share of population aged 15-64 65.7 65.4Population density (inhabitants / km2) 440.3 117.1
The performance of Russia is below that of the EU, and the country is a Modest Innovator. Performance has increased since 2010. Russia’s relative strengths are in Tertiary education, Private co-funding of public R&D,
and Trademark applications.
The performance of India is below that of the EU, and the country is a Modest Innovator. Performance has increased since 2010. Relative strengths are in Public R&D expenditure, Marketing and organisational
innovation, and Exports of knowledge-intensive services.
2010 2011 2012 2013 2014 2015 2016 20170
20406080
100120140160
47 48 41 45 44 51 52 51
49
Relative to EU in 2010 Relative to EU in 2017
2010 2011 2012 2013 2014 2015 2016 20170
20406080
100120140160
42 42 40 42 43 44 44 44
42
Relative to EU in 2010 Relative to EU in 2017
Columns show performance relative to EU in 2010. The red triangle shows performance relative to EU in 2017.
Best three and worst three indicators highlighted. Best three and worst three indicators highlighted.
Columns show performance relative to EU in 2010. The red triangle shows performance relative to EU in 2017.

38 European Innovation Scoreboard 2018
6. Expected short-term changes in EU innovation performance
This year’s report includes, for the third time, a forward-looking analysis of EU innovation performance discussing more recent developments, trends, and expected changes. The aim is to address the need for more recent information, since available statistical data for the indicators used for constructing the innovation index are, on average, two to three years old. This year’s analysis once again, as in the EIS 2016, will use provisional ‘fast-track’ data from the 2016 Community Innovation Sur-vey (CIS) (cf. Section 6.3).
In summary, the analysis suggests that EU innovation performance will continue to increase for most indicators, leading to an increase in overall EU innovation performance compared to 2010 from 106 in 2017 to 112 in two years’ time (Figure 15). Of the expected 6.2 percentage point increase, about 40% can be explained by improved performance for the six indicators using provisional CIS 2016 data, and about 20% each in terms of the expected increase of Broadband penetration and Venture capital expenditures.
Table 6 shows a summary of the results for 18 indicators for which the calculation of relatively reliable short-term changes proved possible. EU innovation performance is expected to increase strongly by at least 10 percent for six indicators, to increase between five and 10 percent for one indicator, to increase more moderately between one and five per-cent for eight indicators, and to remain stable for three indicators. A decrease in performance is not expected for any of the indicators.
Section 6.1 first discusses the accuracy of last year’s predictions. Sec-tion 6.2 examines trend performance of the EU compared to four of its main international competitors. Section 6.3 discusses the provisional ‘fast-track’ CIS 2016 data. Section 6.4 explores EU trend performance for individual indicators, and Section 6.5 discusses the possible use of Big data for providing more timely and policy-relevant innovation-relat-ed indicators.
2010 2011 2012 2013 2014 2015 2016 2017 2018 201990
95
100
105
110
115
100 10099 100 100
102105
106
112110
Summary Innovation Index relative to 2010 Nowcast
Figure 15: Expected EU innovation performance

39European Innovation Scoreboard 2018
CURRENT SCORE
EXPECTED CHANGE IN TWO YEARS'
TIME
METHODOLOGY FOR ESTIMATING EXPECTED CHANGE
HUMAN RESOURCES
1.1.1 Doctorate graduates per 1000 population age 25-34 2.01 5-10% increase Linear regression
1.1.2 Population aged 25-34 with tertiary education 39.0 1-5% increase Linear regression
ATTRACTIVE RESEARCH SYSTEMS
1.2.1 International scientific co-publications 334.0 >10% increase Linear regression
1.2.2 Most-cited scientific publications 10.6 No notable change Linear regression
1.2.3 Foreign doctorate students 26.1 1-5% increase Linear regression
INNOVATION-FRIENDLY ENVIRONMENT
1.3.1 Broadband penetration 16.0 >10% increase Linear regression
FINANCE AND SUPPORT
2.1.2 Venture capital expenditures 0.099 >10% increase Linear regression
FIRM INVESTMENTS
2.2.1 R&D expenditure in the business sector 1.32 1-5% increase Survey on Industrial R&D Investment Trends
2.2.2 Non-R&D innovation expenditures 0.76 >10% increase CIS 2016 Fast-track data
INNOVATORS
3.1.1 SMEs with product or process innovations 30.9 >10% increase CIS 2016 Fast-track data
3.1.2 SMEs with marketing or organisational innovations 34.9 1-5% increase CIS 2016 Fast-track data
3.1.3 SMEs innovating in-house 28.8 >10% increase CIS 2016 Fast-track data
LINKAGES
3.2.1 Innovative SMEs collaborating with others 11.2 No notable change CIS 2016 Fast-track data
INTELLECTUAL ASSETS
3.3.1 PCT patent applications 3.53 No notable change Econometric model using GDP and R&D
3.3.2 Trademark applications 7.86 1-5% increase Linear regression
EMPLOYMENT IMPACTS
4.1.1 Employment in knowledge-intensive activities 14.2 1-5% increase Linear regression
SALES IMPACTS
4.2.2 Knowledge-intensive services exports 69.2 1-5% increase Linear regression
4.2.3 Sales of new-to-market and new-to-firm product innovations 13.4 1-5% increase CIS 2016 Fast-track data
Table 6: Changes in two years’ time in EU innovation performance

40 European Innovation Scoreboard 2018
EIS 2017 SCORE
EXPECTED CHANGE IN TWO
YEARS’ TIME
REVISEDSCORE FOR EIS 2017
EIS 2018 SCORE
REALISED CHANGE IN ONE-YEAR
ACCURACY OF EIS 2017 PREDICTION
Population aged 25-34 with tertiary education 38.2 1-5% increase same 39.0 1-5% increase Good
International scientific co-publications 493.6 >10% increase 501.4 517.5 1-5% increase Fairly good
Most-cited scientific publications 10.6 1-5% increase same 10.6 No notable change Fairly good
Foreign doctorate students 25.6 1-5% increase same 26.1 1-5% increase Good
Broadband penetration 13.0 >10% increase same 16.0 >10% increase Good
Opportunity-driven entrepreneurship 3.1 1-5% decrease same 3.3 5-10% increase Poor
Venture capital expenditures 0.063 1-5% decrease 0.077 0.116 >10% increase Poor
R&D expenditure in the business sector 1.30 1-5% decrease 131 1.32 No notable change Fairly good
Non-R&D innovation expenditures 0.76 5-10% increase sameNo
update-- --
Training ICT skills 22.0 5-10% increase same 21.0 1-5% decrease Poor
SMEs with product or process innovations 30.9 1-5% decrease sameNo
update-- --
SMEs with marketing or organisational innovations 34.9 1-5% decrease sameNo
update-- --
Innovative SMEs collaborating with others 11.2 5-10% increase sameNo
update-- --
PCT patent applications 3.70 1-5% decrease same 3.53 1-5% decrease Good
Trademark applications 7.60 1-5% increase 7.58 7.86 1-5% increase Good
Design applications 4.33 No notable change 4.34 4.44 1-5% increase Fairly good
Employment in knowledge-intensive activities 14.1 1-5% increase 14.0 14.1 No notable change Fairly good
Medium and high-tech product exports 56.2 1-5% increase same 56.7 No notable change Fairly good
Knowledge-intensive services exports 69.3 1-5% increase 69.4 69.2 No notable change Fairly good
Table 7: Accuracy of EIS 2017 predictions for short-term changes in EU innovation performance
6.1 Looking back at last year’s estimates
21 For two of these indicators last year a decline was predicted whereas performance has increased.
The EIS 2017 report suggested – over a period of two years – an in-crease in the EIS innovation index by about 2% and a strong increase of more than 10% for two indicators, a more moderate increase between 1% and 10% for 10 indicators, about the same performance for one indicator, and a decrease for six indicators. For eight indicators, expected two-year changes could not be calculated.
Table 7 provides a comparison of the predicted two-year change and the real one-year change achieved since last year. For five indicators, last year’s prediction turned out to be good, for seven indicators it was fairly good, and for three indicators it was poor21. For the indicators using CIS data, the same data are used in this year’s report, and a comparison of the predicted scores will not be possible until next year. Overall, the average accuracy of the expected changes is sufficiently high to use the same methodology for most indicators in this year’s forward-looking analysis.

41European Innovation Scoreboard 2018
6.2 EU trend performance compared to China, Japan, South Korea, and the United States
22 Growth for the EU is different from that in Section 3 as the methodologies for calculating nowcasts are different.
A statistical trend analysis using performance data for 2010 to 2017 shows that the EU performance gap towards Japan and South Korea is expected to narrow. The gap with South Korea is expected to shrink by 0.8 percentage points, and the gap with Japan by 0.6 percentage points (red-coloured numbers in Figure 16). The performance gap with the United States is expected to be closed in two years’ time, and the EU performance lead over China is expected to decrease by more than 1 percentage point. Nowcasts for 2018 and 2019 have been calculated for the EU, China, Japan, South Korea, and the United States, using esti-mates based on nowcasting three-year averages for the innovation in-dex scores. Details are explained in the EIS 2018 Methodology Report.
For South Korea, the trend analysis foresees an increase in the rela-tive-to-EU performance in 2010 from 129.2 in 2017 to 130.3 in two years’ time (blue coloured number in Figure 16). For Japan, the trend analysis foresees an increase of the relative-to-EU performance in 2010 from 107.4 in 2017 to 108.4 in two years’ time. For the United States, the trend analysis foresees an increase of the relative-to-EU performance in 2010 from 105.2 in 2017 to 105.9 in two years’ time. For China, the trend analysis foresees an increase of the relative-to-EU performance in 2010 from 79.4 in 2017 to 82.0 in two years’ time. The EU’s performance, based on nowcasting the innovation index, is expect-ed to increase by 1.5 percentage points22.
2010 2011 2012 2013 2014 2015 2016 2017 2018 201960
80
100
120
140
129.2 130.3
122.9123.7
Relative to EU 2010 Relative to EU in same year
South Korea
2010 2011 2012 2013 2014 2015 2016 2017 2018 201960
80
100
120
140
105.2 105.9
99.9
Relative to EU 2010 Relative to EU in same year
100.7
United States
2010 2011 2012 2013 2014 2015 2016 2017 2018 201960
80
100
120
140
79.4 82.0
77.3
Relative to EU 2010 Relative to EU in same year
76.0
China
2010 2011 2012 2013 2014 2015 2016 2017 2018 201960
80
100
120
140
107.4 108.4
102.2102.8
Japan
Relative to EU 2010 Relative to EU in same year
Figure 16: Expected short-term changes in innovation performance for main competitors

42 European Innovation Scoreboard 2018
6.3 Provisional CIS 2016 data
23 Austria, Bulgaria, Croatia, Cyprus, Czech Republic, Denmark, Estonia, Finland, France, Germany, Greece, Hungary, Ireland, Italy, Latvia, Lithuania, Malta, Poland, Portugal, Romania, Slovakia, Slovenia, Spain, Sweden, and the United Kingdom.
24 Results for all countries are included in the respective Country profiles in Section 7.
25 Fast-track data for Denmark and the United Kingdom were made available too late to include them in the calculation of the EU aggregates.
The Community Innovation Survey (CIS) is a survey of innovation activity in enterprises. For the CIS 2014, the latest CIS for which final results are available, most questions cover the reference period 2012-2014, i.e. the three-year period from the beginning of 2012 to the end of 2014. Ac-cording to Commission Regulation No 995/2012, national CIS statistics must be delivered to Eurostat within 18 months of the end of the refer-ence year, i.e. June in even-numbered years (e.g., June 2016 for the CIS 2014). Data are then checked and corrected for detected inconsisten-cies by Eurostat. Final CIS 2014 data were made available by Eurostat in November 2016. Final CIS 2016 data are expected to be made avail-able by Eurostat in the last quarter of 2018.
Eurostat has made a request to national data providers to share provi-sional CIS 2016 data for the indicators used in the EIS. Provisional CIS 2016 data for all CIS-based EIS indicators were received from 28 coun-tries, including 25 Member States23, Norway, Serbia, and Turkey24, except for the two indicators using expenditure data for Austria, Italy, and Tur-key, and SMEs innovating in-house for Turkey (Table 8).
An EU aggregate using data for those Member States which shared pro-visional CIS 2016 data25 can be compared with the EU aggregate for the same set of Member States using final CIS 2014 data. For the EU, pro-visional CIS 2016 data scores are higher for five indicators, and almost the same for one indicator (Figure 17).
SMES WITH PRODUCT/ PROCESS
INNOVATIONS
SMES WITH ORGANI-
SATIONAL/ MARKETING
INNOVATIONS
SMES INNOVATING IN-HOUSE
INNOVATIVE SMES COLLABORATING
WITH OTHERS
NON-R&D INNOVATION
EXPENDITURES
SALES OF NEW-TO-MARKET OR NEW-TO-
FIRM PRODUCT INNOVATIONS
EU European Union 111 105 112 100 114 103BG Bulgaria 116 107 123 117 63 125CZ Czech Republic 107 122 109 126 79 89DK Denmark 135 176 143 188 n/a n/aDE Germany 99 93 97 85 123 105EE Estonia 238 135 243 229 225 106IE Ireland 83 93 83 83 104 224EL Greece 128 115 126 153 126 105ES Spain 115 106 100 96 116 121FR France 107 109 107 101 95 65HR Croatia 121 122 126 145 116 169IT Italy 125 112 127 86 n/a n/aCY Cyprus 89 91 93 80 317 275LV Latvia 157 113 149 202 129 150LT Lithuania 112 139 109 110 100 172HU Hungary 119 121 124 95 83 61MT Malta 84 84 86 79 263 198AT Austria 111 110 110 105 n/a n/aPL Poland 111 98 145 128 90 97PT Portugal 133 125 200 126 159 156RO Romania 94 83 94 96 50 73SI Slovenia n/a 81 86 93 90 73SK Slovakia 117 89 120 97 130 106FI Finland 123 120 126 127 230 122SE Sweden 95 103 96 98 69 126UK United Kingdom 138 83 190 120 163 131NO Norway 135 125 119 114 108 118RS Serbia 119 95 92 177 497 149TR Turkey 132 124 n/a 166 n/a n/a
Table 8: Relative performance of provisional CIS 2016 data compared to CIS 2014 data for EU, EU Member States and other European countries
Relative performance for provisional CIS 2016 indicator scores has been calculated relative to the CIS 2014 indicator scores (where the relative score is 100 if the provisional CIS 2016 score
equals the CIS 2014 score). For Slovenia, a relative performance for SMEs innovating in-house score could not be calculated as CIS 2014 data are not available. For Austria, Italy, and Turkey,
data are not available for the two expenditure-based indicators. For Denmark, data are not available for Sales of new-to-market and new-to-firm innovations. For Turkey, data are not
available for SMEs innovating in-house.

43European Innovation Scoreboard 2018
EU averages using data for all Member States shown in blue coloured columns. Data for 2014 and 2016 for the average of those Member States for which provisional CIS 2016 data are
available are shown with red coloured dots. The forecast for the EU for 2016, shown in the green coloured column, is calculated by taking the vertical difference between the EU (blue column
for 2014) and the CIS 2016 fast-track subgroup of Member States (the red coloured dot on top of the blue column) and repeating this difference for 2016. The EU average using data for
Member States having made available provisional CIS 2016 data represents about 80% for SMEs with product and process innovations, about 80% for SMEs with marketing and organisa-
tional innovations, about 75% for SMEs innovating in-house, about 65% for Innovative SMEs collaborating with others, about 75% for total EU Non-R&D innovation expenditures, and about
60% for Sales due to new-to-market or new-to-firm product innovations.
2008 2010 2012 2014 20160
5
10
15
20
25
30
35
40
35.1 33.5 30.6 30.9 34.2
2008 2010 2012 2014 20160
2
4
6
8
10
12
11.2 8.9 10.3 11.2 11.2
2008 2010 2012 2014 201605
1015202530354045
39.9 39.8 36.2 34.9 36.5
2008 2010 2012 2014 20160.0
0.2
0.4
0.6
0.8
1.0
1.2
0.70 0.57 0.69 0.76 0.87
2008 2010 2012 2014 20160
5
10
15
20
25
30
35
30.2 31.6 28.7 28.8 32.1
2008 2010 2012 2014 20160
2
4
6
8
10
12
14
16
13.26 13.37 12.29 13.37 13.71
Figure 17: Expected change in EU performance in 2016 for the indicators using CIS data
Share of SMEs with product and process innovations
expected to increase
Share of innovative SMEs collaborating expected to re-
main the same
Share of non-R&D innovation expenditures expected to
increase
Share of sales due to new-to-market/firm product inno-
vations expected to increase
Share of SMEs with marketing and organisational inno-
vations expected to increase
Share of SMEs innovating in-house expected to increase
The share of SMEs with product and process innovations for the EU decreased until 2012, after which it slowly increased in 2014. Based on provisional CIS 2016 data for 23 Member States, the share of product and process innovators is estimated to increase from 30.9 in 2014 to 34.2 in 2016. For 16 Member States, the indicator is expected to in-crease, in particular for Estonia. For six Member States, it is expected to decrease26.
The share of SMEs with marketing and organisational innovations for the EU fell between 2006 and 2014. Based on provisional CIS 2016 data for 23 Member States, the share of marketing and organisational innovators is estimated to increase again from 34.9 in 2014 to 36.5 in 2016. For 15 Member States, the indicator is expected to increase. For eight Member States, it is expected to decrease.
The share of SMEs innovating in-house for the EU declined between 2010 and 2014. Based on provisional CIS 2016 data for 23 Member States, the share of SMEs innovating in-house for the EU is estimated to increase strongly from 28.8 in 2014 to 32.1 in 2016. For 16 Member States, the indicator is expected to increase, in particular for Estonia and Portugal. For seven Member States, it is expected to decrease.
26 For Slovenia, a comparison between the provisional CIS 2016 and CIS 2014 data cannot be made due to missing CIS 2014 data.
The share of innovative SMEs collaborating with others for the EU has mostly increased between 2006 and 2012. Based on provisional CIS 2016 data for 23 Member States, the share of innovative SMEs collab-orating is estimated to remain the same. For 12 Member States, the indicator is expected to increase, and for 11 Member States, it is expect-ed to decrease.
The share of non-R&D innovation expenditures for the EU has been increasing since 2010. Using provisional CIS 2016 data for 21 Member States, the share of non-R&D innovation expenditure for the EU is esti-mated to increase from 0.76 in 2014 to 0.87 in 2016. For 12 Member States, the indicator is expected to increase, in particular for Cyprus and Serbia, and for nine Member States, it is expected to decrease.
The sales share due to new-to-market or new-to-firm product innova-tions for the EU returned to its 2006-2010 level in 2014 after a decline in 2012. Based on provisional CIS 2016 data for 21 Member States, the sales share due to new-to-market and new-to-firm product innovations is estimated to increase from 13.4 in 2014 to 13.7 in 2016. This in-crease is driven by increasing performance in 15 Member States. For six Member States, performance is expected to decrease.

44 European Innovation Scoreboard 2018
6.4 Short-term changes in EU innovation performance by indicator
27 For Lifelong learning, there was a break in series in 2013, resulting in an upward shift of the indicator from 9.2 in 2012 to 10.7 in 2013. Before the break, the indicator had declined from 9.3 in 2009 to 9.2 in 2012. After the break, the indicator has increased from 10.7 in 2013 to 10.9 in 2017.
28 This survey is carried out by the Industrial Research and Innovation (IRI) action of the European Commission’s Joint Research Centre (JRC), Institute for Prospective Technological Studies (IPTS). Survey results are available at http://iri.jrc.ec.europa.eu/survey.html
29 EU Winter 2018 Economic Forecast: https://ec.europa.eu/info/sites/info/files/economy-finance/ip073_en.pdf
This section discusses expected short-term changes for 18 indicators. For 10 of these indicators, changes have been calculated applying a simple linear regression using time series data (see the EIS 2018 Meth-odology Report for more details). For six indicators, fast-track CIS 2016 data have been used, and for two indicators, a mix of techniques has been used, which will be discussed in this section.
Human resources
New doctorate graduates has been increasing from 2011 onwards. A linear regression using data for 2009-2016 has been used to estimate an increase from 2.01 to 2.19 in two years’ time. For Population aged 25-34 having completed tertiary education, there was a break in series in 2014, and data before 2014 are not comparable to those for 2014-2017. A linear regression using data for 2014-2017 has been used to estimate an increase from 39.0 to 40.2 in two years’ time. For Lifelong learning, the regression results using a linear regression for 2010-2017 are of insufficient quality. The value of the indicator has been stable between 10.7 and 10.9 between 2013 and 201627. With no reliable expected change and a stable development in the past, it is assumed that the indicator will be at the same level in two years’ time.
Attractive research systems
International scientific co-publications has shown a steady increase be-tween 2010 and 2017. A linear regression for the same period has been used to estimate an increase from 517.5 to 570.2 in two years’ time. The share of Most-cited scientific publications has been increasing con-sistently between 2008 and 2015, although there was a more signifi-cant upward performance shift in 2010 (from 10.27 in 2009 to 10.46) and a small performance decline in 2015 (from 10.59 in 2014 to 10.57). A linear regression for 2008-2015 has been used to estimate an in-crease from 10.57 to 10.66 in two years’ time. The share of Foreign doctorate students has increased for most years between 2009 and 2016, except for a one-time decrease between 2012 and 2013. The linear regression using data for 2009-2016 has low predictive power, and it is therefore assumed that the indicator will be at the same level in two years’ time.
Innovation-friendly environment
For Broadband penetration, data are available for four years only. Al-though the number of observations is quite small, a linear regression has been used for the years 2014-2017. For the EIS 2017, a trend ex-trapolation was used, but as the indicator increases consistently over time, results are almost the same. The results from the linear regression show an expected increase from 16.0 to 20.6 in two years’ time. Oppor-tunity-driven entrepreneurship has shown a consistent decrease be-
tween 2010 and 2015, followed by an increase in 2016 and 2017. A simple linear regression for the same period has low predictive power, and it is therefore assumed that the indicator will be at the same level in two years’ time.
Finance and support
R&D expenditure in the public sector has been falling since 2013 after a more stable performance between 2009 and 2013. A linear regres-sion using data for 2009-2016 has only low predictive power, and it has therefore been assumed that the indicator will hold its value in two years’ time. Venture capital expenditures shows a declining perfor-mance from 2010 to 2013 and an increasing performance from 2013 to 2016. A linear regression for 2013-2017 has been used to estimate an increase from 0.116 (three-year average) to 0.146 (three-year aver-age) in two years’ time.
Firm investments
For R&D expenditures in the business sector, the same methodology as in the EIS 2017 has been used to estimate short-term changes. The 2017 EU Survey on R&D Investment Business Trends28 shows that larg-er EU companies expect their R&D expenditures in the EU to increase, on average, by 3.5% per annum for the period 2017-2018. Nominal GDP has increased by 2.8% in 2017 and is expected to increase by 2.3% in 201829. The EU’s business R&D intensity is therefore expected to in-crease from 1.32 in 2016 to 1.34 in two years’ time. For Non-R&D in-novation expenditures, provisional CIS 2016 data show an expected increase from 0.76 in 2014 to 0.87 in two years’ time. For Enterprises providing training to develop or upgrade ICT skills of their personnel, data are available for 2012 and from 2014 onwards, showing an in-crease from 19.0 in 2012 to 22.0 in 2016, followed by a decline to 21.0 in 2017. A linear regression has only low predictive power, and it has therefore been assumed that the indicator will hold its value in two years’ time.
Innovators
For SMEs with product and/or process innovations, provisional CIS 2016 data show an expected increase from 30.9 in 2014 to 34.2 in two years’ time. For SMEs with marketing and/or organisational innova-tions, provisional CIS 2016 data show an expected increase from 34.9 in 2014 to 36.5 in two years’ time. For SMEs innovating in-house, pro-visional CIS 2016 data show an expected increase from 28.8 in 2014 to 32.1 in two years’ time.

45European Innovation Scoreboard 2018
Linkages
For Innovative SMEs collaborating with others, provisional CIS 2016 data show that performance in two years’ time would be the same as in 2014. For Public-private co-publications, performance dropped relative-ly strongly between 2011 and 2012, followed by a period of increasing performance until 2016. Performance in 2017 once again declined. Re-gression results using a linear regression are of insufficient quality, and it is assumed that the indicator will be at the same level in two years’ time. Private co-funding of public R&D expenditures has remained at a stable level of about 0.052 for the period 2009-2014. Performance de-clined to 0.049 in 2015. Regression results using a linear regression are of insufficient quality, and it is assumed that the indicator will be at the same level in two years’ time.
Intellectual assets
A working paper by Eurostat30 discusses several options for nowcasting patent data, including six econometric models using data on GDP, R&D expenditures, researchers, and human resources in science and technol-ogy. Three of these models have been explored31, of which the model assuming a linear logarithmic dependence on GDP and R&D expendi-tures performs best. PCT patent applications per billion GDP are expect-ed to increase from 3.53 to 3.54 in two years’ time. Trademark applica-tions per billion GDP have been increasing between 2010 and 2014 and, after a decline in 2015, between 2015 and 2017. A linear regres-sion estimates a further increase from 7.86 to 8.12 in two years’ time. Design applications per billion GDP have been decreasing between 2010 and 2016, followed by an increase in 2017. Regression results using a linear regression are of insufficient quality, and it is assumed that the indicator will be at the same level in two years’ time.
Employment impacts
Between 2010 and 2017, the Employment share in knowledge-inten-sive activities has been increasing every year. A linear regression for 2009-2016 has been used to estimate an increase from 14.2 in 2017 to 14.4 in two years’ time. For Employment in fast-growing enterprises of innovative sectors, data are only available for four years. The number of observations is too small for a linear regression, and the indicator’s score was 5.1 in 2014, 5.2 in 2015, 4.7 in 2016, and 4.8 in 2017. There is no clear trend in this four-year period, and it is assumed that the indi-cator will be at the same level in two years’ time.
Sales impacts
For Medium and high-tech products exports, the regression results us-ing a linear regression are of insufficient quality. The value of the indica-tor declined between 2010 and 2013, followed by an increase of 1.3 percentage points in 2014, and 1.9 percentage points in 2015. After a less strong increase in 2016, the indicator declined in 2017.
30 Eurostat, Patent Statistics – Working Paper: Methods for Nowcasting Patent Data, Final version, 21 December 2010.
31 The first model assumes that the number of patent applications is linearly dependent on GDP and R&D expenditures, the second model assumes a linear logarithmic dependence between the same variables, and the third model assumes a linear dependence on R&D expenditures only.
With no reliable expected change and a stable development in the past, it is assumed that the indicator will be at the same level in two years’ time. For Knowledge-intensive services exports, data are available from 2010 onwards. Between 2010 and 2016, the indicator increased from 66.8 to 69.4, followed by a small decrease in 2017. A linear re-gression for the same period has been used to estimate an increase from 69.4 to 70.1 in two years’ time. For Sales share due to new-to-market or new-to-firm product innovations, provisional CIS 2016 data show an expected increase from 13.4 in 2014 to 13.7 in two years’ time.

46 European Innovation Scoreboard 2018
6.5 Big data as a statistical source for innovation indicators
32 Insofar, new data sources capture innovation activities that have until recently remained ‘hidden’ from R&I policymakers, such as social innovations and innovations in creative industries.
33 EIS Exploratory report “Opportunities in data analytics for innovation performance measurement”, written by Joel Klinger, Juan Mateos-Garcia, Konstantinos Stathoulopoulos, Chantale Tippett (Nesta), Raphaële Moeremans and Julien Morret (Deloitte). The report is available at https://ec.europa.eu/docsroom/documents/29305
34 These new approaches seek to connect actors spread across wide-ranging research, industry and society networks in order to tackle grand societal challenges such as climate change, demographic change or economic inequality and regional disparities.
35 In particular the Cross-industry standard process for data mining (CRISP-DM) method: Shearer C., The CRISP-DM model: the new blueprint for data mining, J Data Warehousing (2000); 5:13—22.
Introduction
The Big data revolution and associated innovations in analytical meth-ods and tools (including machine learning and Artificial Intelligence) of-fer new opportunities to measure and monitor social and economic ac-tivities, including some which are of interest for research and innovation (R&I) policymakers. Indicators based on Big data could complement traditional R&I indicators based on business surveys and other official statistics, providing a perspective on R&I activities which is more timely, granular and/or inclusive.32 However, using new data is not without risks: Big data sources might be less representative, less consistent or less easily interpretable, thereby compromising the quality of indicators based on them, rendering them unsuitable for policy-making.
In one of the exploratory reports produced as part of the European In-novation Scoreboards project33, the potential use of Big data to develop indicators for future editions of the EIS was explored. Based on a state-of-the-art review regarding uses of Big data for innovation policy, a framework for a possible incorporation of Big data-based indicators into the EIS was developed, and exploratory pilots were carried out to gain a better understanding of challenges and relevance-reliability trade-offs. The following summarises the results of each of these activities and possible next steps.
Opportunities and challenges from Big data
The arrival of so-called ‘Big data’ (datasets with unprecedented volume, variety – including text, networks and images – and velocity) is bringing with it many opportunities to quantitatively measure the economy and society (Cukier and Schonberger, 2013, Salganik, 2017)34. Big data com-bining information ‘scraped’ from websites, social media, innovation platforms (such as networking sites, coding repositories, and crowdfund-ing sites), open datasets about research activity and official data could provide detailed, timely and comprehensive information about innova-tion systems, including new, ambitious frames based on transformative and mission-driven innovation (Schott and Steinmueller, 2016, Mazzu-cato, 2018).
Natural Language Processing and network analyses use text data to classify innovative projects and organisations into ‘bottom-up’ taxono-mies capturing emerging technologies and disciplines, and to represent them as networks of collaboration that can be strengthened through targeted policy interventions, while interactive data visualisations and dashboards make it possible to present this information in user-friendly ways (Börner, 2015).
Predictive analyses of new data can also help identify real-time (or close to real-time) proxies for policy-relevant indicators. Such nowcast-
ing approaches, which are already being used to monitor key aspects of economic activity such as inflation or unemployment through online price listings and web searches, can also play a role in R&I policy (for examples, see Guzman and Stern, 2016).
The ‘Big data explosion’ also brings important challenges, for example when new indicators are based on proprietary data of uncertain quality or black box algorithms, which are hard to interpret. There are also sig-nificant concerns about the ethical aspects of the Big data revolution, with lack of clarity about what rules apply to the linking and dissemina-tion of personal data available online. Measurement frameworks such as the EIS place a premium on international comparability and temporal consistency, so new data sources which could potentially be incorporat-ed need to be assessed with those dimensions of quality in mind.
Indicator development framework
The methodological framework for constructing new indicators using Big data was influenced by a previous EC-funded project (Data Mining for Research and Innovation policy), as well as Data Science standards 35. This framework is consistent with state-of-the-art practices and has guided the development of the five pilot indicators.
The framework is an idealised sequence of events to be followed in each pilot, including the following steps:
1. Policy and subject scoping: This phase sets out the policy goals for the project and the actors and activities that it seeks to measure, as well as the success criteria;
2. Data collection: This includes the identification of data sources and the acquisition of data;
3. Tools and analysis methods: Tool requirements definition, tool setup, architecture, etc.;
4. Data preparation: Preparation of data definitions, design of the data model, data quality profiling and reporting, data standardisation, data integration;
5. Analysis: Data analytics and visualisation, interpretation, and conclusions;
6. Evaluation: Creation and validation of reports by key stakeholders, based on the objectives and success criteria set out at the beginning of the project;
7. Deployment: Formalisation of scaling and deployment considerations.

47European Innovation Scoreboard 2018
The framework is implemented following an iterative approach that may involve loops between steps rather than a linear sequence. It is important to pay attention at all stages to emerging challenges and difficulties that could increase deployment costs or make indicators less useful for policy.
Pilot summary
Five pilots were carried out to explore some of the Big data opportuni-ties identified in the state-of-the-art review, following the methodolog-ical framework described above.
1. Skills supply (from university websites)
This pilot used data scraped from university websites and analysed it with topic modelling methods to generate highly detailed estimates of skills supply in the EU. This analysis could enhance the measurement of skills supply, a critical input for innovation, strengthening the Human resources dimension of the ‘Framework conditions’ section of the EIS. It could also help nowcast existing indicators based on slower moving data. The pilot started from GRID (Global Research Identifier Database), a database of research institutions with metadata and URLs. A ‘shallow’ scrape of these universities’ websites helped understand their structure (based on the pattern of links between pages). Text mining (topic mod-elling) algorithms were then used to analyse the text within different sections of the website capturing disciplines, identifying the skills pres-ent there. Having trialled this strategy with a single university website, this analysis is now being scaled up to all UK and Italian universities in the GRID data. Estimates of number of graduates with different skills graduating from universities will be obtained by combining these data with information from ETER (the European Tertiary Education Registry).
2. Open digital innovation (from GitHub, an open coding site)
This pilot analysed open digital innovation with data from GitHub, an online collaborative software development platform and code sharing site with more than 24 million users globally. The information resulting from this analysis could feed into several parts of the EIS, including the ‘Intellectual assets’ and ‘Linkages’ dimensions as well as the ‘SMEs with products and process innovation’ indicator of the ‘Innovation activities’ section. The data were obtained from Git Torrent, a snapshot of GitHub data made periodically available by the platform. These data were que-ried to identify GitHub users based in EU countries according to their profile, resulting in 500,000 unique users and 4.5 million projects. Clio, an information retrieval system developed by the team, extracted proj-ects related to specific innovation topics such as machine learning and AI, blockchain, robotics, and virtual reality from these data.
36 Start-ups: A start-up company is an entrepreneurial venture, which is typically a newly emerged, fast-growing business that aims to meet a marketplace need by developing a viable business model around an innovative product, service, process or a platform. Spinoffs: companies created for the exploitation of products or services that are developed using knowledge or technologies generated by academic research. As such, the distinction is that a spinoff is based on university intellectual property, while a start-up not based on university IP, even if founded by university staff or recent graduates – will not be considered a spinoff.
37 http://www.spinoutsuk.co.uk/
38 Such as https://london.startups-list.com/ for London, or https://data.startups.be/actors?category=Startup for Belgium.
3. Access to early-stage finance (from crowd funding sites)
Here, access to finance in the EU was analysed using data from crowd-funding platforms. This pilot could feed into the ‘Investments’ section of the EIS. The pilot focused on equity crowdfunding platforms which are most frequently used by innovators and entrepreneurs. An initial explo-ration of a register of crowdfunding sites in the EU revealed platform fragmentation across national and language boundaries. Individual scrapers were written for three platforms in the register, and the result-ing data were combined to produce policy-relevant indicators such as the number of projects funded and amounts raised.
4. University spinoffs
This pilot focused on university spinoffs (start-ups established out of universities)36. It could complement the ‘Attractive research systems’, ‘Linkages’, and ‘Finance and support’ dimensions of the EIS. This pilot focused on selected universities in the UK and Belgium. While in the case of the UK there is a consolidated database with information about spinoffs, Belgian data had to be obtained directly from universities’ websites37. The analysis of start-ups relied on a selection of directories covering all of Belgium and a selection of UK cities38. It would be possi-ble to build a database based on these sources with information about spinoffs, their age and sector, etc. This database could be cross-refer-enced with other start-up databases, providing a policy-relevant per-spective on the position of spinoffs within the start-up ecosystem.
5. Start-up Ecosystem
This pilot focused on “Digital Innovation Hubs” as a proxy for conditions favouring innovative initiatives and start-ups. These enablers are con-sidered to represent a model for supporting (tech) entrepreneurship and innovation. As such, this indicator could complement the ‘Innova-tion-friendly environment’ and ‘Firm investments’ dimensions of the EIS. This pilot focused on incubators (working environments for entrepre-neurs and freelancers which also host events and activities) and accel-erators (which in addition to a working space also provide investment and intensive business development and training) circumscribed to Bel-gium and the UK to facilitate comparisons with the results of pilot 4. A database of “Innovation enablers” was built by crawling different source websites and classifying organisations as either Incubators or Accelera-tors. Since relevant information is spread across multiple websites, it was necessary to create multiple adaptations in the code.

48 European Innovation Scoreboard 2018
Conclusions and next steps
The work performed so far suggests that Big data-based indicators could make valuable contributions to the EIS particularly around ‘emerg-ing’ sectors, technologies and business models that are hard to capture effectively using traditional methods such as surveys. Detailed skills and specific digital technologies of interest to R&I policymakers are two ex-amples of aspects for which information could be gathered through some of the pilots described above. One issue to bear in mind here is that some of these currently interesting technologies may go out of fashion, potentially becoming irrelevant for the EIS. One way to address this would be to segment the EIS into a ‘core’ of stable indicators and a more flexible set of modules capturing topical technology trends and industries at a higher level of detail. An initial exploration of the data collected also suggested that there is potential for using Big data to nowcast other indicators in the EIS.
Although a scaling-up of these pilots would not be without challenges, potential strategies were identified to achieve comprehensive coverage through global registers (in the skills pilot), dominant platforms with open data strategies (GitHub), and the development of multiple scrap-ers (crowdfunding). These opportunities illustrate the value of standard-isation and data sharing. Going forward, policy-makers, statistical au-thorities and data analysts will need to devise a suitable division of labour to pursue this strategy.
Work on using Big data to construct new indicators will continue as part of the European Innovation Scoreboards project and other EC-funded projects. To the extent possible and depending on data quality, it is fore-seen to integrate some of the quantitative evidence generated in future editions of the EIS.
References
Börner, K. (2015). Atlas of knowledge: anyone can map. MIT Press.
Cukier, K. and Mayer-Schönberger, V. (2013). Big data: A revolution that will transform how we live, work, and think. Houghton Mifflin Harcourt.
Guzman, J. and Stern, S. (2016). The state of American entrepreneur-ship: New estimates of the quantity and quality of entrepreneurship for 15 US states, 1988-2014 (No. w22095). National Bureau of Eco-nomic Research.
Mazzucato, M. (2018). Mission-Oriented Research & Innovation in the European Union. Brussels: European Commission.
Salganik, M. J. (2017). Bit by bit: social research in the digital age. Princ-eton University Press.
Schot, J. and Steinmueller, E. (2016). Framing innovation policy for trans-formative change: Innovation policy 3.0. SPRU Science Policy Research Unit, University of Sussex: Brighton, UK.

49European Innovation Scoreboard 2018
7. Country profiles
39 For those dimensions where data are missing for at least one indicator, relative scores for the dimension have been calculated compared to the EU dimension score using all indicators. This can result in relative dimension scores which do not match the relative performance scores for the indicators belonging to that dimension, as the dimension score for the country has been calculated using data for less indicators than the dimension score for the EU. These potential cases are highlighted in the performance tables with an §.
This section provides individual profiles for the EU Member States and eight other European and neighbouring countries (Iceland, Israel, Former Yugoslav Republic of Macedonia, Norway, Serbia, Switzerland, Turkey, and Ukraine). Each profile includes the following information:
• A graph showing the development of the country’s innovation index over time between 2010 and 2017 as compared to the EU perfor-mance score in 2010 (blue bars) and relative performance to the EU in 2017 (red dot). For all indicators underlying the innovation index, "2017" refers to the most recent data available; depending on data update schedules, the most recent actual performance year by indi-cator is 2014, 2015, 2016 or 2017; "2010" refers to data seven years older than the most recent available results;
• A table providing a comparison of the respective country's innova-tion performance in 2010 and 2017 by indicator and dimension rel-ative to that of the EU in 2010 and 2017 (Annex D shows the difference between both relative scores for all countries and all indi-cators). Different colour codes highlight strengths and weaknesses in 2010 and 201739;
• A graph showing provisional CIS 2016 data compared to CIS 2014 data as used for this year’s calculations;
• A table reporting on progress towards the EU targets for 2020 for R&D expenditures and Tertiary educational attainment (targets are provided in http://ec.europa.eu/eurostat/web/europe-2020-indica-tors/europe-2020-strategy/headline-indicators-scoreboard);
• A box showing links to the Research and Innovation Observatory (RIO) and European Semester country reports. The annual RIO Coun-try Reports analyse and assess the development and performance of national research and innovation systems and related policies in the perspective of EU strategy and goals. The reports also assess the match between national policy priorities and the structural chal-lenges of the respective research and innovation system (https://rio.jrc.ec.europa.eu/). The European Semester provides a framework for the coordination of economic policies across the European Union. It allows EU countries to discuss their economic and budget plans and monitor progress at specific times throughout the year (https://ec.europa.eu/info/business-economy-euro/economic-and-fis-cal-policy-coordination/eu-economic-governance-monitoring-pre-vention-correction/european-semester_en). The European Semes-ter country reports include quantitative and qualitative analyses on framework conditions for innovation.

50 European Innovation Scoreboard 2018
Belgium
Performance relative to EU 2010 in
Relative to EU
2017 in2010 2017 2017
SUMMARY INNOVATION INDEX 117.5 124.4 117.5Human resources 112.5 127.1 106.5New doctorate graduates 92.3 133.2 95.6Population with tertiary education 163.4 163.4 144.1Lifelong learning 77.1 77.1 75.5Attractive research systems 151.8 191.0 168.0International scientific co-publications 325.8 490.6 301.6Most cited publications 121.8 127.6 122.9Foreign doctorate students 134.6 178.1 160.9Innovation-friendly environment 164.0 143.5 107.3Broadband penetration 188.9 288.9 162.5Opportunity-driven entrepreneurship 149.2 57.4 53.3Finance and support 108.4 107.4 99.8R&D expenditure in the public sector 91.1 103.5 107.3Venture capital expenditures 130.6 112.4 92.1Firm investments 124.4 149.5 133.8R&D expenditure in the business sector 110.5 147.2 132.2Non-R&D innovation expenditures 77.4 75.4 69.0Enterprises providing ICT training 178.6 214.3 187.5Innovators 132.5 138.8 161.3SMEs product/process innovations 138.2 156.5 191.3SMEs marketing/organisational innovations 114.1 117.7 142.0SMEs innovating in-house 145.7 143.4 153.7Linkages 152.9 163.4 161.8Innovative SMEs collaborating with others 210.9 217.4 216.3Public-private co-publications 130.9 141.1 139.8Private co-funding of public R&D exp. 118.2 133.0 131.2Intellectual assets 93.8 84.3 83.5PCT patent applications 91.7 85.7 89.4Trademark applications 113.3 116.0 102.6Design applications 81.1 59.1 61.3Employment impacts 75.1 78.9 78.5Employment in knowledge-intensive activities 128.6 128.6 116.5Employment fast-growing enterprises 37.0 43.4 46.4Sales impacts 82.1 78.3 75.2Medium and high tech product exports 83.4 81.7 77.2Knowledge-intensive services exports 97.5 104.2 99.3Sales of new-to-market/firm innovations 62.8 44.1 43.6
BE EUPerformance and structure of the economyGDP per capita (PPS) 33,900 28,600Average annual GDP growth (%) 1.6 2.2Employment share Manufacturing (NACE C) (%) 12.7 15.5
of which High and Medium high-tech (%) 36.2 37.2Employment share Services (NACE G-N) (%) 40.3 41.6
of which Knowledge-intensive services (%) 36.3 35.0Turnover share SMEs (%) 39.2 38.0Turnover share large enterprises (%) 36.2 44.4Foreign-controlled enterprises – share of value added (%) 15.0 12.5Business and entrepreneurshipEnterprise births (10+ employees) (%) 0.5 1.5Total Entrepreneurial Activity (TEA) (%) 6.2 6.6FDI net inflows (% GDP) -1.0 3.6Top R&D spending enterprises per 10 mln population 29.1 19.7Buyer sophistication (1 to 7 best) 4.4 3.7Governance and policy frameworkEase of starting a business (0 to 100 best) 72.9 76.9Basic-school entrepren. education and training (1 to 5 best) 2.0 1.9Govt. procurement of advanced tech products (1 to 7 best) 3.5 3.5Rule of law (-2.5 to 2.5 best) 1.5 1.2DemographyPopulation size (millions) 11.3 510.1Average annual population growth (%) 0.5 0.3Population density (inhabitants/km2) 371.4 117.1
2010 2011 2012 2013 2014 2015 2016 20170
20406080
100120140160
118 119 118 118 118 118 123 124
Relative to EU in 2010 Relative to EU in 2017
118
EU targets for 2020
Indicator 2013 Latest Target1
Gross domestic expenditure on R&D (% of GDP) 2.33 2.49 3.00Tertiary educational attainment (% of population aged 30-34)
42.7 45.9 47.0
1 Sources are provided in the introduction to the country profiles.
Belgium is a Strong Innovator. Over time, performance has increased relative to that of the EU in 2010.
Attractive research systems, Linkages, and Innovators are the strongest innovation dimensions. Sales and Employment impacts are the weakest innovation dimensions.
For Belgium, fast-track CIS 2016 data are not available.
Structural differences with the EU are shown in the table below. GDP per capita and the value added share of foreign-controlled enter-prises are well above the EU average.
RIO country report:https://rio.jrc.ec.europa.eu/en/country-analysis/Belgium
European Semester country report:https://ec.europa.eu/info/sites/info/files/2018-european
Dark green: normalised performance above 120% of EU; light green: normalised perfor- -semester-country-report-belgium-en.pdfmance between 90% and 120% of EU, yellow: normalised performance between 50%and 90% of EU; orange: normalised performance below 50% of EU. Normalised perfor-mance uses the data after a possible imputation of missing data and transformation ofthe data.
Data in red show a decline in performance compared to 2010.

51European Innovation Scoreboard 2018
Bulgaria
Performance relative to EU 2010 in
Relative to EU
2017 in2010 2017 2017
SUMMARY INNOVATION INDEX 49.3 47.9 45.4Human resources 32.0 64.7 54.2New doctorate graduates 30.8 101.3 72.7Population with tertiary education 56.0 71.6 63.2Lifelong learning 5.2 12.5 12.2Attractive research systems 27.1 31.8 28.0International scientific co-publications 38.5 62.3 38.3Most cited publications 26.8 28.4 27.4Foreign doctorate students 23.6 26.0 23.5Innovation-friendly environment 50.1 70.7 52.9Broadband penetration 88.9 133.3 75.0Opportunity-driven entrepreneurship 27.1 33.6 31.2Finance and support 90.7 22.7 21.0R&D expenditure in the public sector 32.7 9.7 10.1Venture capital expenditures 165.0 39.2 32.1Firm investments 66.4 57.5 51.4R&D expenditure in the business sector 9.1 45.8 41.2Non-R&D innovation expenditures 141.2 106.7 97.6Enterprises providing ICT training 64.3 28.6 25.0Innovators 33.6 12.3 14.3SMEs product/process innovations 38.0 9.3 11.3SMEs marketing/organisational innovations 23.3 14.4 17.4SMEs innovating in-house 40.0 13.0 13.9Linkages 34.1 32.3 32.0Innovative SMEs collaborating with others 23.1 19.1 19.0Public-private co-publications 27.2 27.1 26.9Private co-funding of public R&D exp. 52.9 51.2 50.5Intellectual assets 46.6 86.6 85.8PCT patent applications 8.9 17.5 18.2Trademark applications 106.2 127.0 112.4Design applications 37.1 121.0 125.3Employment impacts 87.2 103.0 102.4Employment in knowledge-intensive activities 36.4 58.4 52.9Employment fast-growing enterprises 123.4 134.8 144.1Sales impacts 45.6 34.3 33.0Medium and high tech product exports 18.3 40.6 38.4Knowledge-intensive services exports 18.7 43.3 41.3Sales of new-to-market/firm innovations 109.3 16.3 16.2
BG EUPerformance and structure of the economyGDP per capita (PPS) 13,600 28,600Average annual GDP growth (%) 3.7 2.2Employment share Manufacturing (NACE C) (%) 19.6 15.5
of which High and Medium high-tech (%) 19.7 37.2Employment share Services (NACE G-N) (%) 41.1 41.6
of which Knowledge-intensive services (%) 27.1 35.0Turnover share SMEs (%) 47.1 38.0Turnover share large enterprises (%) 30.7 44.4Foreign-controlled enterprises – share of value added (%) 17.7 12.5Business and entrepreneurshipEnterprise births (10+ employees) (%) 2.1 1.5Total Entrepreneurial Activity (TEA) (%) 4.0 6.6FDI net inflows (% GDP) 3.8 3.6Top R&D spending enterprises per 10 mln population 0.0 19.7Buyer sophistication (1 to 7 best) 3.2 3.7Governance and policy frameworkEase of starting a business (0 to 100 best) 73.2 76.9Basic-school entrepren. education and training (1 to 5 best) 1.7 1.9Govt. procurement of advanced tech products (1 to 7 best) 3.2 3.5Rule of law (-2.5 to 2.5 best) -0.1 1.2DemographyPopulation size (millions) 7.2 510.1Average annual population growth (%) -0.7 0.3Population density (inhabitants/km2) 65.8 117.1
2010 2011 2012 2013 2014 2015 2016 20170
20406080
100120140160
49 47 39 42 44 45 47 48
Relative to EU in 2010 Relative to EU in 2017
45
EU targets for 2020
Indicator 2013 Latest Target1
Gross domestic expenditure on R&D (% of GDP) 0.63 0.78 1.50Tertiary educational attainment (% of population aged 30-34)
29.4 33.1 36.0
1 Sources are provided in the introduction to the country profiles.
SMEs innovating in-house
Innovative SMEs collaborating
Product/process innovators
Marketing/org. innovators
Non-R&D innovation exp.
Sales share new product inn.
60 70 80 90 100 110 120 130
Provisional CIS 2016 vs CIS 2014 (=100)
Provisional CIS 2016 data show improved performance for five indi-cators and reduced performance for one indicator (Non-R&D innovation expenditures)
Structural differences with the EU are shown in the table below. GDP per capita, the employment share of high and medium high-tech manufacturing and the turnover share of SMEs are well below the EU average. The value added share of foreign-controlled enterprises is well above the EU average.
Bulgaria is a Modest Innovator. Over time, performance has not changed relative to that of the EU in 2010.
Employment impacts and Intellectual assets are the strongest innova-tion dimensions. Innovators and Finance and support are the weakest innovation dimensions.
Dark green: normalised performance above 120% of EU; light green: normalised perfor-mance between 90% and 120% of EU, yellow: normalised performance between 50% and 90% of EU; orange: normalised performance below 50% of EU. Normalised perfor-mance uses the data after a possible imputation of missing data and transformation of the data.
Data in red show a decline in performance compared to 2010.
RIO country report:https://rio.jrc.ec.europa.eu/en/country-analysis/Bulgaria
European Semester country report:https://ec.europa.eu/info/sites/info/files/2018-european-semester-country-report-bulgaria-en.pdf

52 European Innovation Scoreboard 2018
The Czech Republic is a Moderate Inno-vator. Over time, performance has declined relative to that of the EU in 2010.
Employment impacts and Firm investments are the strongest innovation dimensions. Finance and support and Intellectual assets are the weak-est innovation dimensions.
Czech Republic
Performance relative to EU 2010 in
Relative to EU
2017 in2010 2017 2017
SUMMARY INNOVATION INDEX 89.7 86.8 82.3Human resources 76.2 93.5 78.4New doctorate graduates 92.3 114.4 82.1Population with tertiary education 45.5 74.6 65.8Lifelong learning 92.7 90.6 88.8Attractive research systems 58.5 82.4 72.5International scientific co-publications 132.1 244.6 150.4Most cited publications 51.8 57.3 55.2Foreign doctorate students 42.8 62.3 56.3Innovation-friendly environment 78.7 106.0 79.2Broadband penetration 88.9 133.3 75.0Opportunity-driven entrepreneurship 72.7 89.8 83.3Finance and support 116.1 50.9 47.3R&D expenditure in the public sector 73.4 85.8 89.0Venture capital expenditures 170.9 6.1 5.0Firm investments 108.4 116.2 103.9R&D expenditure in the business sector 58.9 86.0 77.2Non-R&D innovation expenditures 155.4 139.5 127.6Enterprises providing ICT training 121.4 128.6 112.5Innovators 105.5 74.1 86.1SMEs product/process innovations 98.8 81.5 99.6SMEs marketing/organisational innovations 120.1 51.7 62.5SMEs innovating in-house 97.0 89.7 96.1Linkages 80.6 78.4 77.6Innovative SMEs collaborating with others 101.1 88.6 88.1Public-private co-publications 81.0 72.3 71.6Private co-funding of public R&D exp. 59.2 74.7 73.7Intellectual assets 45.6 63.2 62.7PCT patent applications 25.2 25.2 26.3Trademark applications 64.1 77.0 68.2Design applications 50.8 88.6 91.8Employment impacts 115.3 115.7 115.1Employment in knowledge-intensive activities 85.7 93.5 84.7Employment fast-growing enterprises 136.4 131.6 140.7Sales impacts 104.2 98.7 94.8Medium and high tech product exports 124.8 131.6 124.3Knowledge-intensive services exports 41.1 53.0 50.6Sales of new-to-market/firm innovations 153.4 112.9 111.7
CZ EUPerformance and structure of the economyGDP per capita (PPS) 24,900 28,600Average annual GDP growth (%) 3.4 2.2Employment share Manufacturing (NACE C) (%) 27.3 15.5
of which High and Medium high-tech (%) 41.4 37.2Employment share Services (NACE G-N) (%) 35.7 41.6
of which Knowledge-intensive services (%) 33.8 35.0Turnover share SMEs (%) 40.0 38.0Turnover share large enterprises (%) 42.4 44.4Foreign-controlled enterprises – share of value added (%) 24.9 12.5Business and entrepreneurshipEnterprise births (10+ employees) (%) 0.8 1.5Total Entrepreneurial Activity (TEA) (%) n/a 6.6FDI net inflows (% GDP) 2.7 3.6Top R&D spending enterprises per 10 mln population 2.8 19.7Buyer sophistication (1 to 7 best) 3.0 3.7Governance and policy frameworkEase of starting a business (0 to 100 best) 76.3 76.9Basic-school entrepren. education and training (1 to 5 best) n/a 1.9Govt. procurement of advanced tech products (1 to 7 best) 3.1 3.5Rule of law (-2.5 to 2.5 best) 1.1 1.2DemographyPopulation size (millions) 10.6 510.1Average annual population growth (%) 0.2 0.3Population density (inhabitants/km2) 136.6 117.1
2010 2011 2012 2013 2014 2015 2016 20170
20406080
100120140160
90 88 82 84 84 85 84 87
Relative to EU in 2010 Relative to EU in 2017
82
SMEs innovating in-house
Innovative SMEs collaborating
Product/process innovators
Marketing/org. innovators
Non-R&D innovation exp.
Sales share new product inn.
70 80 90 100 110 120 130 140
Provisional CIS 2016 vs CIS 2014 (=100)
Provisional CIS 2016 data show improved performance for four in-dicators and reduced performance for two indicators.
Structural differences with the EU are shown in the table below. The employment share in manufacturing and the value added share of for-eign-controlled enterprises are well above the EU average.
RIO country report: https://rio.jrc.ec.europa.eu/en/country-analysis/Czech%20RepublicEuropean Semester country report:https://ec.europa.eu/info/sites/info/files/2018-european- semester-country-report-czech-republic-en.pdfDark green: normalised performance above 120% of EU; light green: normalised perfor-
mance between 90% and 120% of EU, yellow: normalised performance between 50% and 90% of EU; orange: normalised performance below 50% of EU. Normalised perfor-mance uses the data after a possible imputation of missing data and transformation of the data.
Data in red show a decline in performance compared to 2010.
EU targets for 2020
Indicator 2013 Latest Target1
Gross domestic expenditure on R&D (% of GDP) 1.90 1.68 1.00Tertiary educational attainment (% of population aged 30-34)
26.7 34.4 32.0
1 Sources are provided in the introduction to the country profiles.

53European Innovation Scoreboard 2018
Denmark
Performance relative to EU 2010 in
Relative to EU
2017 in2010 2017 2017
SUMMARY INNOVATION INDEX 139.0 139.7 132.4Human resources 178.9 219.8 184.2New doctorate graduates 115.4 231.4 166.0Population with tertiary education 160.4 167.2 147.4Lifelong learning 277.1 267.7 262.2Attractive research systems 159.0 206.4 181.7International scientific co-publications 430.1 680.8 418.6Most cited publications 146.7 137.0 131.9Foreign doctorate students 83.3 142.1 128.4Innovation-friendly environment 214.4 264.6 197.8Broadband penetration 277.8 355.6 200.0Opportunity-driven entrepreneurship 176.9 210.7 195.6Finance and support 121.8 110.5 102.6R&D expenditure in the public sector 133.6 144.3 149.5Venture capital expenditures 106.6 67.1 55.0Firm investments 142.5 122.0 109.1R&D expenditure in the business sector 182.1 161.2 144.7Non-R&D innovation expenditures 66.5 30.7 28.1Enterprises providing ICT training 164.3 157.1 137.5Innovators 103.8 96.3 111.9SMEs product/process innovations 110.7 97.9 119.7SMEs marketing/organisational innovations 100.2 100.1 120.9SMEs innovating in-house 100.9 90.8 97.3Linkages 164.1 132.6 131.3Innovative SMEs collaborating with others 215.5 120.7 120.0Public-private co-publications 197.6 201.3 199.5Private co-funding of public R&D exp. 75.5 69.4 68.4Intellectual assets 157.1 167.3 165.8PCT patent applications 189.6 164.1 171.3Trademark applications 135.0 163.9 145.0Design applications 143.3 172.7 179.0Employment impacts 128.0 101.0 100.5Employment in knowledge-intensive activities 122.1 122.1 110.6Employment fast-growing enterprises 132.3 86.0 92.0Sales impacts 89.7 78.2 75.1Medium and high tech product exports 63.3 81.1 76.6Knowledge-intensive services exports 123.1 109.9 104.8Sales of new-to-market/firm innovations 82.0 37.7 37.3
DK EUPerformance and structure of the economyGDP per capita (PPS) 36,100 28,600Average annual GDP growth (%) 2.1 2.2Employment share Manufacturing (NACE C) (%) 11.9 15.5
of which High and Medium high-tech (%) 42.6 37.2Employment share Services (NACE G-N) (%) 40.7 41.6
of which Knowledge-intensive services (%) 35.6 35.0Turnover share SMEs (%) 39.8 38.0Turnover share large enterprises (%) 41.2 44.4Foreign-controlled enterprises – share of value added (%) 12.2 12.5Business and entrepreneurshipEnterprise births (10+ employees) (%) 0.6 1.5Total Entrepreneurial Activity (TEA) (%) n/a 6.6FDI net inflows (% GDP) 1.5 3.6Top R&D spending enterprises per 10 mln population 58.3 19.7Buyer sophistication (1 to 7 best) 3.7 3.7Governance and policy frameworkEase of starting a business (0 to 100 best) 84.8 76.9Basic-school entrepren. education and training (1 to 5 best) n/a 1.9Govt. procurement of advanced tech products (1 to 7 best) 3.4 3.5Rule of law (-2.5 to 2.5 best) 2.0 1.2DemographyPopulation size (millions) 5.7 510.1Average annual population growth (%) 0.8 0.3Population density (inhabitants/km2) 133.4 117.1
2010 2011 2012 2013 2014 2015 2016 20170
20406080
100120140160 139 143 144 145 143 143 140 140
Relative to EU in 2010 Relative to EU in 2017
132
SMEs innovating in-house
Innovative SMEs collaborating
Product/process innovators
Marketing/org. innovators
Non-R&D innovation exp.
Sales share new product inn. n/a
40 70 100 130 160 190 220
Provisional CIS 2016 vs CIS 2014 (=100)
EU targets for 2020
Indicator 2013 Latest Target1
Gross domestic expenditure on R&D (% of GDP) 2.97 2.87 3.00Tertiary educational attainment (% of population aged 30-34)
43.4 48.6 40.0
1 Sources are provided in the introduction to the country profiles.
Provisional CIS 2016 data show improved performance for four in-dicators and reduced performance for one indicator. For the other indica-tor, fast-track data are not available.
Structural differences with the EU are shown in the table below. GDP per capita is well above the EU average. The employment share in manufacturing is well below the EU average.
RIO country report: https://rio.jrc.ec.europa.eu/en/country-analysis/DenmarkEuropean Semester country report:https://ec.europa.eu/info/sites/info/files/2018-european-semester- country-report-denmark-en.pdf
Denmark is an Innovation Leader. Over time, performance has remained the same compared to that of the EU in 2010.
Innovation-friendly environment and Human resources are the strongest innovation dimensions. Sales and Employment impacts are the weakest innovation dimensions.
Dark green: normalised performance above 120% of EU; light green: normalised perfor-mance between 90% and 120% of EU, yellow: normalised performance between 50% and 90% of EU; orange: normalised performance below 50% of EU. Normalised perfor-mance uses the data after a possible imputation of missing data and transformation of the data.
Data in red show a decline in performance compared to 2010.

54 European Innovation Scoreboard 2018
Germany
Performance relative to EU 2010 in
Relative to EU
2017 in2010 2017 2017
SUMMARY INNOVATION INDEX 127.4 126.1 119.6Human resources 98.4 112.6 94.4New doctorate graduates 184.6 198.2 142.2Population with tertiary education 34.3 56.0 49.3Lifelong learning 69.8 76.0 74.5Attractive research systems 96.1 104.8 92.2International scientific co-publications 175.3 264.4 162.6Most cited publications 111.3 112.9 108.7Foreign doctorate students 47.2 38.2 34.5Innovation-friendly environment 79.2 134.7 100.7Broadband penetration 100.0 155.6 87.5Opportunity-driven entrepreneurship 66.9 122.3 113.6Finance and support 103.5 109.8 102.0R&D expenditure in the public sector 128.3 138.9 144.0Venture capital expenditures 71.6 72.4 59.3Firm investments 141.4 174.8 156.4R&D expenditure in the business sector 156.8 170.8 153.4Non-R&D innovation expenditures 128.8 192.5 176.1Enterprises providing ICT training 135.7 164.3 143.8Innovators 173.7 131.3 152.6SMEs product/process innovations 179.5 127.6 156.1SMEs marketing/organisational innovations 170.0 131.1 158.2SMEs innovating in-house 172.1 135.0 144.7Linkages 125.6 126.4 125.2Innovative SMEs collaborating with others 106.1 89.3 88.8Public-private co-publications 119.5 124.7 123.5Private co-funding of public R&D exp. 152.0 165.8 163.5Intellectual assets 164.6 148.9 147.6PCT patent applications 187.4 165.8 173.0Trademark applications 136.1 131.5 116.3Design applications 164.6 146.2 151.4Employment impacts 120.7 100.9 100.3Employment in knowledge-intensive activities 126.0 118.2 107.1Employment fast-growing enterprises 116.9 88.5 94.7Sales impacts 130.2 119.4 114.7Medium and high tech product exports 132.2 138.8 131.0Knowledge-intensive services exports 119.1 115.7 110.3Sales of new-to-market/firm innovations 140.7 100.7 99.6
DE EUPerformance and structure of the economyGDP per capita (PPS) 35,600 28,600Average annual GDP growth (%) 2.1 2.2Employment share Manufacturing (NACE C) (%) 19.4 15.5
of which High and Medium high-tech (%) 50.7 37.2Employment share Services (NACE G-N) (%) 40.5 41.6
of which Knowledge-intensive services (%) 33.7 35.0Turnover share SMEs (%) 35.8 38.0Turnover share large enterprises (%) 52.8 44.4Foreign-controlled enterprises – share of value added (%) 12.5 12.5Business and entrepreneurshipEnterprise births (10+ employees) (%) 0.6 1.5Total Entrepreneurial Activity (TEA) (%) 4.8 6.6FDI net inflows (% GDP) 1.2 3.6Top R&D spending enterprises per 10 mln population 26.8 19.7Buyer sophistication (1 to 7 best) 4.3 3.7Governance and policy frameworkEase of starting a business (0 to 100 best) 79.7 76.9Basic-school entrepren. education and training (1 to 5 best) 1.6 1.9Govt. procurement of advanced tech products (1 to 7 best) 4.3 3.5Rule of law (-2.5 to 2.5 best) 1.8 1.2DemographyPopulation size (millions) 82.0 510.1Average annual population growth (%) 0.8 0.3Population density (inhabitants/km2) 229.4 117.1
EU targets for 2020
Indicator 2013 Latest Target1
Gross domestic expenditure on R&D (% of GDP) 2.82 2.94 3.00Tertiary educational attainment (% of population aged 30-34)
32.9 33.8 42.0
1 Sources are provided in the introduction to the country profiles.
2010 2011 2012 2013 2014 2015 2016 20170
20406080
100120140160
127 129 128 129 124 125 124 126
Relative to EU in 2010 Relative to EU in 2017
120
SMEs innovating in-house
Innovative SMEs collaborating
Product/process innovators
Marketing/org. innovators
Non-R&D innovation exp.
Sales share new product inn.
80 90 100 110 120 130
Provisional CIS 2016 vs CIS 2014 (=100)
Germany is a Strong Innovator. Over time, performance has remained the same com-pared to that of the EU in 2010..
Firm investments and Innovators are the strongest innovation dimensions. Attractive research systems and Human resources are the weakest innovation dimensions.
Dark green: normalised performance above 120% of EU; light green: normalised perfor-mance between 90% and 120% of EU, yellow: normalised performance between 50% and 90% of EU; orange: normalised performance below 50% of EU. Normalised perfor-mance uses the data after a possible imputation of missing data and transformation of the data.
Data in red show a decline in performance compared to 2010.
Provisional CIS 2016 data show improved performance for two indi-cators and reduced performance for four indicators.
Structural differences with the EU are shown in the table below. GDP per capita and the employment shares in manufacturing and in high and medium high-tech manufacturing are well above the EU aver-age.
RIO country report: https://rio.jrc.ec.europa.eu/en/country-analysis/GermanyEuropean Semester country report:https://ec.europa.eu/info/sites/info/files/2018-european- semester-country-report-germany-en.pdf

55European Innovation Scoreboard 2018
Estonia
Performance relative to EU 2010 in
Relative to EU
2017 in2010 2017 2017
SUMMARY INNOVATION INDEX 86.1 83.0 78.6Human resources 93.3 123.9 103.8New doctorate graduates 53.8 67.9 48.7Population with tertiary education 125.4 144.0 127.0Lifelong learning 103.1 167.7 164.3Attractive research systems 59.6 101.8 89.5International scientific co-publications 175.6 356.1 218.9Most cited publications 58.1 76.4 73.6Foreign doctorate students 21.7 50.4 45.5Innovation-friendly environment 90.3 138.9 103.8Broadband penetration 88.9 188.9 106.3Opportunity-driven entrepreneurship 91.1 109.3 101.4Finance and support 89.3 96.5 89.6R&D expenditure in the public sector 103.5 80.5 83.5Venture capital expenditures 71.0 117.0 95.8Firm investments 116.0 75.4 67.5R&D expenditure in the business sector 50.2 53.7 48.2Non-R&D innovation expenditures 277.8 124.7 114.0Enterprises providing ICT training 50.0 57.1 50.0Innovators 111.0 24.3 28.3SMEs product/process innovations 137.8 23.5 28.7SMEs marketing/organisational innovations 80.2 15.4 18.6SMEs innovating in-house 117.0 34.1 36.5Linkages 119.0 76.3 75.6Innovative SMEs collaborating with others 211.5 95.9 95.4Public-private co-publications 79.7 51.5 51.0Private co-funding of public R&D exp. 68.2 83.6 82.4Intellectual assets 68.2 111.6 110.6PCT patent applications 51.0 27.3 28.4Trademark applications 117.7 196.3 173.7Design applications 47.0 127.0 131.6Employment impacts 55.5 74.9 74.5Employment in knowledge-intensive activities 61.0 101.3 91.8Employment fast-growing enterprises 51.5 56.1 60.0Sales impacts 59.8 65.4 62.8Medium and high tech product exports 48.1 61.9 58.5Knowledge-intensive services exports 62.9 62.8 59.9Sales of new-to-market/firm innovations 70.0 72.6 71.9
EE EUPerformance and structure of the economyGDP per capita (PPS) 21,500 28,600Average annual GDP growth (%) 3.4 2.2Employment share Manufacturing (NACE C) (%) 18.6 15.5
of which High and Medium high-tech (%) 19.9 37.2Employment share Services (NACE G-N) (%) 39.3 41.6
of which Knowledge-intensive services (%) 30.6 35.0Turnover share SMEs (%) 48.0 38.0Turnover share large enterprises (%) 22.5 44.4Foreign-controlled enterprises – share of value added (%) 16.0 12.5Business and entrepreneurshipEnterprise births (10+ employees) (%) 0.9 1.5Total Entrepreneurial Activity (TEA) (%) 16.2 6.6FDI net inflows (% GDP) 2.2 3.6Top R&D spending enterprises per 10 mln population 0.0 19.7Buyer sophistication (1 to 7 best) 3.5 3.7Governance and policy frameworkEase of starting a business (0 to 100 best) 80.8 76.9Basic-school entrepren. education and training (1 to 5 best) 2.8 1.9Govt. procurement of advanced tech products (1 to 7 best) 3.9 3.5Rule of law (-2.5 to 2.5 best) 1.3 1.2DemographyPopulation size (millions) 1.3 510.1Average annual population growth (%) 0.0 0.3Population density (inhabitants/km2) 30.3 117.1
EU targets for 2020
Indicator 2013 Latest Target1
Gross domestic expenditure on R&D (% of GDP) 1.72 1.28 3.00Tertiary educational attainment (% of population aged 30-34)
42.5 47.4 40.0
1 Sources are provided in the introduction to the country profiles.
2010 2011 2012 2013 2014 2015 2016 20170
20406080
100120140160
86 89 91 92 87 9081 83
Relative to EU in 2010 Relative to EU in 2017
79
SMEs innovating in-house
Innovative SMEs collaborating
Product/process innovators
Marketing/org. innovators
Non-R&D innovation exp.
Sales share new product inn.
70 100 130 160 190 220 250 280
Provisional CIS 2016 vs CIS 2014 (=100)
RIO country report: https://rio.jrc.ec.europa.eu/en/country-analysis/EstoniaEuropean Semester country report:https://ec.europa.eu/info/sites/info/files/2018-european- semester-country-report-estonia-en.pdf
Provisional CIS 2016 data show improved performance for all six indicators.
Structural differences with the EU are shown in the table below. The turnover share of SMEs and the value added share of foreign-controlled enterprises are well above the EU average. The employment share in high and medium high-tech manufacturing and the turnover share of large enterprises are well below the EU average.
Estonia is a Moderate Innovator. Over time, performance has declined relative to that of the EU in 2010.
Intellectual assets, Human resources, and Innovation-friendly environ-ment are the strongest innovation dimensions. Innovators and Sales im-pacts are the weakest innovation dimensions.
Dark green: normalised performance above 120% of EU; light green: normalised perfor-mance between 90% and 120% of EU, yellow: normalised performance between 50% and 90% of EU; orange: normalised performance below 50% of EU. Normalised perfor-mance uses the data after a possible imputation of missing data and transformation of the data.
Data in red show a decline in performance compared to 2010.

56 European Innovation Scoreboard 2018
Ireland
Performance relative to EU 2010 in
Relative to EU
2017 in2010 2017 2017
SUMMARY INNOVATION INDEX 113.8 122.3 115.9Human resources 139.5 167.9 140.7New doctorate graduates 107.7 187.5 134.5Population with tertiary education 221.6 221.6 195.4Lifelong learning 81.3 81.3 79.6Attractive research systems 146.4 160.8 141.5International scientific co-publications 263.3 415.2 255.3Most cited publications 109.9 127.4 122.7Foreign doctorate students 158.1 120.9 109.2Innovation-friendly environment 64.4 129.3 96.6Broadband penetration 111.1 200.0 112.5Opportunity-driven entrepreneurship 36.7 87.3 81.1Finance and support 125.3 81.6 75.8R&D expenditure in the public sector 62.8 34.5 35.8Venture capital expenditures 205.5 142.1 116.5Firm investments 134.1 104.5 93.5R&D expenditure in the business sector 92.1 68.5 61.6Non-R&D innovation expenditures 151.1 61.7 56.4Enterprises providing ICT training 164.3 178.6 156.3Innovators 124.9 146.3 170.0SMEs product/process innovations 130.9 145.5 178.0SMEs marketing/organisational innovations 105.5 142.7 172.3SMEs innovating in-house 138.9 150.6 161.5Linkages 73.0 90.0 89.1Innovative SMEs collaborating with others 86.5 127.8 127.2Public-private co-publications 87.8 106.3 105.3Private co-funding of public R&D exp. 43.0 33.9 33.4Intellectual assets 67.8 47.3 46.9PCT patent applications 73.5 48.8 50.9Trademark applications 93.3 76.9 68.1Design applications 43.3 23.7 24.5Employment impacts 158.1 165.7 164.8Employment in knowledge-intensive activities 193.5 193.5 175.3Employment fast-growing enterprises 132.8 145.9 156.0Sales impacts 106.2 132.9 127.7Medium and high tech product exports 87.2 104.0 98.2Knowledge-intensive services exports 149.8 149.8 142.8Sales of new-to-market/firm innovations 77.8 147.5 145.9
IE EUPerformance and structure of the economyGDP per capita (PPS) 47,900 28,600Average annual GDP growth (%) 6.5 2.2Employment share Manufacturing (NACE C) (%) 11.5 15.5
of which High and Medium high-tech (%) 44.8 37.2Employment share Services (NACE G-N) (%) 46.8 41.6
of which Knowledge-intensive services (%) 39.9 35.0Turnover share SMEs (%) 41.5 38.0Turnover share large enterprises (%) 38.1 44.4Foreign-controlled enterprises – share of value added (%) 39.0 12.5Business and entrepreneurshipEnterprise births (10+ employees) (%) 0.5 1.5Total Entrepreneurial Activity (TEA) (%) 9.7 6.6FDI net inflows (% GDP) 43.2 3.6Top R&D spending enterprises per 10 mln population 54.1 19.7Buyer sophistication (1 to 7 best) 4.4 3.7Governance and policy frameworkEase of starting a business (0 to 100 best) 79.3 76.9Basic-school entrepren. education and training (1 to 5 best) 2.1 1.9Govt. procurement of advanced tech products (1 to 7 best) 3.6 3.5Rule of law (-2.5 to 2.5 best) 1.7 1.2DemographyPopulation size (millions) 4.7 510.1Average annual population growth (%) 1.1 0.3Population density (inhabitants/km2) 68.7 117.1
EU targets for 2020
Indicator 2013 Latest Target1
Gross domestic expenditure on R&D (% of GDP) 1.56 1.18 2.00Tertiary educational attainment (% of population aged 30-34)
52.6 53.3 60.0
1 Sources are provided in the introduction to the country profiles.
2010 2011 2012 2013 2014 2015 2016 20170
20406080
100120140160
114 114 111 108 109 111121 122
Relative to EU in 2010 Relative to EU in 2017
116
SMEs innovating in-house
Innovative SMEs collaborating
Product/process innovators
Marketing/org. innovators
Non-R&D innovation exp.
Sales share new product inn.
75 100 125 150 175 200 225 250
Provisional CIS 2016 vs CIS 2014 (=100)
Ireland is a Strong Innovator. Over time, performance has increased relative to that of the EU in 2010.
Innovators and Employment impacts are the strongest innovation dimensions. Intellectual assets and Finance and support are the weakest innovation dimensions.
Dark green: normalised performance above 120% of EU; light green: normalised perfor-mance between 90% and 120% of EU, yellow: normalised performance between 50% and 90% of EU; orange: normalised performance below 50% of EU. Normalised perfor-mance uses the data after a possible imputation of missing data and transformation of the data.
Data in red show a decline in performance compared to 2010.
Provisional CIS 2016 data show improved performance for two indi-cators and reduced performance for four indicators.
Structural differences with the EU are shown in the table below. GDP per capita and the value added share of foreign-controlled enter-prises are well above the EU average. The employment share in manu-facturing is well below the EU average.
RIO country report: https://rio.jrc.ec.europa.eu/en/country-analysis/IrelandEuropean Semester country report:https://ec.europa.eu/info/sites/info/files/2018-european- semester-country-report-ireland-en_1.pdf

57European Innovation Scoreboard 2018
Greece
Performance relative to EU 2010 in
Relative to EU
2017 in2010 2017 2017
SUMMARY INNOVATION INDEX 69.4 68.5 65.0Human resources 70.1 84.4 70.7New doctorate graduates 69.2 71.2 51.1Population with tertiary education 111.2 139.6 123.0Lifelong learning 22.9 35.4 34.7Attractive research systems 83.2 102.3 90.0International scientific co-publications 120.9 194.0 119.3Most cited publications 78.6 85.7 82.5Foreign doctorate students N/A N/A N/AInnovation-friendly environment 39.2 54.0 40.3Broadband penetration 22.2 55.6 31.3Opportunity-driven entrepreneurship 49.3 53.0 49.2Finance and support 29.2 41.7 38.7R&D expenditure in the public sector 41.6 73.4 76.1Venture capital expenditures 13.2 0.9 0.7Firm investments 61.0 61.2 54.7R&D expenditure in the business sector 16.1 33.6 30.2Non-R&D innovation expenditures 105.4 109.3 100.0Enterprises providing ICT training 71.4 50.0 43.8Innovators 120.0 101.3 117.7SMEs product/process innovations 109.4 97.7 119.5SMEs marketing/organisational innovations 138.5 100.7 121.5SMEs innovating in-house 111.3 105.3 112.8Linkages 86.7 91.1 90.2Innovative SMEs collaborating with others 121.5 136.0 135.3Public-private co-publications 58.9 51.1 50.6Private co-funding of public R&D exp. 81.8 89.4 88.1Intellectual assets 12.8 35.4 35.1PCT patent applications 11.0 13.3 13.9Trademark applications 19.0 74.5 65.9Design applications 9.9 26.6 27.6Employment impacts 57.3 69.2 68.9Employment in knowledge-intensive activities 68.8 83.1 75.3Employment fast-growing enterprises N/A N/A N/ASales impacts 87.5 47.4 45.6Medium and high tech product exports 12.9 4.8 4.5Knowledge-intensive services exports 88.5 49.9 47.6Sales of new-to-market/firm innovations 174.5 95.0 93.9
EL EUPerformance and structure of the economyGDP per capita (PPS) 19,900 28,600Average annual GDP growth (%) 0.5 2.2Employment share Manufacturing (NACE C) (%) 9.2 15.5
of which High and Medium high-tech (%) 14.2 37.2Employment share Services (NACE G-N) (%) 45.8 41.6
of which Knowledge-intensive services (%) 29.1 35.0Turnover share SMEs (%) 39.1 38.0Turnover share large enterprises (%) 27.9 44.4Foreign-controlled enterprises – share of value added (%) 3.8 12.5Business and entrepreneurshipEnterprise births (10+ employees) (%) 2.2 1.5Total Entrepreneurial Activity (TEA) (%) 5.8 6.6FDI net inflows (% GDP) 1.1 3.6Top R&D spending enterprises per 10 mln population 4.3 19.7Buyer sophistication (1 to 7 best) 3.3 3.7Governance and policy frameworkEase of starting a business (0 to 100 best) 68.6 76.9Basic-school entrepren. education and training (1 to 5 best) 1.8 1.9Govt. procurement of advanced tech products (1 to 7 best) 2.6 3.5Rule of law (-2.5 to 2.5 best) 0.3 1.2DemographyPopulation size (millions) 10.8 510.1Average annual population growth (%) -0.4 0.3Population density (inhabitants/km2) 82.3 117.1
EU targets for 2020
Indicator 2013 Latest Target1
Gross domestic expenditure on R&D (% of GDP) 0.66 1.01 1.20Tertiary educational attainment (% of population aged 30-34)
34.9 43.4 32.0
1 Sources are provided in the introduction to the country profiles.
2010 2011 2012 2013 2014 2015 2016 20170
20406080
100120140160
69 69 69 7062 65 67 69
Relative to EU in 2010 Relative to EU in 2017
65
SMEs innovating in-house
Innovative SMEs collaborating
Product/process innovators
Marketing/org. innovators
Non-R&D innovation exp.
Sales share new product inn.
90 100 110 120 130 140 150 160
Provisional CIS 2016 vs CIS 2014 (=100)
Dark green: normalised performance above 120% of EU; light green: normalised perfor-mance between 90% and 120% of EU, yellow: normalised performance between 50% and 90% of EU; orange: normalised performance below 50% of EU. Normalised perfor-mance uses the data after a possible imputation of missing data and transformation of the data.
Data in red show a decline in performance compared to 2010.
Greece is a Moderate Innovator. Over time, performance has remained the same relative to that of the EU in 2010.
Innovators, Linkages, and Attractive research systems are the strongest innovation dimensions. Intellectual assets and Finance and support are the weakest innovation dimensions.
RIO country report: https://rio.jrc.ec.europa.eu/en/country-analysis/GreeceEuropean Semester country report:Not available
Provisional CIS 2016 data show improved performance for all six indicators.
Structural differences with the EU are shown in the table below. GDP per capita, the employment share in high and medium high-tech manufacturing, and the value added share of foreign-controlled enter-prises are well below the EU average.

58 European Innovation Scoreboard 2018
Spain
Performance relative to EU 2010 in
Relative to EU
2017 in2010 2017 2017
SUMMARY INNOVATION INDEX 76.2 83.7 79.3Human resources 95.6 141.6 118.6New doctorate graduates 61.5 184.2 132.1Population with tertiary education 132.1 140.3 123.7Lifelong learning 93.8 91.7 89.8Attractive research systems 93.4 98.7 86.9International scientific co-publications 134.4 236.8 145.6Most cited publications 83.6 88.7 85.4Foreign doctorate students 93.4 65.4 59.1Innovation-friendly environment 78.3 143.5 107.3Broadband penetration 111.1 277.8 156.3Opportunity-driven entrepreneurship 58.8 64.0 59.4Finance and support 90.5 86.4 80.2R&D expenditure in the public sector 87.6 69.9 72.5Venture capital expenditures 94.2 107.5 88.1Firm investments 65.0 75.8 67.8R&D expenditure in the business sector 57.2 51.9 46.6Non-R&D innovation expenditures 58.8 43.2 39.5Enterprises providing ICT training 78.6 128.6 112.5Innovators 65.7 36.2 42.0SMEs product/process innovations 67.2 28.9 35.3SMEs marketing/organisational innovations 67.4 51.0 61.6SMEs innovating in-house 62.6 28.0 30.0Linkages 69.8 69.3 68.6Innovative SMEs collaborating with others 41.5 54.9 54.6Public-private co-publications 71.8 72.5 71.8Private co-funding of public R&D exp. 96.2 80.3 79.2Intellectual assets 70.5 72.9 72.2PCT patent applications 36.4 39.3 41.0Trademark applications 106.8 125.8 111.3Design applications 75.2 64.5 66.9Employment impacts 65.3 90.7 90.2Employment in knowledge-intensive activities 77.9 88.3 80.0Employment fast-growing enterprises 56.3 92.4 98.8Sales impacts 77.1 76.6 73.6Medium and high tech product exports 81.3 79.0 74.6Knowledge-intensive services exports 30.7 31.3 29.9Sales of new-to-market/firm innovations 126.2 126.5 125.1
ES EUPerformance and structure of the economyGDP per capita (PPS) 26,000 28,600Average annual GDP growth (%) 3.1 2.2Employment share Manufacturing (NACE C) (%) 12.4 15.5
of which High and Medium high-tech (%) 31.7 37.2Employment share Services (NACE G-N) (%) 49.6 41.6
of which Knowledge-intensive services (%) 31.6 35.0Turnover share SMEs (%) 38.2 38.0Turnover share large enterprises (%) 38.4 44.4Foreign-controlled enterprises – share of value added (%) 9.7 12.5Business and entrepreneurshipEnterprise births (10+ employees) (%) 1.5 1.5Total Entrepreneurial Activity (TEA) (%) 5.7 6.6FDI net inflows (% GDP) 2.7 3.6Top R&D spending enterprises per 10 mln population 4.7 19.7Buyer sophistication (1 to 7 best) 3.3 3.7Governance and policy frameworkEase of starting a business (0 to 100 best) 74.8 76.9Basic-school entrepren. education and training (1 to 5 best) 1.9 1.9Govt. procurement of advanced tech products (1 to 7 best) 3.2 3.5Rule of law (-2.5 to 2.5 best) 0.9 1.2DemographyPopulation size (millions) 46.5 510.1Average annual population growth (%) 0.1 0.3Population density (inhabitants/km2) 92.5 117.1
EU targets for 2020
Indicator 2013 Latest Target1
Gross domestic expenditure on R&D (% of GDP) 1.27 1.19 2.00Tertiary educational attainment (% of population aged 30-34)
42.3 39.7 44.0
1 Sources are provided in the introduction to the country profiles.
2010 2011 2012 2013 2014 2015 2016 20170
20406080
100120140160
76 77 76 77 71 73 78 84
Relative to EU in 2010 Relative to EU in 2017
79
Spain is a Moderate Innovator. Over time, performance has increased relative to that of the EU in 2010.
Human resources and Innovation-friendly environment are the strongest innovation dimensions. Innovators, Firm investments, and Linkages are the weakest innovation dimensions.
Dark green: normalised performance above 120% of EU; light green: normalised perfor-mance between 90% and 120% of EU, yellow: normalised performance between 50% and 90% of EU; orange: normalised performance below 50% of EU. Normalised perfor-mance uses the data after a possible imputation of missing data and transformation of the data.
Data in red show a decline in performance compared to 2010.
Provisional CIS 2016 data show improved performance for five indi-cators and reduced performance for one indicator.
Structural differences with the EU are shown in the table below. The value added share of foreign-controlled enterprises is well below the EU average.
RIO country report: https://rio.jrc.ec.europa.eu/en/country-analysis/SpainEuropean Semester country report:https://ec.europa.eu/info/sites/info/files/2018-european-semester- country-report-spain-en.pdf
SMEs innovating in-house
Innovative SMEs collaborating
Product/process innovators
Marketing/org. innovators
Non-R&D innovation exp.
Sales share new product inn.
80 90 100 110 120 130
Provisional CIS 2016 vs CIS 2014 (=100)

59European Innovation Scoreboard 2018
France
Performance relative to EU 2010 in
Relative to EU
2017 in2010 2017 2017
SUMMARY INNOVATION INDEX 105.1 115.2 109.2Human resources 142.1 148.5 124.4New doctorate graduates 100.0 115.1 82.6Population with tertiary education 153.0 153.0 134.9Lifelong learning 180.2 183.3 179.6Attractive research systems 137.0 146.8 129.2International scientific co-publications 162.9 234.7 144.3Most cited publications 104.5 108.9 104.9Foreign doctorate students 174.4 170.6 154.1Innovation-friendly environment 85.8 135.8 101.5Broadband penetration 100.0 133.3 75.0Opportunity-driven entrepreneurship 77.3 137.3 127.5Finance and support 106.8 152.2 141.3R&D expenditure in the public sector 108.9 110.6 114.7Venture capital expenditures 104.2 205.5 168.4Firm investments 96.4 97.9 87.6R&D expenditure in the business sector 114.9 121.0 108.6Non-R&D innovation expenditures 60.3 66.2 60.6Enterprises providing ICT training 107.1 100.0 87.5Innovators 93.7 104.4 121.4SMEs product/process innovations 86.9 101.4 124.1SMEs marketing/organisational innovations 95.1 105.7 127.6SMEs innovating in-house 98.7 106.0 113.6Linkages 100.4 102.4 101.5Innovative SMEs collaborating with others 123.5 120.5 119.8Public-private co-publications 101.1 103.3 102.3Private co-funding of public R&D exp. 76.2 83.3 82.1Intellectual assets 93.0 86.8 86.0PCT patent applications 104.6 108.0 112.7Trademark applications 90.0 90.3 79.9Design applications 84.3 64.3 66.6Employment impacts 102.8 92.5 92.0Employment in knowledge-intensive activities 107.8 114.3 103.5Employment fast-growing enterprises 99.3 77.0 82.3Sales impacts 100.2 109.6 105.3Medium and high tech product exports 108.6 111.0 104.8Knowledge-intensive services exports 92.0 101.5 96.8Sales of new-to-market/firm innovations 99.9 117.4 116.1
FR EUPerformance and structure of the economyGDP per capita (PPS) 30,200 28,600Average annual GDP growth (%) 1.5 2.2Employment share Manufacturing (NACE C) (%) 12.3 15.5
of which High and Medium high-tech (%) 36.1 37.2Employment share Services (NACE G-N) (%) 40.8 41.6
of which Knowledge-intensive services (%) 37.1 35.0Turnover share SMEs (%) 34.5 38.0Turnover share large enterprises (%) 44.7 44.4Foreign-controlled enterprises – share of value added (%) 7.5 12.5Business and entrepreneurshipEnterprise births (10+ employees) (%) 0.6 1.5Total Entrepreneurial Activity (TEA) (%) 4.6 6.6FDI net inflows (% GDP) 1.1 3.6Top R&D spending enterprises per 10 mln population 17.1 19.7Buyer sophistication (1 to 7 best) 4.0 3.7Governance and policy frameworkEase of starting a business (0 to 100 best) 75.9 76.9Basic-school entrepren. education and training (1 to 5 best) 1.8 1.9Govt. procurement of advanced tech products (1 to 7 best) 3.8 3.5Rule of law (-2.5 to 2.5 best) 1.4 1.2DemographyPopulation size (millions) 66.7 510.1Average annual population growth (%) 0.4 0.3Population density (inhabitants/km2) 105.0 117.1
EU targets for 2020
Indicator 2013 Latest Target1
Gross domestic expenditure on R&D (% of GDP) 2.24 2.25 3.00Tertiary educational attainment (% of population aged 30-34)
37.1 39.7 40.0
1 Sources are provided in the introduction to the country profiles.
2010 2011 2012 2013 2014 2015 2016 20170
20406080
100120140160
105 107 105 106 109 111 116 115
Relative to EU in 2010 Relative to EU in 2017
109
SMEs innovating in-house
Innovative SMEs collaborating
Product/process innovators
Marketing/org. innovators
Non-R&D innovation exp.
Sales share new product inn.
60 70 80 90 100 110 120 130
Provisional CIS 2016 vs CIS 2014 (=100)
Dark green: normalised performance above 120% of EU; light green: normalised perfor-mance between 90% and 120% of EU, yellow: normalised performance between 50% and 90% of EU; orange: normalised performance below 50% of EU. Normalised perfor-mance uses the data after a possible imputation of missing data and transformation of the data.
Data in red show a decline in performance compared to 2010.
France is a Strong Innovator. Over time, performance has increased relative to that of the EU in 2010.
Finance and support and Attractive research systems are the strongest innovation dimensions. Intellectual assets and Firm investments are the weakest innovation dimensions.
RIO country report: https://rio.jrc.ec.europa.eu/en/country-analysis/FranceEuropean Semester country report:https://ec.europa.eu/info/sites/info/files/2018-european- semester-country-report-france-en.pdf
Provisional CIS 2016 data show improved performance for four in-dicators and reduced performance for two indicators.
Structural differences with the EU are shown in the table below. The employment share in manufacturing and the value added share of for-eign-controlled enterprises are well below the EU average.

60 European Innovation Scoreboard 2018
2010 2011 2012 2013 2014 2015 2016 20170
20406080
100120140160
56 57 52 54 49 54 54 54
Relative to EU in 2010 Relative to EU in 2017
51
SMEs innovating in-house
Innovative SMEs collaborating
Product/process innovators
Marketing/org. innovators
Non-R&D innovation exp.
Sales share new product inn.
80 100 120 140 160 180
Provisional CIS 2016 vs CIS 2014 (=100)
Croatia
Performance relative to EU 2010 in
Relative to EU
2017 in2010 2017 2017
SUMMARY INNOVATION INDEX 56.0 54.0 51.2Human resources 48.8 53.7 45.0New doctorate graduates 61.5 75.6 54.2Population with tertiary education 60.4 66.4 58.6Lifelong learning 19.8 12.5 12.2Attractive research systems 24.8 42.3 37.2International scientific co-publications 85.2 154.0 94.7Most cited publications 20.6 33.8 32.5Foreign doctorate students 10.0 16.0 14.4Innovation-friendly environment 37.9 54.4 40.6Broadband penetration 11.1 77.8 43.8Opportunity-driven entrepreneurship 53.8 40.5 37.6Finance and support 36.6 40.2 37.3R&D expenditure in the public sector 54.0 54.0 56.0Venture capital expenditures 14.3 22.5 18.4Firm investments 104.1 108.1 96.7R&D expenditure in the business sector 29.2 29.2 26.2Non-R&D innovation expenditures 126.8 183.4 167.8Enterprises providing ICT training 164.3 128.6 112.5Innovators 79.1 62.0 72.1SMEs product/process innovations 84.3 58.2 71.2SMEs marketing/organisational innovations 74.5 69.1 83.4SMEs innovating in-house 78.8 58.4 62.6Linkages 91.7 67.2 66.5Innovative SMEs collaborating with others 107.1 55.9 55.6Public-private co-publications 87.4 65.7 65.1Private co-funding of public R&D exp. 80.7 80.1 79.0Intellectual assets 21.4 29.8 29.6PCT patent applications 18.1 16.5 17.2Trademark applications 49.7 60.2 53.3Design applications 3.2 19.5 20.2Employment impacts 27.4 69.0 68.6Employment in knowledge-intensive activities 44.2 76.6 69.4Employment fast-growing enterprises 15.5 63.5 67.9Sales impacts 60.8 26.7 25.6Medium and high tech product exports 72.9 58.0 54.8Knowledge-intensive services exports 5.3 2.8 2.7Sales of new-to-market/firm innovations 111.3 17.4 17.3
HR EUPerformance and structure of the economyGDP per capita (PPS) 17,000 28,600Average annual GDP growth (%) 3.0 2.2Employment share Manufacturing (NACE C) (%) 17.0 15.5
of which High and Medium high-tech (%) 19.5 37.2Employment share Services (NACE G-N) (%) 39.5 41.6
of which Knowledge-intensive services (%) 29.6 35.0Turnover share SMEs (%) 41.1 38.0Turnover share large enterprises (%) 40.3 44.4Foreign-controlled enterprises – share of value added (%) 13.7 12.5Business and entrepreneurshipEnterprise births (10+ employees) (%) 2.2 1.5Total Entrepreneurial Activity (TEA) (%) 8.3 6.6FDI net inflows (% GDP) 3.6 3.6Top R&D spending enterprises per 10 mln population 0.0 19.7Buyer sophistication (1 to 7 best) 2.7 3.7Governance and policy frameworkEase of starting a business (0 to 100 best) 72.7 76.9Basic-school entrepren. education and training (1 to 5 best) 1.5 1.9Govt. procurement of advanced tech products (1 to 7 best) 2.6 3.5Rule of law (-2.5 to 2.5 best) 0.3 1.2DemographyPopulation size (millions) 4.2 510.1Average annual population growth (%) -0.8 0.3Population density (inhabitants/km2) 74.6 117.1
EU targets for 2020
Indicator 2013 Latest Target1
Gross domestic expenditure on R&D (% of GDP) 0.81 0.85 1.40Tertiary educational attainment (% of population aged 30-34)
25.6 27.3 35.0
1 Sources are provided in the introduction to the country profiles.
Croatia is a Moderate Innovator. Over time, performance has declined relative to that of the EU in 2010.
Firm investments and Innovators are the strongest innovation dimensions. Sales impacts and Intellectual assets are the weakest innovation dimensions.
Dark green: normalised performance above 120% of EU; light green: normalised perfor-mance between 90% and 120% of EU, yellow: normalised performance between 50% and 90% of EU; orange: normalised performance below 50% of EU. Normalised perfor-mance uses the data after a possible imputation of missing data and transformation of the data.
Data in red show a decline in performance compared to 2010.
Provisional CIS 2016 data show improved performance for all six indicators.
Structural differences with the EU are shown in the table below. GDP per capita and the employment share in high and medium high-tech manufacturing are well below the EU average.
RIO country report: https://rio.jrc.ec.europa.eu/en/country-analysis/CroatiaEuropean Semester country report:https://ec.europa.eu/info/sites/info/files/2018-european- semester-country-report-croatia-en.pdf

61European Innovation Scoreboard 2018
Italy
Performance relative to EU 2010 in
Relative to EU
2017 in2010 2017 2017
SUMMARY INNOVATION INDEX 75.7 77.7 73.6Human resources 55.1 65.2 54.7New doctorate graduates 107.7 101.6 72.9Population with tertiary education 3.0 23.1 20.4Lifelong learning 53.1 70.8 69.4Attractive research systems 73.4 99.4 87.5International scientific co-publications 119.4 202.2 124.3Most cited publications 89.7 102.3 98.6Foreign doctorate students 34.4 59.8 54.0Innovation-friendly environment 99.2 84.6 63.2Broadband penetration 55.6 77.8 43.8Opportunity-driven entrepreneurship 125.1 88.7 82.3Finance and support 58.1 59.4 55.1R&D expenditure in the public sector 66.4 61.1 63.3Venture capital expenditures 47.4 57.2 46.9Firm investments 58.6 64.5 57.7R&D expenditure in the business sector 52.8 61.6 55.3Non-R&D innovation expenditures 84.6 77.1 70.5Enterprises providing ICT training 42.9 57.1 50.0Innovators 101.7 90.8 105.6SMEs product/process innovations 84.3 89.4 109.3SMEs marketing/organisational innovations 102.3 81.8 98.8SMEs innovating in-house 117.6 101.3 108.5Linkages 57.8 57.1 56.5Innovative SMEs collaborating with others 48.0 55.4 55.1Public-private co-publications 82.9 74.4 73.7Private co-funding of public R&D exp. 40.2 40.0 39.4Intellectual assets 98.0 104.3 103.4PCT patent applications 52.9 58.5 61.1Trademark applications 95.5 119.9 106.1Design applications 142.1 135.5 140.4Employment impacts 71.3 74.8 74.4Employment in knowledge-intensive activities 102.6 103.9 94.1Employment fast-growing enterprises 48.9 54.0 57.7Sales impacts 80.6 77.0 74.0Medium and high tech product exports 88.7 93.7 88.5Knowledge-intensive services exports 68.3 67.6 64.4Sales of new-to-market/firm innovations 85.5 68.4 67.6
IT EUPerformance and structure of the economyGDP per capita (PPS) 27,500 28,600Average annual GDP growth (%) 1.1 2.2Employment share Manufacturing (NACE C) (%) 18.4 15.5
of which High and Medium high-tech (%) 33.0 37.2Employment share Services (NACE G-N) (%) 44.8 41.6
of which Knowledge-intensive services (%) 37.1 35.0Turnover share SMEs (%) 44.1 38.0Turnover share large enterprises (%) 31.4 44.4Foreign-controlled enterprises – share of value added (%) 6.5 12.5Business and entrepreneurshipEnterprise births (10+ employees) (%) 1.2 1.5Total Entrepreneurial Activity (TEA) (%) 4.5 6.6FDI net inflows (% GDP) 0.8 3.6Top R&D spending enterprises per 10 mln population 7.1 19.7Buyer sophistication (1 to 7 best) 3.7 3.7Governance and policy frameworkEase of starting a business (0 to 100 best) 72.1 76.9Basic-school entrepren. education and training (1 to 5 best) 1.8 1.9Govt. procurement of advanced tech products (1 to 7 best) 2.8 3.5Rule of law (-2.5 to 2.5 best) 0.3 1.2DemographyPopulation size (millions) 60.7 510.1Average annual population growth (%) -0.2 0.3Population density (inhabitants/km2) 201.9 117.1
2010 2011 2012 2013 2014 2015 2016 20170
20406080
100120140160
76 75 76 75 76 78 77 78
Relative to EU in 2010 Relative to EU in 2017
74
Dark green: normalised performance above 120% of EU; light green: normalised perfor-mance between 90% and 120% of EU, yellow: normalised performance between 50% and 90% of EU; orange: normalised performance below 50% of EU. Normalised perfor-mance uses the data after a possible imputation of missing data and transformation of the data.
Data in red show a decline in performance compared to 2010.
EU targets for 2020
Indicator 2013 Latest Target1
Gross domestic expenditure on R&D (% of GDP) 1.31 1.29 1.53Tertiary educational attainment (% of population aged 30-34)
22.5 26.5 26.0
1 Sources are provided in the introduction to the country profiles.
RIO country report: https://rio.jrc.ec.europa.eu/en/country-analysis/ItalyEuropean Semester country report:https://ec.europa.eu/info/sites/info/files/2018-european- semester-country-report-italy-en.pdf
Italy is a Moderate Innovator. Over time, performance has increased relative to that of the EU in 2010.
Innovators and Intellectual assets are the strongest innovation dimen-sions. Human resources and Finance and support are the weakest inno-vation dimensions.
Provisional CIS 2016 data show improved performance for three indicators and reduced performance for one indicator. There are no fast-track data for the other two indicators.
Structural differences with the EU are shown in the table below. The turnover share of large enterprises and the value added share of for-eign-controlled enterprises are well below the EU average.
SMEs innovating in-house
Innovative SMEs collaborating
Product/process innovators
Marketing/org. innovators
Non-R&D innovation exp. n/a
Sales share new product inn. n/a
80 90 100 110 120 130
Provisional CIS 2016 vs CIS 2014 (=100)
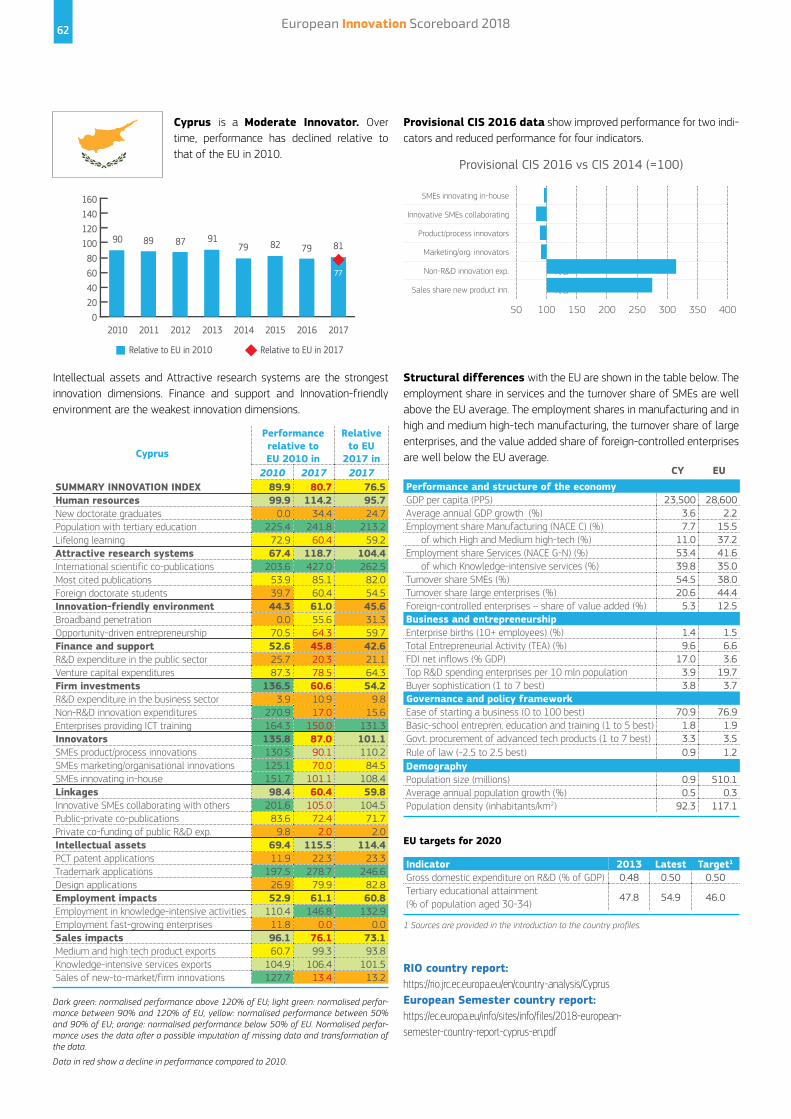
62 European Innovation Scoreboard 2018
Cyprus
Performance relative to EU 2010 in
Relative to EU
2017 in2010 2017 2017
SUMMARY INNOVATION INDEX 89.9 80.7 76.5Human resources 99.9 114.2 95.7New doctorate graduates 0.0 34.4 24.7Population with tertiary education 225.4 241.8 213.2Lifelong learning 72.9 60.4 59.2Attractive research systems 67.4 118.7 104.4International scientific co-publications 203.6 427.0 262.5Most cited publications 53.9 85.1 82.0Foreign doctorate students 39.7 60.4 54.5Innovation-friendly environment 44.3 61.0 45.6Broadband penetration 0.0 55.6 31.3Opportunity-driven entrepreneurship 70.5 64.3 59.7Finance and support 52.6 45.8 42.6R&D expenditure in the public sector 25.7 20.3 21.1Venture capital expenditures 87.3 78.5 64.3Firm investments 136.5 60.6 54.2R&D expenditure in the business sector 3.9 10.9 9.8Non-R&D innovation expenditures 270.9 17.0 15.6Enterprises providing ICT training 164.3 150.0 131.3Innovators 135.8 87.0 101.1SMEs product/process innovations 130.5 90.1 110.2SMEs marketing/organisational innovations 125.1 70.0 84.5SMEs innovating in-house 151.7 101.1 108.4Linkages 98.4 60.4 59.8Innovative SMEs collaborating with others 201.6 105.0 104.5Public-private co-publications 83.6 72.4 71.7Private co-funding of public R&D exp. 9.8 2.0 2.0Intellectual assets 69.4 115.5 114.4PCT patent applications 11.9 22.3 23.3Trademark applications 197.5 278.7 246.6Design applications 26.9 79.9 82.8Employment impacts 52.9 61.1 60.8Employment in knowledge-intensive activities 110.4 146.8 132.9Employment fast-growing enterprises 11.8 0.0 0.0Sales impacts 96.1 76.1 73.1Medium and high tech product exports 60.7 99.3 93.8Knowledge-intensive services exports 104.9 106.4 101.5Sales of new-to-market/firm innovations 127.7 13.4 13.2
CY EUPerformance and structure of the economyGDP per capita (PPS) 23,500 28,600Average annual GDP growth (%) 3.6 2.2Employment share Manufacturing (NACE C) (%) 7.7 15.5
of which High and Medium high-tech (%) 11.0 37.2Employment share Services (NACE G-N) (%) 53.4 41.6
of which Knowledge-intensive services (%) 39.8 35.0Turnover share SMEs (%) 54.5 38.0Turnover share large enterprises (%) 20.6 44.4Foreign-controlled enterprises – share of value added (%) 5.3 12.5Business and entrepreneurshipEnterprise births (10+ employees) (%) 1.4 1.5Total Entrepreneurial Activity (TEA) (%) 9.6 6.6FDI net inflows (% GDP) 17.0 3.6Top R&D spending enterprises per 10 mln population 3.9 19.7Buyer sophistication (1 to 7 best) 3.8 3.7Governance and policy frameworkEase of starting a business (0 to 100 best) 70.9 76.9Basic-school entrepren. education and training (1 to 5 best) 1.8 1.9Govt. procurement of advanced tech products (1 to 7 best) 3.3 3.5Rule of law (-2.5 to 2.5 best) 0.9 1.2DemographyPopulation size (millions) 0.9 510.1Average annual population growth (%) 0.5 0.3Population density (inhabitants/km2) 92.3 117.1
SMEs innovating in-house
Innovative SMEs collaborating
Product/process innovators
Marketing/org. innovators
Non-R&D innovation exp. n/a
Sales share new product inn. n/a
50 100 150 200 250 300 350 400
Provisional CIS 2016 vs CIS 2014 (=100)
2010 2011 2012 2013 2014 2015 2016 20170
20406080
100120140160
90 89 87 9179 82 79 81
Relative to EU in 2010 Relative to EU in 2017
77
EU targets for 2020
Indicator 2013 Latest Target1
Gross domestic expenditure on R&D (% of GDP) 0.48 0.50 0.50Tertiary educational attainment (% of population aged 30-34)
47.8 54.9 46.0
1 Sources are provided in the introduction to the country profiles.
Cyprus is a Moderate Innovator. Over time, performance has declined relative to that of the EU in 2010.
Intellectual assets and Attractive research systems are the strongest innovation dimensions. Finance and support and Innovation-friendly environment are the weakest innovation dimensions.
Dark green: normalised performance above 120% of EU; light green: normalised perfor-mance between 90% and 120% of EU, yellow: normalised performance between 50% and 90% of EU; orange: normalised performance below 50% of EU. Normalised perfor-mance uses the data after a possible imputation of missing data and transformation of the data.
Data in red show a decline in performance compared to 2010.
Provisional CIS 2016 data show improved performance for two indi-cators and reduced performance for four indicators.
Structural differences with the EU are shown in the table below. The employment share in services and the turnover share of SMEs are well above the EU average. The employment shares in manufacturing and in high and medium high-tech manufacturing, the turnover share of large enterprises, and the value added share of foreign-controlled enterprises are well below the EU average.
RIO country report: https://rio.jrc.ec.europa.eu/en/country-analysis/CyprusEuropean Semester country report:https://ec.europa.eu/info/sites/info/files/2018-european- semester-country-report-cyprus-en.pdf

63European Innovation Scoreboard 2018
Latvia
Performance relative to EU 2010 in
Relative to EU
2017 in2010 2017 2017
SUMMARY INNOVATION INDEX 48.1 59.6 56.5Human resources 64.7 79.8 66.8New doctorate graduates 30.8 38.8 27.9Population with tertiary education 116.4 132.8 117.1Lifelong learning 44.8 66.7 65.3Attractive research systems 12.6 55.8 49.1International scientific co-publications 20.8 92.9 57.1Most cited publications 17.8 52.3 50.4Foreign doctorate students 2.3 47.9 43.2Innovation-friendly environment 116.7 141.2 105.5Broadband penetration 200.0 211.1 118.8Opportunity-driven entrepreneurship 67.3 99.8 92.6Finance and support 36.7 107.4 99.8R&D expenditure in the public sector 23.9 31.0 32.1Venture capital expenditures 53.1 205.5 168.4Firm investments 68.7 37.5 33.5R&D expenditure in the business sector 10.0 5.6 5.1Non-R&D innovation expenditures 182.3 79.7 72.9Enterprises providing ICT training 35.7 35.7 31.3Innovators 20.7 12.7 14.7SMEs product/process innovations 22.9 0.0 0.0SMEs marketing/organisational innovations 11.6 28.8 34.7SMEs innovating in-house 27.9 8.4 9.0Linkages 42.3 44.3 43.9Innovative SMEs collaborating with others 20.9 15.8 15.7Public-private co-publications 21.7 16.0 15.8Private co-funding of public R&D exp. 86.4 104.3 102.8Intellectual assets 60.8 48.8 48.4PCT patent applications 20.4 22.3 23.3Trademark applications 105.6 112.0 99.1Design applications 64.9 26.1 27.0Employment impacts 51.6 94.1 93.6Employment in knowledge-intensive activities 44.2 83.1 75.3Employment fast-growing enterprises 56.8 102.0 109.0Sales impacts 45.1 46.3 44.4Medium and high tech product exports 31.8 43.3 40.9Knowledge-intensive services exports 74.1 70.6 67.3Sales of new-to-market/firm innovations 27.1 21.4 21.2
LV EUPerformance and structure of the economyGDP per capita (PPS) 18,300 28,600Average annual GDP growth (%) 3.4 2.2Employment share Manufacturing (NACE C) (%) 13.4 15.5
of which High and Medium high-tech (%) 12.3 37.2Employment share Services (NACE G-N) (%) 41.7 41.6
of which Knowledge-intensive services (%) 28.3 35.0Turnover share SMEs (%) 51.2 38.0Turnover share large enterprises (%) 22.2 44.4Foreign-controlled enterprises – share of value added (%) 15.7 12.5Business and entrepreneurshipEnterprise births (10+ employees) (%) 2.0 1.5Total Entrepreneurial Activity (TEA) (%) 14.2 6.6FDI net inflows (% GDP) 2.3 3.6Top R&D spending enterprises per 10 mln population 0.0 19.7Buyer sophistication (1 to 7 best) 2.9 3.7Governance and policy frameworkEase of starting a business (0 to 100 best) 79.3 76.9Basic-school entrepren. education and training (1 to 5 best) 2.4 1.9Govt. procurement of advanced tech products (1 to 7 best) 3.1 3.5Rule of law (-2.5 to 2.5 best) 0.9 1.2DemographyPopulation size (millions) 2.0 510.1Average annual population growth (%) -0.9 0.3Population density (inhabitants/km2) 31.6 117.1
SMEs innovating in-house
Innovative SMEs collaborating
Product/process innovators
Marketing/org. innovators
Non-R&D innovation exp.
Sales share new product inn. n/a
80 100 120 140 160 180 200 220
Provisional CIS 2016 vs CIS 2014 (=100)
2010 2011 2012 2013 2014 2015 2016 20170
20406080
100120140160
48 48 45 4555 62 58 60
Relative to EU in 2010 Relative to EU in 2017
57
Dark green: normalised performance above 120% of EU; light green: normalised perfor-mance between 90% and 120% of EU, yellow: normalised performance between 50% and 90% of EU; orange: normalised performance below 50% of EU. Normalised perfor-mance uses the data after a possible imputation of missing data and transformation of the data.
Data in red show a decline in performance compared to 2010.
RIO country report: https://rio.jrc.ec.europa.eu/en/country-analysis/LatviaEuropean Semester country report:https://ec.europa.eu/info/sites/info/files/2018-european- semester-country-report-latvia-en.pdf
Latvia is a Moderate Innovator. Over time, performance has increased relative to that of the EU in 2010.
Innovation-friendly environment and Finance and support are the stron-gest innovation dimensions. Innovators and Firm investments are the weakest innovation dimensions.
Provisional CIS 2016 data show improved performance for all six indicators.
Structural differences with the EU are shown in the table below. The turnover share of SMEs and the value added share of foreign-controlled enterprises are well above the EU average. GDP per capita, the employ-ment share in high and medium high-tech manufacturing, and the turn-over share of large enterprises are well below the EU average.
EU targets for 2020
Indicator 2013 Latest Target1
Gross domestic expenditure on R&D (% of GDP) 0.61 0.44 1.50Tertiary educational attainment (% of population aged 30-34)
40.7 45.6 34.0
1 Sources are provided in the introduction to the country profiles.

64 European Innovation Scoreboard 2018
Lithuania
Performance relative to EU 2010 in
Relative to EU
2017 in2010 2017 2017
SUMMARY INNOVATION INDEX 55.0 75.0 71.1Human resources 106.9 115.5 96.8New doctorate graduates 61.5 51.1 36.7Population with tertiary education 214.9 237.3 209.2Lifelong learning 34.4 50.0 49.0Attractive research systems 32.0 39.5 34.8International scientific co-publications 48.2 139.6 85.8Most cited publications 47.9 29.8 28.7Foreign doctorate students 3.8 18.8 17.0Innovation-friendly environment 103.3 164.5 123.0Broadband penetration 177.8 311.1 175.0Opportunity-driven entrepreneurship 59.2 77.6 72.1Finance and support 47.8 64.0 59.4R&D expenditure in the public sector 82.3 69.9 72.5Venture capital expenditures 3.5 56.4 46.2Firm investments 48.9 104.2 93.2R&D expenditure in the business sector 13.5 22.2 20.0Non-R&D innovation expenditures 109.1 280.8 256.8Enterprises providing ICT training 35.7 42.9 37.5Innovators 43.5 79.7 92.6SMEs product/process innovations 43.2 93.8 114.7SMEs marketing/organisational innovations 37.0 45.9 55.4SMEs innovating in-house 50.5 100.7 107.9Linkages 83.4 103.0 102.0Innovative SMEs collaborating with others 68.5 140.3 139.6Public-private co-publications 46.3 31.0 30.7Private co-funding of public R&D exp. 139.2 144.0 142.0Intellectual assets 25.7 51.5 51.0PCT patent applications 14.8 21.8 22.8Trademark applications 56.1 107.5 95.1Design applications 13.0 37.2 38.5Employment impacts 62.2 39.6 39.3Employment in knowledge-intensive activities 31.2 51.9 47.1Employment fast-growing enterprises 84.4 30.7 32.8Sales impacts 31.9 36.6 35.1Medium and high tech product exports 36.0 49.6 46.8Knowledge-intensive services exports 0.3 8.7 8.3Sales of new-to-market/firm innovations 63.7 53.7 53.1
LT EUPerformance and structure of the economyGDP per capita (PPS) 21,500 28,600Average annual GDP growth (%) 3.1 2.2Employment share Manufacturing (NACE C) (%) 15.3 15.5
of which High and Medium high-tech (%) 13.3 37.2Employment share Services (NACE G-N) (%) 39.5 41.6
of which Knowledge-intensive services (%) 23.7 35.0Turnover share SMEs (%) 48.7 38.0Turnover share large enterprises (%) 33.3 44.4Foreign-controlled enterprises – share of value added (%) 11.9 12.5Business and entrepreneurshipEnterprise births (10+ employees) (%) 2.3 1.5Total Entrepreneurial Activity (TEA) (%) n/a 6.6FDI net inflows (% GDP) 1.9 3.6Top R&D spending enterprises per 10 mln population 0.0 19.7Buyer sophistication (1 to 7 best) 3.2 3.7Governance and policy frameworkEase of starting a business (0 to 100 best) 78.3 76.9Basic-school entrepren. education and training (1 to 5 best) n/a 1.9Govt. procurement of advanced tech products (1 to 7 best) 3.0 3.5Rule of law (-2.5 to 2.5 best) 1.0 1.2DemographyPopulation size (millions) 2.9 510.1Average annual population growth (%) -1.3 0.3Population density (inhabitants/km2) 46.3 117.1
2010 2011 2012 2013 2014 2015 2016 20170
20406080
100120140160
55 57 60 59 58 6477 75
Relative to EU in 2010 Relative to EU in 2017
71
Lithuania is a Moderate Innovator. Over time, performance has increased relative to that of the EU in 2010.
Innovation-friendly environment and Linkages are the strongest innovation dimensions. Attractive research systems and Sales impacts are the weakest innovation dimensions.
Dark green: normalised performance above 120% of EU; light green: normalised perfor-mance between 90% and 120% of EU, yellow: normalised performance between 50% and 90% of EU; orange: normalised performance below 50% of EU. Normalised perfor-mance uses the data after a possible imputation of missing data and transformation of the data.
Data in red show a decline in performance compared to 2010.
Provisional CIS 2016 data show improved performance for five indi-cators and slightly reduced performance for one indicator.
Structural differences with the EU are shown in the table below. The turnover share of SMEs is well above the EU average. GDP per capita, the employment share in high and medium high-tech manufacturing, the employment share in knowledge-intensive services, and the turnover share of large enterprises are well below the EU average.
RIO country report: https://rio.jrc.ec.europa.eu/en/country-analysis/LithuaniaEuropean Semester country report:https://ec.europa.eu/info/sites/info/files/2018-european- semester-country-report-lithuania-en.pdf
EU targets for 2020
Indicator 2013 Latest Target1
Gross domestic expenditure on R&D (% of GDP) 0.95 0.85 1.90Tertiary educational attainment (% of population aged 30-34)
51.3 58.2 48.7
1 Sources are provided in the introduction to the country profiles.
SMEs innovating in-house
Innovative SMEs collaborating
Product/process innovators
Marketing/org. innovators
Non-R&D innovation exp.
Sales share new product inn.
80 100 120 140 160 180 200
Provisional CIS 2016 vs CIS 2014 (=100)

65European Innovation Scoreboard 2018
Luxembourg
Performance relative to EU 2010 in
Relative to EU
2017 in2010 2017 2017
SUMMARY INNOVATION INDEX 121.2 127.7 121.1Human resources 137.3 150.3 126.0New doctorate graduates 46.2 83.1 59.6Population with tertiary education 197.8 204.5 180.3Lifelong learning 176.0 167.7 164.3Attractive research systems 163.7 224.8 197.8International scientific co-publications 282.4 576.0 354.1Most cited publications 85.4 133.3 128.4Foreign doctorate students 234.3 234.3 211.6Innovation-friendly environment 186.1 192.0 143.5Broadband penetration 144.4 277.8 156.3Opportunity-driven entrepreneurship 210.7 141.1 131.0Finance and support 114.4 134.3 124.7R&D expenditure in the public sector 43.4 78.8 81.7Venture capital expenditures 205.5 205.5 168.4Firm investments 67.4 77.1 68.9R&D expenditure in the business sector 57.2 51.9 46.6Non-R&D innovation expenditures 24.5 4.9 4.5Enterprises providing ICT training 114.3 164.3 143.8Innovators 134.9 122.3 142.2SMEs product/process innovations 127.3 107.8 131.8SMEs marketing/organisational innovations 144.2 148.9 179.8SMEs innovating in-house 132.6 109.1 117.0Linkages 80.1 62.8 62.2Innovative SMEs collaborating with others 111.7 80.0 79.6Public-private co-publications 94.5 79.5 78.8Private co-funding of public R&D exp. 32.4 27.1 26.7Intellectual assets 145.1 154.4 153.0PCT patent applications 44.2 47.5 49.6Trademark applications 278.7 278.7 246.6Design applications 139.3 161.1 166.9Employment impacts 124.4 139.4 138.6Employment in knowledge-intensive activities 223.4 211.7 191.8Employment fast-growing enterprises 53.8 87.8 93.8Sales impacts 100.6 88.2 84.8Medium and high tech product exports 93.0 73.8 69.7Knowledge-intensive services exports 146.1 149.8 142.8Sales of new-to-market/firm innovations 56.6 33.6 33.2
LU EUPerformance and structure of the economyGDP per capita (PPS) 75,700 28,600Average annual GDP growth (%) 2.7 2.2Employment share Manufacturing (NACE C) (%) 5.1 15.5
of which High and Medium high-tech (%) 20.7 37.2Employment share Services (NACE G-N) (%) 46.2 41.6
of which Knowledge-intensive services (%) 59.2 35.0Turnover share SMEs (%) 55.1 38.0Turnover share large enterprises (%) 29.9 44.4Foreign-controlled enterprises – share of value added (%) 22.3 12.5Business and entrepreneurshipEnterprise births (10+ employees) (%) 1.1 1.5Total Entrepreneurial Activity (TEA) (%) 9.5 6.6FDI net inflows (% GDP) 19.2 3.6Top R&D spending enterprises per 10 mln population 272.4 19.7Buyer sophistication (1 to 7 best) 4.9 3.7Governance and policy frameworkEase of starting a business (0 to 100 best) 68.8 76.9Basic-school entrepren. education and training (1 to 5 best) 2.0 1.9Govt. procurement of advanced tech products (1 to 7 best) 4.6 3.5Rule of law (-2.5 to 2.5 best) 1.8 1.2DemographyPopulation size (millions) 0.6 510.1Average annual population growth (%) 2.4 0.3Population density (inhabitants/km2) 220.2 117.1
2010 2011 2012 2013 2014 2015 2016 20170
20406080
100120140160
121 124 129 131 126 131 131 128
Relative to EU in 2010 Relative to EU in 2017
121
RIO country report: https://rio.jrc.ec.europa.eu/en/country-analysis/LuxembourgEuropean Semester country report:https://ec.europa.eu/info/sites/info/files/2018-european- semester-country-report-luxembourg-en.pdf
EU targets for 2020
Indicator 2013 Latest Target1
Gross domestic expenditure on R&D (% of GDP) 1.30 1.24 2.30Tertiary educational attainment (% of population aged 30-34)
52.5 54.5 66.0
1 Sources are provided in the introduction to the country profiles.
Dark green: normalised performance above 120% of EU; light green: normalised perfor-mance between 90% and 120% of EU, yellow: normalised performance between 50% and 90% of EU; orange: normalised performance below 50% of EU. Normalised perfor-mance uses the data after a possible imputation of missing data and transformation of the data.
Data in red show a decline in performance compared to 2010.
Luxembourg is an Innovation Leader. Over time, performance has increased relative to that of the EU in 2010.
Attractive research systems and Intellectuals assets are the strongest innovation dimensions. Linkages and Firm investments are the weakest innovation dimensions.
For Luxembourg fast-track CIS 2016 data are not available.
Structural differences with the EU are shown in the table below. GDP per capita, the employment share in knowledge-intensive services, the turnover share of SMEs and the value added share of foreign-con-trolled enterprises are well above the EU average. The employment shares in manufacturing and in high and medium high-tech manufactur-ing, and the turnover share of large enterprises are well below the EU average

66 European Innovation Scoreboard 2018
Hungary
Performance relative to EU 2010 in
Relative to EU
2017 in2010 2017 2017
SUMMARY INNOVATION INDEX 69.5 69.3 65.7Human resources 59.2 54.6 45.7New doctorate graduates 53.8 62.4 44.8Population with tertiary education 61.9 47.8 42.1Lifelong learning 62.5 53.1 52.0Attractive research systems 52.0 66.4 58.4International scientific co-publications 87.8 141.6 87.0Most cited publications 59.2 60.5 58.3Foreign doctorate students 29.3 48.9 44.2Innovation-friendly environment 85.0 117.9 88.1Broadband penetration 100.0 177.8 100.0Opportunity-driven entrepreneurship 76.1 82.4 76.5Finance and support 45.8 50.0 46.4R&D expenditure in the public sector 55.7 23.9 24.8Venture capital expenditures 33.1 83.4 68.4Firm investments 72.2 87.5 78.3R&D expenditure in the business sector 52.8 73.8 66.3Non-R&D innovation expenditures 106.1 107.1 98.0Enterprises providing ICT training 64.3 85.7 75.0Innovators 25.0 15.1 17.6SMEs product/process innovations 21.2 13.7 16.7SMEs marketing/organisational innovations 34.0 16.0 19.4SMEs innovating in-house 19.5 15.5 16.6Linkages 85.8 70.2 69.5Innovative SMEs collaborating with others 59.7 50.0 49.8Public-private co-publications 82.4 85.8 85.0Private co-funding of public R&D exp. 116.0 73.5 72.5Intellectual assets 35.0 39.5 39.2PCT patent applications 36.6 36.4 38.0Trademark applications 51.0 62.5 55.3Design applications 21.3 25.1 26.0Employment impacts 125.7 124.9 124.3Employment in knowledge-intensive activities 85.7 76.6 69.4Employment fast-growing enterprises 154.2 159.4 170.4Sales impacts 113.4 99.0 95.1Medium and high tech product exports 147.8 139.6 131.8Knowledge-intensive services exports 63.1 63.6 60.7Sales of new-to-market/firm innovations 131.4 92.1 91.2
HU EUPerformance and structure of the economyGDP per capita (PPS) 19,400 28,600Average annual GDP growth (%) 3.1 2.2Employment share Manufacturing (NACE C) (%) 21.6 15.5
of which High and Medium high-tech (%) 42.7 37.2Employment share Services (NACE G-N) (%) 36.5 41.6
of which Knowledge-intensive services (%) 29.7 35.0Turnover share SMEs (%) 37.6 38.0Turnover share large enterprises (%) 43.5 44.4Foreign-controlled enterprises – share of value added (%) 30.3 12.5Business and entrepreneurshipEnterprise births (10+ employees) (%) 2.1 1.5Total Entrepreneurial Activity (TEA) (%) 7.9 6.6FDI net inflows (% GDP) 19.8 3.6Top R&D spending enterprises per 10 mln population 1.0 19.7Buyer sophistication (1 to 7 best) 3.0 3.7Governance and policy frameworkEase of starting a business (0 to 100 best) 72.7 76.9Basic-school entrepren. education and training (1 to 5 best) 1.5 1.9Govt. procurement of advanced tech products (1 to 7 best) 2.9 3.5Rule of law (-2.5 to 2.5 best) 0.5 1.2DemographyPopulation size (millions) 9.8 510.1Average annual population growth (%) -0.3 0.3Population density (inhabitants/km2) 106.5 117.1
SMEs innovating in-house
Innovative SMEs collaborating
Product/process innovators
Marketing/org. innovators
Non-R&D innovation exp.
Sales share new product inn. n/a
60 70 80 90 100 110 120 130
Provisional CIS 2016 vs CIS 2014 (=100)
2010 2011 2012 2013 2014 2015 2016 20170
20406080
100120140160
69 68 65 65 66 67 67 69
Relative to EU in 2010 Relative to EU in 2017
66
RIO country report: https://rio.jrc.ec.europa.eu/en/country-analysis/HungaryEuropean Semester country report:https://ec.europa.eu/info/sites/info/files/2018-european- semester-country-report-hungary-en.pdf
EU targets for 2020
Indicator 2013 Latest Target1
Gross domestic expenditure on R&D (% of GDP) 1.39 1.21 1.80Tertiary educational attainment (% of population aged 30-34)
32.3 32.3 34.0
1 Sources are provided in the introduction to the country profiles.
Dark green: normalised performance above 120% of EU; light green: normalised perfor-mance between 90% and 120% of EU, yellow: normalised performance between 50% and 90% of EU; orange: normalised performance below 50% of EU. Normalised perfor-mance uses the data after a possible imputation of missing data and transformation of the data.
Data in red show a decline in performance compared to 2010.
Hungary is a Moderate Innovator. Over time, performance has declined relative to that of the EU in 2010
Employment and Sales impacts are the strongest innovation dimensions. Innovators and Intellectual assets are the weakest innovation dimensions.
Provisional CIS 2016 data show improved performance for three indicators and reduced performance for three indicators
Structural differences with the EU are shown in the table below. The employment share in manufacturing and the value added share of for-eign-controlled enterprises are well above the EU average. GDP per cap-ita is well below the EU average.

67European Innovation Scoreboard 2018
Malta
Performance relative to EU 2010 in
Relative to EU
2017 in2010 2017 2017
SUMMARY INNOVATION INDEX 69.1 84.3 79.9Human resources 46.3 66.5 55.8New doctorate graduates 7.7 38.2 27.4Population with tertiary education 45.5 72.4 63.8Lifelong learning 93.8 93.8 91.8Attractive research systems 50.9 161.0 141.7International scientific co-publications 54.9 190.3 117.0Most cited publications 57.8 105.3 101.4Foreign doctorate students 39.6 230.3 208.0Innovation-friendly environment 107.5 165.4 123.6Broadband penetration 144.4 222.2 125.0Opportunity-driven entrepreneurship N/A N/A N/AFinance and support 8.5 7.5 6.9R&D expenditure in the public sector 6.2 13.3 13.8Venture capital expenditures 11.4 0.0 0.0Firm investments 101.9 79.8 71.4R&D expenditure in the business sector 24.9 30.1 27.0Non-R&D innovation expenditures 159.0 42.0 38.4Enterprises providing ICT training 135.7 164.3 143.8Innovators 57.3 67.9 79.0SMEs product/process innovations 60.4 63.8 78.0SMEs marketing/organisational innovations 51.4 68.9 83.1SMEs innovating in-house 60.4 70.9 76.0Linkages 30.5 11.9 11.8Innovative SMEs collaborating with others 40.0 29.9 29.7Public-private co-publications 42.5 0.0 0.0Private co-funding of public R&D exp. 7.8 6.7 6.6Intellectual assets 73.2 168.3 166.8PCT patent applications 33.6 35.5 37.1Trademark applications 200.7 278.7 246.6Design applications 14.2 209.9 217.4Employment impacts 122.0 140.5 139.7Employment in knowledge-intensive activities 128.6 164.9 149.4Employment fast-growing enterprises 117.3 123.1 131.6Sales impacts 105.1 56.8 54.5Medium and high tech product exports 101.0 120.1 113.4Knowledge-intensive services exports 97.1 33.0 31.4Sales of new-to-market/firm innovations 119.3 9.7 9.6
MT EUPerformance and structure of the economyGDP per capita (PPS) 26,300 28,600Average annual GDP growth (%) 6.0 2.2Employment share Manufacturing (NACE C) (%) 12.6 15.5
of which High and Medium high-tech (%) 30.0 37.2Employment share Services (NACE G-N) (%) 46.4 41.6
of which Knowledge-intensive services (%) 35.2 35.0Turnover share SMEs (%) 45.0 38.0Turnover share large enterprises (%) 17.6 44.4Foreign-controlled enterprises – share of value added (%) 13.3 12.5Business and entrepreneurshipEnterprise births (10+ employees) (%) 1.7 1.5Total Entrepreneurial Activity (TEA) (%) n/a 6.6FDI net inflows (% GDP) 17.4 3.6Top R&D spending enterprises per 10 mln population 22.7 19.7Buyer sophistication (1 to 7 best) 3.5 3.7Governance and policy frameworkEase of starting a business (0 to 100 best) 63.8 76.9Basic-school entrepren. education and training (1 to 5 best) n/a 1.9Govt. procurement of advanced tech products (1 to 7 best) 3.8 3.5Rule of law (-2.5 to 2.5 best) 1.1 1.2DemographyPopulation size (millions) 0.5 510.1Average annual population growth (%) 2.3 0.3Population density (inhabitants/km2) 1477.8 117.1
SMEs innovating in-house
Innovative SMEs collaborating
Product/process innovators
Marketing/org. innovators
Non-R&D innovation exp.
Sales share new product inn. n/a
60 100 140 180 220 260 300 340
Provisional CIS 2016 vs CIS 2014 (=100)
2010 2011 2012 2013 2014 2015 2016 20170
20406080
100120140160
69 67 6273
82 85 79 84
Relative to EU in 2010 Relative to EU in 2017
80
RIO country report: https://rio.jrc.ec.europa.eu/en/country-analysis/MaltaEuropean Semester country report:https://ec.europa.eu/info/sites/info/files/2018-european- semester-country-report-malta-en.pdf
EU targets for 2020
Indicator 2013 Latest Target1
Gross domestic expenditure on R&D (% of GDP) 0.77 0.61 2.00Tertiary educational attainment (% of population aged 30-34)
26.0 30.5 33.0
1 Sources are provided in the introduction to the country profiles.
Dark green: normalised performance above 120% of EU; light green: normalised perfor-mance between 90% and 120% of EU, yellow: normalised performance between 50% and 90% of EU; orange: normalised performance below 50% of EU. Normalised perfor-mance uses the data after a possible imputation of missing data and transformation of the data.
Data in red show a decline in performance compared to 2010.
Malta is a Moderate Innovator. Over time, performance has increased relative to that of the EU in 2010.
Intellectual assets and Attractive research systems are the strongest innovation dimensions. Finance and support and Linkages are the weak-est innovation dimensions.
Provisional CIS 2016 data show improved performance for the two expenditure indicators and reduced performance for four indicators.
Structural differences with the EU are shown in the table below. The turnover share of large enterprises is well below the EU average.

68 European Innovation Scoreboard 2018
Netherlands
Performance relative to EU 2010 in
Relative to EU
2017 in2010 2017 2017
SUMMARY INNOVATION INDEX 119.6 135.5 128.5Human resources 146.1 174.4 146.1New doctorate graduates 115.4 167.6 120.2Population with tertiary education 153.0 170.1 150.0Lifelong learning 175.0 187.5 183.7Attractive research systems 179.0 207.5 182.6International scientific co-publications 345.2 546.0 335.7Most cited publications 148.8 151.4 145.8Foreign doctorate students 164.8 170.8 154.3Innovation-friendly environment 182.3 213.3 159.4Broadband penetration 166.7 300.0 168.8Opportunity-driven entrepreneurship 191.6 162.0 150.3Finance and support 117.5 140.2 130.2R&D expenditure in the public sector 121.2 126.6 131.2Venture capital expenditures 112.8 157.7 129.2Firm investments 80.8 85.4 76.4R&D expenditure in the business sector 92.1 97.4 87.4Non-R&D innovation expenditures 69.2 10.2 9.3Enterprises providing ICT training 78.6 135.7 118.8Innovators 75.8 109.5 127.3SMEs product/process innovations 84.7 133.5 163.3SMEs marketing/organisational innovations 61.5 74.8 90.2SMEs innovating in-house 81.9 122.0 130.7Linkages 150.6 152.6 151.2Innovative SMEs collaborating with others 118.0 163.1 162.2Public-private co-publications 160.0 157.3 155.8Private co-funding of public R&D exp. 173.2 136.9 135.0Intellectual assets 125.1 127.7 126.6PCT patent applications 162.5 157.8 164.7Trademark applications 129.5 134.4 118.9Design applications 86.8 94.5 97.9Employment impacts 121.2 115.9 115.3Employment in knowledge-intensive activities 148.1 148.1 134.1Employment fast-growing enterprises 102.1 93.0 99.4Sales impacts 82.6 95.5 91.7Medium and high tech product exports 69.0 86.1 81.2Knowledge-intensive services exports 118.8 122.0 116.3Sales of new-to-market/firm innovations 56.4 75.7 74.9
NL EUPerformance and structure of the economyGDP per capita (PPS) 36,800 28,600Average annual GDP growth (%) 2.7 2.2Employment share Manufacturing (NACE C) (%) 10.2 15.5
of which High and Medium high-tech (%) 29.9 37.2Employment share Services (NACE G-N) (%) 46.3 41.6
of which Knowledge-intensive services (%) 39.8 35.0Turnover share SMEs (%) 48.0 38.0Turnover share large enterprises (%) 37.3 44.4Foreign-controlled enterprises – share of value added (%) 14.7 12.5Business and entrepreneurshipEnterprise births (10+ employees) (%) 1.1 1.5Total Entrepreneurial Activity (TEA) (%) 9.4 6.6FDI net inflows (% GDP) 17.5 3.6Top R&D spending enterprises per 10 mln population 28.6 19.7Buyer sophistication (1 to 7 best) 4.4 3.7Governance and policy frameworkEase of starting a business (0 to 100 best) 76.2 76.9Basic-school entrepren. education and training (1 to 5 best) 3.2 1.9Govt. procurement of advanced tech products (1 to 7 best) 3.9 3.5Rule of law (-2.5 to 2.5 best) 1.9 1.2DemographyPopulation size (millions) 17.0 510.1Average annual population growth (%) 0.5 0.3Population density (inhabitants/km2) 500.6 117.1
2010 2011 2012 2013 2014 2015 2016 20170
20406080
100120140160
120 120 128 128 126 129 131 135
Relative to EU in 2010 Relative to EU in 2017
128
RIO country report: https://rio.jrc.ec.europa.eu/en/country-analysis/NetherlandsEuropean Semester country report:https://ec.europa.eu/info/sites/info/files/2018-european- semester-country-report-netherland-en.pdf
EU targets for 2020
Indicator 2013 Latest Target1
Gross domestic expenditure on R&D (% of GDP) 1.95 2.03 2.50Tertiary educational attainment (% of population aged 30-34)
43.2 47.1 40.0
1 Sources are provided in the introduction to the country profiles.
Dark green: normalised performance above 120% of EU; light green: normalised perfor-mance between 90% and 120% of EU, yellow: normalised performance between 50% and 90% of EU; orange: normalised performance below 50% of EU. Normalised perfor-mance uses the data after a possible imputation of missing data and transformation of the data.
Data in red show a decline in performance compared to 2010.
The Netherlands is an Innovation Leader. Over time, performance has increased relative to that of the EU in 2010.
Attractive research systems and Innovation-friendly environment are the strongest innovation dimensions. Firm investments and Sales impacts are the weakest innovation dimensions.
For the Netherlands, fast-track CIS 2016 data are not available.
Structural differences with the EU are shown in the table below. GDP per capita and the turnover share of SMEs are well above the EU average. The employment share in manufacturing is well below the EU average.

69European Innovation Scoreboard 2018
Provisional CIS 2016 show improved performance for four indicators. There are no fast-track data for the other two indicators.
Structural differences with the EU are shown in the table below. GDP per capita, the turnover share of SMEs, and the value added share of foreign-controlled enterprises are well above the EU average. The turnover share of large enterprises is well below the EU average.
Austria
Performance relative to EU 2010 in
Relative to EU
2017 in2010 2017 2017
SUMMARY INNOVATION INDEX 112.0 121.0 114.7Human resources 129.1 134.6 112.8New doctorate graduates 146.2 130.4 93.6Population with tertiary education 109.0 123.1 108.6Lifelong learning 132.3 153.1 150.0Attractive research systems 137.0 157.4 138.5International scientific co-publications 291.7 458.9 282.1Most cited publications 113.6 110.7 106.6Foreign doctorate students 116.9 120.1 108.5Innovation-friendly environment 120.2 116.0 86.7Broadband penetration 133.3 144.4 81.3Opportunity-driven entrepreneurship 112.4 99.2 92.1Finance and support 83.7 98.8 91.8R&D expenditure in the public sector 117.7 126.6 131.2Venture capital expenditures 40.1 63.3 51.8Firm investments 131.9 150.7 134.8R&D expenditure in the business sector 150.7 188.2 169.0Non-R&D innovation expenditures 61.0 61.5 56.3Enterprises providing ICT training 171.4 185.7 162.5Innovators 115.7 122.1 141.9SMEs product/process innovations 119.0 124.0 151.6SMEs marketing/organisational innovations 109.6 120.8 145.8SMEs innovating in-house 118.9 121.6 130.3Linkages 121.8 144.9 143.5Innovative SMEs collaborating with others 135.4 193.3 192.3Public-private co-publications 134.5 143.1 141.8Private co-funding of public R&D exp. 94.1 97.7 96.3Intellectual assets 155.3 147.5 146.2PCT patent applications 118.5 127.3 132.9Trademark applications 171.5 166.7 147.5Design applications 177.5 151.9 157.4Employment impacts 74.9 66.0 65.6Employment in knowledge-intensive activities 111.7 120.8 109.4Employment fast-growing enterprises 48.7 26.9 28.7Sales impacts 70.3 82.8 79.6Medium and high tech product exports 98.8 109.7 103.6Knowledge-intensive services exports 33.0 51.8 49.4Sales of new-to-market/firm innovations 80.1 87.3 86.4
AT EUPerformance and structure of the economyGDP per capita (PPS) 37,000 28,600Average annual GDP growth (%) 2.2 2.2Employment share Manufacturing (NACE C) (%) 15.9 15.5
of which High and Medium high-tech (%) 38.0 37.2Employment share Services (NACE G-N) (%) 41.6 41.6
of which Knowledge-intensive services (%) 32.1 35.0Turnover share SMEs (%) 48.7 38.0Turnover share large enterprises (%) 33.9 44.4Foreign-controlled enterprises – share of value added (%) 15.0 12.5Business and entrepreneurshipEnterprise births (10+ employees) (%) 1.4 1.5Total Entrepreneurial Activity (TEA) (%) 9.6 6.6FDI net inflows (% GDP) -3.2 3.6Top R&D spending enterprises per 10 mln population 33.0 19.7Buyer sophistication (1 to 7 best) 3.8 3.7Governance and policy frameworkEase of starting a business (0 to 100 best) 78.7 76.9Basic-school entrepren. education and training (1 to 5 best) 1.4 1.9Govt. procurement of advanced tech products (1 to 7 best) 3.5 3.5Rule of law (-2.5 to 2.5 best) 1.9 1.2DemographyPopulation size (millions) 8.7 510.1Average annual population growth (%) 1.1 0.3Population density (inhabitants/km2) 104.8 117.1
SMEs innovating in-house
Innovative SMEs collaborating
Product/process innovators
Marketing/org. innovators
Non-R&D innovation exp. n/a
Sales share new product inn. n/a
Provisional CIS 2016 vs CIS 2014 (=100)
90 95 100 105 110 115
2010 2011 2012 2013 2014 2015 2016 20170
20406080
100120140160
112 113 116 118 115 116 122 121
115
Relative to EU in 2010 Relative to EU in 2017
Dark green: normalised performance above 120% of EU; light green: normalised perfor-mance between 90% and 120% of EU, yellow: normalised performance between 50% and 90% of EU; orange: normalised performance below 50% of EU. Normalised perfor-mance uses the data after a possible imputation of missing data and transformation of the data.
Data in red show a decline in performance compared to 2010.
RIO country report: https://rio.jrc.ec.europa.eu/en/country-analysis/AustriaEuropean Semester country report:https://ec.europa.eu/info/sites/info/files/2018-european- semester-country-report-austria-en.pdf
EU targets for 2020
Indicator 2013 Latest Target1
Gross domestic expenditure on R&D (% of GDP) 2.95 3.09 3.76Tertiary educational attainment (% of population aged 30-34)
21.9 40.5 38.0
1 Sources are provided in the introduction to the country profiles.
Austria is a Strong Innovator. Over time, performance has increased relative to that of the EU in 2010.
Intellectual assets and Linkages are the strongest innovation dimen-sions. Employment and Sales impacts are the weakest innovation di-mensions.

70 European Innovation Scoreboard 2018
Poland
Performance relative to EU 2010 in
Relative to EU
2017 in2010 2017 2017
SUMMARY INNOVATION INDEX 53.3 56.6 53.6Human resources 75.1 72.2 60.5New doctorate graduates 46.2 33.3 23.9Population with tertiary education 140.3 147.8 130.3Lifelong learning 33.3 30.2 29.6Attractive research systems 21.7 33.4 29.4International scientific co-publications 44.0 86.4 53.1Most cited publications 24.9 38.7 37.3Foreign doctorate students 9.4 7.5 6.8Innovation-friendly environment 39.1 127.2 95.1Broadband penetration 77.8 144.4 81.3Opportunity-driven entrepreneurship 16.2 117.0 108.6Finance and support 44.6 33.2 30.8R&D expenditure in the public sector 57.5 29.2 30.3Venture capital expenditures 28.0 38.2 31.3Firm investments 72.1 90.6 81.0R&D expenditure in the business sector 12.6 51.1 45.9Non-R&D innovation expenditures 190.7 188.8 172.7Enterprises providing ICT training 35.7 50.0 43.8Innovators 25.6 2.9 3.4SMEs product/process innovations 24.3 5.9 7.3SMEs marketing/organisational innovations 27.7 3.0 3.6SMEs innovating in-house 24.8 0.0 0.0Linkages 47.9 37.9 37.6Innovative SMEs collaborating with others 52.1 23.0 22.9Public-private co-publications 34.2 36.6 36.2Private co-funding of public R&D exp. 58.5 54.5 53.8Intellectual assets 52.0 75.2 74.5PCT patent applications 9.6 18.8 19.6Trademark applications 50.7 80.5 71.2Design applications 92.6 124.2 128.7Employment impacts 91.6 92.5 91.9Employment in knowledge-intensive activities 42.9 59.7 54.1Employment fast-growing enterprises 126.4 115.8 123.8Sales impacts 67.4 55.3 53.1Medium and high tech product exports 90.4 83.9 79.2Knowledge-intensive services exports 45.2 45.8 43.7Sales of new-to-market/firm innovations 66.2 32.7 32.3
PL EUPerformance and structure of the economyGDP per capita (PPS) 19,400 28,600Average annual GDP growth (%) 3.7 2.2Employment share Manufacturing (NACE C) (%) 19.7 15.5
of which High and Medium high-tech (%) 27.6 37.2Employment share Services (NACE G-N) (%) 34.8 41.6
of which Knowledge-intensive services (%) 29.6 35.0Turnover share SMEs (%) 35.1 38.0Turnover share large enterprises (%) 44.1 44.4Foreign-controlled enterprises – share of value added (%) 14.5 12.5Business and entrepreneurshipEnterprise births (10+ employees) (%) 1.9 1.5Total Entrepreneurial Activity (TEA) (%) 9.6 6.6FDI net inflows (% GDP) 3.4 3.6Top R&D spending enterprises per 10 mln population 0.4 19.7Buyer sophistication (1 to 7 best) 3.3 3.7Governance and policy frameworkEase of starting a business (0 to 100 best) 76.8 76.9Basic-school entrepren. education and training (1 to 5 best) 1.6 1.9Govt. procurement of advanced tech products (1 to 7 best) 3.1 3.5Rule of law (-2.5 to 2.5 best) 0.8 1.2DemographyPopulation size (millions) 38.0 510.1Average annual population growth (%) 0.0 0.3Population density (inhabitants/km2) 123.9 117.1
SMEs innovating in-house
Innovative SMEs collaborating
Product/process innovators
Marketing/org. innovators
Non-R&D innovation exp.
Sales share new product inn.
Provisional CIS 2016 vs CIS 2014 (=100)
60 80 100 120 140 160 180
2010 2011 2012 2013 2014 2015 2016 20170
20406080
100120140160
53 54 50 52 50 52 55 57
Relative to EU in 2010 Relative to EU in 2017
54
RIO country report: https://rio.jrc.ec.europa.eu/en/country-analysis/PolandEuropean Semester country report:https://ec.europa.eu/info/sites/info/files/2018-european- semester-country-report-poland-en_1.pdfDark green: normalised performance above 120% of EU; light green: normalised perfor-
mance between 90% and 120% of EU, yellow: normalised performance between 50% and 90% of EU; orange: normalised performance below 50% of EU. Normalised perfor-mance uses the data after a possible imputation of missing data and transformation of the data.
Data in red show a decline in performance compared to 2010.
EU targets for 2020
Indicator 2013 Latest Target1
Gross domestic expenditure on R&D (% of GDP) 0.87 0.97 1.70Tertiary educational attainment (% of population aged 30-34)
40.5 45.6 45.0
1 Sources are provided in the introduction to the country profiles.
Poland is a Moderate Innovator. Over time, performance has increased relative to that of the EU in 2010.
Innovation-friendly environment and Employment impacts are the strongest innovation dimensions. Innovators and Attractive research systems are the weakest innovation dimensions.
Provisional CIS 2016 data show improved performance for three indicators and reduced performance for three indicators
Structural differences with the EU are shown in the table below. The employment share in manufacturing is well above the EU average. GDP per capita and the employment share in high and medium high-tech manufacturing are well below the EU average.

71European Innovation Scoreboard 2018
Portugal
Performance relative to EU 2010 in
Relative to EU
2017 in2010 2017 2017
SUMMARY INNOVATION INDEX 86.4 84.9 80.5Human resources 123.1 100.0 83.8New doctorate graduates 200.0 131.0 94.0Population with tertiary education 56.7 76.1 67.1Lifelong learning 108.3 90.6 88.8Attractive research systems 81.4 120.9 106.4International scientific co-publications 146.0 301.2 185.2Most cited publications 86.6 85.8 82.6Foreign doctorate students 51.6 108.9 98.3Innovation-friendly environment 104.0 178.2 133.2Broadband penetration 144.4 355.6 200.0Opportunity-driven entrepreneurship 80.0 73.0 67.8Finance and support 80.3 70.1 65.1R&D expenditure in the public sector 92.9 85.8 89.0Venture capital expenditures 64.0 50.0 41.0Firm investments 94.5 83.5 74.7R&D expenditure in the business sector 61.6 49.3 44.3Non-R&D innovation expenditures 95.6 90.0 82.4Enterprises providing ICT training 128.6 114.3 100.0Innovators 127.8 99.9 116.1SMEs product/process innovations 154.2 129.9 158.8SMEs marketing/organisational innovations 113.2 92.7 112.0SMEs innovating in-house 117.6 78.8 84.4Linkages 70.0 54.9 54.3Innovative SMEs collaborating with others 121.4 65.7 65.4Public-private co-publications 56.8 57.3 56.8Private co-funding of public R&D exp. 32.5 41.2 40.6Intellectual assets 64.5 74.0 73.4PCT patent applications 16.5 25.7 26.8Trademark applications 75.8 115.9 102.5Design applications 101.0 87.8 91.0Employment impacts 49.2 82.8 82.3Employment in knowledge-intensive activities 44.2 63.6 57.6Employment fast-growing enterprises 52.9 96.5 103.2Sales impacts 70.3 44.9 43.1Medium and high tech product exports 48.3 54.1 51.0Knowledge-intensive services exports 47.4 47.6 45.4Sales of new-to-market/firm innovations 122.8 30.9 30.6
PT EUPerformance and structure of the economyGDP per capita (PPS) 22,000 28,600Average annual GDP growth (%) 2.1 2.2Employment share Manufacturing (NACE C) (%) 17.0 15.5
of which High and Medium high-tech (%) 18.0 37.2Employment share Services (NACE G-N) (%) 41.0 41.6
of which Knowledge-intensive services (%) 31.0 35.0Turnover share SMEs (%) n/a 38.0Turnover share large enterprises (%) n/a 44.4Foreign-controlled enterprises – share of value added (%) 10.2 12.5Business and entrepreneurshipEnterprise births (10+ employees) (%) 1.7 1.5Total Entrepreneurial Activity (TEA) (%) 8.8 6.6FDI net inflows (% GDP) 3.8 3.6Top R&D spending enterprises per 10 mln population 4.8 19.7Buyer sophistication (1 to 7 best) 3.6 3.7Governance and policy frameworkEase of starting a business (0 to 100 best) 77.0 76.9Basic-school entrepren. education and training (1 to 5 best) 2.8 1.9Govt. procurement of advanced tech products (1 to 7 best) 3.6 3.5Rule of law (-2.5 to 2.5 best) 1.1 1.2DemographyPopulation size (millions) 10.3 510.1Average annual population growth (%) -0.3 0.3Population density (inhabitants/km2) 112.9 117.1
SMEs innovating in-house
Innovative SMEs collaborating
Product/process innovators
Marketing/org. innovators
Non-R&D innovation exp.
Sales share new product inn.
Provisional CIS 2016 vs CIS 2014 (=100)
80 100 120 140 160 180 200 220
2010 2011 2012 2013 2014 2015 2016 20170
20406080
100120140160
86 86 82 84 81 83 83 85
Relative to EU in 2010 Relative to EU in 2017
80
Dark green: normalised performance above 120% of EU; light green: normalised perfor-mance between 90% and 120% of EU, yellow: normalised performance between 50% and 90% of EU; orange: normalised performance below 50% of EU. Normalised perfor-mance uses the data after a possible imputation of missing data and transformation of the data.
Data in red show a decline in performance compared to 2010.
RIO country report: https://rio.jrc.ec.europa.eu/en/country-analysis/PortugalEuropean Semestercountry report:https://ec.europa.eu/info/sites/info/files/2018-european- semester-country-report-portugal-en.pdf
EU targets for 2020
Indicator 2013 Latest Target1
Gross domestic expenditure on R&D (% of GDP) 1.33 1.27 2.70Tertiary educational attainment (% of population aged 30-34)
30.0 33.9 40.0
1 Sources are provided in the introduction to the country profiles.
Portugal is a Moderate Innovator. Over time, performance has declined relative to that of the EU in 2010.
Innovation-friendly environment and Innovators are the strongest inno-vation dimensions. Sales impacts and Linkages are the weakest innova-tion dimensions.
Provisional CIS 2016 show improved performance for all six indica-tors.
Structural differences with the EU are shown in the table below. GDP per capita and the employment share in high and medium high-tech manufacturing are well below the EU average

72 European Innovation Scoreboard 2018
Romania
Performance relative to EU 2010 in
Relative to EU
2017 in2010 2017 2017
SUMMARY INNOVATION INDEX 46.8 32.8 31.1Human resources 40.7 22.5 18.8New doctorate graduates 100.0 49.9 35.8Population with tertiary education 11.9 13.4 11.8Lifelong learning 3.1 0.0 0.0Attractive research systems 22.8 29.7 26.1International scientific co-publications 22.7 46.8 28.8Most cited publications 30.2 35.6 34.3Foreign doctorate students 12.3 15.3 13.8Innovation-friendly environment 81.1 96.8 72.3Broadband penetration 122.2 188.9 106.3Opportunity-driven entrepreneurship 56.7 42.2 39.1Finance and support 48.3 22.4 20.8R&D expenditure in the public sector 27.4 9.7 10.1Venture capital expenditures 75.1 38.6 31.6Firm investments 64.9 13.3 11.9R&D expenditure in the business sector 11.8 19.6 17.6Non-R&D innovation expenditures 209.4 21.3 19.5Enterprises providing ICT training 0.0 0.0 0.0Innovators 39.1 0.0 0.0SMEs product/process innovations 26.4 0.0 0.0SMEs marketing/organisational innovations 52.0 0.0 0.0SMEs innovating in-house 38.0 0.0 0.0Linkages 53.7 38.1 37.7Innovative SMEs collaborating with others 10.7 5.8 5.8Public-private co-publications 46.2 30.4 30.1Private co-funding of public R&D exp. 105.3 79.1 78.0Intellectual assets 8.6 22.5 22.3PCT patent applications 4.2 5.9 6.1Trademark applications 14.3 35.4 31.3Design applications 8.4 28.4 29.4Employment impacts 18.8 34.7 34.6Employment in knowledge-intensive activities 3.9 26.0 23.5Employment fast-growing enterprises 29.5 41.0 43.8Sales impacts 83.4 66.6 64.0Medium and high tech product exports 90.1 103.4 97.7Knowledge-intensive services exports 48.8 57.9 55.2Sales of new-to-market/firm innovations 115.9 33.2 32.9
RO EUPerformance and structure of the economyGDP per capita (PPS) 16,200 28,600Average annual GDP growth (%) 5.9 2.2Employment share Manufacturing (NACE C) (%) 18.5 15.5
of which High and Medium high-tech (%) 30.0 37.2Employment share Services (NACE G-N) (%) 29.7 41.6
of which Knowledge-intensive services (%) 27.4 35.0Turnover share SMEs (%) 42.4 38.0Turnover share large enterprises (%) 41.6 44.4Foreign-controlled enterprises – share of value added (%) 18.1 12.5Business and entrepreneurshipEnterprise births (10+ employees) (%) 3.1 1.5Total Entrepreneurial Activity (TEA) (%) 10.8 6.6FDI net inflows (% GDP) 2.4 3.6Top R&D spending enterprises per 10 mln population 0.3 19.7Buyer sophistication (1 to 7 best) 2.8 3.7Governance and policy frameworkEase of starting a business (0 to 100 best) 74.3 76.9Basic-school entrepren. education and training (1 to 5 best) 2.4 1.9Govt. procurement of advanced tech products (1 to 7 best) 2.9 3.5Rule of law (-2.5 to 2.5 best) 0.2 1.2DemographyPopulation size (millions) 19.8 510.1Average annual population growth (%) -0.6 0.3Population density (inhabitants/km2) 85.6 117.1
SMEs innovating in-house
Innovative SMEs collaborating
Product/process innovators
Marketing/org. innovators
Non-R&D innovation exp.
Sales share new product inn.
Provisional CIS 2016 vs CIS 2014 (=100)
20 40 60 80 100 120
2010 2011 2012 2013 2014 2015 2016 20170
20406080
100120140160
47 47 40 40 32 30 32 33
Relative to EU in 2010 Relative to EU in 2017
31
RIO country report: https://rio.jrc.ec.europa.eu/en/country-analysis/RomaniaEuropean Semester country report:https://ec.europa.eu/info/sites/info/files/2018-european- semester-country-report-romania-en.pdf
Dark green: normalised performance above 120% of EU; light green: normalised perfor-mance between 90% and 120% of EU, yellow: normalised performance between 50% and 90% of EU; orange: normalised performance below 50% of EU. Normalised perfor-mance uses the data after a possible imputation of missing data and transformation of the data.
Data in red show a decline in performance compared to 2010.
EU targets for 2020
Indicator 2013 Latest Target1
Gross domestic expenditure on R&D (% of GDP) 0.39 0.48 2.00Tertiary educational attainment (% of population aged 30-34)
22.9 26.3 26.7
1 Sources are provided in the introduction to the country profiles.
Romania is a Modest Innovator. Over time, performance has declined relative to that of the EU in 2010.
Innovation-friendly environment and Sales impacts are the strongest innovation dimensions. Innovators and Firm investments are the weakest innovation dimensions.
Provisional CIS 2016 data show reduced performance for all six in-dicators, in particular for Non-R&D innovation expenditures.
Structural differences with the EU are shown in the table below. The value added share of foreign-controlled enterprises is well above the EU average. GDP per capita and the employment shares in services and in knowledge-intensive services are well below the EU average.

73European Innovation Scoreboard 2018
Slovenia
Performance relative to EU 2010 in
Relative to EU
2017 in2010 2017 2017
SUMMARY INNOVATION INDEX 95.9 97.3 92.2Human resources 119.6 171.4 143.6New doctorate graduates 100.0 235.9 169.2Population with tertiary education 106.0 154.5 136.2Lifelong learning 159.4 113.5 111.2Attractive research systems 75.1 102.5 90.2International scientific co-publications 230.9 375.7 231.0Most cited publications 65.2 80.1 77.1Foreign doctorate students 35.6 40.5 36.5Innovation-friendly environment 121.1 117.3 87.7Broadband penetration 144.4 177.8 100.0Opportunity-driven entrepreneurship 107.3 81.4 75.6Finance and support 53.5 36.0 33.4R&D expenditure in the public sector 85.8 59.3 61.5Venture capital expenditures 12.1 6.1 5.0Firm investments 143.1 135.3 121.0R&D expenditure in the business sector 152.4 128.0 114.9Non-R&D innovation expenditures 114.5 118.5 108.4Enterprises providing ICT training 157.1 157.1 137.5Innovators 86.8 82.2 95.6SMEs product/process innovations 82.3 89.1 109.0SMEs marketing/organisational innovations 98.1 77.1 93.0SMEs innovating in-house 79.7 81.0 86.8Linkages 127.7 113.4 112.3Innovative SMEs collaborating with others 130.8 119.9 119.2Public-private co-publications 137.7 118.2 117.1Private co-funding of public R&D exp. 113.7 101.4 100.0Intellectual assets 88.1 80.9 80.2PCT patent applications 80.6 44.7 46.6Trademark applications 134.7 147.7 130.7Design applications 60.0 64.7 67.0Employment impacts 66.8 75.8 75.4Employment in knowledge-intensive activities 93.5 103.9 94.1Employment fast-growing enterprises 47.8 55.7 59.5Sales impacts 86.6 78.1 75.0Medium and high tech product exports 103.9 106.8 100.9Knowledge-intensive services exports 31.8 37.2 35.5Sales of new-to-market/firm innovations 130.1 91.8 90.8
SI EUPerformance and structure of the economyGDP per capita (PPS) 23,500 28,600Average annual GDP growth (%) 4.1 2.2Employment share Manufacturing (NACE C) (%) 24.0 15.5
of which High and Medium high-tech (%) 38.7 37.2Employment share Services (NACE G-N) (%) 35.7 41.6
of which Knowledge-intensive services (%) 34.8 35.0Turnover share SMEs (%) 46.8 38.0Turnover share large enterprises (%) 31.9 44.4Foreign-controlled enterprises – share of value added (%) 13.7 12.5Business and entrepreneurshipEnterprise births (10+ employees) (%) 1.1 1.5Total Entrepreneurial Activity (TEA) (%) 6.9 6.6FDI net inflows (% GDP) 3.1 3.6Top R&D spending enterprises per 10 mln population 17.8 19.7Buyer sophistication (1 to 7 best) 3.3 3.7Governance and policy frameworkEase of starting a business (0 to 100 best) 74.9 76.9Basic-school entrepren. education and training (1 to 5 best) 1.8 1.9Govt. procurement of advanced tech products (1 to 7 best) 2.7 3.5Rule of law (-2.5 to 2.5 best) 1.0 1.2DemographyPopulation size (millions) 2.1 510.1Average annual population growth (%) 0.1 0.3Population density (inhabitants/km2) 102.4 117.1
SMEs innovating in-house
Innovative SMEs collaborating
Product/process innovators n/a
Marketing/org. innovators
Non-R&D innovation exp.
Sales share new product inn.
Provisional CIS 2016 vs CIS 2014 (=100)
60 70 80 90 100 110 1202010 2011 2012 2013 2014 2015 2016 2017
020406080
100120140160
96 98 95 96 98 97 98 97
92
Relative to EU in 2010 Relative to EU in 2017
Dark green: normalised performance above 120% of EU; light green: normalised perfor-mance between 90% and 120% of EU, yellow: normalised performance between 50% and 90% of EU; orange: normalised performance below 50% of EU. Normalised perfor-mance uses the data after a possible imputation of missing data and transformation of the data.
Data in red show a decline in performance compared to 2010.
RIO country report: https://rio.jrc.ec.europa.eu/en/country-analysis/SloveniaEuropean Semester country report:https://ec.europa.eu/info/sites/info/files/2018-european- semester-country-report-slovenia-en.pdf
EU targets for 2020
Indicator 2013 Latest Target1
Gross domestic expenditure on R&D (% of GDP) 2.58 2.00 3.00Tertiary educational attainment (% of population aged 30-34)
40.1 46.8 40.0
1 Sources are provided in the introduction to the country profiles.
Slovenia is a Strong Innovator. Over time, performance has increased relative to that of the EU in 2010.
Human resources and Firm investments are the strongest innovation di-mensions. Finance and support, Sales and Employment impacts are the weakest innovation dimensions.
Provisional CIS 2016 show reduced performance for five indicators. For Product/process innovators a comparison with 2014 is not possible due to missing 2014 data.
Structural differences with the EU are shown in the table below. The employment share in manufacturing and the turnover share of SMEs are well above the EU average. The turnover share of large enterprises is well below the EU average.

74 European Innovation Scoreboard 2018
Slovakia
Performance relative to EU 2010 in
Relative to EU
2017 in2010 2017 2017
SUMMARY INNOVATION INDEX 62.8 67.6 64.0Human resources 76.9 92.6 77.6New doctorate graduates 146.2 157.6 113.1Population with tertiary education 44.8 84.3 74.3Lifelong learning 31.3 24.0 23.5Attractive research systems 47.1 57.4 50.5International scientific co-publications 85.5 135.5 83.3Most cited publications 49.7 52.1 50.1Foreign doctorate students 30.1 38.2 34.5Innovation-friendly environment 64.2 79.3 59.3Broadband penetration 100.0 133.3 75.0Opportunity-driven entrepreneurship 43.0 47.4 44.0Finance and support 17.0 29.7 27.6R&D expenditure in the public sector 22.1 41.6 43.1Venture capital expenditures 10.5 14.5 11.9Firm investments 83.4 63.7 57.0R&D expenditure in the business sector 12.6 31.0 27.8Non-R&D innovation expenditures 102.1 78.9 72.2Enterprises providing ICT training 142.9 85.7 75.0Innovators 40.8 29.2 33.9SMEs product/process innovations 30.8 20.8 25.4SMEs marketing/organisational innovations 60.6 40.5 48.9SMEs innovating in-house 30.3 25.6 27.4Linkages 58.3 68.7 68.0Innovative SMEs collaborating with others 45.8 72.4 72.0Public-private co-publications 60.0 50.6 50.2Private co-funding of public R&D exp. 69.0 84.7 83.6Intellectual assets 27.8 35.6 35.3PCT patent applications 9.2 13.7 14.3Trademark applications 47.0 68.0 60.2Design applications 30.7 31.7 32.9Employment impacts 118.4 119.2 118.6Employment in knowledge-intensive activities 61.0 63.6 57.6Employment fast-growing enterprises 159.4 158.9 169.9Sales impacts 92.8 105.4 101.2Medium and high tech product exports 121.5 133.7 126.2Knowledge-intensive services exports 36.0 31.6 30.2Sales of new-to-market/firm innovations 125.0 157.8 156.1
SK EUPerformance and structure of the economyGDP per capita (PPS) 22,000 28,600Average annual GDP growth (%) 3.3 2.2Employment share Manufacturing (NACE C) (%) 24.2 15.5
of which High and Medium high-tech (%) 42.4 37.2Employment share Services (NACE G-N) (%) 34.4 41.6
of which Knowledge-intensive services (%) 27.9 35.0Turnover share SMEs (%) 35.6 38.0Turnover share large enterprises (%) 44.0 44.4Foreign-controlled enterprises – share of value added (%) 19.2 12.5Business and entrepreneurshipEnterprise births (10+ employees) (%) 2.1 1.5Total Entrepreneurial Activity (TEA) (%) 10.3 6.6FDI net inflows (% GDP) 1.8 3.6Top R&D spending enterprises per 10 mln population 0.0 19.7Buyer sophistication (1 to 7 best) 2.9 3.7Governance and policy frameworkEase of starting a business (0 to 100 best) 75.1 76.9Basic-school entrepren. education and training (1 to 5 best) 2.0 1.9Govt. procurement of advanced tech products (1 to 7 best) 3.1 3.5Rule of law (-2.5 to 2.5 best) 0.6 1.2DemographyPopulation size (millions) 5.4 510.1Average annual population growth (%) 0.1 0.3Population density (inhabitants/km2) 110.9 117.1
2010 2011 2012 2013 2014 2015 2016 20170
20406080
100120140160
63 66 69 71 66 68 70 68
64
Relative to EU in 2010 Relative to EU in 2017
RIO country report: https://rio.jrc.ec.europa.eu/en/country-analysis/SlovakiaEuropean Semester country report:https://ec.europa.eu/info/sites/info/files/2018-european- semester-country-report-slovakia-en.pdf
Dark green: normalised performance above 120% of EU; light green: normalised perfor-mance between 90% and 120% of EU, yellow: normalised performance between 50% and 90% of EU; orange: normalised performance below 50% of EU. Normalised perfor-mance uses the data after a possible imputation of missing data and transformation of the data.
Data in red show a decline in performance compared to 2010.
EU targets for 2020
Indicator 2013 Latest Target1
Gross domestic expenditure on R&D (% of GDP) 0.82 0.79 1.20Tertiary educational attainment (% of population aged 30-34)
26.9 33.6 40.0
1 Sources are provided in the introduction to the country profiles.
Slovakia is a Moderate Innovator. Over time, performance has increased relative to that of the EU in 2010.
Employment and Sales impacts are the strongest innovation dimensions. Finance and support and Innovators are the weakest innovation dimensions.
SMEs innovating in-house
Innovative SMEs collaborating
Product/process innovators
Marketing/org. innovators
Non-R&D innovation exp.
Sales share new product inn.
Provisional CIS 2016 vs CIS 2014 (=100)
80 90 100 110 120 130 140 150
Provisional CIS 2016 data show improved performance for four in-dicators and reduced performance for two indicators.
Structural differences with the EU are shown in the table below. The employment share in manufacturing and the value added share of for-eign-controlled enterprises are well above the EU average. GDP per cap-ita and the employment share in knowledge-intensive services are well below the EU average.

75European Innovation Scoreboard 2018
FInland
Performance relative to EU 2010 in
Relative to EU
2017 in2010 2017 2017
SUMMARY INNOVATION INDEX 132.9 135.7 128.7Human resources 184.3 197.1 165.2New doctorate graduates 207.7 205.6 147.5Population with tertiary education 123.1 123.1 108.6Lifelong learning 228.1 274.0 268.4Attractive research systems 107.4 156.6 137.8International scientific co-publications 339.4 556.6 342.2Most cited publications 99.2 107.0 103.0Foreign doctorate students 39.1 89.7 81.0Innovation-friendly environment 149.3 245.7 183.7Broadband penetration 233.3 355.6 200.0Opportunity-driven entrepreneurship 99.4 180.6 167.7Finance and support 176.7 118.7 110.3R&D expenditure in the public sector 158.4 133.6 138.5Venture capital expenditures 200.1 99.6 81.6Firm investments 185.0 148.1 132.5R&D expenditure in the business sector 222.3 154.2 138.4Non-R&D innovation expenditures 77.3 36.1 33.0Enterprises providing ICT training 235.7 235.7 206.3Innovators 112.3 121.7 141.4SMEs product/process innovations 128.8 138.5 169.4SMEs marketing/organisational innovations 71.3 90.9 109.7SMEs innovating in-house 138.2 136.9 146.7Linkages 143.2 133.9 132.6Innovative SMEs collaborating with others 141.4 156.2 155.4Public-private co-publications 149.1 145.8 144.5Private co-funding of public R&D exp. 138.6 98.3 96.9Intellectual assets 146.7 148.1 146.7PCT patent applications 223.7 201.4 210.2Trademark applications 112.9 159.4 141.0Design applications 99.8 89.5 92.7Employment impacts 86.7 83.9 83.5Employment in knowledge-intensive activities 123.4 136.4 123.5Employment fast-growing enterprises 60.5 46.5 49.7Sales impacts 82.0 80.8 77.6Medium and high tech product exports 72.5 71.9 67.9Knowledge-intensive services exports 56.4 107.0 102.1Sales of new-to-market/firm innovations 123.1 60.6 59.9
FI EUPerformance and structure of the economyGDP per capita (PPS) 31,400 28,600Average annual GDP growth (%) 2.4 2.2Employment share Manufacturing (NACE C) (%) 13.5 15.5
of which High and Medium high-tech (%) 36.0 37.2Employment share Services (NACE G-N) (%) 39.9 41.6
of which Knowledge-intensive services (%) 38.8 35.0Turnover share SMEs (%) 39.8 38.0Turnover share large enterprises (%) 44.9 44.4Foreign-controlled enterprises – share of value added (%) 10.5 12.5Business and entrepreneurshipEnterprise births (10+ employees) (%) 0.3 1.5Total Entrepreneurial Activity (TEA) (%) 6.7 6.6FDI net inflows (% GDP) 3.2 3.6Top R&D spending enterprises per 10 mln population 71.9 19.7Buyer sophistication (1 to 7 best) 4.6 3.7Governance and policy frameworkEase of starting a business (0 to 100 best) 80.8 76.9Basic-school entrepren. education and training (1 to 5 best) 2.3 1.9Govt. procurement of advanced tech products (1 to 7 best) 3.9 3.5Rule of law (-2.5 to 2.5 best) 2.1 1.2DemographyPopulation size (millions) 5.4 510.1Average annual population growth (%) 0.1 0.3Population density (inhabitants/km2) 110.9 117.1
SMEs innovating in-house
Innovative SMEs collaborating
Product/process innovators
Marketing/org. innovators
Non-R&D innovation exp.
Sales share new product inn.
Provisional CIS 2016 vs CIS 2014 (=100)
75 100 125 150 175 200 225 250
2010 2011 2012 2013 2014 2015 2016 20170
20406080
100120140160
133 132 132 132 130 132 134 136
Relative to EU in 2010 Relative to EU in 2017
129
Dark green: normalised performance above 120% of EU; light green: normalised perfor-mance between 90% and 120% of EU, yellow: normalised performance between 50% and 90% of EU; orange: normalised performance below 50% of EU. Normalised perfor-mance uses the data after a possible imputation of missing data and transformation of the data.
Data in red show a decline in performance compared to 2010.
RIO country report: https://rio.jrc.ec.europa.eu/en/country-analysis/FinlandEuropean Semester country report:https://ec.europa.eu/info/sites/info/files/2018-european-semester-country-report-finland-en.pdf
EU targets for 2020
Indicator 2013 Latest Target1
Gross domestic expenditure on R&D (% of GDP) 3.29 2.75 4.00Tertiary educational attainment (% of population aged 30-34)
45.1 45.3 42.0
1 Sources are provided in the introduction to the country profiles.
Finland is an Innovation Leader. Over time, performance has increased relative to that of the EU in 2010.
Innovation-friendly environment and Human resources are the strongest innovation dimensions. Sales and Employment impacts are the weakest innovation dimensions.
Provisional CIS 2016 show improved performance for all six indica-tors, in particular for Non-R&D innovation expenditures.
Structural differences with the EU are shown in the table below. All indicators are close to the EU average.

76 European Innovation Scoreboard 2018
Sweden
Performance relative to EU 2010 in
Relative to EU
2017 in2010 2017 2017
SUMMARY INNOVATION INDEX 143.1 148.5 140.8Human resources 209.8 214.3 179.6New doctorate graduates 223.1 193.4 138.8Population with tertiary education 165.7 176.1 155.3Lifelong learning 245.8 284.4 278.6Attractive research systems 148.9 200.6 176.5International scientific co-publications 419.0 680.8 418.6Most cited publications 111.1 121.8 117.3Foreign doctorate students 109.9 147.6 133.3Innovation-friendly environment 186.2 254.8 190.5Broadband penetration 244.4 355.6 200.0Opportunity-driven entrepreneurship 151.7 195.2 181.2Finance and support 162.6 120.1 111.6R&D expenditure in the public sector 149.6 146.0 151.4Venture capital expenditures 179.4 86.9 71.2Firm investments 151.8 176.5 157.9R&D expenditure in the business sector 210.1 193.5 173.8Non-R&D innovation expenditures 105.9 169.6 155.2Enterprises providing ICT training 128.6 164.3 143.8Innovators 114.2 109.1 126.8SMEs product/process innovations 123.5 122.7 150.0SMEs marketing/organisational innovations 89.1 83.6 100.9SMEs innovating in-house 131.0 122.1 130.9Linkages 141.9 132.3 131.0Innovative SMEs collaborating with others 153.5 123.5 122.8Public-private co-publications 172.1 180.3 178.6Private co-funding of public R&D exp. 97.2 88.7 87.5Intellectual assets 152.6 158.0 156.6PCT patent applications 223.7 223.7 233.5Trademark applications 124.9 151.1 133.7Design applications 106.7 101.6 105.3Employment impacts 137.2 132.1 131.4Employment in knowledge-intensive activities 144.2 166.2 150.6Employment fast-growing enterprises 132.2 107.8 115.2Sales impacts 90.7 85.5 82.1Medium and high tech product exports 97.0 99.6 94.0Knowledge-intensive services exports 111.1 112.8 107.6Sales of new-to-market/firm innovations 59.5 37.0 36.6
SE EUPerformance and structure of the economyGDP per capita (PPS) 35,500 28,600Average annual GDP growth (%) 2.8 2.2Employment share Manufacturing (NACE C) (%) 10.5 15.5
of which High and Medium high-tech (%) 41.7 37.2Employment share Services (NACE G-N) (%) 41.3 41.6
of which Knowledge-intensive services (%) 43.6 35.0Turnover share SMEs (%) 38.2 38.0Turnover share large enterprises (%) 42.7 44.4Foreign-controlled enterprises – share of value added (%) 15.1 12.5Business and entrepreneurshipEnterprise births (10+ employees) (%) 0.4 1.5Total Entrepreneurial Activity (TEA) (%) 7.3 6.6FDI net inflows (% GDP) 1.1 3.6Top R&D spending enterprises per 10 mln population 83.8 19.7Buyer sophistication (1 to 7 best) 4.6 3.7Governance and policy frameworkEase of starting a business (0 to 100 best) 81.6 76.9Basic-school entrepren. education and training (1 to 5 best) 2.4 1.9Govt. procurement of advanced tech products (1 to 7 best) 3.9 3.5Rule of law (-2.5 to 2.5 best) 2.0 1.2DemographyPopulation size (millions) 9.9 510.1Average annual population growth (%) 1.3 0.3Population density (inhabitants/km2) 24.1 117.1
SMEs innovating in-house
Innovative SMEs collaborating
Product/process innovators
Marketing/org. innovators
Non-R&D innovation exp.
Sales share new product inn.
Provisional CIS 2016 vs CIS 2014 (=100)
60 70 80 90 100 110 120 130
2010 2011 2012 2013 2014 2015 2016 20170
20406080
100120140160 143 144 145 146 143 145 148 149
141
Relative to EU in 2010 Relative to EU in 2017
RIO country report: https://rio.jrc.ec.europa.eu/en/country-analysis/SwedenEuropean Semester country report:https://ec.europa.eu/info/sites/info/files/2018-european- semester-country-report-sweden-en.pdf
Dark green: normalised performance above 120% of EU; light green: normalised perfor-mance between 90% and 120% of EU, yellow: normalised performance between 50% and 90% of EU; orange: normalised performance below 50% of EU. Normalised perfor-mance uses the data after a possible imputation of missing data and transformation of the data.
Data in red show a decline in performance compared to 2010.
EU targets for 2020
Indicator 2013 Latest Target1
Gross domestic expenditure on R&D (% of GDP) 3.31 3.25 4.00Tertiary educational attainment (% of population aged 30-34)
48.3 51.1 45.0
1 Sources are provided in the introduction to the country profiles.
Sweden is an Innovation Leader. Over time, performance has increased relative to that of the EU in 2010.
Innovation-friendly environment and Human resources are the strongest innovation dimensions. Sales impacts and Finance and support are the weakest innovation dimensions.
Provisional CIS 2016 data show improved performance for two in-dicators and reduced performance for four indicators.
Structural differences with the EU are shown in the table below. GDP per capita, the employment share in knowledge-intensive services, and the value added share of foreign-controlled enterprises are well above the EU average. The employment share in manufacturing is well below the EU average.

77European Innovation Scoreboard 2018
United Kingdom
Performance relative to EU 2010 in
Relative to EU
2017 in2010 2017 2017
SUMMARY INNOVATION INDEX 114.1 128.1 121.5Human resources 170.5 180.6 151.4New doctorate graduates 153.8 221.6 159.0Population with tertiary education 164.2 175.4 154.6Lifelong learning 197.9 137.5 134.7Attractive research systems 177.8 196.8 173.2International scientific co-publications 245.6 405.9 249.6Most cited publications 144.0 156.1 150.3Foreign doctorate students 202.7 183.0 165.3Innovation-friendly environment 111.4 123.4 92.2Broadband penetration 88.9 144.4 81.3Opportunity-driven entrepreneurship 124.7 111.0 103.0Finance and support 123.3 115.8 107.6R&D expenditure in the public sector 84.1 64.6 67.0Venture capital expenditures 173.7 181.5 148.7Firm investments 98.7 113.9 101.9R&D expenditure in the business sector 88.6 94.8 85.1Non-R&D innovation expenditures 33.3 95.2 87.1Enterprises providing ICT training 164.3 150.0 131.3Innovators 61.2 85.6 99.5SMEs product/process innovations 65.0 89.0 108.8SMEs marketing/organisational innovations 69.8 118.7 143.3SMEs innovating in-house 48.8 48.8 52.3Linkages 139.1 134.8 133.5Innovative SMEs collaborating with others 217.4 217.4 216.3Public-private co-publications 123.1 127.3 126.1Private co-funding of public R&D exp. 77.4 59.3 58.4Intellectual assets 78.5 82.3 81.5PCT patent applications 92.3 83.0 86.7Trademark applications 89.1 102.0 90.2Design applications 57.6 66.7 69.1Employment impacts 140.3 144.8 144.0Employment in knowledge-intensive activities 150.6 166.2 150.6Employment fast-growing enterprises 132.9 129.5 138.5Sales impacts 86.3 128.3 123.2Medium and high tech product exports 98.5 107.3 101.3Knowledge-intensive services exports 112.7 109.9 104.8Sales of new-to-market/firm innovations 41.1 174.5 172.7
UK EUPerformance and structure of the economyGDP per capita (PPS) 30,900 28,600Average annual GDP growth (%) 1.8 2.2Employment share Manufacturing (NACE C) (%) 9.7 15.5
of which High and Medium high-tech (%) 38.0 37.2Employment share Services (NACE G-N) (%) 44.7 41.6
of which Knowledge-intensive services (%) 39.7 35.0Turnover share SMEs (%) 31.6 38.0Turnover share large enterprises (%) 54.9 44.4Foreign-controlled enterprises – share of value added (%) 17.3 12.5Business and entrepreneurshipEnterprise births (10+ employees) (%) 3.8 1.5Total Entrepreneurial Activity (TEA) (%) 8.0 6.6FDI net inflows (% GDP) 5.0 3.6Top R&D spending enterprises per 10 mln population 42.9 19.7Buyer sophistication (1 to 7 best) 4.7 3.7Governance and policy frameworkEase of starting a business (0 to 100 best) 82.7 76.9Basic-school entrepren. education and training (1 to 5 best) 2.0 1.9Govt. procurement of advanced tech products (1 to 7 best) 3.8 3.5Rule of law (-2.5 to 2.5 best) 1.8 1.2DemographyPopulation size (millions) 65.4 510.1Average annual population growth (%) 0.7 0.3Population density (inhabitants/km2) 268.5 117.1
SMEs innovating in-house
Innovative SMEs collaborating
Product/process innovators
Marketing/org. innovators
Non-R&D innovation exp.
Sales share new product inn.
Provisional CIS 2016 vs CIS 2014 (=100)
60 80 100 120 140 160 180 200
2010 2011 2012 2013 2014 2015 2016 20170
20406080
100120140160
114 112 112 110 116 119128 128
121
Relative to EU in 2010 Relative to EU in 2017
Dark green: normalised performance above 120% of EU; light green: normalised perfor-mance between 90% and 120% of EU, yellow: normalised performance between 50% and 90% of EU; orange: normalised performance below 50% of EU. Normalised perfor-mance uses the data after a possible imputation of missing data and transformation of the data.
Data in red show a decline in performance compared to 2010.
RIO country report: https://rio.jrc.ec.europa.eu/en/country-analysis/United%20KingdomEuropean Semester country report:https://ec.europa.eu/info/sites/info/files/2018-european- semester-country-report-united-kingdom-en.pdf
EU targets for 2020
Indicator 2013 Latest Target1
Gross domestic expenditure on R&D (% of GDP) 1.65 1.69 n/aTertiary educational attainment (% of population aged 30-34)
47.4 48.5 n/a
1 Sources are provided in the introduction to the country profiles.
The United Kingdom is an Innovation Leader. Over time, performance has in-creased relative to that of the EU in 2010.
Attractive research systems and Human resources are the strongest in-novation dimensions. Intellectual assets and Innovation-friendly envi-ronment are the weakest innovation dimensions.
Provisional CIS 2016 show improved performance for five indicators and reduced performance for one indicator.
Structural differences with the EU are shown in the table below. The turnover share of large enterprises and the value added share of for-eign-controlled enterprises are well above the EU average. The employ-ment share in manufacturing is well below the EU average.

78 European Innovation Scoreboard 2018
Iceland
Performance relative to EU 2010 in
Relative to EU
2017 in2010 2017 2017
SUMMARY INNOVATION INDEX 121.4 120.5 114.2Human resources 132.7 150.3 125.9New doctorate graduates 38.5 53.8 38.6Population with tertiary education 126.9 177.6 156.6Lifelong learning 253.1 234.4 229.6Attractive research systems 161.4 188.1 165.5International scientific co-publications 653.4 680.8 418.6Most cited publications 87.2 106.7 102.8Foreign doctorate students 97.8 134.4 121.4Innovation-friendly environment 264.6 264.6 197.8Broadband penetration N/A N/A N/AOpportunity-driven entrepreneurship 210.7 210.7 195.6Finance and support 124.3 122.3 113.6R&D expenditure in the public sector 110.6 108.9 112.8Venture capital expenditures N/A N/A N/AFirm investments 133.5 134.5 120.3R&D expenditure in the business sector 81.7 110.5 99.2Non-R&D innovation expenditures N/A N/A N/AEnterprises providing ICT training 171.4 142.9 125.0Innovators 149.1 123.6 143.6SMEs product/process innovations 181.9 139.4 170.5SMEs marketing/organisational innovations 120.4 110.5 133.3SMEs innovating in-house N/A N/A N/ALinkages 156.5 158.2 156.7Innovative SMEs collaborating with others 163.1 194.7 193.7Public-private co-publications 201.3 201.3 199.5Private co-funding of public R&D exp. 100.9 74.1 73.1Intellectual assets 60.2 57.8 57.3PCT patent applications 66.5 86.4 90.2Trademark applications 106.3 93.2 82.4Design applications 19.6 4.2 4.4Employment impacts 139.5 147.1 146.3Employment in knowledge-intensive activities 167.5 176.6 160.0Employment fast-growing enterprises N/A N/A N/ASales impacts 55.3 36.6 35.1Medium and high tech product exports 0.0 0.0 0.0Knowledge-intensive services exports 84.7 80.2 76.5Sales of new-to-market/firm innovations 86.4 28.9 28.6
IS EUPerformance and structure of the economyGDP per capita (PPS) 35,400 28,600Average annual GDP growth (%) 5.5 2.2Employment share Manufacturing (NACE C) (%) 10.5 15.5
of which High and Medium high-tech (%) 15.8 37.2Employment share Services (NACE G-N) (%) 44.0 41.6
of which Knowledge-intensive services (%) 39.4 35.0Turnover share SMEs (%) n/a 38.0Turnover share large enterprises (%) n/a 44.4Foreign-controlled enterprises – share of value added (%) n/a 12.5Business and entrepreneurshipEnterprise births (10+ employees) (%) n/a 1.5Total Entrepreneurial Activity (TEA) (%) n/a 6.6FDI net inflows (% GDP) 1.8 3.6Top R&D spending enterprises per 10 mln population 30.4 19.7Buyer sophistication (1 to 7 best) 4.1 3.7Governance and policy frameworkEase of starting a business (0 to 100 best) 78.8 76.9Basic-school entrepren. education and training (1 to 5 best) n/a 1.9Govt. procurement of advanced tech products (1 to 7 best) 3.6 3.5Rule of law (-2.5 to 2.5 best) 1.6 1.2DemographyPopulation size (millions) 0.3 510.1Average annual population growth (%) 1.4 0.3Population density (inhabitants/km2) 3.3 117.1
2010 2011 2012 2013 2014 2015 2016 20170
20406080
100120140160
121 123 127 126 125 126 121 120
Relative to EU in 2010 Relative to EU in 2017
114
RIO country report: https://rio.jrc.ec.europa.eu/en/country-analysis/Iceland
Dark green: normalised performance above 120% of EU; light green: normalised perfor-mance between 90% and 120% of EU, yellow: normalised performance between 50% and 90% of EU; orange: normalised performance below 50% of EU. Normalised perfor-mance uses the data after a possible imputation of missing data and transformation of the data.
Data in red show a decline in performance compared to 2010.
Iceland is a Strong Innovator. Over time, performance has remained the same relative to that of the EU in 2010.
Innovation-friendly environment and Attractive research systems are the strongest innovation dimensions. Sales impacts and Intellectual as-sets are the weakest innovation dimensions.
For Iceland, fast-track CIS 2016 data are not available.
Structural differences with the EU are shown in the table below. GDP per capita is well above the EU average. The employment shares in manufacturing and in high and medium high-tech manufacturing are well below the EU average.

79European Innovation Scoreboard 2018
Israel
Performance relative to EU 2010 in
Relative to EU
2017 in2010 2017 2017
SUMMARY INNOVATION INDEX 117.6 113.1 107.2Human resources 93.9 105.1 88.1New doctorate graduates 87.8 98.2 70.5Population with tertiary education N/A N/A N/ALifelong learning N/A N/A N/AAttractive research systems 117.2 130.6 115.0International scientific co-publications 235.4 297.4 182.8Most cited publications 94.9 97.4 93.8Foreign doctorate students N/A N/A N/AInnovation-friendly environment 97.9 112.3 83.9Broadband penetration N/A N/A N/AOpportunity-driven entrepreneurship 77.9 89.4 83.0Finance and support 49.9 45.6 42.3R&D expenditure in the public sector 83.2 73.8 76.5Venture capital expenditures 7.1 9.3 7.6Firm investments 243.9 243.9 218.2R&D expenditure in the business sector 222.3 222.3 199.6Non-R&D innovation expenditures N/A N/A N/AEnterprises providing ICT training N/A N/A N/AInnovators 116.0 74.6 86.7SMEs product/process innovations 82.2 44.3 54.2SMEs marketing/organisational innovations 170.0 116.8 141.0SMEs innovating in-house 93.4 60.6 64.9Linkages 158.9 141.2 139.9Innovative SMEs collaborating with others 159.5 117.3 116.7Public-private co-publications 102.4 91.1 90.3Private co-funding of public R&D exp. 220.3 220.3 217.2Intellectual assets 89.6 103.2 102.3PCT patent applications 223.7 223.7 233.5Trademark applications 15.5 51.9 45.9Design applications 19.5 28.8 29.9Employment impacts 186.1 186.1 185.0Employment in knowledge-intensive activities 223.4 223.4 202.4Employment fast-growing enterprises N/A N/A N/ASales impacts 85.5 95.9 92.1Medium and high tech product exports 96.7 102.1 96.4Knowledge-intensive services exports 82.6 97.7 93.1Sales of new-to-market/firm innovations 75.7 86.5 85.6
IL EUPerformance and structure of the economyGDP per capita (PPS) 26,200 28,600Average annual GDP growth (%) 3.1 2.2Employment share Manufacturing (NACE C) (%) 10.0 15.5
of which High and Medium high-tech (%) n/a 37.2Employment share Services (NACE G-N) (%) 44.4 41.6
of which Knowledge-intensive services (%) n/a 35.0Turnover share SMEs (%) n/a 38.0Turnover share large enterprises (%) n/a 44.4Foreign-controlled enterprises – share of value added (%) n/a 12.5Business and entrepreneurshipEnterprise births (10+ employees) (%) n/a 1.5Total Entrepreneurial Activity (TEA) (%) 12.0 6.6FDI net inflows (% GDP) 3.2 3.6Top R&D spending enterprises per 10 mln population 27.4 19.7Buyer sophistication (1 to 7 best) 4.1 3.7Governance and policy frameworkEase of starting a business (0 to 100 best) 71.6 76.9Basic-school entrepren. education and training (1 to 5 best) 1.9 1.9Govt. procurement of advanced tech products (1 to 7 best) 4.4 3.5Rule of law (-2.5 to 2.5 best) 1.1 1.2DemographyPopulation size (millions) 8.2 510.1Average annual population growth (%) 1.1 0.3Population density (inhabitants/km2) 379.8 117.1
2010 2011 2012 2013 2014 2015 2016 20170
20406080
100120140160
118 118 119 120112 114 113 113
Relative to EU in 2010 Relative to EU in 2017
107
Dark green: normalised performance above 120% of EU; light green: normalised perfor-mance between 90% and 120% of EU, yellow: normalised performance between 50% and 90% of EU; orange: normalised performance below 50% of EU. Normalised perfor-mance uses the data after a possible imputation of missing data and transformation of the data.
Data in red show a decline in performance compared to 2010.
RIO country report: https://rio.jrc.ec.europa.eu/en/country-analysis/Israel
Israel is a Strong Innovator. Over time, performance has declined relative to that of the EU in 2010.
Firm investments and Employment impacts are the strongest innovation dimensions. Finance and support and Innovation-friendly environment are the weakest innovation dimensions.
Structural differences with the EU are shown in the table below. The employment share in manufacturing is well below the EU average.

80 European Innovation Scoreboard 2018
Former Yugoslav Republic of Macedonia
Performance relative to EU 2010 in
Relative to EU
2017 in2010 2017 2017
SUMMARY INNOVATION INDEX 34.3 46.4 44.0Human resources 24.0 42.8 35.8New doctorate graduates 15.4 42.6 30.6Population with tertiary education 32.1 68.7 60.5Lifelong learning 25.0 12.5 12.2Attractive research systems 6.1 76.2 67.1International scientific co-publications 11.8 36.2 22.2Most cited publications 5.6 50.8 48.9Foreign doctorate students 4.7 126.3 114.0Innovation-friendly environment 33.1 53.7 40.1Broadband penetration 88.9 122.2 68.8Opportunity-driven entrepreneurship 0.0 13.1 12.2Finance and support 0.0 32.8 30.5R&D expenditure in the public sector 0.0 29.2 30.3Venture capital expenditures N/A N/A N/AFirm investments 61.0 69.7 62.4R&D expenditure in the business sector 1.2 4.8 4.3Non-R&D innovation expenditures 132.7 132.7 121.4Enterprises providing ICT training 64.3 85.7 75.0Innovators 78.5 55.0 63.9SMEs product/process innovations 117.5 59.0 72.2SMEs marketing/organisational innovations 68.9 58.8 71.0SMEs innovating in-house 51.4 47.3 50.7Linkages 49.4 44.1 43.7Innovative SMEs collaborating with others 84.2 59.0 58.6Public-private co-publications 15.6 29.0 28.7Private co-funding of public R&D exp. N/A N/A N/AIntellectual assets 5.8 14.3 14.2PCT patent applications 5.3 2.2 2.3Trademark applications 13.2 47.1 41.6Design applications 0.6 1.0 1.0Employment impacts 16.2 6.5 6.5Employment in knowledge-intensive activities 19.5 7.8 7.1Employment fast-growing enterprises N/A N/A N/ASales impacts 31.6 46.3 44.5Medium and high tech product exports 44.5 114.3 107.9Knowledge-intensive services exports 31.7 15.9 15.1Sales of new-to-market/firm innovations 16.4 1.6 1.5
FYROM EUPerformance and structure of the economyGDP per capita (PPS) 10,100 28,600Average annual GDP growth (%) 1.5 2.2Employment share Manufacturing (NACE C) (%) 19.3 15.5
of which High and Medium high-tech (%) n/a 37.2Employment share Services (NACE G-N) (%) 30.3 41.6
of which Knowledge-intensive services (%) n/a 35.0Turnover share SMEs (%) n/a 38.0Turnover share large enterprises (%) n/a 44.4Foreign-controlled enterprises – share of value added (%) n/a 12.5Business and entrepreneurshipEnterprise births (10+ employees) (%) n/a 1.5Total Entrepreneurial Activity (TEA) (%) n/a 6.6FDI net inflows (% GDP) n/a 3.6Top R&D spending enterprises per 10 mln population 0.0 19.7Buyer sophistication (1 to 7 best) 1.8 3.7Governance and policy frameworkEase of starting a business (0 to 100 best) 80.0 76.9Basic-school entrepren. education and training (1 to 5 best) n/a 1.9Govt. procurement of advanced tech products (1 to 7 best) 3.9 3.5Rule of law (-2.5 to 2.5 best) n/a 1.2DemographyPopulation size (millions) 2.1 510.1Average annual population growth (%) 0.1 0.3Population density (inhabitants/km2) 82.3 117.1
2010 2011 2012 2013 2014 2015 2016 20170
20406080
100120140160
34 37 37 40 41 43 45 46
Relative to EU in 2010 Relative to EU in 2017
44
Dark green: normalised performance above 120% of EU; light green: normalised perfor-mance between 90% and 120% of EU, yellow: normalised performance between 50% and 90% of EU; orange: normalised performance below 50% of EU. Normalised perfor-mance uses the data after a possible imputation of missing data and transformation of the data.
Data in red show a decline in performance compared to 2010.
The Former Yugoslav Republic of Mace-donia is a Modest Innovator. Over time, performance has increased relative to that of the EU in 2010.
Attractive research systems and Innovators are the strongest innovation dimensions. Sales impacts and Intellectual assets are the weakest inno-vation dimensions
For the Former Yugoslav Republic of Macedonia, fast-track CIS 2016 data are not available.
Structural differences with the EU are shown in the table below. The employment share in manufacturing is well above the EU average. GDP per capita and the employment share in services are well below the EU average.

81European Innovation Scoreboard 2018
Norway
Performance relative to EU 2010 in
Relative to EU
2017 in2010 2017 2017
SUMMARY INNOVATION INDEX 99.9 119.3 113.1Human resources 162.3 171.1 143.4New doctorate graduates 115.4 139.3 99.9Population with tertiary education 197.0 182.8 161.2Lifelong learning 178.1 195.8 191.8Attractive research systems 150.8 166.4 146.4International scientific co-publications 371.5 634.9 390.3Most cited publications 116.6 105.7 101.8Foreign doctorate students 123.6 91.6 82.7Innovation-friendly environment 141.5 192.7 144.0Broadband penetration 144.4 233.3 131.3Opportunity-driven entrepreneurship 139.7 168.6 156.5Finance and support 114.8 147.0 136.5R&D expenditure in the public sector 119.5 140.7 145.9Venture capital expenditures 108.9 155.0 127.0Firm investments 108.3 139.6 124.9R&D expenditure in the business sector 73.8 90.4 81.2Non-R&D innovation expenditures 0.0 87.2 79.8Enterprises providing ICT training 235.7 235.7 206.3Innovators 73.4 119.7 139.1SMEs product/process innovations 73.2 125.5 153.5SMEs marketing/organisational innovations 69.0 111.2 134.3SMEs innovating in-house 78.0 122.8 131.6Linkages 124.1 137.5 136.2Innovative SMEs collaborating with others 119.0 178.9 178.0Public-private co-publications 148.8 143.0 141.7Private co-funding of public R&D exp. 102.1 89.6 88.4Intellectual assets 46.5 45.2 44.8PCT patent applications 77.6 72.2 75.4Trademark applications 44.6 56.7 50.1Design applications 18.7 11.3 11.7Employment impacts 95.2 95.4 94.9Employment in knowledge-intensive activities 118.2 126.0 114.1Employment fast-growing enterprises 78.7 73.6 78.7Sales impacts 45.8 51.9 49.8Medium and high tech product exports 0.0 0.0 0.0Knowledge-intensive services exports 118.8 123.3 117.6Sales of new-to-market/firm innovations 14.7 29.8 29.5
NO EUPerformance and structure of the economyGDP per capita (PPS) 46,200 28,600Average annual GDP growth (%) 1.5 2.2Employment share Manufacturing (NACE C) (%) 8.5 15.5
of which High and Medium high-tech (%) 34.6 37.2Employment share Services (NACE G-N) (%) 38.7 41.6
of which Knowledge-intensive services (%) 38.7 35.0Turnover share SMEs (%) 38.2 38.0Turnover share large enterprises (%) 39.2 44.4Foreign-controlled enterprises – share of value added (%) 16.1 12.5Business and entrepreneurshipEnterprise births (10+ employees) (%) 0.8 1.5Total Entrepreneurial Activity (TEA) (%) 5.7 6.6FDI net inflows (% GDP) -0.7 3.6Top R&D spending enterprises per 10 mln population 22.0 19.7Buyer sophistication (1 to 7 best) 4.5 3.7Governance and policy frameworkEase of starting a business (0 to 100 best) 82.6 76.9Basic-school entrepren. education and training (1 to 5 best) 2.4 1.9Govt. procurement of advanced tech products (1 to 7 best) 4.1 3.5Rule of law (-2.5 to 2.5 best) 2.0 1.2DemographyPopulation size (millions) 5.2 510.1Average annual population growth (%) 0.9 0.3Population density (inhabitants/km2) 17.0 117.1
SMEs innovating in-house
Innovative SMEs collaborating
Product/process innovators
Marketing/org. innovators
Non-R&D innovation exp.
Sales share new product inn.
Provisional CIS 2016 vs CIS 2014 (=100)
90 100 110 120 130 140 150
2010 2011 2012 2013 2014 2015 2016 20170
20406080
100120140160
100 103 101 102 100 102120 119
Relative to EU in 2010 Relative to EU in 2017
113
RIO country report: https://rio.jrc.ec.europa.eu/en/country-analysis/Norway
Dark green: normalised performance above 120% of EU; light green: normalised perfor-mance between 90% and 120% of EU, yellow: normalised performance between 50% and 90% of EU; orange: normalised performance below 50% of EU. Normalised perfor-mance uses the data after a possible imputation of missing data and transformation of the data.
Data in red show a decline in performance compared to 2010.
Norway is a Strong Innovator. Over time, performance has increased relative to that of the EU in 2010.
Attractive research systems, Innovation-friendly environment, and Hu-man resources are the strongest innovation dimensions. Intellectual as-sets and Sales impacts are the weakest innovation dimensions.
Provisional CIS 2016 show improved performance for all six indica-tors.
Structural differences with the EU are shown in the table below. GDP per capita and the value added share of foreign-controlled enter-prises are well above the EU average. The employment share in manu-facturing is well below the EU average.

82 European Innovation Scoreboard 2018
Serbia
Performance relative to EU 2010 in
Relative to EU
2017 in2010 2017 2017
SUMMARY INNOVATION INDEX 56.9 70.1 66.5Human resources 28.0 76.5 64.1New doctorate graduates 26.2 71.5 51.3Population with tertiary education N/A N/A N/ALifelong learning N/A N/A N/AAttractive research systems 30.0 37.2 32.7International scientific co-publications 46.3 106.0 65.2Most cited publications 32.9 27.7 26.7Foreign doctorate students 20.2 27.0 24.4Innovation-friendly environment 24.8 24.8 18.5Broadband penetration 33.3 33.3 18.8Opportunity-driven entrepreneurship N/A N/A N/AFinance and support 67.3 40.6 37.7R&D expenditure in the public sector 103.9 69.9 72.5Venture capital expenditures 20.4 3.0 2.4Firm investments 78.0 132.3 118.3R&D expenditure in the business sector 6.9 24.9 22.3Non-R&D innovation expenditures 116.1 280.8 256.8Enterprises providing ICT training 121.4 121.4 106.3Innovators 47.7 72.3 84.1SMEs product/process innovations 27.7 70.5 86.2SMEs marketing/organisational innovations 25.6 75.9 91.7SMEs innovating in-house 89.0 70.4 75.4Linkages 96.6 94.9 94.0Innovative SMEs collaborating with others 23.1 37.3 37.1Public-private co-publications 51.6 33.6 33.3Private co-funding of public R&D exp. 220.3 220.3 217.2Intellectual assets 27.2 24.4 24.2PCT patent applications N/A N/A N/ATrademark applications 64.7 54.8 48.5Design applications 0.0 2.6 2.7Employment impacts 62.8 94.0 93.5Employment in knowledge-intensive activities 75.5 112.9 102.2Employment fast-growing enterprises N/A N/A N/ASales impacts 50.4 60.9 58.5Medium and high tech product exports 33.4 72.4 68.4Knowledge-intensive services exports 52.7 60.8 58.0Sales of new-to-market/firm innovations 67.9 47.4 46.9
RS EUPerformance and structure of the economyGDP per capita (PPS) 10,400 28,600Average annual GDP growth (%) 2.3 2.2Employment share Manufacturing (NACE C) (%) 16.6 15.5
of which High and Medium high-tech (%) n/a 37.2Employment share Services (NACE G-N) (%) 31.3 41.6
of which Knowledge-intensive services (%) n/a 35.0Turnover share SMEs (%) n/a 38.0Turnover share large enterprises (%) n/a 44.4Foreign-controlled enterprises – share of value added (%) n/a 12.5Business and entrepreneurshipEnterprise births (10+ employees) (%) n/a 1.5Total Entrepreneurial Activity (TEA) (%) n/a 6.6FDI net inflows (% GDP) 5.6 3.6Top R&D spending enterprises per 10 mln population 0.0 19.7Buyer sophistication (1 to 7 best) 2.3 3.7Governance and policy frameworkEase of starting a business (0 to 100 best) 69.3 76.9Basic-school entrepren. education and training (1 to 5 best) n/a 1.9Govt. procurement of advanced tech products (1 to 7 best) 2.8 3.5Rule of law (-2.5 to 2.5 best) -0.1 1.2DemographyPopulation size (millions) 7.1 510.1Average annual population growth (%) -0.5 0.3Population density (inhabitants/km2) 81.5 117.1
SMEs innovating in-house
Innovative SMEs collaborating
Product/process innovators
Marketing/org. innovators
Non-R&D innovation exp.
Sales share new product inn.
Provisional CIS 2016 vs CIS 2014 (=100)
0 100 200 300 400 500 600 700
2010 2011 2012 2013 2014 2015 2016 20170
20406080
100120140160
57 5668 71 74 75 71 70
Relative to EU in 2010 Relative to EU in 2017
66
Dark green: normalised performance above 120% of EU; light green: normalised perfor-mance between 90% and 120% of EU, yellow: normalised performance between 50% and 90% of EU; orange: normalised performance below 50% of EU. Normalised perfor-mance uses the data after a possible imputation of missing data and transformation of the data.
Data in red show a decline in performance compared to 2010.
Serbia is a Moderate Innovator. Over time, performance has increased relative to that of the EU in 2010.
Firm investments, Linkages, and Employment impacts are the strongest innovation dimensions. Innovation-friendly environment and Intellectual assets are the weakest innovation dimensions.
Provisional CIS 2016 data show improved performance for four in-dicators and reduced performance for two indicators.
Structural differences with the EU are shown in the table below. GDP per capita and the employment share in services are well below the EU average.

83European Innovation Scoreboard 2018
Switzerland
Performance relative to EU 2010 in
Relative to EU
2017 in2010 2017 2017
SUMMARY INNOVATION INDEX 158.9 168.9 160.1Human resources 221.1 236.4 198.1New doctorate graduates 235.9 235.9 169.2Population with tertiary education 152.2 196.3 173.0Lifelong learning 284.4 284.4 278.6Attractive research systems 235.2 251.6 221.4International scientific co-publications 647.1 680.8 418.6Most cited publications 160.2 160.2 154.2Foreign doctorate students 200.5 234.3 211.6Innovation-friendly environment 162.4 193.9 144.9Broadband penetration n/a n/a n/aOpportunity-driven entrepreneurship 129.3 154.4 143.3Finance and support 98.3 126.4 117.4R&D expenditure in the public sector 105.3 137.2 142.2Venture capital expenditures 89.3 112.5 92.2Firm investments 183.5 234.8 210.0R&D expenditure in the business sector 195.2 205.7 184.7Non-R&D innovation expenditures 176.1 280.8 256.8Enterprises providing ICT training n/a n/a n/aInnovators 147.0 160.7 186.8SMEs product/process innovations 181.9 156.0 190.7SMEs marketing/organisational innovations 170.0 170.0 205.2SMEs innovating in-house 90.7 155.9 167.1Linkages 128.5 142.1 140.8Innovative SMEs collaborating with others 82.2 75.7 75.3Public-private co-publications 201.3 201.3 199.5Private co-funding of public R&D exp. 95.8 144.6 142.6Intellectual assets 184.4 164.7 163.3PCT patent applications 193.1 175.4 183.1Trademark applications 224.2 206.8 182.9Design applications 146.3 123.0 127.5Employment impacts 110.0 118.1 117.4Employment in knowledge-intensive activities 184.4 203.9 184.7Employment fast-growing enterprises 56.9 56.9 60.8Sales impacts 129.7 114.6 110.0Medium and high tech product exports 123.6 85.7 80.9Knowledge-intensive services exports 97.5 102.4 97.6Sales of new-to-market/firm innovations 174.5 162.9 161.1
CH EUPerformance and structure of the economyGDP per capita (PPS) 46,900 28,600Average annual GDP growth (%) 1.2 2.2Employment share Manufacturing (NACE C) (%) 13.1 15.5
of which High and Medium high-tech (%) 44.5 37.2Employment share Services (NACE G-N) (%) 45.1 41.6
of which Knowledge-intensive services (%) 45.3 35.0Turnover share SMEs (%) n/a 38.0Turnover share large enterprises (%) n/a 44.4Foreign-controlled enterprises – share of value added (%) n/a 12.5Business and entrepreneurshipEnterprise births (10+ employees) (%) 0.2 1.5Total Entrepreneurial Activity (TEA) (%) 8.0 6.6FDI net inflows (% GDP) 4.9 3.6Top R&D spending enterprises per 10 mln population 66.8 19.7Buyer sophistication (1 to 7 best) 5.0 3.7Governance and policy frameworkEase of starting a business (0 to 100 best) 76.1 76.9Basic-school entrepren. education and training (1 to 5 best) 2.5 1.9Govt. procurement of advanced tech products (1 to 7 best) 3.9 3.5Rule of law (-2.5 to 2.5 best) 2.0 1.2DemographyPopulation size (millions) 8.3 510.1Average annual population growth (%) 1.1 0.3Population density (inhabitants/km2) 207.3 117.1
2010 2011 2012 2013 2014 2015 2016 20170
20406080
100120140160180 159 160 159 158 160 164 167 169
Relative to EU in 2010 Relative to EU in 2017
160
RIO country report: https://rio.jrc.ec.europa.eu/en/country-analysis/Switzerland
Dark green: normalised performance above 120% of EU; light green: normalised perfor-mance between 90% and 120% of EU, yellow: normalised performance between 50% and 90% of EU; orange: normalised performance below 50% of EU. Normalised perfor-mance uses the data after a possible imputation of missing data and transformation of the data.
Data in red show a decline in performance compared to 2010.
Switzerland is an Innovation Leader. Over time, performance has increased relative to that of the EU in 2010.
Attractive research systems and Firm investments are the strongest in-novation dimensions. Sales impacts, Finance and support, and Employ-ment impacts are the weakest innovation dimensions.
For Switzerland, fast-track CIS 2016 data are not available.
Structural differences with the EU are shown in the table below. GDP per capita and the employment share in knowledge-intensive ser-vices are well above the EU average.

84 European Innovation Scoreboard 2018
Turkey
Performance relative to EU 2010 in
Relative to EU
2017 in2010 2017 2017
SUMMARY INNOVATION INDEX 44.8 59.9 56.8Human resources 16.9 37.5 31.4New doctorate graduates 7.7 15.8 11.4Population with tertiary education 0.0 50.0 44.1Lifelong learning 47.9 49.0 48.0Attractive research systems 36.7 43.3 38.1International scientific co-publications 85.2 154.0 94.7Most cited publications 42.9 34.6 33.3Foreign doctorate students 11.3 17.6 15.9Innovation-friendly environment 85.4 112.5 84.1Broadband penetration 155.6 188.9 106.3Opportunity-driven entrepreneurship 43.8 67.3 62.5Finance and support 64.6 56.7 52.7R&D expenditure in the public sector 57.5 50.4 52.3Venture capital expenditures N/A N/A N/AFirm investments 21.3 140.8 126.0R&D expenditure in the business sector 24.0 34.5 31.0Non-R&D innovation expenditures 18.8 280.8 256.8Enterprises providing ICT training N/A N/A N/AInnovators 101.1 83.8 97.5SMEs product/process innovations 75.8 84.6 103.4SMEs marketing/organisational innovations 135.2 102.0 123.1SMEs innovating in-house 90.6 64.8 69.5Linkages 57.7 64.3 63.7Innovative SMEs collaborating with others 40.9 51.1 50.9Public-private co-publications 23.1 22.4 22.2Private co-funding of public R&D exp. 112.5 123.4 121.7Intellectual assets 5.8 9.0 9.0PCT patent applications 11.8 19.7 20.6Trademark applications 0.0 4.6 4.1Design applications 4.5 2.3 2.4Employment impacts 0.0 10.8 10.8Employment in knowledge-intensive activities 0.0 13.0 11.8Employment fast-growing enterprises N/A N/A N/ASales impacts 36.8 55.9 53.6Medium and high tech product exports 51.8 68.1 64.3Knowledge-intensive services exports 16.9 28.9 27.6Sales of new-to-market/firm innovations 42.4 72.8 72.0
TR EUPerformance and structure of the economyGDP per capita (PPS) 15,700 28,600Average annual GDP growth (%) 4.6 2.2Employment share Manufacturing (NACE C) (%) 19.3 15.5
of which High and Medium high-tech (%) 13.5 37.2Employment share Services (NACE G-N) (%) 30.3 41.6
of which Knowledge-intensive services (%) 21.0 35.0Turnover share SMEs (%) n/a 38.0Turnover share large enterprises (%) n/a 44.4Foreign-controlled enterprises – share of value added (%) n/a 12.5Business and entrepreneurshipEnterprise births (10+ employees) (%) 5.4 1.5Total Entrepreneurial Activity (TEA) (%) 16.1 6.6FDI net inflows (% GDP) 1.6 3.6Top R&D spending enterprises per 10 mln population 0.9 19.7Buyer sophistication (1 to 7 best) 3.5 3.7Governance and policy frameworkEase of starting a business (0 to 100 best) 68.2 76.9Basic-school entrepren. education and training (1 to 5 best) 1.6 1.9Govt. procurement of advanced tech products (1 to 7 best) 3.7 3.5Rule of law (-2.5 to 2.5 best) -0.1 1.2DemographyPopulation size (millions) 78.8 510.1Average annual population growth (%) 1.4 0.3Population density (inhabitants/km2) 101.8 117.1
SMEs innovating in-house n/a
Innovative SMEs collaborating
Product/process innovators
Marketing/org. innovators
Non-R&D innovation exp. n/a
Sales share new product inn. n/a
Provisional CIS 2016 vs CIS 2014 (=100)
100 110 120 130 140 150 160 1702010 2011 2012 2013 2014 2015 2016 20170
20406080
100120140160
45 47 45 4658 58 58 60
57
Relative to EU in 2010 Relative to EU in 2017
Dark green: normalised performance above 120% of EU; light green: normalised perfor-mance between 90% and 120% of EU, yellow: normalised performance between 50% and 90% of EU; orange: normalised performance below 50% of EU. Normalised perfor-mance uses the data after a possible imputation of missing data and transformation of the data.
Data in red show a decline in performance compared to 2010.
RIO country report: https://rio.jrc.ec.europa.eu/en/country-analysis/Turkey
Turkey is a Moderate Innovator. Over time, performance has increased relative to that of the EU in 2010.
Firm investments and Innovators are the strongest innovation dimen-sions. Intellectual assets and Employment impacts are the weakest in-novation dimensions.
Provisional CIS 2016 data show improved performance for three indicators. For SMEs innovating in-house a comparison with 2014 is not possible due to missing 2014 data. There are no fast-track data for the other two indicators.
Structural differences with the EU are shown in the table below. The employment share in manufacturing is well above the EU average. The employment share in high and medium high-tech manufacturing and the employment shares in services and in knowledge-intensive services are well below the EU average.

85European Innovation Scoreboard 2018
Ukraine
Performance relative to EU 2010 in
Relative to EU
2017 in2010 2017 2017
SUMMARY INNOVATION INDEX 31.1 29.3 27.8Human resources 65.8 131.6 110.3New doctorate graduates 61.5 123.1 88.3Population with tertiary education N/A N/A N/ALifelong learning N/A N/A N/AAttractive research systems 18.4 22.3 19.6International scientific co-publications 0.0 5.3 3.2Most cited publications 18.5 21.6 20.8Foreign doctorate students 24.5 29.2 26.4Innovation-friendly environment 5.7 5.5 4.1Broadband penetration 7.7 7.4 4.2Opportunity-driven entrepreneurship N/A N/A N/AFinance and support 24.5 16.7 15.5R&D expenditure in the public sector 41.1 14.1 14.6Venture capital expenditures 3.2 20.0 16.4Firm investments 70.7 44.8 40.1R&D expenditure in the business sector 37.0 29.5 26.4Non-R&D innovation expenditures 116.1 66.1 60.4Enterprises providing ICT training N/A N/A N/AInnovators 18.2 16.0 18.6SMEs product/process innovations 0.0 0.0 0.0SMEs marketing/organisational innovations 2.4 0.0 0.0SMEs innovating in-house 51.4 47.3 50.7Linkages 12.5 9.6 9.5Innovative SMEs collaborating with others 5.0 3.0 3.0Public-private co-publications 19.1 15.4 15.3Private co-funding of public R&D exp. N/A N/A N/AIntellectual assets 7.9 13.4 13.3PCT patent applications 7.6 14.8 15.5Trademark applications 18.5 18.1 16.0Design applications 0.1 8.5 8.8Employment impacts 69.2 77.9 77.5Employment in knowledge-intensive activities 83.1 93.5 84.7Employment fast-growing enterprises N/A N/A N/ASales impacts 45.4 32.8 31.5Medium and high tech product exports 59.6 28.3 26.7Knowledge-intensive services exports 55.8 64.0 61.1Sales of new-to-market/firm innovations 16.4 1.6 1.5
UA EUPerformance and structure of the economyGDP per capita (PPS) 6,600 28,600Average annual GDP growth (%) -7.9 2.2Employment share Manufacturing (NACE C) (%) 12.4 15.5
of which High and Medium high-tech (%) n/a 37.2Employment share Services (NACE G-N) (%) 33.8 41.6
of which Knowledge-intensive services (%) n/a 35.0Turnover share SMEs (%) n/a 38.0Turnover share large enterprises (%) n/a 44.4Foreign-controlled enterprises – share of value added (%) n/a 12.5Business and entrepreneurshipEnterprise births (10+ employees) (%) n/a 1.5Total Entrepreneurial Activity (TEA) (%) n/a 6.6FDI net inflows (% GDP) 2.6 3.6Top R&D spending enterprises per 10 mln population 0.0 19.7Buyer sophistication (1 to 7 best) 3.2 3.7Governance and policy frameworkEase of starting a business (0 to 100 best) 62.8 76.9Basic-school entrepren. education and training (1 to 5 best) n/a 1.9Govt. procurement of advanced tech products (1 to 7 best) 3.0 3.5Rule of law (-2.5 to 2.5 best) -0.8 1.2DemographyPopulation size (millions) 42.7 510.1Average annual population growth (%) -0.4 0.3Population density (inhabitants/km2) 78.2 117.1
2010 2011 2012 2013 2014 2015 2016 20170
20406080
100120140160
31 31 29 29 28 30 26 29
28
Relative to EU in 2010 Relative to EU in 2017
Dark green: normalised performance above 120% of EU; light green: normalised perfor-mance between 90% and 120% of EU, yellow: normalised performance between 50% and 90% of EU; orange: normalised performance below 50% of EU. Normalised perfor-mance uses the data after a possible imputation of missing data and transformation of the data.
Data in red show a decline in performance compared to 2010.
Ukraine is a Modest Innovator. Over time, performance has declined relative to that of the EU in 2010.
Human resources and Employment impacts are the strongest innovation dimensions. Linkages and Innovation-friendly environment are the weakest innovation dimensions.
Structural differences with the EU are shown in the table below. GDP per capita is well below the EU average.

86 European Innovation Scoreboard 2018
8. European Innovation Scoreboard methodology
40 https://ec.europa.eu/docsroom/documents/29402.
The overall performance of each country’s innovation system has been summarised in a composite indicator, the Summary Innovation Index. Full details on the EIS methodology are available in the EIS 2018 Meth-odology Report40. The methodology used for calculating the Summary Innovation Index is explained below. “All countries” include all Member States and other European and neighbouring countries included in Sec-tion 5.1.
European benchmark
Step 1: Identifying and replacing outliers
Positive outliers are identified as those country scores which are higher than the mean across all countries plus twice the standard deviation. Negative outliers are identified as those country scores which are small-er than the mean across all countries minus twice the standard devia-tion. These outliers are replaced by the respective maximum and mini-mum values observed over all the years and all countries.
Step 2: Setting reference years
For each indicator, a reference year is identified based on data availabil-ity for all countries for which data availability is at least 75%. For most indicators, this reference year will be lagging one or two years behind the year to which the EIS refers (cf. Annex E).
Step 3: Imputing for missing values
Reference year data are then used for “2017”, etc. If data for a year-in-between are not available, missing values are replaced with the value for the previous year. If data are not available at the beginning of the time series, missing values are replaced with the next available year. The following examples clarify this step and show how ‘missing’ data are imputed. If data are missing for all years, no data will be imputed (the indicator will not contribute to the Summary Innovation Index).
Step 4: Determining Maximum and Minimum scores
The Maximum score is the highest score found for the eight-year period within all countries excluding positive outliers. Similarly, the Minimum score is the lowest score found for the eight-year period within all coun-tries excluding negative outliers.
Step 5: Transforming data if data are highly skewed
Most of the indicators are fractional indicators with values between 0% and 100%. Some indicators are unbound indicators, where values are not limited to an upper threshold. These indicators can be highly volatile and can have skewed data distributions (where most countries show low performance levels and a few countries show exceptionally high levels of performance). For these indicators where the degree of skewness across the full eight-year period is above one, data have been trans-formed using a square root transformation. For the following indicators data have been transformed: Opportunity-driven entrepreneurship, Pub-lic-private co-publications, Private co-funding of public R&D expendi-tures, and Trademark applications. A square root transformation means using the square root of the indicator value instead of the original value.
Step 6: Calculating re-scaled scores
Re-scaled scores of the country scores (after correcting for outliers and a possible transformation of the data) for all years are calculated by first subtracting the Minimum score and then dividing by the difference between the Maximum and Minimum score. The maximum re-scaled score is thus equal to 1, and the minimum re-scaled score is equal to 0. For positive and negative outliers, the re-scaled score is equal to 1 or 0, respectively.
Step 7: Calculating composite innovation indexes
For each year, a composite Summary Innovation Index is calculated as the unweighted average of the re-scaled scores for all indicators where all indicators receive the same weight (1/27 if data are available for all 27 indicators).
Step 8: Calculating relative to EU performance scores
Performance scores relative to the EU are then calculated as the SII of the respective country divided by the SII of the EU multiplied by 100. Relative performance scores are calculated for the full eight-year period compared to the performance of the EU in 2010 and for the latest year also to that of the EU in 2017. For the definition of the performance groups, only the performance scores relative to the EU in 2017 have been used.
Latest year missing “2017” “2016” “2015” “2014” “2013”Available data N/A 45 40 35 30Use most recent year 45 45 40 35 30
Year-in-between missing “2017” “2016” “2015” “2014” “2013”Available data 50 N/A 40 35 30Substitute with previous year 50 40 40 35 30
Beginning-of-period missing “2017” “2016” “2015” “2014” “2013”Available data 50 45 40 35 N/ASubstitute with next available year 50 45 40 35 35

87European Innovation Scoreboard 2018
International benchmark
The methodology for calculating average innovation performance for the EU and its major global competitors is the same as that used for calculating average innovation performance for the EU Member States but using a smaller set of countries and a smaller set of indicators.
Performance group membership
For determining performance group membership, the EIS uses the fol-lowing classification scheme:
• Innovation Leaders are all countries with a relative performance in 2017 more than 20% above the EU average in 2017;
• Strong Innovators are all countries with a relative performance in 2017 between 90% and 120% of the EU average in 2017;
• Moderate Innovators are all countries with a relative performance in 2017 between 50% and 90% of the EU average in 2017;
• Modest Innovators are all countries with a relative performance in 2017 below 50% of the EU average in 2017.

88 European Innovation Scoreboard 2018
Annex A: Country abbreviations
AT Austria IT Italy
AU Australia JP Japan
BE Belgium KR South Korea
BG Bulgaria LT Lithuania
BR Brazil LU Luxembourg
CA Canada LV Latvia
CH Switzerland MK Former Yugoslav Republic of Macedonia
CN China MT Malta
CY Cyprus NL Netherlands
CZ Czech Republic NO Norway
DE Germany PL Poland
DK Denmark PT Portugal
EL Greece RO Romania
EE Estonia RS Serbia
ES Spain RU Russia
FI Finland SA South Africa
FR France SE Sweden
HR Croatia SI Slovenia
HU Hungary SK Slovakia
IE Ireland TR Turkey
IL Israel UA Ukraine
IN India UK United Kingdom
IS Iceland US United States
Annex B: Performance per indicator
Available on the EIS website: https://ec.europa.eu/docsroom/documents/29403

89European Innovation Scoreboard 2018
EU28
BEBG
CZD
KD
EEE
IEEL
ESFR
HR
ITCY
LVLT
LUH
UM
T
FRAM
EWO
RK C
ON
DIT
ION
SH
uman
res
ourc
es1.
1.1
New
doc
tora
te g
radu
ates
2.0
1.9
1.5
1.7
3.2
2.8
1.1
2.6
1.1
2.6
1.7
1.2
1.5
0.6
0.7
0.9
1.3
1.0
0.7
1.1.
2 Po
pula
tion
com
plet
ed t
ertia
ry e
duca
tion
39.0
45.7
33.4
33.8
46.2
31.3
43.1
53.5
42.5
42.6
44.3
32.7
26.9
57.0
41.6
55.6
51.2
30.2
33.5
1.1.
3 Li
felo
ng le
arni
ng10
.98.
52.
39.
826
.88.
417
.28.
94.
59.
918
.72.
37.
96.
97.
55.
917
.26.
210
.1
Attr
acti
ve r
esea
rch
syst
ems
1.2.
1 In
tern
atio
nal s
cien
tific
co-p
ublic
atio
ns51
714
6822
775
523
4681
210
7812
4960
873
272
649
263
212
8331
545
117
1545
659
7
1.2.
2 Sc
ient
ific
publ
icat
ions
am
ong
top
10%
mos
t ci
ted
10.6
12.6
4.2
6.6
13.4
11.3
8.2
12.6
9.0
9.3
11.0
4.6
10.4
9.0
6.2
4.3
13.1
6.9
10.7
1.2.
3 Fo
reig
n do
ctor
ate
stud
ents
26.1
41.8
6.3
14.8
33.4
9.1
12.0
28.4
n/a
15.5
40.1
3.9
14.2
14.3
11.4
4.6
87.0
11.6
54.0
Inno
vati
on-f
rien
dly
envi
ronm
ent
1.3.
1 Br
oadb
and
pene
trat
ion
16.0
26.0
12.0
12.0
42.0
14.0
17.0
18.0
5.0
25.0
12.0
7.0
7.0
5.0
19.0
28.0
25.0
16.0
20.0
1.3.
2 O
ppor
tuni
ty-d
riven
ent
repr
eneu
rshi
p3.
31.
61.
02.
711
.14.
03.
42.
61.
51.
84.
61.
22.
61.
83.
02.
24.
82.
4n/
a
INV
ESTM
ENTS
Fina
nce
and
supp
ort
2.1.
1 R&
D e
xpen
ditu
re in
the
pub
lic s
ecto
r0.
700.
740.
210.
640.
970.
940.
610.
350.
570.
550.
780.
460.
500.
270.
330.
550.
600.
290.
23
2.1.
2 Ve
ntur
e ca
pita
l exp
endi
ture
s0.
116
0.10
70.
037
0.00
60.
064
0.06
90.
111
0.13
50.
001
0.10
20.
240
0.02
10.
055
0.07
50.
285
0.05
40.
352
0.07
90.
000
Firm
inve
stm
ents
2.2.
1 R&
D e
xpen
ditu
re in
the
bus
ines
s se
ctor
1.32
1.73
0.57
1.03
1.89
2.00
0.66
0.83
0.43
0.64
1.43
0.38
0.75
0.17
0.11
0.30
0.64
0.89
0.39
2.2.
2 N
on-R
&D
inno
vatio
n ex
pend
iture
s0.
760.
560.
740.
940.
291.
260.
850.
470.
760.
360.
501.
200.
570.
210.
582.
010.
130.
750.
36
2.2.
3 En
terp
rises
pro
vidi
ng IC
T tr
aini
ng21
.035
.09.
023
.027
.028
.013
.030
.012
.023
.019
.023
.013
.026
.010
.011
.028
.017
.028
.0
INN
OVA
TIO
N A
CTIV
ITIE
SIn
nova
tors
3.1.
1 SM
Es w
ith p
rodu
ct o
r pr
oces
s in
nova
tions
30.9
48.3
14.0
30.8
34.7
41.6
17.4
45.7
34.6
18.6
35.5
25.4
32.7
32.8
11.9
33.7
37.0
15.1
26.7
3.1.
2 SM
Es w
ith m
arke
ting
or o
rgan
isat
iona
l inn
ovat
ions
34.9
45.1
14.8
25.7
40.0
49.1
15.0
52.5
40.1
25.5
41.6
30.8
34.6
31.1
19.0
24.0
54.3
15.2
30.8
3.1.
3 SM
Es in
nova
ting
in-h
ouse
28.8
39.8
11.2
28.0
28.2
37.9
15.8
41.3
31.4
14.5
31.5
21.1
30.5
30.5
10.2
30.4
32.2
11.7
23.9
Link
ages
3.2.
1 In
nova
tive
SMEs
col
labo
ratin
g w
ith o
ther
s11
.228
.63.
110
.013
.210
.110
.813
.914
.86.
713
.26.
86.
711
.72.
815
.29.
26.
24.
2
3.2.
2 Pu
blic
-priv
ate
co-p
ublic
atio
ns40
.980
.03.
021
.016
2.8
62.4
10.6
45.4
10.5
21.1
42.8
17.3
22.2
21.1
1.0
3.9
25.4
29.6
0.0
3.2.
3 Pr
ivat
e co
-fun
ding
of
publ
ic R
&D
exp
endi
ture
s0.
050.
080.
020.
030.
030.
120.
040.
010.
040.
030.
040.
030.
010.
000.
050.
090.
010.
030.
00
Inte
llect
ual a
sset
s3.
3.1
PCT
pate
nt a
pplic
atio
ns3.
533.
160.
640.
936.
056.
111.
011.
800.
491.
453.
980.
612.
160.
820.
820.
811.
751.
341.
31
3.3.
2 Tr
adem
ark
appl
icat
ions
7.86
8.11
9.10
5.09
12.7
99.
5116
.55
5.08
4.92
8.99
6.04
4.00
8.46
43.1
57.
777.
3937
.70
4.15
40.8
8
3.3.
3 D
esig
n ap
plic
atio
ns4.
442.
725.
564.
077.
946.
725.
841.
091.
222.
972.
960.
906.
233.
671.
201.
717.
401.
1513
.05
IMPA
CTS
Empl
oym
ent
impa
cts
4.1.
1 Em
ploy
men
t in
kno
wle
dge-
inte
nsiv
e ac
tiviti
es14
.215
.610
.212
.915
.114
.813
.520
.612
.112
.514
.511
.613
.717
.012
.19.
722
.011
.618
.4
4.1.
2 Em
ploy
men
t fa
st-g
row
ing
firm
s in
nova
tive
sect
ors
4.8
2.7
6.6
6.5
4.5
4.6
3.2
7.1
n/a
4.8
4.1
3.5
3.1
0.1
5.2
2.1
4.6
8.7
6.1
Sale
s im
pact
s4.
2.1
Med
ium
& h
igh
tech
pro
duct
exp
orts
56.7
48.2
33.8
65.7
48.0
68.2
41.2
56.0
21.2
47.2
58.5
39.9
52.4
54.4
34.7
36.9
45.4
68.5
61.6
4.2.
2 Kn
owle
dge-
inte
nsiv
e se
rvic
es e
xpor
ts69
.268
.939
.043
.871
.774
.648
.694
.242
.233
.167
.619
.150
.970
.052
.422
.092
.649
.033
.9
4.2.
3 Sa
les
of n
ew-t
o-m
arke
t an
d ne
w-t
o-fir
m in
nova
tions
13.3
77.
604.
8014
.57
6.96
13.3
410
.49
18.0
712
.75
15.9
415
.02
4.91
10.0
64.
495.
318.
576.
5412
.47
4.12
Anne
x C:
Cur
rent
per
form
ance

90 European Innovation Scoreboard 2018
EU28
NL
ATPL
PTRO
SISK
FISE
UK
ISIL
MK
NO
RSCH
TRU
A
FRAM
EWO
RK C
ON
DIT
ION
SH
uman
res
ourc
es1.
1.1
New
doc
tora
te g
radu
ates
2.0
2.4
1.9
0.6
1.9
0.8
3.5
2.2
2.9
2.7
3.1
0.9
1.5
0.8
2.0
1.1
3.4
0.4
1.8
1.1.
2 Po
pula
tion
com
plet
ed t
ertia
ry e
duca
tion
39.0
46.6
40.3
43.6
34.0
25.6
44.5
35.1
40.3
47.4
47.3
47.6
n/a
33.0
48.3
n/a
50.1
30.5
n/a
1.1.
3 Li
felo
ng le
arni
ng10
.919
.115
.84.
09.
81.
112
.03.
427
.430
.414
.323
.6n/
a2.
319
.9n/
a31
.25.
8n/
a
Attr
acti
ve r
esea
rch
syst
ems
1.2.
1 In
tern
atio
nal s
cien
tific
co-p
ublic
atio
ns51
716
2813
7629
791
918
211
3543
916
5920
1912
2227
9990
815
118
8635
329
4649
261
1.2.
2 Sc
ient
ific
publ
icat
ions
am
ong
top
10%
mos
t ci
ted
10.6
14.6
11.1
5.1
9.0
4.8
8.6
6.2
10.8
12.1
15.0
10.8
10.0
6.1
10.7
4.1
15.3
4.7
3.6
1.2.
3 Fo
reig
n do
ctor
ate
stud
ents
26.1
40.1
28.3
2.0
25.6
3.8
9.7
9.1
21.1
34.7
42.9
31.6
n/a
29.7
21.6
6.5
54.9
4.3
7.0
Inno
vati
on-f
rien
dly
envi
ronm
ent
1.3.
1 Br
oadb
and
pene
trat
ion
16.0
27.0
13.0
13.0
32.0
17.0
16.0
12.0
32.0
39.0
13.0
n/a
n/a
11.0
21.0
3.0
n/a
17.0
0.7
1.3.
2 O
ppor
tuni
ty-d
riven
ent
repr
eneu
rshi
p3.
35.
93.
03.
72.
11.
22.
41.
36.
97.
83.
510
.02.
60.
66.
3n/
a5.
51.
9n/
a
INV
ESTM
ENTS
Fina
nce
and
supp
ort
2.1.
1 R&
D e
xpen
ditu
re in
the
pub
lic s
ecto
r0.
700.
870.
870.
320.
640.
210.
490.
390.
910.
980.
520.
770.
570.
320.
950.
550.
930.
440.
23
2.1.
2 Ve
ntur
e ca
pita
l exp
endi
ture
s0.
116
0.15
00.
060
0.03
60.
048
0.03
70.
006
0.01
40.
095
0.08
30.
173
n/a
0.00
9n/
a0.
148
0.00
30.
107
n/a
0.01
9
Firm
inve
stm
ents
2.2.
1 R&
D e
xpen
ditu
re in
the
bus
ines
s se
ctor
1.32
1.16
2.20
0.63
0.61
0.27
1.51
0.40
1.81
2.26
1.13
1.31
3.64
0.10
1.08
0.33
2.40
0.44
0.38
2.2.
2 N
on-R
&D
inno
vatio
n ex
pend
iture
s0.
760.
160.
471.
240.
640.
230.
810.
580.
321.
120.
67n/
an/
a0.
900.
631.
792.
012.
700.
50
2.2.
3 En
terp
rises
pro
vidi
ng IC
T tr
aini
ng21
.024
.031
.012
.021
.04.
027
.017
.038
.028
.026
.025
.0n/
a17
.040
.022
.0n/
an/
an/
a
INN
OVA
TIO
N A
CTIV
ITIE
SIn
nova
tors
3.1.
1 SM
Es w
ith p
rodu
ct o
r pr
oces
s in
nova
tions
30.9
42.9
40.7
13.3
42.1
4.9
32.6
16.7
44.1
40.4
32.6
44.3
22.2
25.6
41.1
28.3
48.1
31.5
7.4
3.1.
2 SM
Es w
ith m
arke
ting
or o
rgan
isat
iona
l inn
ovat
ions
34.9
32.5
46.1
11.4
37.8
8.8
33.2
22.4
37.3
35.1
45.4
43.0
44.9
27.8
43.3
32.9
62.0
40.5
10.5
3.1.
3 SM
Es in
nova
ting
in-h
ouse
28.8
35.0
35.0
8.3
25.6
4.5
26.1
13.9
38.3
35.1
19.0
n/a
21.6
18.7
35.2
23.8
42.5
22.5
18.7
Link
ages
3.2.
1 In
nova
tive
SMEs
col
labo
ratin
g w
ith o
ther
s11
.217
.520
.53.
57.
81.
813
.28.
416
.813
.524
.720
.612
.97.
119
.04.
98.
76.
31.
5
3.2.
2 Pu
blic
-priv
ate
co-p
ublic
atio
ns40
.999
.382
.35.
413
.23.
756
.110
.385
.413
0.6
65.1
183.
233
.33.
482
.24.
526
0.6
2.0
1.0
3.2.
3 Pr
ivat
e co
-fun
ding
of
publ
ic R
&D
exp
endi
ture
s0.
050.
080.
050.
020.
010.
030.
050.
040.
050.
040.
020.
030.
57n/
a0.
040.
190.
090.
07n/
a
Inte
llect
ual a
sset
s3.
3.1
PCT
pate
nt a
pplic
atio
ns3.
535.
824.
700.
690.
950.
221.
650.
517.
439.
083.
063.
199.
830.
082.
66n/
a6.
470.
730.
55
3.3.
2 Tr
adem
ark
appl
icat
ions
7.86
9.78
13.0
95.
338.
102.
6411
.09
4.49
12.3
011
.44
6.95
6.26
3.52
3.24
3.79
3.68
17.8
71.
341.
85
3.3.
3 D
esig
n ap
plic
atio
ns4.
444.
346.
985.
714.
041.
312.
971.
464.
114.
673.
070.
191.
320.
040.
520.
125.
660.
110.
39
IMPA
CTS
Empl
oym
ent
impa
cts
4.1.
1 Em
ploy
men
t in
kno
wle
dge-
inte
nsiv
e ac
tiviti
es14
.217
.115
.010
.310
.67.
713
.710
.616
.218
.518
.519
.326
.96.
315
.414
.421
.46.
712
.9
4.1.
2 Em
ploy
men
t fa
st-g
row
ing
firm
s in
nova
tive
sect
ors
4.8
4.8
1.9
5.8
5.0
2.6
3.2
7.7
2.8
5.5
6.4
n/a
n/a
n/a
4.0
n/a
3.2
n/a
n/a
Sale
s im
pact
s4.
2.1
Med
ium
& h
igh
tech
pro
duct
exp
orts
56.7
49.7
58.0
49.0
38.5
55.8
57.0
66.4
44.7
54.5
57.1
10.2
55.3
59.6
14.3
44.9
49.6
43.4
29.4
4.2.
2 Kn
owle
dge-
inte
nsiv
e se
rvic
es e
xpor
ts69
.277
.743
.140
.241
.146
.236
.033
.270
.373
.271
.757
.165
.725
.578
.347
.668
.031
.949
.2
4.2.
3 Sa
les
of n
ew-t
o-m
arke
t an
d ne
w-t
o-fir
m in
nova
tions
13.3
710
.81
11.9
86.
456.
276.
5112
.44
19.1
29.
276.
8920
.81
6.07
11.9
03.
306.
167.
9419
.62
10.5
13.
30

91European Innovation Scoreboard 2018
EU28
BEBG
CZD
KD
EEE
IEEL
ESFR
HR
ITCY
LVLT
LUH
UM
T
FRAM
EWO
RK C
ON
DIT
ION
SH
uman
res
ourc
es1.
1.1
New
doc
tora
te g
radu
ates
39.4
40.9
70.5
22.1
116.
013
.514
.079
.82.
012
2.6
15.1
14.0
-6.1
34.4
8.1
-10.
437
.08.
630
.6
1.1.
2 Po
pula
tion
com
plet
ed t
ertia
ry e
duca
tion
13.4
0.0
15.7
29.1
6.7
21.6
18.7
0.0
28.4
8.2
0.0
6.0
20.1
16.4
16.4
22.4
6.7
-14.
226
.9
1.1.
3 Li
felo
ng le
arni
ng2.
10.
07.
3-2
.1-9
.46.
364
.60.
012
.5-2
.13.
1-7
.317
.7-1
2.5
21.9
15.6
-8.3
-9.4
0.0
Attr
acti
ve r
esea
rch
syst
ems
1.2.
1 In
tern
atio
nal s
cien
tific
co-p
ublic
atio
ns63
165
2411
325
189
180
152
7310
272
6983
223
7291
294
5413
5
1.2.
2 Sc
ient
ific
publ
icat
ions
am
ong
top
10%
mos
t ci
ted
3.8
5.8
1.6
5.5
-9.7
1.6
18.3
17.5
7.0
5.1
4.5
13.1
12.7
31.2
34.5
-18.
047
.91.
347
.5
1.2.
3 Fo
reig
n do
ctor
ate
stud
ents
10.7
43.5
2.4
19.5
58.9
-9.0
28.6
-37.
2n/
a-2
7.9
-3.8
5.9
25.3
20.7
45.6
15.0
0.0
19.6
190.
7
Inno
vati
on-f
rien
dly
envi
ronm
ent
1.3.
1 Br
oadb
and
pene
trat
ion
77.8
100.
044
.444
.477
.855
.610
0.0
88.9
33.3
166.
733
.366
.722
.255
.611
.113
3.3
133.
377
.877
.8
1.3.
2 O
ppor
tuni
ty-d
riven
ent
repr
eneu
rshi
p7.
7-9
1.8
6.5
17.1
33.8
55.4
18.1
50.7
3.8
5.2
60.0
-13.
3-3
6.5
-6.2
32.5
18.5
-69.
66.
3n/
a
INV
ESTM
ENTS
Fina
nce
and
supp
ort
2.1.
1 R&
D e
xpen
ditu
re in
the
pub
lic s
ecto
r-3
.512
.4-2
3.0
12.4
10.6
10.6
-23.
0-2
8.3
31.9
-17.
71.
80.
0-5
.3-5
.37.
1-1
2.4
35.4
-31.
97.
1
2.1.
2 Ve
ntur
e ca
pita
l exp
endi
ture
s22
.0-1
8.3
-125
.8-1
64.8
-39.
40.
846
.0-6
3.4
-12.
413
.410
1.3
8.1
9.8
-8.8
152.
452
.80.
050
.3-1
1.4
Firm
inve
stm
ents
2.2.
1 R&
D e
xpen
ditu
re in
the
bus
ines
s se
ctor
11.4
36.7
36.7
27.1
-21.
014
.03.
5-2
3.6
17.5
-5.2
6.1
0.0
8.7
7.0
-4.4
8.7
-5.2
21.0
5.2
2.2.
2 N
on-R
&D
inno
vatio
n ex
pend
iture
s9.
3-2
.0-3
4.5
-15.
9-3
5.8
63.7
-153
.1-8
9.4
3.9
-15.
66.
056
.6-7
.5-2
53.9
-102
.617
1.6
-19.
61.
0-1
17.0
2.2.
3 En
terp
rises
pro
vidi
ng IC
T tr
aini
ng14
.335
.7-3
5.7
7.1
-7.1
28.6
7.1
14.3
-21.
450
.0-7
.1-3
5.7
14.3
-14.
30.
07.
150
.021
.428
.6
INN
OVA
TIO
N A
CTIV
ITIE
SIn
nova
tors
3.1.
1 SM
Es w
ith p
rodu
ct o
r pr
oces
s in
nova
tions
-18.
218
.3-2
8.7
-17.
3-1
2.8
-51.
8-1
14.3
14.7
-11.
6-3
8.3
14.6
-26.
05.
1-4
0.4
-22.
950
.6-1
9.5
-7.5
3.3
3.1.
2 SM
Es w
ith m
arke
ting
or o
rgan
isat
iona
l inn
ovat
ions
-17.
23.
6-8
.8-6
8.4
-0.1
-38.
9-6
4.8
37.2
-37.
8-1
6.4
10.5
-5.5
-20.
4-5
5.1
17.1
8.8
4.8
-18.
017
.5
3.1.
3 SM
Es in
nova
ting
in-h
ouse
-6.7
-2.2
-27.
0-7
.3-1
0.1
-37.
1-8
2.9
11.7
-6.0
-34.
67.
3-2
0.4
-16.
3-5
0.5
-19.
550
.2-2
3.5
-3.9
10.5
Link
ages
3.2.
1 In
nova
tive
SMEs
col
labo
ratin
g w
ith o
ther
s0.
56.
5-4
.0-1
2.5
-94.
8-1
6.8
-115
.741
.414
.513
.4-3
.1-5
1.1
7.4
-96.
6-5
.171
.8-3
1.6
-9.6
-10.
1
3.2.
2 Pu
blic
-priv
ate
co-p
ublic
atio
ns0.
910
.20.
0-8
.83.
75.
2-2
8.2
18.4
-7.8
0.7
2.2
-21.
7-8
.5-1
1.2
-5.7
-15.
2-1
5.0
3.5
-42.
5
3.2.
3 Pr
ivat
e co
-fun
ding
of
publ
ic R
&D
exp
endi
ture
s1.
414
.8-1
.715
.5-6
.113
.815
.4-9
.17.
5-1
5.9
7.1
-0.5
-0.2
-7.8
17.8
4.8
-5.3
-42.
5-1
.2
Inte
llect
ual a
sset
s3.
3.1
PCT
pate
nt a
pplic
atio
ns-4
.2-6
.08.
60.
0-2
5.5
-21.
6-2
3.7
-24.
72.
42.
93.
3-1
.75.
610
.41.
97.
03.
3-0
.21.
9
3.3.
2 Tr
adem
ark
appl
icat
ions
13.0
2.6
20.8
13.0
29.0
-4.6
78.6
-16.
355
.519
.00.
210
.524
.581
.26.
451
.40.
011
.578
.0
3.3.
3 D
esig
n ap
plic
atio
ns-3
.5-2
2.0
83.8
37.7
29.4
-18.
480
.0-1
9.6
16.7
-10.
7-1
9.9
16.3
-6.6
53.0
-38.
924
.221
.83.
819
5.7
IMPA
CTS
Empl
oym
ent
impa
cts
4.1.
1 Em
ploy
men
t in
kno
wle
dge-
inte
nsiv
e ac
tiviti
es10
.40.
022
.17.
80.
0-7
.840
.30.
014
.310
.46.
532
.51.
336
.439
.020
.8-1
1.7
-9.1
36.4
4.1.
2 Em
ploy
men
t fa
st-g
row
ing
firm
s in
nova
tive
sect
ors
-6.5
6.5
11.4
-4.8
-46.
3-2
8.4
4.6
13.2
n/a
36.1
-22.
348
.15.
1-1
1.8
45.1
-53.
734
.05.
35.
8
Sale
s im
pact
s4.
2.1
Med
ium
& h
igh
tech
pro
duct
exp
orts
5.9
-1.6
22.3
6.9
17.9
6.6
13.8
16.8
-8.1
-2.3
2.4
-14.
95.
038
.611
.513
.5-1
9.2
-8.2
19.1
4.2.
2 Kn
owle
dge-
inte
nsiv
e se
rvic
es e
xpor
ts4.
96.
724
.611
.9-1
3.1
-3.4
-0.1
0.0
-38.
60.
69.
5-2
.5-0
.71.
5-3
.58.
43.
70.
5-6
4.1
4.2.
3 Sa
les
of n
ew-t
o-m
arke
t an
d ne
w-t
o-fir
m in
nova
tions
1.1
-18.
8-9
2.9
-40.
5-4
4.2
-39.
92.
669
.7-7
9.6
0.3
17.5
-93.
9-1
7.1
-114
.4-5
.7-1
0.0
-23.
0-3
9.2
-109
.6
Anne
x D
: Per
form
ance
cha
nge
Perf
orm
ance
cha
nge
is m
easu
red
as th
e di
ffer
ence
bet
wee
n pe
rfor
man
ce in
201
7 re
lativ
e to
the
EU a
vera
ge in
201
0 an
d pe
rfor
man
ce in
201
0 re
lativ
e to
the
EU a
vera
ge in
201
0 (th
e re
lativ
e pe
rfor
man
ce s
core
s in
bot
h ye
ars
are
show
n in
the
first
tabl
e on
the
Coun
try
prof
iles)
.

92 European Innovation Scoreboard 2018
EU28
NL
ATPL
PTRO
SISK
FISE
UK
ISIL
MK
NO
RSCH
TRU
A
FRAM
EWO
RK C
ON
DIT
ION
SH
uman
res
ourc
es1.
1.1
New
doc
tora
te g
radu
ates
39.4
52.2
-15.
8-1
2.8
-69.
0-5
0.1
135.
911
.4-2
.1-2
9.6
67.7
15.4
10.5
27.2
23.9
45.4
0.0
8.2
61.5
1.1.
2 Po
pula
tion
com
plet
ed t
ertia
ry e
duca
tion
13.4
17.2
14.2
7.5
19.4
1.5
48.5
39.6
0.0
10.4
11.2
50.7
n/a
36.6
-14.
2n/
a44
.050
.0n/
a
1.1.
3 Li
felo
ng le
arni
ng2.
112
.520
.8-3
.1-1
7.7
-3.1
-45.
8-7
.345
.838
.5-6
0.4
-18.
8n/
a-1
2.5
17.7
n/a
0.0
1.0
n/a
Attr
acti
ve r
esea
rch
syst
ems
1.2.
1 In
tern
atio
nal s
cien
tific
co-p
ublic
atio
ns63
201
167
4215
524
145
5021
726
216
027
6224
263
6034
695
1.2.
2 Sc
ient
ific
publ
icat
ions
am
ong
top
10%
mos
t ci
ted
3.8
2.6
-3.0
13.9
-0.8
5.4
14.9
2.4
7.7
10.8
12.1
19.5
2.5
45.2
-10.
9-5
.20.
0-8
.23.
1
1.2.
3 Fo
reig
n do
ctor
ate
stud
ents
10.7
6.0
3.2
-1.9
57.2
3.0
4.8
8.1
50.6
37.7
-19.
736
.6n/
a12
1.5
-32.
06.
833
.86.
24.
7
Inno
vati
on-f
rien
dly
envi
ronm
ent
1.3.
1 Br
oadb
and
pene
trat
ion
77.8
133.
311
.166
.721
1.1
66.7
33.3
33.3
122.
211
1.1
55.6
n/a
n/a
33.3
88.9
0.0
n/a
33.3
-0.2
1.3.
2 O
ppor
tuni
ty-d
riven
ent
repr
eneu
rshi
p7.
7-2
9.6
-13.
210
0.8
-7.0
-14.
5-2
5.9
4.4
81.2
43.4
-13.
70.
011
.513
.128
.9n/
a25
.123
.5n/
a
INV
ESTM
ENTS
Fina
nce
and
supp
ort
2.1.
1 R&
D e
xpen
ditu
re in
the
pub
lic s
ecto
r-3
.55.
38.
9-2
8.3
-7.1
-17.
7-2
6.6
19.5
-24.
8-3
.5-1
9.5
-1.8
-9.4
29.2
21.2
-34.
031
.9-7
.1-2
7.0
2.1.
2 Ve
ntur
e ca
pita
l exp
endi
ture
s22
.044
.923
.110
.2-1
4.0
-36.
5-6
.04.
0-1
00.5
-92.
57.
8n/
a2.
2n/
a46
.1-1
7.4
23.2
n/a
16.8
Firm
inve
stm
ents
2.2.
1 R&
D e
xpen
ditu
re in
the
bus
ines
s se
ctor
11.4
5.2
37.6
38.4
-12.
27.
9-2
4.5
18.3
-68.
2-1
6.6
6.1
28.8
0.0
3.5
16.6
18.0
10.5
10.5
-7.6
2.2.
2 N
on-R
&D
inno
vatio
n ex
pend
iture
s9.
3-5
9.0
0.5
-1.8
-5.6
-188
.14.
0-2
3.2
-41.
263
.861
.9n/
an/
a0.
087
.216
4.7
104.
726
1.9
-50.
0
2.2.
3 En
terp
rises
pro
vidi
ng IC
T tr
aini
ng14
.357
.114
.314
.3-1
4.3
0.0
0.0
-57.
10.
035
.7-1
4.3
-28.
6n/
a21
.40.
00.
0n/
an/
an/
a
INN
OVA
TIO
N A
CTIV
ITIE
SIn
nova
tors
3.1.
1 SM
Es w
ith p
rodu
ct o
r pr
oces
s in
nova
tions
-18.
248
.85.
0-1
8.4
-24.
3-2
6.4
6.8
-10.
09.
7-0
.824
.0-4
2.5
-37.
9-5
8.5
52.3
42.9
-25.
98.
70.
0
3.1.
2 SM
Es w
ith m
arke
ting
or o
rgan
isat
iona
l inn
ovat
ions
-17.
213
.211
.1-2
4.7
-20.
5-5
2.0
-21.
1-2
0.1
19.6
-5.5
48.9
-10.
0-5
3.1
-10.
142
.250
.30.
0-3
3.2
-2.4
3.1.
3 SM
Es in
nova
ting
in-h
ouse
-6.7
40.1
2.7
-24.
8-3
8.9
-38.
01.
3-4
.7-1
.2-8
.90.
0n/
a-3
2.9
-4.1
44.8
-18.
665
.2-2
5.8
-4.1
Link
ages
3.2.
1 In
nova
tive
SMEs
col
labo
ratin
g w
ith o
ther
s0.
545
.157
.9-2
9.1
-55.
7-4
.9-1
1.0
26.6
14.8
-30.
00.
031
.7-4
2.1
-25.
359
.914
.2-6
.510
.2-2
.0
3.2.
2 Pu
blic
-priv
ate
co-p
ublic
atio
ns0.
9-2
.78.
62.
30.
5-1
5.8
-19.
5-9
.4-3
.38.
24.
30.
0-1
1.3
13.4
-5.8
-17.
90.
0-0
.7-3
.6
3.2.
3 Pr
ivat
e co
-fun
ding
of
publ
ic R
&D
exp
endi
ture
s1.
4-3
6.3
3.6
-3.9
8.8
-26.
2-1
2.2
15.8
-40.
4-8
.5-1
8.1
-26.
70.
0n/
a-1
2.5
0.0
48.8
10.9
n/a
Inte
llect
ual a
sset
s3.
3.1
PCT
pate
nt a
pplic
atio
ns-4
.2-4
.78.
89.
29.
21.
7-3
5.9
4.5
-22.
30.
0-9
.220
.00.
0-3
.1-5
.3n/
a-1
7.7
7.9
7.2
3.3.
2 Tr
adem
ark
appl
icat
ions
13.0
4.9
-4.8
29.7
40.1
21.1
13.0
21.0
46.5
26.2
12.9
-13.
136
.433
.912
.1-9
.9-1
7.4
4.6
-0.4
3.3.
3 D
esig
n ap
plic
atio
ns-3
.57.
7-2
5.6
31.6
-13.
120
.04.
61.
0-1
0.3
-5.1
9.1
-15.
49.
30.
3-7
.42.
6-2
3.3
-2.1
8.3
IMPA
CTS
Empl
oym
ent
impa
cts
4.1.
1 Em
ploy
men
t in
kno
wle
dge-
inte
nsiv
e ac
tiviti
es10
.40.
09.
116
.919
.522
.110
.42.
613
.022
.115
.69.
10.
0-1
1.7
7.8
37.4
19.5
13.0
10.4
4.1.
2 Em
ploy
men
t fa
st-g
row
ing
firm
s in
nova
tive
sect
ors
-6.5
-9.1
-21.
8-1
0.6
43.6
11.5
7.9
-0.5
-14.
0-2
4.4
-3.3
n/a
n/a
n/a
-5.1
n/a
0.0
n/a
n/a
Sale
s im
pact
s4.
2.1
Med
ium
& h
igh
tech
pro
duct
exp
orts
5.9
17.0
10.9
-6.5
5.7
13.4
2.9
12.2
-0.6
2.6
8.8
0.0
5.5
69.9
0.0
39.1
-37.
916
.3-3
1.3
4.2.
2 Kn
owle
dge-
inte
nsiv
e se
rvic
es e
xpor
ts4.
93.
218
.80.
60.
29.
15.
4-4
.450
.71.
7-2
.8-4
.515
.1-1
5.9
4.5
8.2
4.9
12.0
8.2
4.2.
3 Sa
les
of n
ew-t
o-m
arke
t an
d ne
w-t
o-fir
m in
nova
tions
1.1
19.3
7.2
-33.
5-9
1.9
-82.
7-3
8.3
32.8
-62.
6-2
2.4
133.
4-5
7.6
10.9
-14.
815
.1-2
0.4
-11.
730
.4-1
4.8
Perf
orm
ance
cha
nge
is m
easu
red
as th
e di
ffer
ence
bet
wee
n pe
rfor
man
ce in
201
7 re
lativ
e to
the
EU a
vera
ge in
201
0 an
d pe
rfor
man
ce in
201
0 re
lativ
e to
the
EU a
vera
ge in
201
0 (th
e re
lativ
e pe
rfor
man
ce s
core
s in
bot
h ye
ars
are
show
n in
the
first
tabl
e on
the
Coun
try
prof
iles)
.

93European Innovation Scoreboard 2018
Annex E: Definitions of indicators
INDICATORDEFINITION NUMERATORSource
DEFINITION DENOMINATORSource
MOST RECENT YEAR FOR WHICH DATA ARE AVAILABLEINTERPRETATION
1.1.1 New doctorate graduates per 1000 population aged 25-34
Number of doctorate graduates
Eurostat
Population between and including 25 and 34 years
Eurostat
2016
The indicator is a measure of the supply of new second-stage tertiary graduates in all fields of training (ISCED 8). For most countries, ISCED 8 captures PhD graduates.
1.1.2 Percentage population aged 25-34 having completed tertiary education
Number of persons in age class with some form of post-secondary education
Eurostat
Population between and including 25 and 34 years
Eurostat
2017
This is a general indicator of the supply of advanced skills. It is not limited to science and technical fields, because the adoption of innovations in many areas, in particular in the service sectors, depends on a wide range of skills. The indicator focuses on a younger age cohort of the population, aged 25 to 34, and will therefore easily and quickly reflect changes in educational policies leading to more tertiary graduates.
1.1.3. Lifelong learning The target population for lifelong learning statistics refers to all persons in private households aged between 25 and 64 years. The information collected relates to all education or training, whether or not relevant to the respondent’s current or possible future job. Data are collected through the EU labour force survey (LFS).
Eurostat
Total population of the same age group, excluding those who did not answer the question concerning participation in (formal and non-formal) education and training
Eurostat
2017
Lifelong learning encompasses all purposeful learning activity, whether formal, non-formal or informal, undertaken on an ongoing basis with the aim of improving knowledge, skills and competence. The intention or aim to learn is the critical point that distinguishes these activities from non-learning activities, such as cultural or sporting activities.
1.2.1 International scientific co-publications per million population
Number of scientific publications with at least one co-author based abroad (where abroad is non-EU for the EU28)
Web of Science *
Total population
Eurostat
2017
International scientific co-publications are a proxy for the quality of scientific research as collaboration increases scientific productivity.
1.2.2 Scientific publications among the top-10% most cited publications worldwide as percentage of total scientific publications of the country
Number of scientific publications among the top-10% most cited publications worldwide
Web of Science *
Total number of scientific publications
Web of Science *
2015
The indicator is a measure for the efficiency of the research system, as highly cited publications are assumed to be of higher quality. There could be a bias towards small or English-speaking countries given the coverage of Scopus’ publication data.
1.2.3 Foreign doctorate students as a percentage of all doctorate students
Number of doctorate students from foreign countries
Eurostat
Total number of doctorate students
Eurostat
2016
The share of foreign doctorate students reflects the mobility of students as an effective way of diffusing knowledge. Attracting high-skilled foreign doctorate students will secure a continuous supply of researchers.
1.3.1 Broadband penetration
Number of enterprises with a maximum contracted download speed of the fastest fixed internet connection of at least 100 Mb/s
Eurostat (Community Survey of ICT Usage and E-commerce in Enterprises)
All enterprises
Eurostat (Community Survey of ICT Usage and E-commerce in Enterprises)
2017
Realising Europe’s full e-potential depends on creating the conditions for electronic commerce and the Internet to flourish. This indicator captures the relative use of this e-potential by the share of enterprises that have access to fast broadband.

94 European Innovation Scoreboard 2018
INDICATORDEFINITION NUMERATORSource
DEFINITION DENOMINATORSource
MOST RECENT YEAR FOR WHICH DATA ARE AVAILABLEINTERPRETATION
1.3.2 Opportunity-driven entrepreneurship (Motivational index)
This index is calculated as the ratio between the share of persons involved in improvement-driven entrepreneurship and the share of persons involved in necessity-driven entrepreneurship.
Global Entrepreneurship Monitor (GEM)
Comment: Three-year averages have been used.
2017
Data from GEM distinguish between two types of entrepreneurship: 1) improvement-driven entrepreneurship and 2) necessity-driven entrepreneurship. The first includes persons involved in TEA (Total Early-Stage Entrepreneurial Activity) who (i) claim to be driven by opportunity as opposed to finding no other option for work; and (ii) who indicate the main driver for being involved in this opportunity is being independent or increasing their income, rather than just maintaining their income; the second includes persons involved in TEA who are involved in entrepreneurship because they had no other option for work.
Countries with high relative prevalence of improvement-driven opportunity entrepreneurship appear to be primarily innovation-driven countries. In these countries, opportunities may be expected to be more abundant, and individuals may have more alternatives to make a living.
GEM has constructed the Motivational index to measure the relative degree of improvement-driven entrepreneurship.
2.1.1 R&D expenditure in the public sector (percentage of GDP)
All R&D expenditures in the government sector (GOVERD) and the higher education sector (HERD)
Eurostat
Gross Domestic Product
Eurostat
2016
R&D expenditure represents one of the major drivers of economic growth in a knowledge-based economy. As such, trends in the R&D expenditure indicator provide key indications of the future competitiveness and wealth of the EU. Research and development spending is essential for making the transition to a knowledge-based economy as well as for improving production technologies and stimulating growth.
2.1.2 Venture capital (percentage of GDP)
Venture capital expenditures is defined as private equity being raised for investment in companies. Management buyouts, management buy-ins, and venture purchase of quoted shares are excluded. Venture capital includes early stage (seed + start-up) and expansion and replacement capital
Invest Europe
Comment: Three-year averages have been used.
Gross Domestic Product
Eurostat
2017
The amount of venture capital is a proxy for the relative dynamism of new business creation. In particular for enterprises using or developing new (risky) technologies, venture capital is often the only available means of financing their (expanding) business.
2.2.1 R&D expenditure in the business sector (percentage of GDP)
All R&D expenditures in the business sector (BERD)
Eurostat
Gross Domestic Product
Eurostat
2016
The indicator captures the formal creation of new knowledge within firms. It is particularly important in the science-based sectors (pharmaceuticals, chemicals and some areas of electronics) where most new knowledge is created in or near R&D laboratories.
2.2.2 Non-R&D innovation expenditures (percentage of turnover)
Sum of total innovation expenditure for enterprises, excluding intramural and extramural R&D expenditures
Eurostat (Community Innovation Survey)
Total turnover for all enterprises
Eurostat (Community Innovation Survey)
2014
This indicator measures non-R&D innovation expenditure as a percentage of total turnover. Several of the components of innovation expenditure, such as investment in equipment and machinery and the acquisition of patents and licenses, measure the diffusion of new production technology and ideas.

95European Innovation Scoreboard 2018
INDICATORDEFINITION NUMERATORSource
DEFINITION DENOMINATORSource
MOST RECENT YEAR FOR WHICH DATA ARE AVAILABLEINTERPRETATION
2.2.3 Enterprises providing training to develop or upgrade ICT skills of their personnel
Number of enterprises that provided any type of training to develop ICT related skills of their personnel
Eurostat (Community Survey of ICT Usage and E-commerce in Enterprises)
All enterprises
Eurostat (Community Survey of ICT Usage and E-commerce in Enterprises)
2017
ICT skills are particularly important for innovation in an increasingly digital economy. The share of enterprises providing training in that respect is a proxy for the overall skills development of employees.
3.1.1 SMEs introducing product or process innovations (percentage of SMEs)
Number of Small and medium-sized enterprises (SMEs) who introduced at least one product innovation or process innovation either new to the enterprise or new to their market. A product innovation is the market introduction of a new or significantly improved good or service with respect to its capabilities, user friendliness, components or sub-systems. A process innovation is the implementation of a new or significantly improved production process, distribution method, or supporting activity
Eurostat (Community Innovation Survey)
Total number of Small and medium-sized enterprises
Eurostat (Community Innovation Survey)
2014
Technological innovation, as measured by the introduction of new products (goods or services) and processes, is a key ingredient to innovation in manufacturing activities. Higher shares of technological innovators should reflect a higher level of innovation activities.
3.1.2 SMEs introducing marketing or organisational innovations (percentage of SMEs)
Number of Small and medium-sized enterprises (SMEs) who introduced at least one new organisational innovation or marketing innovation. An organisational innovation is a new organisational method in an enterprise’s business practices (including knowledge management), workplace organisation or external relations that has not been previously used by the enterprise. A marketing innovation is the implementation of a new marketing concept or strategy that differs significantly from an enterprise’s existing marketing methods and which has not been used before
Eurostat (Community Innovation Survey)
Total number of Small and medium-sized enterprises
Eurostat (Community Innovation Survey)
2014
The Community Innovation Survey mainly asks firms about their technological innovation. Many firms, in particular in the services sectors, innovate through other non-technological forms of innovation. Examples of these are marketing and organisational innovations. This indicator captures the extent to which SMEs innovate through non-technological innovation.
3.1.3 SMEs innovating in-house (percentage of SMEs)
Number of Small and medium-sized enterprises (SMEs) with in-house innovation activities. In-house innovating enterprises are defined as enterprises which have introduced product or process innovations either themselves or in co-operation with other enterprises or organisations
Eurostat (Community Innovation Survey)
Total number of Small and medium-sized enterprises
Eurostat (Community Innovation Survey)
2014
This indicator measures the degree to which SMEs, that have introduced any new or significantly improved products or production processes, have innovated in-house. The indicator is limited to SMEs, because almost all large firms innovate and because countries with an industrial structure weighted towards larger firms tend to do better.

96 European Innovation Scoreboard 2018
INDICATORDEFINITION NUMERATORSource
DEFINITION DENOMINATORSource
MOST RECENT YEAR FOR WHICH DATA ARE AVAILABLEINTERPRETATION
3.2.1 Innovative SMEs collaborating with others (percentage of SMEs)
Number of Small and medium-sized enterprises with innovation co-operation activities, i.e. those firms that had any co-operation agreements on innovation activities with other enterprises or institutions in the three years of the survey period
Eurostat (Community Innovation Survey)
Total number of Small and medium-sized enterprises
Eurostat (Community Innovation Survey)
2014
This indicator measures the degree to which SMEs are involved in innovation co-operation. Complex innovations, in particular in ICT, often depend on the ability to draw on diverse sources of information and knowledge, or to collaborate in the development of an innovation. This indicator measures the flow of knowledge between public research institutions and firms, and between firms and other firms. The indicator is limited to SMEs, because almost all large firms are involved in innovation co-operation.
3.2.2 Public-private co-publications per million population
Number of public-private co-authored research publications. The definition of the “private sector” excludes the private medical and health sector. Publications are assigned to the country in which the business companies or other private sector organisations are located.
Web of Science *
Total population
Eurostat
2017
This indicator captures public-private research linkages and active collaboration activities between business sector researchers and public sector researchers resulting in academic publications.
3.2.3 Private co-funding of public R&D expenditures (percentage of GDP)
All R&D expenditures in the government sector (GOVERD) and the higher education sector (HERD) financed by the business sector
Eurostat, OECD
Gross Domestic Product
Eurostat, OECD
2015
This indicator measures public-private co-operation. University and government R&D financed by the business sector are expected to explicitly serve the more short-term research needs of the business sector.
3.3.1 PCT patent applications per billion GDP (in PPS)
Number of patent applications filed under the PCT, at international phase, designating the European Patent Office (EPO). Patent counts are based on the priority date, the inventor’s country of residence and fractional counts.
OECD
Gross Domestic Product in Purchasing Power Standard
Eurostat
2015
The capacity of firms to develop new products will determine their competitive advantage. One measure of the rate of new product innovation is the number of patents. This indicator measures the number of PCT patent applications.
3.3.2 Trademarks applications per billion GDP (in PPS)
Number of trademark applications applied for at EUIPO plus number of trademark applications applied for at WIPO (“yearly Madrid applications by origin”)
European Union Intellectual Property Office (EUIPO), World Intellectual Property Organization (WIPO)
Comment: Two-year averages have been used.
Gross Domestic Product in Purchasing Power Standard
Eurostat
2017
Trademarks are an important innovation indicator, especially for the service sector. The Community trademark gives its proprietor a uniform right applicable in all Member States of the European Union through a single procedure which simplifies trademark policies at European level. It fulfils the three essential functions of a trademark: it identifies the origin of goods and services, guarantees consistent quality through evidence of the company’s commitment vis-à-vis the consumer, and it is a form of communication, a basis for publicity and advertising.
3.3.3 Designs applications per billion GDP (in PPS)
Number of individual designs applied for at EUIPO
European Union Intellectual Property Office (EUIPO)
Comment: Two-year averages have been used.
Gross Domestic Product in Purchasing Power Standard
Eurostat
2017
A design is the outward appearance of a product or part of it resulting from the lines, contours, colours, shape, texture, materials and/or its ornamentation. A product can be any industrial or handicraft item including packaging, graphic symbols and typographic typefaces but excluding computer programmes. It also includes products that are composed of multiple components, which may be disassembled and reassembled. Community design protection is directly enforceable in each Member State and it provides both the option of an unregistered and a registered Community design right for one area encompassing all Member States.

97European Innovation Scoreboard 2018
INDICATORDEFINITION NUMERATORSource
DEFINITION DENOMINATORSource
MOST RECENT YEAR FOR WHICH DATA ARE AVAILABLEINTERPRETATION
4.1.1 Employment in knowledge-intensive activities (percentage of total employment)
Number of employed persons in knowledge-intensive activities in business industries. Knowledge-intensive activities are defined, based on EU Labour Force Survey data, as all NACE Rev.2 industries at 2-digit level where at least 33% of employment has a higher education degree (ISCED 5-8).
Eurostat
Total employment
Eurostat
2017
Knowledge-intensive activities provide services directly to consumers, such as telecommunications, and provide inputs to the innovative activities of other firms in all sectors of the economy.
4.1.2 Employment in fast-growing enterprises (percentage of total employment)
Number of employees in high-growth enterprises in 50% ‘most innovative’ industries41
Eurostat
Total employment for enterprises with 10 or more employees
Eurostat
2015
This indicator provides an indication of the dynamism of fast-growing firms in innovative sectors as compared to all fast-growing business activities. It captures the capacity of a country to transform rapidly its economy to respond to new needs and to take advantage of emerging demand.
4.2.1 Exports of medium and high technology products as a share of total product exports
Value of medium and high-tech exports, in national currency and current prices, including exports of the following SITC Rev.3 products: 266, 267, 512, 513, 525, 533, 54, 553, 554, 562, 57, 58, 591, 593, 597, 598, 629, 653, 671, 672, 679, 71, 72, 731, 733, 737, 74, 751, 752, 759, 76, 77, 78, 79, 812, 87, 88 and 891
Eurostat (ComExt) for Member States, UN (ComTrade) for non-EU countries
Value of total product exports
Eurostat (ComExt) for MS, UN ComTrade for non-MS
2017
The indicator measures the technological compe-titiveness of the EU, i.e. the ability to commercialise the results of research and development (R&D) and innovation in international markets. It also reflects product specialisation by country. Creating, exploiting and commercialising new technologies are vital for the competitiveness of a country in the modern economy. Medium and high technology products are key drivers for economic growth, productivity and welfare, and are generally a source of high value added and well-paid employment.
4.2.2 Knowledge-intensive services exports as percentage of total services exports
Exports of knowledge-intensive services is defined as the sum of credits in EBOPS 2010 (Extended Balance of Payments Services Classification) items SC1, SC2, SC3A, SF, SG, SH, SI, SJ and SK142
Eurostat
Total value of services exports
Eurostat
2016
The indicator measures the competitiveness of the knowledge-intensive services sector. Competitiveness-enhancing measures and innovation strategies can be mutually reinforcing for the growth of employment, export shares and turnover at the firm level. It reflects the ability of an economy, notably resulting from innovation, to export services with high levels of value added, and successfully take part in knowledge-intensive global value chains.
4.2.3 Sales of new-to-market and new-to-firm innovations as percentage of turnover
Sum of total turnover of new or significantly improved products, either new-to-the-firm or new-to-the-market, for all enterprises
Eurostat (Community Innovation Survey)
Total turnover for all enterprises
Eurostat (Community Innovation Survey)
2014
This indicator measures the turnover of new or significantly improved products and includes both products which are only new to the firm and products which are also new to the market. The indicator thus captures both the creation of state-of-the-art technologies (new-to-market products) and the diffusion of these technologies (new-to-firm products).
42 SC1 (Sea transport), SC2 (Air transport), SC3A (Space transport), SF (Insurance and pension services), SG (Financial services), SH (Charges for the use of intellectual property), SI (Telecommunications, computer, and information services), SJ (Other business services) and SK1 (Audio-visual and related services)
41 Defined as B06 (Extraction of crude petroleum and natural gas), B09 (Mining support service activities), C11 (Manufacture of beverages), C12 (Manufacture of tobacco products), C19 (Manufacture of coke and refined petroleum product), C20 (Manufacture of chemicals and chemical products), C21 (Manufacture of basic pharmaceutical products and pharmaceutical preparations), C26 (Manufacture of computer, electronic and optical products), C27 (Manufacture of electrical equipment), C28 (Manufacture of machinery and equipment n.e.c.), C29 (Manufacture of motor vehicles, trailers and semi-trailers), C30 (Manufacture of other transport equipment), C32 (Other manufacturing), D35 (Electricity, gas, steam and air conditioning supply) and E39 (Remediation activities and other waste management services).

98 European Innovation Scoreboard 2018
SUMMARY INNOVATION INDEX RELATIVE TO EU IN 2010 … IN 2017
2010 2011 2012 2013 2014 2015 2016 2017 2010 2011 2012 2013 2014 2015 2016 2017 2017
EU28 0.477 0.478 0.471 0.476 0.476 0.485 0.498 0.504 100.0 100.3 98.8 99.9 99.8 101.8 104.6 105.8 100.0
BE 0.560 0.569 0.562 0.562 0.560 0.564 0.585 0.593 117.5 119.3 117.9 117.8 117.5 118.3 122.8 124.4 117.5
BG 0.236 0.226 0.188 0.201 0.210 0.217 0.226 0.229 49.5 47.4 39.5 42.2 44.0 45.6 47.5 48.0 45.4
CZ 0.429 0.422 0.394 0.401 0.399 0.408 0.403 0.415 90.0 88.5 82.7 84.2 83.8 85.5 84.5 87.1 82.3
DK 0.665 0.685 0.688 0.695 0.682 0.684 0.670 0.668 139.4 143.7 144.2 145.9 143.1 143.6 140.6 140.1 132.4
DE 0.609 0.616 0.614 0.615 0.594 0.598 0.593 0.603 127.8 129.2 128.8 128.9 124.5 125.3 124.4 126.5 119.6
EE 0.412 0.427 0.436 0.439 0.417 0.432 0.389 0.397 86.4 89.5 91.5 92.0 87.5 90.6 81.6 83.2 78.6
IE 0.544 0.544 0.529 0.518 0.523 0.530 0.578 0.585 114.2 114.1 111.0 108.6 109.6 111.1 121.1 122.7 115.9
EL 0.332 0.330 0.329 0.336 0.297 0.309 0.323 0.328 69.6 69.2 68.9 70.5 62.4 64.8 67.7 68.8 65.0
ES 0.364 0.367 0.365 0.367 0.339 0.347 0.374 0.400 76.4 77.0 76.5 77.1 71.0 72.8 78.4 83.9 79.3
FR 0.503 0.512 0.504 0.508 0.520 0.532 0.553 0.551 105.5 107.4 105.7 106.6 109.0 111.7 116.0 115.5 109.2
HR 0.268 0.275 0.249 0.260 0.234 0.257 0.259 0.258 56.2 57.6 52.2 54.5 49.1 53.9 54.4 54.2 51.2
IT 0.362 0.361 0.363 0.357 0.365 0.375 0.369 0.371 75.9 75.7 76.1 74.8 76.6 78.6 77.3 77.9 73.6
CY 0.430 0.424 0.418 0.434 0.378 0.393 0.376 0.386 90.2 88.9 87.7 91.0 79.3 82.5 78.8 81.0 76.5
LV 0.230 0.230 0.217 0.216 0.262 0.294 0.278 0.285 48.2 48.3 45.5 45.3 54.9 61.7 58.4 59.8 56.5
LT 0.263 0.271 0.286 0.284 0.278 0.306 0.369 0.359 55.1 56.9 60.0 59.6 58.3 64.3 77.3 75.3 71.1
LU 0.580 0.594 0.617 0.627 0.602 0.626 0.624 0.611 121.6 124.5 129.5 131.6 126.2 131.3 131.0 128.1 121.1
HU 0.332 0.327 0.311 0.312 0.315 0.318 0.323 0.332 69.7 68.5 65.3 65.4 66.1 66.8 67.7 69.6 65.7
MT 0.330 0.319 0.299 0.349 0.392 0.405 0.377 0.403 69.3 66.9 62.7 73.2 82.1 84.9 79.1 84.5 79.9
NL 0.572 0.574 0.610 0.612 0.602 0.615 0.625 0.648 120.0 120.3 128.0 128.5 126.3 129.0 131.0 135.9 128.5
AT 0.536 0.541 0.556 0.566 0.550 0.556 0.582 0.579 112.4 113.4 116.5 118.7 115.3 116.6 122.1 121.3 114.7
PL 0.255 0.256 0.240 0.248 0.240 0.247 0.261 0.270 53.5 53.8 50.3 52.0 50.3 51.7 54.7 56.7 53.6
PT 0.413 0.409 0.390 0.402 0.386 0.397 0.395 0.406 86.7 85.8 81.8 84.2 81.0 83.2 82.9 85.2 80.5
RO 0.224 0.223 0.191 0.190 0.153 0.145 0.154 0.157 46.9 46.7 40.1 39.9 32.2 30.4 32.4 32.9 31.1
SI 0.459 0.469 0.456 0.459 0.467 0.463 0.468 0.465 96.2 98.4 95.7 96.3 98.0 97.1 98.1 97.6 92.2
SK 0.300 0.315 0.328 0.338 0.317 0.327 0.333 0.323 63.0 66.1 68.7 70.9 66.5 68.6 69.8 67.8 64.0
FI 0.636 0.631 0.631 0.632 0.621 0.632 0.641 0.649 133.3 132.4 132.3 132.7 130.3 132.6 134.5 136.1 128.7
SE 0.684 0.690 0.694 0.700 0.686 0.693 0.708 0.710 143.5 144.8 145.5 146.7 143.8 145.4 148.4 149.0 140.8
UK 0.546 0.533 0.534 0.526 0.553 0.568 0.612 0.613 114.5 111.9 111.9 110.4 116.0 119.0 128.3 128.5 121.5
IS 0.580 0.587 0.606 0.601 0.597 0.602 0.576 0.576 121.7 123.2 127.2 126.2 125.3 126.2 120.9 120.8 114.2
IL 0.562 0.564 0.569 0.576 0.535 0.545 0.542 0.541 117.9 118.3 119.4 120.8 112.3 114.4 113.7 113.4 107.2
MK 0.164 0.178 0.177 0.189 0.198 0.204 0.215 0.222 34.4 37.3 37.2 39.7 41.5 42.8 45.0 46.5 44.0
NO 0.478 0.492 0.482 0.487 0.477 0.488 0.572 0.571 100.2 103.1 101.1 102.1 100.0 102.3 120.0 119.7 113.1
RS 0.272 0.268 0.327 0.341 0.353 0.356 0.341 0.335 57.1 56.2 68.6 71.5 74.0 74.8 71.5 70.3 66.5
CH 0.760 0.764 0.760 0.755 0.766 0.782 0.799 0.808 159.4 160.3 159.5 158.5 160.8 164.0 167.6 169.4 160.1
TR 0.214 0.223 0.217 0.219 0.275 0.279 0.280 0.286 45.0 46.8 45.5 45.9 57.8 58.6 58.7 60.1 56.8
UA 0.149 0.146 0.140 0.138 0.135 0.145 0.124 0.140 31.2 30.7 29.4 28.9 28.4 30.4 25.9 29.4 27.8
Annex F: Summary Innovation Index (SII) time series

99European Innovation Scoreboard 2018
HUMAN RESOURCES
RESEARCH SYSTEMS
INNOVATION- FRIENDLY
ENVIRONMENT
FINANCE AND SUPPORT
FIRM INVESTMENTS INNOVATORS LINKAGES INTELLECTUAL
ASSETSEMPLOYMENT
IMPACTSSALES
IMPACTS
2017 2017 2017 2017 2017 2017 2017 2017 2017 2017
EU28 100 100 100 100 100 100 100 100 100 100
BE 106.5 168.0 107.3 99.8 133.8 161.3 161.8 83.5 78.5 75.2
BG 54.2 28.0 52.9 21.0 51.4 14.3 32.0 85.8 102.4 33.0
CZ 78.4 72.5 79.2 47.3 103.9 86.1 77.6 62.7 115.1 94.8
DK 184.2 181.7 197.8 102.6 109.1 111.9 131.3 165.8 100.5 75.1
DE 94.4 92.2 100.7 102.0 156.4 152.6 125.2 147.6 100.3 114.7
EE 103.8 89.5 103.8 89.6 67.5 28.3 75.6 110.6 74.5 62.8
IE 140.7 141.5 96.6 75.8 93.5 170.0 89.1 46.9 164.8 127.7
EL 70.7 90.0 40.3 38.7 54.7 117.7 90.2 35.1 68.9 45.6
ES 118.6 86.9 107.3 80.2 67.8 42.0 68.6 72.2 90.2 73.6
FR 124.4 129.2 101.5 141.3 87.6 121.4 101.5 86.0 92.0 105.3
HR 45.0 37.2 40.6 37.3 96.7 72.1 66.5 29.6 68.6 25.6
IT 54.7 87.5 63.2 55.1 57.7 105.6 56.5 103.4 74.4 74.0
CY 95.7 104.4 45.6 42.6 54.2 101.1 59.8 114.4 60.8 73.1
LV 66.8 49.1 105.5 99.8 33.5 14.7 43.9 48.4 93.6 44.4
LT 96.8 34.8 123.0 59.4 93.2 92.6 102.0 51.0 39.3 35.1
LU 126.0 197.8 143.5 124.7 68.9 142.2 62.2 153.0 138.6 84.8
HU 45.7 58.4 88.1 46.4 78.3 17.6 69.5 39.2 124.3 95.1
MT 55.8 141.7 123.6 6.9 71.4 79.0 11.8 166.8 139.7 54.5
NL 146.1 182.6 159.4 130.2 76.4 127.3 151.2 126.6 115.3 91.7
AT 112.8 138.5 86.7 91.8 134.8 141.9 143.5 146.2 65.6 79.6
PL 60.5 29.4 95.1 30.8 81.0 3.4 37.6 74.5 91.9 53.1
PT 83.8 106.4 133.2 65.1 74.7 116.1 54.3 73.4 82.3 43.1
RO 18.8 26.1 72.3 20.8 11.9 0.0 37.7 22.3 34.6 64.0
SI 143.6 90.2 87.7 33.4 121.0 95.6 112.3 80.2 75.4 75.0
SK 77.6 50.5 59.3 27.6 57.0 33.9 68.0 35.3 118.6 101.2
FI 165.2 137.8 183.7 110.3 132.5 141.4 132.6 146.7 83.5 77.6
SE 179.6 176.5 190.5 111.6 157.9 126.8 131.0 156.6 131.4 82.1
UK 151.4 173.2 92.2 107.6 101.9 99.5 133.5 81.5 144.0 123.2
IS 125.9 165.5 197.8 113.6 120.3 143.6 156.7 57.3 146.3 35.1
IL 88.1 115.0 83.9 42.3 218.2 86.7 139.9 102.3 185.0 92.1
NO 143.4 146.4 144.0 136.5 124.9 139.1 136.2 44.8 94.9 49.8
MK 35.8 67.1 40.1 30.5 62.4 63.9 43.7 14.2 6.5 44.5
RS 64.1 32.7 18.5 37.7 118.3 84.1 94.0 24.2 93.5 58.5
CH 198.1 221.4 144.9 117.4 210.0 186.8 140.8 163.3 117.4 110.0
TR 31.4 38.1 84.1 52.7 126.0 97.5 63.7 9.0 10.8 53.6
UA 110.3 19.6 4.1 15.5 40.1 18.6 9.5 13.3 77.5 31.5
Annex G: Performance scores per dimensionPerformance is measured relative to that of the EU in 2017.

100 European Innovation Scoreboard 2018
Performance in 2017 relative to EU in 2010 AU BR CA CN IN JP KR RU SA US
2017 2017 2017 2017 2017 2017 2017 2017 2017 2017
1.1.1 New doctorate graduates 123.8 23.4 78.4 10.8 5.7 61.5 83.8 60.6 11.0 80.8
1.1.2 Population completed tertiary education 133.7 43.8 171.9 39.5 29.9 154.3 143.2 169.9 36.8 139.5
1.2.1 International scientific co-publications 183.9 51.5 183.0 36.4 20.0 80.5 104.6 54.8 68.1 126.6
1.2.2 Scientific publications among top 10% most cited 117.1 49.8 115.0 77.4 60.7 59.4 62.5 34.0 71.6 130.8
2.1.1 R&D expenditure in the public sector 120.6 93.3 115.5 70.7 78.6 92.4 129.8 66.8 57.5 100.7
2.2.1 R&D expenditure in the business sector 80.8 41.9 65.7 132.0 23.5 199.1 240.1 51.8 27.8 157.2
3.1.1 SMEs with product or process innovations 181.1 114.8 172.2 n/a 58.4 80.2 96.4 15.4 n/a 72.6
3.1.2 SMEs with marketing or organisational innovations 136.7 181.8 154.7 n/a 134.4 95.2 84.8 7.8 158.9 n/a
3.2.1 Innovative SMEs collaborating with others 131.0 52.8 n/a n/a n/a 164.7 21.4 9.8 168.9 n/a
3.2.2 Public-private co-publications 80.0 5.6 104.7 16.7 2.0 118.4 156.4 5.4 6.9 169.2
3.2.3 Private co-funding of public R&D expenditures 108.0 n/a 109.9 119.8 n/a 34.6 131.8 124.4 58.5 42.3
3.3.1 PCT patent applications 78.0 28.0 86.1 67.4 33.6 161.7 161.7 33.6 41.4 111.8
3.3.2 Trademark applications 228.3 99.8 178.8 266.0 67.9 158.6 233.3 130.3 96.7 55.2
3.3.3 Design applications 96.7 52.4 73.9 208.6 41.9 91.0 229.9 50.9 65.2 58.8
4.2.1 Medium & high tech product exports 19.0 47.3 67.8 91.7 51.7 118.8 119.8 21.1 63.5 85.7
4.2.2 Knowledge-intensive services exports 33.4 78.3 82.2 49.4 119.1 66.5 44.8 95.6 20.6 86.4
Change in performance (2010-2017) AU BR CA CN IN JP KR RU SA US
1.1.1 New doctorate graduates 9.1 -0.5 1.0 -2.1 -1.2 -7.3 10.3 -24.6 2.5 -16.0
1.1.2 Population completed tertiary education -2.6 -2.2 -11.4 3.0 -5.6 -8.0 -0.7 -22.6 -3.7 -11.4
1.2.1 International scientific co-publications -22.6 5.4 -6.6 8.8 1.0 -5.1 -2.0 1.5 4.7 -2.3
1.2.2 Scientific publications among top 10% most cited 2.1 3.7 -1.3 9.0 -0.4 -3.8 -1.0 5.9 4.4 -8.8
2.1.1 R&D expenditure in the public sector -2.2 2.2 -10.5 4.9 -1.1 -7.0 12.0 7.1 0.3 -8.1
2.2.1 R&D expenditure in the business sector -32.7 -4.5 -19.0 20.1 1.5 -14.9 9.0 -4.8 -16.9 -9.0
3.1.1 SMEs with product or process innovations 24.0 5.3 5.7 n/a 6.6 3.5 -8.0 4.1 n/a 6.2
3.1.2 SMEs with marketing or organisational innovations 26.6 34.9 18.7 n/a 28.2 13.2 50.1 1.6 33.3 n/a
3.2.1 Innovative SMEs collaborating with others -18.7 -9.8 n/a n/a n/a 43.8 -110.5 2.0 -31.2 n/a
3.2.2 Public-private co-publications -17.9 0.1 -25.0 8.9 0.1 -28.0 12.8 -0.7 -1.8 -10.0
3.2.3 Private co-funding of public R&D expenditures 9.2 n/a -10.2 -6.1 n/a 8.6 14.0 -5.3 16.2 1.4
3.3.1 PCT patent applications -9.9 2.0 0.2 23.5 2.2 16.2 32.1 3.8 -6.7 6.6
3.3.2 Trademark applications -32.6 4.0 -12.0 84.2 -7.3 67.8 -5.0 -17.7 -10.1 2.2
3.3.3 Design applications 4.4 0.4 5.0 2.8 1.1 -3.3 14.6 1.8 65.2 9.4
4.2.1 Medium & high tech product exports 4.9 8.1 10.6 -3.6 11.7 -4.2 2.0 7.7 16.4 1.5
4.2.2 Knowledge-intensive services exports 4.4 -25.5 -4.9 -42.4 -0.4 -57.0 -46.9 1.5 0.9 3.8
Annex H: International data
Performance change is measured as the difference between performance in 2017 relative to the EU average in 2010 and performance in 2010 relative to the EU average in 2010 (the
results are the same as those shown in the final column in the performance tables in the country profiles in Section 5.3)

Getting in touch with the EU
In personAll over the European Union there are hundreds of Europe Direct information centres. You can find the address of the centre nearest you at: https://europa.eu/european-union/contact_en
On the phone or by emailEurope Direct is a service that answers your questions about the European Union. You can contact this service: - by freephone: 00 800 6 7 8 9 10 11 (certain operators may charge for these calls), - at the following standard number: +32 22999696 or - by email via: https://europa.eu/european-union/contact_en
Finding information about the EU
OnlineInformation about the European Union in all the official languages of the EU is available on the Europa website at: https://europa.eu/european-union/index_en
EU publications You can download or order free and priced EU publications from EU Bookshop at: https://publications.europa.eu/bookshop. Multiple copies of free publications may be obtained by contacting Europe Direct or your local information centre (see https://europa.eu/european-union/contact_en).
EU law and related documentsFor access to legal information from the EU, including all EU law since 1952 in all the official language versions, go to EUR-Lex at: http://eur-lex.europa.eu
Open data from the EUThe EU Open Data Portal (http://data.europa.eu/euodp/en) provides access to datasets from the EU. Data can be downloaded and reused for free, both for commercial and non-commercial purposes.

European Innovation Scoreboard 2018