european commission, dg mare studies for carrying out … · msy: maximum sustainable yield ......
TRANSCRIPT

i
European Commission, DG MARE
Studies for carrying out the Common Fisheries Policy:
Lot 3 Socio-economic dimensions in EU fisheries
Shetland: Lerwick case study report
Picture courtesy of Lerwick Port Authority
October 2013

ii
Lerwick case study report
Contents
List of figures.......................................................................................................................................iv
Abbreviations and acronyms...............................................................................................................v
1. Methods.........................................................................................................................................1 1.1 Secondary data sources....................................................................................................................1 1.2 Interviews with focus groups............................................................................................................1 1.3 Questionnaires...................................................................................................................................1
2. Settings.........................................................................................................................................2 2.1 Description of the Lerwick case study site......................................................................................2 2.2 Demographics.....................................................................................................................................4 2.3 Employment opportunities/sector overview....................................................................................4 2.4 Fisheries..............................................................................................................................................5
Infrastructure.................................................................................................................................................................5 Seasonality....................................................................................................................................................................5 2.4.1 Whitefish fleet (demersal).............................................................................................................................7 2.4.2 Pelagic fleet.................................................................................................................................................13 2.4.3 Shellfish fleet...............................................................................................................................................15
2.5 Summary of settings........................................................................................................................19
3. Linkages......................................................................................................................................20 3.1 Inter-sectoral linkages.....................................................................................................................20
Geographical..............................................................................................................................................................20 Labour.........................................................................................................................................................................20
3.2 Intra-sectoral linkages.....................................................................................................................21 3.2.1 Between fleet segments.................................................................................................................................21 3.2.2 Between subsectors........................................................................................................................................22
3.3 Summary of linkages.......................................................................................................................23
4. Role of fishing.............................................................................................................................24 4.1 Fisheries as an economic activity...................................................................................................24
4.1.1 Diversification...................................................................................................................................................24 4.2 Adaptation.........................................................................................................................................25
4.2.1. Analysis of adaptive response......................................................................................................................25 4.3 Future development of the community..........................................................................................26
5. Summary and conclusions........................................................................................................27

iii
List of tables
Table 1: Fleet segments in Lerwick fleet .................................................................................................. 7
Table 2: Summary of fishing fleets in Lerwick ........................................................................................ 19

iv
List of figures
Figure 1: Location of Lerwick in the Shetland Islands. ............................................................................. 3
Figure 2: Age, gender and place of origin for crew types in Lerwick ........................................................ 8
Figure 3: Whitefish (demersal) landings into Lerwick from 2003-11 ........................................................ 9
Figure 4: Whitefish (demersal) landings value into Lerwick from 2003-11 ............................................. 10
Figure 5: Whitefish (demersal) landings price into Shetland from 2003-11 ............................................ 10
Figure 6: Pelagic landings volumes into Lerwick from 2003-11 ............................................................. 14
Figure 7: Pelagic landings values into Lerwick from 2003-11 ................................................................ 14
Figure 8: Pelagic landings price into Lerwick from 2003-11 ................................................................... 15
Figure 9: Age, gender and place of origin for crew types in Lerwick ...................................................... 16
Figure 10: Shellfish landings volume Lerwick 2003-11 .......................................................................... 17
Figure 11: Changes in vessel number in Lerwick 2003-11 .................................................................... 17
Figure 12: Proportion of the population employed in fish catching and the entire fish sector in Shetland, 1997-2011 ..................................................................................................................................... 24
Figure 13: Length of time in the Lerwick fishing industry ....................................................................... 25

v
Abbreviations and acronyms
DCF: data collection framework
FTE: full-time equivalent
GBP: British Pound (€1 is equal to GBP 0.84 in April 2013)
ICES: International Council for the Exploration of the Sea
MSC: Marine Stewardship Council
MSY: maximum sustainable yield
NAFC: North Atlantic Fisheries College
SFA: Shetland Fishermen’s Association
SFF: Scottish Fishermen’s Federation
SFCT: Shetland Fisheries Training Centre Trust
SFPO: Shetland Fish Producers’ Organisation
SIC: Shetland Islands Council
SSMO: Shetland Shellfish Management Organisation
SSQC: Shetland Seafood Quality Control

1
1. Methods
1.1 Secondary data sources A number of data sources have been used to prepare this report, including:
data on fish landings – from Marine Scotland Science Fisheries statistics;
population statistics – from Scottish Government neighbourhood statistics and Shetland Health Board;
employment statistics – provided by the Shetland Islands Council Economic Development Unit.
Some data is only available at the Shetland level as it is collected only at county (Shetland) scale.
1.2 Interviews with focus groups Stakeholder group A comprised community council representatives, councillors, Shetland Islands Council Economic Development department, Shetland Seafood Auctions, Shetland Aquaculture, Shetland Fishermen’s Association (SFA), Shetland Seafood, representatives from the fishing industry and a former community councillor. Three stakeholder sessions were held for fishers. All fishers in the community were invited to the sessions by letter/email, posters and radio advertisement. Due to the high level of shareholder ownership within the fleet it was not possible prior to the session to distinguish between owner and non-owner crew. Eight vessel skippers attended, representing approximately 9 % of all fishers present. Given the working rotations of fishers this is thought to represent 60 % of those ashore during the survey period. Three of the 12 whitefish boats in Lerwick were represented (25 %) and two of the shellfish vessels were represented (7 %). Fishers reported that attendance would have been higher but distrust of EU-led projects prevented attendance.
1.3 Questionnaires All vessels are shareholder-owned by a number of the boat’s crew (varying from 60-100 %), making it difficult to distinguish between owners and crew. There is a low level of crew mobility within the fleet, so non-shareholding crew also have a sense of ownership of the vessels. All stakeholder representatives completed crew questionnaires. Skippers also completed the 'owners' questionnaire in addition to the crew questionnaire.

2
2. Settings
2.1 Description of the Lerwick case study site Lerwick is Shetland’s largest port area, run by Lerwick Port Authority (LPA). Lerwick harbour accommodates small vessels (recreation and small shellfish boats) in two marina areas; larger fishing boats are accommodated across three dock areas as well as large oil vessels. Whitefish (demersal), shellfish and pelagic fish are landed into Lerwick.
Lerwick is connected to the mainland via daily air services to the Scottish mainland and daily passenger and cargo ferries, which both run overnight (12-hour sailings) from Lerwick to Aberdeen, which is situated 338 km to the south of the Shetland Islands and is the nearest large port. Bergan is the second nearest major port, situated 360 km to the east. The Shetland Islands are 477 km from the Scottish capital Edinburgh and 957 km from the UK capital, London. The seas around Shetland are highly productive, supporting inshore shellfish and offshore pelagic and whitefish fisheries. Lerwick is situated in the North Sea, with the divide between the North Atlantic and North Sea crossing through the Shetland Islands N-S. This eastern side of the Shetland Islands includes an extensive offshore area characterised by flat, sandy seabed with occasional pockmarks (seabed craters), and small inshore firths often with sandbanks, mud flats and sandy beaches. In contrast, the western side of Shetland Islands has a rockier coastline, exposed to the full force of the Atlantic. Fishing became increasingly important to Shetland during the 15th century when there are records of trade of Shetland trading fish and related products with mainland Europe. The first evidence of the use of drift net fishing is from this period, used to catch herring, a method that remained in use until the 1960s. Fishing for herring boomed in Shetland and elsewhere in the early 20th century. In Shetland it employed 13,543 crew members at its peak, with an estimated 9,500 incomers present during the herring season. From 1905 a steady decline in the herring industry was observed: the 1st and 2nd World Wars reduced trade opportunities. Pre-1965 drift netting was the only commercial method used by the pelagic fleet. The purse-seine technique was introduced from Scandinavia in 1965. The purse-seine increased catches and was less labour intensive. In 1986 the pelagic trawl was introduced from Ireland: 2 pelagic boats successfully adopted this fishing method. This technological advance allowed deeper water trawling and trawling in a greater variety of conditions. Increasingly, the fishing technique became mechanised and computerised, creating a large, efficient, modern industry. During the 1970s Shetland economic prosperity increased, first with increased profitability of the traditional industries such as fishing and knitwear, then with the building of the Sullom Voe oil terminal. During the construction phase up to 7,000 workers were accommodated within Shetland. Sullom Voe led to increased employment opportunity and pay. Shetland also benefited through a charge on every

3
barrel of oil brought through the terminal. This income has been used to invest in new industries and to improve local infrastructure.
Figure 1: Location of Lerwick in the Shetland Islands.
During the 1980s the development of aquaculture created a new industry in Shetland, and is now one of Shetland’s largest industries. There are no fish farms situated in the Lerwick Port area, but Lerwick is home to the largest finfish-processing factory in Shetland, 'Lerwick Fish Traders' which has approximately 100 employees (full-time and part-time). Lerwick is home to approximately 50 % of the Shetland whitefish fleet. It should be noted that all the Shetland whitefish fleet lands primarily into Lerwick but all boats also land into Scalloway and Cullivoe. The Shetland fleet landed 10,222 tonnes of fish across the islands, valued at GBP 18.7 million (EUR 22.25 million), 10 % of the total Scottish catch. Pelagic fishing, in particular mackerel, has also become an increasingly large fishery with the capital value of the Shetland pelagic industry valued at GBP 750 million (EUR 892.5 million) in 2011. There are no Lerwick-owned-and-operated pelagic boats, although a number of Whalsay pelagic boats berth in

4
Lerwick due to insufficient harbour facilities in Whalsay. The Shetland pelagic fleet represents 30 % of the Scottish fleet. Shellfish are landed all over Shetland. In 2010 they were valued at GBP 5.8 million (EUR 6.9 million), slightly less than 1 % of all Scottish vessel landings. Shellfish landings into Lerwick represented approximately 40 % by weight and volume of all Shetland landings.
2.2 Demographics The population estimate for Lerwick is 7,500, 34 % of the total for Shetland. A breakdown in age structure for the Lerwick population is not available but is likely to be similar to that of the whole of Shetland (see national level report). Shetland has a very small proportion of non-UK residents which is also true of Lerwick, though it is likely to be the area of Shetland with the highest proportion of non-EU residents. Across Shetland the country of origin of community members is 98.1 % from the UK, higher than the Scottish average of 91 % UK. A breakdown of residents whose origins are non-UK is not available at a Shetland level.
The number of individuals entering and leaving Lerwick is not available. The average life expectancy at birth is also not available at the Lerwick level and could not be accurately estimated, due to the population size, but is likely to be similar to that of the whole of Shetland (see national level report).
2.3 Employment opportunities/sector overview Lerwick is one of the key employment centres of Shetland and is the largest employment area for the public and private sectors. There are 5,414 full-time equivalent (FTE) jobs in Lerwick, higher than the population would suggest, indicating that people commute to Lerwick for work. Employment opportunities within Lerwick include: marine engineering, construction, aquaculture, retail, education, ferries, leisure centre, oil service industry, fish processing, social care and public sector jobs. Sullom Voe is within commuting distance of Lerwick, approximately 40 km to the north. The fishing industry provides direct employment within Lerwick but also to related sectors such as marine engineering, processing and transportation. Many of the key fishery facilities for Shetland, such as dry dock, are only available in Lerwick. In 2009 the average yearly wage in Lerwick was at GBP 30,111 (EUR 34,929), slightly lower than the Shetland of GBP 30,180 (EUR 35,008). The median weekly wage in Shetland in 2012 was GBP 546.1 (EUR 655), higher than the Scottish and UK median weekly wage, at GBP 498.3 (EUR 598) and GBP 508.0 (EUR 610) respectively. This represents a more rapid increase in the weekly median wage since 2007 than both Scotland and the UK, reflecting, in part, the recent increase in employment opportunities caused by large-scale projects, such as the construction of the Total Gas plant. Unemployment statistics are not available beyond the Shetland level. Unemployment in Shetland is below the national average, varying between 1.7 % and 2.2 % since 2005. This is below the Scottish and UK average, currently 7.6 % and 7.8 % respectively.

5
Within Lerwick it is estimated that there are 100 fishers, just fewer than 2 % of all FTE employment, similar to the Shetland average of 2 % (see national level report for more information). This is higher than the Scottish average of 0.2 %. Fisheries (fish catching, aquaculture and fish processing) directly employ 8.6% of the workforce across Shetland. While there are no aquaculture sites in Lerwick it is likely that a number of individuals will commute to other areas of Shetland to work in the industry.
2.4 Fisheries Total landings into Lerwick in 2011 by Shetland and non-Shetland boats were 65,862 tonnes, with a value of GBP 81.6 million (EUR 94.7 million). In Lerwick landings volume has also declined but landing value has increased. The number of individuals across Scotland employed in fishing reached its lowest level in 2011. This trend was also observed in Shetland. However, fishing remains a significant employer in Shetland, with 2 % of all FTE employment opportunities in Lerwick and across the Shetland Islands in the fish catching. This is higher than the Scottish average of 0.2 %. Fisheries (fish catching, aquaculture and fish processing) directly employ 8.6 % of the workforce across Shetland Islands. Fishing remains a significant and well-regarded industry within Lerwick and Shetland. Fishing representatives expressed concern that national anti-fishing campaigns had affected the perception of fishing locally and nationally. While the fleets have remained in local ownership a small number of non-EU crew have now been employed by Lerwick based boats. The Shetland pelagic fleet is of regional (Shetland) and national (Scottish) importance, with all landings within Shetland being made to Lerwick. While there are positive trends in terms of the value of the landings, the fishing sector faces significant challenges. Lerwick community and fisheries representatives and fisheries owners expressed concern that rising fuel prices, quota costs, quota restrictions and reduction in days at sea has reduced the profitability of the sector, particularly for the whitefish fleet. This makes it more difficult to attract investment to upgrade vessels and makes the industry less attractive to young people.
Infrastructure Lerwick Port Authority is an independent trust and all income is re-invested in the port. Lerwick harbour offers a range of facilities for fishing boats including fish processing, sales, marine engineering, transportation and supplies including fuel, nets and ropes.
Seasonality Employment in Lerwick is dominated by full-time, year-round work, with only the tourism sector showing seasonality. Business tourism provides a significant proportion of the tourism industry, and does not have a seasonal pattern. Whitefish fishing is non-seasonal and occurs year round. Due to the reduction in days at sea some boats may choose fishing trips based on weather and market prices. Pelagic fishing is highly seasonal,

6
with mackerel fishing taking place from January to March and herring and mackerel from August to October. Shellfish fishing takes place year round, although creel fishing levels can be higher in the summer when the weather is better, reducing the risk of losing gear.
Fleet Lerwick is home to 40 % of the Shetland fleet. The fleet can be broken down into two main fisheries: inshore shellfish (creel and scallop dredge) (83 %) and whitefish (demersal) (17 %), Fleet segments in Lerwick fleet. This differs to the rest of Shetland: shellfish (82 %), whitefish (13 %) and pelagic (5 %). Nationally, the Scottish fleet can be broken down into inshore shellfish (88 %), demersal (11 %) and pelagic (1 %). The Lerwick whitefish fleet has reduced in recent years due to decommissioning; however, it still represents 50 % of the Shetland fleet and 5 % of the Scottish fleet. There are no Lerwick-owned pelagic boats, although a number berth in the harbour. In Lerwick the shellfish fleet comprises creel, nephrops and scallop dredgers. The Shetland shellfish fleet represents 10 % of the total Scottish shellfish fleet. In Shetland the shellfish fleet comprises nearly all vessels 0-24 m in length with only one shellfish vessel over 24 m. The shellfish fleet can be broken down into creel (32 %), scallop dredge (6 %) and Nephrops trawl (3 %) of the total Lerwick fleet. In comparison the Scottish fleet comprises 76 % creel, 10 % scallop and 13 % Nephrops. Restrictions on the number of scallop dredges mean that it is not economical to operate large shellfish trawling boats. This has meant that smaller boats dominate the Shetland shellfish fleet. Changes of gear type (e.g. trawl to seine net) within the whitefish fleet or changes to fishing areas are hampered by the quota restrictions. Targeting of new species requires the acquisition of new quota.

7
Table 1: Fleet segments in Lerwick fleet
Segment (length class)
Number of vessels
Shetland fleet
Main gears used
Number of crew (average)
Main species fished (list at least 3 and up to 5 for all fleet types)
0-10 23 109 (21 %) creel 1 lobster, brown crab, green crab, velvet crab
0-10 2 3 (67 %) trawl 1 nephrops
0-10 3 20 (15 %) scallop dredge 1 king and queen scallop
10-15 1 6 (17 %) scallop dredge 2 king and queen scallop
15-40 12 24 (50 %) trawl - TR1 6 cod, whiting, haddock, anglerfish
Total 72 175 (41 %) Source: Scottish Government.
2.4.1 Whitefish fleet (demersal)
Fleet segment as a whole The Lerwick whitefish fleet has historically been locally owned by a number of shareholders who also work on the boat. All boats are still locally owned (rather than owned by external companies). While shareholders and crew are related in some instances this is not true of all shareholders or all boats. Historically, groups of fishermen would coordinate to buy a new boat; however, this has become increasingly difficult due to availability and cost of quota. Working patterns have changed due to the reduction in days at sea, which now means that some boats can only fish 120 days per year. Working patterns differ between vessels. Most boats work between one and two weeks at sea, followed by between one to two weeks at home. Some boats work a rotating crew system, e.g. five on board four on shore. Wind direction and strength is one driver on the choice of fishing areas. In response to strong winds fishermen traditionally fished closer inshore and on the leeward side of Shetland. However, reductions in permitted days at sea and cod closed areas has restricted the choice of fishing grounds. This has reduced the fleet’s ability to fully exploit available grounds and has meant vessels increasingly have to exploit the same areas. Increasing cost of fuel and the reduction in days at sea has meant that fishers are targeting grounds further inshore, targeting shoaling fish such as cod, haddock and saithe, rather than high value but more dispersed species such as monkfish. Vessels are crewed by four to nine people, with normally four to six on board at any one time. The crew types are skipper, engineer, mates, cooks and deckhands. Any of these individuals may be shareholders, although normally skippers are always shareholders. There are no managerial or administrative roles associated with the vessels. Crew demographics, based on responses from surveyed skippers (total crew=21), are shown in Figure 2.

8
Figure 2: Age, gender and place of origin for crew types in Lerwick
No evidence of spouse or partner involvement (formal or informal) in the whitefish industry has been found. Previous involvement of spouses or partners would have been in ancillary industries such as fish processing but would not have been directly employed by the vessels. The wild-caught fish processing sector has decreased in Shetland, with a number of whitefish factories now closed. Fish processing has also become less labour intensive and, while it is still a form of employment in Shetland, the number of people employed in fish processing has decreased. Fish processing is now also dependent on non-Shetland and non-EU staff: many Shetland women now have greater opportunity to access better paid and higher skilled jobs in other, largely non-manual sectors. Of those surveyed 70 % had fathers who had also been fishermen. As all crew members were not surveyed it is difficult to quantify broader family involvement, however, of those surveyed only 25 % reported that family members also worked on the same vessel. All family involvement was formally paid as crew of the boats.
Economics In 2011 the Scottish, Shetland and Lerwick whitefish fleets have shown record landing values. This is reflective of the increase in price of key stocks. However, operating costs, including quota costs and fuel, have become more significant. Fuel prices have risen sharply and now represent up to 50 % of the boat costs. The whitefish fleet is particularly vulnerable to the cost of fuel because of the fuel required to tow gear over the seabed. Modern boats are more fuel efficient due to improved hull, engine and gearbox design. Loans and funding for investment in new boats or improvements to existing boats is difficult to gain so there is concern regarding an aging fleet.
Landings Lerwick is Scotland’s second largest whitefish landings port, and Shetland’s largest port with 66 % of all Shetland landings made into Lerwick. In 2011, the whitefish landing volume into Lerwick was 9,559 tonnes. Landings volumes peaked in 2008 at 10,659 tonnes and have since been declining; however,

9
landings are higher than pre-2008 levels. The landing volume of haddock has declined since 2005, while the landing volumes of cod, saithe and megrims have increased. The landing volume of anglerfish has declined since 2009, however landings in 2011 increased relative to 2010. Landings volumes are shown in Figure 3.
Figure 3: Whitefish (demersal) landings into Lerwick from 2003-11
Source: Scottish Government.
Whitefish landings value in Lerwick in 2011 was GBP 18.4 million (EUR 21.34 million). Total landings value increased in 2011, only slightly lower than the peak in total landings value in 2008. Anglerfish have the highest landings value of species landed, with landings value peaking in 2009. Cod has shown an increasing landing value and has the second highest landing value. The landing value of haddock has decreased from 2008, reflecting the reduction in landing volume. Saithe, megrims and whiting have increased in landings value. Landings values are shown in Figure 4 .
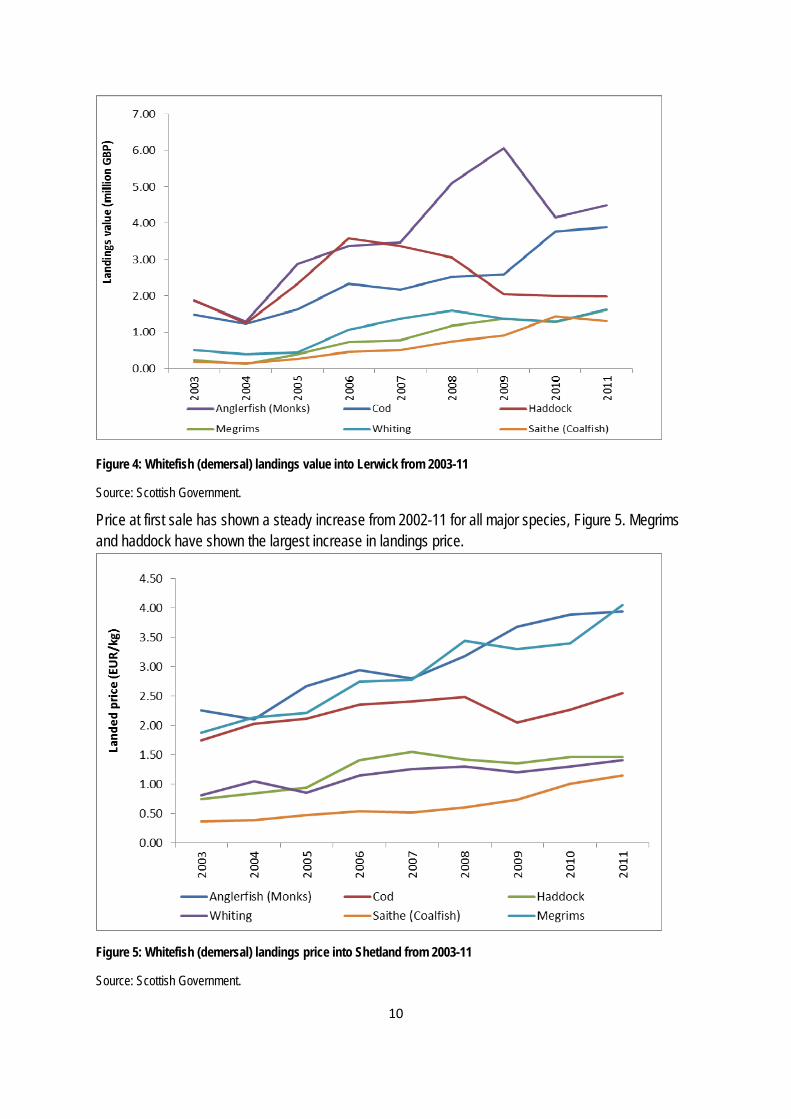
10
Figure 4: Whitefish (demersal) landings value into Lerwick from 2003-11
Source: Scottish Government.
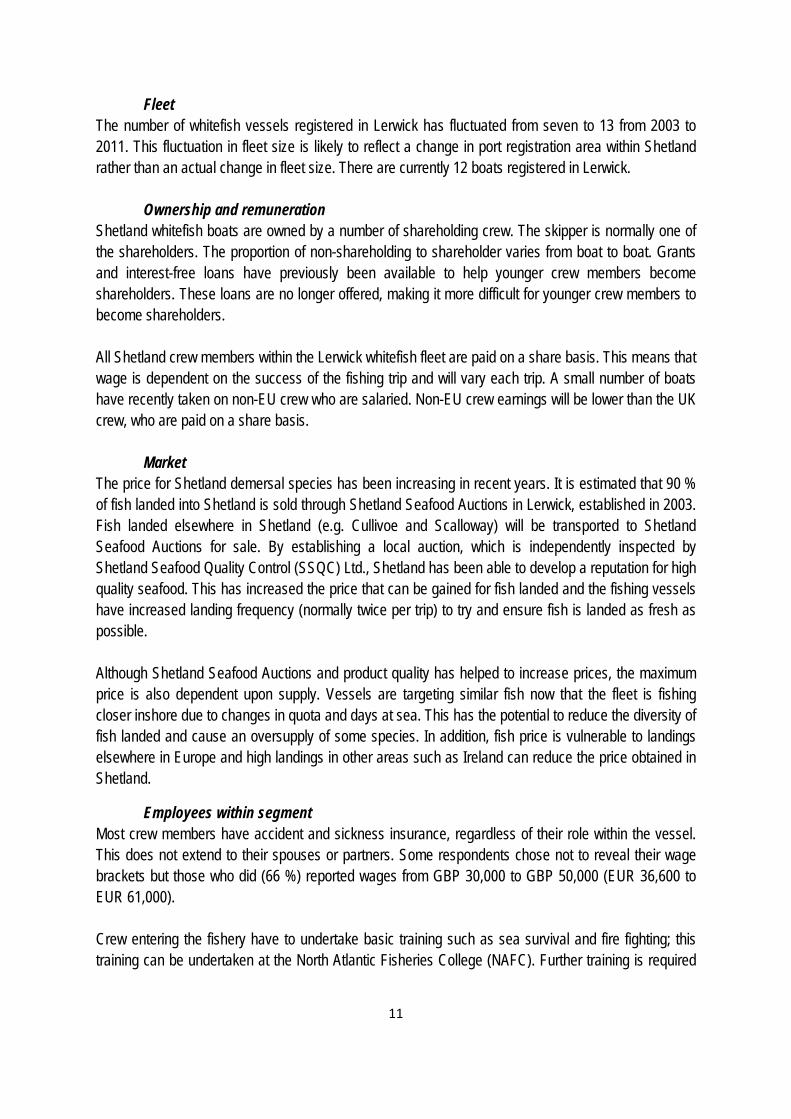
Price at first sale has shown a steady increase from 2002-11 for all major species, Figure 5. Megrims and haddock have shown the largest increase in landings price.
Figure 5: Whitefish (demersal) landings price into Shetland from 2003-11
Source: Scottish Government.
11
Fleet The number of whitefish vessels registered in Lerwick has fluctuated from seven to 13 from 2003 to 2011. This fluctuation in fleet size is likely to reflect a change in port registration area within Shetland rather than an actual change in fleet size. There are currently 12 boats registered in Lerwick.
Ownership and remuneration Shetland whitefish boats are owned by a number of shareholding crew. The skipper is normally one of the shareholders. The proportion of non-shareholding to shareholder varies from boat to boat. Grants and interest-free loans have previously been available to help younger crew members become shareholders. These loans are no longer offered, making it more difficult for younger crew members to become shareholders. All Shetland crew members within the Lerwick whitefish fleet are paid on a share basis. This means that wage is dependent on the success of the fishing trip and will vary each trip. A small number of boats have recently taken on non-EU crew who are salaried. Non-EU crew earnings will be lower than the UK crew, who are paid on a share basis.
Market The price for Shetland demersal species has been increasing in recent years. It is estimated that 90 % of fish landed into Shetland is sold through Shetland Seafood Auctions in Lerwick, established in 2003. Fish landed elsewhere in Shetland (e.g. Cullivoe and Scalloway) will be transported to Shetland Seafood Auctions for sale. By establishing a local auction, which is independently inspected by Shetland Seafood Quality Control (SSQC) Ltd., Shetland has been able to develop a reputation for high quality seafood. This has increased the price that can be gained for fish landed and the fishing vessels have increased landing frequency (normally twice per trip) to try and ensure fish is landed as fresh as possible. Although Shetland Seafood Auctions and product quality has helped to increase prices, the maximum price is also dependent upon supply. Vessels are targeting similar fish now that the fleet is fishing closer inshore due to changes in quota and days at sea. This has the potential to reduce the diversity of fish landed and cause an oversupply of some species. In addition, fish price is vulnerable to landings elsewhere in Europe and high landings in other areas such as Ireland can reduce the price obtained in Shetland.
Employees within segment Most crew members have accident and sickness insurance, regardless of their role within the vessel. This does not extend to their spouses or partners. Some respondents chose not to reveal their wage brackets but those who did (66 %) reported wages from GBP 30,000 to GBP 50,000 (EUR 36,600 to EUR 61,000). Crew entering the fishery have to undertake basic training such as sea survival and fire fighting; this training can be undertaken at the North Atlantic Fisheries College (NAFC). Further training is required

12
to gain engineering and skippers positions and crew are normally employed on reputation and/or recommendation. The boat crew showed low mobility, with most crew members having been with the boats for more than 10 years. The exception was with young crew members who had been with the boats since leaving school but were too young to have been on the boat ten years. All fishers interviewed had secondary education but had not undertaken higher education, most leaving to join the fishing industry at the age of 16. The skills and qualifications gained in the fishing fleet are transferable to both the aquaculture industry, the merchant navy and to the local ferry service. However, all respondents indicated that they did not wish to change profession. Shetland crew are paid as a share of the catch, so any change in profitability of the sector directly affects the income of the crew. Increased costs (such as fuel, quota) and reduction in earning potential (through reduction in days at sea) reduce the potential income of the fleet. Fishers reported that these challenges were reducing the profitability of the sector. In Lerwick these challenges have meant that a number of boats have now taken on foreign crew. Non-EU crew represent 16 % of all crew in Lerwick, this is higher than the Shetland average of 9 %. Skippers reported that they were reluctant to take on new young crew members to the boat in case they could not afford to keep paying them. In some cases, where crew have left, these fishers have not been replaced in an attempt to reduce costs. Fishers who remain in the fishery are often supplementing their fishing income with other jobs such as oil guard duty.
Representation Fishers reported that they felt the socio-economic importance of fishing was recognised locally but reported, at a Scottish and EU level, little understanding or consideration was given to the impact that changing regulations has on fishing-dependent communities. Concern was also raised about the number of Shetland Island Council councillors who have a fishing background, which has declined, as this may reduce understanding of the fishing industry locally. Fisheries representatives reported that despite repeatedly raising concerns about the socio-economic impacts of changing fishing regulation, their views had not been given consideration; for example in stock and days at sea negotiations. Fishers and community representatives voiced distrust as to whether their views or opinions are considered by the EU. In addition, concern was expressed that participation in EU studies may result in information being used to the disadvantage of community and fleets. Concern was also raised that celebrity-led publicity campaigns had the potential to give misleading information regarding the fishing industry, and that these campaigns were being given greater weight than the views of the fishers.
Spousal involvement The fishing vessels are crewed by men and there is no spousal involvement within the fishery.
13
Summary The whitefish fleet in Lerwick has adapted to external pressures by trying to improve the quality of the fish they have landed to increase the price obtained for the fish. Fishing patterns have also been changed, increasing the frequency of landings, fishing at closer grounds and increasingly targeting shoaling fish. Fishers report that fish abundance is highest in living memory; however, they felt that fisheries science was not recognising these changes in stock levels and they wished to see increased scientific study into stock assessments. The fleet faces challenges in financing the modernisation of the fleet to ensure that vessels are economical and efficient to run. Uncertainty generated by quota and reductions in days at sea will create continued economic challenges for the fleet and may discourage young people from joining the fleet, while others take on additional employment to supplement their income.
2.4.2 Pelagic fleet
Fleet segment as a whole The pelagic vessels are operated by shareholding crew and are based in Whalsay and Northmaivine. A number of Whalsay boats are berthed in Lerwick as there is insufficient space for all boats in Whalsay. Due to the efficiency of the fishing method, quota restrictions mean that the fishing season is very short, with mackerel fishing taking place from January to March and herring fishing taking place from August to October.
Economics The pelagic fleet has the highest value of landings of all the fleet segments. The cost of the vessels and quota are high, estimated at GBP 150 million (EUR 183 million) per vessel. The high cost of building a boat and purchasing quota make it unlikely that any new locally owned vessels will join this segment.
Although the pelagic fleet is not based in Lerwick, all Shetland landings are made into Lerwick. Landings into Lerwick were 55,795 tonnes in 2011, accounting for 41 % of landings by UK vessels into the UK and 51 % of all Scottish landings into the UK.
Pelagic landing volumes have decreased from a peak in 2007, Figure 6. Most of this decline can be attributed to the decline in landings of ‘other’ industrial species such as blue whiting. Mackerel landings peaked in 2005 and. after a rapid fall in 2006, landing volumes have increased, although landing in 2011 were lower than in 2010. Herring landings peaked in 2006 and declined until 2009. Herring landings increased in 2010 and 2011.

14
Figure 6: Pelagic landings volumes into Lerwick from 2003-11
Source: Scottish Government.
Pelagic landings value in Shetland in 2011 was GBP 61.77 million (EUR 71.6 million), accounting for 51 % of value of landings by UK vessels into the UK and 57 % of the value of Scottish landings into the UK. Pelagic landings values have increased since 2006 and are now at their highest level. Landings value of mackerel has shown a continuous increase from 2006. Herring landing value has increased since 2009, Figure 7.
Figure 7: Pelagic landings values into Lerwick from 2003-11
Source: Scottish Government.

15
The price at first sale has increased for all pelagic fish categorises, mackerel, herring and ‘other’ small pelagic species (e.g. blue whiting and horse mackerel), Figure 8.
Figure 8: Pelagic landings price into Lerwick from 2003-11
Source: Scottish Government.
While fuel prices will have reduced the economics of the fleet – as the nets are towed through mid-water, rather than across the bottom – fuel is not as high a percentage cost compared to the whitefish fleet. The pelagic fleet comprises modern boats (all built after 2000). The current challenge facing the pelagic fleet has been the granting of new quota to the Icelandic and Faeroes by their government. The quota granted has been against advice from the International Council for the Exploration of the Sea (ICES) and may result in over-fishing. The pelagic fleet, which had been Marine Stewardship Council (MSC) certified, have subsequently lost their certificate.
Summary
The pelagic fleet is a modern efficient fishery, which has retained local ownership. Although no boats are based in Lerwick, all landings are made into Lerwick.
2.4.3 Shellfish fleet
Fleet segment as a whole Due to the small size of the shellfish boats, predominantly <10m, the fleet is normally operated single-handed by the vessel owners. To operate a shellfish boat a local Shetland Shellfish Management Organisation (SSMO) licence is required. This would be on an informal basis.
Of those surveyed, all worked part-time shell fishing, although there are full-time fishers in the fleet. Shellfish fishing is more weather dependent due to the small boat size and the risk of losing static gear; however, fishing takes place all year.

16
Not all fishers interviewed lived in Lerwick, often living in the surrounding area. All fishers surveyed had worked in other fishing sectors. All fishers had gained the qualifications to skipper the shellfish boats while working in other fish catching fleets. All fishers surveyed were 41 to 65 years old, Figure 9.
Figure 9: Age, gender and place of origin for crew types in Lerwick
Economics All those surveyed fished part-time and paid themselves on the operating surplus. Of those who reported an operating profit, all reported an income of less than GBP 15,000 (EUR 18,300). Several fishers reported that the largest cost was paying off the loan for the vessel. However, it should be noted that there are full-time fishers in the fleet and their income will be higher.
Shellfish landings into Lerwick in 2011 were 654 tonnes, which represents 42 % of the total Shetland shellfish landings. The shellfish landings volume in Shetland in 2011 was 1,565 tonnes, accounting for 1 % of landings by UK vessels into the UK and 3 % of all Scottish landings into the UK. Landings into Lerwick therefore account for 0.4 % of all UK vessel landings in to the UK and 1 % of all Scottish landings. In Lerwick landings peaked in 2011. This differs from Shetland as a whole where landings volumes peaked in 2008 and after falling in 2009 have increased in 2010 and 2011. Velvet crabs represent the highest landing volume and have increased rapidly since 2009. Scallops are the second largest landing volume.

17
Figure 10: Shellfish landings volume Lerwick 2003-11
Source: Scottish Government.
Shellfish landings value in Lerwick in 2011 was GBP 1.44 million (EUR 1.67 million), 40 % of the value of Shetland landings, accounting for 1 % of the value landings by UK vessels into the UK vessels and 1.5 % of all the value Scottish landings into the UK. Landing values have increased since 2008. Landings value for all species increased from 2010 to 2011. Scallops have shown the highest increase in landing value. The landings value of velvet crabs has increased since 2003, but has also shown the largest fluctuation in landings value.
The price at first sale of velvet crabs and lobsters has increased in 2011. The price at first sale of edible crabs has remained relatively constant. The price at first sale of scallops has been decreasing since 2006. The number of shellfish vessels has fluctuated year to year, Figure 11. This change is likely to represent vessels moving between ports rather than leaving the sector.
Figure 11: Changes in vessel number in Lerwick 2003-11
Source: Scottish Government.

18
As with all fleet segments, increasing fuel costs have reduced the profitability of the fleet. Fishers reported that the cost of entering the fleet (boat cost) and the difficulty of obtaining a local licence restricted new entrants into the fleet. The fleet has recently gained MSC certification for king and queen scallops, brown and velvet crabs. The dredge fishery was certified after the fleet agreed voluntary closed areas. These areas were developed in consultation with the fishermen.
Employees within segment None of the fishers interviewed had accident or life insurance associated with this vessel, with insurance covered through other boats. The fishers interviewed had all also worked in other fleet segments and shellfish fishing was undertaken as secondary employment. It should be noted that there are full-time fishers within this fleet segment but they did not choose to participate in this study. All fishers interviewed had more qualifications than required to skipper their vessels and were all qualified to skipper or crew larger vessels. The fleet is represented through the SFA. As the fleet is not quota led, representation at an EU level is less relevant to the fleet. The fishers did report that they felt that poorly represented in recent UK media reports.
Summary The fishing fleet comprises small vessels, which are predominantly part time. Shellfish fishing is managed by the SSMO. The fleet has recently gained MSC certification, which may increase the prices the fleet can command.

19
2.5 Summary of settings Fishing remains a key industry within Lerwick. Entry into all fishing segments has become more difficult with the cost of entry high and difficulties of obtaining licences and quota due to increased legislation. It has become increasingly difficult for young people to join the fishing sector. Fishers report a high level of job satisfaction but also report that legislation has made it difficult for the fisheries to operate effectively. Table 2: Summary of fishing fleets in Lerwick
Demersal fleet (whitefish) Pelagic fleet Shellfish fleet
Target species status
85 % MSY. MSY being exceeded due to pressure from non-EU countries.
Stocks stable.
Business type Shareholding crew. Shareholding crew or Limited company owned by crew.
Owner crewed.
Demographics
Average annual income
GBP 30,000-GBP 50,000 n/a GBP 10,000-GBP 15,000
Main education level
School education until 16. Fishing qualifications up to class 2.
School education until 16. Fishing qualifications up to class 1.
School education until 16. Fishing qualifications up to class 2.
Highlights 85 % of Scottish stocks considered to be at MSY. Many stocks increasing. Fishermen reporting large numbers of fish.
Shetland catch considered to be of a high quality; Shetland Seafood Auctions has helped to increase landing price.
Highly efficient.
Previous MSC certification.
Locally managed. Recently gained MSC certification for key species.
Key points Management measures (days at sea/quota) creating difficulties for the fleet.
Fuel costs and quota costs reducing profitability.
Lerwick is key landing port.
Difficult to gain new licence. Vessels normally single-handed.
20
3. Linkages
3.1 Inter-sectoral linkages
Geographical Within Lerwick fishing is a key marine industry, however the fishing fleets have the potential to spatial overlap with other industries. For the inshore fishing fleet cables, pipelines, aquaculture instillations, and proposed renewable devices are the primary potential conflicts. For the offshore fleets, renewables, cables and pipelines, and oil related infrastructure (oil rigs etc.) have the potential to compete for space. Natural heritage designations have the potential to reduce fishing opportunity in the future, through management measures such as restrictions imposed on gear types.
Labour Competition for labour between marine sectors is not perceived as being high. However, due to difficulties young people have encountered in entering the fleets, some have chosen to enter the merchant navy as they still wished to pursue a marine career. The skills gained in the merchant navy would allow them to enter the fishing fleet at a later date. Starting incomes into the fishing industry is relatively low until qualified. In addition trainees will have to pay their own training costs and support themselves while in college. In contrast, the employer pays for merchant navy training. Financial support is available in Shetland to young fishers through the Hunter and Morrison Trust and the Shetland Fisheries Training Centre Trust (SFCT). A new apprenticeship scheme has also been launched this year.
Economic The Shetland fishing fleet uses over 300 local and national suppliers. The Lerwick and Shetland fishing vessels will also directly support onshore jobs across within Lerwick and Shetland in transportation, processing, sales, engineering and supply. A survey of companies conducted as part of this study indicated that at least 225 onshore jobs in sectors such fish processing, transportation, and engineering are directly dependent on fishing across Shetland. Of these over 100 are based in Lerwick, 2 % of all FTE jobs in Lerwick. Some of these businesses will be solely dependent on fishing (such as fish processing companies), while fishing represents a proportion of income for others. Many of these businesses have already had to adapt to the reduction in the number of fishing vessels in Shetland and have increased reliance on other marine industries such as aquaculture and oil. While many of these companies would be able to continue to trade if the fishing industry were to close, it would be likely that staff whose jobs are directly dependent on fishing would be made redundant. In addition, the income to fishermen and onshore workers will indirectly help to support jobs across Shetland. The Shetland Catch is the largest wild caught processing facility in Shetland, processing pelagic fish. It is capable of processing 800t per day and all pelagic caught fish (mackerel and herring) are fish landed directly to the factory. The presence of the factory is the primary reason for the pelagic fleet landing to Lerwick. Whilst the factory will retain a core staff, due to the seasonal nature of the pelagic fishery many factory workers will be employed on a seasonal basis.

21
Whitefish processing is small scale and is primarily focused on local supply (such as smoking of haddock). While there are a number of fish catching and onshore jobs based in Lerwick it is likely that workers will commute from across Shetland to work within Lerwick. Some businesses reported that reductions in fleet size had reduced the size of their workforce and additional reductions would comprise the long-term sustainability of their companies. Wild fish, farmed fish and shellfish are Shetland’s largest export and these industries help to support Shetland’s ferry link to the mainland and also the interisland ferry services.
3.2 Intra-sectoral linkages
Institutions The SFA represents all fleet segments within Shetland, and organises meetings for each fleet segment to ensure that they are all represented. As a member of the Scottish Fishermen’s Federation (SFF), the SFA represents fishermen's interests nationally and internationally. All fishers reported that the SFA represent their fleets. The Scottish Pelagic Fishermen's Association (SFPA) is set up to represent the pelagic feet, with three branches in Scotland, including one in Shetland. Within Shetland the SSMO manage the inshore shellfishery. The SSMO has representatives from the SFA, Shetland Islands Council (SIC), Association of Community Councils and processor representation. Fishers reported that they were not reliant upon state or voluntary aid, neither of which was rated as important to them. As fishers work all year around there is not a need for organisations to provide financial aid for times or hardship. The SFA and SFPA do not provide assistance in times of hardship and the fishermen reported that none was required. The Fishermen's Mission is a charity that can provide support to fishermen and their families in an emergency, including loss of life and boat.
3.2.1 Between fleet segments
Geographical Fishers reported that there was no major conflict for space within the Shetland fishing sectors. However, the demersal fleet reported that they had increasing conflicts with other nation’s vessels, especially with Spanish gill-netters (targeting monkfish). Gillnets are left in place for a number of days at a time and this prevents a hazard to trawlers. They reported that gillnets were being used in increasingly shallow depths. Fishers felt that foreign vessels were not as tightly controlled and regulated as the Scottish vessels.
Labour Labour mobility appears to be low in the Shetland fishing fleets, with fishers staying with the same vessels for a number of years. In addition, many fishers are shareholders so there is less incentive to

22
move boat. As all boats use a share system to pay UK crew then it is presumed that there is little financial incentive to move boats. It is not known what labour mobility exists within the non-UK crew.
Economic Fishers operate independently from one another. Whitefish boats are able to obtain quota from a number of sources: they can purchase or rent quota from other fishermen, the Shetland Islands Council, LHD (fish agents) and the Shetland Fish Producers Organisation (SFPO). The SIC rents quota at market prices and makes GBP 0.8 million to GBP 1.0 million (EUR 0.98 to EUR 1.22 million) a year from rental. LHD and SFPO are able to rent quota to the local fleet. The shellfish segment is not managed by a quota system, with the exception of nephrops.
3.2.2 Between subsectors Geographical
There is limited spatial overlap between subsectors. While shellfish dredging grounds and whitefish trawling grounds may overlap, fishers reported that this did not cause any conflicts between the fleets. Fishers suggested that this was because the fishing grounds were quite large and fishing intensity relatively low. The location of ancillary industries such as fish processing has contracted in recent years. Fish processing now primarily takes place in Lerwick and Scalloway. Historically there were a number of fish processing factories spread across Shetland. The centralisation of services has meant that many jobs created by ancillary industries are less geographically spread and are often within different communities than the fishers and boats.
Labour None of the fishers reported that their spouses or partners were involved in the fishing industry. It is likely that people in separate households will hold the 225 fisheries-related onshore jobs in Shetland as little evidence was found of more than one household member working in a fishing dependent industry.
Economic Seafood from Shetland is primarily sold unprocessed to Scottish mainland distributors. Whitefish is sold via Shetland Seafood Auction with buyers bidding on the fish. The pelagic industry land to the Shetland Catch who sell the fish on to mainland distributors. Shellfish is predominantly sold straight to mainland buyers, however brown crab is processed in Yell and some fishers will sell a proportion of their catch to the factory. The price fishers receive is dependent on the national availability of fish, with over-supply lowering prices and under-supply raising prices. The different fleet segments are not competing in the same markets so the landing volume of one sector does not affect the landing price in other sectors. The aquaculture industry in Shetland produces significant volumes of salmon and mussels, but these are not fish that are caught by the wild fishery in Shetland, so there is little market competition.

23
3.3 Summary of linkages The Lerwick fishing fleets support a large number of onshore jobs both in Lerwick and in other parts of Shetland. These jobs are in marine engineering, transportation, processing and boat supply; there is no evidence that people living in the same households as fishers hold these onshore jobs. The fishing fleet also helps to support key aspects of infrastructure including the ferry service, as fish is the dominant export product and the ferry would not run as frequently if it were not for the freight. No negative interactions were reported between the Shetland fleet segments due to differences in markets and fishing grounds.

24
4. Role of fishing 4.1 Fisheries as an economic activity 4.1.1 Diversification
The whitefish fishers also reported that their income represented a high proportion of household income (normally >50 %). All shellfish fishers surveyed reported that shellfish fishing represented <30 % of household income. (For the shellfish fishery it should be noted that there are full-time shellfish fishers who will be more dependent on fishing.) Within Lerwick there are a number of other economic activities, including oil-related work, tourism and public sector work. However, fishers may not be qualified to work in all alternative sectors and fishers reported a high degree of job satisfaction working in the fishing sector. Income from fishing is generally higher than the Lerwick average wage. While at the Shetland level dependency on fish catching is 2 % of the workforce, this ignores the additional jobs created in ancillary industries. The direct employment in fish catching, fish processing and aquaculture employs 9 % of the workforce. Within the dependent industries (fish processing, marine engineering, transportation) it is likely that there is only one dependent person per household. While this means that any change to fishing will only affect a proportion of household income it also means that many households are dependent on fishing.
0%
2%
4%
6%
8%
10%
12%
1997 2000 2003 2007 2011
Proprtion of population
employed
Entire fisheries sector Catching sub‐sector
Figure 12: Proportion of the population employed in fish catching and the entire fish sector in Shetland, 1997-2011
Source: Shetland Island Council.
All fishers surveyed reported a high level of job satisfaction (although many fishers, particularly in the demersal fleet, reported that EU regulation affected this). All fishers reported that they wished to stay working in the sector and did not intend to leave within the next 12 months. No fishers reported that they were or had previously been looking for alternative employment. The Lerwick fleets show low labour mobility and employment levels have been stable in recent years, following a period of fleet reduction, particularly within the whitefish fleet.

25
The shellfish fleet are mostly operated single-handedly so do not need to recruit crew. The whitefish fleet report that they are reluctant to recruit new young crew in case they cannot afford to keep individuals employed.
Figure 13: Length of time in the Lerwick fishing industry
4.2 Adaptation
4.2.1. Analysis of adaptive response Whitefish fleet
Fishers expressed concern that it was hard to adapt to future change as many of the challenges facing the fleet were beyond their control. Many fishers wished to make additional investments in the fleet by upgrading or replacing vessels, but availability of loans and uncertainty created by governance measures reduced investment certainty. Cost of purchasing quota and the cost of purchasing new boats reduce the likelihood that the whitefish fleet in Lerwick will grow. Fishers reported that fishing regulation (quota and days at sea) reduce fishers ability to adapt to future changes in fish abundances. As the whitefish fishery is quota-controlled it is difficult for fishers to take advantage of changes in stock abundance. Fishers can rent quota or trade their quotas, allowing them to adapt to some changes in abundance or markets. Fishers reported that they were seeing high stock abundances but were not able to utilise increased stock abundance as the biological data collected did not reflect the changes in stock. Reductions in allowed days at sea have also reduced fishers’ ability to respond to changes in stock abundance and fishers report that it has reduced total landings. Wider declines in the economy have made it more difficult to access loans, both from banks but also through a reduction in the level of financial support that can be offered at a national level. None of the fishers surveyed wished to leave the whitefish fleet and they reported job satisfaction, but regulation was making it increasingly difficult to maintain an economically viable fishery. Some whitefish fishers also had shellfish boats, which they used when they were not whitefish fishing. Fishers would be qualified to work in the aquaculture industry and in the offshore industries. A number of shellfish fishers had previously worked in the whitefish fleet but had to change fleets during decommissioning.

26
Several boats have been working for the oil industry on 'guard duty' as new pipes are laid. This has provided additional income to boats.
Fishers reported that the uncertainty created by fisheries regulation also made them unwilling to take on young fishers in case they could not afford to keep them employed. The NAFC Marine Centre in Scalloway is now offering a modern apprenticeship for young fishers wishing to join the industry.
Economic challenges such as increased fuel prices affect all crew members due to fishers being paid on a share basis. Reduction in profitability has the potential to affect new fishers because skippers will be less willing to take on new crew members.
Shellfish The shellfish industry is not controlled by quota so can adapt more easily to increases in stock abundance. Regular local monitoring of stock abundance means that there is greater confidence in stock assessment. Fishers report that currently it is very difficult for the sector to grow as the SSMO is not issuing new licences to fishers. This makes it harder for new entrants to join the fleet. As most vessels are operated by only one crew member it may be difficult for a young person to gain shellfish fishing experience (unless a family member already owns a shellfish boat). Wider declines in the economy have made it more difficult to access loans, both from banks and through a reduction in the level of financial support offered at a national level. Economic challenges, such as increased fuel prices, affect the profitability of the sector. Most fishers are not solely reliant upon an income from shell fishing. Reduction in profitability has the potential to affect new fishers because skippers will be less willing to take on new crew members. MSC certification may help fishers achieve a higher price and maintain profitability.
4.3 Future development of the community Fishers reported that uncertainty created by external regulation makes it difficult for the fleet to prepare for the future by investing in their business and upgrading boats. Work for the oil industry providing guard duty is currently supplementing income for many whitefish boats, although this work is reliant upon the laying of new pipelines. Across Shetland there has been a general trend of migration from rural locations to Lerwick and the surrounding area. The SIC is currently im plementing budgetary cuts across Shetland. As the SIC is a large employer within Lerwick, traditional activities such as fishing will become of increasing economic importance. Oil decommissioning and renewable energy has the potential to become increasingly large employers within Lerwick. A new funding scheme has been made available since 2012 for coastal communities through the European Fisheries fund, Axis 4. There have been has been one grant awarded for the Lerwick area.

27
5. Summary and conclusions Lerwick is the commercial capital of the Shetland Islands and contains the largest fishing and commercial port. It has a population of 7,500 people (around one-third of the Shetland total). Lerwick is one of the key employment centres of Shetland and is the largest employment area for the public and private sectors. There are 5,414 FTE jobs in Lerwick, higher than the population would suggest, indicating that people commute to Lerwick for work. Unemployment in Shetland is below the national average, varying between 1.7 to 2.2 %, since 2005. This is below the Scottish and UK average, currently 7.6 % and 7.8 % respectively. In 2009 the average yearly wage in Lerwick was slightly lower than the Shetland average at GBP 30,111 (EUR 34,929) compared to the Shetland GBP 30,180 (EUR 35,008). It is home to approximately 50 % of the Shetland Islands whitefish fleet, which also land into Scalloway and Cullivoe. The fishing industry provides direct employment within Lerwick but also to related sectors such as marine engineering, processing and transportation. Many of the key fishery facilities for Shetland, such as dry dock, are only available in Lerwick. A survey of companies conducted as part of this study indicated that at least 225 onshore jobs in sectors such fish processing, transportation, and engineering are directly dependent on fishing across Shetland. Of these over 100 are based in Lerwick, representing 2 % of all FTE jobs in Lerwick. This is higher than the Scottish average of 0.2 %. Fisheries (fish catching, aquaculture and fish processing) directly employ 8.6 % of the workforce across Shetland. Within Lerwick the fishing industry is a large primary income generator. Despite diversification of the economy, Lerwick is reliant upon fishing, both for direct employment but also in supporting industries (transportation, fish processing, marine engineering). Segment (length class)
Number of vessels
Shetland fleet
Main gears used
Number of crew (average)
Main species fished (list at least 3 and up to 5 for all fleet types)
0-10 23 109 (21 %) creel 1 lobster, brown crab, green crab, velvet crab
0-10 2 3 (67 %) trawl 1 nephrops
0-10 3 20 (15 %) scallop dredge 1 king and queen scallop
10-15 1 6 (17 %) scallop dredge 2 king and queen scallop
15-40 12 24 (50 %) trawl - TR1 6 cod, whiting, haddock, anglerfish
Total 72 175 (41 %)
The Lerwick whitefish fleet has adapted to external pressures by trying to improve quality of the fish they have landed to increase the price obtained for the fish. Fishing patterns have also been changed, increasing the frequency of landings, fishing at closer grounds and increasingly targeting shoaling fish. Fishers report that fish abundance is the highest in living memory, however, they felt that fisheries science was not recognising these changes in stock levels. The whitefish fleet faces challenges in financing the modernisation of the fleet to ensure that vessels are economical and efficient to run.

28
The pelagic fleet is a modern efficient fishery, which has retained local ownership. Although no boats are based in Lerwick, all domestic landings are made into Lerwick. Uncertainty generated by quota and reductions in days at sea will create continued economic uncertainties for the fleet and may discourage young people from joining the fleet. The shellfish fishing fleet comprises small vessels, which are predominantly part time. Shellfish fishing is managed by the SSMO. The fleet has recently gained MSC certification, which may increase the prices the fleet can command.
In summary, fishing remains a key industry within Lerwick. Entry into all fish segments has become more difficult with the cost of entry high and difficulties of obtaining licences and quota due to increased legislation. It has become increasingly difficult for young people to join the fishing sector. Fishers report a high level of job satisfaction but also report that legislation has made it difficult for the fisheries to operate effectively. Fishing remains the career of choice for many in Lerwick, despite the lure of often better paid and easier jobs in the key employment sectors such as the SIC. Within Shetland as a whole financial support is available to young fishers through the Hunter and Morrison Trust and the Shetland Fisheries Training Trust. A new apprenticeship scheme has also been launched this year. However, wider declines in the economy have made it more difficult to access loans, both from banks but also through a reduction in the level of financial support that can be offered at a national level. None of the fishers surveyed wished to leave the whitefish fleet and fishers reported that regulation was making it increasingly difficult to maintain an economically viable fishery. Fishers reported that the uncertainty created by fisheries regulation also made them unwilling to take on young fishers in case they could not afford to keep them employed.
At present there are no data collection framework (DCF) variable types associated with social dimensions, apart from some information on employment (FTEs and the number of engaged crew). It is apparent that there is a high dependency on fishing-derived employment and so the community is highly vulnerable to external factors, such as changes in quota allocation, fuel costs and market prices. Many of these pressures are captured in the current DCF regime (e.g. under expenditure) but the vulnerability element is not currently captured or fully understood by many. Therefore, it is suggested that key indicators are identified and included where possible in a new socio-economic dimension of the DCF. This could include:
entrance and departure rates of persons involved in fishing; ratios of fisheries dependence in the local economy, in terms of both employment and
economic contribution; relative contribution of Member State/other EU and non-EU employment within the local
fisheries sector.