european commission dg envec.europa.eu/environment/archives/eussd/pdf/rebound_effect_report.pdf ·...
TRANSCRIPT

Contacts Dr. Dorothy Maxwell
Ms. Laure McAndrew [email protected]
European Commission DG ENV
A project under the Framework contract
ENV.G.4/FRA/2008/0112
ADDRESSING THE REBOUND EFFECT
FINAL REPORT
26 April 2011
In association with
&

in association with &
_____________________________________________________________________________________
2 European Commission DG ENV Addressing the Rebound Effect
The study has been conducted by the consortium Global View Sustainability Services (GVSS) (project
lead) in association with BIO Intelligence Service (BIO) and Ecologic Institute.
PROJECT TEAM & REPORT AUTHORS
Lead Contractor:
In association with:
Dr. Dorothy Maxwell (Project Director)
Dr. Paula Owen
Ms. Laure McAndrew
Mr. Shailendra Mudgal
Mr. Frank Cachia
Mr. Kurt Muehmel
Mr. Alexander Neubauer
Ms. Jenny Tröltzsch
PROJECT WEBSITE: http://rebound.eu-smr.eu
CITATION REFERENCE: Maxwell, D., Owen, P., McAndrew. L, Muehmel, K., Neubauer, A., Addressing the
Rebound Effect, a report for the European Commission DG Environment, 26 April 2011
ACKNOWLEDGEMENT: This report was commissioned and financed by the EUROPEAN COMMISSION DG
ENVIRONMENT Unit C2 – Sustainable Consumption and Production, under the Sustainable Resource
Management Framework contract.

in association with &
____________________________________________________________________________________
European Commission DG ENV Addressing the Rebound Effect
3
Contents
1. EXECUTIVE SUMMARY .................................................................................... 5
1.1. PROJECT OVERVIEW .............................................................................................................. 5
1.2. KEY REBOUND EFFECT FINDINGS .......................................................................................... 6
1.3. CASE EXAMPLES .................................................................................................................. 10
1.4. RECOMMENDED MEASURES TO ADDRESS REBOUND EFFECTS .......................................... 15
2. INTRODUCTION ............................................................................................. 23
2.1 AIMS, OBJECTIVES AND DELIVERABLES ............................................................................... 23
2.2 BACKGROUND ..................................................................................................................... 24
2.3 PROJECT TEAM .................................................................................................................... 24
3. METHOD ....................................................................................................... 25
3.1 TASKS ................................................................................................................................... 25
3.2 EVIDENCE SOURCES ............................................................................................................ 26
3.3 KEY PROJECT MILESTONES .................................................................................................. 26
4. STATE OF THE ART REVIEW ............................................................................ 28
4.1 WHAT IS THE REBOUND EFFECT? ........................................................................................ 28
4.2 REBOUND EFFECT DEFINITIONS .......................................................................................... 30
4.3 SIGNIFICANCE OF THE REBOUND EFFECT ........................................................................... 32
4.4 APPROACHES FOR MEASURING REBOUND & LIMITATIONS ............................................... 33
4.5 DIFFERENTIATING THE REBOUND EFFECT FROM OTHER FACTORS .................................... 37
5. CASE EXAMPLES TO ILLUSTRATE REBOUND EFFECT ........................................ 40
5.1 CASE: HOUSEHOLD CARS & HEATING/COOLING (OECD) .................................................... 40
5.2 CASE: HOUSEHOLD CARS, HEATING, LIGHTING, PRODUCTION (USA) ................................ 41
5.3 CASE: ENERGY EFFICIENCY POLICIES & PROGRAMMES (EU) .............................................. 42
5.4 CASE: HOUSEHOLD APPLIANCES (EU) ................................................................................. 45
5.5 CASE: LIGHTING (DEVELOPED & DEVELOPING COUNTRIES) ............................................... 46
5.6 CASE: ROAD FREIGHT .......................................................................................................... 48
5.7 CASE: PRIVATE TRANSPORT ................................................................................................ 49
5.8 CASE: FRENCH ECO PASTILLE SCHEME & VEHICLES ............................................................ 50
5.9 CASE: MOBILE DATA TRAFFIC .............................................................................................. 51
5.10 CASE: PAPERLESS OFFICE & ICT ........................................................................................... 51
6. MEASURES AND CASE EXAMPLES FOR TACKLING REBOUND EFFECT ............... 53
6.1 DESIGN, EVALUATION & PERFORMANCE OF POLICY INSTRUMENTS ................................. 53
6.2 SUSTAINABLE LIFESTYLES & CONSUMER BEHAVIOUR ........................................................ 59
6.3 AWARENESS RAISING & EDUCATION IN BUSINESS ............................................................. 65

in association with &
_____________________________________________________________________________________
4 European Commission DG ENV Addressing the Rebound Effect
6.4 TECHNOLOGY & INNOVATION ............................................................................................ 68
6.5 FISCAL INSTRUMENTS ......................................................................................................... 68
6.6 MIXED INSTRUMENTS: TECHNOLOGY, FISCAL, BEHAVIOUR ............................................... 73
6.7 NEW BUSINESS MODELS ..................................................................................................... 79
7. CONCLUSIONS ............................................................................................... 80
7.1 KEY FINDINGS STATE OF THE ART ON REBOUND EFFECTS.................................................. 80
7.2 GUIDELINE RECOMMENDATIONS FOR TACKLING REBOUND EFFECTS ............................... 85
8. REFERENCES ................................................................................................. 101
ANNEX A: STAKEHOLDER QUESTIONS ....................................................................... 111
ANNEX B: STAKEHOLDER RESPONDANTS .................................................................. 112
ANNEX C: STAKEHOLDER VIEWS (GENERIC) ............................................................... 115
ANNEX D: STAKEHOLDER MEETING ........................................................................... 124
ANNEX F: FAQ ON REBOUND EFFECTS ....................................................................... 132

in association with &
____________________________________________________________________________________
European Commission DG ENV Addressing the Rebound Effect
5
1. EXECUTIVE SUMMARY
This is the final report of the Addressing the Rebound Effect project. The overall project objectives and
tasks were:
1. Review the current State of the Art knowledge and practice on the rebound effect occurring in the
EU from EU policies on resource efficiency, waste prevention and Sustainable Consumption and
Production (SCP) (direct, indirect and economy wide) as well as wider international experiences.
2. Analyse ways to prevent, reduce or counteract the rebound effect and their effectiveness.
3. Develop guideline recommendations for addressing rebound in policy in order to achieve the
maximum environmental benefit through these policies.
This report documents the key findings from tasks 1- 3. A key focus of the project has been to identify
SCP relevant, real world case examples that illustrate rebound effects and measures to counteract them.
A summary of the project (1.1), findings from the State of the Art review (1.2) and key recommendations
for addressing rebound effects in policy (1.3) are summarised below.
1.1. PROJECT OVERVIEW
The Task 1 State of the Art review analysed key evidence literature sources and 44 expert stakeholder
responses received, mainly through interviews supplemented with email responses (15 responses was
the original target). Key topics investigated include:
Existence and significance of the rebound effect (direct, indirect and/or economy wide).
Accurate measurement of the rebound effect (direct, indirect and/or economy wide), limitations of
current approaches and any improvements required.
Links between the rebound effect and other factors causing consumption e.g. pricing, income etc.
Whether internalising all environmental externality costs in prices in the future (e.g. for energy,
water, materials, land use etc) would make the rebound effect irrelevant?
Case examples illustrating the rebound effect associated with resource, waste and SCP instruments.
Measures to address the rebound effect in environmental policy making and successful use of this
already.
The stakeholder questions and respondents are listed in Annex A and B with their generic responses to
the topics in Annex C. The evidence literature sources reviewed are in 8.0 References. Key experts that
have or are involved in credible rebound effect projects in the EU, USA, India and China have provided
input. The general response from experts was that the project was welcomed, timely and the right
questions being investigated. All these evidence sources were analysed to present the current status on
rebound effect knowledge and practice as well as identifying twenty four case examples that illustrate
the rebound effect for different products/services/SCP policies and/or measures for addressing it.

in association with &
_____________________________________________________________________________________
6 European Commission DG ENV Addressing the Rebound Effect
A stakeholder meeting on 28 February with over fifty attendees discussed the key findings from the state
of the art review and further informed the recommendations for addressing rebound effects in policy.
The report of the meeting is in Annex D. Overall, there is strong interest from stakeholders on this topic.
1.2. KEY REBOUND EFFECT FINDINGS
1.2.1 DEFINITIONS
Our working definition and scope of the rebound effect is increases in consumption due to
environmental efficiency interventions that can occur through a price reduction (i.e. an efficient product
being cheaper and hence more is consumed) or other behavioural responses. This encompasses both
price induced and mental /psychological rebound effects. The mental rebound effect is where a feel good
perception of being “green” encourages increased consumption for certain products where “green” or
lower impact options are readily available. Three types of price induced rebound effect are recognised: -
1. Direct Rebound Effect - where increased efficiency and associated cost reduction for a
product/service results in its increased consumption because it is cheaper.
2. Indirect Rebound Effect – where savings from efficiency cost reductions enable more income to
be spent on other products and services.
Both direct and indirect rebound effects are microeconomic.
3. Economy wide Rebound Effect – where more efficiency drives economic productivity overall resulting in more economic growth and consumption at a macroeconomic level.
There are many definitions for rebound effects in the evidence e.g. Jevons Paradox which are detailed in
4.2.
The magnitude of the rebound effect is typically expressed as the percentage of potential savings taken
back from the maximum efficiency improvement expected.
1.2.2. EXISTENCE AND SIGNIFICANCE
The evidence and stakeholders show clear recognition of the rebound effect’s existence. Stakeholders
advise that the question is not about whether rebound effects exist or not, but to what level of
significance and in what products/ services, sectors and interventions. One of the reasons there is debate
on the rebound effect is because it is hard to measure and varies depending on the intervention (policy,
technology, practice), the type of products/services/resources investigated (energy, food, transport,
etc.), as well as other related factors e.g. income level, productivity, price elasticity, saturation, location
and time (Sorrell, 2007; UKERC, 2007). This is one explanation proposed for why it is not currently
factored into key energy studies informing policy e.g. from IPCC (2008), Stern (2007) or traditional energy
economic models used for energy policy modelling (Sorrell et al, 2010).
in association with &
____________________________________________________________________________________
European Commission DG ENV Addressing the Rebound Effect
7
The magnitude of rebound effects are debated and based on a relatively small number of empirical
studies with modelling and data limitations. However, the following can be concluded:-
In general, evidence does not support either the views that rebound effects are too small to be
insignificant (Lovins, 1998 & 2005; Schipper, 2000) or claims that it is greater than 100% which
remain insufficient to demonstrate validity (Sorrell, 2010). A rebound effect greater than 100% is
called a “backfire”, as it would negate completely the environmental improvement intended.
There is clear evidence for direct rebound effects for household energy efficiency for space heating/
cooling, personal transport, white goods and lighting which are estimated in the range 10- 30% for
developed countries (Greening et al, 2000; Schipper and Grubb, 2000; UKERC, 2007; Sorrell, 2007;
Small and van Dender, 2007). In these cases, efficiency improvements and associated cost reductions
result in increased consumption by consumers. This may decline in future as demand reduces and
income increases. This is because energy accounts for a greater amount of expenditure in lower
incomes. For this reason, these direct rebound effects may be larger for low income groups and
households in developing countries (Sorrell, 2007).
Evidence was also found for direct rebound effects of 30-80% for fuel efficiency in commercial road
transport (Gately 1990, Graham & Glaister 2002, Anson & Turner 2009). This is because fuel
efficiency lowers the cost of freight transport, making cost efficient transportation possible for more
goods, over longer distances and more frequently.
● Negative rebound effects of -10 to -100% for proposed interventions to reduce the environmental
impacts of meat and dairy consumption in the EU were identified in the EU Environmental
Improvement of Products (IMPRO) (Meat and Dairy) study because they increase the production and
consumption costs (Weidema et al, 2008). This negative rebound effect means that the net
environmental benefit would be greater than planned. It illustrates the role increased cost can play
in mitigating rebound effects.
● For industry sectors, estimates for rebound effects for energy efficiency in the UK are 15% (4CMR,
2006). A recent USA study investigating 30 industry sectors shows long term direct rebound effects
of 20-60% with energy intensive sectors e.g. utilities, chemicals and agriculture having the highest
effects (Saunders, 2010). The reason energy intensive sectors show higher rebound effects is
because energy costs are a significant factor in their production costs. This makes them more energy
constrained than for example the services sector. When efficiencies reduce energy costs in energy
intensive sectors much of the savings can be used to increase production which in turn uses more
energy. For example, if an energy intensive sector e.g. a foundry installs a more energy efficient
furnace much of the cost savings from this can be used to produce more metal.

in association with &
_____________________________________________________________________________________
8 European Commission DG ENV Addressing the Rebound Effect
In particular, indirect and economy wide rebound effects are difficult to define, measure and
counteract. Estimates of indirect and economy wide rebound were only found for energy efficiency
improvements, and are limited due to few published studies with weaknesses in the measurement
approach (Sorrell, 2007; Allan et al, 2006; Barker, 2005). Based on these, the economy wide rebound
effects for energy efficiency improvements are estimated to be smaller than direct rebound effects
at approximately 10% although some cases show > 30% (Barker, 2005; Sorrell, 2007). One case for
energy efficiency improvements of 5 % in the production sectors of the Scottish economy shows
backfire over the long term in most sectors (Hanley et al, 2009; Turner, 2010). The Scottish case
shows backfire only tends to occur where there is increased energy efficiency in a highly energy
intensive supply sector, particularly where trade and competitiveness are important since these are
influencing factors that increase economy wide rebound effects (Turner et al, 2010).
As the factors that influence the rebound effect are varied, the evidence is clear that generalising the
available direct rebound effect estimates to all types of rebound effect from all types of energy
efficiency improvement is not appropriate. Further, while the evidence is clear that the energy
efficiency rebound effect mechanism logically applies to other non energy resources e.g. water,
there is little evidence for these (UKERC, 2007; Sorrell, 2007; Sorrell, 2010). Estimates for the
magnitude of the rebound effects for SCP policies beyond energy is a gap at present and further
research will be needed to determine this. This reflects the status of research on the topic, as most
available rebound effect evidence is energy efficiency related.
1.2.3 IMPLICATIONS FOR POLICY
The existence of the rebound effect is recognised in evidence from credible sources including United
Nations Environment Programme (UNEP, 2002), International Energy Agency (IEA, 2005), UK Dept of
Environment, Food and Rural Affairs (4CMR, 2006), European Environment Agency (EEA, 2009), UK Dept
for Energy and Climate Change (DECC, 2010) and most recently the EEA State of the Environment and
Outlook Report (EEA, 2010). The rebound effect can limit the environmental improvements possible
through SCP and sustainable products policies and technologies and, in particular, the goal of decoupling
resource consumption from economic growth (i.e. maintaining economic productivity without depleting
limited resources e.g. energy, water and land) (UNEP, 2005; Sorrell et al, 2010). In the context of energy
and climate change policies, projections from the IPPC that by 2030, energy efficiency gains will reduce
global energy consumption by 30% below where they would otherwise be do not incorporate the
rebound effect. Many rebound effect publications cite this as a serious oversight in light of the evidence
for rebound effects for energy efficiency. Because of this, they propose that meeting GHG emissions
targets by relying significantly on energy efficiency gains are likely to fall short (Herring, 2008; Sorrell,
2010; Turner, 2010; Saunders, 2010; Jenkins, 2010).
The evidence is clear that the existence of the rebound effect does not mean efficiency based
policies and technologies are not valuable instruments for environmental improvement. It
means that understanding the magnitude of the take back in anticipated environmental savings
from the rebound effect is important when developing interventions. It also clarifies that where

in association with &
____________________________________________________________________________________
European Commission DG ENV Addressing the Rebound Effect
9
rebound effects are significant, efficiency policies need to be more ambitious, and that policies alone
will not be sufficient (Sorrell, 2007). Other measures will be required, in particular sustainable
consumption focused interventions (EEEA, 2010). The UK was the only example identified where the
direct rebound effect is recognised by the UK government and accounted for in relevant energy saving
policies. Following a UK Parliamentary enquiry, Defra commissioned the milestone study An
Assessment of the Evidence for Economy Wide Energy Savings from Improved Energy Efficiency (Sorrell
et al, 2007). Based on this the DECC Valuation of energy use and greenhouse gas emissions for appraisal
and evaluation provides guidance and a spreadsheet tool to facilitate taking the direct rebound effect
into account in energy policy development (DECC, 2010). For domestic insulation measures specifically,
the anticipated energy savings is downgraded by 15% to reflect the direct rebound effect called
“comfort taking” caused by increased energy consumption due to householders using higher internal
temperatures as its more affordable.
1.2.4 APPROACHES FOR MEASURING REBOUND EFFECTS
To accurately measure the rebound effect it is necessary to define and distinguish it from other
micro/macro economic factors. There is a good evidence base for this and the relationships with key
factors have been explored e.g. price (price elasticities), income (income elasticities), substitution (cross
price/substitution elasticity) and saturation effects (see 4.4 and 4.5. Overall, the economic factors
underpinning energy efficiency price induced rebound effects are that efficiency improvements result in
an effective cut in energy prices, which produces output, substitution, competitiveness and income
effects that stimulate energy demands (Hanley et al, 2009). The relationship between these effects can
be complex which adds to the challenge in measuring the rebound effect. Isolating the rebound effects
from other factors that cause increased consumption is a key issue that needs resolution in the definition
and measurement techniques for estimating the magnitude of rebound effects. Current measurement
approaches include income/price elasticity studies (for direct rebound effects), econometric modelling,
general equilibrium modelling and expenditure surveys. Traditional economic models for measuring
environmental policy savings do not cater for the rebound effect. Overall, this is a key problem for
enabling the scale of the rebound effect to be clarified in policy interventions at present and has
contributed to scepticism on the significance of the effect. For energy efficiency, a key issue is the
contribution that energy efficiency improvements (or more generally, increasing inputs of ‘useful work’)
make to overall productivity and economic growth. This is a complex issue, but the traditional economic
view that energy plays a relatively unimportant role in economic growth may be incorrect.

in association with &
_____________________________________________________________________________________
10 European Commission DG ENV Addressing the Rebound Effect
1.3. CASE EXAMPLES
To clarify rebound effects further, over twenty practical case examples were investigated to illustrate:-
The existence/significance of the rebound effect or not (direct, indirect and/or economy wide) and its measurement in products/services/SCP interventions.
Measures proposed to account for/counteract it.
In general, the cases illustrate the rebound effect associated with interventions relevant to energy
efficiency, with a smaller number focusing on water, materials and waste. This is a reflection of the
status of the rebound effect topic which has been mostly measured for energy efficiency as distinct from
wider resource related impacts. The cases are detailed in sections 5.0 and 6.0 and summarised in 1.3.1
and 1.4 below.
1.3.1 CASE EXAMPLES THAT ILLUSTRATE THE SIGNIFICANCE OR NOT OF THE REBOUND EFFECT
The most well investigated examples are for the direct rebound effect associated with energy efficiency
interventions for energy services, transport (private and commercial), household heating/cooling,
appliances, lighting and industry sectors. There are some limited examples for ICT. Examples were
identified to illustrate the different types of rebound (direct, indirect, economy wide) and related causal
factors e.g. time, space and technology. For wider resources, potential direct and indirect rebound
examples for water saving measures (low flow and grey water technologies) in households were
identified, however these are not officially defined as rebound and could also be seen as unintended
consequences. For economy wide rebound effect for energy efficiency interventions, this has been
quantified in the UK. Few evidence based examples of indirect rebound effect were available. These
include estimates of indirect rebound effects for energy efficiency programmes in Germany. University of
Brussels and ADEME in France respectively have projects underway to quantify direct and indirect
rebound effects associated with household energy efficiency. Overall, examples are from the USA, EU,
Australia and, for lighting only, India and China. Table 1.1 lists these case examples. For each case the
product/service/intervention, rebound effect being illustrated, SCP policy relevant, key evidence sources
plus a short summary are provided.

in association with &
________________________________________________________________________________________________________________________________
European Commission DG ENV Addressing the Rebound Effect
11
Table 1.1 Case Examples illustrating the Rebound Effect for different products/services/interventions & for direct /indirect /economy wide
PRODUCT/ SERVICE/INTERVENTION REBOUND EFFECT ILLUSTRATED SCP POLICY EVIDENCE
1. Energy efficiency in cars, heating/cooling and other consumer energy services (OECD)
Direct rebound effect Energy use, Climate Change, Cars, Energy Related Products (ERP)
IEA, 2005 ; Sorrell et al, 2007 (UKERC) Haas et al, 2000 ; Sorrell et al, 2009 Martin & Watson, EST 2006
Summary: Based on an assessment of evidence for energy savings from improved energy efficiency associated with household cars, heating/cooling and other consumer services from studies in a range of OECD countries to identify rebound effect values, the “best guess” direct rebound effect range was estimated at 10-30% (IEA, 2005; Sorrell et al, 2007). Further, a range of empirical studies have also been conducted to estimate the direct rebound effect from energy efficiency interventions relevant to these products and services in several EU countries. These show rebound effects for consumption associated with energy efficiency as 20-30% for Austrian space heating (Haas et al, 2000) and 15% for personal transport, household heating, and other household services in the UK (Sorrell et al, 2009).
2. Energy efficiency in household (cars, heating/cooling & lighting) and producing sectors (USA)
Direct rebound effect in the USA. Energy use, Climate Change, Cars, ERP
Utopities/UNEP, 2000 ; Greening et al, 2000 Dimitropoulos & Sorrell, 2006 Saunders et al, 2010
Summary: This illustrates direct rebound effects of 10-30% for energy efficiency of household cars, heating/cooling and lighting based on 1990s data (Greening et al, 2000; Utopities/UNEP, 2000). This shows that the variations in estimates minimum to maximum were most significant for heating/cooling and for cars. For the production side, a USA study measuring rebound effects associated with energy efficiency improvements in 30 industry sectors of the US economy during 1980-1995 shows direct rebound over the long term of 20-60% with energy intensive sectors e.g. utilities, agriculture and chemical being the highest (Saunders, 2010). The main reason for this is over time, energy efficiency provides cost reductions, enabling more production to take place which consequently uses more energy. The energy intensive sectors have the largest rebound effects because energy costs are a significant factor of production, which is also easily substituted for other factors of production enabling productivity to increase overall.
3. Energy efficiency policies and programmes for industry, households, transport – UK, Germany & Belgium and France
Direct, Indirect and Economy wide rebound effects
Energy use, Climate Change, Transport
4CMR, 2006 ; Sorrell et al, 2009 Martin & Watson, EST 2006 Henderson, Staniaszek et al, 2003 Irrek, 2010; Newak, 2010; ADEME, 2010

in association with &
__________________________________________________________________________________________________________________________________
12 European Commission DG ENV Addressing the Rebound Effect
PRODUCT/ SERVICE/INTERVENTION REBOUND EFFECT ILLUSTRATED SCP POLICY EVIDENCE
Summary: This illustrates the rebound effects measured for energy efficiency policies and programmes based on projects in the UK and Germany and forthcoming projects in Belgium and France. For the UK, the total rebound effects associated with energy efficiency policies and programmes for the period 2000-2010 covering industry, households, transport and commerce was estimated as 26%. Of this 15% is direct and 11 % economy wide (4CMR,2006; Sorrell et al, 2009). In the German case, indirect rebound effects associated with 12 proposed energy efficiency programmes for energy savings were estimated at 5% (Irrek, 2010). University of Belgium have a project underway (2010-2012) to measure direct and indirect rebound effects associated with energy efficiency for dwellings and mobility with improvement options (Newak, 2010). ADEME are running a project during 2010 -2012 with gas supplier GrFD to measure rebound effects from household energy efficiency policies in France (ADEME, 2010).
4. Household Appliances – EU (cases in Denmark & UK)
Direct rebound effect Energy use, Climate Change, ERP
EEA, 2010; JRC/IE, 2009; Owen, 2006 & 2007; Rikke, 2010; DECCAct on CO2, 2010
Summary: For the EU-27, the energy efficiency of most types of household appliances (e.g. washing machines, dishwashers, fridges, ovens, and electric hobs) and lighting per unit has improved significantly over the past 20 years driven by a mixture of policy interventions and technology breakthroughs. However, increases in ownership, multiple purchasing and the extended use of appliances have greatly overtaken the efficiency increases. As a result, overall electricity consumption per household for lighting and appliances has increased illustrating a direct rebound effect (EEA, 2010). Part of this increase is due to increasing numbers of households and disposable income, increased ownership of multiple appliances per household, rising demand (especially for AC from Mediterranean countries) as well as usage changes (e.g. ICT having high rates of standby energy consumption) (EEA, 2010; JRC/IE, 2009). The rebound effect contribution is due to efficiency related cost savings making appliances and lighting cheaper and hence consumption has increased. In particular, multiple appliance ownership is a key feature of this. For example, instead of buying a new fridge to replace an old inefficient one, a new one that is twice the size of the old one is bought (as it is cheaper and costs no more to run) and the old one is kept for use to enable additional cold storage. TVs are another example where the number of the same appliance has increased in the home over the last 20 years. In the UK there is currently an average of 2.5 TVs per household (DECCAct of CO2, 2010). This case example describes this based on evidence for the EU (EEA, 2010; JRC/IE, 2009). Further, specific cases for Denmark and UK provide similar evidence (Owen, 2006 &2007; DECCAct on CO2, 2010).
5. Lighting – Developed and Developing Worlds
Direct rebound effect and rebound through reversion from perverse outcomes due to technology shifts .
Energy use, Climate Change, ERP
Tsao et al, 2010; Tsao and Waide,2010 IEA, 2005; Nordhaus, 1997; Callwell, C, 2010 EEA, 2010; UK EEPH Lighting Strategy Group, 2010 Ouyang, 2010 (China); Roy, 2000 (India)

in association with &
________________________________________________________________________________________________________________________________
European Commission DG ENV Addressing the Rebound Effect
13
PRODUCT/ SERVICE/INTERVENTION REBOUND EFFECT ILLUSTRATED SCP POLICY EVIDENCE
Summary: This case illustrates evidence showing an estimated direct rebound effect of 5-12% for lighting in developed countries for private households (IEA,2005) and that it is expected to be greater in developing countries with evidence of this for India and China. It incorporates evidence focusing on solid-state lighting (SSL) and analysing the interplay between lighting, human productivity and energy consumption extrapolating past behaviour of light consumption into the future (Tsao et al. 2010).
6. Road freight transportation sector – relevant for EU and non-EU countries.
Direct and economy-wide rebound effect in the commercial freight sector from fuel efficiency.
Transport, Climate Change, Energy Efficiency
Gately, 1990; Graham & Glaister 2002, Anson & Turner, 2009, Ruzzenenti & Basosi, 2008
Summary: Environmental policy and technology improvements in vehicle engines and fuels have improved fuel efficiency per vehicle (EEA, 2010). Through lower fuel use per tonne-kilometre driven, the costs for transport of goods per unit has decreased and longer distances plus more frequent journeys has become cost-efficient. Despite the drop in specific fuel consumption of trucks, energy consumption in freight transport has increased significantly. For example in the EU, tonne-kilometres of goods hauled by road increased 130% between 1970 and 1995 (Ruzzenenti & Basosi, 2008). Lower costs enable outsourcing - the transport of goods to varying locations for different steps in the manufacturing process. Studies which analysed the rebound effect from energy efficiency improvements for commercial transportation show rebound effect estimates to be between 30 - 80 % (Gately 1988, Graham & Glaister 2002, Anson & Turner 2009). Further, the case shows that outsourcing is the main reason for traffic density growth, so not only longer distances are driven but also the frequency of transportation between locations has increased (Ruzzenenti & Basosi, 2008). This is a new development in the wider commercial freight economic system of production and relevant to economy wide rebound effects.
7. Fuel Efficiency and longer miles – for private transport
Direct Rebound Transport, Energy Sorrell, 2007 (UKERC); Victoria Transport Institute (2010)
Summary: This case shows that when fuel efficiency increases for private cars and is accompanied with a reduction in cost of fuels, this can lead to more miles being driven in private cars and ultimately greater full usage. Studies have estimated the rebound effect for this to be between 10-30% based on studies in OECD countries (Sorrell, 2007). This reflects the elasticity of vehicle travel with respect to fuel price (transportation elasticities). According to the Victoria Transport Institute a 10% increase in fuel efficiency could actually provide a 7-8% net reduction in fuel consumption and a 1-3% increase in vehicle mileage (Victoria Transport Institute, 2010).
8. French Eco-Pastille scheme could lead to ‘backfire’
Direct rebound measurement and accuracy Transport SEEID, 2009
Summary: The French Eco-Pastille scheme provided financial assistance to purchasers of efficient vehicles. Depending on the value chosen for the price elasticity of the demand for travel (kilometres travelled), the resulting rebound effect was seen to vary considerably, changing if the overall outcome of the scheme is positive or negative. While the environmental benefit of the scheme was always positive, when different values for the price elasticity are used, the social and economic benefit did not always exceed the costs of the scheme. This case highlights the challenges in accurately quantifying the rebound effect and demonstrates the level of uncertainty which is inherent to policy making.

in association with &
__________________________________________________________________________________________________________________________________
14 European Commission DG ENV Addressing the Rebound Effect
PRODUCT/ SERVICE/INTERVENTION REBOUND EFFECT ILLUSTRATED SCP POLICY EVIDENCE
9. Increased mobile data traffic outweighs efficiency gains
Direct rebound related to time Consumer products, energy use, GHG emissions
Faist Emmenegger ,2004 Girod et al, 2010
Summary: The UMTS (3G) mobile data transfer technology, used in millions of mobile devices in the EU, is able to achieve lower CO2 emissions for a given quantity of data transferred when compared to the older GSM (2G) technology. This is because the data transfer rates of UMTS are so much faster than those of GSM that the transceivers in the device and the base station are activated for a shorter amount of time. This increased efficiency is counteracted, however, by the increased data consumption from users of UMTS. As the data transfer rates of UMTS are three times that of GSM, and assuming a constant usage time per user (which is unlikely, as explained below), a study has calculated that the UMTS system will result in an increase in energy use by a factor of 2.4. Given that the UMTS system is 30% more efficient than GSM per unit of data transferred, this increase in the transfer rate can be understood as a rebound of a factor of 8 (8 = 2.4/0.3). This effect is described by Girod et al., 2010 as a ‘time rebound’. Furthermore, given the faster data transfer speeds, new applications such as streaming video, become possible, leading to a significant increase in the time spent using the device and therefore the total quantity of data transferred relative to typical levels of usage under the GSM technology, contributing to an even stronger rebound.
10. Paperless office has greater paper use
Direct rebound related to time and price Timber, energy use, GHG emissions
Hilty/Ruddy, no year; Schneidewind, 2002 Dardozzi, 2008
Summary: ICT systems were expected to enable a "paperless office" and associated resource benefits over their predecessors e.g. typewriters (Dardozzi, 2008). However, evidence shows ICT contributes to an increase of paper consumption because the technology enable users increased functionality, speed and greater capacity to print more at a reduced price (Hilty/Rudy, no year; Schneidewind, 2002).

in association with &
____________________________________________________________________________________
European Commission DG ENV Addressing the Rebound Effect
15
1.4. RECOMMENDED MEASURES TO ADDRESS REBOUND EFFECTS
Evidence based measures for addressing rebound effects include the following:-
Recognising and accounting for rebound effects in the design and evaluation of policy;
Use of an integrated mixture of instruments encompassing fiscal, behavioural and technology;
Sustainable lifestyles & behaviour change in consumers;
Awareness raising & education for leveraging behaviour change in business.
Guideline recommendations for using these measures over the short to long term and for direct, indirect
and economy rebound effects respectively, are detailed in 7.2 and summarised below. Case examples
have also been used to illustrate how these measures may work in practice. However, few of the
evidence based measures have been tested in real life, so examples from outside the SCP arena have
also been used to demonstrate their application e.g. from health care (anti smoking), traffic
decongestion and safe driving. A pilot to trial the most promising recommendations is proposed as a
valuable next step. This would also facilitate moving the rebound effect beyond debate to demonstrating
action to address it where it occurs.
1.4.1 Design and Evaluation of Policy
The first step for policy is to recognise and account for rebound effect take back in the projected
environmental savings expected to be achieved through interventions in their design and evaluation. The
UK government is the only case example identified where the direct rebound effect is now recognised
and factored into energy policy development guidance and tools (DECC, 2010). This provides a
precedent to build on. Anticipating and assessing rebound effects where the evidence is clear that they
occur in the design, evaluation and performance monitoring of interventions, will avoid falling short of
efficiency targets and enable measures to address it to be incorporated. Assessment criteria can be
incorporated in tools e.g. Regulatory Impact Assessment (RIA). This can be done in the short term for
specific policies where direct rebound effects are known to occur e.g. energy efficiency interventions for
energy services, transport, household heating/cooling heating, appliances and lighting. Further it can be
included as a cross cutting consideration in policies to enable indirect and economy wide rebound effects
to be anticipated. Proposed assessment criteria for interventions to evaluate likely rebound effects and
effectiveness of mitigating measures that could be added to RIA include key factors that influence
rebound effects e.g. price, income, substitutability, technology type, resource intensity of the production
sector, potential for perverse outcomes/burden shifting, time span of the intervention and whether it is
targeting consumers or producers. How these can be used are detailed in 7.2.
At present, there is a debate on the significance of rebound effects in environmental policy. A toolbox to
support awareness raising /engagement of policy makers on rebound effect facts and how to include
them in policy design and evaluation is needed. This will aid in advancing beyond the current debate and
moving towards effective and measurable policy that addresses rebound effects. The toolbox (ideally
web based) should be developed to include agreed rebound effect definitions; official recognition of
those rebound effects to incorporate in policies; models and data to support more sophisticated
measurement/evaluation of rebound effects and mitigating measures. The UK DECC which already
accounts for direct rebound effects where they occur using the Valuation of energy use and GHG

in association with &
_____________________________________________________________________________________
16 European Commission DG ENV Addressing the Rebound Effect
emissions for appraisal & evaluation Guidance & Tool (DECC, 2010), provides a Member State example to
build on. As a short term measure, this research project clarifies the evidence based facts, with a view to
overcoming current misconceptions. With this in mind, a FAQ on Rebound Effects is included in Annex F.
This can be part of the policy toolbox for generating awareness amongst policy makers in environment,
economics and other cross cutting policy departments on the facts. Further, a trial involving a selection
of Member States to assess rebound effects in policy is recommended. This can build on the UK tool and
RIA assessment criteria recommended from this project. In the medium to long term, current R&D gaps
need to be filled (see 1.4.2) to develop further the tools that will enable better evaluation of rebound
effects and the effectiveness of measures to constrain them.
1.4.2 R&D Gaps
There are R&D gaps on rebound effects and further developments are needed. Overall, these developments can facilitate policy design by anticipating rebound effects more accurately at the assessment stage and the effectiveness of counteracting measures. These include:
Data and modelling developments to provide a more sophisticated understanding of the factors
that influence and constrain rebound effects for energy efficiency.
Rebound can be better understood through improvements in econometric modelling;
incorporating consumption increases in Life Cycle Assessment (LCA) through consequential LCA
and integration with econometric models.
In the short to medium term use of Member State household expenditure and other household
panel and business surveys can be developed further and used to measure/track consumption
and direct/indirect rebound effect contributions.
Beyond the currently used computable general equilibrium (CGE) models, non-equilibrium
modelling techniques (e.g. Barker, 2009) are beginning to show promising advantages over more
traditional approaches but are largely new and need further development.
Rebound effects for SCP policies beyond energy e.g. for water and other resource efficiencies is
largely not investigated to date. The magnitude of these rebound effects, circumstances they
occur in and the influencing/constraining factors is required.
1.4.3 Mixed Instruments (Fiscal, Technology and Behaviour Change)
Where the rebound effect is significant, it is clear that efficiency measures alone will not be sufficient
and that other measures will also be required (Sorrell, 2007; EEA, 2010). The evidence shows
implementing a consistent mixed instrument approach, incorporating technology, fiscal and behavioural
aspects, is suited to addressing direct rebound effects in particular. The case examples of lighting,
transport rebound effects from traffic decongestion, hybrid cars and space heating are all examples
where evidence supports combined fiscal, behavioural and technology instruments being more effective
to counteract rebound effects. This use of a mixture of instruments is an element of EU SCP policy
already, in particular to incorporate both demand and supply facing measures. It is noted that for
rebound effects for energy efficiency, implementation of any measures in the absence of energy price
increases was seen to be ineffective (Sorrell, 2010).
in association with &
17 European Commission DG ENV Addressing the Rebound Effect
For price induced rebound effects for energy efficiency, as it is driven by the falling cost of energy
services which drive the demand increase, measures that offset the fall will constrain it. Measures that
can dampen rebound effects in the short term include raising the price of fuels so that effective/implicit
price does not change (if politically feasible to raise the price of energy) or rationing the energy supply
i.e. Cap & Trade schemes for industry or SMART meters for consumers. The EU IMPRO meat and dairy
case example in 6.0, illustrates that measures that raise the cost of production and consumption can
reduce overall consumption of these foods such that negative rebound effects occur - a net
environmental gain. Within the context of mixed instruments, the fiscal measures proposed are taxes,
consumption caps and bonus malus schemes. These are detailed further in 7.2.
It is cautioned that taxes are distortive and it is difficult to design an optimal tax to address something as
specific as the change in energy prices as a result of efficiency improvements. This needs consideration at
policy development stage such that the full economic benefits of improved efficiency are maintained.
Where fiscal measures are uniformly applied across sectors, they can be too indirect to be effective and
lead to unnecessary costs. For example, with a uniformly applied energy tax , as sectors have different
price elasticities with respect to the price of energy, this tax would have different impacts across the
economy creating a burden for some sectors which exceeds any benefit gained. Further, evidence shows
rebound effects vary depending on the energy intensity of the sector, so uniform approaches are less
likely to be equitable. For energy efficiency-related direct rebound effects, it would more effective to
focus directly on the energy use where the price change occurs. Mixed instruments combining targeted
sectoral fiscal incentives where the revenues raised can be used to bring technologies to market, with
awareness raising to leverage behaviour change in producers and consumers regarding their price and
income responses to efficiencies are recommended. A sectoral approach targeting the differing
influencing factors and consumer/market responses driving the direct rebound effects and economy
wide respectively are required. This is already consistent with the EU SCP sectoral and product/service
specific policy approach. However, these will come at a higher administrative cost (compared to
economy-wide price incentives for example) and require a minimum knowledge of the sectors
considered, e.g. production technologies and/or household behaviours in order to fine tune the design of
the instruments.
In the bigger picture in the medium to long term, for energy efficiency associated rebound effects energy
supply alternatives that are clean, cheap and abundant are a key technology solution. Therefore,
promotion of clean, renewable energy is a key mitigating measure in reducing the environmental
consequences of rebound effects.
1.4.4 Sustainable Lifestyle Behaviour Change
Common approaches to tackle direct rebound effects include provision of information on the
consumption of energy / resources via SMART metering (or real time displays) or SMART billing giving
the consumer the opportunity to think about their consumption and possibly reduce it. Measures to
tackle indirect or economy-wide rebound effects are scarce. In general, such measures go hand in hand
with promoting consistently sustainable lifestyles and accustoming consumers to assessing their
activities with regard to their environmental impact. Such measures would need to be extensive and aim
at a more profound change in the awareness and the priorities of consumers.

in association with &
_____________________________________________________________________________________
18 European Commission DG ENV Addressing the Rebound Effect
Inclusion of behavioural factors that influence consumption and role models (business, government,
education) in consumer focused Sustainable Lifestyle instruments is a mitigating measure for direct
rebound effects. For indirect rebound effects (where consumers use income from efficiencies to
consume more products with a high environmental burden) the importance of effective awareness
raising for consumers is key. A Swiss study where no indirect rebound effects were found for hybrid cars
identified a potential link between increasing consumer knowledge on the environmental impacts of
their car that can translate across to other consumption expenditure choices e.g. food. Further a UK
example shows the importance of encouraging householders to shift consumption patterns to lower
GHG intensive expenditure and to invest in low carbon investments vs. consuming.
Beyond measures to address rebound effects specifically, wider measures to reduce/change to
sustainable consumption patterns in the long term are key. Consumer focused measures to tackle
rebound effects should clarify that raising energy or resource efficiency alone is not enough but absolute
reduction of energy and resources is required. Much rebound effect evidence cites the role of wider
initiatives to reduce growth and consumption and overcoming the conflict that traditional economic
models have where GDP growth is the main success factor. Recent recognition of this in France and the
UK with the consideration of introducing social and environmental well being indicators and making GDP
a measure of market activity only are relevant developments in this agenda for the rebound effect (ONS,
2010, Stiglitz,2009, NEF, 2010). On the sustainable consumption and growth agenda – we need to ask
what is the goal of our society? At present the economic priority is for maximum growth in consumption
and production which is in conflict with a planet with limited resources.
1.4.5 Awareness Raising and Capacity Building in Business
Inclusion of how to avoid inadvertently causing indirect rebound in awareness raising and capacity
building tools e.g. EU Green Claims Guide for business is recommended. Several business examples (e.g.
Tesco) were identified that show well intentioned, but misguided advertising using air miles to motivate
other pro- environmental choices, e.g. replacing inefficient lighting with low energy light bulbs.
Table 1.2 outlines the case examples that illustrate the measures identified for addressing rebound
effects within the SCP arena. For each case the product/service/intervention, rebound effect being
illustrated, SCP policy relevant, measure to counteract and key evidence sources plus a short summary
are provided.

in association with &
_________________________________________________________________________________________________________________________________
19 European Commission DG ENV Addressing the Rebound Effect
Table1.2 Case Examples illustrating accounting for/counteracting the Rebound Effect for different products/services/interventions
PRODUCT / SERVICE /
INTERVENTION
REBOUND EFFECT ILLUSTRATED SCP POLICY MEASURE TO COUNTERACT EVIDENCE
1. UK government acceptance and incorporation of direct rebound effect in energy policies relating to home insulation
Direct and economy wide rebound effect and shows varying influence and magnitude of effect.
Energy Use GHG emissions
UK govt includes a 15% reduction in energy savings from insulation measures in the home to account for rebound effect
UK CERT programme; Henderson, Staniaszek et al, 2003; Martin & Watson, EST, 2006; Sanders and Phillipson,2006
Summary: Based on a review of thirteen studies (Sanders and Philipson, 2006), the differences between the measured and theoretical energy savings in UK domestic insulation measures determined that an overall reduction factor of approximately 50% of the theoretical expected energy saving occurs in practice. Of this, 15% of the reduction has been identified to be a result of explicit “comfort taking” – the percentage of the overall reduction that can be identified as being caused by improved, higher internal temperatures (through behavioural changes) – a direct rebound effect. The remainder of the reduction is expected to be due to other factors not explained by the comfort factor. In 2008 for the launch of the UK Carbon Emissions Reduction programme (CERT), the government and OFGEM (the regulator), in consultation with other key government agency stakeholders such as the Energy Saving Trust (EST) and Buildings Research Establishment (BRE), took the decision to reduce the theoretically modelled savings for all individual insulation measures by 15% to account for “comfort taking” which had been researched and proven to exist over the intervening years (Martin & Wilson, 2006, Henderson, Staniaszek, et al, 2003). In addition, the EST, also in recognition of the rebound effect of comfort taking, has decreased the energy savings per insulating measure, and hence the cost saving advice per measure it gives to consumers in line with official government policy in this area. Overall, in the UK the efficacy of existing carbon reducing policies for insulation measures in the domestic sector, have been downgraded by 15% to reflect the real life situation of “comfort taking”.
2. UK Homes – ‘water saving’ improvements in attaining higher grades within the UK Code for Sustainable Homes
Increased water use through reversion from low flow water products to higher flow alternatives. Also increased energy/carbon emissions through implementation of water saving technologies.
Water use, Energy use, Climate Change
Preventing unintended consequences or rebound through reversion in water saving policies
UK Code for Sustainable Homes, 2007 Greener building magazine, 2008
Summary: This example shows how well intended water saving policy measures within the UK ‘Code for Sustainable Homes’ can result in the installation of too low-flow rate products/appliances. The unexpected consequence of this is the disillusionment of occupiers and the tendency to replace the low-flow products with much higher flow-rate models, hence resulting in a much higher water and energy use overall. This is an unintended consequence which can be considered a rebound effect (rebound by reversion) in that a policy that pertains to reduce water and energy use, inadvertently may result in higher water/energy use.

in association with &
__________________________________________________________________________________________________________________________________
20 European Commission DG ENV Addressing the Rebound Effect
PRODUCT / SERVICE /
INTERVENTION
REBOUND EFFECT ILLUSTRATED SCP POLICY MEASURE TO COUNTERACT EVIDENCE
3. Lighting - developed and developing countries
traditional lighting (incandescent and fluorescent)
Emerging solid-state lighting (SSL) e.g. LEDs, OLED
Direct Rebound effect
Energy use, Climate Change, ERP
Role of mixed instruments including policy, technology and behaviour change to counteract rebound.
Tsao et al, 2010; EEA, 2010; Tsao and Waide,2010; IEA, 2005; Nordhaus, 1997; Callwell, 2010; UK EEPH Lighting Strategy Group, 2010; Ouyang, 2010 (China); Roy, 2000
Summary: The earlier lighting case example illustrates the estimated direct rebound effect of 5-12% in developed countries for private households (IEA,2005). This case builds on this and highlights evidence for using a mixture of instruments including policy, energy pricing, technology shifts (e.g. incandescent bulbs to Compact Fluorescent Lamps (CFL) to LED expected to be mainstream by 2030), behaviour change, light controls and smart technology to counteract rebound.
4. Toyota Prius –Switzerland & behaviour change
No rebound effect Energy use, Climate Change, Transport
Role of mixed instruments including subsidies, technology and awareness Role of Household Expenditure Surveys in measuring and monitoring rebound
Haan et al, 2006 Girod and Haan, 2009 Peters et al, 2008, ETH, 2006 Girod and Haan, 2010.
Summary: This Swiss case example investigated the potential rebound effect associated with household consumption of hybrid cars in Switzerland in light of government subsidies for hybrids being made available and illustrates two key features:-
Buying this more environmentally efficient and cheaper to run car did not result in increased expenditure on more cars or the replacement of already eco-efficient cars with the Prius (direct rebound effect) or other good/services with increased environmental impact (indirect rebound effect) but showed expenditure on other environmental goods with reduced impact e.g. Organic products – so called higher “quality” goods in an environmental content. This shows no rebound effect. This study determined that this was due to the consumer deciding to buy the hybrid car for an environmental reason and a potential link with increasing knowledge on car and wider product environmental impacts that translate across to other products consumed. For counteracting the direct and indirect rebound effects it provides evidence to support the role of subsidies being used in conjunction with awareness raising enabling pro environmental behaviour change in eco aware citizens to consume lower environmental impact products (Haan et al, 2006; Peters et al, 2008, ETH, 2006)
Swiss Household Expenditure Survey data was used and found to be an accurate measure for direct and indirect rebound effects. This data is currently underutilised in the EU, even in Member States when Household Expenditure Surveys exist. It is a potential example of how improving household data though Household Expenditure Surveys can facilitate a more accurate understanding of the direct and indirect rebound effect that could be used to inform policy development and performance monitoring (Girod et al, 2009).
in association with &
21 European Commission DG ENV Addressing the Rebound Effect
PRODUCT / SERVICE /
INTERVENTION
REBOUND EFFECT ILLUSTRATED SCP POLICY MEASURE TO COUNTERACT EVIDENCE
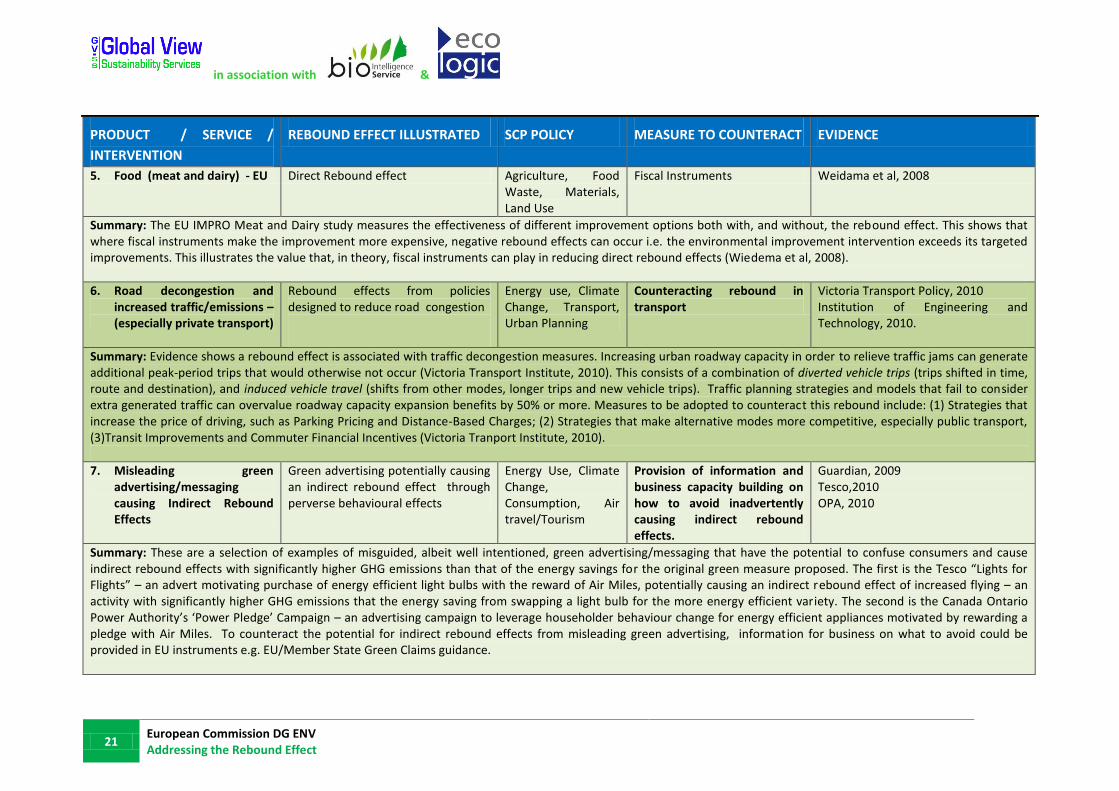
5. Food (meat and dairy) - EU Direct Rebound effect Agriculture, Food Waste, Materials, Land Use
Fiscal Instruments Weidama et al, 2008
Summary: The EU IMPRO Meat and Dairy study measures the effectiveness of different improvement options both with, and without, the rebound effect. This shows that where fiscal instruments make the improvement more expensive, negative rebound effects can occur i.e. the environmental improvement intervention exceeds its targeted improvements. This illustrates the value that, in theory, fiscal instruments can play in reducing direct rebound effects (Wiedema et al, 2008).
6. Road decongestion and increased traffic/emissions – (especially private transport)
Rebound effects from policies designed to reduce road congestion
Energy use, Climate Change, Transport, Urban Planning
Counteracting rebound in transport
Victoria Transport Policy, 2010 Institution of Engineering and Technology, 2010.
Summary: Evidence shows a rebound effect is associated with traffic decongestion measures. Increasing urban roadway capacity in order to relieve traffic jams can generate additional peak-period trips that would otherwise not occur (Victoria Transport Institute, 2010). This consists of a combination of diverted vehicle trips (trips shifted in time, route and destination), and induced vehicle travel (shifts from other modes, longer trips and new vehicle trips). Traffic planning strategies and models that fail to consider extra generated traffic can overvalue roadway capacity expansion benefits by 50% or more. Measures to be adopted to counteract this rebound include: (1) Strategies that increase the price of driving, such as Parking Pricing and Distance-Based Charges; (2) Strategies that make alternative modes more competitive, especially public transport, (3)Transit Improvements and Commuter Financial Incentives (Victoria Tranport Institute, 2010).
7. Misleading green advertising/messaging causing Indirect Rebound Effects
Green advertising potentially causing an indirect rebound effect through perverse behavioural effects
Energy Use, Climate Change, Consumption, Air travel/Tourism
Provision of information and business capacity building on how to avoid inadvertently causing indirect rebound effects.
Guardian, 2009 Tesco,2010 OPA, 2010
Summary: These are a selection of examples of misguided, albeit well intentioned, green advertising/messaging that have the potential to confuse consumers and cause indirect rebound effects with significantly higher GHG emissions than that of the energy savings for the original green measure proposed. The first is the Tesco “Lights for Flights” – an advert motivating purchase of energy efficient light bulbs with the reward of Air Miles, potentially causing an indirect rebound effect of increased flying – an activity with significantly higher GHG emissions that the energy saving from swapping a light bulb for the more energy efficient variety. The second is the Canada Ontario Power Authority’s ‘Power Pledge’ Campaign – an advertising campaign to leverage householder behaviour change for energy efficient appliances motivated by rewarding a pledge with Air Miles. To counteract the potential for indirect rebound effects from misleading green advertising, information for business on what to avoid could be provided in EU instruments e.g. EU/Member State Green Claims guidance.
in association with &
__________________________________________________________________________________________________________________________________
22 European Commission DG ENV Addressing the Rebound Effect
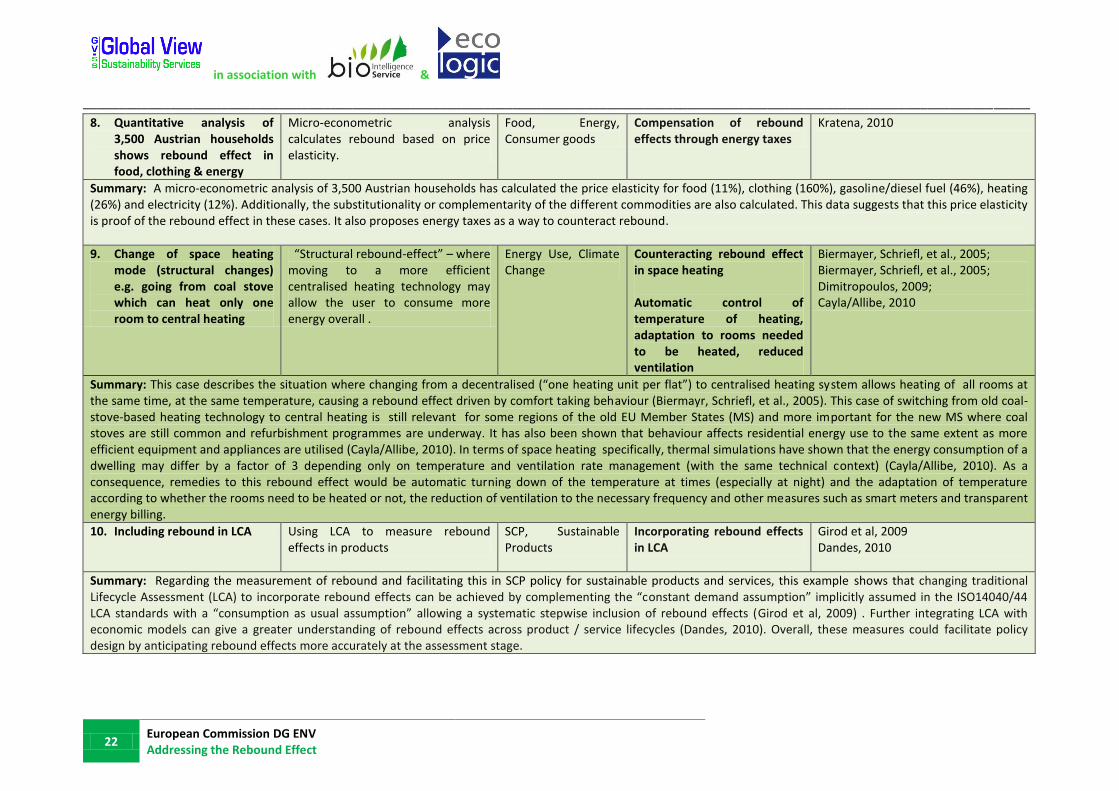
8. Quantitative analysis of 3,500 Austrian households shows rebound effect in food, clothing & energy
Micro-econometric analysis calculates rebound based on price elasticity.
Food, Energy, Consumer goods
Compensation of rebound effects through energy taxes
Kratena, 2010
Summary: A micro-econometric analysis of 3,500 Austrian households has calculated the price elasticity for food (11%), clothing (160%), gasoline/diesel fuel (46%), heating (26%) and electricity (12%). Additionally, the substitutionality or complementarity of the different commodities are also calculated. This data suggests that this price elasticity is proof of the rebound effect in these cases. It also proposes energy taxes as a way to counteract rebound.
9. Change of space heating mode (structural changes) e.g. going from coal stove which can heat only one room to central heating
“Structural rebound-effect” – where moving to a more efficient centralised heating technology may allow the user to consume more energy overall .
Energy Use, Climate Change
Counteracting rebound effect in space heating Automatic control of temperature of heating, adaptation to rooms needed to be heated, reduced ventilation
Biermayer, Schriefl, et al., 2005; Biermayer, Schriefl, et al., 2005; Dimitropoulos, 2009; Cayla/Allibe, 2010
Summary: This case describes the situation where changing from a decentralised (“one heating unit per flat”) to centralised heating system allows heating of all rooms at the same time, at the same temperature, causing a rebound effect driven by comfort taking behaviour (Biermayr, Schriefl, et al., 2005). This case of switching from old coal-stove-based heating technology to central heating is still relevant for some regions of the old EU Member States (MS) and more important for the new MS where coal stoves are still common and refurbishment programmes are underway. It has also been shown that behaviour affects residential energy use to the same extent as more efficient equipment and appliances are utilised (Cayla/Allibe, 2010). In terms of space heating specifically, thermal simulations have shown that the energy consumption of a dwelling may differ by a factor of 3 depending only on temperature and ventilation rate management (with the same technical context) (Cayla/Allibe, 2010). As a consequence, remedies to this rebound effect would be automatic turning down of the temperature at times (especially at night) and the adaptation of temperature according to whether the rooms need to be heated or not, the reduction of ventilation to the necessary frequency and other measures such as smart meters and transparent energy billing.
10. Including rebound in LCA Using LCA to measure rebound effects in products
SCP, Sustainable Products
Incorporating rebound effects in LCA
Girod et al, 2009 Dandes, 2010
Summary: Regarding the measurement of rebound and facilitating this in SCP policy for sustainable products and services, this example shows that changing traditional Lifecycle Assessment (LCA) to incorporate rebound effects can be achieved by complementing the “constant demand assumption” implicitly assumed in the ISO14040/44 LCA standards with a “consumption as usual assumption” allowing a systematic stepwise inclusion of rebound effects (Girod et al, 2009) . Further integrating LCA with economic models can give a greater understanding of rebound effects across product / service lifecycles (Dandes, 2010). Overall, these measures could facilitate policy design by anticipating rebound effects more accurately at the assessment stage.

in association with &
_____________________________________________________________________________________
European Commission DG ENV Addressing the Rebound Effect
23
2. INTRODUCTION
2.1 AIMS, OBJECTIVES AND DELIVERABLES
The existence and significance of the rebound effect in reality and how to address it is still debated. This
project aims to determine the current thinking on the rebound effect, its impact on EU Sustainable
Consumption and Production (SCP), waste and resource policies and effective measures to address it
that policy makers can use as needed. The approach used has been to conduct an independent
assessment based on existing evidence and expert stakeholder views. A key aspect has been to identify
and use evidence based SCP relevant case examples to illustrate the rebound effect and measures for
addressing it where they are available.
The objectives of project were:
1. Determine and analyse the current state-of-the-art knowledge and practice on rebound effect
occurring in the EU from EU policies on resource efficiency, waste prevention and SCP (direct,
indirect and economy wide) as well as wider international experiences.
2. Analyse measures to prevent, reduce or counteract the rebound effect and their effectiveness.
3. Develop guidelines with clear recommendations for reducing/overcoming rebound in policy in order
to achieve the maximum environmental benefit through these policies, and how to measure their
success.
This final report documents the project findings and guideline recommendations. This report includes:-
State of the Art Review – Key Findings (4.0)
What is the Rebound Effect
Rebound Effect Definitions
Approaches for Measuring Rebound and Limitations
Differentiating the Rebound Effect from other factors causing increased Consumption
Key Research ongoing on Rebound Effects
Case Examples illustrating the Rebound Effect (5.0);
Measures to Account/Counteract Rebound effect with case examples (6.0)
Conclusions (7.0)
Summary of state of the art review
Guideline recommendations for addressing rebound effects
Stakeholder Views (Annex A -C) – Questions and responses from expert stakeholders via interview and
Report from Stakeholder Meeting conducted on 28 February 2011 (Annex D)
FAQ on Rebound Effects to overcome misconceptions (Annex F).

in association with &
_____________________________________________________________________________________
24 European Commission DG ENV Addressing the Rebound Effect
2.2 BACKGROUND
Recognition of the rebound effect, and the resulting reduction in benefit from environmental technologies and policies it can cause, is still debated and further clarity in needed for policy makers. While the existence of the rebound effect is recognised as an obstacle to environmental improvements in studies from credible sources including EEA, OECD, UNEP and IEA1, its real world significance, and how best to address this, needs to be more clearly understood. For energy and carbon, wider resource efficiency, waste prevention and other SCP policies and related technologies, the rebound effect could limit the overall energy and resource savings possible. The rebound effect associated with energy efficiency interventions is the most well investigated to date. This shows that despite significant energy efficiency improvements (per unit of product), the continual trend for increasing energy consumption can counteract, and in theory even neutralise, efficiency gains. Outside of energy efficiency, further clarity is needed on the rebound effect associated with wider waste and resource policies and interventions. For these reasons, this project was commissioned by DG Environment. In particular, recommendations from the project should inform the Resource Efficiency Roadmap 2020 the Commission are developing.
2.3 PROJECT TEAM
The study has been conducted by the consortium Global View Sustainability Services (GVSS) ( project
lead) in association with BIO Intelligence Service (BIO) and Ecologic Institute.
Dr. Dorothy Maxwell (Project Director)
Dr. Paula Owen
Ms.Laure McAndrew
Mr. Shailendra Mudgal
Mr. Frank Cachia
Mr. Kurt Muehmel
Mr. Alexander Neubauer
Ms. Jenny Tröltzsch
The project website is at http://rebound.eu-smr.eu
1 EEA (2010), State of the Environment and Outlook Report; EEA (2010), Transport final energy consumption by mode (TERM 01) - Assessment
published Oct 2010; EEA (2010) a, towards a resource-efficient transport system TERM 2009: indicators tracking transport and environment in the European Union; EEA (2009), Final energy consumption - outlook from IEA; Euonima (2009), Policy Instruments for Sustainable Materials Management: Report for the OECD; Schipper, & Grubb (2000), On the rebound? Feedback between energy intensities and energy uses in IEA countries, Energy Policy, 28, 367-388; UNEP (2010), Assessing the Environmental Impacts of Consumption and Production: Priority Products and Materials; UNEP, Utopities, Global Compact (2005), Talk the Walk Advancing Sustainable Lifestyles through Marketing and Communications; UNEP (2002), Sustainable Consumption A global Status Report.

in association with &
_____________________________________________________________________________________
European Commission DG ENV Addressing the Rebound Effect
25
3. METHOD
The agreed approach for conducting the project was to provide facts and real world case examples from
EU SCP, resource, materials and waste policy areas that can facilitate a wider understanding of the role
of rebound, the relevance of addressing it in future EU policies and how this can be achieved. In light of
the debate on the relevance of the rebound effect in reality, an independent evidence based approach
using credible literature and expert stakeholder views was used to clarify the facts in order to provide
unbiased, practical information for policy makers. The project’s duration was six months (October 2010 –
April 2011).
3.1 TASKS
As illustrated in Figure 3.1 the project has been conducted in the following three tasks:-
● Task 1: State of the Art Overview - Gathering evidence from fit for purpose literature and
stakeholder sources on the current knowledge and practice relating to the rebound effect illustrated
by case examples relevant for SCP policy.
● Task 2: Tackling Rebound Effect – Identifying and Analysing measures that can counteract the
rebound effect using case examples where available from EU and wider sources.
● Task 3: Key Guideline Recommendations for policy makers to use in considering and counteracting
the rebound effect where necessary based on the Task 1 and 2 results.
Stakeholder consultation encompassing expert input via telephone interviews and email, as well as a
stakeholder meeting to discuss and inform the project outcomes has been a key feature of this project.
Figure 3.1 Task Structure

in association with &
_____________________________________________________________________________________
26 European Commission DG ENV Addressing the Rebound Effect
3.2 EVIDENCE SOURCES
The project tasks were conducted using fit for purpose literature and stakeholder evidence sources. The
evidence reviewed included credible published literature on the rebound effect itself – what it is,
measurement, limitations, significance, key research etc. Wider related topics were also included that
can inform the understanding of the rebound effect in different products/services/SCP policies and
addressing it e.g. environmental economics, sustainable lifestyles/behaviour change, consumption
trends, energy efficiency, resource use, waste, SCP/sustainable products, green advertising/claims and
new business models e.g. Product Service Systems. The sources used are listed in 8.0 References.
Stakeholders
Over 100 key stakeholders identified from the literature as having expert knowledge relevant to the
rebound effect and who can contribute key input and insight into the project, were invited to participate
in interviews (face-to-face where feasible and telephone) as well as to attend the stakeholder meeting
planned for 28 February 2011 in Brussels. The stakeholders were chosen to provide a representative
approach across the rebound effect topic and related disciplines for understanding and counteracting
rebound effect - economics, behaviour change etc. Key categories were represented at an international
level - policy, academia, practitioners, business and NGOs. A list of stakeholders contacted was provided
to the Commission. A one page project summary and short questionnaire was used for the stakeholder
telephone interviews as well as email responses requested in wider calls for input. This is in Annex A. To
cast the net even wider, stakeholders from relevant networks were invited by directing them to
complete a short questionnaire on the project website. Open calls for email responses to the
questionnaire and notice of the stakeholder meeting was sent to following networks and newsletters:-
International Sustainable Resource Use Task Group via UNEP secretariat – in particular this includes
international and all Member State representatives with a significant focus on the developing world
and recent EU Member States.
LCT Forum – EU LCA Platform
UNEP/SETAC SCP.Net Newsletter
Resource Recovery Network, UK (1500 contacts)
Sustainable Development Research Network
Forum for the Future Business Newsletter.
The stakeholder input was conducted from 12 Nov – end Dec 2010. 44 expert stakeholder responses (via
interview / email) were received (15 responses was the minimum target). A list of key respondents are
in Annex B. Generic (i.e. not personally attributed) responses to the stakeholder questions from the
telephone interviews and email responses are in Annex C The call to networks ran from Nov - end
January 2011. Over 50 stakeholders attended the stakeholder meeting on 28 February 2011.
3.3 KEY PROJECT MILESTONES
The key project milestones and timeline is below.

in association with &
_____________________________________________________________________________________
European Commission DG ENV Addressing the Rebound Effect
27
TIME ACTIVITY
20 Oct. 2010 Inception Meeting & Minutes
28 Oct. 2010 Website live
3 Dec. 2010 List of Evidence, stakeholders and case examples identified from evidence review submitted to the Commission and a telephone conference call to discuss the information and progress held on 08 Dec 2010. Additional 2 page Progress Summary document provided on 30/12/2010.
11 Jan 2011 Interim report completed
18 Jan. 2011 Interim meeting with the Commission
28 February 2011 Stakeholder Meeting, European Commission, Brussels
18 March 2011 Draft final report completed
April 2011 Final report completed

in association with &
_____________________________________________________________________________________
28 European Commission DG ENV Addressing the Rebound Effect
4. STATE OF THE ART REVIEW
4.1 WHAT IS THE REBOUND EFFECT?
The working definition and scope of the rebound effect used for this project is as follows:-
The Rebound Effect is an increase in consumption which may occur as an unintended side-effect of the
introduction of policy, market and/or technology interventions aimed at environmental efficiency
improvements. The increase is caused by behavioural and/or other systemic responses to the
interventions, in particular where the efficiency gains bring reduced costs (Khazzoom, 1987; Musters,
1995; Alexander 1997; Herring 1998; Saunders,1992 Moezzi,1998, J.S. Norgard,1995; Schipper, 2000;
Gorham 2009; UKERC 2007). In the case of efficiency measures that result in reduced costs, additional
comfort or amenity can be obtained by increased consumption without incurring extra financial outlay
– known as a “price induced rebound effect”. Based on energy efficiency related rebound, the effect
occurs when improvements in efficiency stimulate the demand for energy in production and/or
consumption. The trigger is that the effective/implicit price of energy (the cost of energy to produce
one unit of output) falls when efficiency is increased and causes more energy to be consumed.
In addition there is some limited evidence of a “mental/psychological rebound effect” in households
which make pro environmental related behavioural changes e.g. recycled paper (where there is not
necessarily a cost reduction) and compensate for this with increased consumption (Schneider, 2003;
Girod, 2009).
While the rebound effect is generally associated with an increase in consumption due to an increase in
efficiency and the accompanying decrease in price, it can also occur due to changes in other variables.
Rebound effects have been identified for time, space and technology reasons as follows:-
Time rebound - where the improvement option is more or less time consuming than the status
quo, leading to changes in consumption.
Space rebound where the improvement option uses more or less space than the status quo,
leading to changes in consumption.
Technology rebound where the improvement option changes the availability/affordability of
certain resources or technologies, leading to changes in consumption.
Whichever the cause, where this occurs, the rebound effect can reduce the environmental improvement potential from the original interventions. Therefore recognising and counteracting rebound effects, where they occur, is important to maximise environmental gains from policy, market and technology interventions. For the purposes of this project, this broad definition of the rebound effect has been used to enable a wider understanding of the topic.

in association with &
_____________________________________________________________________________________
European Commission DG ENV Addressing the Rebound Effect
29
In general, there are three main types of rebound effect recognised:
● Direct – where increased efficiency of a product / service lowers the cost of consumption and, as a
result, more consumption of this product/service occurs. For example, the addition of insulation
measures in a home, which help to make the home more thermally efficient and cheaper to heat,
can result in householders leaving the heating on for longer and/or at a higher temperature. For cars,
rebound effects include a potential increase in trips made and distances travelled because of
improved fuel and/or vehicle efficiency.
● Indirect – where savings accrued due to efficiency cost reductions in one product/service, cause
increased demand and/or expenditure for other goods and services that also require resources to
provide. For example, savings made through the more efficient heating of the home being redirected
to extra overseas holidays, and, as a result, the marginal environmental intensity of an individual’s
overall lifestyle consumption goes up. Indirect rebound effects can take a number of forms e.g.
increases in output of specific sectors, shifts to more resource intensive goods and services,
increases in energy consumption and more rapid economic growth (Sorrell, 2007).
Both direct and indirect rebound effects are at the microeconomic level and can be observed at
individual, company and household level). This is distinct from ‘economy wide’ rebound effects
which are at the macroeconomic level.
Economy wide – This form of rebound is where more efficient production and use drives
productivity resulting in more growth and energy consumption at a macroeconomic level (Sorrell,
2007; Brännlund et al., 2007; Jenkins, 2010).
The rebound effect is typically expressed as the percentage of potential savings taken back from the
maximum efficiency improvement that has been calculated from theory or models. For example a 20%
direct positive rebound effect means 20% of the efficiency improvement expected is lost. Whereas a
15% negative rebound effect means 15% more efficiency improvement has been achieved than was
expected.
The direct rebound effect for energy efficiency interventions is currently the most understood, having
been recognised as early as the 1800s for coal (Jevons, 1865) , in the 70s/80s (Ehrlich and Holdren, 1971;
Khazoom, 1980) and in a range of more recent studies in the USA and Europe (Greening et al, 2000;
Schipper, 2000; Haas et al, 2000; IEA, 2005; Martin and Watson, 2006; Sorrell and Dimitripoulos 2007 &
2010; Tsao et al, 2010 ). The economy wide rebound effect is less understood than the direct, but some
country based studies have investigated this for energy efficiency interventions to include a study
commissioned by the UK government (4CMR, 2006; Sorrell et al, 2009; Turner et al, 2009 & 2010; Barker
et al, 2009). University of Brussels have a project underway for Belgium to measure direct and indirect
rebound effects for household dwelling and mobility and policy instruments to address this running from
2010-2012 (Newak, 2010). ADEME has recently launched a project on the measurement of direct
rebound effect associated with households (ADEME, 2010). There is less available evidence for indirect
and also mental rebound effects. Key studies are for rebound effects associated with hybrids in
Switzerland (Girod et al, 2009) and green consumption behaviour changes measures tackling food waste,
space heating and car travel in the UK (Druckman et al, 2010).

in association with &
_____________________________________________________________________________________
30 European Commission DG ENV Addressing the Rebound Effect
The current understanding of rebound effects associated with energy efficiency interventions shows that
despite significant energy efficiency improvements per unit of product from interventions, overall
continuing rises in energy consumption can counteract and, in theory, even neutralise gains. This is
caused by growing consumption due to increasing demand, some of which is caused by rebound.
Understanding the contribution rebound makes to increased consumption vs. other factors in reality is
important. Generally, rebound effects are difficult to quantify and their significance in different
circumstances is debated. For example, some of the theories controversially claim that the rebound
effect can be responsible for up to 50% of increased consumption, while in others, that rebound can
negate the environmental gains 100% - a so called “backfire” ( Jevons, 1865; Khazzoom, 1980;
Brookes,1990 and 2000) In practice, the magnitude of the rebound effect is dependent on individual
circumstances e.g. sectors, technologies and income and is linked with a range of factors impacting
consumption and economic growth. Understanding these factors and their role in direct, indirect and
economy wide rebound effect is key to understanding the significance of the rebound effect associated
with different interventions. This is detailed in 4.4 and 4.5.
4.2 REBOUND EFFECT DEFINITIONS
In addition to the definitions in 4.1, a series of official definitions and terms have also been identified in the evidence. Further, there are variations in definitions for some products and services. These are summarised below.
4.2.1 GENERAL DEFINITIONS
The Consumption Equation illustrated in Figure 4.1 incorporates the rebound effect as defined by Ehrlich and Holdren in 1971 showing the relationship between increasing environmental efficiency and increased consumption of units of products and services per head of population.
Figure 4.1: The Consumption Equation

in association with &
_____________________________________________________________________________________
European Commission DG ENV Addressing the Rebound Effect
31
The above equation is also described as:-
I (Impact) = P (Population) *A (Affluence)*T (Technical Efficiency)
The Jevons Paradox is another definition used to explain the rebound effect. Named after the
nineteenth century economist and philosopher William Stanley Jevons, the paradox is if there is an
increase in efficiency in the use of a resource its price can reduce, leading to an increase in consumption
of this resource and, under certain circumstances, it can actually increase overall resource use as
opposed to reducing it (Polimenti et al, 2008). This was identified for energy efficiency related rebound
effects for coal as early as 1865 (Jevons, 1865) and into more modern times for other fossil fuels and
proposed as applicable to wider resources e.g. land and food ( Polimenti et al, 2008 and 2009).
Mental/Psychological Rebound Effect – Technical innovations improving the environmental impact of a
good or an activity can have negative repercussions on consumer behaviour. A “feel good perception of
being green” can encourage increased consumption for certain products where ‘green’ options are
available. For example, the introduction of the 3-way catalytic converter in cars has slowed down the
discussion about the social and environmental effects of passenger car transport and may have moved
many people, critical of increasing car ownership and use, to reconsider this and take up car driving
themselves (Paech, 2005). Similar considerations can apply to the use of recycled paper (Schneider,
20032) or energy-efficient lighting.3 A Swiss study has , developed the notion of the mental
“environmental” budget. According to this, households would carry out a virtual environmental book-
keeping exercise, valuing the environmental impacts of different activities. What is regarded as
environmentally harmful and favourable, very much depends on the household. This system has it that in
return for environmental improvements of certain activities in the household (e.g. a growth in energy
efficiency), other environmentally harmful activities could be taken up, i.e. indirect rebound effects could
arise (see Bundesamt für Energie, 2009). This study says that to the authors’ no empirical study has yet
been carried out where such a rebound effect has been proven to exist.
Other terms used for the rebound effect are the Income Effect – due to higher disposable income
resulting from cost efficient interventions (Ouyang et al, 2010) Takeback Effect , Bounceback, Comfort
Taking or Offsetting Behaviour. Outside of energy efficiency related examples, definitions of the rebound
effect are often used inconsistently in the evidence.
Variations on definitions for products and services - Product or service specific examples found in the
evidence include the following:-
Transport: One cited example of the rebound effect in the transport sector is the behavioural
phenomena of increased vehicle mileage and associated impacts that can inadvertently occur from
congestion reduction, fuel efficiency and road safety programs (Kent et al, 2010, Victoria Transport
Policy, 2010). The effect is described as Generated Traffic - additional vehicle trips on a particular
roadway or area that occur when roadway capacity is increased, or travel conditions are improved in
2 Schneider does not explain the concrete reasons of the increased paper use which counteracts the sustainable effects of the introduction of
recycled paper. 3 As for similar potential rebound effects linked to the purchase of a hybrid vehicle, see 6.6. There rebound effects could not be identified in reality.

in association with &
_____________________________________________________________________________________
32 European Commission DG ENV Addressing the Rebound Effect
other ways. This may consist of shifts in travel time, route, mode, destination and frequency. This can
result from:-
o Induced travel: An increase in total vehicle mileage due to increased motor vehicle trip
frequency, longer trip distances or shifts from other modes, but excludes travel shifted from
other times and/or routes.
o Latent demand: Additional trips that would be made if travel conditions improved (less
congested, higher design speeds, lower vehicle costs or tolls) (Victoria Transport Policy, 2010).
Domestic Insulation: The rebound effect in domestic insulation interventions has been measured and one aspect of it is referred to as the “comfort factor”. A study by Saunders and Phillips (2006) investigated and clarified the key terminology in this context as follows:-
o Reduction factor - the total amount by which the measured energy saving following housing
refurbishment is less than predicted from theory and from modelling.
o Comfort factor - the part of the reduction factor being caused through raising internal
temperatures as it’s cheaper and more efficient to heat the home, and hence consuming
more energy - the direct rebound effect.
o Other factors – the remaining amount of the reduction factor which is not explained by the
comfort factor (for e.g. the insulation materials not performing, in practice, to the standard
they are, in theory, calculated to; sub-standard installation or fitting; or sub-standard
products used).
4.3 SIGNIFICANCE OF THE REBOUND EFFECT
4.3.1 RELEVANCE FOR EU SCP POLICY
Reviews of the EU SCP Action Plan (Euonima, 2009), and most recently the EEA State of the Environment
and Outlook Report draft (EEA, 2010) have identified that estimated potential gains from energy
efficiency measures have been reduced by the rebound effect. The rebound effect can limit the
environmental improvements possible through SCP and sustainable products policies and technologies
and, in particular, the goal of decoupling resource consumption from economic growth (UNEP, 2005;
Sorrel et al, 2010). Because of the clear evidence seen for rebound effects in energy efficiency this is
especially relevant for energy/climate change policy. Key rebound projects have identified that efficiency
measures alone are not sufficient to meet current GHG targets (Sorrell et al, 2010; Turner, 2010;
Saunders, 2010; Jenkins, 2010).Therefore, understanding the magnitude of the effect, and how it varies
with the products/services concerned, is key not just for energy but for wider resource policies, and to
allow policy makers to consider it in future SCP policies.
4.3.2 IS THE REBOUND EFFECT JUST ACADEMIC SPECULATION?
There have been some discussions as to whether the rebound effect is just academic speculation.
Research within this project has found that there is clear evidence for the rebound effect, for energy
efficiency interventions for household space heating/ cooling , personal transport, white goods and
lighting , ICT, fuel efficiency in commercial transport and environmental improvement interventions for
food. The question is not about whether rebound exists or not but to what level of magnitude and for
what products & services and interventions.

in association with &
_____________________________________________________________________________________
European Commission DG ENV Addressing the Rebound Effect
33
For example, the UK Department of Energy and Climate Change (DECC) accepts the existence of the
direct rebound effects in relevant policy interventions, and officially incorporates ‘take back’ in energy
savings from rebound in its policy evaluation. To date this has been incorporated in domestic insulation
energy policy; where a 15% direct rebound effect is accounted for in recognition of ‘comfort taking’ in a
newly insulated home. This 15% reduction in savings has been applied to the CERT (Carbon Emissions
Reduction Scheme) scheme which has been running in the UK since 2008. The Case Study at 6.1.1 details
this further.
The main definition and measurement of the rebound effect to date has related to energy efficiency and
the cost reductions and associated increased consumption this can cause. However, it has been noted
that, in theory, this can apply to wider resources beyond energy, but, to date, the details on how, and
the significance of rebound in these areas, are missing (Sorrell et al, 2010). The existing evidence is
mostly for energy efficiency and this indicates that differences are strongly dependent on the
circumstances.
4.4 APPROACHES FOR MEASURING REBOUND & LIMITATIONS
In order to accurately quantify the rebound effect, it must be precisely defined and then distinguished from other micro- and macro-economic effects. The relationship between these effects can be complex which adds to the difficulty in accurately measuring the rebound effect. That said, various approaches can be taken which can increase the confidence in the conclusions of any analysis.
This section presents relevant economic concepts and their relationship to the rebound effect, then highlights the different approaches employed to measure it. This is followed by a discussion of the limitations of such measurements and suggestions for improving the reliability of results.
4.4.1 RELEVANT ECONOMIC CONCEPTS
● Price effect (price elasticity)
○ The price-elasticity is defined as the percentage change in demand associated with an
increase in price by 1%, for a given product. It measures the sensitivity of demand to price
changes, for a specific good.
○ Price-elasticity is often used to measure the direct rebound effect, since it is the change in
demand for a given service in reaction to a change in the corresponding price. In this case,
the price-elasticity is linked to the demand for the underlying product (e.g. electricity)
through the service it provides to the user/customer (e.g. heating service).
● Income effect (income elasticity)
○ The income-elasticity is defined as the percentage change in demand associated with an
increase in income by 1%, for a given product. It measures the sensitiveness of the demand
to income changes, for a specific product.
○ Income-elasticity is relevant to rebound as changes in energy or resource efficiency lead to a
decrease in the price of the corresponding service and hence an increase in disposable
income, everything else being held equal (such as revenues and prices of other products).
This surplus of disposable income could be spent on increasing the level of service required
(direct rebound effect, e.g. increasing the average heating temperature) or/and allocated to
other additional goods and services (indirect rebound effect).
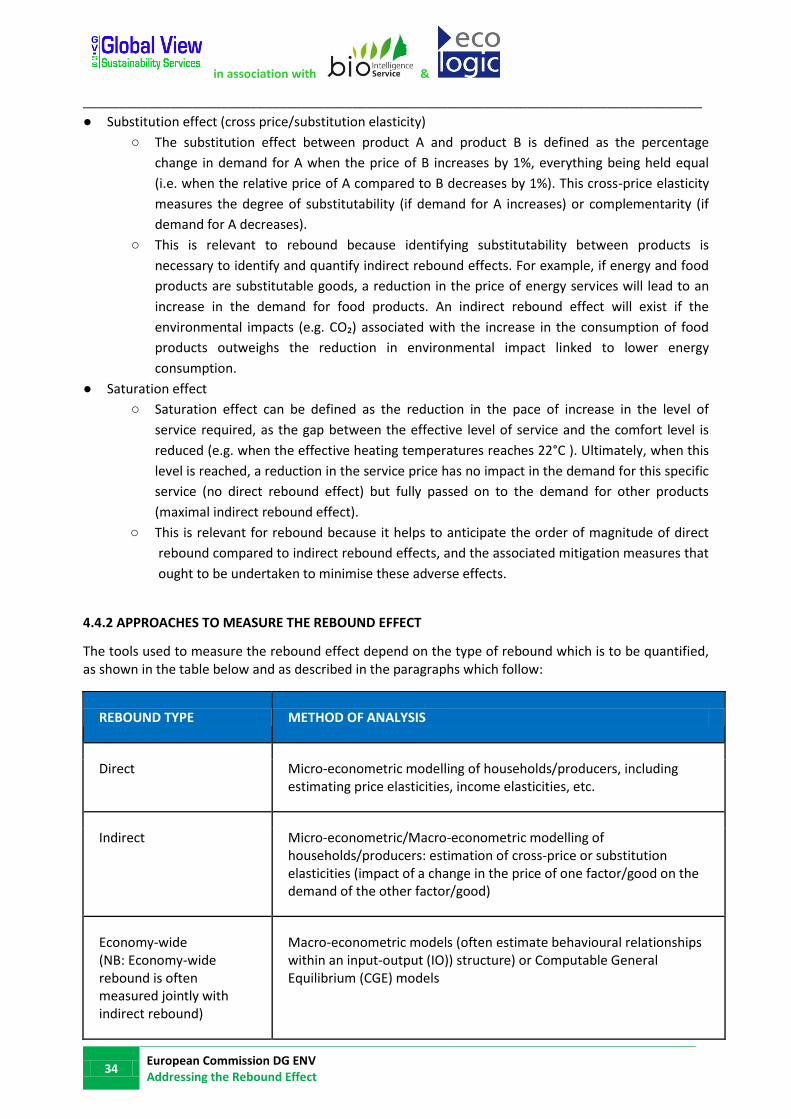
in association with &
_____________________________________________________________________________________
34 European Commission DG ENV Addressing the Rebound Effect
● Substitution effect (cross price/substitution elasticity)
○ The substitution effect between product A and product B is defined as the percentage
change in demand for A when the price of B increases by 1%, everything being held equal
(i.e. when the relative price of A compared to B decreases by 1%). This cross-price elasticity
measures the degree of substitutability (if demand for A increases) or complementarity (if
demand for A decreases).
○ This is relevant to rebound because identifying substitutability between products is
necessary to identify and quantify indirect rebound effects. For example, if energy and food
products are substitutable goods, a reduction in the price of energy services will lead to an
increase in the demand for food products. An indirect rebound effect will exist if the
environmental impacts (e.g. CO₂) associated with the increase in the consumption of food
products outweighs the reduction in environmental impact linked to lower energy
consumption.
● Saturation effect
○ Saturation effect can be defined as the reduction in the pace of increase in the level of
service required, as the gap between the effective level of service and the comfort level is
reduced (e.g. when the effective heating temperatures reaches 22°C ). Ultimately, when this
level is reached, a reduction in the service price has no impact in the demand for this specific
service (no direct rebound effect) but fully passed on to the demand for other products
(maximal indirect rebound effect).
○ This is relevant for rebound because it helps to anticipate the order of magnitude of direct
rebound compared to indirect rebound effects, and the associated mitigation measures that
ought to be undertaken to minimise these adverse effects.
4.4.2 APPROACHES TO MEASURE THE REBOUND EFFECT
The tools used to measure the rebound effect depend on the type of rebound which is to be quantified, as shown in the table below and as described in the paragraphs which follow:
REBOUND TYPE METHOD OF ANALYSIS
Direct Micro-econometric modelling of households/producers, including estimating price elasticities, income elasticities, etc.
Indirect Micro-econometric/Macro-econometric modelling of households/producers: estimation of cross-price or substitution elasticities (impact of a change in the price of one factor/good on the demand of the other factor/good)
Economy-wide (NB: Economy-wide rebound is often measured jointly with indirect rebound)
Macro-econometric models (often estimate behavioural relationships within an input-output (IO)) structure) or Computable General Equilibrium (CGE) models

in association with &
_____________________________________________________________________________________
European Commission DG ENV Addressing the Rebound Effect
35
Estimation of direct rebound effects
Micro-economic/household level
To measure micro-economic/household level direct rebound effects, the approach used is generally based on an econometric estimation of elasticities. According to the data available, the following parameters can be considered as a measure of direct rebound effects, ranked in decreasing order according to their level of precision/relevance:
● Elasticity of the demand for a specific service relative to the efficiency in the use of the underlying
product providing the service (e.g. energy efficiency for energy-related services), where service is
proportional to the amount of product needed to produce a unit of service (e.g. number of kWh
necessary to generate a 1 °C rise in temperature) and the level of service required (e.g. the heating
temperature, 21 or 22 °C for example). This is the most direct and precise measure of the direct
rebound effect.
● Elasticity of the demand for a specific product relative to the product-related efficiency (e.g.
elasticity of energy demand to energy-efficiency). Given data constraints and uncertainties
associated to data on services (related to energy, resources, etc.), the latter measure of direct
rebound effect is preferred. A relationship exists between these two measures of the rebound effect:
product=service-1. Taking the example of energy-related services, in the absence of direct rebound
effect, an increase in energy-efficiency by 1% leads to a decrease in the demand of energy by 1%
(product=-1%). The existence of a change in the level of energy-related service due to a change in
energy-efficiency (service>0) will limit the reduction in demand.
● Price-elasticity of demand, for a given service.
● Elasticity of the demand for a specific service to the price of the underlying product necessary to
provide the service (e.g. energy price for the service related to the provision of hot water).
● Price-elasticity of the demand for a specific service-related product to the price of the product (e.g.
elasticity of electricity demand to electricity prices).
Beyond the criteria related to the availability and reliability of the data, the choice of a quantification method also depends on economic and/or technical aspects. For example, focusing again on energy-related services, choosing price-elasticities to measure direct rebound effects may be relevant if the response of demand to efficiency changes is the same than the response of demand to price changes and if energy efficiency is independent from energy prices (which may not be true in the long-term).
Measurement of direct rebound is often based on empirical data. To date, such measurements have generally focused on energy consumption and related services (e.g. transportation, heating, electricity, etc.). Madlener and Alcott( 2008) and Dimitropoulos and Sorrell (2006) cast doubt on the validity of such approaches, arguing that issues related to the definition of the rebound effect and the appropriate method for quantifying the effect are unresolved.
Non-econometric techniques can also be used to measure rebound. A good example is controlled experimentation, where two populations are followed, one which has been given incentives to carry out energy efficiency investments. The difference in energy consumption between the two populations can be taken as a measure of rebound effect. This approach, however, requires considerable time and resources (e.g. surveys, etc.), thus limiting its applicability.

in association with &
_____________________________________________________________________________________
36 European Commission DG ENV Addressing the Rebound Effect
Modelling of indirect and economy-wide rebound effects
Generally speaking, the quantification of indirect and economy-wide rebound is more challenging (Sorrell, 2010) as more variables and greater uncertainty is involved. Some of the approaches which can be taken are outlined below.
Micro-economic/household level
● Comparing the price elasticities of different products and services -- known as cross-price elasticities -- can provide insight into how changes in the price of one product can change consumption of another. Katrena et al 2010 (see section 5.5) show, for example, that increasing the price of automotive fuels by 7% will reduce demand for heating by approximately 15%.
Macro-economic/aggregate level
● Statistical methods can be used to test a hypothesis that efficiency increases contribute to an
increase in energy consumption. However this requires a metric for energy efficiency levels that is
valid in different time periods and in different countries (or at different scales) (Madlener and Alcott,
2008)
● In order to assess rebound effect at the economy-wide level, macroeconomic models such as
computable general equilibrium (CGE) models and non-equilibrium models can be used. These
models use real economic data to estimate how an economy may react to some change. Barker et al,
2009 use this type of model to calculate that energy efficiency improvements associated with
transport, residential and services buildings and industrial sectors could lead to a rebound of 52% by
2030.
● In terms of economy wide rebound, this is normally applied to a national economy. However it has
been noted that for energy efficiency improvements global variables come into play if trade patterns
and international energy prices are impacted. Hence incorporating these factors and scale would
enable a more accurate measurement (Sorrell et al, 2010).
4.4.3 LIMITATIONS TO MEASURING REBOUND EFFECT AND HOW THEY CAN BE OVERCOME
Sorrell (2010) summarises the challenges inherent to quantifying the rebound effect, stating:
Quantification of rebound effects is hampered by inadequate data, unclear system boundaries, endogenous variables (a variable whose value is determined by other variables) , uncertain causal relationships, transboundary effects and complex, long-term dynamics such as changing patterns of consumption.
The use of econometric modelling to quantify the rebound effect share the limitations of such modelling
in general, namely:
● Uncertainty related to the accuracy of the base data;
● Uncertainty related to the accuracy of assumptions;
● Uncertainty related to the validity of the model.
In order to overcome these limitations, different methodological approaches can be combined which
allows the researcher to compare the results. If the results from the two different approaches tend to
agree, then the overall confidence in the results is increased. Barker (2009) used this approach in his
study on quantifying macroeconomic rebound, incorporating the results of a general equilibrium model
with those of a simulation model. The overall result shows a strong rebound.

in association with &
_____________________________________________________________________________________
European Commission DG ENV Addressing the Rebound Effect
37
It is important to note the necessity for high quality base data as this informs the assumptions and the
overall evaluation of the model’s validity. The output of any model will only be as good as the data which
is used as input, therefore ensuring the collection of high-quality data across the economy will only
contribute to improving the calculations.
4.5 DIFFERENTIATING THE REBOUND EFFECT FROM OTHER FACTORS
Accurately quantifying the rebound effect requires that it be isolated from other macroeconomic factors
which also drive consumption. This task is made complex by the large number of variables, and the
complex interrelations between them, which must be controlled in order to obtain an accurate value. For
example, a policy which increases the energy efficiency of a certain class of appliances will theoretically
have an impact on numerous factors which influence the ultimate purchasing decisions and use
behaviours of consumers. These factors range from the purchasing power of the consumer, to the price
of the fuel which powers the appliances, to the amount of time per day which the consumer may use the
appliances. As such isolating and quantifying the rebound effect at the macroeconomic level requires
estimations, approximations, and assumptions in order to produce a meaningful value. These are
explored below.
Price - If you increase efficiency of any factor of production, its price / unit of service (i.e. the
effective/implicit price) is reduced. This triggers a positive demand response – directly (by the producer
or consumer whose efficiency has improved) and also economy wide through knock on effects. The
strength of this demand is what causes the rebound effect. The effective price change is the source of
the rebound effect. How this is impacted by the efficiency improvement and associated factors needs to
be considered to measure rebound (Turner, 2010). These factors include:-
Is the desired efficiency improvement (i.e. does technology work as anticipated) realised or only
partly and how does this impact price?
Costs to implement efficiency improvements could limit the fall in effective price.
Substitution effect away from other inputs in favour of energy following the fall in effective energy
price allows the price of output in that sector and other sectors that purchase it as inputs to their
sectors to fall. This triggers positive competitiveness effects that raise activity levels, increase GDP
growth and stimulate further rebound. If the initial substitution effects are weak, this limits the size
of the competiveness etc
For direct rebound effects from energy efficiency, the key determining factor is how producers
substitute between energy and other inputs in production in the sector with the energy efficiency
improvement.
Under energy efficiency the costs of production fall, particularly in energy intensive sectors and the
products/services from these sectors become cheaper and consumer demand grows. This leads to
increased production and hence energy consumption. As the economy grows, incomes increase
encouraging further rebound effects.
How well energy users recognise and respond to the effective price change. For example, if a
household purchases a more energy efficient fridge, the price effect is automatic and will be
reflected in the next electricity bill. On the other hand, if a household installs loft insulation, they
may need to undertake further activity, such as appropriate adjustments to thermostats/heating
controls, before the efficiency improvement and subsequent price effect are realised.

in association with &
_____________________________________________________________________________________
38 European Commission DG ENV Addressing the Rebound Effect
Supply side effects e.g. labour and capital and their role in allowing economic expansion and hence
economy wide rebound.
Productivity improvements and rebound effects can impact trade patterns so environmental impacts
across supply chains e.g. carbon footprints may be different (Sorrell, 2007; Turner, 2010).
Backfire requires an economy wide demand response that is more than proportionate to the initial
effective price change. Recent research on the economy wide rebound effect for Scotland shows that
this only tends to occur in highly energy intensive energy supply sectors, in particular where trade
and competitiveness are important (Turner et al, 2009; Turner, 2009).
Income and Expenditure - Business producers require a different focus than households as the rebound
effects vary with these actors. For example, for household consumers, energy efficiency improvements
cause shifts in demand and the income freed up will allow consumption to increase elsewhere. How
households spend the money they save from efficiency improvements impacts net economic activity. In
the case of energy efficiency, if expenditure on more energy increases this will increase rebound effects,
but if they expend on non energy goods and services the economy would grow with more limited
rebound. Further if consumers save vs. spend the extra income, the carbon intensity of the investment
will impact the rebound effects (Druckman et al, 2010). These demand shifts will also change prices
throughout the economy and need to be considered.
Energy efficiency related rebound effects evidence shows that this is likely to be greater in low income
households, because the initial spend on energy accounts for a larger share of income. However, other
factors e.g. habitual behaviour should be considered (Jackson, 2005, Sorrell, 2007, Druckman et al,
2010).
Location - Because behavioural responses cause direct rebound effects, these are likely to be similar
across the Western world, but subject to differences on a national level based on income. Further,
rebound effects in the developing world is estimated to be higher due to unmet demand (Roy, 2000)
Production - Sectors, product and services where production factor energy is high e.g. industrial
processes and transport/logistics show higher energy efficiency related direct rebound effects. These are
illustrated in Figure 4.2
Technology – Evidence has shown that rebound effects are stronger for so called “General Purpose
Technologies” vs. others. These are defined as being applicable across a broad range of uses, products
and processes. Examples are lighting, motor vehicles and computers. This is because they permeate the
economy once a threshold efficiency of operation is realised and contribute to consumption growth and
economy wide rebound (Lipsey et al, 2005; Sorrell, 2007, van den Bergh, 2010).

in association with &
_____________________________________________________________________________________
European Commission DG ENV Addressing the Rebound Effect
39
Figure 4.2 Qualitative assessment of indicators of potential rebound for energy consuming activities in industry (van den Bergh, 2010)
Additionally, the increase in efficiency occurs against a backdrop of numerous other macroeconomic
trends. Economic growth naturally leads to an increase in consumption of goods and services.
Innovation and the discovery of new resources will both tend to drive real prices down and real incomes
up, resulting in increased purchasing power, much in the same way that increases in efficiency would. In
the short to medium-term, fuel prices are greatly affected by changes in the parity of the US dollar and
geopolitical conditions, etc.
Ideally, properly controlled experiments would be conducted in order to isolate and precisely quantify
the rebound effect. Such experiments, however, are not possible at the macroeconomic level as they
would require, for example, increasing efficiency for one population while maintaining the status quo for
another, all while controlling for all other variables across the two populations. As such, quantification of
the rebound effect must be based on the results of models — mainly econometric — which include all of
the limitations described in the previous section.
Given this inherent uncertainty, experts contacted within the context of this study have suggested that
attention and efforts not be directed at additional attempts to derive a precise value for the rebound
effect, but rather to focus on developing policies which will be effective despite such inherent
uncertainty.

in association with &
_____________________________________________________________________________________
40 European Commission DG ENV Addressing the Rebound Effect
5. CASE EXAMPLES TO ILLUSTRATE REBOUND EFFECT
Based on the evidence and stakeholder input, this section details real world case examples that illustrate
the existence and magnitude of rebound effects (direct, indirect and/or economy wide), its
measurement in products/services or SCP interventions and limitations.
To note, the rebound effect in the following examples were investigated in line with Commission
requests, but no credible evidence based examples were identified for:-
Packaging;
Water use associated with shower heads;
Travel/tourism – low cost airlines are a likely example to have rebound effects for airline fuel
efficiency but no evidence was found to demonstrate this to date. Case examples for personal
and commercial transport are available and presented below.
5.1 CASE: HOUSEHOLD CARS & HEATING/COOLING (OECD)
In 2007, the UK Energy Research Centre conducted an assessment of the evidence for direct rebound
effects from improved energy efficiency associated with household cars, heating/cooling and other
consumer services from studies in a range of OECD countries to identify rebound effect values (Sorrell et
al, 2007). Based on an assessment of the reliability of the rebound effect measured, the “best guess”
rebound effect range was 10-30% as illustrated in Figure 5.1
Figure 5.1 Direct Rebound Effect Estimates for consumer energy services in the OECD (Source: Sorrell et al, 2007)
This builds on a meta study done by the IEA in 2005 which collates direct rebound effects as illustrated in
Figure 5.2.

in association with &
_____________________________________________________________________________________
European Commission DG ENV Addressing the Rebound Effect
41
Figure 5.2: Direct Rebound Effect Estimates (Source: IEA, 2005)
Interestingly this shows 0% direct rebound effect for white goods, however, later evidence shows there
is evidence of direct rebound effects for household appliances as described in this case at 5.3.
A range of empirical studies have also been conducted to estimate the direct rebound effect from energy
efficiency interventions relevant to these products and services in several EU countries. These show
rebound effects for consumption associated with energy efficiency as:
20-30% rebound effect in Austrian space heating (Haas et al, 2000) ;
15-27% for the Netherlands space heating (Berkhout et al, 2000);
15% for personal transport, household heating, and other household services in the UK
(Sorrell et al, 2009).
5.2 CASE: HOUSEHOLD CARS, HEATING, LIGHTING, PRODUCTION (USA)
For the USA, rebound effects for consumption associated with energy efficiency in household
heating/cooling, lighting and appliances based on mid 1990s data are typically 10-30% (Greening et al,
2000).4, Figure 5.3 illustrates the rebound effect ranges - minimum to maximum for these estimates
based on a UNEP study (Utopies/UNEP, 2000).
4 This is included for information and it is noted that USA and EU consumption levels are different which impacts the transferability of this
example to an EU context.

in association with &
_____________________________________________________________________________________
42 European Commission DG ENV Addressing the Rebound Effect
Figure 5.3 Rebound Effect estimates in the USA for personal travel and household cooling, heating, lighting and appliances (Source: UNEP (2000))
A recent econometric analysis of historical energy consumption rebound magnitudes in the US economy
for 30 producing sectors has been conducted, by sector and in aggregate (Saunders, 2010) using a USA
data set covering the period 1960-2005 (Jorgenson et al)5. A draft paper on the analysis “Historical
evidence for energy consumption rebound in 30 US sectors and a toolkit for rebound analysts.” was
provided and is expected to be published in Energy Economics in 2011. In addition to this analysis, an
open source toolkit is available to conduct a comparable analysis for any country, or sector, for which the
data are available. Based on the aggregate results, this analysis shows that improvements in energy
efficiency in the US industry sectors have an estimated 20-60% direct rebound effect over the long term
(1990-1995) It shows rebound to have averaged 121% in the 1980-85 time frame (“backfire”), 75% in the
1985-90 time frame, and 60% in the 1990-95 period. Changes in factor prices over this time period are
one contributing factor for these trends. The analysis shows key variations in rebound effect, per sector,
over the short to long term and that energy intensive sectors, e.g. utilities, transportation, chemical and
agriculture, have the largest rebound effects as energy services are easily substituted for other factors of
production (Saunders, 2010).
5.3 CASE: ENERGY EFFICIENCY POLICIES & PROGRAMMES (EU)
Rebound effects for energy efficiency policies and programmes have been measured in the UK and
Germany. Following a House of Lords enquiry in 2005 on whether rebound plays a role in UK energy use
not reducing in line with efficiency improvements, the UK ERC were commissioned by Defra to conduct a
milestone review of evidence on energy efficiency and the rebound effect, in particular economy wide
(Sorrell, et al, 2007). Following this, a series of projects have been funded to investigate the source and
magnitude of energy efficiency related economy wide rebound effects (Barker et al, 2009; Turner, 2009
& 2010). UK studies have estimated the total rebound effect (micro and macro), arising from UK energy
efficiency policies and programmes for the period 2005-2010 covering industry, households, transport
5 The data set is available at http://dvn.iq.harvard.edu/dvn/dv/jorgenson;jsessionid=5f474ccc4bb102aec4ff946761c8 and the econometric
approach is in line with Jorgenson (2000) and Jorgenson, Ho and Stiroh (2005) .
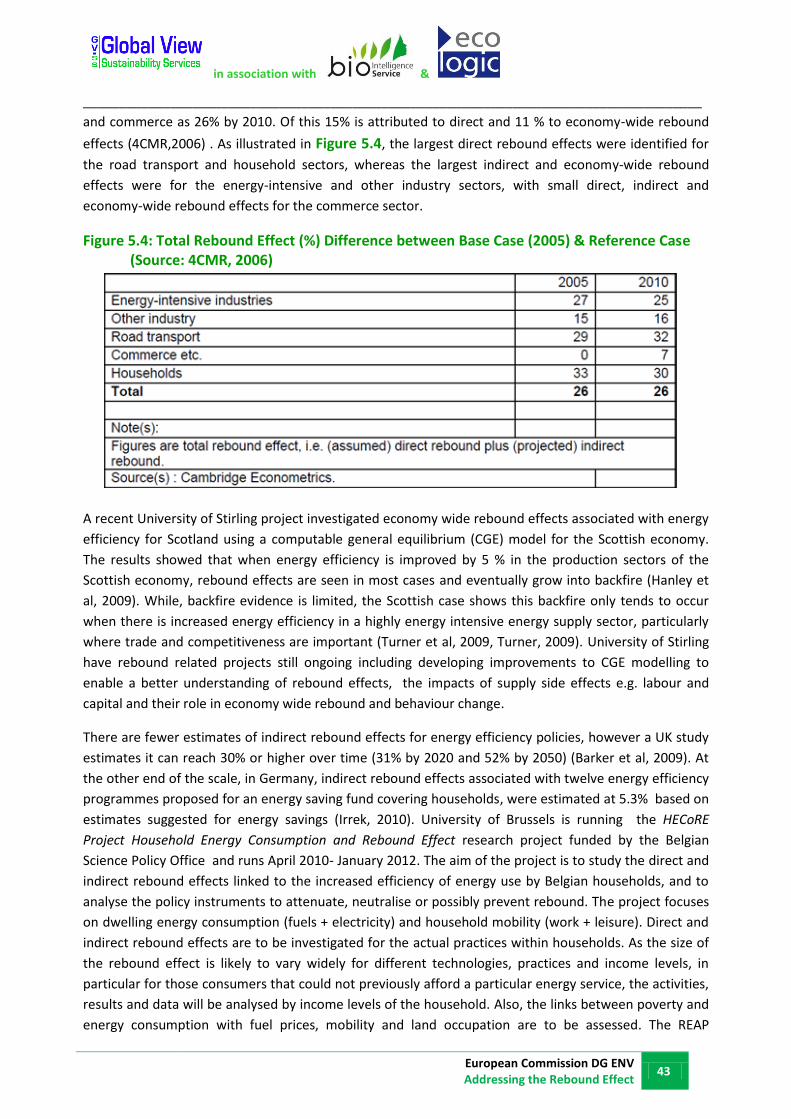
in association with &
_____________________________________________________________________________________
European Commission DG ENV Addressing the Rebound Effect
43
and commerce as 26% by 2010. Of this 15% is attributed to direct and 11 % to economy-wide rebound
effects (4CMR,2006) . As illustrated in Figure 5.4, the largest direct rebound effects were identified for
the road transport and household sectors, whereas the largest indirect and economy-wide rebound
effects were for the energy-intensive and other industry sectors, with small direct, indirect and
economy-wide rebound effects for the commerce sector.
Figure 5.4: Total Rebound Effect (%) Difference between Base Case (2005) & Reference Case (Source: 4CMR, 2006)
A recent University of Stirling project investigated economy wide rebound effects associated with energy
efficiency for Scotland using a computable general equilibrium (CGE) model for the Scottish economy.
The results showed that when energy efficiency is improved by 5 % in the production sectors of the
Scottish economy, rebound effects are seen in most cases and eventually grow into backfire (Hanley et
al, 2009). While, backfire evidence is limited, the Scottish case shows this backfire only tends to occur
when there is increased energy efficiency in a highly energy intensive energy supply sector, particularly
where trade and competitiveness are important (Turner et al, 2009, Turner, 2009). University of Stirling
have rebound related projects still ongoing including developing improvements to CGE modelling to
enable a better understanding of rebound effects, the impacts of supply side effects e.g. labour and
capital and their role in economy wide rebound and behaviour change.
There are fewer estimates of indirect rebound effects for energy efficiency policies, however a UK study
estimates it can reach 30% or higher over time (31% by 2020 and 52% by 2050) (Barker et al, 2009). At
the other end of the scale, in Germany, indirect rebound effects associated with twelve energy efficiency
programmes proposed for an energy saving fund covering households, were estimated at 5.3% based on
estimates suggested for energy savings (Irrek, 2010). University of Brussels is running the HECoRE
Project Household Energy Consumption and Rebound Effect research project funded by the Belgian
Science Policy Office and runs April 2010- January 2012. The aim of the project is to study the direct and
indirect rebound effects linked to the increased efficiency of energy use by Belgian households, and to
analyse the policy instruments to attenuate, neutralise or possibly prevent rebound. The project focuses
on dwelling energy consumption (fuels + electricity) and household mobility (work + leisure). Direct and
indirect rebound effects are to be investigated for the actual practices within households. As the size of
the rebound effect is likely to vary widely for different technologies, practices and income levels, in
particular for those consumers that could not previously afford a particular energy service, the activities,
results and data will be analysed by income levels of the household. Also, the links between poverty and
energy consumption with fuel prices, mobility and land occupation are to be assessed. The REAP
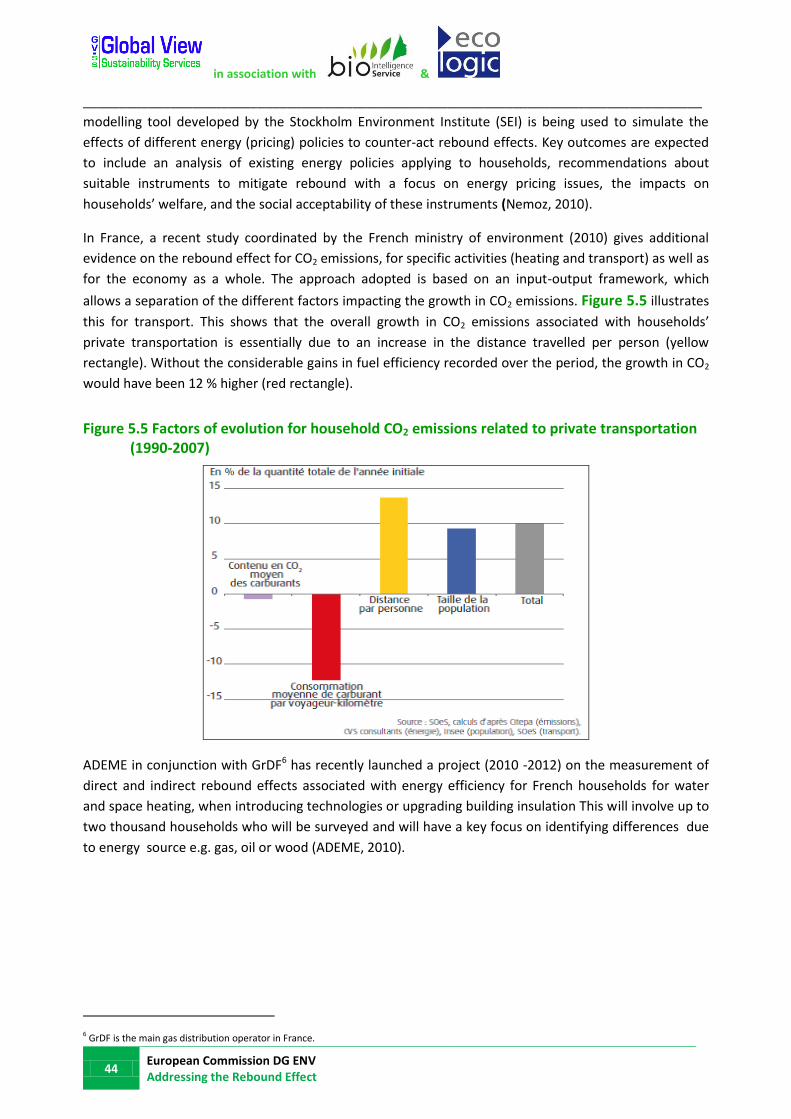
in association with &
_____________________________________________________________________________________
44 European Commission DG ENV Addressing the Rebound Effect
modelling tool developed by the Stockholm Environment Institute (SEI) is being used to simulate the
effects of different energy (pricing) policies to counter-act rebound effects. Key outcomes are expected
to include an analysis of existing energy policies applying to households, recommendations about
suitable instruments to mitigate rebound with a focus on energy pricing issues, the impacts on
households’ welfare, and the social acceptability of these instruments (Nemoz, 2010).
In France, a recent study coordinated by the French ministry of environment (2010) gives additional
evidence on the rebound effect for CO2 emissions, for specific activities (heating and transport) as well as
for the economy as a whole. The approach adopted is based on an input-output framework, which
allows a separation of the different factors impacting the growth in CO2 emissions. Figure 5.5 illustrates
this for transport. This shows that the overall growth in CO2 emissions associated with households’
private transportation is essentially due to an increase in the distance travelled per person (yellow
rectangle). Without the considerable gains in fuel efficiency recorded over the period, the growth in CO2
would have been 12 % higher (red rectangle).
Figure 5.5 Factors of evolution for household CO2 emissions related to private transportation (1990-2007)
ADEME in conjunction with GrDF6 has recently launched a project (2010 -2012) on the measurement of
direct and indirect rebound effects associated with energy efficiency for French households for water
and space heating, when introducing technologies or upgrading building insulation This will involve up to
two thousand households who will be surveyed and will have a key focus on identifying differences due
to energy source e.g. gas, oil or wood (ADEME, 2010).
6 GrDF is the main gas distribution operator in France.

in association with &
_____________________________________________________________________________________
European Commission DG ENV Addressing the Rebound Effect
45
5.4 CASE: HOUSEHOLD APPLIANCES (EU)
For the EU-27, while the energy efficiency per unit of product for types of household appliances has
improved significantly over the past two decades, these product improvements have been outstripped
by increases in ownership and increased use of appliances (EEA, 2010; JRC/IE, 2009). As a result, overall
electricity consumption per household for lighting and appliances has gone up, illustrating the rebound
effect (EEA, 2010). Key examples are fridges, washing machines and dishwashers as shown in Figure 5.6
Figure 5.6: Trends in Appliance Energy Efficiency and Ownership – EU-27 (Source: EEA, 2010)
Part of this increase is due to increasing numbers of households and disposable income, increased
ownership of multiple appliances per household (e.g. refrigeration products), rising demand for A/C
especially from Mediterranean countries and usage changes, for e.g. components of ICT having high
rates of standby/idle energy consumption (JRC/IE, 2009, Owen, 2006 & 2007).
Similar trends in electricity use in the domestic sector have been found in Japan and within the EU-27,
Denmark and the UK. For example in the UK, the typical electricity consumption in the home has more
than doubled from the 1970s to the 2000s despite the efficiency of typical household appliances such as
fridges, washing machines and dishwashers increasing, on average, by approximately 2% year on year for
the last 30 years (Owen, 2006). The explanation for this phenomenon lies in the fact that the typical UK
household has many more electronic products than it did three decades ago and facilities such as ‘stand-
by’ and ‘idle mode’ have allowed appliances to be left in an energy-using mode indefinitely. The number
of the same appliance has increased in the home with an average of 2.5 TVs now present in UK
households for example (DECC Act on CO2).
If we take fridges as an example, between 1990 and 2001 the average energy consumption of a 140 litre
refrigerator dropped by 29%. However, households now tend to contain more than one refrigerating
product. For e.g. a home could easily contain a fridge or combined fridge-freezer and a further chest
in association with &
_____________________________________________________________________________________
46 European Commission DG ENV Addressing the Rebound Effect
freezer in an outhouse or garage. Similar trends in electricity use in the domestic sector have been
found in Denmark [Danish Energy Agency, 2010]. Again these rises in electricity use are in contrast to
rising efficiency standards in most of the main energy-using household appliances.
Hence this is an example of the direct rebound effect where increasing energy efficiency standards for
these products has not led to economy-wide savings in energy and carbon terms; instead energy
demand/use has risen steadily.
5.5 CASE: LIGHTING (DEVELOPED & DEVELOPING COUNTRIES)
The rebound effect associated with energy efficiency in lighting is estimated at 5-12% in developed
countries for private households and 0-2% for industry and commerce (IEA, 2005). The ever-growing
demand for artificial light in the home (e.g. outdoors lights, lamps left on for security reasons), and also
in offices and factories to increase productivity at night, has been well documented (Bowers B 1998).
This has led to a spectacular increase in total light consumption, which, by the year 2000, in the UK was
25,000 times higher than in 1800 (Fouquet and Pearson 2006). However, incandescent bulbs are now
being replaced by compact fluorescent lamps (CFLs), more energy efficient alternatives are currently
under development, with light-emitting diodes (LEDs) expected to become mainstream and achieve
ultimate performance potential around 2030.
A recent study by the USA Physical, Chemical and Nano Sciences Center at Sandia National Laboratories
focusing on solid-state lighting (SSL) (e.g. semiconductor LEDs, Organic Light-Emitting Diodes (OLED)),
analyses the interplay between lighting, human productivity and energy consumption extrapolating past
behaviour of light consumption into the future (Tsao et al. 2010). Artificial lighting is estimated to
consume 6.5% of the world primary energy (Tsao and Waide, 2010), a larger percentage of energy
consumption than GDP (of which artificial lighting consumption is estimated at 0.72%). In this review
extensive data over three centuries were collected to show that new, additional lighting applications
have continuously emerged resulting in the offset of maximum energy consumption reductions due to
lighting efficiency gains. It is unclear as to whether the demand for light might be nearing saturation in
developed countries and no empirical evidence, has been found to date.
In the EU, according to the reference scenario of the European Commission’s PRIMES model (which
includes the effect of existing energy efficiency policies and the anticipated effects of the climate and
energy package adopted in 2009), there will be a growth of final energy demand for electrical appliances
and lighting in the residential sector of 2.2 % annually in the period 2010 to 2020 (EEA, 2010). As
illustrated in Figure 5.7, in the past two decades changes to average household size, number of homes,
and appliance and lighting energy use have led to a 20% increase in total residential energy
consumption.

in association with &
_____________________________________________________________________________________
European Commission DG ENV Addressing the Rebound Effect
47
Figure 5.7: EU housing efficiency trends, 1990 – 2004 (ECOS analysis of EU data, Source: Callwell, 2010)
The case of developing countries and unmet demand:
When unmet demand is very high in poor communities (or developing countries) where traditional
fuel is still the norm, then the rebound effect could also be very high. When solar lanterns were first
introduced to replace kerosene lamps in rural households in India, a rebound of 50-80% was
calculated based on the calculated reduction in the use of kerosene and the actual reduction (Roy, J.
2000). The actual kerosene savings worked out to zero and sometimes negative as the fuel saved was
shifted to meet other needs e.g. cooking. Roy concludes that high positive rebound implies that
technology advances, unless supplemented by appropriate pricing policy, will not be successful in
containing demand.
In China, the rising energy demand and security issues makes it imperative for the country to
neutralise the rebound effect, especially since a high level of rebound of at least 30% and up to 50%
in household energy efficiency is presumed (Ouyang J et al, 2010). The paper recognises that while
energy efficiency and conservation can slow down the exploitation and depletion pace of non-
renewable energy sources, it is imperative to also mitigate the rebound effect to achieve a lower
energy consumption in Chinese households.
5.5.1 REBOUND DEFINITION IN THE LIGHTING SECTOR AND LINKS TO TECHNOLOGY
Two types of behaviours, which can both be interpreted as forms of rebound effect in the wider sense
are noted. The first behaviour is called rebound through reversion and consists of users reverting back to
incandescent light bulbs, when for instance, it is found that CFLs give poor quality lighting or fail (Davis, S.
2010). Factors influencing reversion are replacement costs, availability of the technology, traditions,
norms and dissatisfaction with the quality of the service. It is to prevent such a risk of seeing further
‘rebound through reversion’ that the lighting industry is striving to tackle the quality concerns of LEDs
before any major roll-out programmes are envisaged. A new Solid State Lighting (SSL) Annex initiated by

in association with &
_____________________________________________________________________________________
48 European Commission DG ENV Addressing the Rebound Effect
France, the United States and Japan, was launched in June 2010 under the IEA Implementing Agreement
on Efficient Electrical End-Use Equipment (4E) to provide guidance on appropriate test methods and
performance levels that can be used to identify quality SSLs and to remove poorer performing products
from the market before consumer credibility is lost.
In a recent paper van den Bergh (2010) qualified the recent EU phase-out of incandescent light bulbs as
a “possibly ineffective policy” - if it is not complemented by higher prices of energy (electricity) - because
of the direct (more lamps and more light hours) and indirect (re-spending of direct monetary savings)
rebound effects. He also mentions that, in Nordic countries, the replacement of incandescent lamps,
which produce relatively much more heat than their more energy efficient alternatives, will lead to more
energy use by home and office heating systems to substitute for heat loss. This concept, known as the
Heat Replacement Effect (HRE), is a term used for the consequential effect of improving the energy-
consuming products installed in heated buildings. The beneficial saving factor for lighting is currently
estimated at 21% by UK the UK government department Defra, and both Defra and DECC have used this
percentage in their background calculations. Whether or not the HRE could be classed as a type of
rebound effect is open to debate, especially since it is a technical/physical effect resulting from
thermostat settings and not directly linked to consumer behaviour. However, similar to the rebound
effect, HRE may change the forecast of benefits and ranking of energy efficiency measures when policy
instruments are prioritised according to their impact on GHG emissions.
5.6 CASE: ROAD FREIGHT
The introduction of fuel efficiency standards to decrease fuel use is one of the major policy regulations to
reduce environmental effects in the commercial transport sector. In particular in the last decade the aim
of reducing greenhouse gas emissions has led to new fuel efficiency standards for heavy duty trucks. In
this context engine technology enhancements for trucks have been developed. Other regulations such as
lower speed limits have also lowered fuel consumption. All of these factors have contributed to
increased fuel efficiency per tonne-kilometre. Different studies which analysed the rebound effect of
energy efficiency improvements for commercial transportation show rebound effect measurements
between 30 and 80% (Gately 1990, Graham & Glaister 2002, Anson & Turner 2009).
Anson & Turner (2009) found that a 5% increase in energy efficiency in the freight transport sector leads
to rebound effects in the use of oil-based energy commodities in all time periods, in the target sector
and at the economy-wide level. Despite the 5% increase in energy efficiency, “transport” related oil
consumption only falls by 3.2% in the short run and by slightly less, 3.1% over the long run. The
“transport” oil rebound effect is thus 36.5% in the short run and 38.3% in the long run (Anson & Turner
2009). Graham & Glaister (2002) reviewed international literature on road traffic and fuel demand to
identify the range of relevant elasticities. The results show that there is a wide variation in the published
data, but Graham & Glaister found that 42% of the estimates fall within the range of a direct rebound
effect of 40-80%. Gately (1990) used econometric analysis on U.S. data to estimate the fuel price
elasticity of heavy goods vehicles transport and found a statistically significant rebound effect of 37%.
The decreasing cost for transportation of goods has made longer distances and more frequent transport
journeys cost-effective. Lower costs for transportation have also increased the movement of goods for
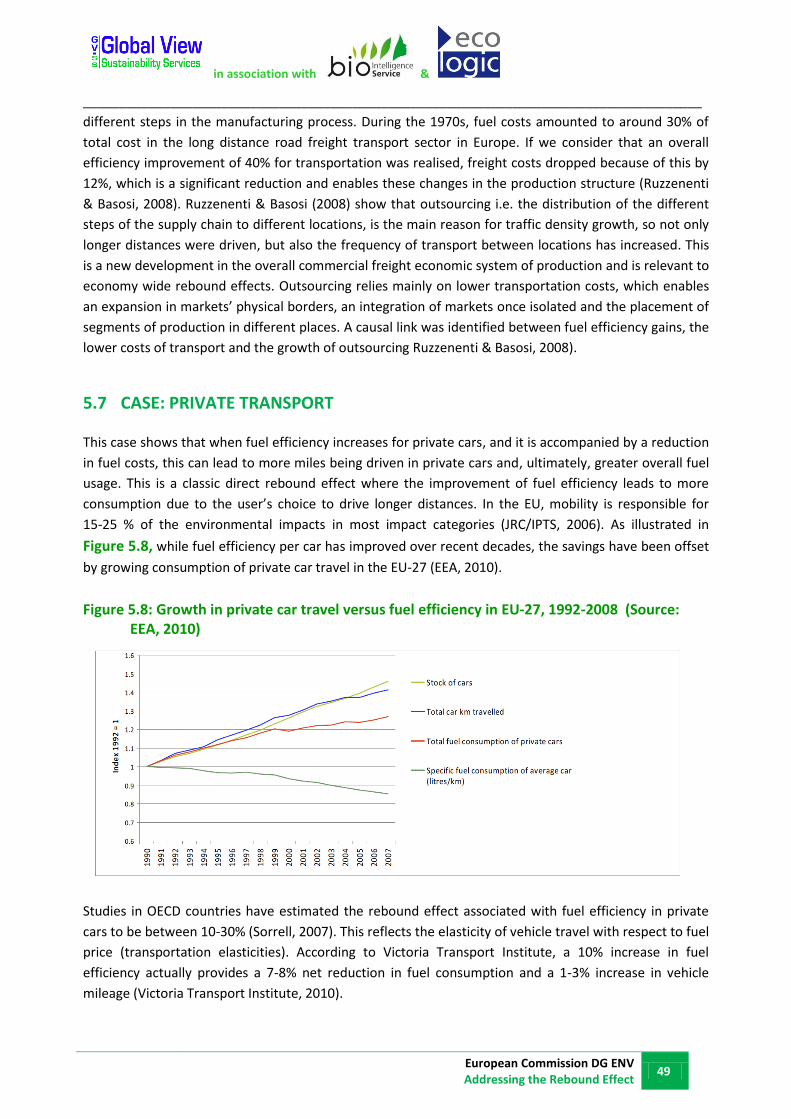
in association with &
_____________________________________________________________________________________
European Commission DG ENV Addressing the Rebound Effect
49
different steps in the manufacturing process. During the 1970s, fuel costs amounted to around 30% of
total cost in the long distance road freight transport sector in Europe. If we consider that an overall
efficiency improvement of 40% for transportation was realised, freight costs dropped because of this by
12%, which is a significant reduction and enables these changes in the production structure (Ruzzenenti
& Basosi, 2008). Ruzzenenti & Basosi (2008) show that outsourcing i.e. the distribution of the different
steps of the supply chain to different locations, is the main reason for traffic density growth, so not only
longer distances were driven, but also the frequency of transport between locations has increased. This
is a new development in the overall commercial freight economic system of production and is relevant to
economy wide rebound effects. Outsourcing relies mainly on lower transportation costs, which enables
an expansion in markets’ physical borders, an integration of markets once isolated and the placement of
segments of production in different places. A causal link was identified between fuel efficiency gains, the
lower costs of transport and the growth of outsourcing Ruzzenenti & Basosi, 2008).
5.7 CASE: PRIVATE TRANSPORT
This case shows that when fuel efficiency increases for private cars, and it is accompanied by a reduction
in fuel costs, this can lead to more miles being driven in private cars and, ultimately, greater overall fuel
usage. This is a classic direct rebound effect where the improvement of fuel efficiency leads to more
consumption due to the user’s choice to drive longer distances. In the EU, mobility is responsible for
15‐25 % of the environmental impacts in most impact categories (JRC/IPTS, 2006). As illustrated in
Figure 5.8, while fuel efficiency per car has improved over recent decades, the savings have been offset
by growing consumption of private car travel in the EU-27 (EEA, 2010).
Figure 5.8: Growth in private car travel versus fuel efficiency in EU‐27, 1992‐2008 (Source: EEA, 2010)
Studies in OECD countries have estimated the rebound effect associated with fuel efficiency in private
cars to be between 10-30% (Sorrell, 2007). This reflects the elasticity of vehicle travel with respect to fuel
price (transportation elasticities). According to Victoria Transport Institute, a 10% increase in fuel
efficiency actually provides a 7-8% net reduction in fuel consumption and a 1-3% increase in vehicle
mileage (Victoria Transport Institute, 2010).

in association with &
_____________________________________________________________________________________
50 European Commission DG ENV Addressing the Rebound Effect
5.8 CASE: FRENCH ECO PASTILLE SCHEME & VEHICLES
In 2008, the French government introduced an écopastille scheme aiming to encourage a transition
towards vehicles with lower CO2 emissions. This scheme included a “bonus-malus” plan which provided a
subsidy for the purchase of efficient vehicles (bonus) and an extra charge for inefficient vehicles (malus).
The bonus-malus ranged from a subsidy of €5,000 for vehicles emitting less than 60g CO2/km to a
penalty of €2,600 for vehicles emitting more than 260 g CO2/km. Vehicles emitting between 131 and
160g CO2/km received neither a bonus nor a malus. In addition, a “super-bonus” of €300 was given on
top of the normal bonus for the purchase of a vehicle emitting less than 130 g CO2/km when proof was
given that a vehicle older than 15 years was taken out of service.
In 2009, the French Ministry of Ecology, Energy, Sustainable Development and Sea (MEEDM) undertook a
study to evaluate the social, economic, and environmental impact of the écopastille scheme. This study
included a comprehensive cost-benefit analysis of the scheme and concluded that the ultimate result of
the scheme (i.e. whether it brought a social-economic cost or benefit to the country) was highly sensitive
to three variables in the calculation:
● the total effect of the bonus-malus scheme in reducing emissions;
● the opportunity cost for public funds;
● the price elasticity of driving, per kilometre.
According to the value of these variables, the total social-economic impact of the scheme can change
from positive (a benefit to society) to negative (a cost to society). Figure 5.9 summarises the effect of
modifying these variables (variation 1 and 2) on the total socio-economic outcome of the scheme.
Figure 5.9: Sensitivity of the social-economic cost-benefit analysis of the French écopastille scheme
Variable Reference value
Net result M€
Variation 1 (v1)
Net result (v1) M€
Variation 2 (v2)
Net result (v2) M€
Effect of the bonus-malus scheme in reducing emissions
50% -17 40% -34 60% 0
Opportunity cost for public funds
1.30 -17 1.10 71 1.50 -105
Price elasticity of driving, per kilometre
-0.20 -17 -0.10 140 -0.30 -80
in association with &
_____________________________________________________________________________________
European Commission DG ENV Addressing the Rebound Effect
51
From a purely environmental perspective, the authors conclude that the scheme prevented the emission
of 1.6 MT CO2 and included a rebound of 20% (equivalent to the price elasticity of driving, per kilometre).
This study demonstrates the challenge which is inherent to all economic analysis, including those
analyses which seek to identify and quantify the rebound effect. The studies are often very sensitive to
variables which cannot be known precisely. That said, various approaches can be taken to overcome
these limitations which are inherent to the rebound effect topic (see Section 4.4).
5.9 CASE: MOBILE DATA TRAFFIC
While the rebound effect is generally associated with an increase in consumption due to an increase in
efficiency and the accompanying decrease in price, it can also occur due to changes in other variables.
This example shows how a technological advance, which changes how much time is required to
accomplish a particular task, can significantly affect the overall energy consumption levels.
As an example, the UMTS (3G) mobile data transfer technology, used in millions of mobile devices in the
EU, is able to achieve lower CO₂ emissions for a given quantity of data transferred when compared to the
older GSM (2G) technology. This is because the data transfer rates of UMTS are so much faster than
those of GSM, and hence the transceivers in the device and the base station need be activated for a
shorter amount of time in order to transfer a given quantity of data. These faster transfer rates result in
higher quality voice calls for consumers and increased opportunities to consume multimedia content.
This gain in efficiency is, however, compensated for by UMTS users increasing their data consumption. As
the data transfer rates of UMTS are three times that of GSM, and assuming a constant usage time per
user (which is unlikely, as explained below), Faist et al. 2004 calculated that the UMTS system will result
in an increase in energy use by a factor of 2.4. Given that the UMTS system is 30% more energy efficient
than GSM per unit of data transferred, this increase in the transfer rate can be understood as a rebound
of a factor of 8 (8 = 2.4/0.3). In other words, rather than the 30% decrease in energy consumption which
may be expected from the new technology, the fact that the technology allows for faster data transfer
results in a 240% increase in energy consumption. This effect is described by Girod et al., 2010 as a ‘time
rebound’. Further, given the faster data transfer, new applications, such as streaming video, become
possible. This leads to a significant increase in the time spent using the device and therefore the total
quantity of data transferred increases greatly relative to typical levels of usage under the GSM
technology, contributing to an even stronger rebound.
5.10 CASE: PAPERLESS OFFICE & ICT
Before the advent of Personal Computers (PCs), producing a professional typewritten document was
time consuming and expensive. As the number of computers with internet access and scanners
increased, there was widespread hype that we would no longer need paper and the "paperless office"
was presented as one of the great resource conserving aspects of technology (Dardozzi, 2008). The PC as
the modern form of a typewriter, and, in particular, the PC used as a medium to access e-mail and other
Internet services does have the potential to reduce paper consumption. Viewing on-screen is substituted
for paper in many cases and there is also an optimisation effect as errors can be corrected before a text
or picture is printed for the first time. However, these positive effects are substantially offset because
today’s PCs and printer technology enable the user to print out hundreds of pages with a few mouse

in association with &
_____________________________________________________________________________________
52 European Commission DG ENV Addressing the Rebound Effect
clicks7 (and at relatively low cost). Therefore, overall ICT contributes to an increase of paper consumption
(Hilty/Ruddy, undated ; Schneidewind et al, 2002. One contribution to this increased consumption is a
direct rebound effect, due to technical efficiency gains (Hilty/Ruddy, undated) providing a gain in time
and money, given that printing is very quick and cheap to achieve. The time aspect is critical as the
reduced time for printing allows consumers to use the time for additional activities, be it additional
printing or other activities with environmental impacts (Schneidewind et al, 2002). Similar to the
household appliances case, this highlights the fact that technical solutions for environmental
improvement should not be considered in isolation from behavioural trends.
7 Paper consumption was found to be a significant environmental impact of office imaging equipment in the EU Energy Using Products
Preparatory Study (IZM, 2008). This did not look at the role of rebound effects, only the significant environmental impacts and potential for improvement.

in association with &
_____________________________________________________________________________________
European Commission DG ENV Addressing the Rebound Effect
53
6. MEASURES AND CASE EXAMPLES FOR TACKLING REBOUND EFFECT
Based on the evidence review and stakeholder input, this section describes evidence based measures
identified to account for or , in theory counteract, the rebound effect in products/services or SCP
interventions in order to reduce environmental impacts from consumption. These are illustrated with
case examples, where available, to show how they can address rebound effects. Outside of the UK
already recognising and accounting for the rebound effect in energy efficiency policy evaluation and
design, no examples of measures to counteract rebound were identified that had been implemented
with results to show how they had actually impacted the rebound effect. The measures and examples
identified in the evidence are proposed for addressing rebound, with some indicating the likely value,
however they require further testing in practice.
The measures identified and analysed are outlined under the following key categories:-
Design, Evaluation & Performance of Policy Instruments
Sustainable Lifestyles & Consumer Behaviour
Awareness Raising & Education in Business
Technology & Innovation
Fiscal Instruments
Mixed Instruments
New Business Models.
6.1 DESIGN, EVALUATION & PERFORMANCE OF POLICY INSTRUMENTS
6.1.1 RECOGNITION IN POLICY DEVELOPMENT & EVALUATION
Recognising the rebound effect in relevant cases, and accounting for the reduction in environmental
performance that results, is a key first step. The UK government includes a 15% reduction in all energy
savings from insulation measures in the home to account for the direct rebound effect . This case
example is summarised below.
CASE EXAMPLE: UK government acceptance and incorporation of direct rebound effect in energy policies relating to home insulation The UK electricity and gas industries were privatised in the 1990s and a subsequent obligation was placed upon them to improve the energy efficiency of the domestic sector. This obligation has been implemented over the intervening years through a series of programmes. For example, the Energy Efficiency Standards of Performance (EESoP) programmes were in force from 1994-2002; they were then replaced by the Energy Efficiency Commitments (EEC) 1&2 which lasted until 2008. The most recent incarnation of this policy measure has been known as the Carbon Emissions Reduction programme (CERT).

in association with &
_____________________________________________________________________________________
54 European Commission DG ENV Addressing the Rebound Effect
The programmes achieved energy savings primarily through the insulating of existing homes (retrofit) at a reduced cost to the consumer. The two most common insulating measures were loft insulation and cavity wall insulation. The expected energy and carbon savings (by which the success of these programmes have been measured) were calculated using the BRE Domestic Energy Model (BREDEM) [BRE 1985], a method consistent with European Standard EN832 and widely used in the UK for modelling energy heat demand in the home. BREDEM uses a mixture of analytical and empirical techniques. Savings for individual measures were calculated from a standard three-bedroom semi-detached home (the most common home in the UK). In the past, it has been noted that the maximum theoretical improvement of thermal performance due to insulation measures has not been achieved in real-life situations, hence the corresponding calculated reductions in energy consumption not achieved. And indeed policy measures in the UK, for example the Climate Change Programme and the EEC programmes, have taken this into account through the use of a reduction factor. However, the exact reasons behind this reduced efficiency were unclear. A study by Sanders and Phillipson (2006) reviewed a number of studies into the differences in measured and theoretical savings in installed insulation measures and clarified a number of areas of uncertainty. Sanders and Phillipson concluded that, previously, the terminology used surrounding the terms rebound, comfort-taking and reduction factor were used intermittently to mean different things. Often the total ‘reduction factor’ applied to a saving measure was attributed to ‘comfort taking’, however, Sanders and Phillipson outlined a useful, clear terminology that explained the differences between these distinct terms.
Reduction factor - the amount by which the measured energy saving following refurbishment is less than predicted from theory
Comfort factor - the part of the reduction factor which can be identified as being caused through improved (increased) internal temperatures (through behavioural changes)
Other factors - the part of the reduction factor which is not explained by the comfort factor. The review of thirteen studies into various elements of insulation measures came to the following conclusions. Generally:
The figures suggest that the reduction factor can be approximately 50% of the theoretical expected energy saving, and
15% of the reduction is due to explicit ‘Comfort taking’. These figures are rounded estimates from the previous studies and as such should not be considered precise values for any individual dwelling. Instead they should be considered as typical for houses that have had their thermal performance enhanced by typically loft and cavity wall insulation. For each subsequent UK energy efficiency programme, the savings for each insulating (and other) measure are reviewed and recalculated under the auspices of OFGEM (Office of Gas and Electricity Markets) and Defra/DECC. In 2008 for the launch of the Carbon Emissions Reduction programme (CERT) the government and OFGEM, in consultation with other stakeholders such as the Energy Saving Trust and BRE, took the decision to reduce the theoretically modelled savings for all individual insulation measures by 15% to account for ‘comfort taking’ which had been researched and proven to exist over the intervening years (Martin & Watson 2006; Henderson, Staniaszek et al, 2003). In addition, the Energy Saving Trust (Foreman, 2010), also in recognition of the rebound effect of comfort-taking, has decreased the energy savings per insulating measure, and hence cost saving advice per measure, it gives to consumers in line with official governmental policy in this area (DECC 2010).

in association with &
_____________________________________________________________________________________
European Commission DG ENV Addressing the Rebound Effect
55
In conclusion, for the UK, the existence of a direct rebound effect through insulation measures has been proven to exist and accepted by governmental agencies to the point that the efficacy of existing carbon reducing policies have been downgraded by 15% reflecting the real-life occurrence of comfort-taking. Further, the DECC Valuation of energy use and greenhouse gas emissions for appraisal and evaluation June 2010 provides guidance and a spreadsheet tool8 to facilitate taking the rebound effect into account in policies that save energy (such as insulation), reduce energy bills and increase consumers disposable income, which may in turn lead to greater consumption of energy through the rebound effect (DECC, 2010). In accounting for the direct rebound effect in evaluations it recommends:-
Only the resource and emission savings of the net reduction in energy which results from the energy saving policy should be valued
The welfare derived from the direct rebound related increased energy use should be counted as a social benefit within the appraisal. When valuing this the full retail price (including tax) should be used. This is based on the assumption that consumers are willing to pay at least the full retail price for the welfare they gain from the increased energy use. As an example, if an energy efficiency measure has the technical potential to reduce energy consumption by 100 units and leave the level of “comfort” unchanged, but the consumer chooses to only reduce consumption by 40 units, then the rebound effect amounts to 60 units of energy and the net change in energy use is 40 units of energy. These 40 units are valued in accordance with the rest of this guidance, accounting for resource cost and emissions savings. The 60 units are valued at the full retail
price, as a welfare benefit (i.e. an increase in “comfort”) (DECC, 2010). As illustrated in Figure 6.1 a screen shot of the spreadsheet tool, the rebound effect can be entered either as a percentage of the gross change in energy or as an absolute quantity.
Figure 6.1: DECC GHG Emissions evaluation toolkit spreadsheet (Source: DECC, 2010)
8 Spreadsheet tool can be downloaded from http://www.decc.gov.uk/en/content/cms/statistics/analysts_group/analysts_group.aspx

in association with &
_____________________________________________________________________________________
56 European Commission DG ENV Addressing the Rebound Effect
6.1.2 CONSISTENT DEFINITIONS AND TOOLKIT FOR REBOUND EFFECTS IN SCP POLICY
Outside of energy efficiency related examples, definitions of the rebound effect are used inconsistently
in the evidence and this is a key source of confusion. The identification and selection of fit-for-purpose
definitions, suitable metrics and a toolbox of measurement approaches will aid in advancing the
ongoing debate and arriving at effective and measurable policy that addresses rebound effects. Defining
the rebound effect clearly, for different policies/interventions, to avoid confusion of what the rebound
effect is and its scope is essential. A toolkit for incorporating rebound effect in policy design &
evaluation tools on a policy/intervention basis is needed. Consensus should be built on a set indicators
that could be used by economists and policy makers to quantify rebound for energy and wider resource
policies and establish boundaries within the different criteria used to determine the size of the effect.
Given the challenges inherent to accurately quantifying the rebound effect (see sections 4.4. and 4.5)
flexibility on measurement methods will be required.
As the measurement of the rebound effect requires modelling, selecting appropriate modelling
approaches is essential to developing an accurate understanding of the rebound effect and constraining
factors. Additionally, as the results of models are only as reliable as their inputs and the underlying
structure of the model itself, it is also essential to ensure that accurate data (in particular, time series
data) is collected across the economy, and especially in sectors which may be subject to policies aiming
to increase efficiency.
Research is ongoing in this field and the work of Barker, et al. 2009 could be used as a starting point,
though it is focused on energy efficiency. This study uses a post-Keynesian model E3MG which is a
sectoral macroeconomic model for the global economy which has been designed to assess options for
climate and energy policy and to allow for energy-environment-economy interactions. The model is
highly disaggregated, including many different energy carriers, users and technologies, as well as
production sectors and world regions. Importantly, it is not an equilibrium model. Each sector in each
region is assumed to follow a different pattern of behaviour within an overall theoretical structure. In
order to estimate the rebound effect, scenarios with and without energy efficiency policies are
compared.
The modelling of non-energy resources is complicated by the additional challenges in quantifying the
consumption of these resources. To date, nearly all modelling of the rebound effect has focused on
energy. Evaluating how such approaches could be applied to non-energy resources is therefore an
important area of study.
Improvements to data and measurements include:-
Accurate measurement of direct rebound effects depends on good time series data on the
consumption and cost of energy services. This is lacking for most countries, sectors and services
Sorrell, 2010).
Indirect rebound effects from behavioural changes or energy efficiency improvements by households
can be estimated through a combination of econometric analysis of household behaviour and input-
output modelling of the embodied energy of goods and services. There is considerable potential to
improve the accuracy of estimates in this area (Druckman et al, 2010).

in association with &
_____________________________________________________________________________________
European Commission DG ENV Addressing the Rebound Effect
57
Economy-wide rebound effects should be modelled rather than estimated. Despite the limitations of
the various modelling tools, there is considerable scope for improving estimates and our
understanding of the relative importance of different mechanisms (Barker et al, 2009).
In analysing energy consumption trends and rebound magnitudes, the inclusion of measured,
flexible cost/production functions and use of measured technology gains for all factors of
production is necessary (Saunders, 2010).
In CGE models, the responsiveness of direct and indirect demand to changes in the implicit price of
energy and knock on effects on other prices is key (Turner, 2010).
Rebound measurement depends on how energy supply and demand behaviour, price responsiveness
throughout the system etc. are specified. Research is required to clearly determine these
specification issues.
Analytical models should include behavioural issues e.g. irrational or habitual behaviours and
imperfect information. This is already feasible (Turner et al, 2009).
6.1.3 WATER POLICY AND REBOUND EFFECTS
For resource policies beyond energy e.g. water where rebound effects are not well investigated at all,
being clear on what the rebound effect is and differentiating it from perverse /unintended
environmental outcomes is important given the status of the topic. The case example below illustrates
how well intended, suggested water saving measures in the UK Code for Sustainable Homes may
actually have perverse / unintended consequences of increasing water use, as well as increasing energy
consumption due to human behaviour. This is not necessarily an official, evidence based example of the
rebound effect, but has the same effect: driven by too low water flow and recycling technologies. It
could be considered ‘rebound through reversion’ (as has been identified in evidence for lighting rebound
effects) where consumers revert to higher use products as a result of dissatisfaction with the water
saving technologies employed. It is included as an example for consideration, in particular for
highlighting how considering the potential for rebound/unintended consequences early in policy
development can prevent these outcomes, as well as for considering how the rebound effect can be
defined in terms of water efficiency measures. Stakeholders also suggested technological advances, e.g.
new irrigation technologies which allow expansion of agriculture into drier regions, could be an example
of rebound effects in water but no evidence was found to demonstrate this to date.
DG Environment are planning to include rebound effects as one part of identifying issues/gaps within
the framework of the review of the policy on water scarcity and droughts assessment. In particular this
will include identifying what EU wide measures/policy options could be introduced concerning water
efficiency in buildings. As part of this there are plans to explore potential examples of unintended
consequences of water saving measures which could have similar outcomes to a rebound effect9. This
can be used as an opportunity to measure water efficiency rebound effects.
9 Personal communication Andrea Name, DG Environment, Protection of Water Environment (D1) (Dec.2010)
with details on the review of water policy at http://ec.europa.eu/environment/water/quantity/scarcity_en.htm.

in association with &
_____________________________________________________________________________________
58 European Commission DG ENV Addressing the Rebound Effect
CASE EXAMPLE: UK HOMES - “WATER SAVING” IMPROVEMENTS IN ATTAINING HIGHER GRADES WITHIN THE UK CODE FOR SUSTAINABLE HOMES The Code for Sustainable Homes (CSH)( DCLG, 2007) is an environmental impact assessment rating scheme for homes that complements (and goes further than) the mandatory Building Regulations in England and Wales. It was introduced in England in 2007. The Code goes beyond the minimum needed to comply with the Regulations and has a star rating system 1-6 for environmental efficiency, (although a zero rating is available). In March 2008, the Govt announced that every new home built would be rated against the standard, even if that rating came out as zero. No specific requirement was set, but the rating will inform home buyers to whether their new home was built to basic standards (i.e. UK Building Regulation standard) or has had additional environmental efficiency standards included. The Code awards new homes a star rating between 1 and 6. Where 1 is entry level above Building Regulations and 6 shows best practice products and efficiencies have been included. There are 9 sustainability criteria that performance is based on, and these are combined to give the overall rating:
energy and CO2 emissions water and runoff materials waste pollution health and well-being management ecology.
The CSH makes water efficiency a core and compulsory criterion which cannot be traded against other measures. However, the way in which water is rated under the CSH makes it possible for designers to make water-illiterate choices which could actually increase the use of water (and carbon) in some products/appliances. Although carbon emissions from water are only 0.6% of total UK CO2 emissions, this rises to 5% when domestic hot water emissions are taken into account (Green Building magazine, 2008). Therefore it is important that hot water consumption should be minimised in homes. The CSH currently makes use of a water calculator to work out what measures are needed to ensure compliance with various levels of the code. Therein lies the problem with water efficiency and the Code. The calculator currently makes compliance with certain grades impossible without installing fittings that may prove unacceptable to users (mainly due to the unfeasibly low flow rates required, e.g. 1.7 litres/min for spray taps in kitchens are required for meeting higher code levels, however it has been seen that stakeholders will not accept products with flow rates of less than 8 litres/min). The installation of too low-flow rate products/appliances will result in disillusionment from users and the tendency to remove the low-flow appliances and replace with much higher flow-rate models, hence resulting in a much higher water/energy use than would be calculated for the CSH star awarded (Green building magazine, 2008).

in association with &
_____________________________________________________________________________________
European Commission DG ENV Addressing the Rebound Effect
59
6.1.4 INCORPORATING REBOUND IN LCA AND USE OF HOUSEHOLD EXPENDITURE DATA
Life Cycle Assessment (LCA) is a tool for measuring the environmental impacts across the lifecycle of
products and services. A Carbon Footprint is the GHG emissions sub set of LCA. These are powerful SCP
business and policy tools, but traditional approaches do not incorporate the rebound effect. In
conducting an LCA of a more efficient technology, it is assumed that all other variables, including the
demand, remain unchanged (called the ceteris paribus assumption). For example, an LCA of a product
assesses the environmental impact per unit of function provided all other aspects remain unchanged.
Evidence suggests that rebound can be incorporated in LCA by replacing this “constant demand
assumption” currently included in traditional LCA as per ISO14040/44 with “consumption as usual”
allowing for stepwise systemic inclusion of rebound (Girod et al, 2009). To enable this, a hybrid
combination of LCA, General Equilibrium Modelling (GEM) and consumer expenditure surveys has been
proposed and was trialled during a Swiss study on rebound effects associated with hybrid cars (Ekvall,
2002, Girod et al, 2009). Equilibrium Modelling is already used in energy modelling and can incorporate
the effects of increased demand across a product lifecycle depending on price changes, substitution etc.
Hybrid combinations of GEM and LCA have already been used in energy modelling incorporating rebound
measurement for coal in an ongoing CIRAIG10 study (Dandres et al, 2010) and show a promising new
approach. In particular this showed that a general equilibrium macroeconomic model can be used to
simulate world markets behaviour and LCA used to assess environmental impacts attributed to markets
behaviour. Consequential LCA (which assesses the effects of changes in the lifecycle) vs. the more
traditional attributional LCA (which assesses the environmental properties of the lifecycle and associated
sub systems) was used in both the Swiss and Canadian studies. However, guidance and use of
consequential LCA is still limited in practice.
The study measured the rebound effect associated with household consumption of hybrid cars in
Switzerland in light of government subsidies for hybrids being made available. The hybrid model, and in
particular, the Household Expenditure Survey data was found to be an accurate measure for direct and
indirect rebound effects. The study concluded that the Survey data is currently underutilised in the EU,
even in Member States when Household Expenditure Surveys exist. It shows how improving questions on
household expenditure though Household Expenditure Surveys can facilitate a more accurate
understanding of the direct and indirect rebound effect that could be used to inform policy development
and performance monitoring ( Girod et al, 2009; Girod and Haan, 2009). The model and data proposed
could facilitate policy design by anticipating rebound effects more accurately at the assessment stage.
6.2 SUSTAINABLE LIFESTYLES & CONSUMER BEHAVIOUR
In order to understand and counteract the rebound effect, and to promote a fully sustainable lifestyle,
human behaviour and consumption patterns need to be taken into account (Defra, 2007; UNEP, 2010,
EEA, 2010). There are multiple ways to influence consumer behaviour and to promote sustainable
lifestyles including clearly documenting and influencing consumer behaviour (“individual awareness
raising”), general awareness raising and information campaigns, setting up of environmentally relevant
product publicity standards and associating positive feelings with certain products or activities.
10 CIRAIG is the Interuniversity Research Centre for the Life Cycle of Products, Processes and Services, Montreal, Canada.

in association with &
_____________________________________________________________________________________
60 European Commission DG ENV Addressing the Rebound Effect
Traditionally, campaigns and initiatives trying to raise consumers’ awareness of sustainable behaviour
are targeted on single issues, such as reducing car driving, saving energy in offices or private residences,
consuming organic food, etc. In general, these awareness campaigns aim at improving efficiency and do
not address absolutely reducing consumption. Concerning the rebound effect, consumers need to be
made aware that buying energy-efficient equipment or driving fuel-efficient cars in itself is not enough
but overall (absolute) reduction of resources/energy/fuels needs to be attained. There are a few tools
that aim at reducing absolute consumption even though these tools are rarely originally set up to
expressly counteract a direct rebound effect. There were no public or private initiatives identified that
are specifically designed to counteract any indirect or economy-wide rebound effects. The approaches
include growing economic philosophical movements focusing on limiting growth, consumption and
identifying national indicators beyond GDP growth to measure social wellbeing such as seen at present in
the UK and France. In the following examples, the most important empirical approaches are outlined to
limit rebound effects through behaviour change towards sustainable lifestyles.
6.2.1 INFORMING CONSUMER BEHAVIOUR IN ORDER TO INFLUENCE IT
People tend to consume more of things they like (e.g. fuels to keep their home even warmer than it
needs to be) if they are not aware of their total consumption. For example, if the billing of energy was
more transparent or people knew instantly what they consume every day, and at which cost, such a
feedback would likely motivate them to reduce non-essential energy use (Dimitropoulos, 2009). As a
consequence, people should be confronted with their individual consumption patterns and thus be
motivated to reduce the absolute consumption of energy and wider resources. This would require them
to be informed on the totality of their consumption and/or to set a benchmark of consumption which
they could compare to.
SMART BILLING/SMART METERING OF ELECTRICITY According to findings by Darby (2006) in the longer term and on a larger scale SMART meter, clear displays, informative billing and annual energy reports can promote investment as well as influencing behaviour. Energy savings have been shown to be about 5-15% for direct feedback via the SMART meter or an associated display monitor and 0-10% for indirect feedback which has been processed before it reached the user, normally energy and electricity billing. Wright et al. (2000) says better billing feedback produced savings of up to 10% in electrically heated homes in cold climates, mainly using simple manual methods. Homes without electric heating could reach energy savings between 0 - 5% range. Two separate Norwegian studies focused on the effects of various forms of enhanced billing information on the consumption of customers show that this can have a marked effect on consumers’ incentive to use energy efficiently. One study analysed the use of electricity bills and tested the effect of (1) showing a comparison between current consumption and that in previous years; (2) more frequent billing (e.g. every 60 days) and (3) using graphs on the bill. The study shows that all these changes tended to produce average energy savings of 10% which were maintained once they had been reached for the first year (Wright et al 2000; SMWG 2001). The second Norwegian study tested the effects of enhanced billing information. The customers (sample size 2000 households) read their own meters every 60 days and sent the data to the utility company. After a year the customer got a clear bill with the energy consumption over the year. The results showed consumer satisfaction with the information supplied and an increase in the number of those who reduced room temperature at night or when they left the house. The same households were surveyed

in association with &
_____________________________________________________________________________________
European Commission DG ENV Addressing the Rebound Effect
61
again, two years later, and the results showed a decrease on energy consumption in these households by around 4%. During the same period general residential consumption had increased by around 4%, so that the sample households had effectively made savings of 8% (Wright et al 2000, SMWG 2001). A specific campaign has been undertaken by the German green electricity company “Lichtblick”, based on the notion that the most environmentally friendly electricity is electricity that is not consumed at all. Lichtblick offered to pay customers a bonus if they absolutely reduce energy consumption. If customers succeed in reducing electricity consumption by 10% within 12 months (compared to the electricity bill of the proceeding year), Lichtblick pays a “Less is more” Bonus of €20. Such a campaign combines awareness raising with a small subsidy (Lichtblick, 2010). As a general policy, Lichtblick always includes average consumption data for a specific type of household in order to enable consumers to compare themselves to the average.
While the approaches mentioned above are principally suited to tackle any direct rebound effects, it is
also important to make people aware of any indirect rebound effects arising when one environmentally
harmful activity is reduced and, in turn, other potentially damaging environmentally activities are taken
up. Thus, care needs to be taken to prevent a rebound effect in which people spend the money they
have saved, from e.g. using less energy or fuels, on other, high-carbon purchases, like additional flights. A
UK study showed estimated indirect rebound effects of around 34 % for three GHG abatement actions
advocated on websites to consumers by the UK government – reducing the thermostat by 1C, reducing
food purchased by one third to reduce food waste and walking/cycling for two trips less than two miles
vs. driving. A best case mitigation strategy was estimated to reduce this indirect rebound effect to 12%
by encouraging householders to shift consumption patterns to lower GHG intensive categories and to
invest in low carbon investments vs. consuming (Druckman et al, 2010).
Communications and campaigns that draw attention to indirect rebound effects could raise awareness.
For example, communications that use humour and satire could mock and highlight the perverse effects
of replacing certain high carbon choices with other high carbon choices (IPPR, 2009). An important key
to preventing any indirect rebound effects is to promote wider sustainable lifestyles that encompass all
relevant areas of life. Consumers should be called upon to assess the environmental burden of all their
activities and try to reduce their absolute environmental impact.
In turn, advocating a shift from increased growth and consumption promote an absolute reduction of
production and consumption by changing fundamental aspects of the current social and economic
system. There is a growing recognition of the causal link between measuring a country’s success by
increased growth using GDP, and increasing consumption (Maxwell, 2006, Jackson, 2009, NEF, 2010). A
few countries are now working on defining indicators beyond GDP to measure success relating to natural
and social capital e.g. the new quality of life measures covering environmental and sustainability issues,
as well as economic performance (ONS, 2010)11, France’s Stiglitz report recommending GDP growth be
used just to measure market activity and that new systems take into account environmental health,
safety and education -- what Bhutan already calls "Gross National Happiness." (Stiglitz, 2009)12. A recent
report “Prosperity without Growth” advocates steering the economic system away from consumption
11 http://www.ons.gov.uk/about/consultations/measuring-national-well-being/index.html 12 http://www.france24.com/en/20090914-france-advocates-new-ways-measure-growth-based-well-being-gdp-stiglitz-report-nobel-economics-
sarkozy-statistics)

in association with &
_____________________________________________________________________________________
62 European Commission DG ENV Addressing the Rebound Effect
driven economic growth while keeping the economy stable and resilient (Jackson, 2009a & 2009). It
highlights that simple decoupling of resource use from economic growth cannot be the primary long-
term concept of a sustainable economy because the projected population growth would require an
enormous extent of absolute decoupling if we want to be sustainable and stick with economic growth of
2%. Achieving this extent of decoupling would also be very capital intensive. Instead it is suggested that
macro-economics needs to be adapted to sustainability. The sheer concept of consumerism would need
to be given up in favour of more sustainable lifestyles focusing much more on immaterial values. This
would require structural changes to motivate these lifestyles, e.g. the wage structures would need to
reflect the social or environmental contribution of a job (e.g. care for children, the elderly) and not only
reward competitive or materialistic outcomes. Another vital aspect would be increased investment in
public goods and social infrastructure. In short, new macro-economics must “abandon the presumption
of growth in material consumption as the basis for economic stability. It will have to be ecologically and
socially literate, ending the folly of separating economy from society and environment. And it must
consist in two main avenues. The first is to dismantle the perverse incentives for unproductive status
competition. The second must be to establish new structures that provide capabilities for people to
flourish – and in particular to participate meaningfully and creatively in the life of society – in less
materialistic ways”( Jackson, 2009).
Further initiatives on this topic from think tanks and research include from “Degrowth”13, in France
(Degrowth, 2010) and New Economics Foundation, UK (NEF, 2010). The “Degrowth movement” has
political, economic and social attributes. Degrowth thinkers and activists promote the downscaling of
production and consumption, as they view overconsumption to be the root of environmental issues and
social inequalities. While the model "Sustainable Development" aims to incorporate environmental
sustainability into continued economic growth, "De-growth" is critical of further growth in the face of a
stressed ecosystem - advocating significant reductions in resource consumption and limits to economic
development (Rose, 2010). Some demands of the degrowth movement sound utopian in light of current,
real-world systems and would need further consideration to enable practical application.
6.2.2 APPROACHES TO LEVERAGE BEHAVIOUR CHANGE
There are psychological limits to the effectiveness of awareness raising and simple information
campaigns, when compared to alternative methods of learning (Jackson, 2005). Lack of consumer
information is only one of the barriers to sustainable consumption. High valuing of a service might make
the consumer resistant to any campaigns, as well as to any moderate price rises of the service employed
to try to curb consumption. Awareness is, thus, only part of the solution, given that consumers do not
make totally rational consumption choices. Many awareness raising and information initiatives
underestimate the complexity associated with achieving behavioural change. Behaviour is determined by
a “rich mixture of cultural practices, social interactions, and human feelings that influence the behaviour
of individuals, social groups and institutions. The idea of ‘consumer sovereignty’ and ‘rational choice
models’ is mistaken, or at best, incomplete given that it does not take into account social pressures and
psychological influences on people’s behaviour” (Jackson, 2005). In particular, sustainable consumption
policies must find ways to tackle the question of habit and routine behaviours, and the social embedding
of individual behaviours (Jackson, 2005). In the following examples, different possible approaches are
13 http://www.degrowth.net/Adresse-Address

in association with &
_____________________________________________________________________________________
European Commission DG ENV Addressing the Rebound Effect
63
outlined to influence consumer behaviour even if they have not typically been specifically developed to
counter (mostly direct) rebound effects.
Product standards, ethical standards, technical standards
Standards can shape behaviour and habits when they form a framework for everyday activities and
phenomena, like publicity or technical activities such as heating, car driving, laundry washing, etc. For
example, publicity standards for advertising goods could include certain marketing rules that include
information on environmental impact of a product or a service, including the energy and resource use of
a certain good. This can help to attract the consumer’s awareness to environmental impact. Also
technical standards can help shape habits or overcome environmentally harmful habits. For example,
automatic heating systems can be programmed to automatically turn down at night-time and adapt
themselves automatically to the exterior temperature without the intervention of the consumer
(Biermayr/Schriefl, 2005). Such automatic programming should take into consideration the human need
for comfort but should restrict comfort to the necessary, thereby helping consumers lose the habit of
unnecessary overheating. Thereby, absolute consumption of fuels and other resources can be attained.
The standardisation of teaching “green driving” in car driving lessons, and the relevance of the use of
these green driving techniques in being granted a licence is an example of how to guide consumers’
behaviours from the beginning. Such training could potentially also be used to absolutely reduce vehicle
mileage, e.g. by teaching people to do without short car journeys that could be replaced in a practical
way by walking or cycling. In order to demonstrate the lack of necessity of these short journeys, it would
be helpful to demonstrate the environmental impact of short car journeys as disproportionate to the
convenience of taking the car.
Positive example of role Models
Role models for consumers from other sectors such as business, government, schools and other social
linkages are a route for transferring pro environmental behaviours (DEFRA, 2007). Some examples of this
are outlined below.
o Employers are an important social reference group, and can be models for certain sustainable
behaviour at the work place, e.g. with regard to the control of heating standards, regulation (SMART-
metering), and waste management/reduction. Any such actions have the potential of translating into
sustainable behaviours of the employees at home. One major instrument to accustom employees to
environmentally sound behaviour can be via the introduction of Environmental Management
Systems directed at the management of the workplace, e.g. monitoring the use of energy and the
production of waste with the aim to absolutely reduce consumption of energy and waste production.
Public Authorities and institutions (inter alia schools) need to be models in their environmental
behaviour. As such they have to focus on visible Environmental Management Systems monitoring
energy and resource consumption in public buildings, aiming to absolutely reduce energy and
resource consumption. Public authorities should also make the most of green public procurement
with the aim to reduce consumption of resources and energy.
o Opinion leaders: The social-symbolic role of consumer goods and services occupies an important
role in modern conceptualisation of identity and the negotiation of the ‘self-concept’. Material goods
and services (e.g. holiday destinations, bigger cars) play an important role in the process of identity
construction. This is one of the key elements in the sociology and psychology of consumption. The

in association with &
_____________________________________________________________________________________
64 European Commission DG ENV Addressing the Rebound Effect
idea that material goods are also a part of the ‘extended self’ (Belk, 1988) tying consumption
patterns closely to individual and collective processes of identity construction is key. As a
consequence, the social-symbolic roles of consumer goods need to be re-defined according to their
environmental impact. In order to do this, opinion leaders and popular figures in society should be
persuaded to promote a lifestyle and goods and services, which feature a low environmental impact.
As such, the Toyota Prius was taken up by Hollywood celebrities as a real environmental innovation
with cool design that would also fit normal users, thus the product was defined as also acceptable to
the mainstream.14 Such activities could be extended to promote absolute reduction of consumption
of energy, etc.
Behaviour-influencing initiatives as an effective complementary strategy
Persuasion is a form of social influence. It is the process of guiding oneself or another towards the
adoption of an idea, attitude, or action by rational and symbolic (though not always logical) means.
Persuasion is particularly difficult in a message-dense environment (Jackson, 2005). Effective persuasion
relies on observing a number of basic principles. These include:
o understanding the target audience;
o using emotional and imaginative appeal;
o immediacy and directness;
o commitments/loyalty schemes;
o using ‘retrieval cues’ to catalyse the new behaviour.
MASS MEDIA CAMPAIGNS - HEALTH In health promotion and disease prevention, mass media campaigns are one of the major information tools which have the aim to increase healthier behaviour in the population. Advantages are the wide reach and cost-effectiveness of these campaigns. A meta-analysis of 48 studies of the behavioral effect of mass-media health campaigns found that 9% more people performed the healthy behaviour after the campaign than before (Snyder 2001). A Norwegian study (Hafstadt et al. 1996) showed a successful example for an anti-smoking mass media campaign. The three-week campaign consisted of full page newspaper advertisements, a poster and TV and cinema spots. The messages of this campaign were designed to produce dissonance. They clearly pointed out inconsistencies between widespread attitudes in the target population, on the one hand, and smoking on the other hand. A questionnaire was sent to 5051 young people, answered by 73% showing that 12% of smokers had decided to quit smoking because of the campaign. The results also showed that discussion with peers was the most important trigger for behavioural changes among smokers. The examples from the health sector show mass media campaigns can lead to a long-time behaviour change and could also be used as tool, e.g. for the energy sector, to counteract rebound effect. Measures with the aim of reducing energy consumption could be accompanied by a campaign with energy saving tips to drive energy reduction behavior. But the success of the mass media campaigns depends on a number of design considerations. Randolph and Viswanath (2004) identify the following factors that contribute to the success mass media campaigns for public health, which can also be transferred to the energy or resource sector. Campaign messages should be simple and straightforward. It is important to have creative campaign messages and the right placement for the specific target group.
14 http://www.allabouthybridcars.com/hollywood-hybrids.htm

in association with &
_____________________________________________________________________________________
European Commission DG ENV Addressing the Rebound Effect
65
The integration of professional communication services enhances the probability of campaign success. And the campaigns can be more successful when they are accompanied by structural changes at the same time that provide the structure for the target audience to act on the recommended messages. Hafstadt et al (1996) points out that a discussion about the topic with other people for example from the peer group increases the success.
SAFE DRIVING CAMPAIGN - UK ROAD SAFETY In the UK, the THINK! campaign for road safety was established in 2000. The starting point was the UK government target for reduction of road deaths and serious injuries by 40 % in 2010 compared to the average in 1994-98. The goal was improvement of road user behavior and higher acceptance of engineering and enforcement initiatives which would increase road safety. Parallel to the campaign, the UK Road Safety Act 2006 was adopted. The law regulates various road safety topics, like Drink Driving and Speeding. As one instrument, the law includes higher sentences by road deaths and higher penalties for the use of hand-held mobile phones during driving. The campaign supported activities of local authorities and targeted the activation of actions in the private sector. For the campaign clear specific messages were used to reach the audience and to get the media interested in road safety. The campaign used a mix of an emotional messages to people and delivered facts to increase the knowledge about road safety and the UK government targets. Different media channels, like TV, radio, press etc. were included to target local authorities and private sector companies. Sports sponsorship was involved to deliver the message to a wider audience (UK Department for Transport, 2011). The evaluation which accompanied Think! shows that in 2009 48 % of the interviewed people in the survey recalled road safety advertising. 80 % remembered the Think! logo and half of the survey participants believed that the campaign helps to make roads safer (Angle et al. 2009). The statistical data for the UK shows a decrease of 44 % of killed or seriously injured people because of road accidents in 2009, 26,906 people, compared to the average figure 1994-98 of 47,656 killed or seriously injured. A similar result is shown, if reported casualties in road accidents are considered. 319,928 casualties were registered for the average 1994-98, to 222,100 in 2009. The number of casualties dropped by 31 % (UK Department for Transport, 2010).
6.3 AWARENESS RAISING & EDUCATION IN BUSINESS
A selection of misguided, albeit well intentioned, green advertising/messaging examples are outlined
below. These illustrate the importance of raising awareness and educating business and the media to
avoid these actors inadvertently causing an indirect rebound effect in consumers.
CASE EXAMPLE: MISLEADING GREEN ADVERTISING/MESSAGING CAUSING REBOUND
Green advertising and communications has become very popular in recent years with a number of large, multinational companies beginning to try to gain market advantage by advertising their green credentials and appealing to the ‘eco-aware’ consumer. Examples are campaigns such as Marks & Spencer’s ‘Plan A’ strategy and British Gas’s claim to be the greenest of the main energy suppliers in the UK. However, there are classic examples of how companies get confused about the messaging they are promoting and inadvertently add to an ‘indirect’ rebound effect by encouraging their customers to indulge in environmentally damaging behaviours in one area whilst simultaneously

in association with &
_____________________________________________________________________________________
66 European Commission DG ENV Addressing the Rebound Effect
encouraging them to change their purchasing and behavioural habits for the environmental good in another. Three examples of this indirect rebound effect within advertising/communications are described below.
Tesco - ‘Lights for Flights’ advertising campaign
This short-lived campaign (it was removed days after launch due to backlash from environmental commentators (Guardian, 2009) was promoting the environmental benefit of switching old incandescent light bulbs for new energy efficient CFL-type bulbs (at this time in the UK the government were phasing in a voluntary ban on high wattage incandescent bulbs and a number of the major supermarkets were promoting the purchase of (heavily discounted) energy efficient lighting products). Unfortunately, their good intentions were negated by the juxtaposition of the offer to earn ‘Air Mile’ points through the purchasing of energy efficient light bulbs. See the advert below.
A simple calculation of the carbon saving from swapping from a 60 Watt light bulb to a 15 Watt CFL, per year, is approximately 34kg CO2/year (in a high use area, 4 hours per day15). The carbon used by a single return flight London - Paris in economy class is approximately 60kg (DECC Act on CO2, 2010). The contradiction and potential consumer confusion inherent in any messaging that promotes, on the one hand, an environmentally friendly purchasing/behaviour change, but on the other, equally promotes an arguably more damaging behaviour, is clear.
Ontario Power Authority - ‘Power Pledge’ Campaign
An example from Canada that follows similar lines to the Tesco example previously. The Ontario Power Authority (OPA) was established by the Ontario government in 2004. It is responsible for ensuring a reliable, sustainable supply of electricity to Ontario. The OPA has set ambitious plans for reduction in electricity demand. The reduction target included 75% of expected increase in demand up to the end of 2010 and was equal to taking 1 in 5 homes of the electricity grid. In 2010, it launched a campaign (www.powerpledge.ca) with the support of WWF Canada to help the householders of Ontario reduce their energy bills through behavioural changes. Examples of the types of actions that OPA were promoting were:
buying Energy Star appliances becoming more ‘laundry smart’ getting a Home energy audit and following recommendations
15 Calculation for light bulb savings: CO2 saving: 60x4 = 240 x 365 = 85,000watts/year or 85 KW. 85 x 0.539 = 45 kg CO2/year. Versus 15x4=60 x
365 = 21900 watts/yea or 22 KW. 22 x .539 = 11 kg CO2/yr. Saving: 45 - 11 = 34 kg CO2/year

in association with &
_____________________________________________________________________________________
European Commission DG ENV Addressing the Rebound Effect
67
get rid of old kitchen appliances such as fridges reducing standby power.
For people who pledged to do one or more of these actions, the Power Pledge website was offering Air Miles in return. Again, this type of confusing ‘green’ advertising and communication campaign only serve to heighten the confusion in the consumer’s mind regarding what they should, and should not, be doing in order to become more pro-environmental in their lifestyles and behaviours. The message that you get rewarded with Air Miles for reducing energy use in the home is clearly an influencer in the area of indirect rebound actions. The inclusion of a well-respected environmental NGO such as WWF is also surprising, but will give credence in the eyes of consumers to the validity of such an offer. The website (at time of writing) has now no mention of the Air miles reward for Power Pledges (except at the bottom of the Power Pledge Live page, where the 20 free Air Miles offer is still apparent). A screen shot of the earlier website, with the Air Miles offer clearly shown, is reproduced below.
Air Miles for Mobile phone recycling
This example originates from the Air Miles company itself. In this advert, Air Miles UK are promoting the recycling of old, used mobile phones to help reduce environmental waste, they also claim not to profit from the recycling of mobile phones, but instead donating all monies to environmental projects. Where Air Miles have not joined up the dots on pro-environmental behaviours is by offering up to 750 air miles for the recycling of a phone. 750 air miles will easily get you to Paris and back (London) - a carbon emissions equivalent of 60kg.

in association with &
_____________________________________________________________________________________
68 European Commission DG ENV Addressing the Rebound Effect
6.4 TECHNOLOGY & INNOVATION
The evidence is clear that the existence of rebound in specific circumstances does not mean efficiency
should not be a focus of environmental improvement strategies, but the take back in efficiency savings
rebound causes needs to be incorporated so targets are realistic and not overestimated. Further, for
efficiency interventions and behaviours where rebound exists, engineering technology efficiencies alone
will not provide the improvement required. Policy can distinguish and account for rebound effects in
those technologies where they occur with efficiencies. In particular this should be the case for general
purpose energy technologies as rebound effects are stronger for these vs. others. This is because they
permeate the economy once a threshold efficiency of operation is realised and hence contribute to
consumption growth and economy wide rebound (Sorrell, 2007, van den Bergh, 2010).
Outside of technology and innovations aimed at energy efficiency, at the bigger picture level the
rebound effect provides a further rationale for ongoing support of technologies that provide clean, and
abundant energy sources. At this level, clean technology is a fundamental part of mitigating energy
efficiency related rebound effects and ultimately reducing GHG emissions.
6.5 FISCAL INSTRUMENTS
Fiscal instruments are key existing instruments for reducing environmental damaging activities in both
production and consumption. Where there is a need to counteract rebound, taxes are a possibility. In the
case of energy, a carbon tax is seen as too indirect and it would be better to focus directly on the energy
use where the price change occurs. Measures that can dampen rebound effects in the short term include
raising the price of fuels so that effective/implicit price does not change (if politically feasible to raise the
price of energy) or rationing the resource e.g. via rationing energy supply i.e. Cap & Trade schemes for
industry or SMART meters for consumers. A resource focused example is the UK aggregates tax which
aims to reduce the demand on virgin materials while the money raised is simultaneously used to recycle
aggregates. For energy, revenues from taxes could be partly used to bring energy efficiency improving
technologies to the market e.g. as already done under the UK Climate Change Levy). Progressive prices or
taxation structure could be a feature in order to avoid fuel poverty. However, taxes are distortive and it
is difficult to design an optimal tax to address something as specific as the change in energy prices as a
result of efficiency improvements (particularly where actual as well as effective prices change). This
needs consideration at policy development stage such that the full economic benefits of improved
efficiency are maintained. Awareness measures should be considered in tandem to help energy users
(producers and consumers) understand the issues and consider how they can voluntarily adjust their
behaviour in responding to price and income changes (Turner, 2010).
Two case examples below illustrate the role of fiscal measures. The EU IMPRO (Meat and Dairy) study
shows that various measures to reduce the environmental impacts of meat and dairy consumption will
cost more and demonstrates in these cases that a negative rebound effect occurs meaning a greater
environmental benefit than the intervention expected is achieved. Secondly, an Austrian case example
has investigated the level of energy taxes required to counteract the rebound effect.

in association with &
_____________________________________________________________________________________
European Commission DG ENV Addressing the Rebound Effect
69
CASE EXAMPLE: FOOD (MEAT & DIARY)
As the consumption of meat and dairy products contribute on average 24 % of the environmental impacts from the total final consumption in EU-27, while constituting only 6 % of the economic value, measures to reduce the environmental impact of the sector merit the attention of policymakers (Weidema et al, 2008). Understanding which rebound effects may be at play is key to ensuring the efficacy of any measure. Contrary, for example, to energy efficiency improvements - which generally result in financial savings to consumers - increasing the environmental performance of food production can make food either more or less expensive to produce and consume. As such, depending whether the cost of food production increases or decreases as a result of a certain improvement option, the rebound effect can be positive or negative. In this context, negative rebound is where the implementation of the measure increases the costs of production which leads to an overall decrease in consumption. This results in the environmental impact of the production process being reduced beyond what was expected from the implementation of the measure alone. The EU IMPRO Meat and Dairy study (Weidema et al, 2010) measures the effectiveness of different approaches to improving the environmental performance of meat and dairy production both with and without the rebound effect. The study identifies different types of rebound effects which may impact the effectiveness of the improvement options, namely price, time, space and technology related. By equating the price rebound to the own-price elasticity for meat and dairy products, the study calculates a price rebound of 35%. As most of the improvement options looked at in the study tend to increase the cost of meat and dairy production and consumption, the rebound effect is often negative, meaning that the total environmental benefit of the policies are greater when rebound
effects are included. This is summarised in Figure 6.2
Figure 6.2: Summary of IMPRO study findings – Sum of all improvement potentials in % of the total impact from consumption of meat and dairy products. Negative values signify an improvement.

in association with &
_____________________________________________________________________________________
70 European Commission DG ENV Addressing the Rebound Effect
More specifically, the IMPRO Meat and Dairy study calculates the degree to which the environmental impacts from the consumption of meat and dairy products in the EU-27 can be reduced through twelve different improvement options. While the study integrates the different types of rebound discussed above (i.e. money, time, space, and technology), it is interesting to consider the role of the changes to the cost of production. Some of these options increase the cost of producing food, whereas others decrease it. Therefore, we would expect that those measures which increase the cost of food production would tend to result in a negative rebound as the overall consumption is suppressed. On the other hand, those measures which result in reduced production costs would tend to show a positive rebound, as the cost of food production is reduced, thereby encouraging increased consumption.
This hypothesis is borne out by the findings of the study. Figure 6.3 summarises these findings, showing the positive and negative rebound associated with the increase or decrease in production costs. Note that, in certain cases, such as the home delivery of groceries, the rebound can be significantly negative, meaning the impact of the measure goes well beyond its direct reach to greatly reduce environmental impact. In the case of home delivery of groceries, this is due to the significant increase in the supply side costs, combined with savings from reduced travel.
Figure 6.3: Summary of IMPRO findings
Improvement option
Improvement potential without rebound (negative values signify an improvement)
Improvement potential with rebound (negative values signify an improvement)
Difference Rebound effect
Direct cost of improvement option in % of total cost for meat and dairy products
Optimised protein feeding -1.30% -1.88% 0.58% -44.62% 0.24%
Liquid manure pH reduction -1.42% -1.94% 0.52% -36.62% 0.17%
Liquid manure bio gasification -0.99% -1.43% 0.44% -44.44% 0.26%
Home delivery of groceries -0.37% -3.54% 3.17% -856.76% 3.10%
Power saving in industry -0.44% -0.39% -0.05% 11.36% -0.15%
Household meal planning -2.18% -1.92% -0.26% 11.93% -0.16%

in association with &
_____________________________________________________________________________________
European Commission DG ENV Addressing the Rebound Effect
71
CASE EXAMPLE : QUANTITATIVE ANALYSIS OF AUSTRIAN HOUSEHOLDS SHOWS REBOUND IN FOOD, CLOTHING AND ENERGY SERVICES AND CALCULATES TAXES NEEDED TO COUNTERACT Kratena et al., 2010 undertook a micro-econometric study which highlights the complexity in quantifying the rebound effect for energy and non-energy goods and services as well as calculating how such rebound can be counteracted. The analysis of 3,500 Austrian households uses a model which combines both time-series and cross-section estimation. From this the authors calculate price elasticities (which they understand to be equivalent to rebound) for food, clothing, transportation fuels, heating, and electricity both ceteris paribus (i.e. in one case assuming no changes in the other goods) and in the other case taking into account the assumed changes) and in conjunction with one another. These price elasticities are calculated out to 2020 and future efficiency improvements are assumed based on current trends and future legislation. The derived rebound effects of the two
approaches are summarised in Table 6.1
Table 6.1: Summary of rebound effects calculated by Kratena et al, 2010
Good or service Rebound - ceteris paribus
Assumed efficiency increases
Rebound - Combined
Food 11% -not given- -not calculated-
Clothing 160% -not given- -not calculated-
Gasoline/diesel 46% 20% 11%
Heating 26% 50% 19%
Electricity 12% 20% 11%
The combined analysis takes into consideration cross-price effects as well as the income effect. Rather than being calculated based on a ceteris paribus assumption, this calculation takes into consideration the multiple repercussions within a complex demand system. The increased taxes which would be required in 2020 to counteract the rebound effects mentioned above (combined
rebound) are calculated as summarised in Table 6.2.
Table 6.2: Tax rates required to counteract rebound effect ( Kratena et al, 2010)
Product or service Rebound – Combined Tax rate required to counteract rebound
Gasoline/diesel 11% 7%
Heating 19% 80%
Electricity 11% 60%
The authors state that such tax rates would effectively neutralise the rebound effect, thereby allowing the full advantage of the technological improvements to be appreciated. Indeed, the authors go so far as to say, “ambitious technological standards and energy taxes are ideal complementary instruments for climate policy.”

in association with &
_____________________________________________________________________________________
72 European Commission DG ENV Addressing the Rebound Effect
With regard to rebound effects from transport, measures to counteract are the integration of external
costs in prices for transportation. For example through road charge systems for freight transportation
which focuses on GHG or other air emissions. Also taxes on fuel which rely on GHG-emissions are an
option. Another possibility is labelling of environmental impacts, especially GHG emissions, for
transportation, for example delivery services (Ruzzenenti & Basosi, 2008, Litman, 2009, Noland & Lem,
2000).
A new USA analysis of energy policy related rebound effects across 30 sectors, show a large variation of
rebound across sectors. Therefore, the effect of sectoral based measures e.g. carbon taxes results may
vary and a uniform tax across all sectors could unfairly penalise sectors. This would indicate that sector
specific instruments that aim to deliver energy consumption reductions with least cost to economic
welfare, may be more effective and equitable in practice (Saunders, 2010). This is already consistent with
SCP sectoral and product/service specific interventions.
Further, expert stakeholders were consulted and evidence considered to determine whether
internalising all environmental externality costs would make the rebound effect irrelevant. The results
are outlined in 6.5.1.
6.5.1 ENVIRONMENTAL EXTERNALITIES AND THE REBOUND EFFECT
It has been suggested that if all environmental externalities were internalised in the prices of products
and services, the rebound effect would become irrelevant. Given that this hypothesis is generally not
addressed in the literature, it was systematically posed to experts during the interviews conducted by
the project team. They were also asked whether the prospect of internalising all externalities was
possible.
This second question is a precondition to the first. If it is not possible to internalise all externalities, then
the possible results of such a situation become academic. With regard to this question, the experts
generally agreed that the internalisation of all environmental externalities is not possible in the real
world. Reasons cited for the impossibility of this prospect were linked to the uncertainty inherent to
econometrics, making it impossible to design a mechanism which perfectly accounts for all external
costs, as well as lack of political will to raise the cost of critical resources and natural capital, such as
energy.
That said, the experts also broadly agreed that internalising more externalities would tend to limit the
impact of the rebound effect. While increases in efficiency will tend to drive the cost of products and
services down, internalising external costs will have the opposite effect. It was suggested that such a
combination of measures which increase the resource efficiency of products and services with measures
which account for external costs leading to the greatest environmental benefit, after rebound effects
have been accounted for.
The goal need not be internalising all externalities as this may be impossible, but rather internalising as
many as possible given what is feasible in terms of econometric analysis and political will. Doing so will
help to limit the impact of rebound effects, though it will not make them entirely irrelevant.

in association with &
_____________________________________________________________________________________
European Commission DG ENV Addressing the Rebound Effect
73
6.6 MIXED INSTRUMENTS: TECHNOLOGY, FISCAL, BEHAVIOUR
Where the rebound effect is significant, it is clear that efficiency measures alone will not be sufficient to
resolve the environmental problem and that other measures will also be required (Sorrell, 2007; EC,
2010). This use of a mixture of instruments is an element of the SCP policy toolbox already, in particular
to incorporate both demand and supply facing measures.
The evidence shows there are benefits in establishing and following a consistent multi instrument
approach regarding the rebound effect. Linden A. et al, 2006 analysed the results of a survey of 600
Swedish households to conclude that energy efficiency and rebound effect mitigation are possible with
enough combined incentives (pricing and taxing) and information (energy labelling, more user friendly
technologies etc). A key finding is that it is also very important to promote behaviours in line with recent
trends in lifestyles, for example time saving behaviours, latest fashion for energy efficient technology or
a comfortable indoor environment. According to Linden when trends in lifestyle, energy efficient
technologies and pro-environmental behaviours coincide, changes to more efficient behaviour seem to
appear almost automatically. In the same spirit, Birol et al, 2000 stated that, contrary to the general
belief that two policy approaches that change relative prices and technology development are opposite
to each other; they are the two faces of the same reality and should be developed and promoted
simultaneously and consistently (Birol et al, 2000).
The following case examples outlined below illustrate the benefits of a mixed instrument approach in counteracting rebound:
Lighting – role of policy, fiscal and technology instruments;
Transport rebound associated with traffic decongestion – role of pricing, behaviour, planning and public transport
Toyota Prius – role of subsidies combined with awareness raising and behaviour change
Space heating – Role of technology, behaviour and awareness raising.
CASE EXAMPLE: COUNTERACTING REBOUND EFFECT FROM ENERGY EFFICIENT LIGHTING POLICY AND TECHNOLOGY
Energy efficiency lighting policy incorporates shifts to more energy efficiency technologies (e.g. incandescent to CFL to LED) as well as incorporation of lighting controls and SMART technology.
Figure 6.4 illustrates the potential energy saving for these measures. Evidence shows factors e.g. affordability of the bulb, rebound through reversion when a technology does not meet a user’s expectation (e.g. CFLs not giving enough light) and increasing electricity pricing are considerations for tackling the rebound effect in lighting. These are outlined in this case.
The relative affordability of the bulb – both capital and running costs – is an important factor behind the ever-increasing consumption of light, with the real cost of a lumen of light from an artificial light source falling by nearly 4 orders of magnitude over the last 200 years due improvements in the efficiency and durability of light sources (Nordhaus, 1997). In 2000 in the UK, lighting services cost less than one three thousandth of their 1800 value (Fouquet and Pearson 2006). Research shows that increases in electricity prices (via market forces, taxes or other mechanisms) could lead to a net decline in the electricity used for lighting consumption (Tsao et al. 2010).

in association with &
_____________________________________________________________________________________
74 European Commission DG ENV Addressing the Rebound Effect
Figure 6.4 UK LIGHTING INDUSTRY REALISING THE POTENTIAL FOR ENERGY SAVING (2010) Prepared by the Energy Efficiency Partnership for Homes’ Lighting Strategy Group
The introduction of regulations to limit overall consumption of light and emissions, rather than simply the use of a given technology of lamps, e.g. LEDs over CFLs expressed in luminous efficacy (lumens/Watt), would also result in the flattening or decreasing of overall light consumption. However, there is a risk that customers who want the same or more light from the new bulbs will be tempted to upsize to the next lumen bin, i.e. a higher wattage lamp, thus reducing or even eliminating the resulting energy savings (Callwell, 2010). Factors influencing rebound through reversion are replacement costs, availability of the technology, traditions, norms and dissatisfaction with the quality of the service. Ensuring quality concerns are tackled prior to any major roll out programmes, as is currently ongoing for LEDs, is key to reducing ‘rebound through reversion’. But most importantly, light controls and smart technology have a crucial role to play. The full potential of LEDs to save light also comes from the fact thatthey can be more easily controlled to respond to specific user needs, e.g. real-time control of intensities and focus of light. Subsidies are likely to be envisaged in due course to boost the adoption of LEDs to compensate for the upfront costs, which are currently high. But until reasonably priced LEDs become widely available, increases in electricity prices through fiscal instruments – resulting in lesser affordability in terms of running costs – could still remain a driving force towards a more rationalised use of lights, thus curbing light consumption. Higher electricity prices could also encourage some users to switch to LEDs sooner than anticipated should they realise the potential savings that they could achieve, in spite of the higher capital costs.
CASE EXAMPLE : ROAD DECONGESTION AND INCREASED TRAFFIC
Increasing urban road capacity in order to relieve traffic jams tends to generate additional peak-period trips that would otherwise not occur (Victoria Transport Institute, 2010). Evidence also shows that increases in highway capacity attract new traffic and measures to counteract traffic jams ends in unexpectedly crowded new facilities (Goodwin, 1996). This effect is a combination of diverted vehicle trips and induced vehicle travel (shifts from other modes, longer trips and new vehicle trips). Diverted vehicle trips mean additional vehicle trips on a certain road/route because of shifts in travel time and changing routes, so the driver’s behaviour changes and the change of time or route lead to

in association with &
_____________________________________________________________________________________
European Commission DG ENV Addressing the Rebound Effect
75
more travel during peak time. Induced vehicle travel can be described as an increase in total vehicle mileage due to increased motor vehicle trip frequency, longer trip distances or shifts from other modes, but excludes travel shifted from other times and routes. The consumer benefits from induced travel, because they have the possibility for increased mobility, but it also tends to increase total crash risk, pollution emissions, higher parking costs and urban sprawl. Also the more vehicle oriented land use pattern, and car focused transportation system leads to additional traffic (diverted
and induced) in the long run. Table 6.3 shows the results of various studies that measure which share of added urban roadway capacity is filled by induced travel (increased mileage).
Table 6.3: Portion of new road capacity absorbed by induced traffic (Source: Victoria Transport Institute, 2010)
Author Short-term Long-term (3+ years)
SACTRA 50 - 100%
Goodwin 28% 57%
Hansen and Huang 90%
Noland 20 - 50% 70 - 100%
Reduced congestion lowers travel times and the general cost of driving, but also tends to increase driving. In other words, urban traffic congestion tends to maintain a self-limiting equilibrium. Vehicle traffic volumes increase to fill available capacity until congestion limits further growth. Travel that would not occur if roads are congested, but will occur if roads become less congested, is called latent travel demand. Increasing road capacity, or reducing vehicle use by a small group, creates additional road space that is filled with latent demand. Any time a consumer makes a travel decision based on congestion (“Should I run that errand now? No, I’ll wait until later when traffic will be lighter”) they contribute to this self-limiting equilibrium (Victoria Transport Institute, 2010). To counteract this rebound effect the price for driving during peak time could be increased. For example road use charging is a useful tool to manage travel demand and change travel patterns. Congestion charging is already operating in Stockholm, London and Singapore and these schemes show their benefits with regard to reducing traffic. Also the pricing for parking could be increased. A second part of the strategy focuses on alternative transport modes. The public transport system could be improved, to increase the attractiveness by shorter travel times, more direct connections or short interchange times. Another tool is smart ticketing, which allows accurate estimation of travel times, interchanges and end-to-end-journeys. Also changes in land use can impact on travel behaviour. By reducing the need to travel the rebound effects could be reduced. So “compact” or “polycentric” cities could lead to less average journey distances, less trip frequencies and, because of that, less CO2 emissions (Institute of Engineering and Technology, 2010).
LONDON CONGESTION CHARGING The London Congestion pricing was established in 2003. During weekdays automobiles have to pay a fee if they want to drive in central London. The fee is payable per day, or with discounts for a week or month. There are some exemptions for licensed taxis, vehicles used by disabled people, some alternative fuel/technology vehicles, e.g. hybrids, public transport vehicles and emergency vehicles. For the 2004/05 budget year the costs and revenues resulting in £97 million in net revenues (£190 million in total revenues, £92 million in overhead expenses). Before the congestion pricing 12% of the peak-period trips were made by private automobile. Through the congestion pricing program the

in association with &
_____________________________________________________________________________________
76 European Commission DG ENV Addressing the Rebound Effect
peak-period trips by private vehicle dropped to 10% and decreased by 20%. The total volume of traffic entering the charging zone during charging hours decreased by 21 % in 2005 compared to 2002 (pre-charging period). That means 20.000 automobiles per day less drive through central London. Most people changed to the public transport system, some also use other routes or travel times or changed their destinations. (Litman, 2006, Transport for London, 2006; Transport for London, 2008). Litman (2006) also decribes the potential for further improvements of the congestion pricing system in London. The fee could be based on the driven miles within the charging area. The fee could be higher during peak-period time and less during less congested periods. Furthermore different fees for different locations would improve the charging system.
CASE EXAMPLE : TOYOTA PRIUS – SWITZERLAND & BEHAVIOUR CHANGE Hybrid cars represent a promising technology to decrease fuel consumption of passenger cars. A much discussed question is whether the environmental recognition and rising popularity of eco vehicles such as the Toyota Prius could lead to direct and indirect rebound effects due to increased fuel use overall. A consumer study in Switzerland found no direct and indirect rebound effects (de Haan et al, 2006). The direct rebound effects would be due to:-
a) people switching from small and/or already fuel-efficient cars to a heavier and bigger new hybrid car;
b) Increasing overall vehicle ownership if the hybrid car is purchased and existing cars in the household are not disposed of or if it sets an incentive to buy a car for the first time (de Haan et al, 2006).
a) Switch to a heavier car: The Toyota Prius weighs 170 kg more (total weight) than the average
similar sized car. However, there is no reason to assume that consumers replace their small or already fuel-efficient cars with the Toyota Prius for economic reasons (price rebound) given that the Toyota Prius is more expensive than average cars and the saving of fuels only pays off at the end of the average lifetime of the car (de Haan et al, 2006, p. 596). The Swiss study showed that the replacement of cars by a Prius that occurred (cars from 1996 were replaced in 2004 by Prius) only led to a small rise in weight (from 1309 to 1375 kg). This was however much lower than the development of car size in general as cars of 1309 kg in 1996 would be replaced by cars of 1462 kg in 2004 (de Haan et al, 2006). Thus, there was no direct rebound effect.
b) The additional purchase of the Prius (i.e. in addition to cars of the household that are kept or as
a first car and the corresponding growth in vehicle ownership) would not be out of economic reasons but out of psychological/prestige reasons (meaning: “Look we have the Prius, we are sustainable!”). No such rebound effect has been identified. Swiss consumers buying a Prius as a first car or as an addition to the existing car fleet only represented 13%) whereas car purchases matching the age groups of Prius 2 purchasers as first cars or addition normally account for 20%. De Haan concludes that the Prius 2 does not lead to an increase in vehicle ownership, making hybrid cars a good target for potential government subsidies. Such policy measures are generally targeting “early adopters” with the aim of enabling the breakthrough of new, more efficient technologies (de Haan et al, 2006).
No evidence of indirect rebound effects was shown in this study. Buying this more efficient eco car that was cheaper to run because less fuel was needed did not result in increased expenditure on other good/services with increased environmental impact but showed expenditure on higher “quality” eco goods with reduced impact e.g. organic food. As a consequence, no indirect rebound

in association with &
_____________________________________________________________________________________
European Commission DG ENV Addressing the Rebound Effect
77
effect was identified. A reason proposed for this was that the consumer deciding to buy the hybrid car has environmental reasons for doing so and this might constitute a potential link with increasing knowledge on car and wider product environmental impacts that translates across to other products (de Haan et al, 2006). This illustrates the key role consumer awareness raising could play in avoiding indirect rebound effects.
CASE STUDY: CHANGE OF SPACE HEATING MODE (STRUCTURAL REBOUND) E.G. GOING FROM COAL STOVE WHICH CAN HEAT ONLY ONE ROOM TO CENTRAL HEATING If a heating system is upgrade from a decentralised (“one-oven system”) into a centralised system (“automatic heating”) certain inconveniences are lifted for consumers such as having to buy coal or other fuels and having to manually start the heating process by igniting fuels. In general, a higher and more continuous comfort level is attained with central heating. Furthermore, also space is heated that was not and could not be heated before, with the one-oven system, such as bathroom or bedroom. This is called a “structural rebound effect” (Biermayr/Schriefl, 2005). Such effects arise especially when old buildings are made subject to refurbishment. Therefore, this case is relevant for Member States where outdated heating systems are still common and widespread building refurbishment programmes are ongoing /planned. A study commissioned by the Austrian Federal Ministry of Construction concluded that the switch from one-stove-systems to central heating without any further thermal modernisation measures would not yield a price-induced direct rebound effect (Biermayr/Schriefl, 2005). However, the easier mode of the new automatic heating system would induce a considerable behaviour based rebound effect given that consumers tend to take advantage of more and easier comfort by the new heating system, thereby heating more rooms than previously. Income was identified as the most important socio-economic factor determining the extent of the rebound effect. If a consumer’s “heating budget” is not limited, consumers tend to take advantage of increased comfort after renovation and heat more after the non-automatic heating was replaced by an automatic heating. On the other hand, in specific cases where dwellers are more restricted in budget and after renovation the heating costs increase per unit (i.e. if the new heating mode is more expensive in its operation than the old one), even “negative rebound effects” were witnessed when consumers have to reduce the comfort level they had before renovation. While, such a development might be welcome with respect to the environmental outcome, it is negative from a social perspective (Biermayr/Schriefl, 2005). The table below shows the influence of the heating system and income on the rebound effect if buildings are renovated, in one case leaving the automatic heating system as is and carrying out other energy upgrading measures in the building, in the other case replacing non-automatic heating with automatic heating.16
16 Not specifying if additional energetic upgrading is done or not.
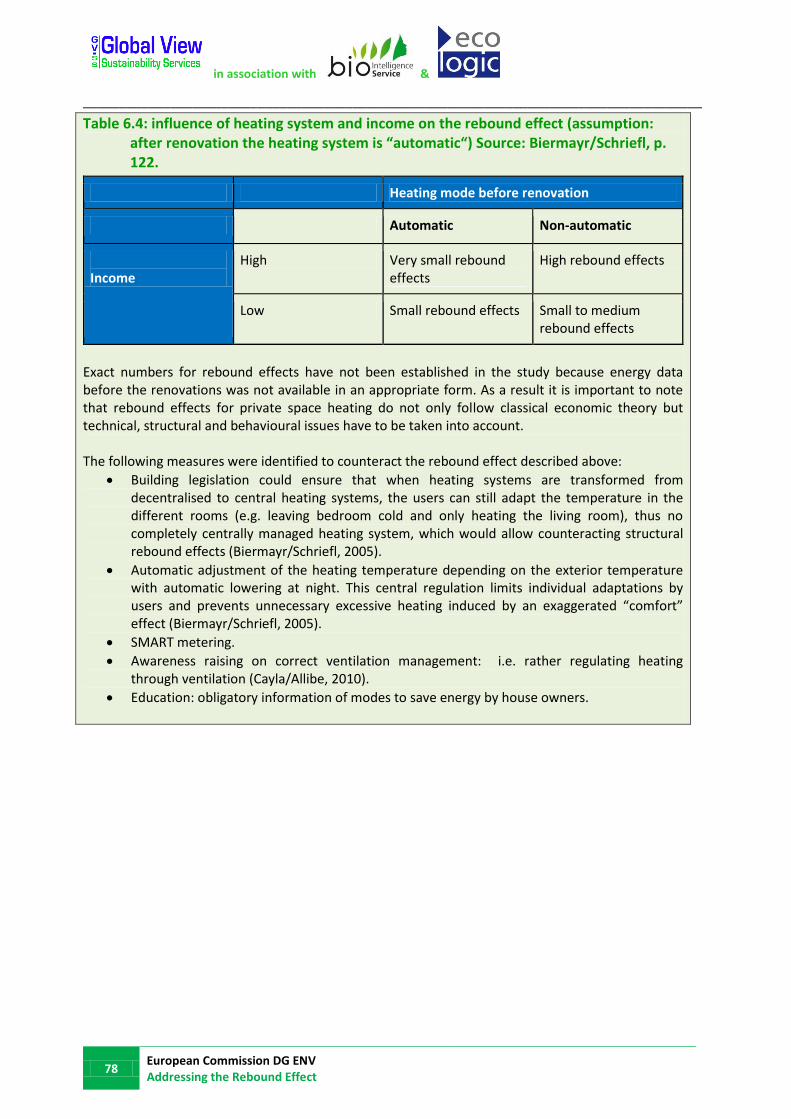
in association with &
_____________________________________________________________________________________
78 European Commission DG ENV Addressing the Rebound Effect
Table 6.4: influence of heating system and income on the rebound effect (assumption: after renovation the heating system is “automatic“) Source: Biermayr/Schriefl, p. 122.
Heating mode before renovation
Automatic Non-automatic
Income
High Very small rebound effects
High rebound effects
Low Small rebound effects Small to medium rebound effects
Exact numbers for rebound effects have not been established in the study because energy data before the renovations was not available in an appropriate form. As a result it is important to note that rebound effects for private space heating do not only follow classical economic theory but technical, structural and behavioural issues have to be taken into account. The following measures were identified to counteract the rebound effect described above:
Building legislation could ensure that when heating systems are transformed from decentralised to central heating systems, the users can still adapt the temperature in the different rooms (e.g. leaving bedroom cold and only heating the living room), thus no completely centrally managed heating system, which would allow counteracting structural rebound effects (Biermayr/Schriefl, 2005).
Automatic adjustment of the heating temperature depending on the exterior temperature with automatic lowering at night. This central regulation limits individual adaptations by users and prevents unnecessary excessive heating induced by an exaggerated “comfort” effect (Biermayr/Schriefl, 2005).
SMART metering.
Awareness raising on correct ventilation management: i.e. rather regulating heating through ventilation (Cayla/Allibe, 2010).
Education: obligatory information of modes to save energy by house owners.

in association with &
_____________________________________________________________________________________
European Commission DG ENV Addressing the Rebound Effect
79
6.7 NEW BUSINESS MODELS
Product Service Systems (PSS) / “servicising” business models have the potential to enable leap frogging
to less resource intensive ways of meeting customer needs, in particular due to the dematerialisation
savings on materials and energy they can provide. B2B remanufacturing / closed loop recycling examples
e.g. for multi functional scanners (Xerox), floor coverings (Interface FLOR) and tyres (Michelin fleet car
solutions) have shown significant resource savings (InterfaceFLOR, 2007; Interface, 2010; Michelin, 2009;
Xerox, 2009). While B2C examples are few, Patagonia polyester clothing recycling in the USA has been
successful at resource savings (Patagonia, 2010). For consumers, PSS can enable a shift to more
sustainable consumption patterns by providing a mechanism to consume differently that does not
necessarily require ownership of a good but focuses on using the service provided by the good.
No evidence has been found to show PSS counteracting a rebound effect. The following evidence shows
that even in a PSS model, rebound effects can still occur (UNEP, 2000).
A “servicising” shift could increase resource use if it involves a resource intensive infrastructure e.g.
telecommunications networks or requires extensive transport e.g. for internet shopping (Heikanen
and Jalas, 2003; Suh, 2006).
Shifts in developed countries to a more serviced based economy by outsourcing manufacturing
activities to developing countries can misleadingly indicate a reduction in environmental impact and
potential decoupling. However, if the embedded international supply chain impacts are included a
more realistic picture shows no change or an increase dependent on the energy sources and
production efficiencies available in the developing country (Barrett et al, 2008; Druckman and
Jackson, 2009).
However, even when well designed, it has been observed that some PSS changes can generate
unwanted rebound effects, in car sharing where customers (business and consumers) pay for the
mobility service of driving the car as they need it vs. owning cars individually. Even in this PSS, a
more fuel efficient and therefore cheaper to drive car can still be driven further on an individual
basis resulting in more kilometres driven and hence higher resource use (Krutwagen et al, 2001).
However, this is based on limited evidence and individual behaviour and does not take into account
evidence that shows GHG savings from overall miles reduced due to car PSS in comparison to
individual ownership as well as the awareness raising benefits (Mont, 2002). As an example for the
UK, this is estimated at 110403.31 tonnes CO2 saved/annum (Liftshare, 2010).
Given the significant resource opportunities already recognised for PSS, research to demonstrate how it
impacts the rebound effect would be a valuable next step for the evidence base.

in association with &
_____________________________________________________________________________________
80 European Commission DG ENV Addressing the Rebound Effect
7. CONCLUSIONS
7.1 KEY FINDINGS STATE OF THE ART ON REBOUND EFFECTS
7.1.1 DEFINITIONS, STATUS AND AWARENESS
The Rebound Effect is an increase in consumption which may occur as an unintended side-effect of the
introduction of policy, market and/or technology interventions aimed at environmental efficiency
improvements. The increase is caused by behavioural and /or other systemic responses to the
interventions, in particular where the efficiency gains bring reduced costs (Khazzoom, 1987; Musters,
1995; Alexander, 1997; Herring 1998; Saunders, 1992; Moezzi, 1998, J.S. Norgard, 1995; Schipper, 2000;
Gorham 2009; UKERC 2007). There are three main types of rebound effects recognised:-
Direct Rebound Effect - where increased efficiency and associated cost reduction for a
product/service results in its increased consumption because it is cheaper.
Indirect Rebound Effect – where savings from efficiency cost reductions enable more income to be
spent on other products and services.
Both direct and indirect rebound effects are microeconomic.
Economy wide Rebound Effect –where more efficiency drives economic productivity overall resulting in more economic growth and consumption at a macroeconomic level.
Taking energy efficiency as an example, the trigger for the rebound effect is the fall in the
effective/implicit price of energy (cost of energy to produce one unit of output) when efficiency is
increased, which then stimulates demand in energy production and consumption. Rebound effects are
relevant to both producers and consumers, hence both supply and demand side measures are needed to
address it.
While the rebound effect is generally associated with an unexpected increase in consumption due to an
increase in efficiency and the accompanying decrease in price, it can also occur due to changes in other
variables, e.g. time, space, technology and behaviour. A mental/psychological rebound effect can also be
defined as a feel good perception of being green that encourages increased consumption for certain
products where ‘green’ options are readily available.
The rebound effect is expressed as the percentage of potential savings “taken back” from the maximum
efficiency improvement. A “backfire” is a rebound effect of ≥ 100% where efficiency improvements are
completely negated.
The direct rebound effect associated with energy efficiency interventions is the most well investigated to
date. Outside of energy efficiency related examples, definitions of the rebound effect are used
inconsistently in the evidence and this is a source of confusion. Outside of specialist groups that focus on
rebound effects e.g. economists, awareness is limited. Official recognition in policy is also limited with UK
energy policy being the only example identified to date where the direct rebound effect in energy
in association with &
_____________________________________________________________________________________
European Commission DG ENV Addressing the Rebound Effect
81
efficiency interventions for domestic households is recognised and accounted for in estimating GHG
emission savings from energy policy interventions (DECC, 2010).
The evidence is clear that it is difficult to isolate the contribution to consumption increases that are
caused by rebound effects, as distinct from other factors driving consumption. This is a limiting feature
and improvements in the way the rebound effect is defined and measured are needed to resolve this.
The ideal would be to run a controlled economic experiment to isolate the rebound effect causes and
contributions to consumption for different products, services and interventions, but this is not feasible in
real life. Another factor is understanding and isolating the behaviours influencing consumption patterns
in business as well as for consumers. For example, depending on household income, expenditure reflects
firstly needs, then wants, and the rebound associated expenditure would follow the same pattern
(Druckman et al, 2010).
7.1.2 SIGNIFICANCE AND MAGNITUDE OF REBOUND EFFECT
The evidence and stakeholder views show that there is general agreement that the rebound effect exists
and can be significant in many cases but varies in size depending on the sector, product , service,
intervention (e.g. technology), location and timeframe (UKERC, 2007, van den Bergh, 2010; Sorrell, 2010;
Saunders, 2010). One of the reasons there is debate on the rebound effect is because it is hard to
measure and varies depending on the intervention (policy, technology, practice) as well as other factors
e.g. income level (Sorrell 2007). In particular, indirect and economy wide rebound effects are difficult to
define, measure and counteract. The question is not about whether rebound effects exist or not but to
what level of significance in what products & services, interventions and circumstances.
The magnitude of rebound effects are debated and based on a relatively small number of empirical
studies with modelling and data limitations. However from these, evidence based examples of the
rebound effect have been identified for energy efficiency in energy services (household and commercial),
household heating/cooling and appliances, lighting, private cars, commercial road transport and
buildings. Wider resource efficiency rebound effects have been measured for environmental
improvement opportunities for food. Water and energy related rebound effects have been identified for
water using equipment in houses, albeit these are not officially called rebound effects in the evidence.
Mental rebound effects have been identified for recycled paper and energy efficient light bulbs. The
detailed case examples for these are in 5.0. The key findings regarding the magnitude of the rebound
effects identified are summarised below including any limitations regarding the measurement.
General
Assertions that rebound effects are generally small (Lovins, 1998 & 2005; Schipper, 2000) are not
supported by the empirical evidence and those that claim it is greater than 100% -a backfire remain
insufficient to demonstrate its validity (Sorrell, 2010).

in association with &
_____________________________________________________________________________________
82 European Commission DG ENV Addressing the Rebound Effect
Direct Rebound Effects
For most household energy services in OECD countries, direct rebound effects for energy efficiency
for heating/ cooling , cars and other energy services are estimated in the range 10- 30% (Greening
et al, 2000; Schipper and Grubb, 2000; UKERC, 2007; Sorrell, 2007; Small and van Dender, 2007).
This may decline in future as demand saturates and income increases and the effect may be larger
for low income groups, households in developing countries and for producers (Sorrell, 2007).
Limitations in this measurement are that the effects have only been studied over limited time
periods and it is anticipated that not all the effects may have been incorporated (Sorrell and
Dimitripoulos, 2007). Key EU based estimates include:-
o 20-30% Austrian space heating (Haas et al, 2000) ;
o 15-27% Netherlands space heating (Berkhout et al, 2000);
o 15% for personal transport, household heating, and other household services in the UK (Sorrell
et al, 2009).
Direct rebound effects from energy efficiency in lighting is estimated at 5-12% in developed countries
for private households and 0-2% for industry and commerce (IEA, 2005).
For commercial road transport, the direct rebound effect of fuel efficiency is 30 - 80 % (Gately 1990,
Graham & Glaister 2002, Anson & Turner 2009). This is because fuel efficiency lowers the cost for
freight transport, making cost efficient transportation possible for more goods, over longer distances
and more frequently.
Increasing the data rate of mobile communications technology can lead to increased energy
consumption, despite the higher energy efficiency of the faster technology. As such, this could be
considered an example of backfire, although the intention of increasing the data rate was not to
improve the technology’s environmental performance, but instead to increase the quality of service
to consumers (Emmenegger et al, 2004).
Various options for reducing the environmental impact of meat and dairy consumption will tend to
increase the cost of producing and consuming such products. The EU (IMPRO) (meat & diary) study
estimated the rebound effects for this and found that price increases play an important role in
mitigating rebound effects. It estimated rebound effects can range from -10% (small price increase) to
more than -100% (large price increase) depending on how significant the increase in costs is
(Wiedema et al, 2008). As such, the rebound effect for such measures is negative, meaning a greater
environmental benefit is achieved.
Evidence for energy efficiency improvements in industry show a direct rebound effect estimate of
15% in the UK (4CMR, 2006). A draft USA study shows rebound effects from energy efficiency
improvements in 30 industry sectors over the long term as 20-60% based on 1980-1995 data and
being highest in energy intensive sectors e.g. utilities, chemicals and agriculture (Saunders, 2010). The
main reason for this is that energy efficiency provides cost reductions, enabling more production to
take place over time which consequently uses more energy. The energy intensive sectors have the
largest rebound effects because energy costs are a significant factor of production, which is also easily
substituted for other factors of production enabling productivity to increase overall.

in association with &
_____________________________________________________________________________________
European Commission DG ENV Addressing the Rebound Effect
83
It is inappropriate to generalise direct rebound effect estimates to all types of rebound effect from
all types of energy efficiency improvement, or indeed to other resource categories e.g. water. This
is because the factors influencing the rebound effect will vary (UKERC, 2007, Sorrell, 2007, Sorrell,
2010). The magnitude of rebound effects associated with resource interventions beyond energy is a
gap in the evidence at present and simply reflects the status of rebound effect research which to
date has focused in the main on energy efficiency.
For developing countries the direct rebound effect is expected to be larger due to increased price
elasticity (i.e. more sensitive to price changes) in comparison to developed countries. In developing
countries the cost of energy is large compared to total costs or income and accounts for a greater
amount of available expenditure. Unmet demand for energy services is also expected to make
rebound higher in developing countries (Roy, 2000).
Influencing factors on the magnitude of the rebound effect include:-
o Sectors, product and services where the energy/total cost ratio and production factor
energy is large (e.g. industrial processes and transport/logistics) show higher energy
efficiency related direct rebound effects. This is because in these cases energy costs are a
significant factor of production which can be easily substituted for other factors. When
prices drop e.g. through efficiencies, more production is enabled and hence more energy
used overall.
○ Technology type – Evidence has shown that rebound effects are stronger for so called
“General Purpose Technologies” compared to others. These are defined as being applicable
across a broad range of uses, products and processes. Examples are lighting, motor vehicles
and computers. Rebound effects are higher because they permeate the economy once a
threshold efficiency of operation is realised and contribute to consumption growth and
economy wide rebound (Lipsey et al, 2005; Sorrell, 2007; van den Bergh, 2010).
Indirect and Economy wide rebound effects
Estimates of indirect and economy wide rebound are only available for energy efficiency
improvements, and are limited due to few published studies and have weaknesses in the
measurement approach (Sorrell, 2007; Allan et al, 2006; Barker, 2005). Based on these, the economy
wide rebound effects for energy efficiency improvements are estimated to be smaller than direct
rebound effects at approximately 10%, although some cases show > 30% and some show backfire
(Sorrell, 2007; Barker, 2005; Turner, 2010). Scotland is an example where energy efficiency
improvements of 5 % in the production sectors of the Scottish economy shows backfire over the
long term in most of these sectors (Hanley, et al, 2009; Turner, 2010). The Scottish case shows
backfire only tends to occur where there is increased energy efficiency in a highly energy intensive
supply sector, particularly where trade and competitiveness are important as these influence
economy wide rebound effects (Turner et al, 2009). The available studies are for energy efficiency
improvements by producers only and show the economy wide rebound effect varies with the sector
that the energy efficiency improvement occurs in. Measuring rebound in particular beyond direct
rebound effects is difficult due to the range of influencing factors. However, many experts agree that
current magnitudes are underestimating the real effects because many of the influencing factors are

in association with &
_____________________________________________________________________________________
84 European Commission DG ENV Addressing the Rebound Effect
not taken into account in current measurement approaches (Polimenti, 2008; Sorrel, 2007 & 2009).
For example, the economy wide study rebound effect estimates do not take into account the
amplifying effect improvements in capital, labour or materials are expected to have in practice
because they enable increased production and ultimately increased energy use (Saunders, 2000;
Worrell et al, 2003).
Only one global model analysis has been conducted and estimates energy efficiencies for transport,
building and industry over 2013-2030 having a global rebound effect >50% (Barker et al, 2009). This
study uses a sectoral macroeconomic model for the global economy which has been designed to
assess options for climate and energy policy and to allow for energy-environment-economy
interactions. The model is highly disaggregated, including many different energy carriers, users and
technologies, as well as production sectors and world regions. Each sector in each region is assumed
to follow a different pattern of behaviour within an overall theoretical structure. In order to estimate
the rebound effect, scenarios with and without energy efficiency policies are compared. Importantly,
this it is not an equilibrium model. It is a promising macroeconomic approach which warrants further
research given only one global analysis has been conducted.
Macroeconomic rebound effects (combining indirect and economy-wide effects) of 50% and greater
have been identified in some studies using both Computable General Equilibrium (CGE) models and
macro-econometric modelling techniques. Broadly speaking, macro-econometric modelling
approaches are understood to give more robust results than CGE approaches. That said, both of
these approaches are subject to the limitations inherent to such modelling (i.e. model, data, and
assumption uncertainties). While this uncertainty casts some doubt on the results of such models,
the magnitude of the potential rebound effect suggests that the uncertainty should not be grounds
for rejecting the results outright. In other words, while the models cannot tell us if the rebound
effect is 50% or 55%, these very different approaches agree that it is not merely 5%, nor is it 150%.
7.1.3 MEASURING REBOUND EFFECT AND LIMITATIONS
Measuring direct rebound effects is generally done by calculating the own-price elasticity of the product.
Indirect and economy-wide rebound can only be calculated by using models which can compare
environmental impact under multiple scenarios, with and without a particular policy intervention, and
across different product categories/sectors. Such models are necessarily a simplification of reality and
their results depend greatly on the quality of the information used as inputs. As such, while it will be
useful to identify a standard definition for the various types of rebound and a metric for calculating it
(with recent UK research showing a promising macroeconomic approach (Barker et al, 2009)), it is also
important to ensure that appropriate data is collected throughout the economy. This is particularly true
for non-energy resources as most modelling and data collection to date has focused on energy efficiency
and energy use.
Obtaining accurate data, especially time series data, for household expenditures before and after policy
interventions will help in accurately measuring the rebound effect as well as evaluating the policies
under question. While researchers are continuing to improve modelling techniques, policy makers can
explore opportunities to integrate data collection requirements into new policies.

in association with &
_____________________________________________________________________________________
European Commission DG ENV Addressing the Rebound Effect
85
In addition to improving the accuracy of measurements and modelling approaches, it is important to
recognise the inherent limitations of these approaches. As such, a “living with uncertainty” approach can
be advised, wherein the goal is not necessarily to develop the most accurate calculations possible, but to
make the best possible decisions with the available information. This uncertainty can be characterised
and bounded, to some extent, by better identifying the underlying processes generating data and by
combining the results of different modelling approaches.
7.1.4 IMPLICATIONS FOR POLICY
The evidence is clear that the existence of the rebound effect does not mean efficiency based policy is
not an important instrument for environmental improvement. However, it does mean that:-
Understanding the significance of the take back in anticipated environmental savings is important;
Efficiency alone is not likely to meet the required improvement targets and that these considerations
are incorporated in developing interventions and allowing for measures to counteract to be
implemented where this is feasible. The recommended measures are outlined in 7.2.
7.2 GUIDELINE RECOMMENDATIONS FOR TACKLING REBOUND EFFECTS
Measures that account for, or can play a role in theory, in counteracting the rebound effect based on
evidence were investigated and are detailed in 6.0 with illustrative case examples. It is noted that the
measures for counteracting the rebound effect that are evidence based are theory and have not been
tested in practice, with results that show how they reduce, or not, the rebound effect. This is an
indication of the status of the rebound effect topic which, to date, has largely focused on modelling and
estimating the significance of the rebound effect vs. tackling it.
This section summarises the recommended evidence based measures the Commission can take going
forward to account for and counteract rebound effects in the short and long term. Where measures for
direct, indirect and economy wide rebound effects vary these are taken separately where feasible. Case
examples are used to illustrate how the measures can work in practice. Because examples illustrating
the results of these measures in an SCP context are very limited, examples where these measures have
been used from outside the SCP arena e.g. to reduce smoking and traffic congestion are also used to
illustrate how they could work in practice. For each recommended measure the following criteria are
considered:-
Evidence based measure(s) the Commission can take going forward;
Type of REs addressed (Direct, Indirect, Economy wide)
Scenario/Circumstances measure(s) will work in
Results where the measure has been successful already (where available)
Actors required (Commission and other stakeholders)
Barriers and Enablers.

in association with &
_____________________________________________________________________________________
86 European Commission DG ENV Addressing the Rebound Effect
Key recommendations are categorised under the following headings:-
1. Recognising and Accounting for Rebound Effects in Policy design and evaluation
2. R&D gaps to fill
3. Tackling Rebound Effects using mixed instruments (fiscal, technology and behavioural)
4. Tackling Indirect & Economy wide Rebound Effects.
Many of the recommendations are suited to include in the Resource Efficiency Roadmap 2020 the Commission are developing. Practical policy measures which can be taken as well as research gaps that need to be filled in the medium to long term are proposed. A pilot to trial the most promising recommendations is suggested as a valuable next step in order to increase engagement with policy makers on this topic and action to address rebound effects.
7.2.1 RECOGNISING AND ACCOUNTING FOR REBOUND EFFECTS IN POLICY DESIGN
& EVALUATION
In future, the design and evaluation of environmental policy instruments (mandatory and voluntary), as
well as ex ante ex post policy evaluation, should recognise and account for rebound effects where they
occur. For direct rebound effects from energy efficiency interventions, there is clear evidence to do this
for energy services (commercial and household), transport (personal and commercial), household space
heating/cooling, appliances and lighting. Recognition and accounting for rebound effect take back in
projected environmental savings expected to be achieved through interventions means efficiency targets
may have to be proportionately larger to allow for rebound. Therefore, deducting rebound take back
savings for the specific intervention will provide a more accurate baseline for setting impact saving
targets. Raised targets (e.g. higher energy efficiency standards) would have the advantage not only to
build into the measure the level of expected direct rebound effects, which can be calculated prior to the
introduction of the measure, but also some elements of indirect rebound effects too. This approach is
not designed to be adopted ‘instead of tackling rebound effects’ but recognises that even when
scrupulous analysis and targeted actions take place, unforeseen consumer behaviour could always lead
to greater rebound effects and consumption. Hence, environmental policies would justifiably benefit
from raising the bar in anticipation of this.
A policy tool box for the Commission (ideally web based) encompassing: clear rebound effect definitions;
recognition of those rebound effects to incorporate in policies; models to support more sophisticated
measurement/evaluation of rebound effects and mitigating measures in the design and performance of
policy interventions is needed. The UK Dept for Energy and Climate Change (DECC) which already
accounts for direct rebound effects where they occur using the Valuation of energy use and GHG
emissions for appraisal & evaluation Guidance & Tool (DECC, 2010), provides a Member State example
and developing policy toolbox to build on. To date, this has focused on the 15% direct rebound effects
from energy efficiency interventions for household insulation. Going forward, recognising rebound
effects from wider energy efficiency interventions in relevant EU SCP policies are important next steps.
Based on the current energy efficiency rebound effect evidence this would include policies impacting
energy services, transport, buildings, appliances, lighting and heating/cooling. The new Implementing
Measures in the Ecodesign of Energy Related Products (ERP17) recast directive, is just one important
17 Directive 2005/32/EC establishing a framework for setting ecodesign requirements for Energy Using Products (EuP) and amending Council
Directives 92/42/EEC, 95/57/EC and 2000/32/EC

in association with &
_____________________________________________________________________________________
European Commission DG ENV Addressing the Rebound Effect
87
example as it covers heating/cooling, appliances and lighting. Overall, recognising rebound effects in
these policies will at least ensure the efficiency targets set in these have a greater chance of being
realised, rather than falling short due to rebound effects as well as other consumption driving factors.
At present, there is a debate on the significance of rebound effects in environmental policy. This research
project clarifies the evidence based facts, with a view to overcoming current misconceptions. With this in
mind, a FAQ on Rebound Effects is included in Annex F. This can be part of the policy toolbox for
generating awareness amongst policy makers in environment, economics and other cross cutting policy
departments on the facts such that the current debate can move towards action to address rebound
effects where relevant.
In future, criteria to anticipate and evaluate rebound effects can be included in the design of
interventions and evaluation approaches. For example this could be included in EU Regulatory Impact
Assessment (RIA) guidelines. On a general basis this could encompass a cross cutting approach for
anticipating rebound effects in all policies – particularly for Economy wide and indirect rebound effects.
On a more specific level, the products, services, sectors where direct rebound effects occur based on
existing evidence can be evaluated to determine the take back savings and effectiveness of likely
mitigation measures. The evaluation criteria should include factors that influence rebound effects e.g.
price, income, country, time span of intervention, technology, production sector (e.g. is it highly energy
intensive), consumer or producer targeted. Some key considerations for these criteria are outlined
below. As a short term measure, a pilot in a selection of Member States could be conducted by the
Commission and Member State policy representatives to illustrate how the assessment of rebound
effects in the design of policy interventions can be done in practice. This could build on the UK example
for direct rebound effects and would help to increase awareness in policy makers on the facts regarding
rebound effects and how to address them in policy.
POLICY DESIGN & EVALUATION REBOUND EFFECT ASSESSMENT CRITERIA
Price, Income and Expenditure: For price induced direct and indirect rebound effects for energy
efficiency, measures that offset the decrease in the effective price of energy that triggers rebound
will counteract it. In policy development, measures need to consider the economic response to
changes in price, income and expenditure associated with efficiency improvements for and decide
how to address them (Turner, 2010). This will vary for business vs. consumers.
Substitution: Because the ability to substitute a cheaper factor of production (e.g. energy for
another such as capital, labour, materials or time) impacts the magnitude of the rebound effect,
consideration of this is a key criterion for assessing the likely significance of rebound effects from an
intervention.
Production sector: For energy efficiency rebound effects, sectors, products or services where
production factor energy is high e.g. industry processes or transport show higher direct rebound
effects.
Welfare: Ideally, measures should not adversely impact the increase in economic welfare associated
with the energy efficiency gains that produce the rebound effect in the first place. The ideal solution
is to find ways to restrain energy consumption without reducing economic welfare. If these are not
available, and insufficient clean, cheap, abundant energy supplies are not forthcoming, two ways to
dampen rebound effects in the short term are to raise the price of energy such that the effective

in association with &
_____________________________________________________________________________________
88 European Commission DG ENV Addressing the Rebound Effect
price does not change and to ration energy supply (e.g. Carbon taxes, Cap and Trade schemes,
technology that can control usage e.g. SMART meter)s. These can reduce consumption but also have
limitations. In particular, these can impact economic activity with the associated political and social
ramifications (Turner, 2010; Saunders, 2010; Jenkins, 2010).
Time: The variation in rebound effects over time should be considered in light of the timeline for
proposed interventions (Irrek, 2010). For example, in the long term price elasticity is higher as the
ability of consumers to respond to price changes is greater.
Technology: The type of technology and the extent it is used across the economy needs to be taken
into account. This is because greater rebound effects are seen in so called “General Purpose
Technologies” that are applicable across a range of uses e.g. lighting, computers or vehicles, and
hence permeate widely across the economy once a threshold of operating efficiency is reached. In
this context, they contribute to consumption growth and economy wide rebound effects (Lipsey et
al, 2005; Sorrell, 2007; van den Bergh, 2010) which should be assessed and accounted for.
Perverse Outcomes/Burden Shifting: For non energy efficiency related rebound effects in SCP
policies e.g. water and waste, official identification of rebound effects is very limited, and are more
likely to be considered as perverse outcomes at present. For example, evidence was found for water
efficiency policies that drive low flow and recycling technologies, having a direct rebound effect
through reversion (but not officially called it) due to dissatisfaction with the low flow technology by
the user (also seen in the lighting sector and officially recognised as rebound). Further increased
energy use/GHG emissions due to use of water pumps to improve the low flow water technologies
was identified as burden shift from water efficiency policies. These examples are detailed in 6.0 . By
anticipating these likely direct rebound effects, currently seen as perverse outcomes/burden shifting,
more realistic efficiency targets for water policies could be set in the short term.
Further recommendations for data and modelling development that are current R&D gaps but important
for supporting the proposed policy toolbox in the medium to long term are outlined in 7.2.2.
7.2.2 R&D GAPS
The following improvements to measurement & data, to support policy evaluation and addressing
rebound effects, were identified as key R&D gaps to fill going forward. The research arena on rebound
effects has a good baseline that can be built on to fill these gaps.
Data and Models to enable better understanding of rebound effects and mitigating measures
Overall areas requiring development include:-
Economy wide rebound effects associated with energy efficiency interventions impacting the
industrial and household parts of the EU economy.
Constraining factors on economy wide rebound effects, their implications over time and inter
economy factors e.g. trade and competition relevant to products and services in global markets.
Quantifying the magnitude of rebound effects for resource policies e.g. water, waste and precious
minerals/ metals – Direct, Indirect , Economy wide. There is hardly any evidence available in this

in association with &
_____________________________________________________________________________________
European Commission DG ENV Addressing the Rebound Effect
89
area as energy efficiency related rebound effects have been the main focus of research to date. For
water policy, the examples of potential rebound effects from water efficiency interventions for low
flow water and recycling technologies should be investigated further to clarify the effect and its
magnitude.
For modelling, advances in computer hardware and software are allowing for the creation of ever
more complex models, resulting in more accurate and realistic results to be produced. However,
many of the fundamental assumptions of the models have not yet been resolved, and different
schools of modelling exist. While non-equilibrium modelling techniques (e.g. Barker, 2009) are
beginning to show promising advantages over more traditional approaches, they remain a new field.
To date, computable general equilibrium (CGE) models remain the dominant tool used to analyse
rebound effects, despite their theoretical limitations.
Shifting to LCA that incorporates shifts in demand (consequential LCA) vs. the constant demand
assumption currently used (attributional LCA), as well as combining LCA with econometric models
can better simulate consumption changes.
Further research into the most appropriate modelling approach and the development of such
models will bear considerable fruit in improving rebound predictions, but likely only in the medium-
term. In particular, given the promise of emerging techniques such as non-equilibrium modelling, it is
recommended that further research be conducted in such fields in order to move past the limitations
of existing CGE models.
Data Improvements include:-
As the modelling and estimation of rebound effects is based on empirical data, the quality and
availability of that data is fundamental to accurately measuring rebound and creating targeted
measures to counteract it. Areas requiring an increased focus in the R&D agenda are improving the
collection of economic data; improving the collection of resource data; and improving the
performance of modelling.
In terms of economic data, it is particularly important to obtain accurate household and business
expenditure data. Much of this data is already being collected in Member State household and
business expenditure surveys, so efforts to coordinate and consolidate that data could be particularly
productive, in particular to gain better data on indirect rebound effects.
In terms of resource data, while the availability and accuracy of energy data is often quite good, data
on other resources, especially mass flows and NAMEA18 data is weak. In order to extend estimates of
the impact of the rebound effect beyond energy to wider environmental impacts, these
improvements will need to be made. While this is a large task, it will not only benefit research into
rebound, but also related SCP policy-making. As such, it can be integrated into broader
environmental data collection efforts within the SCP agenda and Resource Roadmap.
18 National Accounting Matrices with Environmental Accounts

in association with &
_____________________________________________________________________________________
90 European Commission DG ENV Addressing the Rebound Effect
New Business Models
While Product Service Systems (PSS) have already demonstrated their role in enabling resource
savings, in particular through dematerialisation (Mont, 2006; Michelin, 2009; Xerox, 2009, Patagonia,
2010; InterfaceFLOR, 2010), there were no clear evidence examples that had measured rebound
effects in PSS to demonstrate the role they play in this context. A research project to measure the
consumption reduction potential of PSS and shifts to service focused economies would provide
evidence to clarify their potential in mitigating rebound effects.
7.2.3 TACKLING REBOUND EFFECTS USING MIXED INSTRUMENTS (FISCAL,
BEHAVIOUR & TECHNOLOGY)
In addition to the efficiency policy interventions already used for resources - physical, time, price and
behavioural constraints are needed. This is the rationale for using mixed instruments combining fiscal,
technology and behaviour change that incentivise efficiency while limiting rebound effects. These
measures are relevant to constraining direct, indirect and economy wide rebound effects. Where
differences in approach for these different types of rebound effects are required and clear in the
evidence, they are noted. In particular 7.2.4 separates fiscal and behavioural measures specifically
relevant for indirect and economy wide rebound effects. The overall approach proposed for using
mixed instruments is outlined below with examples. The specific measures for fiscal and behavioural
measures are outlined in 7.2.3.1 and 7.2.3.2.
Technology interventions e.g. energy efficient lighting, incremental technology shifts from
incandescent to CFL and LEDs (expected to be mainstream by 2030) provide leapfrog reductions in
energy consumption per unit. However, demand for lighting shows no sign of reduction in the
developed world. For example, demand continues to increase for lighting in the home, workplace
and infrastructure e.g. roads, in particular to enable increased productivity at night and to light
outdoor areas. Hence, these technology interventions still need to be combined with behavioural
interventions e.g. SMART technology light controls, awareness raising to leverage behaviour change,
as well as higher energy prices to set the physical limits to demand in order to tackle rebound (Tsao
et al. 2010). These are measures in the short to medium term that can tackle direct rebound effects.
In the bigger picture in the long term, for energy efficiency associated rebound effects a key
technology solution is energy supply alternatives that are clean, cheap and abundant. Therefore,
promotion of clean technology is a key mitigating measure in reducing the environmental
consequences of rebound effects.
For consumers and business, prices that accurately reflect the environmental impacts of the
production and consumption of goods and services are needed, through the introduction of
instruments capable of generating the appropriate price signals, such as taxes or Cap & Trade. In this
respect, Cap & Trade schemes are an appropriate option, as they provide a cost effective ceiling on
GHG emissions (van den Bergh, 2010). This is because cap and trade schemes provide certainty on
the environmental improvement target required (cap) and leads to increases in the price of the
traded commodity (provided the cap has been set at a sufficiently low level), e.g. raising the cost of
energy use/unit in the case of markets for GHG emissions. Further, the carbon/energy pricing needs

in association with &
_____________________________________________________________________________________
European Commission DG ENV Addressing the Rebound Effect
91
to increase at a rate which accommodates income growth and rebound effects just to prevent GHG
emissions rising and faster to reduce them (Sorrell, 2007).
Fiscal measures, in particular where they are uniformly applied across sectors, can be too indirect to
be effective and lead to unnecessary costs. For example, a blanket energy tax across different sectors
will have different impacts as the price elasticities of demand will vary across sectors. For energy
efficiency-related direct rebound effects, it would be better to focus directly on the energy use
where the price change occurs (e.g. stopping the fall in the effective/implicit price of energy (cost of
energy to produce one unit of output) when efficiency is increased by raising the price). Mixed
instruments which include targeted sectoral fiscal incentives — where the revenues generated can
be used to bring technologies to market — combined with awareness raising to leverage behaviour
change in producers and consumers regarding their price and income responses to efficiencies are
recommended. For example, this would encompass increased carbon/energy prices targeted where
rebound effects are highest, using the revenues to fund technology shifts that reduce the carbon
intensity of the energy supply, combined with behavioural interventions — such as awareness raising
and SMART metering — to constrain growth in demand. A sectoral approach targeting the differing
influencing factors and consumer/market responses driving the direct rebound effects and economy
wide respectively are required. However, these will come at a higher administrative cost (compared
to economy wide price incentives for example) and require a minimum knowledge of the sectors
considered, e.g. production technologies and/or household behaviours in order to fine tune the
design of the instruments.
In theory, internalising all relevant environmental externality costs by pricing measures would
dampen rebound effects. For example, taxing air travel on the basis of negative environmental
externalities generated, e.g. climate change, air pollution and noise, would limit the demand for air
travel and associated impacts. Doing so should help to limit the impact of direct and indirect rebound
effects in the short to medium term, though it will not make them entirely irrelevant. However, the
political and social acceptability of this approach are barriers at present. Stakeholder views show
that internalising all environmental externalities at present is unlikely to happen in practice as the
methods to value and cost these within our economic systems is still at an early stage. Further
political will to raise the cost of critical resources and natural capital e.g. energy is limited. Hence, a
more practical goal for now would be not to focus on internalising all externalities, but rather
internalising as many as possible.
For taxes to drive environmental improvements, a key issue is where that tax revenue is spent. If it is
invested in growth generation (e.g. increasing GDP) it is likely to increase demand and hence
rebound effects. It would need to be invested in clean energy sources or other natural capital
enhancement to prevent this (Jenkins, 2010; Druckman, 2010).
For leveraging behaviour change to address rebound effects directly, effective awareness raising and
education for both producers and consumers plays an important role in the short to medium term. In
the long term, rebound effects provide a strong rationale for broader shifts to fundamentally more
sustainable consumption and production patterns.

in association with &
_____________________________________________________________________________________
92 European Commission DG ENV Addressing the Rebound Effect
7.2.3.1 Fiscal Measures
Most fiscal measures are based on the premise that raising the cost of consuming a resource will reduce
its overall consumption. This effect is what economists call price-elasticity of demand, which is
recognised to be negative (i.e. reduction in demand following price rise for a specific product) for a wide
range of goods and services. Negative price-elasticity is what underpins the rebound effect. In the case of
energy, energy efficiency improvements lead to a decrease in the unit price of the service provided and,
as a result, an increase in demand. As seen in the EU IMPRO Meat & Dairy study example in 6.0,
measures that raise the cost of production and consumption can reduce overall consumption, thereby
leading to environmental impacts being avoided.
There are numerous measures that can be used to modify the price of producing and consuming goods
and services. The most direct ones are fiscal measures. When aiming to control the rebound effect, these
measures have certain advantages and disadvantages. These are outlined below for three likely
measures: taxes, bonus-malus schemes, and consumption caps19. Examples where they are used already,
key socio economic, resource related (e.g. what suits water vs. energy), implementation as well as key
informational approaches are considered. The key actors in the development and implementation of
fiscal measures are the Commission, Member States and regional authorities depending on the type of
resource considered, the level of taxation etc. and will require the input and engagement of a wide
range of stakeholders. A barrier with fiscal measures is that they can be distortive and hard to design
optimally, so further investigation using a trial would be a practical next step.
FISCAL MEASURE 1: TAXES
Range of application and examples
As an instrument to control consumption, taxes are perhaps the most basic and the most well
understood fiscal measure available to policy makers. Taxes have been used to control the use of various
resources, the emission of pollutants, or behaviours deemed undesirable. As an example, the UK Climate
Change Levy taxes energy delivered to non-domestic users with the intention of reducing emissions of
greenhouse gases. In other cases, taxes have been instituted with the intention of raising revenue, but
have the additional effect of reducing consumption. Widely-seen examples include fuel taxes and
cigarette taxes.
Resource considerations
The effectiveness of a tax to control rebound can vary depending on the resource which is being
consumed. In the case of energy, the price is already very highly regulated in many jurisdictions. Further,
for many businesses, energy may represent a relatively small portion of their overall costs, making them
less exposed to any change in the price. Also, one energy carrier may be used for several end uses (e.g.
electricity may be used for heating and lighting), each of which will likely have a different price-elasticity
of demand and, therefore, level of rebound. As such, setting a tax to control rebound for energy in
general, or even a specific energy carrier (e.g. electricity, gas, etc.) will inevitably be less cost-efficient.
19 Strictly speaking, a consumption cap is not a fiscal measure, but a policy measure. However, given that it has fiscal implications, it is treated in
this section as well. This list is not meant to be exhaustive, other fiscal measures could include subsidies or tax credits. That said, such measures
are not likely to be the most effective approach to mitigating rebound.

in association with &
_____________________________________________________________________________________
European Commission DG ENV Addressing the Rebound Effect
93
As the general trend continues towards renewable and “decarbonised” forms of energy, the
environmental benefit realised by increasing the price of energy will decrease in relative terms. However,
avoided impacts may continue to increase in absolute terms. Water, unlike energy, is a local resource
that cannot be easily transported over wide distances. This leads to highly variable water prices across
MS and regions, depending on local availability and demand conditions. This specific feature has to be
taken into account when designing policy schemes to mitigate potential rebound effects. For example,
agricultural areas in relatively arid environments will likely see much higher unit prices for water and will
likely be much more sensitive to price changes. Additionally, like energy, water has many different
applications (e.g. domestic use, industrial processes, agriculture), each of which will likely be subject to
different levels of rebound and will need as a consequence different mitigating measures.
Socio-economic considerations
As lower-income households spend a greater percentage of their revenues on basic necessities (e.g.
housing, clothing, food, etc.) while wealthier households tend to devote a larger share of their income to
savings and luxuries, taxes aiming to reduce the consumption of basic resources like energy or water
could adversely affect the ability of lower-income households to meet their needs. While the rebound
effect may be more pronounced in lower-income households as they may have been “under-consuming”
certain resources relative to their wealthier counterparts, policy-makers should be careful so as to
ensure the fairness of any tax implemented. This could be accomplished, for example, by having variable
tax rates for different income or consumption levels, though this would come with the cost of increased
complexity.
Considerations for implementation
Given that the implementation of a new tax would create a new source of revenue for the government, a
key consideration is the use of that revenue. In fact, this revenue, depending on how it is used, could
lead to increased rebound. Take, as an example, an energy tax that is implemented so as to reduce the
rebound which has followed several energy efficiency programs. While the tax may help to control any
increase in the consumption of energy, if the government spends it on new infrastructure projects
(which come with an environmental cost) or redistribute it back to the population so as to increase
consumption, there is a risk that what would have been a direct rebound effect is simply converted into
an indirect or economy-wide rebound. While this may have the effect of effectively hiding the rebound
(due to the analytical difficulties of observing and quantifying indirect and economy-wide rebound), the
environmental benefit would be reduced regardless.
Directing the revenues of any such tax towards the research, development, and demonstration of
technologies that help to decouple consumption from environmental impacts is a particularly promising
approach. It would have the dual benefit of helping to control rebound immediately through the
application of the tax, while also contributing to the development of technologies which help to
minimise the impact of economic activity – caused by rebound or not – in the long run.

in association with &
_____________________________________________________________________________________
94 European Commission DG ENV Addressing the Rebound Effect
FISCAL MEASURE 2: BONUS-MALUS SCHEMES
Range of application and examples
While a tax provides a clear disincentive of increasing consumption by increasing its cost, a bonus-malus
scheme could prove more flexible and potentially more effective given that it allows for the possibility of
incentives (through subsidies or reduced costs) and disincentives (through penalties or increased costs).
To date, bonus-malus schemes have generally been used to incentivise the purchase of energy efficient
products. For example, the French bonus-malus scheme incentivising the purchase of fuel-efficient
vehicles proved quite successful. As it did not seek to limit total distance travelled, however, it did see
rebound effects as drivers compensated for their more efficient (and more modern) vehicles by driving
more. As such, if a bonus-malus scheme is used to mitigate the rebound effect, it should focus on
incentivising reduced consumption.
As an example, a household that has just undergone a thermal efficiency retrofit could be enrolled in a
bonus-malus scheme whereby the rate that they pay per unit of energy (kWh or m3 of gas) varies based
on their overall consumption. In contrast to conventional “bulk purchasing” schemes where the unit
price decreases as the total quantity purchased increases, under the bonus-malus scheme the unit price
of energy would be lowest when the total energy consumed is lowest as well. As such, the household
would be incentivised to take full advantage of their efficiency retrofit and limit their overall
consumption. Such a scheme would see the cost of consumption increase exponentially as the total
quantity of the resource is consumed. This is similar to pricing schemes for water in arid climates where
the amount deemed essential for a normal life is very inexpensive, but quantities beyond that increase in
price very quickly.
Socio-economic considerations
The bonus-malus scheme has the advantage of not merely penalising consumption, but also providing
consumers with the opportunity to realise considerable savings by reducing their overall consumption.
As such, there is a greater degree of autonomy at the household or business level with regard to the
price paid for a resource. Compared to a tax, which could be perceived as rigid and/or punitive, this may
allow for a bonus-malus scheme to be more easily accepted.
Considerations for implementation
If a bonus-malus scheme is applied to a utility such as energy or water, close collaboration with the utility
provider will be necessary to define a pricing model that is workable with the utility. Additionally, as
consumption of utilities is often measured and billed infrequently (often quarterly, sometimes annually),
a more detailed system of measurement would likely be required. The installation and use of SMART
meters would have clear advantages in this case. Such meters would give utilities a far more detailed
picture of individual consumption and would provide consumers with the ability to frequently calibrate
their energy consumption so as to ensure that they could take full advantage of the bonus-malus
scheme, achieving their consumption target and paying the rate that they desired.
Bonus-malus schemes are often designed to be revenue-neutral. That is, the revenue generated through
the malus is used to fund the bonus. That said, this approach is not required of the scheme, though it
may make it more politically acceptable to the populace.

in association with &
_____________________________________________________________________________________
European Commission DG ENV Addressing the Rebound Effect
95
FISCAL MEASURE 3: CONSUMPTION CAPS
Range of application and examples
Whereas taxes and bonus-malus schemes seek to influence the level of consumption by modifying the
price of goods and services, consumption caps directly set a firm limit on the level of consumption,
allowing prices to adjust accordingly. The theoretical advantage of such caps is that, while the price of
consuming a particular resource may be uncertain, the level of consumption is certain. As it is generally
the quantity of a resource consumed which determines the severity of the environmental impact, by
directly controlling the quantity consumed, policy makers thus have more direct control over
environmental impacts.
As a means of controlling rebound, a cap is an attractive option as it foregoes the uncertainty of
determining an appropriate price to achieve a certain level of consumption, targeting the consumption
itself. As such, even if the efficiency of consumption increases, there is a strict limit on overall
consumption acting as a “fail-safe” to preclude excessive consumption. As such, the benefits of the
efficiency increase could theoretically be maximised. The EU Emissions Trading Scheme (EU ETS) is a
widely known example of such a cap.20
Resource considerations
In applying consumption caps, the principle challenge is defining a level for the cap that meets
environmental objectives while not presenting an excessive burden on the economy. In the case of
emissions trading schemes, the level of the cap is generally based on estimates of the level of emissions
which will not result in some environmental threshold being exceeded (e.g. CO2 emissions which will not
result in a greater than 2°C increase in average global temperatures). In the context of the rebound
effect, it is no different, and policy makers must define what the maximum level of consumption is and
to set the cap appropriately. Implementing a cap in conjunction with an efficiency regulation is a
particularly promising approach to controlling rebound and maximising environmental benefit.
Socio-economic considerations
While caps do not directly increase the cost of a good or a service, limiting the overall availability of the
resource will tend to increase prices. As such, the considerations discussed for taxes also apply in the
case of a cap as well. With a cap, however, there is less certainty as to the degree of the price increase
and less control over how the burden of increasing prices will be distributed throughout society.
Considerations for implementation
As a cap creates artificial scarcity of a resource, an administrative structure is required to monitor
consumption and to enforce compliance with the cap. These monitoring and enforcement activities
necessarily entail additional administrative overhead costs, which can conceivably be significant.
A fundamental question for the implementation of a cap is at what level it ought to be administered. The
EU ETS, for example limits GHG emissions at the EU and Member State levels. Per Member State permits
are set to agreed limits per impacted industry activity. Caps could, however, be established at other
administrative levels. It is even conceivable that a cap could be set at the household level, though this
would require considerable insight into the needs of the household for such an approach to be fair.
20 From a purely economic point of view, the distinction between a cap on the consumption of a resource (e.g. energy, water, etc.) and the
emission of a pollutant (e.g. greenhouse gases) is immaterial. A cap on the emission of a pollutant, for example, could be considered a cap on the consumption of the capacity of the environment to absorb that pollutant. That capacity is a valuable resource itself.

in association with &
_____________________________________________________________________________________
96 European Commission DG ENV Addressing the Rebound Effect
7.2.3.2 Behavioural Measures
Measures and campaigns that attempt to influence and alter consumers’ lifestyles, habits and behaviour
are important instruments that complement legal, fiscal and technology interventions. Behaviour-
targeted measures have been used to achieve similar effects in the past, for example in the field of
health care, safe driving or environmental behaviour. Yet, such measures have so far not addressed the
rebound effect specifically, but have addressed efficiency issues such as green driving, traffic
decongestion or housing refurbishment. As such, behavioural measures could be applied as well to
rebound effects.
Combating the direct rebound effect in behaviour-targeted campaigns is easier than combating indirect
rebound effects as the target of the campaigns can be mono-thematic and thus are better focussed. Such
behavioural measures work specifically well if they are integrated in a package of policy measures that
has one consistent aim. For example, anti-smoking campaigns in many countries rely on a consistent
anti-smoking policy that have also produced different pieces of legislation including restrictions, bans
and increasing tax levels on tobacco21.
One major aim of behaviour targeted campaigns is to make a certain behaviour unattractive or tedious
and deemed socially or environmentally harmful; thereby deterring consumers from taking up this
behaviour. The measures are more successful and effective the more coherently they are matched with
other pieces of policy with the same target. Thus, coherence of policy is a very important precondition
for behaviour-related measures to be effective, hence political will is a key enabler for behaviour-related
measures. The examples of traffic decongestion and smoking, outlined below, illustrate how this could
work. The key actors are the Commission and/or the Member States policy representatives developing
the campaigns, and stakeholders for their implementation/dissemination. One basic barrier to
campaigns is that they cannot force people into taking up behaviours that they do not want to take up.
Democratic societies are not permitted to stigmatise people that behave lawfully even if a certain
behaviour is not socially or environmentally valuable.
PARIS POLICY TO REDUCE CAR TRAFFIC
Rebound effects associated with traffic congestion described in 6.0 have highlighted that urban traffic congestion tends to maintain a self-limiting equilibrium. Vehicle traffic volumes increase to fill available capacity until congestion limits further growth. Travel that would not occur if roads are congested, but will occur if roads become less congested, is called latent travel demand. Increasing road capacity, or reducing vehicle use by a small group, creates additional road space that is filled with latent demand. As a consequence, limiting road space for cars can lead to less traffic. The city of Paris has taken up this policy (Prud’homme et al, 2005). In contrast to the London traffic congestion charge as described in 6.0, the policy of restricting road space for cars in Paris aims to reduce car traffic as distinct from congestion and also accepts the creation of congestion in order to reduce traffic (Prud’homme et al, 2005). The policy that has been executed between 2001 and 2005 consisted mostly of depriving cars of road space by creating bus lanes, bike tracks and broadening pavements. Often one lane in a main road has been removed from car transport. Furthermore, the zones featuring a 30 km/h speed limit have been increased and also the price for parking increased by 30%.
21 Focus, 31.05.2009, Abschrecken ist besser als sterben, http://www.focus.de/schule/gesundheit/medizin/anti-raucher-kampagne-fuer-
schueler-abschrecken-ist-besser-als-sterben_aid_403649.html

in association with &
_____________________________________________________________________________________
European Commission DG ENV Addressing the Rebound Effect
97
These measures brought about sensible changes in Paris transport. First of all, car traffic reduced, the average speed of cars decreased and the use of the metro and bikes as well as motorbikes, has increased. While the results of this policy are subject to heated political debate, the kilometres driven by cars within the Paris city walls have reduced by 21 % between 2001 and 2008 according to official data (Mairie de Paris, undated Le bilan des déplacements à Paris, 2008).22 In order to complement this transport policy the Paris city government started the VELIB project in 2007 making tens of thousands of bikes available in different points in the city of Paris that can be used by persons having subscribed to the programme for a moderate price. Given the growing number of bike use and the decreasing number of cars used, the Paris transport policy has had a major effect on the modification of the transport situation in Paris, even if one cannot claim for sure to what extent this policy has contributed to this shift.
EU ANTI-SMOKING CAMPAIGN
Another example of where behaviour-related campaigns have worked well, because they were coherent and integrated into a set of policy measures was the EU Anti-Smoking Campaign. In addition to different pieces of legislation, that laid down labelling of substances in cigarettes on the packaging and the ban of commercials advertising cigarettes, the European Commission has created the HELP-campaign, which is an information and prevention campaign focusing on smoking in younger generations. The "Help - For a life without tobacco"-campaign has the target of promoting a tobacco-free lifestyle through publishing comprehensive information on the health and societal problems caused by tobacco consumption. The media campaign is one of the largest awareness-raising actions in the public health sector. The Help-Homepage is below.
The first phase of the campaign (2005-2008) started with the building up of the internet presence. In 2006, a period of dissemination of the campaign followed which led to a further spread of the programme. The programme is based on four columns: media, press relations, events and internet. In media different TV campaigns were initiated which regularly (circa every half year) were repeated. Also a partnership with MTV and different online campaigns was established (European Commission, 2009a).
22 There has been widespread criticism of this „politques ans voiture“ including allegations that pollution from cars had increased because of
cars driving more slowly, see for this Prud’homme, Kopp, 2005). This criticism which goes into the depth of transport policy is not subject of this study.

in association with &
_____________________________________________________________________________________
98 European Commission DG ENV Addressing the Rebound Effect
An accompanying research study showed that 59 % of Europeans under 25 pointed out that they have seen the Help-TV spots and also that the main messages were understood. The Help-website was clicked by 7 million visitors during the 4 year-period. 140,000 users signed up to the e-mail coaching module which offered support for the process of smoking cessation (European Commission, 2009a). In May 2009 the second phase of the campaign started with the publishing of three new anti-smoking TV spots. The spots were developed together with young people and employed humorous approaches for their target. There are three clear key messages in the spots: don’t start smoking, how it is possible to quit smoking and how dangerous second-hand smoking is. The TV spots were shown in two one-month periods with a break of three months between them. At the Help-website, tips for cessation can be uploaded. The section is divided in serious and absurd tips (European Commission, 2009b). The overall results of the regulations; the campaign and the changed public opinion regarding smoking showed in the statistics as high. For example, in Germany in 2010 only 13% of the 12-17 year old young people smoked. That is the lowest number of the last thirty years and this proportion decreased from 28 % in 2001 (BZgA, 2011). For the EU population over 15 years old the WHO-data shows a decrease of about 4 percent (from 30 to 26 % (2000 to 2008)) (WHO Europe, 2011). This can be explained by a fundamental change in mentalities that can, to a certain extent, be attributed to such campaigns.
7.2.4 TACKLING INDIRECT & ECONOMY WIDE REBOUND EFFECTS
Broadly speaking, the measures which would be used to tackle indirect and economy-wide rebound
would be the same as those used to tackle direct rebound. The difference is the scale and level of their
application. Measures to tackle indirect and economy-wide rebound would be better applied at a higher
or more general level. Key features relevant to fiscal and behavioural measures for addressing indirect
and economy wide rebound effects in the short and long term are summarised below.
7.2.4.1 Fiscal Measures
An energy tax is an example of a measure which could be used to counteract direct rebound, and also
adapted to counteract indirect and economy-wide rebound. Such a tax could be an effective measure to
control indirect and economy-wide rebound, but rather than targeting energy consumption in a
particular context, it would be better applied to energy production (e.g. taxing the production of crude
oil at the well).
If a measure is expected to have an impact at the macroeconomic or economy-wide level, then the risk
of the measure causing distortions throughout the economy exists also. This could have implications for
inter- and intra-economy trade and competition which would likely be difficult to predict. Additionally, it
is important to note that, while imported goods are also subject to rebound effects, it is difficult to
devise measures which could be effective against the increased consumption of such goods as the
environmental impact typically occurs outside the jurisdiction of the regulatory authority. This is an
example of where a more sophisticated understanding of the influencing effects of inter economy issues
are needed to inform the effectiveness of measures for tackling economy wide rebound effects.
Research is focusing on this at present at University of Stirling as outlined in 5.3, but further
development is needed to inform policy needs as recommended in 7.2.2.

in association with &
_____________________________________________________________________________________
European Commission DG ENV Addressing the Rebound Effect
99
7.2.4.2 Behavioural Measures for Consumers
While the behaviour-related approaches, to tackling the direct rebound effect, are in general focused on
one issue, those suited to tackle the indirect rebound effects have to be broader, focusing on sustainable
lifestyles encompass all aspects of production and consumption.
In this respect, care needs to be taken to prevent situations in which business and consumers expend the
efficiency savings on higher environmental burden activities. For consumers, examples would be
spending the money saved from energy or fuel efficiencies on other, high-carbon purchases, like flights.
For this reason, consumers in particular need to be made aware of the danger of shifting pollution from
one source to another, especially if people “feel good” about having made one environmental choice.
Subjective errors become crucial when people give up an activity with a relatively low environmental
impact replacing it with an activity with a higher environmental impact because they are incorrect ideas
about the actual, relative environmental impacts. Thus, information campaigns should list the
environmental impacts (e.g. given in the units of GHG emissions) of typical activities (e.g. travel by train,
air, car; buying conventional food and organic food, putting the thermostat at 15, 16, 17 degrees
depending on the fuel used, etc) in order to give benchmarks. Thus false compensation of
environmentally friendly actions is avoided e.g. a household books an additional flight because it recycles
its plastic bottles. In order to simplify things, activities with specifically low environmental impacts should
be highlighted and presented as alternative to higher ones. As an example, a UK study showed
estimated indirect rebound effects of around 34 % for three GHG abatement actions advocated on
websites to consumers by the UK government – reducing the thermostat by 1 degree C, reducing food
purchased by one third to reduce food waste and walking/cycling for two trips less than two miles vs.
driving. This means that only two thirds of the anticipated GHG emissions reductions are likely to be
achieved. This was because in this study, the money saved by these three abatement activities was
assumed to be spent on other activities or saved in banks/investments whose Carbon intensity was such
that 34% GHG emissions savings was lost overall. The modelling used in this study made these
assumptions based on UK average household expenditure “business as usual” spending and saving
patterns (not the worst case scenario). A best case mitigation strategy was estimated to reduce this 34%
rebound effect to 12% by encouraging householders to shift consumption patterns to lower GHG
intensive categories of expenditure and to invest in low carbon investments vs. consuming (Druckman et
al, 2010). Investment in ultra low carbon technology could even create a negative rebound effect (e.g.
overall GHG emissions reductions due to the investments would exceed those estimated, giving an
overall environmental gain ) (Druckman et al, 2010).
Communications and campaigns that draw attention to the danger of shifting from one environmental
activity to another with the same or even worse environmental consequences, can raise awareness and
influence behaviours. For example, communications that use humour and satire could mock and
demonstrate typical examples of indirect rebound effects deriding bogus environmental behaviour. An
important key to preventing any indirect rebound effects is to promote wholly and consistently
sustainable lifestyles that encompass all relevant areas of life and are consistent with environmental
awareness that impedes activities, causing an important indirect rebound effect. Consumers should be
trained to assess all activities with regard to their environmental impact and try to reduce their absolute
environmental impact. Such campaigns can be done by the Commission and/or the Member States
involving consumer facing agencies.

in association with &
_____________________________________________________________________________________
100 European Commission DG ENV Addressing the Rebound Effect
7.2.4.3 Awareness Raising & Capacity Building in Business
As several examples of indirect rebound effects were found from well intended green advertising using
air miles to drive lower environmental impact choices elsewhere, there is a clear role for educating
business on the implications this can have on the rebound effect. EU environmental capacity building
measures for business and targeted instruments e.g. the Green Claims Guide should incorporate the role
advertising can play in influencing consumer expenditure and associated direct but also in particular
indirect rebound effects.
7.2.4.4 Long term Sustainable Consumption Behavioural Measures
The rebound effect provides a further rationale for intensifying the sustainable consumption agenda
aiming to leverage change towards more sustainable lifestyles. As part of this, challenging the neo
classical economic model motivations that are driving ongoing production and consumption on a planet
of limited natural capital is a key feature. Hence decoupling, sufficiency and degrowth initiatives, as
detailed in 6.2, are as relevant to rebound effects as they are to wider EU SCP initiatives.
More long-term initiatives comprise the redefinition of certain aspects of the current social and
economic system and the way it is assessed. There is a growing recognition of the causal link between
measuring a country’s success by increased growth using GDP and increasing material consumption
(Maxwell, 2006; Jackson, 2009; NEF, 2010). A few countries are now working on defining indicators
beyond GDP to measure success relating to natural and social capital e.g. the new quality of life
measures covering environmental and sustainability issues, as well as economic performance (ONS,
2010)23. France’s Stiglitz report recommends GDP growth be used just to measure market activity and
that new systems take into account environmental health, safety and education -- what Bhutan already
calls "Gross National Happiness." (Stiglitz, 2009)24. Beyond this, economic systems need to be adapted to
fundamentally incorporate sustainability. These include removing current perverse incentives driving
unsustainable production and consumption as well as and motivating less material intensive ways for
humans to live meaningful lives (Jackson 2009).
The main limit to combating the indirect rebound effect is the fact that people have been told for many
years, that they should consume in order to keep the economy going. Combating indirect rebound
effects will involve reducing consumption in a multitude of areas, thus the priority of consumers will
need to shift from consumption, i.e. “shopping, consuming”, to other less environmentally critical
activities (like arts, sports, social activities, etc.). This will involve a mental shift and could take
generations to implement. Also there is much wariness of the state’s role as an educator and ideologist.
Therefore, any soft measures contributing to awareness and behaviour shaping need to be integrated in
a set of other democratically adopted instruments be it legal or fiscal measures, promoting a more
holistic sustainable lifestyle. The same barrier that was mentioned for the direct rebound applies here
also. Human beings in democratic societies are principally free to make the choices they please as long
as these are not illegal. Thus, any campaigns or government programmes may not force people, who are
not willing, to follow any wholly sustainable behaviour philosophy.
23 http://www.ons.gov.uk/about/consultations/measuring-national-well-being/index.html 24 http://www.france24.com/en/20090914-france-advocates-new-ways-measure-growth-based-well-being-gdp-stiglitz-report-nobel-economics-
sarkozy-statistics)

in association with &
_____________________________________________________________________________________
European Commission DG ENV Addressing the Rebound Effect
101
8. REFERENCES
4CMR (2006), 4CMR, CE, PSI, OU, The Macroeconomic Rebound Effect and the UK Economy, Report for Defra, http://www.landecon.cam.ac.uk/research/eeprg/4cmr/pdf/Rebound_effect_4CMR_Final_Report_v6-1.pdf
ADEME, 2010, Les effets rebond des mesures d’efficacité énergétique : comment les atténuer? , ADEME & Vous, No 24, May 2010, http://www2.ademe.fr/servlet/getBin?name=31AA9B7EF897F2F9B08A4DD7B5C259861273589176085.pdf
Allen et al (2006),The macroeconomic rebound effect and the UK economy, Allen G, Hanley N et al; Final report to Defra, May 2006
Allibe, B., No year, From practices to behaviours: Estimating the impact of household behaviour on space heating energy consumption
Ariely et al (2005), "Psychology, Behavioral Economics, and Public Policy." Marketing Letters 16(3/4):443-454.
Andersen, R. 2003, Envisioning the prototypical company of the 21st century, in: Waage , S. (ed) (2003),
Ants, Galileo and Gandhi – Designing the Future of Business Through Nature, Genius and Compassion,
pp 272, Greenleaf Publishing, ISBN 1874719713
Anderson BR, Clark AJ, Baldwin R, Milbank NO (1985) BREDEM: The BRE Domestic Energy Model, BRE Publication
Anderson, R., 1999, Mid-Course Correction: Toward a Sustainable Enterprise: The Interface Model, ISBN
0964595354
Angle, H.; Bone, S.; Goddard, E. (2009): THINK! Road Safety Campaign Evaluation. Annual Survey 2009 Report. Prepared for: Department for Transport. London.
Anson, S, and Turner, K. (2009), Rebound and disinvestment effects in oil consumption and supply resulting from an increase in energy efficiency in the Scottish commercial transport sector. Strathclyde Discussion Papers in Economics. No. 09-01.
Barker, T.; Dagoumas, A.; Rubin, J., The macroeconomic rebound effect and the world economy. Energy Efficiency 2009, 2, 411-427, http://tyndall2.webapp3.uea.ac.uk/publications/journal-article/2009/macroeconomic-rebound-effect-and-world-economy
Beddoe et al (2009) Overcoming systemic roadblocks to sustainability: The evolutionary redesign of worldviews, institutions, and technologies, February, 2009, Rachael Beddoe, Robert Costanza, Joshua Farley, Eric Garza, Jennifer Kent, Ida Kubiszewski, Luz Martinez, Tracy McCowen, USA
Belk, Russell W. (1988), "Possessions and the Extended Self," J. of Consumer Research, Vol. 15 (September), 139-168.
Bentzen, J. (2004), Estimating the rebound effect in US manufacturing energy consumption, Energy Economics 23, 123-134
Berkhout, P H G, Muskens, J C & Velthuijsen, J W. 2000. Defining the rebound effect. Energy policy, 28:
425-32.
Biermayr, B, Schriefl, E. et al. 2005, Maßnahmen zur Minimierung von Reboundeffekten bei der Sanierung von Wohngebäuden (MARESI)
Birol F, Keppler JH. (200), Prices, technology development and the rebound effect., Energy Policy
2000;28(6e7):457e69
Bowers, B. ( 1998) Lengthening the Day: a History of Lighting Technology (Oxford: Oxford University Press
Brookes, L. (2004). "Energy efficiency fallacies—a postscript." Energy Policy, 32:8, pp. 945-47.

in association with &
_____________________________________________________________________________________
102 European Commission DG ENV Addressing the Rebound Effect
Brookes, L. G. (1990). "The greenhouse effect: the fallacies in the energy efficiency solution." Energy Policy,
18:2, pp. 199-201.
Brookes, L. G. (2000). "Energy efficiency fallacies revisited." Energy Policy, 28:6-7, pp. 355-66.
Bundesamt für Energie (2009), Energieeffizienz und Reboundeffekte, Entstehung , Ausmaß, Eindämmung
BZgA (2011): Der Tabakkonsum Jugendlicher und junger Erwachsener in Deutschland 2010. Ergebnisse einer aktuellen Repräsentativbefragung und Trends. Köln: Bundeszentrale für gesundheitliche Aufklärung.
Callwell, C. (2010), Is efficient sufficient? The case for shifting our emphasis in energy specifications to
progressive efficiency and sufficiency, Prepared for the European Council for an Energy Efficient
Economy (eceee) with funding from the European Climate Foundation and the U.S. Environmental
Protection Agency’s ENERGY STAR Program.
Camerer, Colin et al. (2005), ‘Neuroeconomics: How Neuroscience Can Inform Economics’. Journal of Economic Literature Vol. XLIII (March 2005), pp. 9–64.
Carpenter (2005), From Energy Dreams to Nuclear Nightmares: Lessons for the 21st century from a
previous nuclear era. Charlbury, Oxon: Jon Carpenter 2005.
Cayla, J.M., Allibe, B., Laurent, M.H., (2010) From practices to behaviors: Estimating the impact of household behavior on space heating energy consumption, http://www.modelisation-prospective.org/Documents/COMM/2010/Cayla_ACEEE2010SummerStudy_paper.pdf
ClimateNet, 2010, http://www.climate2010.net/en/start
Costanza, R. (2008). "Stewardship for a 'full' world." Current History, January. Daly (2010), Herman Daly Festschrift: The world is in over-shoot and what to do about it, Encylopedia of
Earth, July 2010 Danish Energy Agency 2010 Energy Statistics 2009, Danish Energy Agency publication November 2010 Darby, S. (2001): Making it obvious : designing feedback into energy consumption. Oxford University. Darby, S. (2006): The effectiveness of feedback on energy consumption. A Review of Defra of the literature
on metering, billing and direct displays. University of Oxford. http://www.eci.ox.ac.uk/research/energy/downloads/smart-metering-report.pdf
Dardozzi, J. (2008), The spector of Jevon’s Paradox, http://www.greens.org/s-r/47/47-05.html Darnton, A. (2008). "GSR Behaviour Change Knowledge Review." ed. Government Social Research Unit. David, S., No year, Spend, save and splurge – the rebound effect of energy efficiency initiatives, Davis, D. S., 2010, Measuring the rebound effect of energy efficiency initiatives for the future. A South
African case study. Draft report: http://www.erc.uct.ac.za/Research/publications/10-Davis_Rebound_effect.pdf
Davis, L. W., 2007. Durable goods and residential demand for energy and water: evidence from a field trial, Working Paper, Department of Economics, University of Michigan.
DECC,2010, Valuation of energy use and greenhouse gas emissions for appraisal and evaluation, Guidance, Background document and spreadsheet tool, June 2010, http://www.decc.gov.uk/en/content/cms/statistics/analysts_group/analysts_group.aspx
DEFRA (2007): The diffusion of environmental behaviours; the role of influential individuals in social networks Report 1: Key findings. http://www.brooklyndhurst.co.uk/media/3b1ffea0/Mavens%20summary.pdf
Defra (2008). "A Framework for Pro-environmental Behaviours." Degrowth, 2010, http://www.degrowth.net/Adresse-Address
Dimitropoulos , J. (2007), Energy productivity improvements and the rebound effect: An overview of the state of knowledge, Energy Policy, Volume 35, Issue 12, December 2007, Pages 6354-6363
Dimitropoulos, J., no year, Energy Consumption, Behaviour Change and the Rebound Effect, http://www.lsx.org.uk/docs/page/3340/Microsoft%20PowerPoint%20-%20John%20Dimitropoulos%20LSX%20presentation%20080909.pdf
in association with &
_____________________________________________________________________________________
European Commission DG ENV Addressing the Rebound Effect
103
Dimitropoulos, John (2009), Rebound Effect, http://www.lsx.org.uk/docs/page/3340/Microsoft%20PowerPoint%20-%20John%20Dimitropoulos%20LSX%20presentation%20080909.pdf
Druckman, A., M. Chitnis, S. Sorrell and T. Jackson (2010) An investigation into the rebound and backfire effects from abatement actions by UK households, RESOLVE Working Paper Series 05-10, University of Surrey, December 2010, http://www.surrey.ac.uk/resolve/DOCS/WorkingPapers/RESOLVE_WP_05-10.pdf
Dubuisson-Quellier, S. (2008): Consumer involvement in fair trade and local food systems: delegation and empowerment regimes, in: GeoJournal, 73, pp. 55-65.
EC (2009), Where energy efficiency increases energy consumption : a caution’, Turner K. and J.DEFENCE, Science for environment policy : DG environment news alert service, February 2009, available at http://ec.europa.eu/environment/integration/research/newsalert/pdf/140na4.pdf
EEA (2007), Sustainable consumption and production in South East Europe and Eastern Europe, Caucasus and Central Asia – Decoupling economic growth from environmental impact
EEA (2009), Final energy consumption - outlook from IEA, 2009 EEA (2010), The European environment — state and outlook 2010: consumption and the environment.
European Environment Agency, Copenhagen, November 2010
EEA,2005, Sustainable use and management of natural resources, EEA Report No 9/2005 EESC, (2009), Mitigating the rebound effect : do increases in energy efficiency improve environmental
quality and sustainability?’, by K.TURNER, Description: Presentation to the public hearing on energy efficiency policy for end-users organised by the European Economic and Social Committee (EESC) and the Italian Council of Economy and Labour (CNEL), July 2009, http://eesc.europa.eu/sections/ten/events/energy/2009-07-09-energy-efficiency
Ene, C.(2008), Consumer Behaviour Concerning Postconsumer Waste, Energy Policy 2000;28(6e7):457e69 Environment Agency, (2010), Evidence: Energy and Carbon Implications of rainwater harvesting and
greywater recycling Report: SC090018
ETH, (2006), Characteristics of buyers of hybrid Honda Civic IMA: Preferences, decision process, vehicle ownership, and willingness-to-pay Results of a survey in September 2005 with all 111 Swiss buyers of a Honda Civic IMA and 200 buyers of a conventional 5-door Civic, Zurich, 30th November 2006
Euonima (2009), Policy Instruments for Sustainable Materials Management: Report for the OECD European Commission (2009a): HELP 2005 – 2008. The European Union anti-tobacco campaign in 27
Member States, Executive Summary. http://ec.europa.eu/health/archive/ph_determinants/life_style/tobacco/help/docs/help_sum_en.pdf
European Commission (2009b): World No Tobacco Day: EU Commission launches new anti-smoking TV campaign, Help 2.0. http://www.europa-eu-un.org/articles/en/article_8759_en.htm
Faist Emmenegger, M., Frischknecht, R., Stutz, M., Guggisberg, M., Witschi, R. Otto, T. (2004) Life Cycle Assessment of the Mobile Communication System UMTS: Towards Eco-efficient Systems. Int J LCA 2004 (OnlineFirst): 1 – 12
Fell et al (2009). "The diffusion of environmental behaviours: the role of influential individuals in social networks, Fell, D., A. Austin, E. Kivinen and C. Wilkins. Report 2: The evidence ". Defra, Brook Lyndhurst
Fouquet R and Pearson P J G 2006 Seven centuries of energy services: the price and use of light in the
United Kingdom, (1300–2000) Energy J. 27 139–77
Fouquet, R. 2008 Heat, Power and Light: Revolutions in Energy Services. Edward Elgar Publications. Cheltenham, UK, and Northampton, MA, USA
French Ministry of the Environment, 2010 “CO2 et activités économiques de la France », French ministry of environment, Études et documents n°27, August 2010. http://www.stats.environnement.developpement-durable.gouv.fr/uploads/media/Namea.pdf
Frieden, T. R. et al. (2008): Public health in New York City, 2002–2007: confronting epidemics of the modern era. International Journal of Epidemiology 2008, vol. 37, 966–977.
Gately, D. (1990), “The U.S. demand for highway travel and motor fuel”, The Energy Journal, 11, pp. 59-73.

in association with &
_____________________________________________________________________________________
104 European Commission DG ENV Addressing the Rebound Effect
Girod and Haan, 2009, GHG reduction potential of changes inconsumption patternsand higher quality levels:Evidence from Swiss household consumption survey, Bastien Girod , Peter deHaan, Energy Policy 37 (2009) 5650–5661
Girod and Haan, 2010, More or Better? A Model for Changes in Household Greenhouse Gas Emissions due to Higher Income, Bastien Girod and Peter de Haan, Journal of Industrial Ecology, 2010, DOI: 10.1111/j.1530-9290.2009.00202.x, Volume 14, Number 1
Girod et al, 2009, Consumption-as-usual instead of ceteris paribus assumption for demand, Integration of potential rebound effects into LCA, International Journal of LCA, Bastien Girod & Peter de Haan & Roland W. Scholz, 2009, Int J Life Cycle Assess, DOI 10.1007/s11367-010-0240-z
Gonzales J F (2010) Empirical evidence of direct rebound effect in Catalonia, Energy Policy, pp. 2309-2314,
May 2010
Gonzalez, J., 2010, The rebound effect: evidence for Catalonia and indirect effects trhough an environmental input-output analysis
Goodwin, P.B., 1996. Empirical evidence on induced traffic, a review and synthesis. Transportation. 23(1), 35-54.
Gottron, F. ,2001, Energy Efficiency and the Rebound Effect: Does Increasing Efficiency Decrease Demand?, CRS Report for Congress
Graham, D. & Glaister, S. (2002), Review of income and price elasticities of demand for road traffic, Centre for Transport Studies, Imperial College of Science, Technology and Medicine.
Green Building Magazine (2008) Water and the Code for Sustainable Homes (pp26-30), Autumn
Green Building magazine, (2008) Good Homes Alliance says Code could be better (pp30-33), Autumn
Greening et al, 2000, Greening, L. A., D. L. Greene, and C. Difiglio, (2000).”Energy efficiency and consumption - the rebound effect - a survey.” Energy Policy 28: 389-401, 2000
Guardian (2009), Article of tesco flights for lights advert , Guardian Newspaper UK, http://www.guardian.co.uk/environment/ethicallivingblog/2009/tesco-advert-energy-saving-bulbs-flights-greenwash
Guertin, C., Kumbhakar, S., Duraiappah, A., 2003. Determining demand for energy services: investigating income-driven behaviours. international institute for sustainable development.
H. Saunders, 2010, Historical Evidence for Energy Consumption Rebound in 30 US Sectors and a Toolkit for Rebound Analysts, draft pending publication in Energy Economics journal in 2011
Haan et al, 2006, Does the hybrid Toyota Prius lead to rebound effects? Analysis of size and number of cars previously owned by Swiss Prius buyers, Peter de Haan, Michel G. Mueller, Anja Peters, Swiss Federal Institute of Technology, Department of Environmental Sciences, HES- NSSI, 8092 Zurich, Switzerland, Ecological Economics 58 (2006) 592– 605
Hafstadt, A., Aarø, L. E. and Langmark, F. (1996): Evaluation of an anti-smoking mass media campaign targeting adolescents: the role of affective responses and interpersonal communication. Health Education Research: Theory & Practice, vol.11, no. 1, 1996, 29-38.
Hanley et al, 2009, Do increases in energy efficiency improve environmental quality and sustainability?,
Nick Hanley, Peter G. McGregor, J. Kim Swales and Karen Turner, Ecological Economics, Volume 68,
Issue 3, 15 January 2009, Pages 692-709
Hanley, N. & McGregor, P. G. (2005), Do increases in resource productivity improve environmental quality? Theory and evidence on "rebound" and "backfire" effects from an energy-economy environment regional computable general equilibrium model of Scotland Department of Economics, University of Stirling.
Hanley, N., Peter G. McGregor, J. Kim Swales and Karen Turner, Ecological Economics, Volume 68, Issue 3, 15 January 2009, Pages 692-709
Harris, J., Diamond, R., et al, Don’t Supersize Me! Toward a Policy of Consumption-Based Energy Efficiency, no link.
Herring (1999), “Does Energy Efficiency Save Energy? The Debate and Its Consequences,” Applied Energy, 63/3, July 1999,pp. 209-226;
in association with &
_____________________________________________________________________________________
European Commission DG ENV Addressing the Rebound Effect
105
Herring (2008), The Rebound Effect: Efficiency, Sufficiency And The Meaning Of Life, Talk to Sustainable Technology Group, the Open University, January 2008
Herring and Moezzi, (2004), Horace Herring and Mithra Moezzi, eds. Energy Efficiency and Consumption:Special issue of Energy & Environment 15 (6) , December 2004.
Herring and Roy (2007), Horace Herring & Robin Roy. Technological innovation, energy efficient design and the rebound effect. Technovation 27 (2007): 194-203.
Herring and Sorrel (2008), Horace Herring and Steve Sorrell, eds. Energy Efficiency and Sustainable Consumption: The Rebound Effect. Palgrave 2008.
Herring, H. (2004), The Rebound Effect and Energy Conservation. In CLEVELAND, C. (Ed.) The Encyclopedia of Energy. Academic Press/Elsevier Science
Hertwich, E. (2005), Consumption and the Rebound Effect: An Industrial Ecology Perspective Hilty, L./Rudy, T., no year, Towards a Sustainable Information Society,
http://www.empa.ch/plugin/template/empa/*/32695/---/l=2 Hilty, L.M., Köhler, A., Von Schéele, F., Zah, R., Ruddy, T., 2005, Rebound effects of progress in information
technology, Switzerland, http://www/blakealcott.org/publications.html http://www.newyorker.com/reporting/2010/12/20/101220fa_fact_owen#ixzz18HbZu0dm IEA (2009). "World Energy Outlook 2009." International Energy Agency: Paris.
IGD (2007), Household Food Waste, IGD UK Institute for Public Policy Research (IPPR) (2009): A communications guide for mainstreaming lower-
carbon behavior Institution of Engineering an Technology (2010), Rebound, Unintended consequences from transport
policies and technology innovation, www.theiet.org/factfiles/transport/unintended.cfm?type=pdf Interface,2010, Sustainability in Action, http://www.interfaceglobal.com/Sustainability/Sustainability-in-
Action/Closing-the-Loop.aspx
InterfaceFLOR, 2007, Rentry2.0, http://www.interfaceflor.com/reentry2.0/
IPCC (2008). "IPCC Fourth Assessment Report: Working Group III Report "Mitigation of Climate Change"."
Intergovernmental Panel on Climate Change.
Irrek (2009), Paper for the 2nd International Wuppertal Colloquium on „Sustainable Growth, Resource Productivity and Sustainable Industrial Policy – Recent Findings, New Approaches for Strategies and Policies“, 10th – 12th September 2009, University of Wuppertal, Schumpeter School of Business and Economics, Wuppertal, Wolfgang Irrek (pending publication). Book to include article to be published entitled: International Economics of Resource Efficiency - Eco-Innovation Policies for a Green Economy
IZM, 2008, Preparatory Studies for Eco-design Requirements of EuPs (Tender TREN/D1/40-2005) Lot 4:
Imaging Equipment, Fraunhofer IZM, May 7, 2008 http://www.ecoimaging.org/, http://www.eup-
network.de/fileadmin/user_upload/Produktgruppen/Lots/Final_Documents/Lot4_T7_Final_Report.pdf
Jackson, T. (2005): Motivating Sustainable Consumption. A review of evidence on consumer behaviour and
behavioural change. A report to the Sustainable Development Research Network
http://www.comminit.com/en/node219688
Jackson, T. 2010, TED Global 2010:
http://www.ted.com/talks/tim_jackson_s_economic_reality_check.html
Jackson, T.,(2009a), Prosperity without Growth: Economics for a Finite Planet (Earthscan, London, 2009). Jackson, T.,(2009), Prosperity without Growth? The Transition to a Sustainable Economy [online] 6 (2009)
http://www.sd-commission.org.uk/publications/downloads/prosperity_without_growth_report.pdf Jeffrey Y. Tsao and Paul Waide (2010) The World’s Appetite for Light: Empirical Data and Trends Spanning
Three Centuries and Six Continents, LEUKOS Vol 6 No. 4 April 2010
Jenkins, J (2010), Energy Emergence, Rebound and Backfire as Emergent Phenomena: Implications for
Climate Change Mitigation Policy A Review of the Literature (draft), Jesse Jenkins, Ted Nordhaus,
Michasle Shellenberger, Breakthough Institute, USA
in association with &
_____________________________________________________________________________________
106 European Commission DG ENV Addressing the Rebound Effect
Jevons, W. S. (1865), "The Coal Question: Can Britain Survive?," in A.W. Flux ed. The Coal Question: An Inquiry Concerning the Progress of the Nation, and the Probable Exhaustion of Our Coal-mines. New York Augustus M. Kelley.
Jinlong Ouyang, Enshen Long, Kazunori Hokao (2010) Rebound effect in Chinese household energy
efficiency and solution for mitigating it, Energy, Volume 35, Issue 12, December 2010, Pages 5269-
5276, The 3rd International Conference on Sustainable Energy and Environmental Protection2009
Joyashree Roy (2000) The rebound effect: some empirical evidence from India , Energy Policy, pp 433-438,
June 2000
JRC/IE, (2009), Electricity Consumption and Efficiency Trends in the European Union. Status Report. JRC
Scientific and Technical Reports, EUR 24005 EN. Joint Research Centre, Institute for Energy, Ispra.
http://re.jrc.ec.europa.eu/energyefficiency/pdf/EnEff_Report_2009.pdf
JRC/IPTS (2006), Environmental impacts of products (EIPRO). Analysis of the life cycle environmental
impacts related to the total final consumption of the EU‐25. EUR 22284 EN. Institute for Prospective
Technological Studies, Sevilla, http://ec.europa.eu/environment/ipp/pdf/eipro_report.pdf
Kahneman, D. (2003), 'A perspective on judgment and choice: Mapping bounded rationality.' American Psychologist 58 (9): 697-720.
Katrena et al. (2010). The Role of Technological and lifestyle Changes Versus Carbon Taxes in Determining the Energy Demand of Households. Published in Critical Issues in Environmental Taxation, Vol VIII, p. 354-375
Khazzoom (1987), “Energy Savings Resulting from the Adoption of More Efficient Appliances,” Energy Journal, Vol.8, No.4, 1987, pp. 85-89;
Khazzoom, J. D. (1980). "Economic implications of mandated efficiency in standards for household
appliances." Energy Journal, 1:4, pp. 21-40.
Krutwagen B., Lindeijer E.(2001), LCA Services. An adapted approach including consumer based rebound
effects in Proceedings of the 6th International Conference ‘Sustainable Services and Systems.Transition
towards Sustainability?’, The Surrey Institute of Art and Design, University College. Amsterdam,
Netherlands, pp. 233- 238, October 2001
LA Times (excerpts), undated, Hollywood loves hybrid cars, http://www.allabouthybridcars.com/hollywood-hybrids.htm .
Lechner, Peter (2009), Proceeding of the 3rd BOKU Waste Conference 2009 “Prosperity Waste and Waste Resources”, Vienna with 8 special papers on food, food waste and food waste prevention
Lichtblick, Werbebroschüre Januar 2010, http://www.lichtblick.de/ufile/5_15_1.pdf .
Liftshare, 2010, Live Statistics, www.liftshare.com/business/livestats.asp
Linden A, Carlsson-Kanyamab A, Eriksson B. Efficient and inefficient aspects of residential energy behavior:
what are the policy instruments for change? 2006
Litman, T. 2006, London Congestion Pricing: Implications for Other Cities. Victoria Transport Policy
Institute. http://www.vtpi.org/london.pdf.
Litman, Todd, (2009), Efficient Vehicles Versus Efficient Transportation : Comparing Transportation Energy Conservation Strategies, USA.
Lorentz, A., Woersdorfer, J., 2009, Energy-efficient household appliances and the rebound effect - A model on the demand for washing machines’, Draft Report
Martin C and Watson M, (2006), Measurement of energy savings and comfort taking in houses receiving insulation upgrades, Energy Monitoring Company for Energy Saving Trust, 2006
Martínez-Alier (2010), Sustainable de-growth: Mapping the context, criticisms and future prospects of an emergent paradigm , Joan Martínez-Alier , Unai Pascual , Franck-Dominique Vivien , Edwin Zaccai, Ecological Economics 69 (2010) 1741–1747

in association with &
_____________________________________________________________________________________
European Commission DG ENV Addressing the Rebound Effect
107
Maxwell, D. et al, (2006), Enabling Sustainable Development through Sustainable Consumption and Production, Maxwell, D. and Sheate, W.(2006), International Journal of Environment and Sustainable Development Vol. 5, No. 3, 2006 221, ht tp://dx .do i .org/10 .1504/ I JESD.2006.010894
Michael Spielmann, Peter de Haan, Roland W. Scholz (2008), Environmental rebound effects of high-speed transport technologies: a case study of climate change rebound effects of a future underground maglev train system, Journal of Cleaner Production, Volume 16, Issue 13, September 2008, Pages 1388-1398
Michelin, (2009), Annual and Sustainable Development Report
Mills, L. et al (2007), Truth in Trash: Investigating Waste Reveals Food behaviours Today’s Dietitian Vol. 9 No. 9 P. 84 http://www.todaysdietitian.com/newarchives/tdsept2007pg84.shtml
Milne G, Boardman B. Making cold homes warmer: the effect of energy efficiency improvements in low-
income homes. Energy Policy 2000
Mizobuci, K., No year, Estimation of the Rebound Effects caused by an Improvement in Energy Efficiency: Japanese Household Consumption and Emission
Moezzi (1998) The Predicament of Efficiency, 1998 ACEEE Summer Study on Energy Efficiency in Buildings, 1998;
Mont, 2002, Clarifying the concept of product service system, Journal of Cleaner Production, 10(3), pp.
237-245, 2002
NEF, 2010, http://www.neweconomics.org/
Newak (2010) HECoRE Project Household Energy Consumption and Rebound Effect - Research project funded by the Belgian Science Policy Office (April 2010- January 2012).
Nordhaus, W. D (1997), “Do real-output and real-wage measures capture reality? The history of light
suggests not,” The Economics of New Goods, 1997
Nørgård et al, 2010, The History of The Limits to Growth, Jørgen Stig Nørgård, John Peet, Kristín Vala Ragnarsdóttir , Feb 2010
Norgard, (1995) Efficient Technology in an Inefficient Economy, 1995 ECEEE Summer Study,1995. Nørgård, JS (2009), Energy Efficiency and Sustainable Consumption: The Rebound Effect (eds Herring, H &
Sorell, S) Ch. 10, Avoiding rebound through a steady state economy, 204–223 (Palgrave Macmillan, UK, 2009).
ONS, 2010, Measuring National Wellbeing, 25 Nov, 2010, Consultation documents,
http://www.ons.gov.uk/about/consultations/measuring-national-well-being/index.html
Owen P , 2007 : The Ampere Strikes Back. An investigation into the Consumer Electronics and ICT sectors to understand why energy consumption in these areas is predicted to rise significantly in the face of increasing demands for energy efficiency in these products.
Owen, 2010, New Yorker, 2010, David Owen, Annals of Environmentalism, “The Efficiency Dilemma,” The New Yorker, December 20, 2010, p. 78-85
Owen, G.; Ward; J. (2006): Smart Meters : Commercial, Policy and Regulatory Drivers. London. http://www.sustainabilityfirst.org.uk/docs/2006/smart%20meters%20pdf%20version.pdf.
Owen, P , 2006 : Rise of the Machines. A review into the energy consumption increase in UK households from the 1970s to the 2000s
Paech, Nico (2005) Nachhaltigkeit zwischen ökologischer Konsistenz und Dematerialisierung. Hat sich die Wachstumsfrage erledigt? In Natur und Kultur 6/1 (2005): 52-72
Patagonia, 2010, Patagonia Common Treads Programme http://www.patagonia.com
Peters et al, 2008, Feebates promoting energy-efficient cars: Design options to address more consumers
and possible counteracting effects, Anja Peters_, Michel G. Mueller, Peter de Haan, Roland W. Scholz,
Energy Policy 36 (2008) 1355–1365
Polimeni, 2008, The myth of resource efficiency: The Jevons Paradox, John M. Polimeni, Kozo Mayumi, Mario Giampietro, and Blake Alcott, Earthscan, London, 2008, 184 pp, ISBN 978-1-84407-813-4
Polimenti et al (2009), The Myth of Resource Efficiency :The Jevons Paradox, John M. Polimeni, Kozo Mayumi, Mario Giampietro and Blake Alcott, London : Earthscan, 2009,ISBN : 978-1-84407-813-4

in association with &
_____________________________________________________________________________________
108 European Commission DG ENV Addressing the Rebound Effect
Porritt (2009), Living within our means: avoiding the ultimate recession. London, Forum for the Future, The Sustainable Development Commission, 39 p. http://www.forumforthefuture.org/files/Living_within_our_means_sml.pdf
Prud’homme, Remy, Knopp, Pierre, Bocarejo, Juan Pablo (2005), Evaluation economique de la politique parisienne des transport, in Revue Transports, nov-dec. 2005, Nr. 434, pp. 346-359
Randolph, W. and Viswanath, K. (2004). Lessons learned from public health mass media campaigns: Marketing health in a crowded media world. Annu. Rev. Public Health 25, 419–437.
Röpke, I. (2009): Theories of practice - New inspiration for ecological economic studies on consumption. Ecological Economics, 68, 2490-2497
Rose, S. (2010): De-growth Versus Sustainable Development, http://www.suite101.com/content/degrowth-versus-sustainable-development-a230642
Ruzzenenti, F and Riccardo, B., 2011, Energy growth, complexity and efficiency, university of Sienna, draft 2011
Ruzzenenti, F.; Basosi, R. , 2008, The rebound effect: An evolutionary perspective. In: Ecological Economics,
67, pp. 526-537.
Ruzzenenti, F.; Basosi, R. , 2008a, The role of the power/efficiency misconception in the rebound effect’s
size debate: Does efficiency actually lead to a power enhancement?, Energy Policy Journal
Ruzzenenti, F.; Basosi, R. , 2007, The rebound effect: An evolutionary perspective, Ecological Economics 6 7
( 2 0 0 8 ) 5 2 6 – 5 3 7
SACTRA (Standing Advisory Committee on Trunk Road Assessment) (1994), Trunk Roads and the
Generation of Traffic, UKDoT, HMSO (London).
Sammer, K. and R. Wustenhagen (2006). "The Influence of Eco-labelling on Consumer Behaviour - Results of a Discrete Choice Analysis for Washing Machines." Business Strategy & the Environment 15:185 - 199.
Sanders, C and Phillipson M., (2006) Review of differences between measured and theoretical energy savings for insulation measures, EST Report December 2006.
Saunders, H. (1992), “The Khazzoom-Brookes Postulate and Neoclassical Growth,” Energy Journal, Vol. 12, No. 4, 1992, pp. 131-148;
Schauer, T. (2001), The Benefits of EcoDesign and the Risk of Rebound Effects," ecodesign, pp.921, 2nd International Symposium on Environmentally Conscious Design and Inverse Manufacturing (EcoDesign'01).
Schettkat, R. (2009), Analysing Rebound Effects, Germany. Schipper, L. & Grubb, M. (2000), On the rebound? Feedback between energy intensities and energy uses in
IEA countries. Energy Policy, 28, 367-388. Schneider F (2009) Options for waste prevention measures concerning food; Müll und Abfall, 3/09 Schneider, F. (2003), L’effet rebond, l’Ecologiste, Edition française de The Ecologist, n°11 Octobre 2003, Vol
4, n°3, p45 Schneider, F., 2009, Rebound Effect and Sustainable Degrowth.,
http://www.degrowth.net/IMG/pdf/SchneiderUAB8.ppt.pdf Schneidewind, U., Müller, M., Hübscher, M., no year, http://www.sozial-oekologische-
forschung.org/intern/upload/literatur/schneidewind_instit_dimensionen.pdf
Schurr, S. (1990): Electricity in the American Economy: Agent of Technological Progress. Greenwood Press, USA.
Simmons, S. (no date). “Immaterialisation – The new reality”. Snyder, L.B. ,2007, Health communication campaigns and their impact on behavior. Journal of Nutrition
Education and Behavior 39, 32-40. Snyder, L.B. 2001, How effective are mediated health campaigns? In Rice, R.E. and Atkin, C.K. (Eds.), Public
Communication Campaigns. Third Edition. Sage, Thousand Oaks. pp. 181-190. Solomon et al , 2006, Consumer behaviour: a European Perspective, Solomon, Michael R. , et al., Sommerville, M., Space Heating Energy Efficiency Program Evaluation Report, Draft: 11/3/2007

in association with &
_____________________________________________________________________________________
European Commission DG ENV Addressing the Rebound Effect
109
Sorrell, S. (2010), Energy, Growth and Sustainability: Five Propositions, Sussex Energy Group Conference ‘Energy transitions in an interdependent world’, 25th - 26th February 2010,Sustainability 2010, 2, 1784-1809; doi:10.3390/su2061784 , www.sussex.ac.uk/sussexenergygroup/documents/sorrell.doc
Sorrell, S. et al (2007), The Rebound Effect: an assessment of the evidence for economy-wide energy savings from improved energy efficiency, UK Energy Research Centre,
Sorrell, S., Dimitropoulos, S., 2007: The rebound effect: microeconomic definitions, limitations and extensions. Ecological Economics, Volume 65, Issue 3, 15 April 2008, Pages 636-649.
Stern, N. (2007). The Economics of Climate Change: The Stern Review. London: The Cabinet Office-HM
Treasury.
Stern, N. (2008). "Key elements of a global deal on climate change." Grantham Research Institute on
Climate Change and the Environment, London School of Economics and Political Science: London.
Steve Sorrell, John Dimitropoulos (2008), The rebound effect: Microeconomic definitions, limitations and extensions, Ecological Economics, Volume 65, Issue 3, 15 April 2008, Pages 636-649, http://www.sussex.ac.uk/sussexenergygroup/documents/iaee_potsdam-final-spru-dimitropoulos-sorrell.pdf
Stiglitz, 2009 http://www.france24.com/en/20090914-france-advocates-new-ways-measure-growth-
based-well-being-gdp-stiglitz-report-nobel-economics-sarkozy-statistics)
Suh, S. (2006). "Are services better for climate change?" Environmental and Science and Technology,
40:21, pp. 6555-60.
Sussex Energy Group, UK, 2010, Sussex Energy Group UK http://www.sussex.ac.uk/sussexenergygroup/
SWMG , 2001, Smart Metering Working Group Report. Executive summary http://www.ofgem.gov.uk/Markets/RetMkts/Metrng/Documents1/1900-SmartReport.pdf
Telegraph,2010 http://www.telegraph.co.uk/travel/hubs/greentravel/739287/Flying-three-times-greener-than-cruising.html
Transport for London, 2006: Central London. Congestion charging. Impacts monitoring. Fourth Annual
Report, http://www.tfl.gov.uk/assets/downloads/FourthAnnualReportFinal.pdf.
Transport for London, 2008: Central London. Congestion charging. Impacts monitoring. Sixth Annual
Report, http://www.tfl.gov.uk/assets/downloads/sixth-annual-impacts-monitoring-report-2008-
07.pdf.
Tsao, H D Saunders, J R Creighton, M E Coltrin and J A Simmons; Journal of Physics D: Applied Physics 43
(2010) Solid-state lighting: an energy-economics perspective
Turner, K (2009), Negative rebound and disinvestment effects in response to an improvement in energy efficiency in the UK economy, Energy Economics, Volume 31, Issue 5, September 2009, Pages 648-666.
Turner, K. and Hanley, N. (2010) 'Energy efficiency, rebound effects and the Environmental Kuznets Curve', forthcoming in Energy Economics. Paper available by emailing [email protected].
Turner, K.(2009) Energy efficiency and the rebound effect, Fraser Economic Commentary, Vol. 33, No. 2, pp. 47-54. Fraser of Allander Institute, University of Strathclyde.
Turner, K., Allan, G., McGregor, P. and J.K. Swales (2009) Energy efficiency improvements and rebound effects: some lessons from the Scottish Case, Welsh Economic Review, Winter, 2009.
Turner, K., Anson, S., De Fence, J. and J.K. Swales (2010) Supply constraints on rebound effects from energy efficiency: negative multiplier and disinvestment effects, Fraser Economic Commentary, Vol. 33, No. 3. Fraser of Allander Institute, University of Strathclyde.
UK Department for Transport (2010): Reported Road Casualities Great Britain. Main results 2009. Department for Transport, Statistics Bulletin (10)17, http://www.dft.gov.uk/adobepdf/162469/221412/221549/227864/642978/rrcgbmain2009.pdf.
UK Department for Transport (2011): Think! Road Safety. http://www.dft.gov.uk/think/ Umweltbundesamt (2009), Abfallverbrennung ist kein Gegner der Abfallvermeidung, Germany.

in association with &
_____________________________________________________________________________________
110 European Commission DG ENV Addressing the Rebound Effect
UNEP (2000) Product Service Systems and Sustainability, UNEP, Interdepartmental Research Centre,
Innovation for the Environmental Sustainability (CIR.IS), International Institute for Industrial
Environmental Economics (IIIEE) ISBN:92-807-2206-9
UNEP (2003), Feed the World without Starving the Planet
UNEP (2010) Assessing the Environmental Impacts of Consumption and Production: Priority Products and
Materials, A Report of the Working Group on the Environmental Impacts of Products and Materials to
the International Panel for Sustainable Resource Management. Hertwich, E., van der Voet, E., Suh, S.,
Tukker, A., Huijbregts M., Kazmierczyk, P., Lenzen, M., McNeely, J., Moriguchi, Y.
UNEP, 2002, Sustainable Consumption, A global Status Report UNEP, 2005, Talk the Walk, Advancing Sustainable, Lifestyles through Marketing, and Communications,
Global Compact, Utopies Utopies-UNEP (2000), Utopies-UNEP /L.A. Greening et al. “Energy efficiency and consumption: the
rebound effect – a survey” Energy Policy 28 (2000) - CHECK REF van den Bergh,(2010) Energy Conservation More Effective With Rebound Policy, July 2010 ‘Environmental
and Resource Economics’ journal Victoria Transport Institute (2010), Rebound Effects, http://www.vtpi.org/tdm/tdm64.htm
Watson, 2009, “Consumers can sabotage energy-saving efforts,” USA Today, March 23, 2009. Wei, K (2010), A general equilibrium view of global rebound effects, Energy Economics, Volume 32, Issue 3,
May 2010, Pages 661-672. Weidema,B M Wesnæs, J Hermansen, T Kristensen, N Halberg, P Eder, L Delgado (2008) · Environmental
improvement potentials of meat and dairy products.
WHO Europe (2011): Table A: % of regular daily smokers in the population, age 15+. http://data.euro.who.int/hfadb/.
Worldwatch Institute, 2004, The state of consumption today by Gary Gardner, Erik Assadourian, and Radhika Sarinin in State of the World 2004
WRAP (2008), The Food we Waste – Food waste report v2. London
WRAP (2009), “Meeting the UK climate change challenge: The contribution of resource efficiency”,
November 2009
Wright, A. J. et al, 2000: A review of the energy efficiency and other benefits of advanced utility metering. for EA Technology.
Xerox, 2009, Xerox Environmental Report 2009, European Environment, Health & Safety Xerox corporate
site www.xltc.com/ehs/extehs.nst

in association with &
_____________________________________________________________________________________
European Commission DG ENV Addressing the Rebound Effect
111
ANNEX A: STAKEHOLDER QUESTIONS
The following project summary and questions were used for the stakeholder telephone interviews as well as email responses requested in wider calls for input. PROJECT SUMMARY: The Rebound Effect is an increase in consumption, which can occur as an unintended side-effect of the introduction of technology and policy instruments aimed at environmental efficiency improvements, in particular where gains bring reduced costs. Three main types of rebound effect have been identified – direct, indirect and economy wide. The existence and significance of the rebound effect in reality and how to address it is still hotly debated. This project is to determine the current thinking on the rebound effect, its impact on EU Sustainable Consumption and Production (SCP), waste and resource policies, and effective measures to address it that policy makers can use as needed. It is an independent assessment of evidence and expert stakeholder views. PROJECT TEAM: Global View Sustainability Services, Bio Intelligence Services and Ecologic Institute. EXPERT STAKEHOLDER INPUT: Expert Stakeholder views are key to informing this project and we would like your views on the following. If responding by email please put your answers below each question using as much space as you need.
● Do you agree the rebound effect exists (direct, indirect and/or economy wide) and how significant is it in reality?
ANSWER:
● Can the rebound effect (direct, indirect and economy wide) be accurately measured now or what more is required to enable this?
ANSWER:
● What are the links between the rebound effect and other factors causing consumption e.g. pricing, spending power?
ANSWER:
● If we internalised all environmental externality costs in prices in the future (e.g. for energy, water, materials, land use etc) would the rebound effect become irrelevant? If not why not? Is it possible to internalise all externalities?
ANSWER:
● What case examples illustrate the rebound effect associated with resource (energy, water, materials, land use), waste and Sustainable Consumption and Production instruments and technologies?
ANSWER:
● What measures can prevent / counteract the rebound effect in environmental policy making, and are you aware of any that have been successfully used? Some examples could be:-
● Incorporating the potential for rebound in the Design, Evaluation & Performance of Policy Instruments
● New Business Models e.g. Produce Service Systems
● Leveraging consumer behaviour change and shifts to sustainable lifestyles
● Awareness raising & education for business and consumers
● Technology & Innovation e.g. SMART metering
● Fiscal Instruments.
ANSWER:
● Can we include your name, organisation and information provided in a generic format (not personally attributed) in the project report?
ANSWER:
Please email your completed responses to [email protected]

in association with &
_____________________________________________________________________________________
112 European Commission DG ENV Addressing the Rebound Effect
ANNEX B: STAKEHOLDER RESPONDANTS
The stakeholders who provided input are listed below. For each their category and key topic area is
noted.
LAST NAME FIRST NAME
ORGANISATION CATEGORY TOPIC COUNTRY
Abelman
Jenny Energy Saving Trust
Policy Rebound acceptance in UK energy policy
UK
Alcott Blake Leeds University Academia Contributing author: The Myth of Resource Efficiency
UK
Barker Dr. Terry Cambridge Centre for Climate Change Mitigation Research (4CMR)
Academia Author: MacroEconomic Rebound Effect & UK Economy & Sceptic
UK
Bernasconi Nicolas GrDF – main French gas Distribution System Operator
Business ADEME/GrDF study on rebound in France
France
Brandao Miguel Joint Research Centre
Policy Measuring rebound Italy
Bouchereau Jean-Marie
ADEME Practitioner ADEME/GrDF study on rebound in France
France
Burger Andreas Federal Environment Agency
Policy Economic and Social Issues Relating to the Environment
Germany
Chene-Pezot
Anne ADEME Practitioner ADEME/GrDF study on rebound in France
France
Chiappini Mauro ArcelorMittal Business Sustainability solutions and R&D (steel production)
France
Ciroth Dr. Ing Andreas
Green Delta TC GmbH
Practitioner LCA Specialist Germany
Cotterill
Andy Defra Policy SCP policy economist UK
Collier Andrea Defra Policy Sustainable Behaviours UK
Dandres Thomas CIRAIG (Interuniversity Research Centre)
Academia Life Cycle of Products, Processes and Services
Canada
de Han van der Veg
Peter ETH Zurich Practitioner Swiss case example of preventing rebound when subsidising hybrid cars and using Household Expenditure Surveys for measuring rebound
Switzerland
Druckman
Dr. Angela
Centre for Environmental Strategy, University of Surrey
Academia Indirect and Economy wide rebound
UK
Fedrigo Doreen Institute for European
NGO Consumption & SCP EU

in association with &
_____________________________________________________________________________________
European Commission DG ENV Addressing the Rebound Effect
113
Environmental Policy
Fouquet Roger Basque Centre for Climate Change
Academia Rebound in lighting. Works with Jeff Tsao.
Spain
Gillespie Ed Futerra Green marketing
Green marketing UK
Girod Bastien University of Utrecht
Academia Hybrid cars and rebound effect Holland
Gonzalez Jaume Freire
ENT Environment & Management
Practitioner Econometric modelling Spain
Herring
Dr. Horace
Open University Academia Measuring Rebound UK
Jenkins Jesse Breakthough Institute
Academia Recent rebound R&D in USA USA
Jackson
Prof Tim University of Surrey
Academia Sustainable Behaviours UK
Korres Nicholas E.
Environmental Research Institute Cork
Academia Sustainable Energy Research Group (Bioenergy)
Ireland
Kurppa Prof Sirpa
MTT Agrifood Research Finland
Policy Bioeconomy Finland
Mazzenga Anthony GrDF – main French gas Distribution System Operator
Business ADEME/GrDF study on rebound in France
France
Nässén Jonas Chalmers University, Göteborg
academia Economics of resource efficiency Sweden
Nam Andrea DG Env (Water) Policy Rebound to be included in water framework review
Brussels
Nemoz Sophie Université Libre Bruxelles
Academia Rebound in Belgium project underway
Belgium
Norgard Jorgen Technical University of Denmark
Academia Economics of resource efficiency Denmark
Polimenti
John Albany College of Pharmacy & US EPA
Policy Author: The Myth of resource Efficiency (key rebound text)
USA
Reichel Almut European Environment Agency
Policy State of Env & Outlook 2010 Report
EU
Saunders
Dr. Harry
MD, Decision Processes Incorporated
Business Rebound study in 30 USA sectors, economics rebound toolkit, Author of “The Khazzoom-Brookes Postulate and Neoclassical Growth and co-author with Tsao on key lighting rebound study
USA
Schipper
Dr. Lee Stanford University Energy Efficiency Centre
Academia Editor - Energy Policy journal special rebound issue & sceptic
USA
Sonnemann Guido UNEP Policy Consumption & SCP International
Sorrell Prof UK Energy Academia Measuring Rebound, Impact on UK

in association with &
_____________________________________________________________________________________
114 European Commission DG ENV Addressing the Rebound Effect
Steve Research Centre Energy Policy SMART Metering
Speck Dr. Stefan
EEA Policy SCP R&D EU
Stahel Walter Product Life Institute
Practitioner PSS, Resource, Consumption links Switzerland
Tsao Jeff Sandia National Laboratories
Research centre
USA LED Lighting and increasing consumption
USA
Tucker Andrew EST Policy Water policy expert UK
Turner Dr. Karen University of Stirling
Academia Rebound effect and Economics (general & transport)
UK
Wallenborn Grégoire Université Libre Bruxelles
Academia Rebound Household/energy policy rebound in Belgium underway
Belgium
Weidema
Bo EcoInvent Practitioner Rebound in Food EU IMPRO (Meat/Dairy) & LCA
Denmark
Wirl Prof. Dr. Franz
Unversität Wien Academia Transport Austria
Yates Lucy Consumer Focus NGO Consumption UK

in association with &
_____________________________________________________________________________________
European Commission DG ENV Addressing the Rebound Effect
115
ANNEX C: STAKEHOLDER VIEWS (GENERIC)
The following are generic (not personally attributed) responses to the questions asked of stakeholders.
1. Do you agree the rebound effect exists (direct, indirect and/or economy wide) and how significant is it in reality?
● Yes – if energy efficiencies reduce price, producers and consumers will use more (of the
same or other services) and demand /consumption will increase. The significance at micro and macroeconomic levels is really the important issue.
● Yes – if consumers have more money then they will buy more goods rather than work less, learn languages or use other services, or even save money for retirement.
● Recognising the rebound effect where it exists does not mean that energy efficiency is not a valuable instrument. It means that efficiency improvements alone will not solve the underlying environmental problem in isolation.
● Rebound effects do exist and are a significant issue – failure to take them into account will likely contribute to the failure to meet energy and climate change targets.
● It is significant because the following rule of thumb holds: the rebound is relevant and substantial in those applications that are energy intensive (mobility, heating, cooling, warm water) and negligible in services with much less energy use (radio, TV, computers).
● The magnitude and importance of rebound effects is likely to vary widely from one situation to another. Also, the question should be plural - ‘rebound effects’ - rather than singular, since a number of mechanisms are involved.
● Yes rebound effects do exist but their magnitudes vary greatly according to type from very low to over 100%. They are of great significance in the long term and the wider the scale considered.
● Assertions that rebound effects are generally small (e.g. Amory Lovins) are not supported by the empirical evidence. However, the evidence and arguments used in support of the claim that rebound effects are generally greater than 100% (e.g. Len Brookes) remain insufficient to demonstrate its validity.
● Yes, the rebound effect exists and it can be very significant. In fact, it can lead to overall increases in energy use, beyond the intended savings.
● Indirect and economy wide rebounds are difficult to define, measure and counteract because normal market behaviour drives those and there is no policy tool to directly deal with those effects.
● Presently, only direct rebound can be measured at the micro level. That said, the fact that macro (indirect, economy-wide) rebound cannot be accurately measured doesn’t meant that it doesn’t exist.
● Economy-wide or ‘total’ rebound is about 100%, meaning that if a society technically or behaviourally finds ways of achieving a given level of utility (or amount of goods-and-services) with less natural-resource input, the natural resources that thus initially lie fallow are used for a combination of population growth and increased affluence (goods-and-services per person).
● No evidence appears of 100% direct or indirect rebound effects that would make any energy savings based policy ineffective. We should be careful not to send the wrong signal by encouraging doubtful opinions on energy policies. Correct evaluation of the rebound effect is clearly a good opportunity to limit scepticism on this matter.
● The rebound effect seems very dependent on the type of energy (gas and electricity versus fuel oil or wood).

in association with &
_____________________________________________________________________________________
116 European Commission DG ENV Addressing the Rebound Effect
● Rebound occurs because when we increase the efficiency with which we use energy (or any input/commodity), we lower its implicit price (i.e. we get more output/consumption per physical unit). So if there is any price responsiveness in the system at all, there will be pressure for rebound. However some supply responses (tightening of local energy supply as/if prices and quantity demanded drop) may constrain and even possibly entirely offset rebound.
● Yes all three types of rebound effect exist, with the impact of their existence quite significant in the real world - ranking from 10% to maybe beyond 100%. But the real problem arises when we try to implement the efficiencies into a conventional neoclassical economy with eternal growth as its overriding goal. In this case the efficiencies are for a long term consideration close to irrelevant, since they will only buy us time, before the eternal economic growth have eaten up the benefit.
● The rebound effect exists within our economic model/framework where growth is the underlying imperative and everything is geared towards more consumption and increased demand.
● It depends on the definition of “rebound effect”. This term can have different meanings in different disciplines.
● The rebound effect has high significance for policy making and for assessing mitigation potential.
● Yes, certainly it exists. But results should be interpreted with great care. ● The rebound effect is greater when there are huge increases in energy services and changes
in lifestyle (e.g. in the 19th century it was linked to transportation and lighting/heating and in the 21st century it is likely to be in ICT and computing). Sensitivity is much lower as the economy grows and services reach saturation.
● Direct, indirect, economy-wide and other types of rebound effect exist and they offset the expected savings of energy efficiency improvements, producing an increase in energy consumption in the long term in most cases.
● Without thoroughly greening the economy there will be rebound effects on all levels that destroy most of the efficiency gains.
● The impact of the rebound effect varies hugely depending on what activity takes place as a result of savings achieved.
● If a household were to put any savings they made from abatement activities into ‘green’ investments, the rebound may approach zero. Or if the money was invested in low carbon technology, it would be possible to achieve negative emissions, resulting in a negative rebound effect.
2. Can the rebound effect (direct, indirect and/or economy wide) be accurately measured now or what more is required to enable this?
● There are some accepted methodologies to approximate direct, indirect and economy-wide
rebound effect under several assumptions. However, even minor changes in these assumptions can affect dramatically the results.
● There are some qualitative and transformational changes related to the rebound effect that cannot be totally quantified using traditional methods.
● The rebound effect can be anticipated based on the understanding of stages of economical development and whether it is a ‘new’ use of service for which greater demand and thus greater rebound is likely.
● The scale of any given rebound effect rather than its precise measure is important because with elasticities greater than 0.5 then the energy efficiency improvements won’t actually lead to much reduction in energy consumption.
● The data should continue to come and should be sought but we should not stop policy

in association with &
_____________________________________________________________________________________
European Commission DG ENV Addressing the Rebound Effect
117
development because we do not have that data. Could work on companies/households level (e.g. SMART meter) to assess their consumption but that’s more Direct rebound. When it’s Indirect then it requires an intimate behaviour analysis, which would be difficult.
● If you accept the principle that the rebound effect exists and that our current economic framework helps create it then you should not wait for the data and stop policy development in the meantime but focus your actions on changing the framework.
● No, very few of the rebound effects can ever be measured accurately, but this does not disqualify them as important. It is not essential to spend research time to be able to measure the effect more accurately as long as we can agree it is there, and that it is in the rich countries significantly pulling in the wrong direction, without improving people’s satisfaction and happiness. In poor regions the productivity increase from the rebound effect can help spur the much needed development towards satisfying basic needs.
● For direct rebound you need to be able to estimate the price elasticities of demand to which the rebound is directly mapped. For economy-wide rebound modelling results depend crucially on how the specification of parameters such as energy supply and demand behaviour, price responsiveness throughout the system etc are set.
● Various methodologies may measure the rebound effect: global assessment using statistical trends, assessment of the difference between ex ante and ex post assessments, and measurement campaigns to collect data and to quantify specific rebound effects.
● While the theoretical quantity ‘engineering savings’ can be measured, tracing the indirect effects of rebound is Herculean. Rebound measurement tries to derive an extensive, or absolute, number from an intensive, relative number (ratio), therefore rebound calculation will always depend on assumptions or information about the numerator measuring efficiency change.
● Suggestion to improve measurement of rebound include improvement to household spending surveys to include physical amount they buy, ‘eco’ choices and price, and changes to LCA tools to incorporate rebound effects.
● Rebound effects can be measured precisely but not accurately, as a great degree of uncertainty is involved. Greater accuracy can be achieved by methodological developments and integration (e.g. consequential Life Cycle Assessment and Computable General or Partial Equilibrium models). Bottom up and top down approaches provide more accuracy but need more development.
● Accurate measurement of direct rebound effects hinges upon good time series data on the consumption and cost of energy services, which is lacking for most countries, sectors and services.
● Indirect rebound effects from behavioural changes or energy efficiency improvements by households can be estimated through a combination of econometric analysis of household behaviour and input-output modelling of the embodied energy of goods and services. There is considerable potential to improve the accuracy of estimates in this area.
● Economy-wide rebound effects need to be modelled rather than estimated. Despite the limitations of the various modelling tools, there is considerable scope for improving estimates and our understanding of the relative importance of different mechanisms.
● The easiest rebound effects to measure are direct ones due to a single end use of unvarying quality (e.g. lighting) whose use can be recorded. Where the quality (in terms of temperature, hours of use, or extent) can be varied by the user, such as with central heating or car use, it is far more difficult to determine rebound. All rebound measurements require extensive recording and measurement techniques, and specifying well-defined boundaries.
● It can be accurately measured, but more research directly measuring the rebound effect could lead to increased precision.
● There is inherent uncertainty to modelling as the model relies on certain assumptions. Modelling could be more accurate with narrower definition of the components.
● To overcome the inherent uncertainty of modelling it is possible to apply different modelling

in association with &
_____________________________________________________________________________________
118 European Commission DG ENV Addressing the Rebound Effect
approaches and see if they agree (e.g. general equilibrium model and simulation model). ● Fully controlled macro-economic experiments are impossible to carry out, so there are limits
to the accuracy of any measurement. ● It’s very good to attempt to measure it, but assumptions are key to determining the
accuracy of the model. ● The rebound effect is not just specific to the technology, but also to the region. ● Not many studies follow actual decisions, therefore limiting their accuracy. ● A sufficient database along with a coherent and comparable methodology is needed to
accurately measure the rebound effect. ● LCA approach should help measure the rebound effect but it has to do it in a very holistic
dimension and in time horizons depending on the time along which the rebound effects will be operating.
● A good methodology that measures direct and indirect rebound effect would be very helpful to evaluate efficiency oriented policies.
● It may be difficult to accurately measure a rebound effect because a lot of parameters may interact with it. General equilibrium economic model may be a good choice to take into account some of these parameters.
● Social research would give us some indication of peoples’ propensity to replace one spend with another, and their general attitude to savings achieved from energy efficiency for example. This would be a reasonable indication, and is likely to be consistent with social trends (e.g. spend patterns).
3. What are the links between the rebound effect and other factors causing consumption e.g. pricing, spending power?
● On the consumption side for energy there is a direct link to prices and spending power. Direct rebound is a price effect. Indirect rebound is an income effect (if there is still money left then there would be spending on other items). Economy-wide effects can also be understood as price and income effects.
● An assumption is implicit in this question, that the rebound is causing the consumption. Is rebound the cause or effect? This is not entirely clear.
● Rebound effect is always specific to one technology or one improvement. ● Consumers care about services and the quality of service, and these choices together with
choice of efficiencies depends on income, and prices for energy, quality and efficiency. ● The rebound effect and other factors causing consumption will vary between different
sectors and income groups. It is important for more attention to be paid to lower income consumers who may need to use the rebound effect to increase their levels of consumption so they can achieve basic needs such as a warm home. This is distinctly different to other consumer segments.
● ‘Rebound effects’ seems to be the special name given to the economic effects of change in energy consumption brought about by energy efficiency changes. These changes are not something that occurs just with energy, but occur with all factors of production. Energy efficiency improvements (or changes in energy prices) result in changes in the cost of energy services, and hence change in consumer demand, as it occurs with all commodities.
● Rebound effects are driven by the falling cost of energy services. Rising energy prices, for example of a consequence of carbon pricing, may reduce the magnitude of rebound effects.
● A key issue is the contribution that energy efficiency improvements (or more generally, increasing inputs of ‘useful work’) make to aggregate productivity and economic growth. This is an extremely complex question, but the mainstream view that energy plays a relatively unimportant role in economic growth may be incorrect.
● The links do exist. These are usually measured by price elasticities of supply and demand. ● The links are huge and strong. Our consumption is time constrained e.g. mobility: if you have

in association with &
_____________________________________________________________________________________
European Commission DG ENV Addressing the Rebound Effect
119
better highways, people will drive more. ● Education and culture explain why certain nations are more inclined to save money rather
than spend their disposable income. ● Rebound is best defined as consumption increase following an efficiency increase. ● Other factors seem to be correlated to rebound effects. For instance, low energy price
should cause direct rebound effect when high energy prices will cause indirect rebound effect.
● The rebound effects are likely to be greater in low income households because the initial spend on energy accounted for a larger share of income; however it may depend on e.g. habitual behaviour.
● The only way to avoid rebound effect is to not turn the productivity increase, whether caused by growing labour productivity or resource productivity, into more production and consumption, but into other benefits such as less work time (more freedom). Or lowering the labour productivity to balance out the growing resource productivity.
● Affluence is constantly being promoted and with increased population and more technology (efficiency gains and sometimes reduced prices) the impacts keep being pushed up.
● There are changes in taste and cultural patterns not linked to energy efficiency (e.g. fashions that take-off) but it would be challenging to capture and separate those out.
● The rebound effect is an example of different behavioural issues. ● Consumer expenditure links are important. ● Price is important, but also general mindset of people; often rebound effects are surprising
e.g. more car kilometres as people drive to recycling bins. ● Time (lifetime) has to be filled. Advertisement manipulates the desires. ● There could be a link around the notion of “budget for” e.g. for heating, for communicating,
for travelling, time budgets etc. This seems to address socio-economics issues at individual and collective level.
● The level of energy prices is not the only factor to explain consumption behaviours. Factors like environmental awareness, habits or life styles modify in the same order consumption behaviours, leading to a mitigation or more frequently an amplification of the rebound effect.
● Pricing and the relevant factors for the pricing policy (e.g. the market structure) are crucial for the extent of the direct rebound effects.
● An understanding of the basic factors influencing consumption patterns is a pre-requisite for understanding the rebound effect, because consumption of the revenue saved will likely follow the same pattern as normal spend. Depending on household income, spend will reflect firstly needs, and then wants, and the rebound spend would follow the same pattern.
● No further direct-rebound studies should be funded or done. Hundreds have been done, yet there is no way of using them to derive the environmentally relevant number, namely economy-wide rebound.
4. If we internalised all environmental externality costs in prices in the future (e.g. for energy, water, materials, land use etc) would the rebound effect become irrelevant? If not why not? Is it possible to internalise all externalities?
If you price externalities and you spend revenue on energy intensive activities you would increase rebound as you would be increasingly more productivity into the economy. The revenue would need to be spend on preservation of natural capital e.g. forests, wetlands or on cleaner cheaper energy. While this still drives energy demand it is not for fossil fuels.
● Internationalisation of externalities comes from constant learning of e.g. valuation of biodiversity and ecosystems. While you will never eliminate the rebound effect a shift of perception to rethink our economic framework and start to value nature would maximise

in association with &
_____________________________________________________________________________________
120 European Commission DG ENV Addressing the Rebound Effect
the internalisation. ● Taxation would need to be adapted to create a shift towards a wealth conserving economy
to include the absence of tax on renewable energy/resource, which includes human productivity (e.g. repair/re-manufacture).
● If all environmental externalities were internalised then yes, the rebound effect would be irrelevant in that case. That said, the uncertainties about the externalities are too great, making their full internalisation impossible.
● If all externalities were internalised, then prices would be much higher. This would fundamentally alter household and public budgets. As such, it is very difficult to predict what the results would be.
● No it is not possible. ● Focus needs to be on achieving the policy targets. Internalising externalities is a tool to
achieve policy goals. ● If new consumption is 100% environment friendly (cradle-cradle economy), rebound effect
doesn’t matter because it doesn’t lead to environmental impact. ● If we were to internalise the correct externalities (somehow) then we would also internalise
the externalities of the rebound effect, and hence, it would not be a rebound effect, but an alternative.
● Even if it was possible, people do not always consider prices they pay as the only factor that determines their behaviour, so even if everything was internalised, the rebound effect would not become irrelevant but somewhat smaller.
● Even if we managed to internalise all environmental externalities, there would remain other non-internalised cost (social, ethical), that would be linked to the rebound effect.
● The rebound effect could probably be reduced if externalities were internalised. Despite the comprehensive role environmental taxation should play in the future, the notion of internalisation of externalities is difficult to implement in practice and has some theoretical problems.
● It is not possible to internalise exactly all the externalities, since they are in principle impossible to evaluate. The life-cycle analysis to evaluate e.g. the environmental impact to provide a certain service constitutes an eternal row of factors.
● If efficiency increases as a result of internalisation, then there will still be a drop in the implicit price, driving a demand response and thus a rebound effect. However if users considered the full social cost of ‘rebounding’ then they may not do it.
● Event if energy prices were to take into account every externalities, the rebound effect would still persist and should be addressed with fine tuning tools.
● Even if prices reflected all externalities, any technological (or behavioural or organisational) efficiency increase would, by expanding the production possibilities frontier and/or lowering the relative price of the newly-more-efficiently-used resource, enable rebound consumption.
● No the rebound effect would still exist even if all environmental impacts are costed and internalised because if there is still a more efficient product that will cost less then more will be consumed.
● It is more meaningful to speak in terms of physical targets, such as a quantitative reduction in global carbon emissions by a certain date. This may be achieved through a mix of reducing the carbon intensity of energy supply, improving the efficiency of energy use and constraining the growth in demand for energy services. The latter is only necessary if - as suspected - a combination of the first two are insufficient.
● Rebound effects are commonly judged negatively as an unwanted outcome, since they reduce energy and carbon ‘savings’. But viewed another way, rebound effects are positive as they reflect greater consumption of the energy services that contribute to human welfare.
● Any ‘externality costs’ imposed would have to be constantly increased if it was desired to keep consumption stable (or reduce it), to keep pace with efficiency improvements.

in association with &
_____________________________________________________________________________________
European Commission DG ENV Addressing the Rebound Effect
121
● The rebound effect itself will not disappear (because the liberation or binding of scarce production or consumption factors is not removed by the internalisation), and is in this sense still relevant as a sociological phenomenon, but it becomes irrelevant from the perspective of sustainability assessment.
● Rebound effects can occur even in a situation of total internalisation. Internalisation and rebound effects must be seen as dynamic inter-related processes. Efficiency gains and rebound effects influence the need to internalise.
● Assessments of externalities rarely integrate the future sustainable development impacts, they are usually shorter term, and assessments of immediate impacts, and therefore they are limited in their impact.
5. What case examples illustrate the rebound effect associated with resource (energy, water, materials, land use), waste and Sustainable Consumption and Production instruments and technologies?
● New irrigation technologies allow expansion of agriculture into drier regions. This would be
an example of rebound in water. ● Rebound effect is another reason to strengthen environmental monitoring. ● Rebound effects related to scarcity of resources and wastes (or waste treatment capacity) as
production or consumption factors are generally short-term effects only and therefore irrelevant for sustainability assessments. The long-term effects of resource scarcity are already captured in the physical modelling in life-cycle based sustainability assessments and measured as the future loss of productivity.
● Any facet of electricity production and use illustrates the tremendous improvements in efficiency alongside great increases in consumption. Also consider IT, the internet and low-cost airlines. Also look at (obsolete) technologies where little improvements in efficiency resulted in stagnant or declining consumption (domestic coal fires, blacksmiths and many craft skills, sailing ships etc).
● Car transport is by far the best studied area for the direct rebound effects for energy efficiency improvements
● The promotion of biofuels by the EU’s Renewable Energy Directive (RED) is a clear example where the policy aiming at reducing greenhouse gas emissions may, in effect, result in higher emissions through indirect land-use change (which can be considered a rebound effect).
● Installing renewable energy, such as solar thermal panels, can lead to a raise in heating or domestic heated water consumption because one can think that his/her bill would be considerably lower and his/her environmental impact would be lower.
● The gap between expected and actual energy savings when energy efficiency increases will not only be due to rebound. There will also be issues such as whether equipment works as anticipated (i.e. in terms of the desired efficiency improvement actually being realised).
● The principle of the aggregates tax in the UK is to reduce the demand on virgin materials while the money raised is used to recycle aggregates at the same time: but are they selling more as a result?
● Historical examples include fret and passenger transportation in 18th/19th century, and lighting in 19th century. Huge increases in the demand associated with increases in energy efficiency led to increase in consumption and economy-wide effect.
● The improvement in efficiency in the use of paper through word processors has paradoxically increased the paper consumption all over the world.
● The improvement in car engines has increased the global consumption of fuel related with transport.
● A more efficient use of water in agriculture has extended the land dedicated to crop in many countries, using more water than estimated.

in association with &
_____________________________________________________________________________________
122 European Commission DG ENV Addressing the Rebound Effect
● More efficient packaging has led to a reduction in its production costs, and this has contributed to the widespread use of new forms of packaging, becoming one of the fastest growing fractions within municipal solid waste.
● Mechanising food processing and catering technologies have increased the amount of waste during processing and catering.
● Computers’ cost have been similar for the past decades although the components become cheaper and cheaper but people just want more computing power and features.
● If electric cars are implemented in Europe fuel will get relatively cheaper and will be consumed by developing countries.
● The rebound effect is clear at the micro level: users increase their spending on leisure as a result of increased energy efficiency, even if they didn’t know how much they were saving.
NB: A significant number of articles, reports and papers were also provided in answer to this question, and were taken into account in the review. All are listed in the References.
6. What measures can prevent / counteract the rebound effect in environmental policy making, and are you aware of any that have been successfully used? Some examples could be:- ○ Incorporating the potential for rebound in the Design, Evaluation & Performance of Policy
Instruments ○ New Business Models e.g. Produce Service Systems ○ Leveraging consumer behaviour change and shifts to sustainable lifestyles ○ Awareness raising & education for business and consumers ○ Technology & Innovation e.g. SMART metering ○ Fiscal Instruments.
● Lack of information is not always an issue when purchasing objects: consumers sometimes
decide to buy a gas-guzzling car or a large fridge actually because it consumes a lot. ● The main goal is to embed energy efficiency policy in a portfolio of other instruments, which
will lead to increases in unit prices sufficient to offset rebound. ● Clearly, an increase in tax is one option, but what would be done with the revenue from that
tax to prevent rebound at the level of the government? ● Short term: fiscal instruments; long term: awareness raising, education, behaviour. ● Rebound effect may not be described explicitly, but it is included in some calculations. It isn’t
that policy makers are afraid of it, they just don’t always notice it. ● Rebound can lead to an increase in welfare, for example, in helping the poor heat their
homes. Should we always aim to counteract rebound? Problem is not the rebound but not expecting it and not reaching the targets for reducing environmental impact.
● It may be that quotas/permits can mitigate the rebound effect. ● Obviously, the first step is to be aware of these effects, i.e. to include them in the
assessments and thereby in the decision-making/design process at all levels. ● If we wish to stabilise (or reduce) consumption then we must raise energy costs through
taxation (such as a carbon tax) or regulation (e.g. cap and trade schemes, personal carbon budgets).
● Energy efficiency measures make us richer, and these gains can be taxed away and the proceeds invested in low-carbon energy sources.
● There has been little systematic investigation of the potential effects of the instruments listed above on the rebound effects. Since carbon pricing is a necessary (but not sufficient condition) for mitigating rebound effects, implementation of such instruments in the absence of carbon pricing would be wholly ineffective.
● Life Cycle Assessment helps the avoidance of shifting burdens. Its use in policy is still in its infancy, though.

in association with &
_____________________________________________________________________________________
European Commission DG ENV Addressing the Rebound Effect
123
● The problem is that (for energy) the energy efficiency gains that produce the rebound effect also increase economic welfare. What you would like to find are ways to restrain energy consumption without reducing economic welfare.
● If insufficient clean, cheap, abundant energy supplies are not forthcoming, interventions (e.g. carbon taxes, regulations) that reduce energy consumption may be the only way. But they will come at the expense of economic activity with all the political and social ramifications. It is conceivable though that the drivers of rebound may actually make the economy more resilient to such interventions.
● You cannot prevent rebound fully as it is a feature of normal market behaviour. But you need to take it into account and select policies that do not make rebound worse.
● Efficiency increases, as well as behavioural change towards more ‘sufficiency’, would follow privately, automatically, and rapidly were caps/taxes enacted. Individuals and firms would make their own decisions on how to retain as much affluence/utility as possible with their new, lower resource budgets.
● Increase of energy prices thanks to energy or carbon taxes could counteract the rebound effect. Progressive prices or taxation structure would also help avoid theoretically impacts on fuel poor.
● Information for final consumers of the correct level of service (by example 19°C temperature set for space heating) and advices to correctly use equipments may limit the magnitude of the rebound effect.
● Anything that offsets the decrease in the implicit price of energy that triggers rebound will counteract it.
● Two ways to dampen energy efficiency rebound in the short term – 1. Raise the price of fuels so that the implicit price does not change (f politically feasible to raise the price of energy); 2 . Rationing energy supply e.g. Cap & Trade or SMART meters.
● It is essential to educate everybody from early childhood and onwards about the limits to growth on our final planet and the benefits of pursuing a steady state economy that can provide in an environmentally sustainable way a high quality of life to everybody, including business people and consumers.
● Creating of taxation and elimination of perverse subsidies (e.g. coal) are essential as well as seeking coherence between economic and environmental objectives.
● New business models (e.g. move to leasing) are about changing the profit model but their adoption is restricted as it is part of private companies’ decisions rather than the public policy framework.
● To what extent if you hinder people from having those services (e.g. cap on holidays) would you actually affect their happiness? However does consumption/shopping actually increase people’s happiness?
● The rebound effect is mainly caused by human nature, which can never be fully overcome. Designers and policy makers should be aware of it (and should have methods to understand it), and where relevant, effects should be internalised as much as possible to prevent some parts of the rebound effect.
● Rebound effects should generally be taken into account in environmental policy making, not only by designing the policy mix in an adequate way but also by formulating the goals in absolute terms and not only efficiency-oriented.
● To avoid economy wide rebound effects there is a need for a green budget reform. Tax burden should be shifted more to production factors that are prone to critical rebound effects (resources and especially energy) and away from production factors as labour. In addition governments spending activities should avoid or at least reduce an economy wide rebound effect and not increase resource use through its spending.

in association with &
_____________________________________________________________________________________
124 European Commission DG ENV Addressing the Rebound Effect
ANNEX D: STAKEHOLDER MEETING ADDRESSING THE REBOUND EFFECT IN POLICY STAKEHOLDER MEETING REPORT
DATE AND TIME: 28 February, 2011, 10-16:00 (Time zone: Brussels CET)
VENUE: DG INFSO, BU-25, European Commission, Ave de Beaulieu, Beaulieu, Brussels
1.0 INTRODUCTION & BACKGROUND
This is the summary report from this stakeholder meeting. The meeting is part of the Addressing the
Rebound Effect project http://rebound.eu-smr.eu carried out by a consortium of consultancy partners
(Global View Sustainability Services – Project Lead, BIO Intelligence Service and Ecologic Institute). This
project was commissioned by DG Environment, European Commission and is designed to identify the
state of the art evidence on rebound effects (RE) knowledge and ways to address it in environmental
policy. At the time of the meeting, the project is over midway through and the draft interim report has
been produced and is downloadable from http://rebound.eu-smr.eu. The next step is to finalise
recommendations for the Commission for addressing REs in policy and produce the final report.
The Aim of Meeting & Programme was designed to present and discuss with stakeholders the project
findings to date, some current EU based projects underway on RE and get stakeholder input in particular
on measures the Commission can take going forward to address RE.
This is a summary overview only and full details on the content are in the speaker presentations and
draft interim project report. It is generic and does not personally attribute any comments made.
2.0 ATTENDEES
This was a multi media meeting and colleagues attended in person as well as remotely by video and
telephone conferencing with webinar. The attendees’ list below includes all participants and their mode
of attendance.
Title Last Name First Name
Organisation
Mode of attendance
Mr Golde Michael Umweltbundesamt Deutschland, Germany In person
Mrs Fedrigo-Fazio Doreen Institute for European Environmental Policy In person
Dr Rettie Ruth Kingston University, UK In person
Mr Freire González
Jaume ENT Environment and Management In person
Ms Entacher Karoline EU Office of the Austrian Federal Economic Chamber, Austria
In person
Mr Struyf Igor Belgian Science Policy Office, Belgium In person
Dr Ruzzenenti Franco University of Siena, Italy In person

in association with &
_____________________________________________________________________________________
European Commission DG ENV Addressing the Rebound Effect
125
Title Last Name First Name
Organisation
Mode of attendance
Mr Basosi Riccardo University of Siena, Italy In person
Dr Baumann Leo Nokia In person
Mr Arditi Stephane European Environment Bureau (EEB) In person
Ms Vuerich Michela ANEC (The European consumer voice in standardisation)
In person
Mr GASC Emilien ANEC/BEUC (European Consumers Organisation)
In person
Prof. Kurppa Sirpa MTT Agrifood Research Finland In person
Mr von Tengg-Kobligk
Dietrich Forum Umwelt & Entwicklung In person
Mr Gammeltoft Peter DG ENV (HoU ENV D1), European Commission In person
Mr Dupuy Ludovic VESUVIUS GROUP In person
Dr Gossart Cédric Telecom Institute In person
Dr Druckman Angela University of Surrey, UK In person
Mr Geerken Theo VITO, Belgium In person
Dr Maxwell Dorothy Global View Sustainability Services, UK In person
Mr Muehmel Kurt BIO Intelligence Service, France In person
Dr Owen Paula Global View Sustainability Services, UK In person
Mr Throndsen William Norwegian University of Science and Technology
In person
Mr Neubauer Alexander Ecologic Institute, Germany In person
Ms Bouchereau Jean-Marie ADEME, France In person
Ms Dujin Anne CREDOC, France In person
Ms Nemoz Sophie Centre for Study on Sustainable Development - IGEAT - Free University of Brussels
In person
Dr De Haan Peter Ernst Basler + Partner AG, Switzerland In person
Mr Sonnemann Guido United National Environment Programme In person
Mr Wallenborn Gregoire Centre for Study on Sustainable Development - IGEAT - Free University of Brussels
In person
Mr Mudgal Shailendra BIO Intelligence Service, France In person
Mr Wejchert Jakub DG ENV -European Commission In person
Ms Zareba Elzbieta DG ENV -European Commission In person
Mr Le Grand Pascal DG ENV -European Commission In person
Ms Hijbeek Renske DG ENV -European Commission In person

in association with &
_____________________________________________________________________________________
126 European Commission DG ENV Addressing the Rebound Effect
Title Last Name First Name
Organisation
Mode of attendance
Ms Maffini Irene DG ENV -European Commission In person
Mr Vincent Gilles DG ENV -European Commission In person
Mr Aichinger Herbert DG ENV -European Commission In person
Mr Hudson Christian DG ENV -European Commission In person
Ms Vopel Carina DG ENV -European Commission In person
Mr Gruszkowski Patrice DG ENV -European Commission In person
Mr Lutzeyer Hans-Jörg DG RTD –European Commission In person
Mr Cotterill Andrew Dept of the Environment, Food & Rural Affairs UK
Telephone
Mr. Tucker Andrew Energy Saving Trust, UK Telephone (AM)
Dr Alles Carina Dupont, USA Telephone
Dr Veith Susanne Dupont, USA Telephone
Dr Harry Saunders Decision Processes Incorporated, USA Telephone
Mr Barr Steven DuPont, USA Telephone
Ms Azevedo Ines Carnegie Mellon University, USA Telephone
Ms Dunbabin Penny Dept for Energy & Climate Change (DECC), UK Telephone
Mr Preiss Philipp University of Stuttgart, Germany Telephone
Mr Brandão Miguel DG Joint Research Centre, Italy Telephone
Mr Speck Stefan European Environment Agency, Copenhagen Telephone
Mr Mayer Armin Institute for Building Efficiency, Belgium Telephone
Prof. Renn Ortwin University of Stuttgart, Germany (TBC) Telephone
Ms Vanassche Stella VITO, Belgium (TBC) Telephone
Dr Turner Karen University of Stirling, UK Video
Mr Nørgård Jørgen Technical Univ. of Denmark Video
3.0 SPEAKERS AND PRESENTATIONS The speaker biographies and presentations given can be downloaded from http://rebound.eu-smr.eu/meetings

in association with &
_____________________________________________________________________________________
European Commission DG ENV Addressing the Rebound Effect
127
4.0 PROGRAMME
09:30 Registration
10:00 Welcome, Chair (AM) Dr. Dorothy Maxwell, Global View Sustainability Services (GVSS)
10:05 Introduction Mr. Jakub Wejchert, DG Environment, European Commission
10:15 State of the Art on Rebound Effects, Project Team
Dr. Dorothy Maxwell & Dr. Paula Owen (GVSS), Mr. Kurt Muehmel (BIO), Mr. Alexander Neubauer (Ecologic Institute)
Rebound Effects: direct/indirect/economy wide
Significance for energy and wider resource policies & practical examples
Measuring Rebound Effects 10:45 Q&A
11:00 Addressing Rebound Effects in Environmental Policy, Project Team
11:30 Interpretations of the rebound effect at the Belgian Household Level Prof. Grégoire Wallenborn and Dr. Sophie Némoz, University of Brussels
12:00 Rebound Effects and the Role of Behavioural Mitigation Measures
Dr. Angela Druckman, Centre for Environmental Strategy, University of Surrey
12:30 Q&A and Discussion Forum:
Accounting for and Counteracting Rebound Effects
Use of Mixed Instruments (Fiscal, Technology, Behavioural)
13:00-14:15 Lunch
14:15 Welcome, Chair (PM) Dr. Paula Owen, GVSS
14:30 Understanding the Source, Potential Magnitude and Implications of Economy-Wide
Rebound Effects, Dr. Karen Turner, University of Stirling, UK
15:00 Q&A and Discussion Forum:
Improving how we measure rebound effects
Relevance of Rebound Effects in resource policies beyond energy
Next steps for R&D
15:45 - 16:00 Discussion Summary and Close
5.0 NOTES
5.1 Summary Content
After an introduction to the project and programme from the Project Consultancy lead and morning
Chair, the European Commission project lead gave an overview on the rationale for the project noting
that it was designed to inform the Resource Efficiency Roadmap 2020 the Commission are developing in
terms of practical policy measures, which can be taken as well as wider research gaps that needed to be
filled. The ongoing and sometimes controversial media interest in RE most recently in mainstream
publications e.g. Nature were noted. In addition to this meeting, the Commission will also include RE

in association with &
_____________________________________________________________________________________
128 European Commission DG ENV Addressing the Rebound Effect
presentations in the forthcoming EC Green Week 24-27 May 2011 to provide a platform for clarifying the
facts the project has gathered and expert views.
The presentations included:
State Of The Art on Rebound Effects in Environmental Policy, Dr. Dorothy Maxwell & Dr. Paula Owen (GVSS), Mr. Kurt Muehmel (BIO), Mr. Alexander Neubauer (Ecologic Institute)
The Project Team presented the findings from the project tasks conducted to date. This introduced the RE basics –What it is, Types of REs, Magnitude & Significance, How its measured and limitations as well as key gaps in the knowledge base. Case Examples of product and services where REs occur were used to illustrate.
Addressing RE in env policy, Project Team presented the evidence based measures for recognising
and accounting for REs in design, evaluation and performance monitoring of policies as well as
proposed measures for counteracting it including fiscal instruments, sustainable lifestyle
interventions designed to leverage behaviour change within the wider sustainable consumption
agenda and mixed instruments combing fiscal, technology and behavioural interventions. Case
examples of lighting, traffic decongestion and food illustrated how these could work in practice.
Presentations from 3 current EU based projects looking at REs & mitigation were as follows:-
o Interpretations of the rebound effect at the Belgian Household Level, Prof. Grégoire Wallenborn and Dr. Sophie Némoz, University of Brussels
This described the concepts behind the recently commenced HECoRE (Household Energy Consumption and Rebound Effect) project whose aim consists in studying the rebound effects linked to the increased efficiency of energy use by Belgian Households. It runs until 2012.
o Rebound Effects and the Role of Behavioural Mitigation Measures, Dr. Angela Druckman,
Centre for Environmental Strategy, University of Surrey
This described the role of behavioural mitigation measures for three household REs being
studied at the Centre for Environmental Strategy, University of Surrey, UK
o Understanding the Source, Potential Magnitude and Implications of Economy-Wide Rebound
Effects, Dr. Karen Turner, University of Stirling, UK
This described direct and economy wide RE associated with energy efficiency in industry sectors
of the Scottish economy, key factors influencing this and ways to improve its measurement and
mitigation.
To get stakeholder views, two discussion forums were conducted in the morning and afternoon and in
particular views were sought on recommendations for addressing REs that can inform the final project
stages and Commissions next steps post this project.

in association with &
_____________________________________________________________________________________
European Commission DG ENV Addressing the Rebound Effect
129
5.2 Key Discussion Topics
A summary of key issues noted by speakers and stakeholders in the discussion forums are outlined
below.
5.2 1 Rebound Effects Beyond those products and services where RE magnitudes are quantified it is important to
distinguish between RE caused by increased consumption and other factors driving consumption
increases beyond RE. The various causes of RE (behavioural, organisational, technological, etc.)
should be distinguished from the decrease in price associated with the efficiency, which is most
commonly understood to drive RE . Beyond energy efficiency RE, there is an evidence gap on REs
associated with wider resource policies relevant for SCP e.g. water and waste. This is a reflection of
the status of the topic. However, in theory the RE mechanism for energy efficiency is likely for other
resources where efficiencies are applied but the evidence is clear that the influencing factors that
determine the magnitude of the RE will vary with the resource intervention. Therefore it is not
appropriate to extrapolate energy efficiency RE magnitudes to other resource interventions. Factors
e.g. price, income, ease of substitution as well the other influencing factors will vary. Therefore these
are gaps that need to be measured for wider resource efficiency interventions beyond energy.
Rebound in the industrial sectors of the economy – for producing goods and services - can be quite
significant and is likely to be a larger problem than household related.
There is some limited evidence for direct RE associated with energy efficiencies in ICT. Given the
expansion of ICT across all so many sectors of the economy REs may be higher and is an area for
further research to understand the scale of ICT related REs fully.
For economy wide REs, in terms of influencing factors, the stronger the substitution effect the larger
REs become leading to what is described as backfire. However substitution effects would have to be
unfeasibly large to create backfire, and these strong substitution effects are unlikely to occur
frequently.
A more sophisticated understanding of key factors influencing economy wide REs in particular is
moving forward e.g. at University of Stirling where extensive modelling is taking place but further
detail is needed. Key areas are the role of trade – inter economy issues beyond one country that are
relevant to global energy markets, competitiveness and the key factors that can constrain REs.
For climate change and energy policy, IPCC projections will be difficult to attain due to REs and give
even less time for action.
Clarifying definitions and the toolbox for policy is key for moving forward and should build on key
milestone studies e.g. UKERC project.
5.2.2 Addressing Rebound Effects
The project team and speakers identified the following key measures for addressing rebound effects
based on evidence and stakeholder views. Due to energy efficiency related rebound effects being the
most well investigated to date the evidence based measures relate to this area.
Anticipating REs where evidence is clear they occur in the design, evaluation and performance
monitoring of interventions. This will avoid falling short of efficiency targets. The UK sets a EU

in association with &
_____________________________________________________________________________________
130 European Commission DG ENV Addressing the Rebound Effect
Member State precedent as direct RE are recognised and accounted for in policy by DECC. So far this
has been for comfort taking in home insulation interventions and can be built on.
Mixed fiscal, technology and behavioural mitigation measures with lighting and traffic decongestion
being good evidence based examples showing the potential mitigation opportunities.
Leveraging consumer behaviour change and driving wider sustainable consumption and growing
degrowth agendas. This should include increasing awareness on reducing the environmental burden
of consumer expenditure and savings.
Leveraging business behaviour change especially regarding the role of advertising influencing REs.
On R&D gaps, it is recognised that further developments are needed regarding data and modelling to
better understand REs and their influencing factors. CGE models are a particularly valuable key
development area. Researchers welcome the opportunity to interact with the policy community to
focus efforts in a productive way.
Policy makers wanted to know stakeholder views on moving forward with these measures to address RE
- moving beyond debate to action in both the short and long term. Stakeholders noted: -
It was early days in this field regarding understanding the implications of applying these measures to
address rebound effects.
Caution on use of fiscal instruments was noted given the social and economic implications of
increasing energy or other resource costs on developed and in particular developing countries.
However, the environmental implications of not doing this is a concern.
Taxes can stop the implicit price change causing direct REs but this brings distortions. However,
concerns regarding the use of fiscal measures may not be as bad as previously thought as the causes
of rebound may make the economy more resilient to carbon taxes/caps.
Internalisation of all externalities is unlikely to realise results but internalisation of some which are
targeted directly to REs would be more effective. There are precedents e.g. consumption of bottled
water where prices do not deter consumers.
For energy efficiency associated REs, the real solution is finding energy supply alternatives that are
clean, cheap and abundant. Promotion of clean technology is a key mitigating measure.
Considering the laws of thermodynamics, more complex systems are more efficient but use more
energy e.g. outsourcing in commercial freight transport. Reducing the complexity of the system is a
potential solution. There is also a trade-off between efficiency and power e.g. cars are more
efficient, but they are also more powerful.
Engaging business is key in their influencing role with consumption. The power of advertising e.g.
showing consumers in shorts all year round to encourage them to raise the temperature of their
homes plays a key role in causing “comfort taking” REs.
Green investment is a key mitigating measure. People can be motivated to save money more than
emissions. Consumer motivations for green investments and policies e.g. the UK Green Deal and
German EEG (renewable energy law) can be leveraged for this to play a role in avoiding indirect REs.
For example, EEG provides financial incentives for householders to invest in solar PV, which has been
successful to date.
One of the best aspects coming from the RE debate is the message that technical efficiency will not
be the whole solution.

in association with &
_____________________________________________________________________________________
European Commission DG ENV Addressing the Rebound Effect
131
On the sustainable consumption and growth agenda – we need to ask what is the goal of our
society? At present the priority is for maximum growth in consumption and production. This is a
conflict. Less working days and less productivity are important solutions as are lower environmental
impact activities e.g. spending time with family and potentially cultural (fine arts) vs. productive
related (commerce and industry).
From a policy perspective a green growth indicator is a productivity indicator (GDP/CO2). This can be
a direction for linking environmental and economic policy.
6.0 NEXT STEPS
The final project report is anticipated to be published at http://rebound.eu-smr.eu in approximately April
2011. The stakeholder meeting report will be included in this final report. Any stakeholders not wishing
to be listed should contact the project team at [email protected]
7.0 PROJECT CONTACT DETAILS
Project Contact: Dr. Dorothy Maxwell, Global View Sustainability Services
Addressing the Rebound Effect project: http://rebound.eu-smr.eu/
Email: [email protected]

in association with &
_____________________________________________________________________________________
132 European Commission DG ENV Addressing the Rebound Effect
ANNEX F: FAQ ON REBOUND EFFECTS
This FAQ contains basic facts on rebound effects for policy makers in order to overcome common misconceptions.
1.0 What Is the Rebound Effect?
The Rebound Effect is unexpected increases in consumption due to environmental efficiency interventions that can
occur through a price reduction (i.e. an efficient product being cheaper and hence more is consumed) or other
behavioural responses. There are three types recognised:-
Direct Rebound Effect - where increased efficiency and associated cost reduction for a product/service results
in its increased consumption because it is cheaper.
Indirect Rebound Effect – where savings from efficiency cost reductions enable more income to be spent on
other products and services.
Both direct and indirect rebound effects are microeconomic.
Economy wide Rebound Effect –where more efficiency drives economic productivity overall resulting in more
economic growth and consumption at a macroeconomic level.
The rebound effect is expressed as the percentage of expected savings “taken back” from the maximum efficiency
improvement that has been calculated for an intervention. For example, for home insulation where a 50% energy
efficiency improvement has been calculated, there is a direct rebound effect “take back” in energy savings of 15%.
This means the actual energy savings realised is only 35%. 15% of the expected energy efficiency improvement is
lost due to the direct rebound effect.
2.0 Is the Rebound Effect just academic speculation?
No, there is clear evidence for the rebound effect from energy efficiency interventions for transport (commercial
and passenger cars), energy services (commercial and household), household space heating/cooling, appliances and
lighting. The question is not about whether rebound exists or not, but to what degree and for what sector, products
& services and interventions.
3.0 What circumstances do rebound effects occur in?
Taking energy efficiency as an example, the trigger for the rebound effect is the fall in implicit price of energy (e.g.
the cost of energy to produce one unit of output) when efficiency is increased which stimulates demand in energy
production and consumption. If efficiency increases, there is drop in the implicit price, driving a demand response
in both producers and consumers.
4.0 How significant is the size of the rebound effect?
Assertions that rebound effects are generally small (Lovins, 1998 & 2005; Schipper, 2000) are not supported by
the empirical evidence and those that claim it is greater than 100% -called a “backfire” (Brookes,1990) remain
insufficient to demonstrate its validity (Sorrell, 2010). Some examples of magnitudes for direct rebound effects
from energy efficiency policies for developed countries are below:-
Household energy efficiency for space heating/ cooling, personal transport, white goods and lighting are
estimated in the range 10- 30% (Greening et al, 2000; Schipper and Grubb, 2000; UKERC, 2007; Sorrell, 2007;
Small and van Dender, 2007). This may be larger for households in developing countries and for producers
(Sorrell, 2007).
Lighting is estimated at 5-12% for private households and 0-2% for industry and commerce (IEA, 2005).
For commercial road transport, the rebound effect of fuel efficiency is 30 – 80 % (Gately 1990, Graham &
Glaister 2002, Anson & Turner 2009).

in association with &
_____________________________________________________________________________________
European Commission DG ENV Addressing the Rebound Effect
133
Indirect and Economy wide rebound effects are harder to define, measure and counteract and there is limited
evidence on magnitudes. However UK studies show economy wide rebound effects for energy efficiency
improvements are estimated to be smaller than direct rebound effects at approximately 10%, although some cases
show > 30% and one for energy efficiency interventions in the Scottish energy sector shows backfire over the long
term (Barker, 2005; Sorrell, 2007; Turner, 2010).
5.0 Why is there debate on the rebound effect and why do traditional energy policy studies e.g. the Stern Review and IPCC neglect it?
One of the reasons there is debate on the rebound effect is because it is hard to measure and varies depending on
the intervention (policy, technology, practice), the type of products/services/resources investigated (energy, food,
transport, etc.), as well as other related factors e.g. income level, productivity, price elasticity, saturation, location
and time (Sorrell, 2007; UKERC, 2007). This is one explanation proposed for why it is not currently factored into key
energy studies informing policy e.g. from IPCC), Stern Review or traditional energy economic models used for
energy policy modelling (Sorrell et al, 2010).
6.0 What are the implications for energy, climate change and wider SCP policy?
The existence of the rebound effect does not mean efficiency based policies and technologies are not valuable
instruments for environmental improvement, but rebound effect savings “taken back” should be accounted for
and addressed where it occurs. Where rebound effects are significant, efficiency policies need to be more
ambitious, and policies alone will not be sufficient (Sorrell, 2007). Other measures will be required, in particular
sustainable consumption focused interventions (EC, 2010).
For Energy and Climate Change policy, projections from the IPPC that by 2030, energy efficiency gains will
reduce global energy consumption by 30% below where they would otherwise be do not incorporate the
rebound effect. Many rebound effect publications cite this as a serious oversight in light of the evidence for
rebound effects for energy efficiency. Because of this, meeting GHG emissions targets by relying significantly
on energy efficiency gains are likely to fall short (Herring, 2008; Sorrell, 2010; Turner, 2010; Saunders, 2010;
Jenkins, 2010).
For wider SCP policies, the rebound effect can limit the environmental improvements possible through SCP
and sustainable products policies and technologies and, in particular, the goal of decoupling resource
consumption from economic growth (UNEP, 2005; Sorrell et al, 2010). However, at present there is very limited
evidence for the magnitude of rebound effects associated with resource policies beyond energy. This is simply
a reflection of the status of research on the topic. There is a clear evidence gap on the magnitude of rebound
effects for wider SCP policies (e.g. water) that needs to be filled.
7.0 What can policy makers do to address rebound effects?
Policy makers can recognise and account for RE when developing interventions and then incorporate measures to
address it directly as well as reinforcing wider measures to tackle increased consumption and cleaner resource and
energy technologies.
Recognising and Accounting for Rebound Effects: The UK government already recognises and accounts for
direct rebound effect take back in energy policies since 2010. Anticipation of rebound effects can be
incorporated in European Commission and wider Member State policy design and evaluation going forward. In
particular, efficiency targets will have to be set higher to include rebound effect take back.
Measures to address Rebound Effects: These include mixed instruments which integrate fiscal, technology and
behavioural interventions. These can constrain rebound effects to a certain extent but should ideally do this
without losing the economic welfare benefits that efficiency measures bring in the first place.