european and asian contribution to the genetic diversity
TRANSCRIPT
royalsocietypublishing.org/journal/rsos
ResearchCite this article: Herrera MB et al. 2020European and Asian contribution to the genetic
diversity of mainland South American chickens.
R. Soc. open sci. 7: 191558.http://dx.doi.org/10.1098/rsos.191558
Received: 26 September 2019
Accepted: 2 January 2020
Subject Category:Genetics and genomics
Subject Areas:genetics
Keywords:chickens, mitochondrial DNA, South America,
phylogeography
Author for correspondence:Jaime Gongora
e-mail: [email protected]
© 2020 The Authors. Published by the Royal Society under the terms of the CreativeCommons Attribution License http://creativecommons.org/licenses/by/4.0/, which permitsunrestricted use, provided the original author and source are credited.
†Contributed equally to this work.
Electronic supplementary material is available
online at https://doi.org/10.6084/m9.figshare.c.
4829577.
European and Asiancontribution to the geneticdiversity of mainland SouthAmerican chickensMichael B. Herrera1,2,†, Spiridoula Kraitsek3,†,
Jose A. Alcalde4, Daniel Quiroz5, Herman Revelo6,
Luz A. Alvarez6, Millor F. Rosario7, Vicki Thomson1,
Han Jianlin8,9, Jeremy J. Austin1 and Jaime Gongora3
1Australian Centre for Ancient DNA, School of Biological Sciences, University of Adelaide,Adelaide, Australia2Archaeological Studies Program, University of the Philippines Diliman, Quezon City,Philippines3Sydney School of Veterinary Science, Faculty of Science, University of Sydney, Sydney,Australia4Facultad de Agronomia e Ingenieria Forestal, Pontificia Universidad Catolica de Chile,Santiago, Chile5Dirección de Bibliotecas, Archivos y Museos-Proyecto Fondecyt, Santiago, Chile6Departamento de Ciencia Animal, Universidad Nacional de Colombia, sede Palmira,Colombia7Nature Science Center, Federal University of São Carlos, São Carlos, Brazil8CAAS-ILRI Joint Laboratory on Livestock and Forage Genetic Resources, Institute of AnimalScience, Chinese Academy of Agricultural Sciences (CAAS), Beijing, People’s Republic of China9Livestock Genetics Program, International Livestock Research Institute (ILRI), Nairobi, Kenya
MBH, 0000-0001-6548-0816; VT, 0000-0001-8368-9664;JJA, 0000-0003-4244-2942; JG, 0000-0003-2215-656X
Chickens (Gallus gallus domesticus) from the Americas havelong been recognized as descendants of European chickens,transported by early Europeans since the fifteenth century.However, in recent years, a possible pre-Columbianintroduction of chickens to South America by Polynesianseafarers has also been suggested. Here, we characterize themitochondrial control region genetic diversity of modernchicken populations from South America and compare this toa worldwide dataset in order to investigate the potentialmaternal genetic origin of modern-day chicken populationsin South America. The genetic analysis of newly generatedchicken mitochondrial control region sequences from SouthAmerica showed that the majority of chickens from thecontinent belong to mitochondrial haplogroup E. The restbelongs to haplogroups A, B and C, albeit at very low levels.
royalsocietypublishing.org2
Haplogroup D, a ubiquitous mitochondrial lineage in Island Southeast Asia and on Pacific Islands isnot observed in continental South America. Modern-day mainland South American chickens are,therefore, closely allied with European and Asian chickens. Furthermore, we find high levels ofgenetic contributions from South Asian chickens to those in Europe and South America. Ourfindings demonstrate that modern-day genetic diversity of mainland South American chickensappear to have clear European and Asian contributions, and less so from Island Southeast Asiaand the Pacific Islands. Furthermore, there is also some indication that South Asia has more geneticcontribution to European chickens than any other Asian chicken populations.
/journal/rsosR.Soc.open
sci.7:191558
1. IntroductionThe domestic chicken (Gallus gallus domesticus) is the world’s most ubiquitous and important bird species.It represents one of the main sources of animal protein around the world, thus it plays a major role in globalfood security. Furthermore, the socio-cultural role of the domestic chicken cannot be overemphasized [1].Despite this, our understanding of the chicken domestication process and global translocation historyremains incomplete. Chicken domestication potentially happened in several episodes involving one ormore wild progenitor species across a wide geographical region. Domestication probably involved theselection of desired traits and behaviour from a wild red junglefowl (RJF) progenitor (Gallus gallus).However, there are indications that this process also included hybridization of the red and greyjunglefowls (Gallus sonneratti) [2]. This complexity reflects the uncoordinated nature of manydomestication events performed by early human cultures. The subsequent translocation of the domesticchicken out of their domestication centres is nuanced by the protracted and complex movements(diaspora and trade) of humans across the globe, including those during the modern era.
The ultimate origin of today’s European domestic chickens is somewhere within the naturalbiogeographic range of junglefowls (i.e. G. gallus and G. sonneratti). This includes domestication centreswithin South and Southeast Asia [3], and potentially China [4]. A recent bioarchaeological study suggestsChina (as a region) represents the earliest site for chicken domestication [5], although this is controversial[6]. It is suggested that chickens reached Europe via trading networks from Asia either north throughChina and Russia [4] or south through Mesopotamia to Greece then westwards towards the rest ofEurope [7]. The economic exploitation of chickens is apparent between the fourth and second centuriesAD in the Southern Levant [8]. Archaeological chicken remains from Central Asia seem to indicate thatchickens arrived in Europe around 3000 BC. [4]. Domestic chickens then became well established inEurope during the Iron Age [9]. These early European chickens belong to mitochondrial haplogroup E[10], a genetic lineage that is ubiquitous today in the Indian subcontinent [3,11,12]. In Africa, the processand timing of domestic chicken introductions is less clear [13]. However, it is likely that East Africanchickens also originated directly from the Indian subcontinent [14,15]. From Europe, chickens are believedto have been brought to the New World during the early contact periods. However, a pre-ColumbianPolynesian introduction of chickens to the New World has been recently hypothesized [16–19].By contrast, chickens from the Pacific are thought to have a southeast Asian origin [20,21].
The potential for human interactions between Polynesia and South America during pre-Columbiantimes have long been a source of interest and controversy. These interactions potentially facilitated thetranslocations of species from the Pacific into South America and vice versa. Some species used toexamine the interactions between Polynesia and South America include the bottle gourd (Lagenariasiceraria) [22,23], sweet potato (Ipomoea batatas) [24–28] and domestic chicken [18,19,29,30]. While somestudies of these species have been used to infer a pre-Columbian contact between Polynesia and SouthAmerica, other studies dispute this [31–33]. A recent genome-wide study of sweet potato questionsthe existence of this contact [34]. Notwithstanding this debate, DNA analyses on translocated speciesremain helpful in studying movements where gene flow between human populations is minimal,absent, hard to study [16,35], or when archaeological evidence is unavailable.
Chickens from the Americas have long been considered as descendants of European chickens,brought by the early Europeans since the fifteenth century [7]. However, historical accounts describe ahigh degree of integration of chickens into Incan culture at the onset of European contact [36,37],suggesting an earlier introduction of chickens into South America. A pre-Colombian introductionfrom Polynesia has been suggested based on chicken mitochondrial DNA (mtDNA) [18]. However,subsequent work examining the relationships of continental South American and Pacific chickenschallenges this conclusion [20,33].
royalsocietypublishing.org/journal/rsosR.Soc.open
sci.7:193
Radiocarbon dates have also been used to suggest a pre-Columbian introduction of chickens to SouthAmerica [18], though there is also debate over the reliability of these radiocarbon dates [33]. The presenceof mtDNA haplogroup D in an early post-European Peruvian specimen has also been used to suggestchickens from this country may have originated from Polynesia during pre-Colombian times [19].Thus, the Americas may have experienced at least two translocations of chickens, initially by thePolynesians and subsequently by Europeans [19]. Haplotype E1 is ubiquitous worldwide andconsidered phylogeographically uninformative [33] and its presence in ancient Polynesian samples issuggested to be a result of laboratory contamination [20]. These issues have been discussedextensively in the literature [16,38,39].
A recent study comparing contemporary chickens from South America and the Iberian Peninsula(Spain and Portugal) suggests that the observed genetic differentiation between the two regions is dueto another (unsourced Asian) maternal source for South American chickens [40]. That study indicatesthat despite the global movement of chicken during modern times, the genetic patterns from theinitial translocation can still be inferred.
In this study, we extend both the South American and comparative sampling of the previous study tocharacterize the contemporary mtDNA control region (CR) DNA data from South America and compareto other chicken populations from across the globe (from Europe to Island and Mainland Southeast Asia,East Asia, the Pacific Islands, South Asia and Southwest Asia). We assess the ancestry of modern SouthAmerican chickens as a potential way to infer the colonization history of the continent by Europeans andlater trade networks with Asia.
1558
2. Methods2.1. Chicken samples, polymerase chain reaction and sequencingBlood samples were collected from a total of 229 native chickens from four South American countries(excluding Easter Island, which although it is a special territory of Chile, is considered to be culturallyaligned with the Pacific region): 30 from Brazil, 60 from Chile, 129 from Colombia and 10 from Peru.Blood samples were collected from the brachial vein of the wing and transferred to FTA cards(Qiagen, Hilden Germany). DNA was extracted using QIAamp DNA Investigator Kit (Qiagen,Hilden, Germany). The mtDNA CR was chosen as the target as it is highly polymorphic andphylogeographically informative [3,14,20,33,41]. The target region of mitochondrial hypervariableregion 1 was amplified using the following primer set: 50-AGGACTACGGCTTGAAAAGC-30 and50-ATGTGCCTGACCGAGGAACCAG-30. DNA was amplified using polymerase chain reaction (PCR)in 30 µl reaction volumes containing 50 mM KCl, 10 mM Tris–HCl (pH 8.3), 0.1% Triton X-100,1.5 mM MgCl2, 0.2 mM dNTPs, 0.1 µM concentrations of each primer, 1.25 units of Taq DNApolymerase (Promega) and 100–200 ng of template DNA. PCR cycling condition included an initialdenaturation of 94°C for 2 min, followed by 35 cycles of 25 s at 94°C, 35 s at 58°C, and 1 min 10 s at72°C, and a final extension for 10 min at 72°C. Sanger sequencing was conducted at the AustralianGenome Research Facility Ltd (AGRF) in Brisbane. The raw forward and reverse chromatograms wereassembled, edited and inspected by eye to give a consensus sequence of a 530 bp fragment for eachsample excluding primer sequences.
2.2. Sequence data, phylogenetic and population genetic analysesIn addition to the 229 control region sequences generated in this study, we included 2618 worldwidemtDNA control region sequences from GenBank to examine the relationship of mainland SouthAmerican chickens with those from South Asia (India, Bangladesh), Mainland Southeast Asia (MSEA:Laos, Myanmar, Thailand, Vietnam), Island Southeast Asia (ISEA: Indonesia, Philippines), PacificIslands (Fiji, Solomon Islands, Vanuatu, Easter Island), Central Asia (Azerbaijan, Turkmenistan), EastAsia (China, Korea) and Europe (electronic supplementary material, table SI 1). A total of 2827sequences were aligned using the MUSCLE [42] algorithm in Geneious v. 11.0.4 [43] and trimmed toproduce a final 412 bp fragment corresponding to mtDNA CR positions 93–504 of the referencesequence NC_007235 [44]. Truncation of the new sequences to the 412 bp fragment was made todirectly compare with the South American chicken samples from Luzuriaga-Neira et al. [40]. Thenumber and assignment of haplotypes of the 412 bp CR dataset was determined using DnaSP v. 6[45]. The haplogroup of the newly generated sequences were established by comparison with
royalsocietypublishing.org/journal/rsosR.Soc.open
sci.7:1915584
sequences of known haplogroup designation [3,12]. This was executed using a combination ofneighbour-joining (NJ) and median-joining (MJ) [46] analyses. jModelTest [47] was used to determinethe best-fit model for the CR dataset (TIM1 +G), this was performed through the CIPRES ScienceGateway [48], then an NJ tree was estimated using PAUP v. 4 [49]. The phylogenetic structure of theSouth American chicken sequences used in this study was also characterized by using the networkanalysis (MJ) implemented in PopART v. 1.7.1 [50]. The program Haplotype Viewer (http://www.cibiv.at/~greg/haploviewer) was also used to visualize the haplotype genealogies for the whole dataset.
The population genetic structure among the sampling locations was estimated using Slatkin’slinearized FST as implemented in Arlequin v. 3.5.2.2 (10 000 permutations) [51]. To visualize therelationships of the sampling populations, the FST scores were ordered into principal coordinateanalysis (PCoA) plots using GenAlEx v. 6.503 [52]. This analysis was initially performed for allpopulations included in the study. By removing the outliers in PC1 of this PCoA plot (responsible forapprox. 30% of variation explained by PC1), we generated a second PCoA plot to investigate whichgeographical regions the South American chickens are most allied with. Population genetic structurewas further investigated using analysis of molecular variance (AMOVA) as implemented by Arlequinv. 3.5.2.2 [51]. The groupings used in the AMOVA compared chicken populations from seven regionsincluding South America, ISEA-Pacific, MSEA, South Asia, Europe and Central Asia. The differentpopulation hypotheses were tested initially using the overall dataset assuming no groups andhierarchically comparing populations from different geographical regions indicated previously.Significance testing was done using 10 000 coalescent simulations in Arlequin v. 3.5.2.2 [51]. Intra-population genetic variability statistics (i.e. segregating sites, number of haplotypes, haplotype andnucleotide diversities) were also calculated using DnaSP v. 6 [45].
3. Results and discussionA previous mtDNA study revealed nine divergent haplogroups (A–I) of chickens from across the world[3]. A more fine-grained mtDNA genome phylogeny study revealed an additional four haplogroups(W–Z) [12]. Haplogroup A and B are predominantly found among southern and eastern Chinese andJapanese chickens as well as wild RJF. Haplogroup C is found mainly in Japanese and southeastChinese chickens. Haplogroup D is found in Japanese, southeast Chinese, Mainland Southeast Asianand Pacific chickens. Haplogroup E is widespread among Indian, Middle Eastern and Europeanchickens.
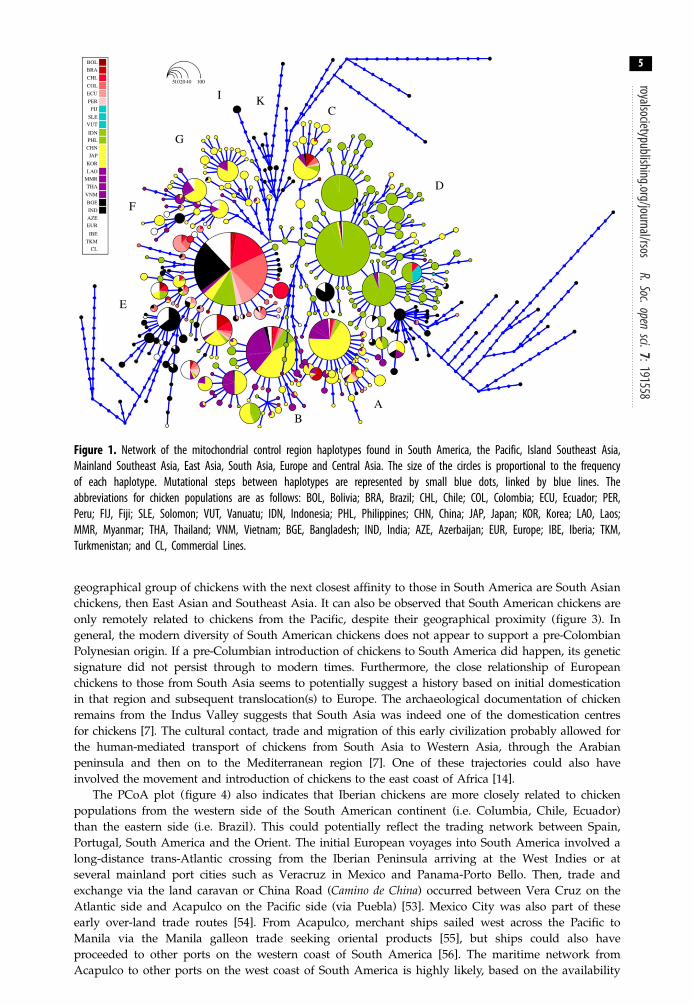
Five of these haplogroups (A–E) are relevant to the present study as they are found in SouthAmerican chickens (figure 1). Haplogroup D has not been found in modern South American chickensin this study. Haplogroup E is the most predominant mitochondrial CR region lineage observed inSouth America comprising 83.96% of all chickens on the continent (table 1). Haplogroups A (7.35%),B (4.68%) and C (4.00%) are also observed in modern South American chickens, albeit at very lowfrequencies. All four of these haplogroups are related to those found in Asian and European chickenpopulations.
Haplogroup E is also the most dominant haplogroup observed across each of the South Americancountries we studied (i.e. Bolivia, Brazil, Chile, Ecuador and Peru). Given the high frequency of thishaplogroup in Europe along with the historical records and observations that Spanish and Portuguesebrought chickens to the Americas [36], Europe may be the more likely source of modern chickens inSouth America. The most ubiquitous haplogroup E lineage in South America is haplotype 107(haplotype E1; figure 2). It is observed in all the South American populations in this study. Thishaplotype potentially represents the founding haplotype brought by the Europeans. Furthermore,haplotype 107 is the lineage observed in archaeological chickens in Europe [10].
The presence of haplogroups A, B and C in South American chickens could represent subsequentintroductions from Asian into the South American populations. Haplogroup D profiles are notobserved in modern South American chickens from the mainland. Rather, haplogroup D is thedominant haplogroup in the Pacific Island [20] and Island Southeast Asian [14] chickens. Thus, thispotentially indicates that the translocation history of haplogroup D chickens from Island SoutheastAsia into the Pacific islands did not include the successful introduction of Polynesian chickens intocontinental South America.
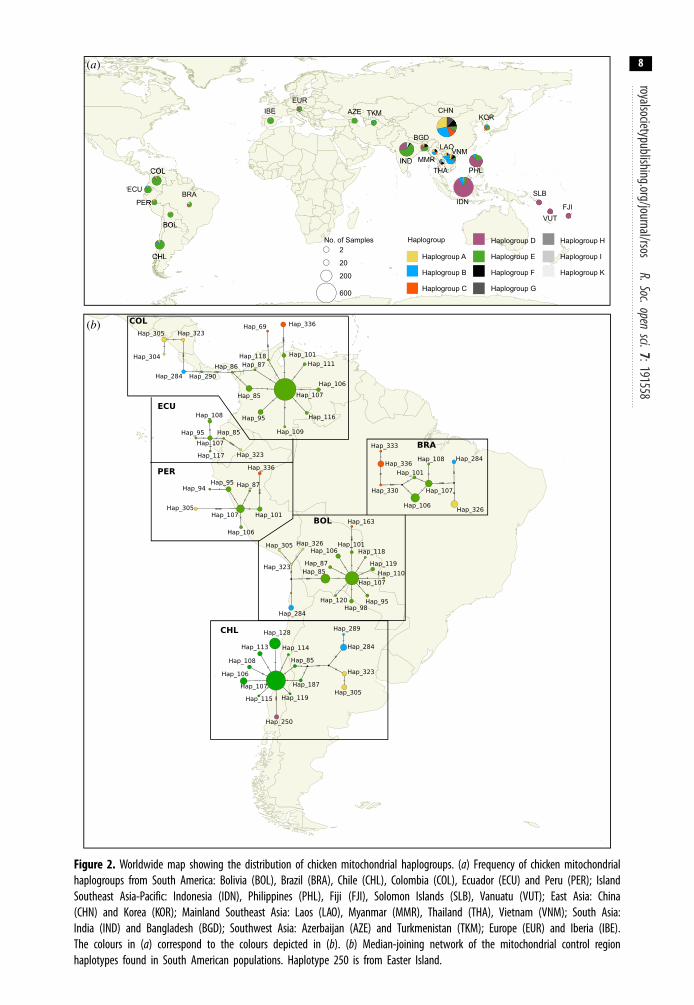
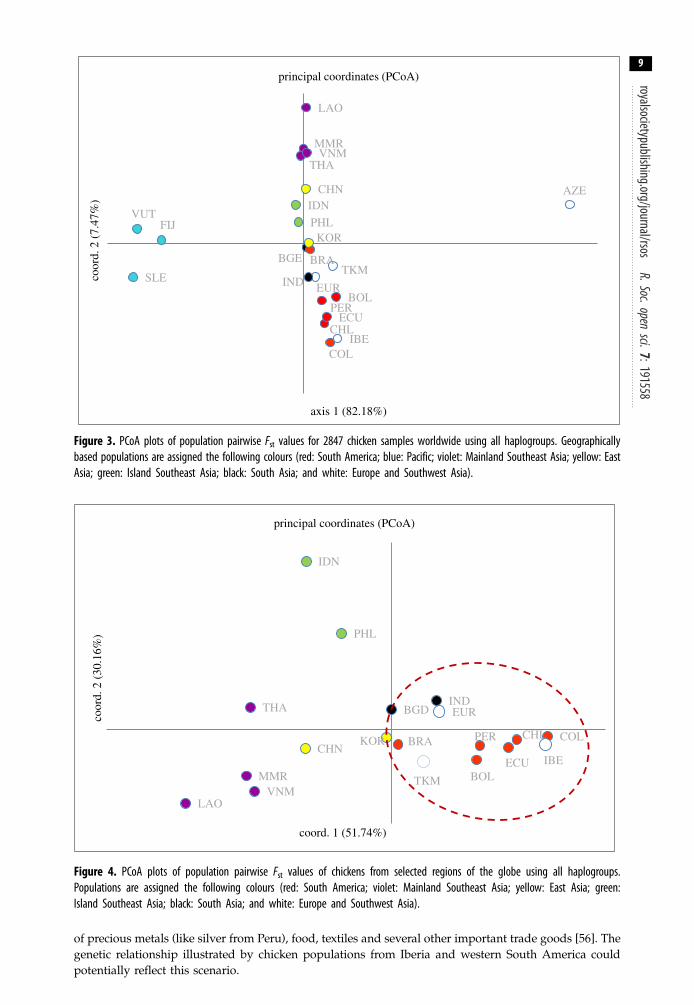
The PCoA analyses (figures 3 and 4) shows that the genetic relationship of South American chickensis largely allied with European populations in comparison to other parts of the world. In particular, thisaffinity is more pronounced with chickens from the Iberian Peninsula (i.e. Portugal and Spain). The
510
BOL
BRA
CHL
COL
ECU
PER
FIJ
SLE
VUT
IDNPHL
CHN
JAP
KOR
LAOMMR
THA
VNM
BGE
IND
AZEEUR
IBE
TKMCL
20 40 100
I KC
D
AB
E
F
G
Figure 1. Network of the mitochondrial control region haplotypes found in South America, the Pacific, Island Southeast Asia,Mainland Southeast Asia, East Asia, South Asia, Europe and Central Asia. The size of the circles is proportional to the frequencyof each haplotype. Mutational steps between haplotypes are represented by small blue dots, linked by blue lines. Theabbreviations for chicken populations are as follows: BOL, Bolivia; BRA, Brazil; CHL, Chile; COL, Colombia; ECU, Ecuador; PER,Peru; FIJ, Fiji; SLE, Solomon; VUT, Vanuatu; IDN, Indonesia; PHL, Philippines; CHN, China; JAP, Japan; KOR, Korea; LAO, Laos;MMR, Myanmar; THA, Thailand; VNM, Vietnam; BGE, Bangladesh; IND, India; AZE, Azerbaijan; EUR, Europe; IBE, Iberia; TKM,Turkmenistan; and CL, Commercial Lines.
royalsocietypublishing.org/journal/rsosR.Soc.open
sci.7:1915585
geographical group of chickens with the next closest affinity to those in South America are South Asianchickens, then East Asian and Southeast Asia. It can also be observed that South American chickens areonly remotely related to chickens from the Pacific, despite their geographical proximity (figure 3). Ingeneral, the modern diversity of South American chickens does not appear to support a pre-ColombianPolynesian origin. If a pre-Columbian introduction of chickens to South America did happen, its geneticsignature did not persist through to modern times. Furthermore, the close relationship of Europeanchickens to those from South Asia seems to potentially suggest a history based on initial domesticationin that region and subsequent translocation(s) to Europe. The archaeological documentation of chickenremains from the Indus Valley suggests that South Asia was indeed one of the domestication centresfor chickens [7]. The cultural contact, trade and migration of this early civilization probably allowed forthe human-mediated transport of chickens from South Asia to Western Asia, through the Arabianpeninsula and then on to the Mediterranean region [7]. One of these trajectories could also haveinvolved the movement and introduction of chickens to the east coast of Africa [14].
The PCoA plot (figure 4) also indicates that Iberian chickens are more closely related to chickenpopulations from the western side of the South American continent (i.e. Columbia, Chile, Ecuador)than the eastern side (i.e. Brazil). This could potentially reflect the trading network between Spain,Portugal, South America and the Orient. The initial European voyages into South America involved along-distance trans-Atlantic crossing from the Iberian Peninsula arriving at the West Indies or atseveral mainland port cities such as Veracruz in Mexico and Panama-Porto Bello. Then, trade andexchange via the land caravan or China Road (Camino de China) occurred between Vera Cruz on theAtlantic side and Acapulco on the Pacific side (via Puebla) [53]. Mexico City was also part of theseearly over-land trade routes [54]. From Acapulco, merchant ships sailed west across the Pacific toManila via the Manila galleon trade seeking oriental products [55], but ships could also haveproceeded to other ports on the western coast of South America [56]. The maritime network fromAcapulco to other ports on the west coast of South America is highly likely, based on the availability
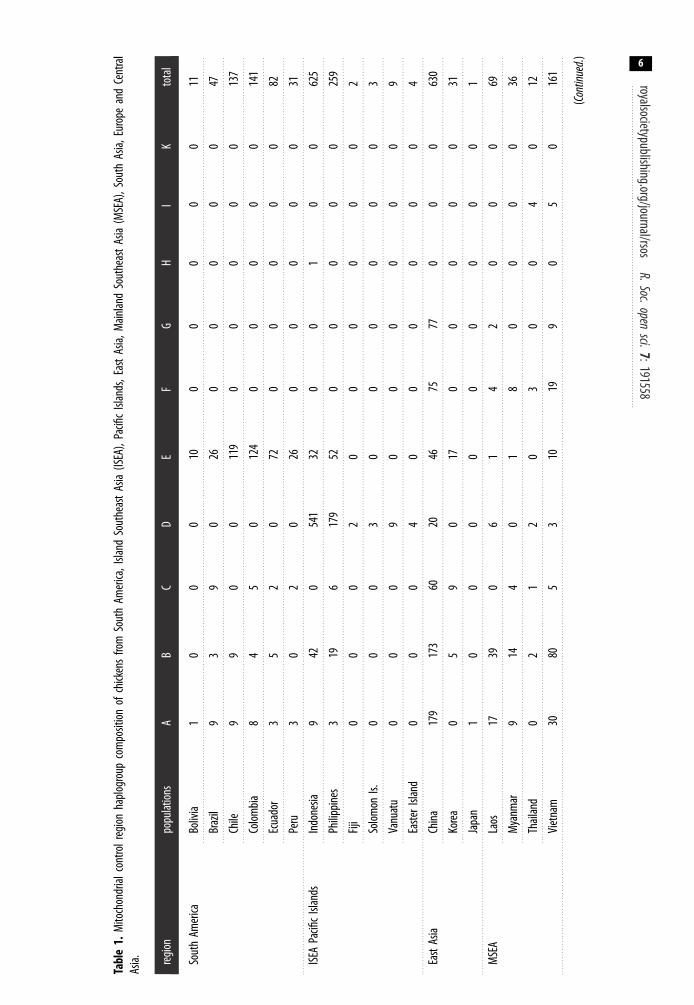
Table1.Mitochondrial
controlregion
haplogroup
composition
ofchickensfromSouthAm
erica,Island
SoutheastAsia(ISEA),PacificIslands,EastAsia,
MainlandSoutheastAsia(MSEA),SouthAsia,
Europe
andCentral
Asia. region
populations
AB
CD
EF
GH
IK
total
SouthAm
erica
Bolivia
10
00
100
00
00
11
Brazil
93
90
260
00
00
47
Chile
99
00
119
00
00
0137
Colombia
84
50
124
00
00
0141
Ecuador
35
20
720
00
00
82
Peru
30
20
260
00
00
31
ISEAPacificIslands
Indonesia
942
0541
320
01
00
625
Philippines
319
6179
520
00
00
259
Fiji
00
02
00
00
00
2
Solomon
Is.0
00
30
00
00
03
Vanuatu
00
09
00
00
00
9
EasterIsland
00
04
00
00
00
4
EastAsia
China
179
173
6020
4675
770
00
630
Korea
05
90
170
00
00
31
Japan
10
00
00
00
00
1
MSEA
Laos
1739
06
14
20
00
69
Myanm
ar9
144
01
80
00
036
Thailand
02
12
03
00
40
12
Vietnam
3080
53
1019
90
50
161
(Continued.)
royalsocietypublishing.org/journal/rsosR.Soc.open
sci.7:1915586
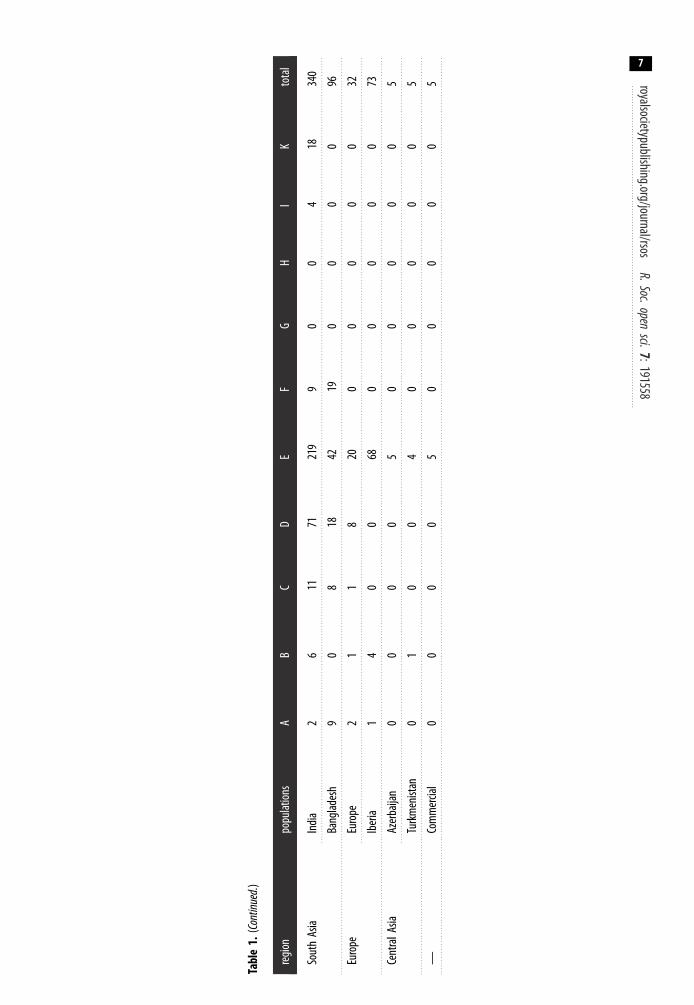
Table1.(Continued.)
region
populations
AB
CD
EF
GH
IK
total
SouthAsia
India
26
1171
219
90
04
18340
Bangladesh
90
818
4219
00
00
96
Europe
Europe
21
18
200
00
00
32
Iberia
14
00
680
00
00
73
CentralAsia
Azerbaijan
00
00
50
00
00
5
Turkmenistan
01
00
40
00
00
5
—Commercial
00
00
50
00
00
5 royalsocietypublishing.org/journal/rsosR.Soc.open
sci.7:1915587
(a)
(b)
Figure 2. Worldwide map showing the distribution of chicken mitochondrial haplogroups. (a) Frequency of chicken mitochondrialhaplogroups from South America: Bolivia (BOL), Brazil (BRA), Chile (CHL), Colombia (COL), Ecuador (ECU) and Peru (PER); IslandSoutheast Asia-Pacific: Indonesia (IDN), Philippines (PHL), Fiji (FJI), Solomon Islands (SLB), Vanuatu (VUT); East Asia: China(CHN) and Korea (KOR); Mainland Southeast Asia: Laos (LAO), Myanmar (MMR), Thailand (THA), Vietnam (VNM); South Asia:India (IND) and Bangladesh (BGD); Southwest Asia: Azerbaijan (AZE) and Turkmenistan (TKM); Europe (EUR) and Iberia (IBE).The colours in (a) correspond to the colours depicted in (b). (b) Median-joining network of the mitochondrial control regionhaplotypes found in South American populations. Haplotype 250 is from Easter Island.
royalsocietypublishing.org/journal/rsosR.Soc.open
sci.7:1915588
AZE
BGE
BOL
BRA
CHL
CHN
COL
ECU
EUR
FIJ
IBE
IND
IDN
KOR
LAO
MMR
PER
PHL
SLE
THA
TKM
VUT
VNM
coor
d. 2
(7.
47%
)
axis 1 (82.18%)
principal coordinates (PCoA)
Figure 3. PCoA plots of population pairwise Fst values for 2847 chicken samples worldwide using all haplogroups. Geographicallybased populations are assigned the following colours (red: South America; blue: Pacific; violet: Mainland Southeast Asia; yellow: EastAsia; green: Island Southeast Asia; black: South Asia; and white: Europe and Southwest Asia).
BGD
BOL
BRA CHLCHN
COL
ECU
EUR
IBE
IND
IDN
KOR
LAO
MMR
PER
PHL
THA
TKMVNM
coor
d. 2
(30
.16%
)
coord. 1 (51.74%)
principal coordinates (PCoA)
Figure 4. PCoA plots of population pairwise Fst values of chickens from selected regions of the globe using all haplogroups.Populations are assigned the following colours (red: South America; violet: Mainland Southeast Asia; yellow: East Asia; green:Island Southeast Asia; black: South Asia; and white: Europe and Southwest Asia).
royalsocietypublishing.org/journal/rsosR.Soc.open
sci.7:1915589
of precious metals (like silver from Peru), food, textiles and several other important trade goods [56]. Thegenetic relationship illustrated by chicken populations from Iberia and western South America couldpotentially reflect this scenario.
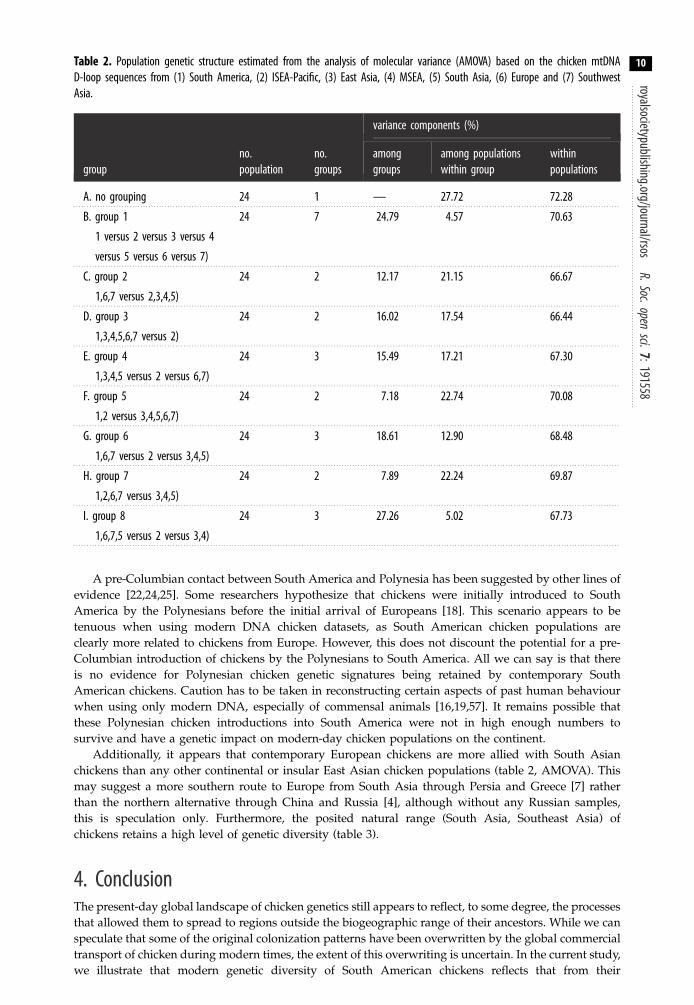
Table 2. Population genetic structure estimated from the analysis of molecular variance (AMOVA) based on the chicken mtDNAD-loop sequences from (1) South America, (2) ISEA-Pacific, (3) East Asia, (4) MSEA, (5) South Asia, (6) Europe and (7) SouthwestAsia.
groupno.population
no.groups
variance components (%)
amonggroups
among populationswithin group
withinpopulations
A. no grouping 24 1 — 27.72 72.28
B. group 1
1 versus 2 versus 3 versus 4
versus 5 versus 6 versus 7)
24 7 24.79 4.57 70.63
C. group 2
1,6,7 versus 2,3,4,5)
24 2 12.17 21.15 66.67
D. group 3
1,3,4,5,6,7 versus 2)
24 2 16.02 17.54 66.44
E. group 4
1,3,4,5 versus 2 versus 6,7)
24 3 15.49 17.21 67.30
F. group 5
1,2 versus 3,4,5,6,7)
24 2 7.18 22.74 70.08
G. group 6
1,6,7 versus 2 versus 3,4,5)
24 3 18.61 12.90 68.48
H. group 7
1,2,6,7 versus 3,4,5)
24 2 7.89 22.24 69.87
I. group 8
1,6,7,5 versus 2 versus 3,4)
24 3 27.26 5.02 67.73
royalsocietypublishing.org/journal/rsosR.Soc.open
sci.7:19155810
A pre-Columbian contact between South America and Polynesia has been suggested by other lines ofevidence [22,24,25]. Some researchers hypothesize that chickens were initially introduced to SouthAmerica by the Polynesians before the initial arrival of Europeans [18]. This scenario appears to betenuous when using modern DNA chicken datasets, as South American chicken populations areclearly more related to chickens from Europe. However, this does not discount the potential for a pre-Columbian introduction of chickens by the Polynesians to South America. All we can say is that thereis no evidence for Polynesian chicken genetic signatures being retained by contemporary SouthAmerican chickens. Caution has to be taken in reconstructing certain aspects of past human behaviourwhen using only modern DNA, especially of commensal animals [16,19,57]. It remains possible thatthese Polynesian chicken introductions into South America were not in high enough numbers tosurvive and have a genetic impact on modern-day chicken populations on the continent.
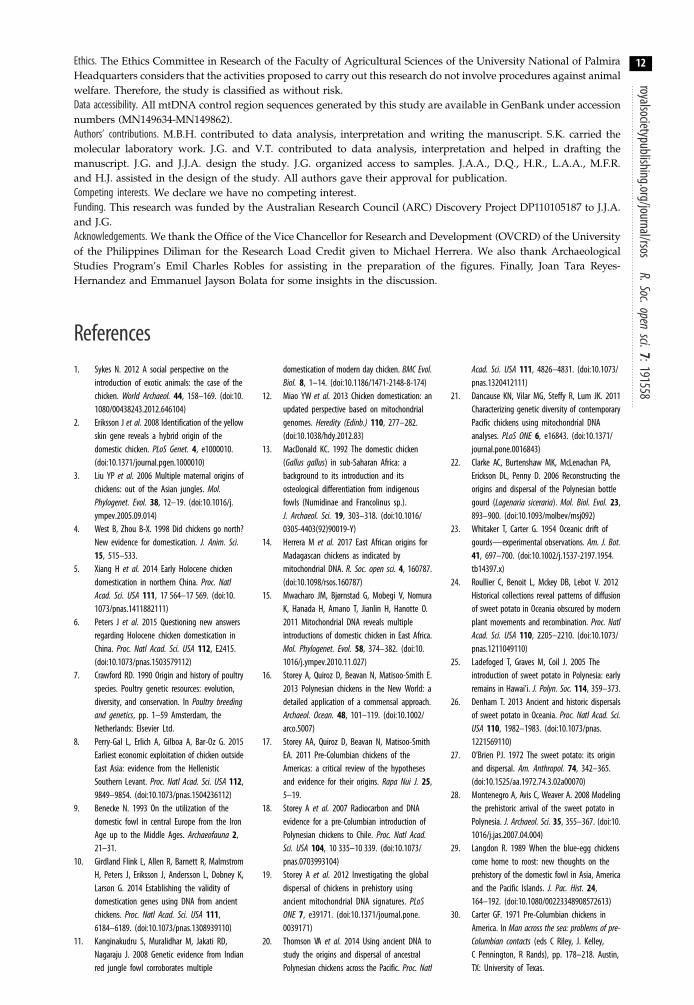
Additionally, it appears that contemporary European chickens are more allied with South Asianchickens than any other continental or insular East Asian chicken populations (table 2, AMOVA). Thismay suggest a more southern route to Europe from South Asia through Persia and Greece [7] ratherthan the northern alternative through China and Russia [4], although without any Russian samples,this is speculation only. Furthermore, the posited natural range (South Asia, Southeast Asia) ofchickens retains a high level of genetic diversity (table 3).
4. ConclusionThe present-day global landscape of chicken genetics still appears to reflect, to some degree, the processesthat allowed them to spread to regions outside the biogeographic range of their ancestors. While we canspeculate that some of the original colonization patterns have been overwritten by the global commercialtransport of chicken during modern times, the extent of this overwriting is uncertain. In the current study,we illustrate that modern genetic diversity of South American chickens reflects that from their
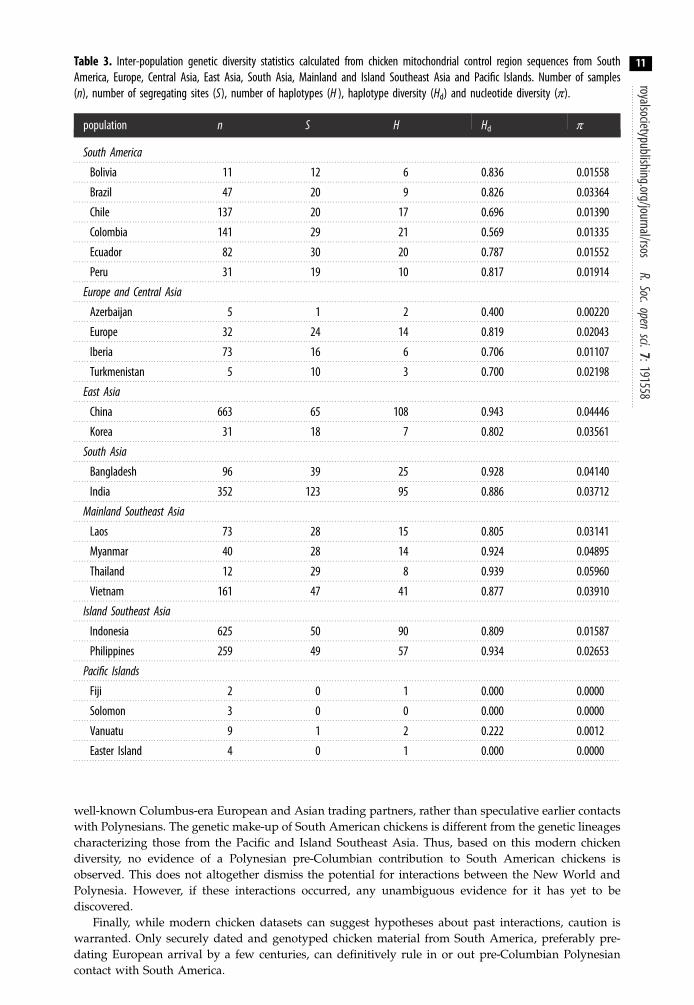
Table 3. Inter-population genetic diversity statistics calculated from chicken mitochondrial control region sequences from SouthAmerica, Europe, Central Asia, East Asia, South Asia, Mainland and Island Southeast Asia and Pacific Islands. Number of samples(n), number of segregating sites (S), number of haplotypes (H ), haplotype diversity (Hd) and nucleotide diversity (π).
population n S H Hd π
South America
Bolivia 11 12 6 0.836 0.01558
Brazil 47 20 9 0.826 0.03364
Chile 137 20 17 0.696 0.01390
Colombia 141 29 21 0.569 0.01335
Ecuador 82 30 20 0.787 0.01552
Peru 31 19 10 0.817 0.01914
Europe and Central Asia
Azerbaijan 5 1 2 0.400 0.00220
Europe 32 24 14 0.819 0.02043
Iberia 73 16 6 0.706 0.01107
Turkmenistan 5 10 3 0.700 0.02198
East Asia
China 663 65 108 0.943 0.04446
Korea 31 18 7 0.802 0.03561
South Asia
Bangladesh 96 39 25 0.928 0.04140
India 352 123 95 0.886 0.03712
Mainland Southeast Asia
Laos 73 28 15 0.805 0.03141
Myanmar 40 28 14 0.924 0.04895
Thailand 12 29 8 0.939 0.05960
Vietnam 161 47 41 0.877 0.03910
Island Southeast Asia
Indonesia 625 50 90 0.809 0.01587
Philippines 259 49 57 0.934 0.02653
Pacific Islands
Fiji 2 0 1 0.000 0.0000
Solomon 3 0 0 0.000 0.0000
Vanuatu 9 1 2 0.222 0.0012
Easter Island 4 0 1 0.000 0.0000
royalsocietypublishing.org/journal/rsosR.Soc.open
sci.7:19155811
well-known Columbus-era European and Asian trading partners, rather than speculative earlier contactswith Polynesians. The genetic make-up of South American chickens is different from the genetic lineagescharacterizing those from the Pacific and Island Southeast Asia. Thus, based on this modern chickendiversity, no evidence of a Polynesian pre-Columbian contribution to South American chickens isobserved. This does not altogether dismiss the potential for interactions between the New World andPolynesia. However, if these interactions occurred, any unambiguous evidence for it has yet to bediscovered.
Finally, while modern chicken datasets can suggest hypotheses about past interactions, caution iswarranted. Only securely dated and genotyped chicken material from South America, preferably pre-dating European arrival by a few centuries, can definitively rule in or out pre-Columbian Polynesiancontact with South America.
royalsocietypublishing.org/journal/rsosR.So
12
Ethics. The Ethics Committee in Research of the Faculty of Agricultural Sciences of the University National of PalmiraHeadquarters considers that the activities proposed to carry out this research do not involve procedures against animalwelfare. Therefore, the study is classified as without risk.Data accessibility. All mtDNA control region sequences generated by this study are available in GenBank under accessionnumbers (MN149634-MN149862).Authors’ contributions. M.B.H. contributed to data analysis, interpretation and writing the manuscript. S.K. carried themolecular laboratory work. J.G. and V.T. contributed to data analysis, interpretation and helped in drafting themanuscript. J.G. and J.J.A. design the study. J.G. organized access to samples. J.A.A., D.Q., H.R., L.A.A., M.F.R.and H.J. assisted in the design of the study. All authors gave their approval for publication.Competing interests. We declare we have no competing interest.Funding. This research was funded by the Australian Research Council (ARC) Discovery Project DP110105187 to J.J.A.and J.G.Acknowledgements. We thank the Office of the Vice Chancellor for Research and Development (OVCRD) of the Universityof the Philippines Diliman for the Research Load Credit given to Michael Herrera. We also thank ArchaeologicalStudies Program’s Emil Charles Robles for assisting in the preparation of the figures. Finally, Joan Tara Reyes-Hernandez and Emmanuel Jayson Bolata for some insights in the discussion.c.opensci.
References7:191558
1. Sykes N. 2012 A social perspective on theintroduction of exotic animals: the case of thechicken. World Archaeol. 44, 158–169. (doi:10.1080/00438243.2012.646104)
2. Eriksson J et al. 2008 Identification of the yellowskin gene reveals a hybrid origin of thedomestic chicken. PLoS Genet. 4, e1000010.(doi:10.1371/journal.pgen.1000010)
3. Liu YP et al. 2006 Multiple maternal origins ofchickens: out of the Asian jungles. Mol.Phylogenet. Evol. 38, 12–19. (doi:10.1016/j.ympev.2005.09.014)
4. West B, Zhou B-X. 1998 Did chickens go north?New evidence for domestication. J. Anim. Sci.15, 515–533.
5. Xiang H et al. 2014 Early Holocene chickendomestication in northern China. Proc. NatlAcad. Sci. USA 111, 17 564–17 569. (doi:10.1073/pnas.1411882111)
6. Peters J et al. 2015 Questioning new answersregarding Holocene chicken domestication inChina. Proc. Natl Acad. Sci. USA 112, E2415.(doi:10.1073/pnas.1503579112)
7. Crawford RD. 1990 Origin and history of poultryspecies. Poultry genetic resources: evolution,diversity, and conservation. In Poultry breedingand genetics, pp. 1–59 Amsterdam, theNetherlands: Elsevier Ltd.
8. Perry-Gal L, Erlich A, Gilboa A, Bar-Oz G. 2015Earliest economic exploitation of chicken outsideEast Asia: evidence from the HellenisticSouthern Levant. Proc. Natl Acad. Sci. USA 112,9849–9854. (doi:10.1073/pnas.1504236112)
9. Benecke N. 1993 On the utilization of thedomestic fowl in central Europe from the IronAge up to the Middle Ages. Archaeofauna 2,21–31.
10. Girdland Flink L, Allen R, Barnett R, MalmstromH, Peters J, Eriksson J, Andersson L, Dobney K,Larson G. 2014 Establishing the validity ofdomestication genes using DNA from ancientchickens. Proc. Natl Acad. Sci. USA 111,6184–6189. (doi:10.1073/pnas.1308939110)
11. Kanginakudru S, Muralidhar M, Jakati RD,Nagaraju J. 2008 Genetic evidence from Indianred jungle fowl corroborates multiple
domestication of modern day chicken. BMC Evol.Biol. 8, 1–14. (doi:10.1186/1471-2148-8-174)
12. Miao YW et al. 2013 Chicken domestication: anupdated perspective based on mitochondrialgenomes. Heredity (Edinb.) 110, 277–282.(doi:10.1038/hdy.2012.83)
13. MacDonald KC. 1992 The domestic chicken(Gallus gallus) in sub-Saharan Africa: abackground to its introduction and itsosteological differentiation from indigenousfowls (Numidinae and Francolinus sp.).J. Archaeol. Sci. 19, 303–318. (doi:10.1016/0305-4403(92)90019-Y)
14. Herrera M et al. 2017 East African origins forMadagascan chickens as indicated bymitochondrial DNA. R. Soc. open sci. 4, 160787.(doi:10.1098/rsos.160787)
15. Mwacharo JM, Bjørnstad G, Mobegi V, NomuraK, Hanada H, Amano T, Jianlin H, Hanotte O.2011 Mitochondrial DNA reveals multipleintroductions of domestic chicken in East Africa.Mol. Phylogenet. Evol. 58, 374–382. (doi:10.1016/j.ympev.2010.11.027)
16. Storey A, Quiroz D, Beavan N, Matisoo-Smith E.2013 Polynesian chickens in the New World: adetailed application of a commensal approach.Archaeol. Ocean. 48, 101–119. (doi:10.1002/arco.5007)
17. Storey AA, Quiroz D, Beavan N, Matisoo-SmithEA. 2011 Pre-Columbian chickens of theAmericas: a critical review of the hypothesesand evidence for their origins. Rapa Nui J. 25,5–19.
18. Storey A et al. 2007 Radiocarbon and DNAevidence for a pre-Columbian introduction ofPolynesian chickens to Chile. Proc. Natl Acad.Sci. USA 104, 10 335–10 339. (doi:10.1073/pnas.0703993104)
19. Storey A et al. 2012 Investigating the globaldispersal of chickens in prehistory usingancient mitochondrial DNA signatures. PLoSONE 7, e39171. (doi:10.1371/journal.pone.0039171)
20. Thomson VA et al. 2014 Using ancient DNA tostudy the origins and dispersal of ancestralPolynesian chickens across the Pacific. Proc. Natl
Acad. Sci. USA 111, 4826–4831. (doi:10.1073/pnas.1320412111)
21. Dancause KN, Vilar MG, Steffy R, Lum JK. 2011Characterizing genetic diversity of contemporaryPacific chickens using mitochondrial DNAanalyses. PLoS ONE 6, e16843. (doi:10.1371/journal.pone.0016843)
22. Clarke AC, Burtenshaw MK, McLenachan PA,Erickson DL, Penny D. 2006 Reconstructing theorigins and dispersal of the Polynesian bottlegourd (Lagenaria siceraria). Mol. Biol. Evol. 23,893–900. (doi:10.1093/molbev/msj092)
23. Whitaker T, Carter G. 1954 Oceanic drift ofgourds—experimental observations. Am. J. Bot.41, 697–700. (doi:10.1002/j.1537-2197.1954.tb14397.x)
24. Roullier C, Benoit L, Mckey DB, Lebot V. 2012Historical collections reveal patterns of diffusionof sweet potato in Oceania obscured by modernplant movements and recombination. Proc. NatlAcad. Sci. USA 110, 2205–2210. (doi:10.1073/pnas.1211049110)
25. Ladefoged T, Graves M, Coil J. 2005 Theintroduction of sweet potato in Polynesia: earlyremains in Hawai’i. J. Polyn. Soc. 114, 359–373.
26. Denham T. 2013 Ancient and historic dispersalsof sweet potato in Oceania. Proc. Natl Acad. Sci.USA 110, 1982–1983. (doi:10.1073/pnas.1221569110)
27. O’Brien PJ. 1972 The sweet potato: its originand dispersal. Am. Anthropol. 74, 342–365.(doi:10.1525/aa.1972.74.3.02a00070)
28. Montenegro A, Avis C, Weaver A. 2008 Modelingthe prehistoric arrival of the sweet potato inPolynesia. J. Archaeol. Sci. 35, 355–367. (doi:10.1016/j.jas.2007.04.004)
29. Langdon R. 1989 When the blue-egg chickenscome home to roost: new thoughts on theprehistory of the domestic fowl in Asia, Americaand the Pacific Islands. J. Pac. Hist. 24,164–192. (doi:10.1080/00223348908572613)
30. Carter GF. 1971 Pre-Columbian chickens inAmerica. In Man across the sea: problems of pre-Columbian contacts (eds C Riley, J. Kelley,C Pennington, R Rands), pp. 178–218. Austin,TX: University of Texas.
royalsocietypublishing.org/journal/rsosR.Soc.open
sci.7:19155813
31. Ballard C, Brown P, Bourke RM, Harwood T.2005 The sweet potato in Oceania. Sydney,Australia: University of Sydney.
32. Bulmer R. 1965 Birds as possible agents in thepropagation of the sweet-potato. Emu 65,165–182. (doi:10.1071/MU965165)
33. Gongora J et al. 2008 Indo-European and Asianorigins for Chilean and Pacific chickens revealedby mtDNA. Proc. Natl Acad. Sci. USA 105,16 404–16 407. (doi:10.1073/pnas.0801991105)
34. Munoz-Rodriguez P et al. 2018 Reconcilingconflicting phylogenies in the origin of sweetpotato and dispersal to Polynesia. Curr. Biol. 28,1–11. (doi:10.1016/j.cub.2018.03.020)
35. Matisso-Smith E. 2009 The commensal modelfor human settlement of the Pacific 10 yearon—what can we say and where to now? J. Isl.Coast. Archaeol. 4, 151–163. (doi:10.1080/15564890903155273)
36. Seligmann LJ. 1987 The chicken in Andeanhistory and myth: The Quechua concept ofWallpa. Ethnohistory 34, 139–170. (doi:10.2307/482251)
37. Pearce CEM, Pearce FM. 2010 Oceanic migration:paths, sequence, timing and range of prehistoricmigration in the Pacific and Indian Oceans.New York, NY: Springer Science.
38. Beavan N. 2014 No evidence for samplecontamination or diet offset for pre-Columbianchicken dates from El Arenal. Proc. Natl Acad.Sci. USA 111, 3582. (doi:10.1073/pnas.1410794111)
39. Storey A et al. 2008 Pre-Colombian chickens,dates, isotopes, and mtDNA. Proc. Natl Acad. Sci.USA 105, E99. (doi:10.1073/pnas.0807625105)
40. Luzuriaga-Neira A et al. 2017 On the originsand genetic diversity of South American
chickens: one step closer. Anim. Genet. 48,353–357. (doi:10.1111/age.12537)
41. Langford S, Kraitsek S, Baskerville B, Ho S,Gongora J. 2013 Australian and Pacificcontributions to the genetic diversity of NorfolkIsland feral chickens. BMC Genet. 14, 91.(doi:10.1186/1471-2156-14-91)
42. Edgar RC. 2004 MUSCLE: multiple sequencealignment with high accuracy and highthroughput. Nucleic Acids Res. 32, 1792–1797.(doi:10.1093/nar/gkh340)
43. Kearse M et al. 2012 Geneious Basic: anintegrated and extendable desktop softwareplatform for the organization and analysis ofsequence data. Bioinformatics 28, 1647–1649.(doi:10.1093/bioinformatics/bts199)
44. Nishibori M, Shimogiri T, Hayashi T, Yasue H.2005 Molecular evidence for hybridization ofspecies in the genus Gallus except for Gallusvarius. Anim. Genet. 36, 367–375. (doi:10.1111/j.1365-2052.2005.01318.x)
45. Rozas J, Ferrer-Mata A, Sánchez-DelBarrio JC, Guirao-Rico S, Librado P, Ramos-Onsins SE, Sánchez-GraciaA. 2017 DnaSP 6: DNA sequence polymorphismanalysis of large data sets. Mol. Biol. Evol. 34,3299–3302. (doi:10.1093/molbev/msx248)
46. Bandelt HJ, Forster P, Rohl A. 1999 Median-joining networks for inferring intraspecificphylogenies. Mol. Biol. Evol. 16, 37–48. (doi:10.1093/oxfordjournals.molbev.a026036)
47. Posada D. 2008 jModelTest: phylogenetic modelaveraging. Mol. Biol. Evol. 7, 1253–1256.(doi:10.1093/molbev/msn083)
48. Miller MA, Pfeiffer W, Schwartz T. 2010 Creatingthe CIPRES Science Gateway for inference oflarge phylogenetic trees. In Gateway ComputingEnvironments Workshop, pp. 1–8.
49. Swofford DL. 2002 PAUP�. Phylogenetic analysisusing parsimony (�and other methods). Version4.0b10. Sunderland, MA: Sinauer Associates.
50. Leigh JW, Bryant D. 2015 POPART: full-featuresoftware for haplotype network construction.Methods Ecol. Evol. 6, 1110–1116. (doi:10.1111/2041-210X.12410)
51. Excoffier L, Laval G, Schneider S. 2005 Arlequin(version 3.0): an integrated software packagefor population genetics data analysis.Evolutionary Bioinformatics 1, 47–50.
52. Peakall R, Smouse PE. 2006 GENALEX6: geneticanalysis in Excel. Population genetic softwarefor teaching and research. Mol. Ecol. Notes6, 288–295. (doi:10.1111/j.1471-8286.2005.01155.x)
53. Throckmorton P. 1987 The sea remembers:shipwrecks and archaeology: from Homer’sGreece to the rediscovery of the Titanic.New York, NY: Chancellor Press.
54. Serrera RM. 2006 El Camino de Asia: La Ruta deMéxico a Acapulco. In Rutas de La NuevaEspaña (ed. C Cramaussel). Zamora, Mexico:Colegio de Michoacán.
55. Seijas T. 2016 Inns, mules, and hardtack for thevoyage: the local economy of the Manilagalleon in Mexico. Colon. Latin Am. Rev. 25,56–76. (doi:10.1080/10609164.2016.1180787)
56. Schurz WL. 1918 Mexico, Peru, and the Manilagalleon. Hisp. Am. Hist. Rev. 1, 389–402.(doi:10.2307/2505890)
57. Matisoo-Smith E. 2002 Something old,something new: do genetic studies ofcontemporary populations reliably representprehistoric populations of Pacific Rattus exulans?Hum. Biol. 74, 489–496. (doi:10.1353/hub.2002.0032)