europe2020stocktaking annex en
DESCRIPTION
Europe 2020 strategyeurope strategydevelopment of europeTRANSCRIPT

7/21/2019 Europe2020stocktaking Annex En
http://slidepdf.com/reader/full/europe2020stocktaking-annex-en 1/35
EN EN
EUROPEAN
COMMISSION
Brussels, 19.3.2014COM(2014) 130 final/2
ANNEXES 1 to 3
CorrigendumAnnule et remplace le document COM(2014)130 final du 05.03.2014.
Concerne les versions EN, FR et DE des annexes à la Communication (remplacement de deux
graphiques dans l'annexe 2).
ANNEXES
to the
COMMUNICATION FROM THE COMMISSION TO THE EUROPEANPARLIAMENT, THE COUNCIL, THE EUROPEAN ECONOMIC AND SOCIAL
COMMITTEE AND THE COMMITTEE OF THE REGIONS
Taking stock of the Europe 2020 strategy
for smart, sustainable and inclusive growth
7/21/2019 Europe2020stocktaking Annex En
http://slidepdf.com/reader/full/europe2020stocktaking-annex-en 2/35
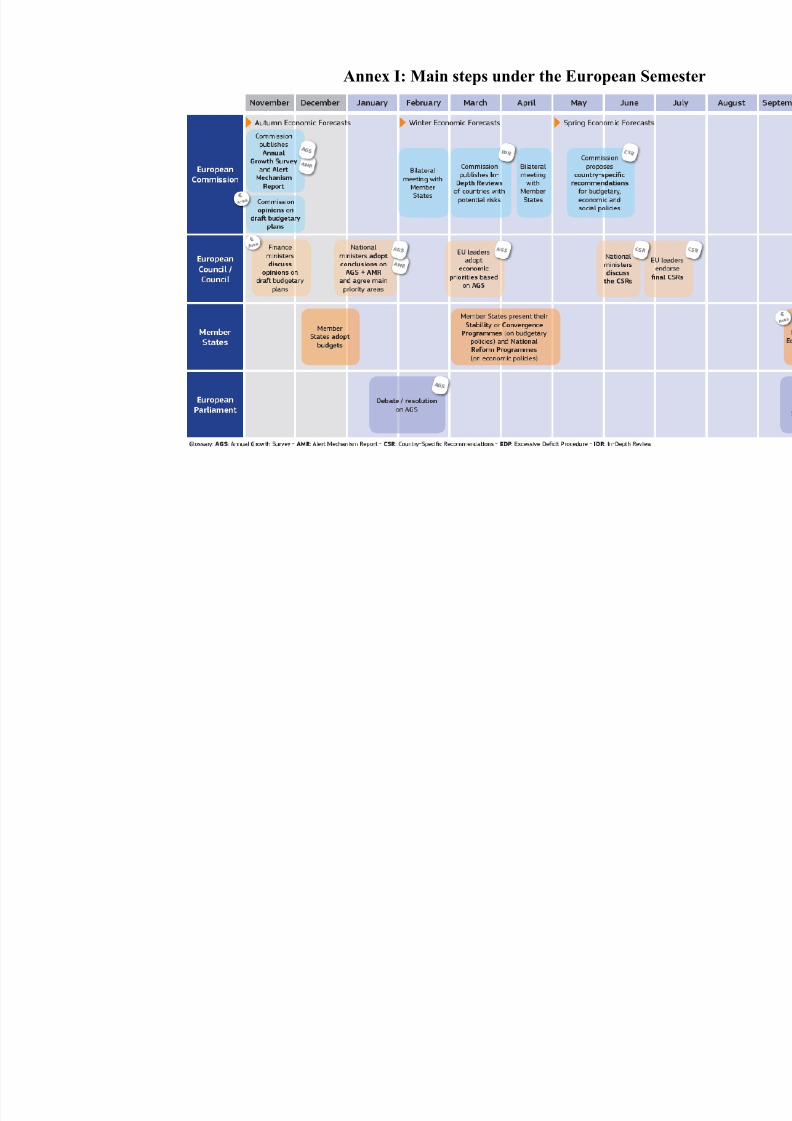
Annex I: Main steps under the European Seme
7/21/2019 Europe2020stocktaking Annex En
http://slidepdf.com/reader/full/europe2020stocktaking-annex-en 3/35
3
Annex II: Overview of progress
towards the Europe 2020 targets
Background:
For each of the Europe 2020 targets, this Annex reviews:
Progress to date at EU level and illustrates possible scenarios until 2020.
Latest data available on performances at national level and national targets for
2020.
Trends in national performances, with some international comparisons where
possible.
The graphs are based on the latest data available as of February 2014. EU averages correspond
to EU28, unless otherwise indicated.
Detailed data, with more variables, are regularly updated and available on Eurostat's website
at: http://epp.eurostat.ec.europa.eu/portal/page/portal/europe_2020_indicators/headline_indicators
Additional information and details on the targets are available at:http://epp.eurostat.ec.europa.eu/portal/page/portal/europe_2020_indicators/headline_indicators/targets
A complete report, with further methodological and statistical explanations, was produced inAutumn 2013 and is also available at: http://epp.eurostat.ec.europa.eu/cache/ITY_OFFPUB/KS-02-13-
238/EN/KS-02-13-238-EN.PDF
7/21/2019 Europe2020stocktaking Annex En
http://slidepdf.com/reader/full/europe2020stocktaking-annex-en 4/35
4
EUROPE 2020 TARGET ON EMPLOYMENT
R AISE THE EMPLOYMENT RATE OF THE POPULATION
AGED 20-64 TO AT LEAST 75%
1. State of play at EU level
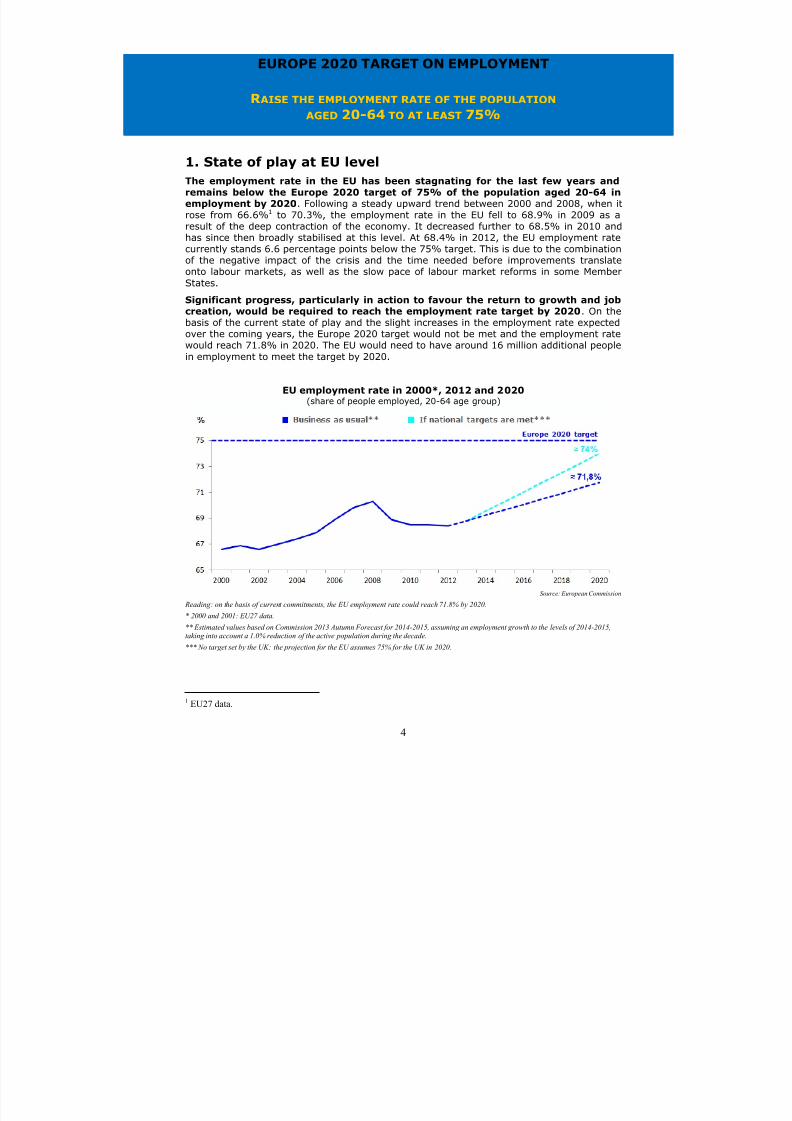
The employment rate in the EU has been stagnating for the last few years andremains below the Europe 2020 target of 75% of the population aged 20-64 inemployment by 2020. Following a steady upward trend between 2000 and 2008, when itrose from 66.6%1 to 70.3%, the employment rate in the EU fell to 68.9% in 2009 as aresult of the deep contraction of the economy. It decreased further to 68.5% in 2010 andhas since then broadly stabilised at this level. At 68.4% in 2012, the EU employment ratecurrently stands 6.6 percentage points below the 75% target. This is due to the combinationof the negative impact of the crisis and the time needed before improvements translateonto labour markets, as well as the slow pace of labour market reforms in some Member
States.
Significant progress, particularly in action to favour the return to growth and jobcreation, would be required to reach the employment rate target by 2020. On thebasis of the current state of play and the slight increases in the employment rate expectedover the coming years, the Europe 2020 target would not be met and the employment ratewould reach 71.8% in 2020. The EU would need to have around 16 million additional people
in employment to meet the target by 2020.
EU employment rate in 2000*, 2012 and 2020(share of people employed, 20-64 age group)
Source: European Commission
Reading: on the basis of current commitments, the EU employment rate could reach 71.8% by 2020.
* 2000 and 2001: EU27 data.
** Estimated values based on Commission 2013 Autumn Forecast for 2014-2015, assuming an employment growth to the levels of 2014-2015,taking into account a 1.0% reduction of the active population during the decade.
*** No target set by the UK: the projection for the EU assumes 75% for the UK in 2020.
1 EU27 data.
7/21/2019 Europe2020stocktaking Annex En
http://slidepdf.com/reader/full/europe2020stocktaking-annex-en 5/35
5
2. State of play and progress at national level
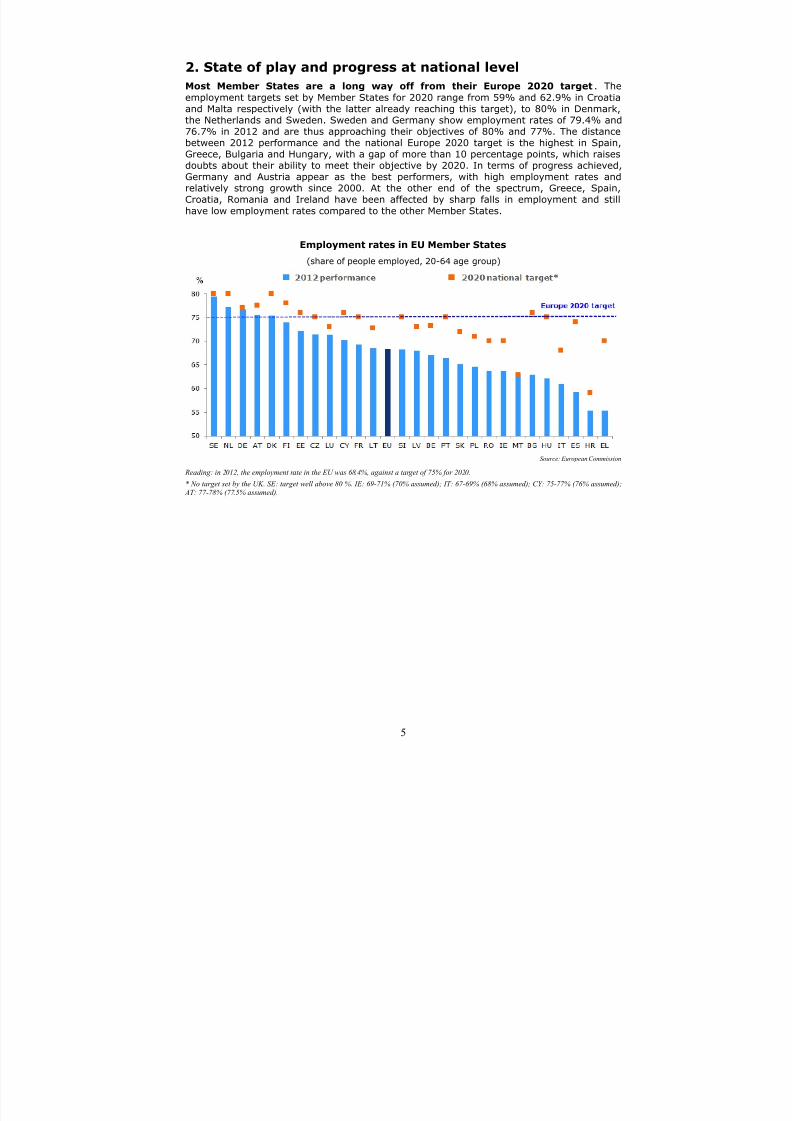
Most Member States are a long way off from their Europe 2020 target . The
employment targets set by Member States for 2020 range from 59% and 62.9% in Croatiaand Malta respectively (with the latter already reaching this target), to 80% in Denmark,the Netherlands and Sweden. Sweden and Germany show employment rates of 79.4% and76.7% in 2012 and are thus approaching their objectives of 80% and 77%. The distancebetween 2012 performance and the national Europe 2020 target is the highest in Spain,Greece, Bulgaria and Hungary, with a gap of more than 10 percentage points, which raisesdoubts about their ability to meet their objective by 2020. In terms of progress achieved,Germany and Austria appear as the best performers, with high employment rates andrelatively strong growth since 2000. At the other end of the spectrum, Greece, Spain,Croatia, Romania and Ireland have been affected by sharp falls in employment and still
have low employment rates compared to the other Member States.
Employment rates in EU Member States
(share of people employed, 20-64 age group)
Source: European Commission
Reading: in 2012, the employment rate in the EU was 68.4%, against a target of 75% for 2020.
* No target set by the UK. SE: target well above 80 %. IE: 69-71% (70% assumed); IT: 67-69% (68% assumed); CY: 75-77% (76% assumed);
AT: 77-78% (77.5% assumed).
7/21/2019 Europe2020stocktaking Annex En
http://slidepdf.com/reader/full/europe2020stocktaking-annex-en 6/35
6
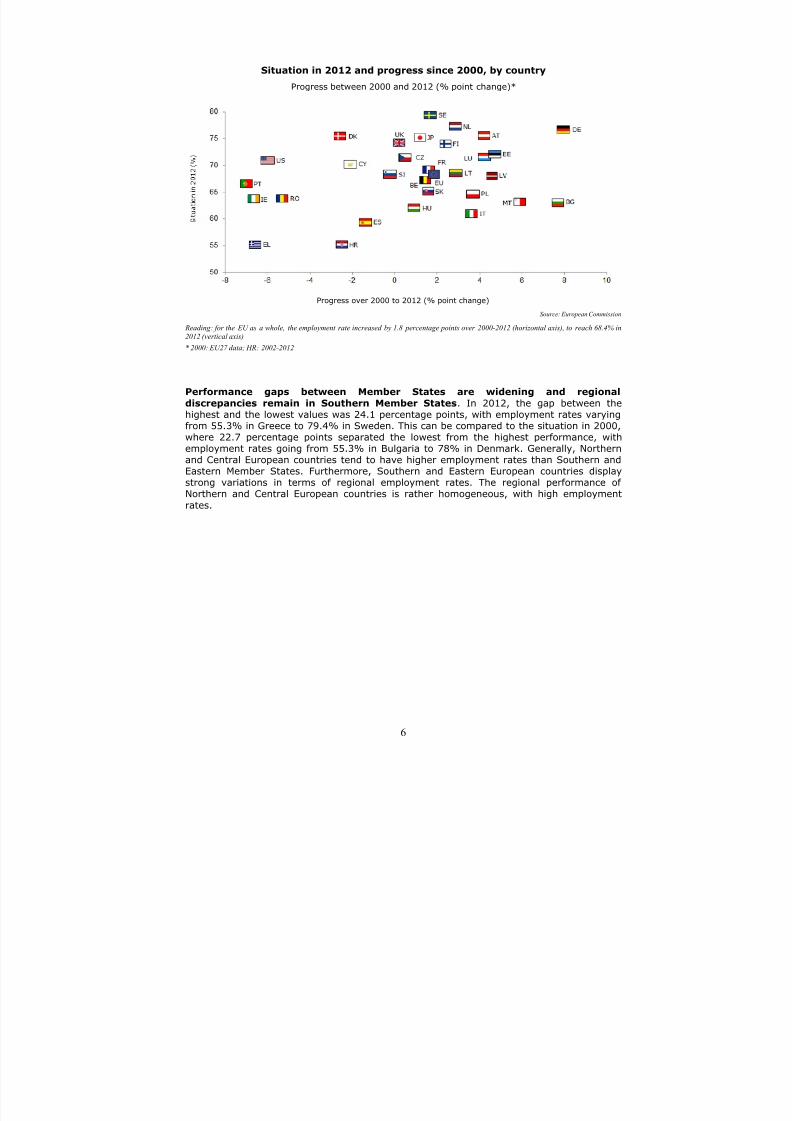
Situation in 2012 and progress since 2000, by country
Progress between 2000 and 2012 (% point change)*
Progress over 2000 to 2012 (% point change)
Source: European Commission
Reading: for the EU as a whole, the employment rate increased by 1.8 percentage points over 2000-2012 (horizontal axis), to reach 68.4% in
2012 (vertical axis).
* 2000: EU27 data; HR: 2002-2012
Performance gaps between Member States are widening and regional
discrepancies remain in Southern Member States. In 2012, the gap between the
highest and the lowest values was 24.1 percentage points, with employment rates varyingfrom 55.3% in Greece to 79.4% in Sweden. This can be compared to the situation in 2000,where 22.7 percentage points separated the lowest from the highest performance, withemployment rates going from 55.3% in Bulgaria to 78% in Denmark. Generally, Northernand Central European countries tend to have higher employment rates than Southern andEastern Member States. Furthermore, Southern and Eastern European countries displaystrong variations in terms of regional employment rates. The regional performance ofNorthern and Central European countries is rather homogeneous, with high employment
rates.

7/21/2019 Europe2020stocktaking Annex En
http://slidepdf.com/reader/full/europe2020stocktaking-annex-en 7/35
7
EUROPE 2020 TARGET ON RESEARCH AND DEVELOPMENT
INVEST 3% OF GDP IN R ESEARCH AND DEVELOPMENT
1. State of play at EU level
Expenditure on research and development (R&D) in the EU has recently beenslightly increasing, but remains lower than the 3% Europe 2020 target. The R&Dobjective set at EU level is expressed in terms of R&D intensity, which measures grossdomestic expenditure of the public and private sector on R&D as a percentage of GDP, i.e.the share of GDP invested in R&D. Public funding of R&D is a direct measure of the level ofpublic effort in support of R&D activities. Monitoring private funding of R&D allows for theassessment of the effectiveness of policies aimed at attracting and fostering business R&D
investments and the development and growth of knowledge-intensive firms. After remainingflat at around 1.85% between 2000 and 2007, EU gross domestic expenditure on R&D as a
share of GDP rose to 2.01% in 2009 and has only moderately increased since then. With ashare of GDP amounting to 2.06% in 2012, EU gross domestic expenditure on R&D as apercentage of GDP remains almost 1 percentage point below the 3% target and visiblybelow the performance of the United States.
Recent progress towards the 3% target results mainly from policies at EU and
Member State level. They aim to foster private investment in R&D (notably throughincreased leverage via public funding, improved framework conditions and fiscal incentives)and to protect and promote public funding of R&D despite the crisis, in line with theprinciple of growth-friendly fiscal consolidation. Compared to international competitors,Europe's shortfall mainly derives from low levels of private investment.
Under current circumstances, the Europe 2020 target on R&D is unlikely to be met
by 2020. According to the latest projections and if current reforms and financial effortscontinue, gross domestic expenditure on R&D as a percentage of GDP is expected to remainbelow the 3% threshold until 2020. To meet this target, the average annual growth rate ofR&D expenditure in the EU would need to double compared to the 2007-2012 period.
Progressing more rapidly towards the 3% target needs faster structural change towardsmore knowledge-based economic activities.
EU gross domestic expenditure on R&D as a % of GDP in 2000, 2012 and 2020
Source: European Commission
Reading: on the basis of current commitments, EU investment in R&D could reach 2.2% by 2020.* Scenario based on the continuation of ongoing reforms and financial efforts.** No targets sets by CZ and the UK: 2020 figures were estimated by Commission services.***The EU target includes R&D expenditure by intergovernmental research infrastructures, which is not included in the R&D expenditure of the
Member States.

7/21/2019 Europe2020stocktaking Annex En
http://slidepdf.com/reader/full/europe2020stocktaking-annex-en 8/35
8
2. State of play and progress at national level
Levels of ambition and progress towards the Europe 2020 targets differ across
Member States. The national targets in terms of R&D highlight various levels in ambitionof the Member States: Finland and Sweden, which already show the greatest R&D intensityin the EU, have set the highest targets of 4% of GDP invested in R&D by 2020. With targetsof 0.50% and 0.67% respectively, Cyprus and Greece have the lowest objectives. Othercountries have defined achievable but not overly ambitious goals, such as Italy with a targetof 1.53%. Greece has already achieved its target of 0.67% of its GDP expenditure on R&Din 2012. Germany, Denmark and Cyprus are getting close to their respective objectives.Romania, Portugal, Malta and Lithuania remain far from their targets, with values at least 1percentage point below their goal. Progress made since 2000 across countries is mixed:Estonia combines a performance above the EU average in 2012 with the biggest increase in
investment in R&D as a share of GDP, whereas Croatia, Luxembourg and the UnitedKingdom display R&D intensity below the EU average and negative growth in this area.
R&D investment in EU Member States as a % of GDP
Source: European Commission
Reading: in 2012, R&D intensity in the EU amounted to 2.06% of GDP, against a target of 3% for 2020.* LU: 2010.** No targets set by CZ (only for the public sector) and the UK. IE: the target is 2.5% of GNP, which is estimated to be equivalent to 2% of GDP.
LU: the target is between 2.30% and 2.60% of GDP (2.45% assumed). PT: the target is between 2.70% and 3.30% of GDP (3% assumed).

7/21/2019 Europe2020stocktaking Annex En
http://slidepdf.com/reader/full/europe2020stocktaking-annex-en 9/35
9
Situation in 2012 and progress since 2000, by country*
Average annual growth in investment in R&D, 2000-2012 (%)
Source: European Commission
Reading: investment in R&D in the EU has increased at an annual growth rate of 0.9% over 2000-2012 (horizontal axis), to reach 2.06% in2012 (vertical axis). * Performance: EL, SI: 2007; LU, NL, RO: 2010; US, JP, CN: 2011. Progress: SI: 2000-2007; LU, NL, RO: 2000-2010; CN: 2000-2011; EL:
2001-2007; HR: 2002-2012; HU, MT: 2004-2012; SE: 2005-2012; US: 2006-2011; DK: 2007-2012; JP: 2008-2011; PT: 2008-2012; FR: 2010-2012.
There is a North-South divide in R&D investment. The inter-country performance gapfor R&D intensity has been widening over the last decade: on the basis of available data,
gross domestic expenditure on R&D as a share of GDP ranged from 0.37% in Romania, to3.35% in Finland in 2000, a difference of 2.98 percentage points. This gap increased to 3.13percentage points in 2012, between 0.42% in Romania and 3.55% in Finland. Generally,
Northern European countries show the highest levels of R&D intensity, whereas Eastern andSouthern Member States score lower on this indicator. At regional level, the countries withthe lowest levels of R&D intensity are rather homogeneous and predominantly made up ofregions with low levels of investment in R&D. In Member States with the highest levels ofR&D intensity, a number of regions remain below the ambitious national target.

7/21/2019 Europe2020stocktaking Annex En
http://slidepdf.com/reader/full/europe2020stocktaking-annex-en 10/35
10
EUROPE 2020 TARGET ON CLIMATE AND ENERGY (1)
R EDUCE GREENHOUSE GAS EMISSIONS BY AT LEAST 20%
COMPARED TO 1990 LEVELS
1. State of play at EU level
Following a sizeable reduction of greenhouse gas emissions, the EU is close toachieving its Europe 2020 target of a 20% reduction compared to 1990 levels.Between 1990 and 2012, greenhouse gas emissions at EU level decreased by 18% Currentclimate and energy policies have delivered on progress, with the economic slowdown also
having a significant effect on emissions reduction. A slight increase in greenhouse gasemissions was observed in 2010, during the temporary recovery. This performance is all the
more significant as the European economy has grown by around 45% in real terms since1990 and it shows a clear decoupling of economic growth and greenhouse gas emissions. Asa result, in 2012 the European economy was almost twice less carbon-intensive – carbonintensity refers to the amount of emissions released per unit of GDP – than in 1990.
Based on the latest trends, the Europe 2020 target related to greenhouse gas
emissions seems within reach. In line with the encouraging developments of recentyears, the reduction of greenhouse gas emissions could exceed the target and reach 24%by 2020.
Greenhouse gas emissions in 2000, 2012 and 2020
(index 1990=100)
Source: European Commission
Reading: if the climate and energy 2020 package is fully implemented, the EU could reduce its greenhouse gas emissions by 24% by 2020,compared to 1990 levels.
7/21/2019 Europe2020stocktaking Annex En
http://slidepdf.com/reader/full/europe2020stocktaking-annex-en 11/35
11
2. State of play and progress at national level
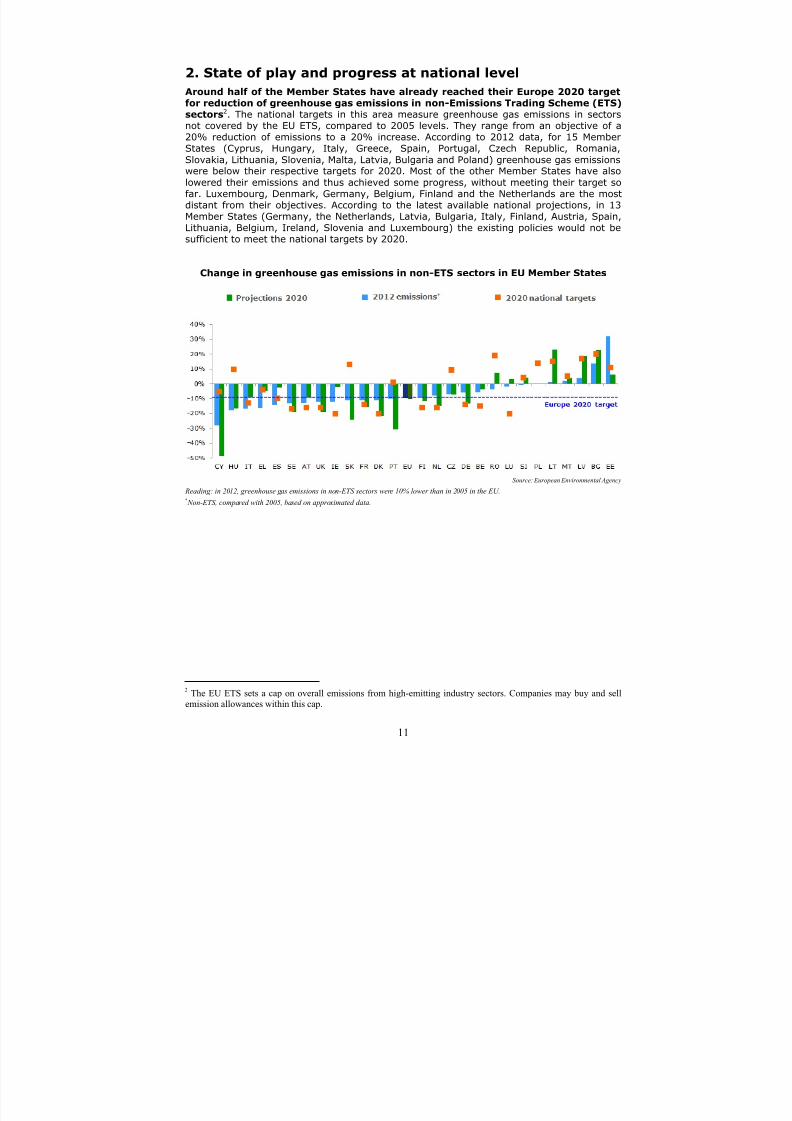
Around half of the Member States have already reached their Europe 2020 targetfor reduction of greenhouse gas emissions in non-Emissions Trading Scheme (ETS)sectors2. The national targets in this area measure greenhouse gas emissions in sectorsnot covered by the EU ETS, compared to 2005 levels. They range from an objective of a
20% reduction of emissions to a 20% increase. According to 2012 data, for 15 MemberStates (Cyprus, Hungary, Italy, Greece, Spain, Portugal, Czech Republic, Romania,
Slovakia, Lithuania, Slovenia, Malta, Latvia, Bulgaria and Poland) greenhouse gas emissionswere below their respective targets for 2020. Most of the other Member States have also
lowered their emissions and thus achieved some progress, without meeting their target sofar. Luxembourg, Denmark, Germany, Belgium, Finland and the Netherlands are the mostdistant from their objectives. According to the latest available national projections, in 13Member States (Germany, the Netherlands, Latvia, Bulgaria, Italy, Finland, Austria, Spain,Lithuania, Belgium, Ireland, Slovenia and Luxembourg) the existing policies would not besufficient to meet the national targets by 2020.
Change in greenhouse gas emissions in non-ETS sectors in EU Member States
Source: European Environmental Agency
Reading: in 2012, greenhouse gas emissions in non-ETS sectors were 10% lower than in 2005 in the EU.* Non-ETS, compared with 2005, based on approximated data.
2 The EU ETS sets a cap on overall emissions from high-emitting industry sectors. Companies may buy and sellemission allowances within this cap.

7/21/2019 Europe2020stocktaking Annex En
http://slidepdf.com/reader/full/europe2020stocktaking-annex-en 12/35
12
Between 2000 and 2011, carbon intensity decreased in all Member States,although progress varies a lot. Highly carbon-intensive countries have generallyachieved a sizeable reduction; low carbon-intensive countries display more limited progress.
Situation in 2011 and progress in terms of carbon intensity since 2000, by country
Reduction in carbon intensity between 2000 and 2011 (%)
Source: European Commission
Reading: in 2011, most Member States were close to the EU average in terms of carbon intensity and progress.
7/21/2019 Europe2020stocktaking Annex En
http://slidepdf.com/reader/full/europe2020stocktaking-annex-en 13/35
13
EUROPE 2020 TARGET ON CLIMATE AND ENERGY (2)
INCREASE THE SHARE OF RENEWABLE ENERGY
IN FINAL ENERGY CONSUMPTION TO 20%
1. State of play at EU level
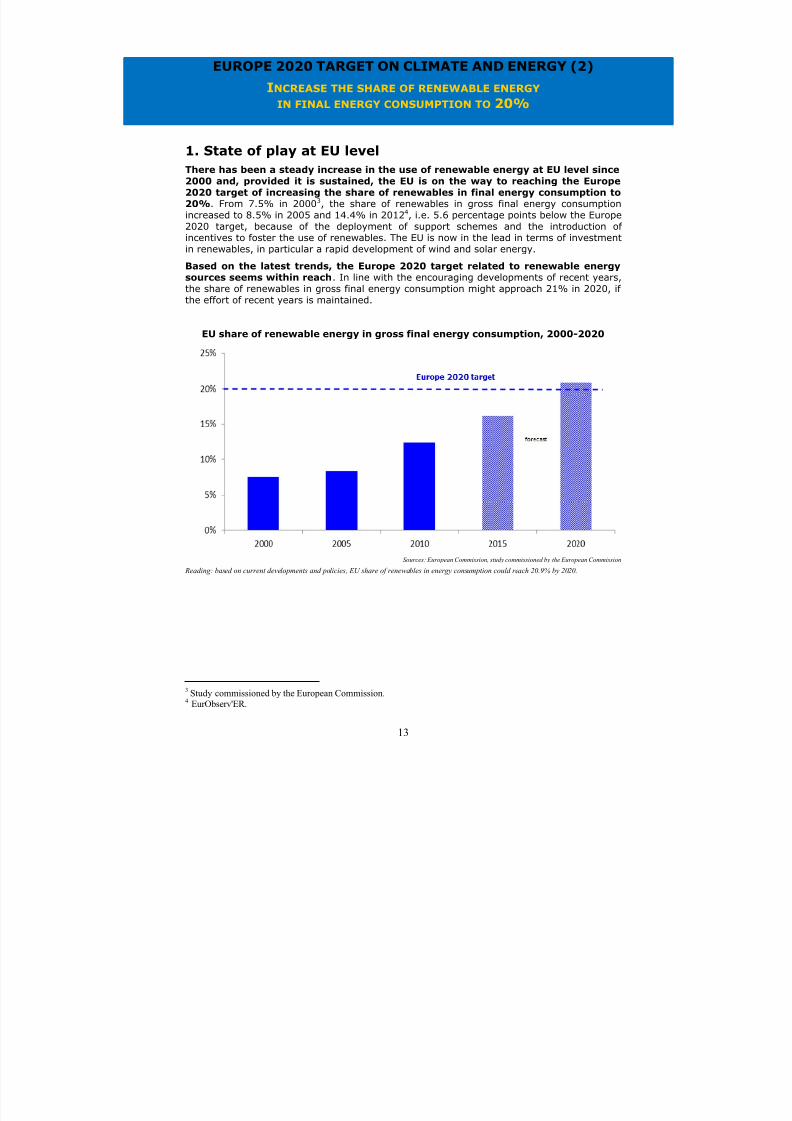
There has been a steady increase in the use of renewable energy at EU level since
2000 and, provided it is sustained, the EU is on the way to reaching the Europe2020 target of increasing the share of renewables in final energy consumption to20%. From 7.5% in 20003, the share of renewables in gross final energy consumptionincreased to 8.5% in 2005 and 14.4% in 20124, i.e. 5.6 percentage points below the Europe2020 target, because of the deployment of support schemes and the introduction ofincentives to foster the use of renewables. The EU is now in the lead in terms of investmentin renewables, in particular a rapid development of wind and solar energy.
Based on the latest trends, the Europe 2020 target related to renewable energy
sources seems within reach. In line with the encouraging developments of recent years,the share of renewables in gross final energy consumption might approach 21% in 2020, ifthe effort of recent years is maintained.
EU share of renewable energy in gross final energy consumption, 2000-2020
Sources: European Commission, study commissioned by the European Commission
Reading: based on current developments and policies, EU share of renewables in energy consumption could reach 20.9% by 2020.
3 Study commissioned by the European Commission.4 EurObserv'ER.
7/21/2019 Europe2020stocktaking Annex En
http://slidepdf.com/reader/full/europe2020stocktaking-annex-en 14/35
14
2. State of play and progress at national level
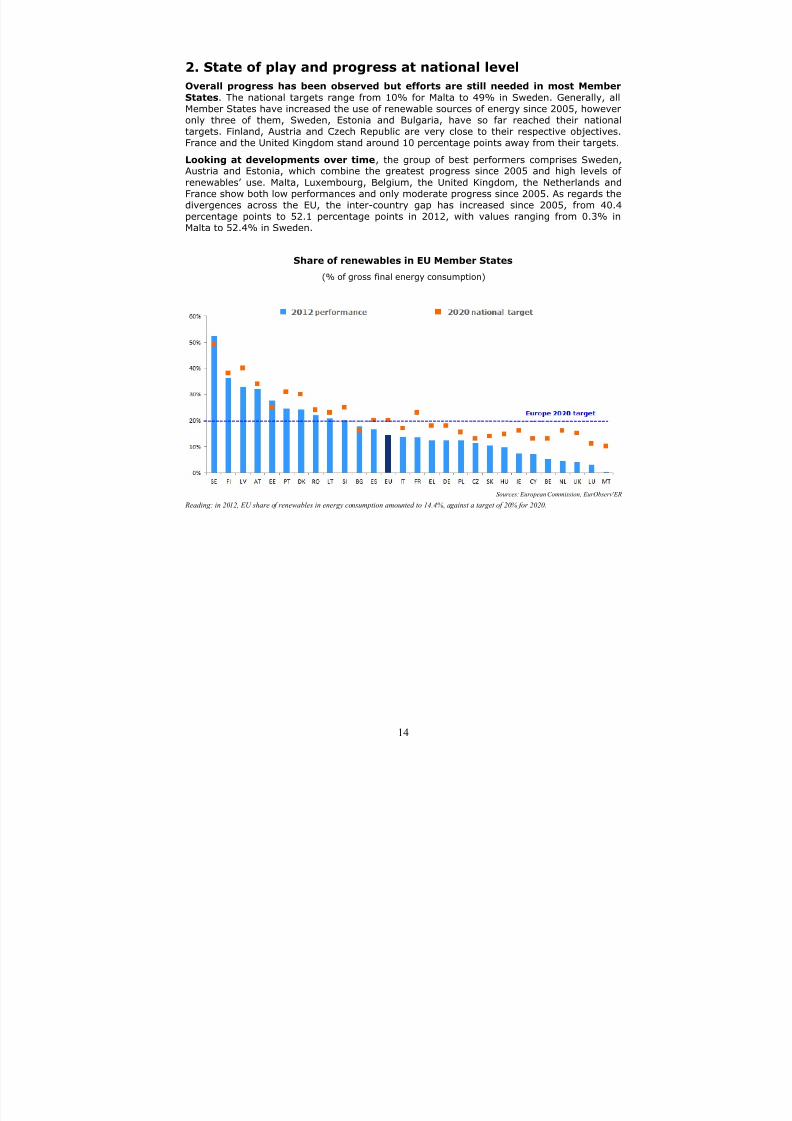
Overall progress has been observed but efforts are still needed in most Member
States. The national targets range from 10% for Malta to 49% in Sweden. Generally, allMember States have increased the use of renewable sources of energy since 2005, howeveronly three of them, Sweden, Estonia and Bulgaria, have so far reached their nationaltargets. Finland, Austria and Czech Republic are very close to their respective objectives.France and the United Kingdom stand around 10 percentage points away from their targets.
Looking at developments over time, the group of best performers comprises Sweden,Austria and Estonia, which combine the greatest progress since 2005 and high levels of
renewables’ use. Malta, Luxembourg, Belgium, the United Kingdom, the Netherlands andFrance show both low performances and only moderate progress since 2005. As regards thedivergences across the EU, the inter-country gap has increased since 2005, from 40.4percentage points to 52.1 percentage points in 2012, with values ranging from 0.3% inMalta to 52.4% in Sweden.
Share of renewables in EU Member States
(% of gross final energy consumption)
Sources: European Commission, EurObserv'ER
Reading: in 2012, EU share of renewables in energy consumption amounted to 14.4%, against a target of 20% for 2020.
7/21/2019 Europe2020stocktaking Annex En
http://slidepdf.com/reader/full/europe2020stocktaking-annex-en 15/35
15
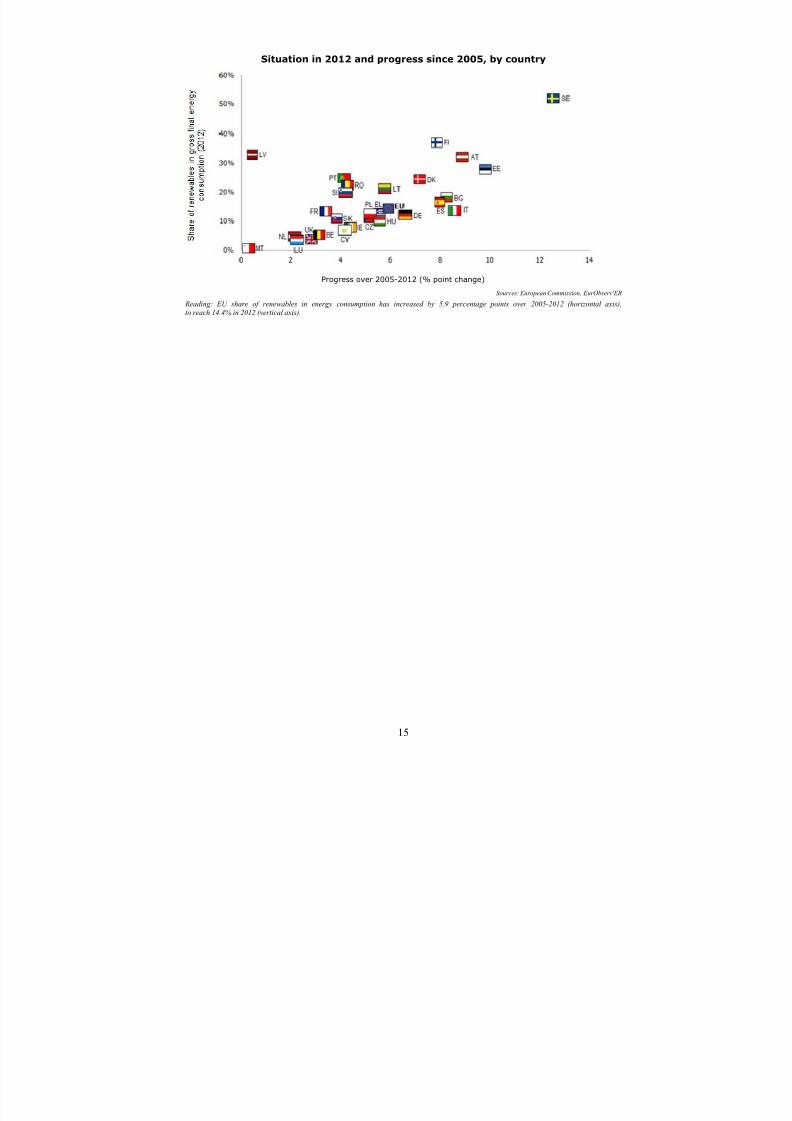
Situation in 2012 and progress since 2005, by country
Progress over 2005-2012 (% point change)
Sources: European Commission, EurObserv'ER
Reading: EU share of renewables in energy consumption has increased by 5.9 percentage points over 2005-2012 (horizontal axis),
to reach 14.4% in 2012 (vertical axis).
7/21/2019 Europe2020stocktaking Annex En
http://slidepdf.com/reader/full/europe2020stocktaking-annex-en 16/35
16
EUROPE 2020 TARGET ON CLIMATE AND ENERGY (3)
ACHIEVE A 20% INCREASE IN ENERGY EFFICIENCY
1. State of play at EU level
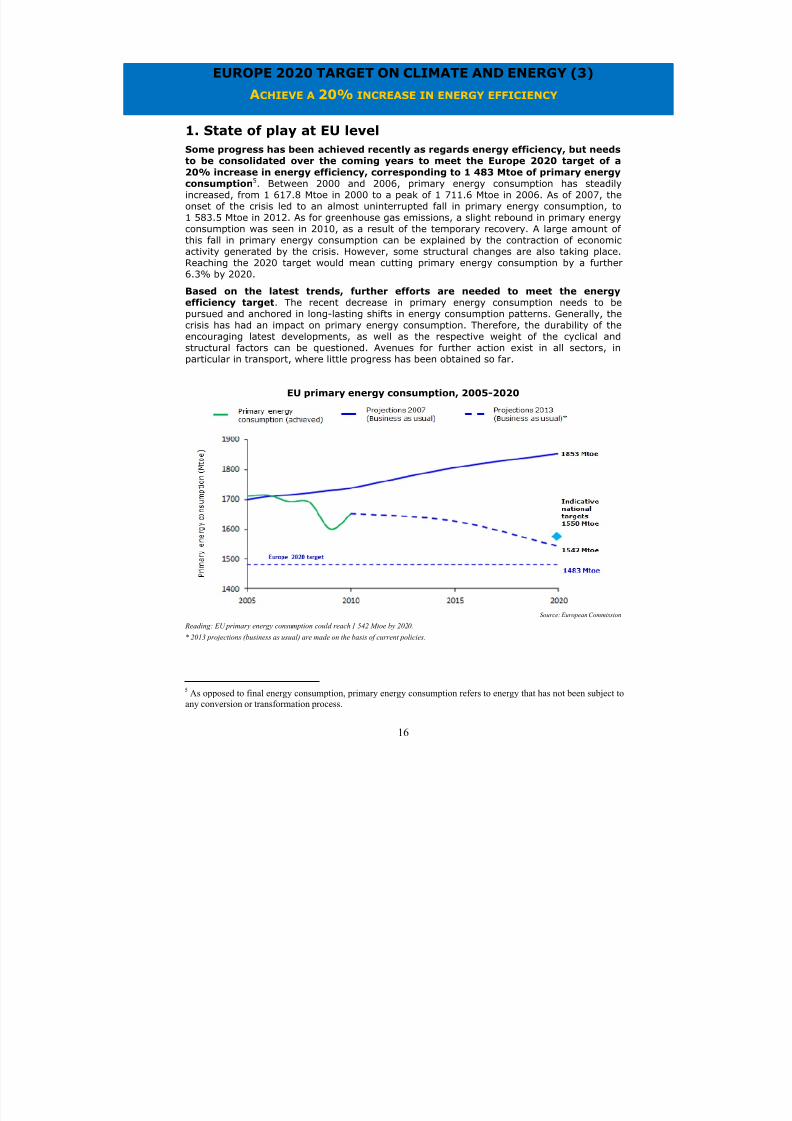
Some progress has been achieved recently as regards energy efficiency, but needsto be consolidated over the coming years to meet the Europe 2020 target of a
20% increase in energy efficiency, corresponding to 1 483 Mtoe of primary energyconsumption5. Between 2000 and 2006, primary energy consumption has steadilyincreased, from 1 617.8 Mtoe in 2000 to a peak of 1 711.6 Mtoe in 2006. As of 2007, theonset of the crisis led to an almost uninterrupted fall in primary energy consumption, to1 583.5 Mtoe in 2012. As for greenhouse gas emissions, a slight rebound in primary energyconsumption was seen in 2010, as a result of the temporary recovery. A large amount ofthis fall in primary energy consumption can be explained by the contraction of economicactivity generated by the crisis. However, some structural changes are also taking place.Reaching the 2020 target would mean cutting primary energy consumption by a further
6.3% by 2020.Based on the latest trends, further efforts are needed to meet the energyefficiency target. The recent decrease in primary energy consumption needs to bepursued and anchored in long-lasting shifts in energy consumption patterns. Generally, thecrisis has had an impact on primary energy consumption. Therefore, the durability of theencouraging latest developments, as well as the respective weight of the cyclical andstructural factors can be questioned. Avenues for further action exist in all sectors, inparticular in transport, where little progress has been obtained so far.
EU primary energy consumption, 2005-2020
Source: European Commission
Reading: EU primary energy consumption could reach 1 542 Mtoe by 2020.
* 2013 projections (business as usual) are made on the basis of current policies.
5 As opposed to final energy consumption, primary energy consumption refers to energy that has not been subject toany conversion or transformation process.
7/21/2019 Europe2020stocktaking Annex En
http://slidepdf.com/reader/full/europe2020stocktaking-annex-en 17/35
17
2. State of play and progress at national level
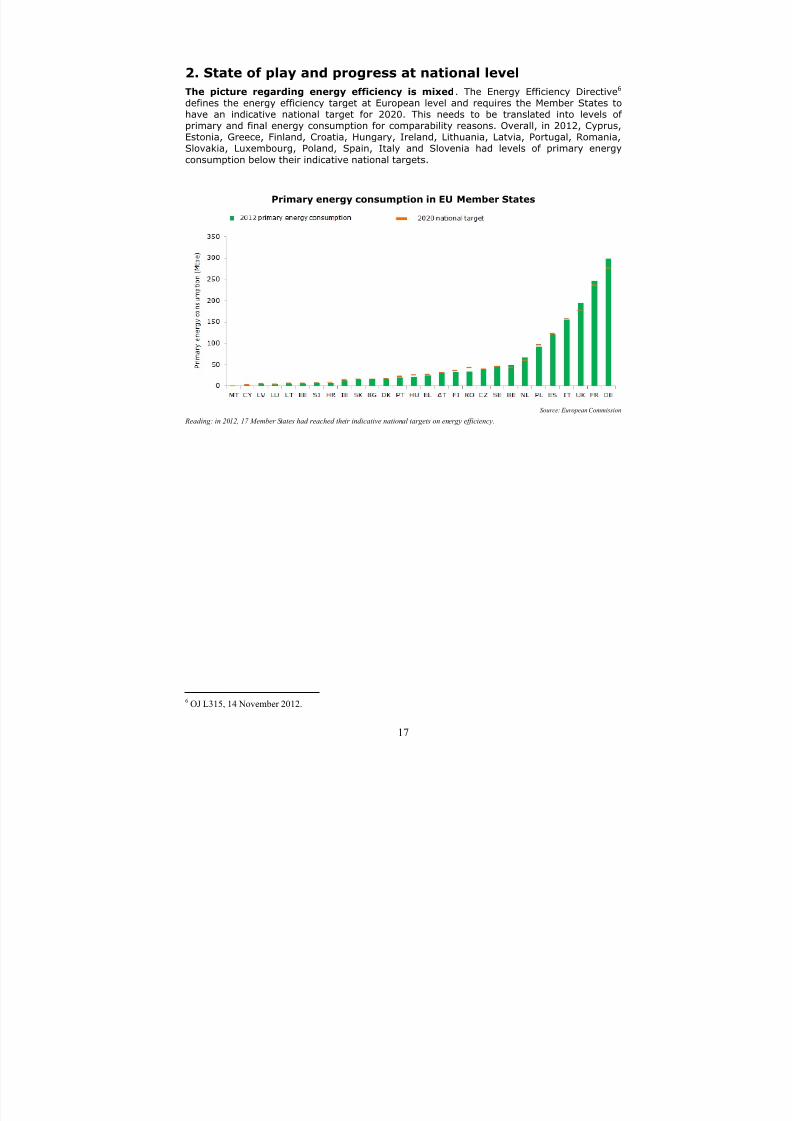
The picture regarding energy efficiency is mixed. The Energy Efficiency Directive6 defines the energy efficiency target at European level and requires the Member States tohave an indicative national target for 2020. This needs to be translated into levels ofprimary and final energy consumption for comparability reasons. Overall, in 2012, Cyprus,
Estonia, Greece, Finland, Croatia, Hungary, Ireland, Lithuania, Latvia, Portugal, Romania,Slovakia, Luxembourg, Poland, Spain, Italy and Slovenia had levels of primary energy
consumption below their indicative national targets.
Primary energy consumption in EU Member States
Source: European Commission
Reading: in 2012, 17 Member States had reached their indicative national targets on energy efficiency.
6 OJ L315, 14 November 2012.
7/21/2019 Europe2020stocktaking Annex En
http://slidepdf.com/reader/full/europe2020stocktaking-annex-en 18/35
18
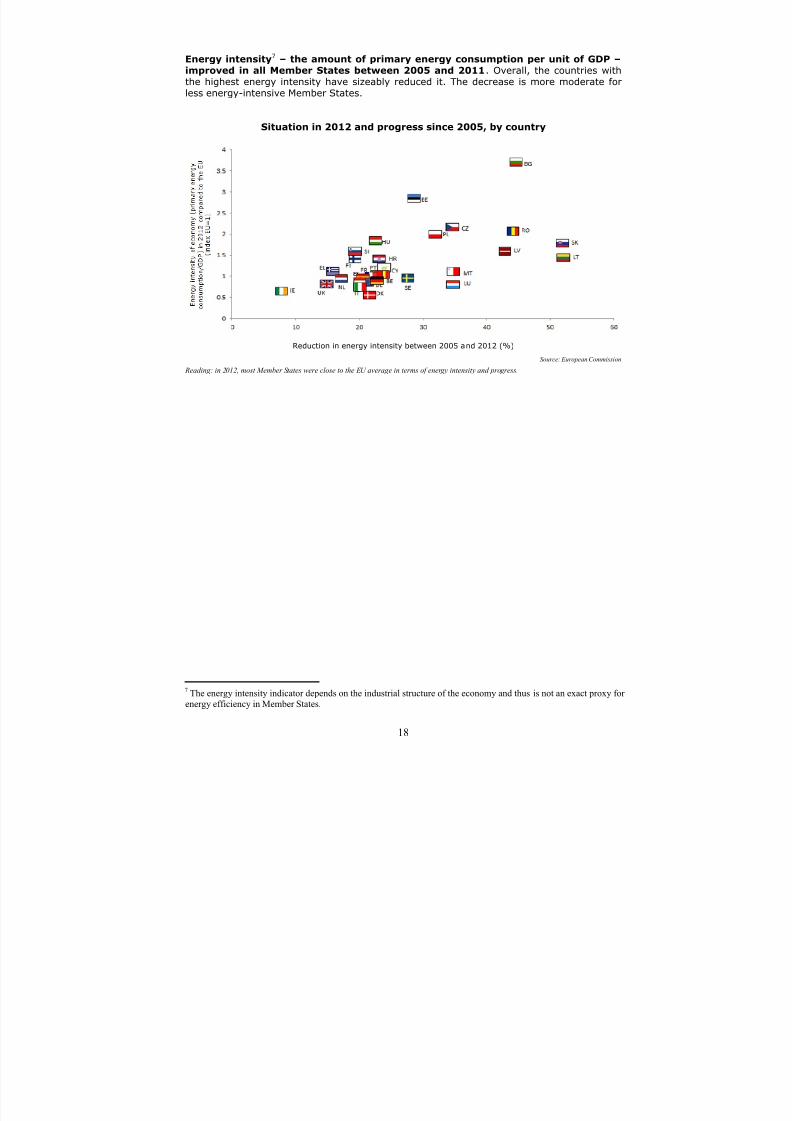
Energy intensity7 – the amount of primary energy consumption per unit of GDP –improved in all Member States between 2005 and 2011. Overall, the countries withthe highest energy intensity have sizeably reduced it. The decrease is more moderate forless energy-intensive Member States.
Situation in 2012 and progress since 2005, by country
Reduction in energy intensity between 2005 and 2012 (%)
Source: European Commission
Reading: in 2012, most Member States were close to the EU average in terms of energy intensity and progress.
7 The energy intensity indicator depends on the industrial structure of the economy and thus is not an exact proxy forenergy efficiency in Member States.
7/21/2019 Europe2020stocktaking Annex En
http://slidepdf.com/reader/full/europe2020stocktaking-annex-en 19/35
19
EUROPE 2020 TARGET ON EDUCATION (1)
R EDUCE THE SHARE OF EARLY SCHOOL LEAVERS TO BELOW 10%
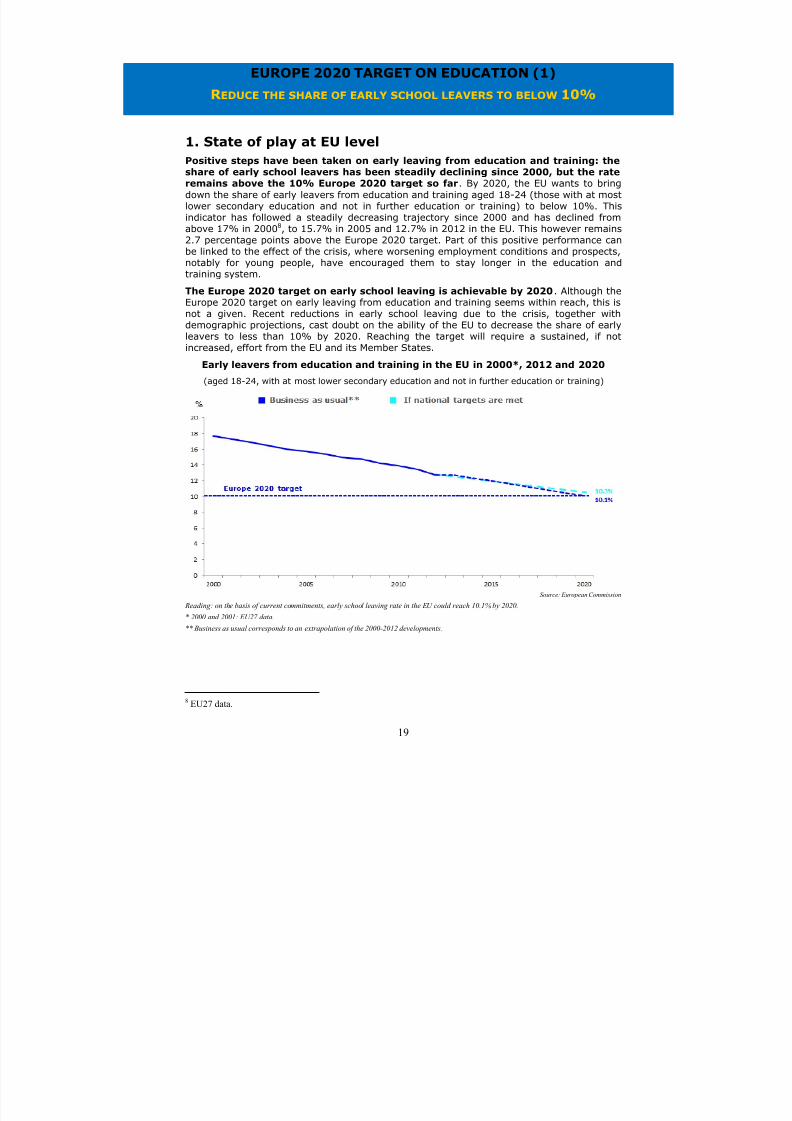
1. State of play at EU levelPositive steps have been taken on early leaving from education and training: theshare of early school leavers has been steadily declining since 2000, but the rateremains above the 10% Europe 2020 target so far. By 2020, the EU wants to bring
down the share of early leavers from education and training aged 18-24 (those with at mostlower secondary education and not in further education or training) to below 10%. Thisindicator has followed a steadily decreasing trajectory since 2000 and has declined fromabove 17% in 20008, to 15.7% in 2005 and 12.7% in 2012 in the EU. This however remains2.7 percentage points above the Europe 2020 target. Part of this positive performance canbe linked to the effect of the crisis, where worsening employment conditions and prospects,notably for young people, have encouraged them to stay longer in the education and
training system.The Europe 2020 target on early school leaving is achievable by 2020. Although theEurope 2020 target on early leaving from education and training seems within reach, this isnot a given. Recent reductions in early school leaving due to the crisis, together withdemographic projections, cast doubt on the ability of the EU to decrease the share of earlyleavers to less than 10% by 2020. Reaching the target will require a sustained, if notincreased, effort from the EU and its Member States.
Early leavers from education and training in the EU in 2000*, 2012 and 2020
(aged 18-24, with at most lower secondary education and not in further education or training)
Source: European Commission
Reading: on the basis of current commitments, early school leaving rate in the EU could reach 10.1% by 2020.
* 2000 and 2001: EU27 data.
** Business as usual corresponds to an extrapolation of the 2000-2012 developments.
8 EU27 data.

7/21/2019 Europe2020stocktaking Annex En
http://slidepdf.com/reader/full/europe2020stocktaking-annex-en 20/35
20
2. State of play and progress at national level
Ambition in terms of reducing early leaving from education and training variesacross Member States. With national targets ranging from 4% in Croatia to 16% in Italy,the Member States have shown different levels of ambition, which makes the path to thetarget more or less difficult. In 2012, 9 Member States, namely Denmark, Slovenia, Czech
Republic, Sweden, Luxembourg, Austria, Latvia, Lithuania and Slovakia, had already mettheir respective targets, nevertheless some of these countries had set less ambitious targets
than other Member States. Croatia, Germany, the Netherlands and Finland are alsoapproaching their targets, whereas Spain, Portugal, Malta and Romania remain far from
their objectives. This can partly be explained by the fact that these countries have setsomewhat ambitious targets.
Looking at developments over time, four main groups of countries can be
identified: some Member States such as Spain, Romania and Italy, display high rates ofearly leaving from education and training and relatively slow progress. Portugal and Malta
also show high rates of early school leaving, but have achieved substantial progress since2000. On the other end of the spectrum, some good performers have only made slightprogress since 2000 – in the case of Luxembourg and Croatia, the rate of early leaving from
education and training even increased between 2000 and 2012. Denmark and Lithuaniastand as the best performers, combining low early school leaving rates with notableprogress since 2000. By 2020, according to the latest projections, most of the MemberStates are likely to meet their target, with the exception of Spain, Portugal and Romania.
Early leavers from education and training in EU Member States
(aged 18-24, with at most lower secondary education and not in further education or training)
Source: European Commission
Reading: the EU average rate of early leavers from education and training was 12.7% in 2012, against a target of 10% for 2020.
* EU28, DK, DE, LU and SE: <10%; LT: <9%; SK: <6%. The UK has not set a target.

7/21/2019 Europe2020stocktaking Annex En
http://slidepdf.com/reader/full/europe2020stocktaking-annex-en 21/35
21
Situation in 2012 and progress since 2000*, by country
% point annual change in the rate of early leaving from education and training (2000-2012)
Source: European Commission
Reading: the rate of early leaving from education and training in the EU was reduced by around 0.4 percentage point every year over 2002-2012
(horizontal axis), to reach 12.7% in 2012 (vertical axis).
* EU: 2002-2012
Early school leaving is marked by gradually decreasing variations across the EU.The gap between the lowest and the highest early school leaving rate has declined by morethan half between 2000 and 2012. With the lowest rate for Sweden, at 7.3% and thehighest for Malta, at 54.2%, the gap reached 46.9 percentage points in 2000. In 2012, it
decreased to 20.7 percentage points, with the lowest value at 4.2% for Croatia and thehighest at 24.9% for Spain. Overall, Southern European countries tend to have highest
shares of early leaving from education and training. Reflecting this pattern, regions inNorthern and Eastern European countries have predominantly low rates of early schoolleaving, in contrast with Southern European regions.

7/21/2019 Europe2020stocktaking Annex En
http://slidepdf.com/reader/full/europe2020stocktaking-annex-en 22/35
22
EUROPE 2020 TARGET ON EDUCATION (2)
INCREASE THE SHARE OF THE POPULATION AGED 30-34
HAVING COMPLETED TERTIARY EDUCATION TO AT LEAST 40%
1. State of play at EU level
Good progress has been made towards the Europe 2020 target of 40% of tertiary(or equivalent) educational attainment and needs to be pursued. The secondindicator related to education aims to raise the share of young people aged 30-34 havingcompleted tertiary (or equivalent) education to 40%. With a rate of 22.4% in 20009, 27.9%in 2005 and 35.7% in 2012, corresponding to an increase of 13.3 percentage points in 12years, the EU has significantly advanced towards its target and the number of tertiarygraduates has rapidly increased. Only 4.3 percentage points separate the current EUperformance from the 40% Europe 2020 target.
The Europe 2020 target on tertiary attainment rate is within reach by 2020. On the
basis of the latest developments where significant progress has already been achieved, andassuming that the past trend will continue, there are good chances that the target ontertiary (or equivalent) attainment can be met.
Tertiary educational attainment rate in the EU, 2000-2020*
(% of population aged 30-34 with completed tertiary education – ISCED levels 5 and 6)
Source: European Commission
Reading: on the basis of current commitments, EU tertiary attainment rate could reach 45.1% by 2020.
* 2000-2001: EU27 data.
** Business as usual corresponds to an extrapolation of 2000-2012 developments.
9 EU27 data.
7/21/2019 Europe2020stocktaking Annex En
http://slidepdf.com/reader/full/europe2020stocktaking-annex-en 23/35
23
2. State of play and progress at national level
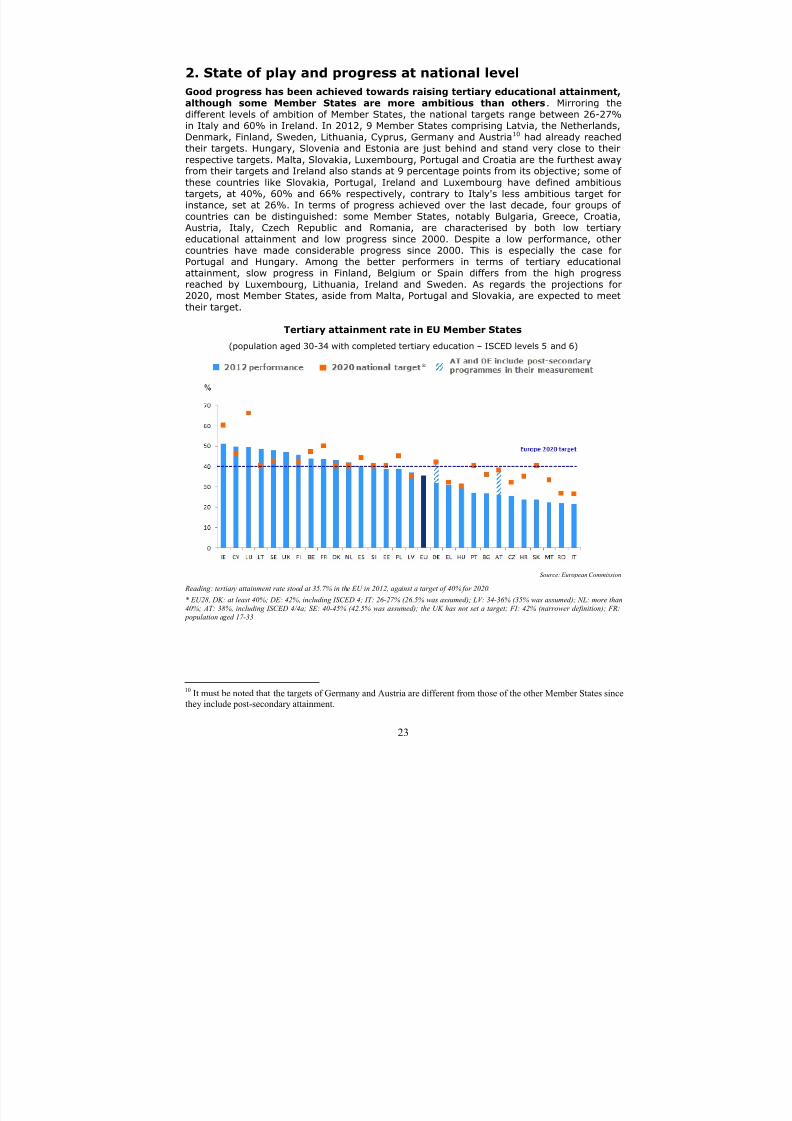
Good progress has been achieved towards raising tertiary educational attainment,although some Member States are more ambitious than others. Mirroring thedifferent levels of ambition of Member States, the national targets range between 26-27%in Italy and 60% in Ireland. In 2012, 9 Member States comprising Latvia, the Netherlands,
Denmark, Finland, Sweden, Lithuania, Cyprus, Germany and Austria10
had already reachedtheir targets. Hungary, Slovenia and Estonia are just behind and stand very close to their
respective targets. Malta, Slovakia, Luxembourg, Portugal and Croatia are the furthest awayfrom their targets and Ireland also stands at 9 percentage points from its objective; some of
these countries like Slovakia, Portugal, Ireland and Luxembourg have defined ambitioustargets, at 40%, 60% and 66% respectively, contrary to Italy's less ambitious target forinstance, set at 26%. In terms of progress achieved over the last decade, four groups ofcountries can be distinguished: some Member States, notably Bulgaria, Greece, Croatia,Austria, Italy, Czech Republic and Romania, are characterised by both low tertiaryeducational attainment and low progress since 2000. Despite a low performance, othercountries have made considerable progress since 2000. This is especially the case forPortugal and Hungary. Among the better performers in terms of tertiary educational
attainment, slow progress in Finland, Belgium or Spain differs from the high progressreached by Luxembourg, Lithuania, Ireland and Sweden. As regards the projections for2020, most Member States, aside from Malta, Portugal and Slovakia, are expected to meet
their target.
Tertiary attainment rate in EU Member States
(population aged 30-34 with completed tertiary education – ISCED levels 5 and 6)
Source: European Commission
Reading: tertiary attainment rate stood at 35.7% in the EU in 2012, against a target of 40% for 2020.
* EU28, DK: at least 40%; DE: 42%, including ISCED 4; IT: 26-27% (26.5% was assumed); LV: 34-36% (35% was assumed); NL: more than
40%; AT: 38%, including ISCED 4/4a; SE: 40-45% (42.5% was assumed); the UK has not set a target; FI: 42% (narrower definition); FR:
population aged 17-33
10 It must be noted that the targets of Germany and Austria are different from those of the other Member States sincethey include post-secondary attainment.
7/21/2019 Europe2020stocktaking Annex En
http://slidepdf.com/reader/full/europe2020stocktaking-annex-en 24/35
24
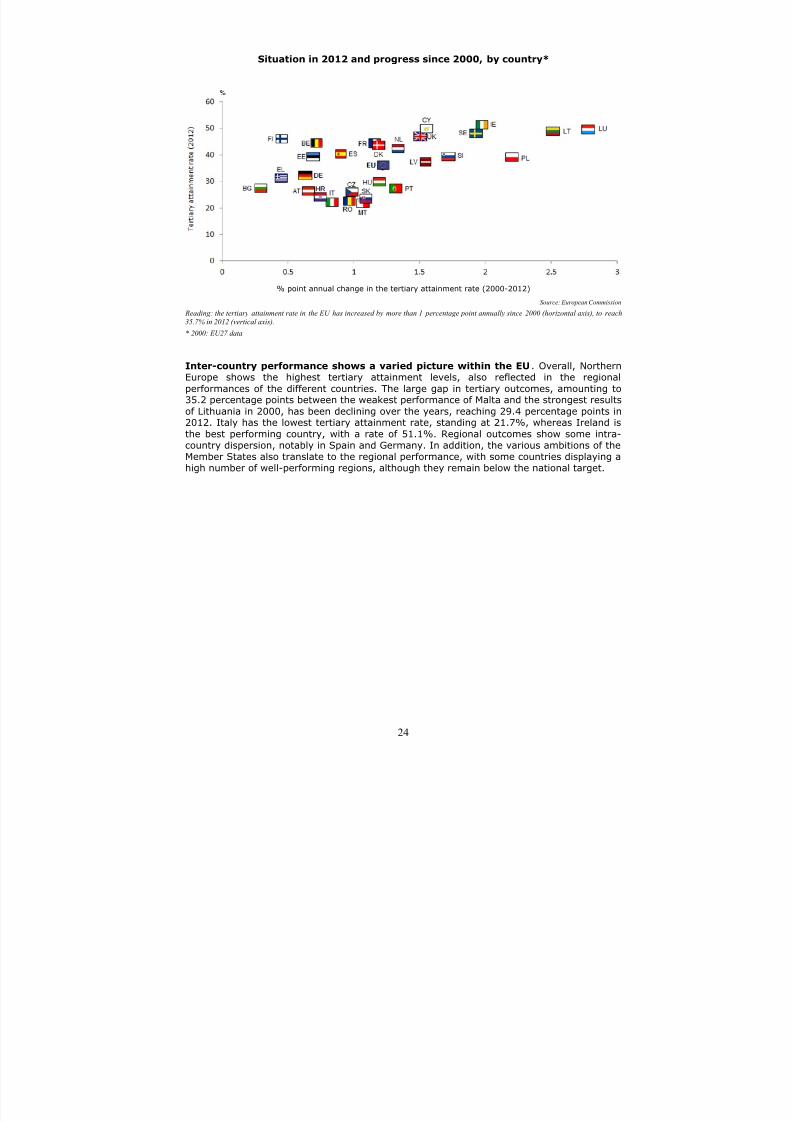
Situation in 2012 and progress since 2000, by country*
% point annual change in the tertiary attainment rate (2000-2012)
Source: European Commission
Reading: the tertiary attainment rate in the EU has increased by more than 1 percentage point annually since 2000 (horizontal axis), to reach
35.7% in 2012 (vertical axis).
* 2000: EU27 data
Inter-country performance shows a varied picture within the EU. Overall, NorthernEurope shows the highest tertiary attainment levels, also reflected in the regional
performances of the different countries. The large gap in tertiary outcomes, amounting to35.2 percentage points between the weakest performance of Malta and the strongest results
of Lithuania in 2000, has been declining over the years, reaching 29.4 percentage points in2012. Italy has the lowest tertiary attainment rate, standing at 21.7%, whereas Ireland is
the best performing country, with a rate of 51.1%. Regional outcomes show some intra-country dispersion, notably in Spain and Germany. In addition, the various ambitions of theMember States also translate to the regional performance, with some countries displaying ahigh number of well-performing regions, although they remain below the national target.

7/21/2019 Europe2020stocktaking Annex En
http://slidepdf.com/reader/full/europe2020stocktaking-annex-en 25/35
25
EUROPE 2020 TARGET ON POVERTY AND SOCIAL EXCLUSION
LIFT AT LEAST 20 MILLION PEOPLE OUT OF
THE RISK OF POVERTY OR SOCIAL EXCLUSION
1. State of play at EU levelThe social impact of the crisis has been significant and the number of peopleexposed to poverty or social exclusion has increased, thus undermining progresstowards the achievement of the Europe 2020 target of lifting 20 million people out
of the risk of poverty or social exclusion. The target set by the EU corresponds to asituation where 96.4 million people are at risk of poverty or social exclusion in 202011. When
referring to the number of people at risk of poverty or social exclusion, the indicatorincludes the number of people affected by at least one of the three types of poverty, namely
income poverty (people at risk of poverty after social transfers12), material poverty(severely materially deprived people13) and people living in households with very low workintensity14.
People at risk of poverty or social exclusion in the EU, 2012
Source: European Commission
Reading: based on three different ways of measuring poverty, a total of 124.2 million people were at risk of poverty or social exclusion in the EU
in 2012 (with 9.3 million people belonging to the three groups).
Given the harsh impact of the crisis, the Europe 2020 target on poverty seems outof reach. The years until 2009 were marked by a steady decrease in the number of peopleexposed to poverty or social exclusion. The lowest level was reached in 2009, with around114 million people at risk of poverty or social exclusion15, against more than 124 million in
11 2008 is used as base year.
12 “Persons with an equivalised disposable income below the risk-of-poverty threshold, which is set at 60% of the
national median equivalised disposable income (after social transfers)”. Source: European Commission.13 “Severely materially deprived persons have living conditions severely constrained by a lack of resources, theyexperience at least 4 out of 9 following deprivation items: cannot afford (i) to pay rent or utility bills, (ii) keep homeadequately warm, (iii) face unexpected expenses, (iv) eat meat, fish or a protein equivalent every second day, (v) aweek holiday away from home, (vi) a car, (vii) a washing machine, (viii) a colour TV, or (ix) a telephone”. Source:European Commission.14
“People living in households with very low work intensity are people aged 0-59 who are not students and live inhouseholds where the adults work less than 20% of their total work potential during the past year”. Source:
European Commission.15 EU27 data.
7/21/2019 Europe2020stocktaking Annex En
http://slidepdf.com/reader/full/europe2020stocktaking-annex-en 26/35
26
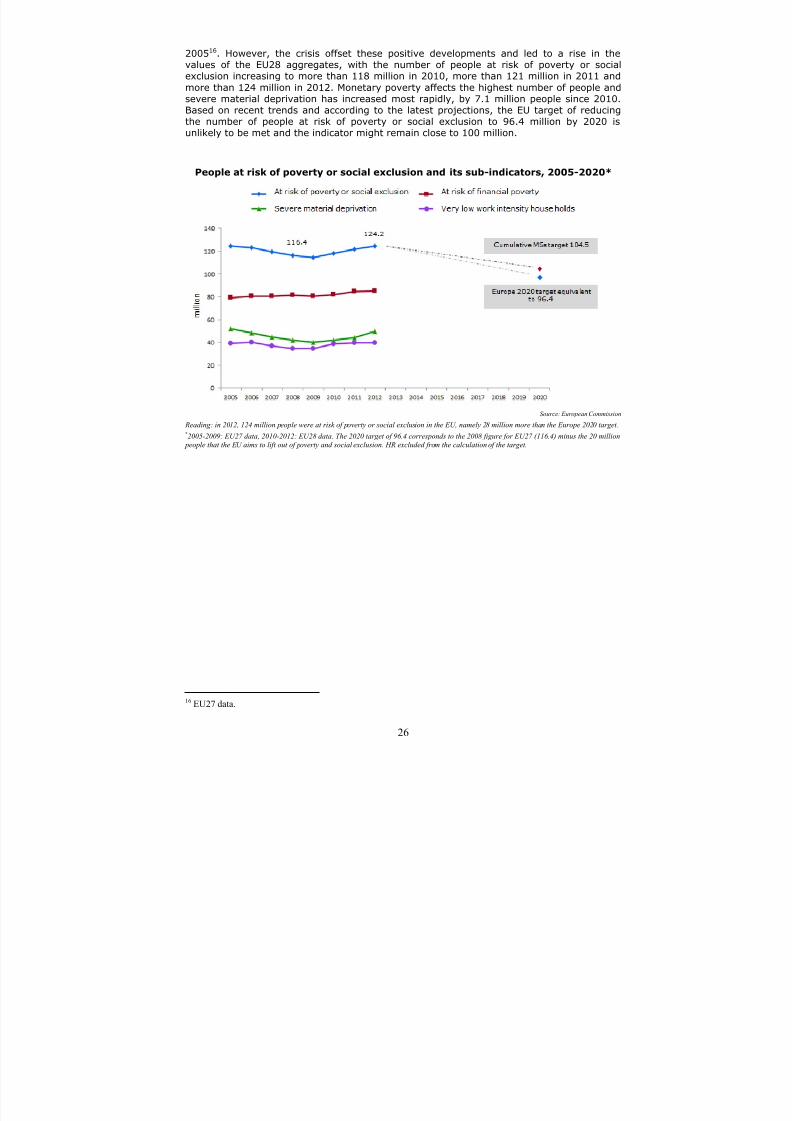
200516. However, the crisis offset these positive developments and led to a rise in thevalues of the EU28 aggregates, with the number of people at risk of poverty or socialexclusion increasing to more than 118 million in 2010, more than 121 million in 2011 and
more than 124 million in 2012. Monetary poverty affects the highest number of people andsevere material deprivation has increased most rapidly, by 7.1 million people since 2010.Based on recent trends and according to the latest projections, the EU target of reducingthe number of people at risk of poverty or social exclusion to 96.4 million by 2020 isunlikely to be met and the indicator might remain close to 100 million.
People at risk of poverty or social exclusion and its sub-indicators, 2005-2020*
Source: European Commission Reading: in 2012, 124 million people were at risk of poverty or social exclusion in the EU, namely 28 million more than the Europe 2020 target.*2005-2009: EU27 data, 2010-2012: EU28 data. The 2020 target of 96.4 corresponds to the 2008 figure for EU27 (116.4) minus the 20 million
people that the EU aims to lift out of poverty and social exclusion. HR excluded from the calculation of the target.
16 EU27 data.
7/21/2019 Europe2020stocktaking Annex En
http://slidepdf.com/reader/full/europe2020stocktaking-annex-en 27/35
27
2. State of play and progress at national level
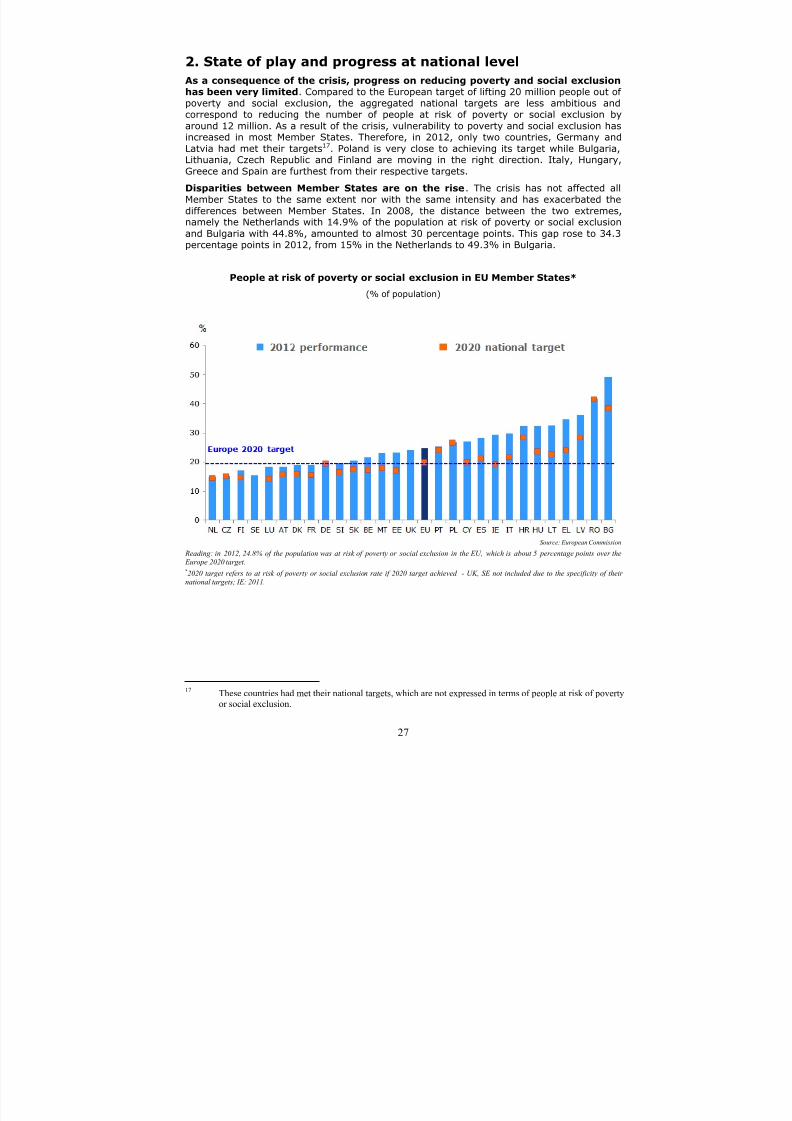
As a consequence of the crisis, progress on reducing poverty and social exclusionhas been very limited. Compared to the European target of lifting 20 million people out ofpoverty and social exclusion, the aggregated national targets are less ambitious andcorrespond to reducing the number of people at risk of poverty or social exclusion by
around 12 million. As a result of the crisis, vulnerability to poverty and social exclusion has
increased in most Member States. Therefore, in 2012, only two countries, Germany andLatvia had met their targets17. Poland is very close to achieving its target while Bulgaria,Lithuania, Czech Republic and Finland are moving in the right direction. Italy, Hungary,
Greece and Spain are furthest from their respective targets.
Disparities between Member States are on the rise. The crisis has not affected allMember States to the same extent nor with the same intensity and has exacerbated the
differences between Member States. In 2008, the distance between the two extremes,namely the Netherlands with 14.9% of the population at risk of poverty or social exclusion
and Bulgaria with 44.8%, amounted to almost 30 percentage points. This gap rose to 34.3percentage points in 2012, from 15% in the Netherlands to 49.3% in Bulgaria.
People at risk of poverty or social exclusion in EU Member States*
(% of population)
Source: European Commission
Reading: in 2012, 24.8% of the population was at risk of poverty or social exclusion in the EU, which is about 5 percentage points over the Europe 2020 target.*2020 target refers to at risk of poverty or social exclusion rate if 2020 target achieved - UK, SE not included due to the specificity of their
national targets; IE: 2011.
17 These countries had met their national targets, which are not expressed in terms of people at risk of povertyor social exclusion.

7/21/2019 Europe2020stocktaking Annex En
http://slidepdf.com/reader/full/europe2020stocktaking-annex-en 28/35
28
Situation in 2012 and progress since 2008, by country
% point change (2008-2012)
Source: European Commission
Reading: the share of population at risk of poverty or social exclusion increased by more than 1 percentage point between 2008 and 2012
(horizontal axis), to reach 24.8% of the population in 2012 (vertical axis).
2008: EU27 data.
7/21/2019 Europe2020stocktaking Annex En
http://slidepdf.com/reader/full/europe2020stocktaking-annex-en 29/35
29
Annex III: State of play on Flagships initiatives
FLAGSHIP INITIATIVE "AGENDA FOR NEW SKILLS AND JOBS"
1. Objective of the flagship initiative
"An agenda for new skills and jobs" is an overarching initiative on employment,encompassing the issues of flexicurity, skills, working conditions and job creation.
It aims to raise the employment rate with more and better jobs, help people anticipate andmanage change by equipping them with the right set of skills and competences, moderniselabour market and welfare systems, and ensure that the benefits of growth reach all parts
of the EU. The flagship initiative set out four major priorities, (i) to make European labourmarkets function better through the adaptation of flexicurity policies to a post-crisis context,
(ii) to endow people with skills adapted to labour market needs, (iii) to improve work qualityand working conditions and (iv) to promote job creation and labour demand. The agendawas set as a joint effort between the Commission and European institutions, MemberStates, social partners, as well as education and training institutions to deliver 13 keyactions accompanied by other support measures.
2. State of play in 2014
2.1 Deliverables and impact
Progress in the delivery of the initiative has been mixed. All actions in the areas offlexicurity and skills have been completed, with adaptations to the new economic context.Results in the area of quality of work and working conditions are more varied, with littleprogress in relation to working time and health and safety. No progress has been made inrelation to a proposal for guiding principles to promote enabling conditions for job creation,even if this key action is addressed to a certain extent in the context of the EuropeanSemester.
2.2 Lessons learnt
The impact of the flagship initiative at a macroeconomic level has been limited .The individual initiatives that have been put in place will help improve the functioning of the
labour market over time and tackle the main bottlenecks, especially in the areas of skillsand mobility. Yet, against the background of the crisis, the overall macroeconomic effects ofthe flagship initiative have been limited.
Awareness of the flagship initiative has been hampered in several respects. In2012, the deepening of the crisis made it necessary to complete the flagship with acomprehensive agenda for a job-rich recovery. The adoption of the Employment Package18
in April 2012 and the Youth Employment Package19 in December 2012 have to a largeextent shifted the policy focus and communication efforts away from the flagship initiative.
The flagship initiative did not fully succeed in creating a coherent framework foremployment policies and exploiting the synergies between the different actions. The linkwith the European Semester has been limited, in particular between EU-level initiativesadopted in the context of the flagship initiative and the country-specific analysis andrecommendations of the European Semester.
18 COM(2012)173.19 COM(2012)727.
7/21/2019 Europe2020stocktaking Annex En
http://slidepdf.com/reader/full/europe2020stocktaking-annex-en 30/35
30
FLAGSHIP INITIATIVE "YOUTH ON THE MOVE"
1. Objective of the flagship initiative
"Youth on the move" covers education and employment and is intended to
upgrade the performance of education, address the challenges faced by youngpeople on the labour market and facilitate school-to-work transition. "Youth on the
move" has set four priority areas, embracing the importance of (i) supporting theacquisition of skills through learning (formal, non-formal and informal), (ii) fostering theparticipation of young people in higher education, (iii) encouraging learning and job mobilityand (iv) supporting youth employment. The initiative aims to use EU funds as catalysts forimproving the education and training opportunities, the employability and the employmentof young people.
2. State of play in 2014
2.1 Deliverables and impact
"Youth on the move" has adopted a comprehensive and integrated approach. Bybringing together the issues of education and employment and striving to achieve smoothbridges between them, "Youth on the move" has opted for an all-embracing logic. This hasallowed bringing together a set of EU actions relevant for young people and putting youth-
related issues high on the European and national agendas.Thorough implementation of "Youth on the move" has been achieved. All follow-upactions in the flagship initiative have been delivered, with the exception of the "Youth on the
move card", which has been replaced by other tools. Actions were deployed in each of thefour pillars of the initiative: (i) a Council Recommendation targeting early school leavingwas formulated in 201120 and gave impetus to national action to reduce dropout rates, andcooperation at European level in the field of vocational education and training wasstrengthened; (ii) modernising higher education has been at the core of a Communicationfrom the Commission; (iii) mobility was fostered through a range of instruments, notablythe new integrated approach of the Erasmus+ programme, the European Skills Passport orthe scheme "Your First EURES job" aimed at providing labour market opportunities foryoung people in the 28 Member States; (iv) to fight against youth unemployment and
inactivity, a Council Recommendation21 establishing Youth Guarantees22 was adopted andYouth Guarantee schemes were launched – they can be supported by the European
Structural and Investment Funds and the Youth Employment Initiative, for Member Stateswith regions showing a youth unemployment rate of above 25%.
2.2 Lessons learnt
Communication on "Youth on the move" has been affected by several weaknesses.The framework agenda nature and long-term orientation of the actions contained in theinitiative have contrasted with the expectations of some stakeholders of an operationalspending programme. Communication on the programmes and initiatives launched in theeducation and youth employment area has created some confusion with the flagshipinitiative itself.
20 2011/C191/01.
21 2013/C120/01.
22 Youth Guarantees ensure that all young people under the age of 25 years receive a good-quality offer of
employment, continued education, an apprenticeship or a traineeship within a period of four months of becomingunemployed or leaving formal education.
7/21/2019 Europe2020stocktaking Annex En
http://slidepdf.com/reader/full/europe2020stocktaking-annex-en 31/35
31
FLAGSHIP INITIATIVE "INNOVATION UNION"
1. Objective of the flagship initiative
"Innovation Union" is a comprehensive package of actions aimed at achieving an
innovation-friendly environment within the EU. "Innovation Union" strives to boostresearch and innovation in the EU through a series of measures to the benefit of public
authorities, entrepreneurs, researchers and engineers, and citizens. Priority is given tochallenges of common interest, with the objective of improving framework conditions andaccess to finance for research and innovation activities, and in turn paving the way for asingle innovation market. To achieve this objective, "Innovation Union" builds on 34commitments and funding from the "Horizon 2020" programme among other instruments.
2. State of play in 2014
2.1 Deliverables and impact
The delivery of the initiative is well on track. 100% of the actions set out in the
context of "Innovation Union" are on course, with different levels of implementation. Inparticular, five European Innovation Partnerships, dealing with (i) active and healthyageing, (ii) agricultural sustainability and productivity, (iii) smart cities and communities,(iv) water and (v) raw materials, have been established in order to foster cooperation of EU,
national and subnational stakeholders. Measures reinforcing the use of public procurementfor innovation, introducing a passport for cross-country venture capital investment orcreating unitary patent protection go in the direction of improving the innovation-friendliness of the business environment. Steps have also been made towards theachievement of the European Research Area in 2014, which aims at increasing the efficiencyand effectiveness of public research systems to generate higher productivity,
competitiveness and growth in the EU.
Monitoring tools have been set up. A comprehensive Innovation Scoreboard provides anassessment of the innovation performance of EU Member States and the respectivestrengths and weaknesses of their research and innovation systems. In addition, a newindicator of innovation output – work is however still ongoing to address some of itslimitations – has been designed with a view to monitoring the EU's and its Member States'
innovation outcomes against their main trading partners. It relies on four main dimensions,namely technological innovation, employment in knowledge-intensive activities,
competitiveness of knowledge-intensive goods and services and employment in fast-growing firms of innovative sectors.
2.2 Lessons learnt
Full implementation of measures is key. The measures set out in the framework of"Innovation Union" go in the right direction; however, the materialisation of the associatedbenefits crucially depends on proper implementation.
"Innovation Union" has not prevented the increasing risk of innovation divide
inside the EU. Since 2008, the EU has managed to close almost half of its innovationperformance gap with the United States and Japan. Yet, within the EU, the dynamics of
convergence between the innovation performance of Member States has come to a halt anddisparities between countries are growing.
7/21/2019 Europe2020stocktaking Annex En
http://slidepdf.com/reader/full/europe2020stocktaking-annex-en 32/35
32
FLAGSHIP INITIATIVE "DIGITAL AGENDA FOR EUROPE"
1. Objective of the flagship initiative
"Digital agenda for Europe" was designed to help the EU and its Member States to
reap the benefits of a competitive digital single market. Faced with the fragmentationof European markets, preventing the EU from grasping the advantages of the digital
economy in terms of increased productivity, employment and growth, "Digital agenda forEurope" aims to unleash the digital potential and diffuse the digital culture widely across theEU. 101 actions, grouped around seven pillars, were initially identified to reach thisobjective. Following a review of the initiative carried out in December 2012, seven new keyactions were flagged. They mainly highlight the importance of fostering digitalinfrastructure, improving the regulatory environment, promoting digital skills and jobs andimplementing focused strategies in the areas of cyber-security, cloud computing andmicroelectronics.
2. State of play in 2014
2.1 Deliverables and impact
The flagship initiative managed to give the digital economy the necessary politicalattention. Its main strengths relate to the creation of a coherent and forward-looking
framework for action. The annual publication of a Digital Agenda Scoreboard and the yearly"Digital Assembly" stakeholder meeting helped to attract political and media attention."Digital agenda for Europe" also gave impetus to national replication and action in 20Member States and a number of regions who set up their own digital agendas.
Progress has been achieved in the delivery of the planned actions. In January 2014,more than 90% of actions foreseen in the flagship initiative were completed or on track. Theuse of the internet has now become widespread across the EU, ecommerce is gainingstrength, although its cross-border take-up remains limited so far, e-government serviceshave been developed and basic broadband coverage across the EU is complete.
2.2 Lessons learnt
The digital single market is not yet a reality and more investment is needed in
high-speed infrastructure. The persistence of obstacles such as fragmentation ofEuropean markets, infrastructure gaps and lack of consumer confidence still hampers thecompletion of the digital single market. The lack of high-speed broadband infrastructure is a
serious concern as it could generate a new digital divide and foster social exclusion incertain areas, particularly in rural areas.
Efficiency of the "Digital agenda for Europe" was affected by a number ofweaknesses. Visibility of the flagship initiative suffered from a lack of focus due to the highnumber of specific measures. The flagship initiative was also unable to bring information
and communication technology topics to the core of structural reform agendas.
7/21/2019 Europe2020stocktaking Annex En
http://slidepdf.com/reader/full/europe2020stocktaking-annex-en 33/35
33
FLAGSHIP INITIATIVE "INDUSTRIAL POLICY FOR THE GLOBALISATION ERA"
1. Objective of the flagship initiative
"Industrial policy for the globalisation era" strives to improve the competitiveness
of European industry through a coordinated approach. This initiative puts theemphasis on the need to combine innovation, diversification and sustainability and to
encourage the creation and development of SMEs. Building on 70 actions to increaseEuropean industrial competitiveness, the initiative aims to achieve a more business-friendlyenvironment and to accompany and support industry to cope with the new globalchallenges.
2. State of play in 2014
2.1 Deliverables and impact
Notable progress has been achieved towards the implementation of the initiative.90% of the 70 key actions initially identified in the initiative have been completed or are
ongoing. The Industrial Policy Communications released in 2010, 2012 and 2014 havesupported the translation of the flagship initiative's objectives into policy. Many actions ofthe initiative are oriented towards support for SMEs: the Small Business Act for Europe wasreviewed, and an Action plan to foster SMEs' access to finance and a strategy to promote
SMEs' internationalisation were adopted in 2011; a standardisation package was presentedin 2012 to make standard-setting more efficient; the Competitiveness and SME (COSME)programme was adopted in 2013 to buttress competitiveness and with Copernicus andGalileo, space policy initiatives provide a new dimension for service industries. ACommunication to encourage entrepreneurship was presented in 2012. Other actions aim toimprove the regulatory environment for businesses, notably by streamlining legislation
through regular "fitness checks" and reducing the time and cost needed to set up abusiness, to reinforce and deepen the single market with the adoption of the Single MarketActs I and II in 2011 and 2012 and to boost innovation and the modernisation of industry. Anumber of sector-specific initiatives have also been undertaken.
2.2 Lessons learnt
"Industrial policy for the globalisation era" has adopted a medium- to long-termapproach and a number of action strands will take time to deliver results. Nationalbudgets' investments in necessary network infrastructures have dwindled, the internalmarket is still insufficiently complete, conditions for access to finance for SMEs haveexperienced a setback through the crisis and progress in ensuring that adequately skilledlabour is available for industrial jobs has been slow. Most of the actions included in the
flagship initiative have a 3- to 10-year horizon. Only a minority of them have a short-term,operational orientation. Against the background of the economic crisis having a strong
negative impact on several sectors of industrial activity in the EU, the flagship actionsneeded to be complemented by actions on key priority areas, which could produce a shorter
or medium-term effect.

7/21/2019 Europe2020stocktaking Annex En
http://slidepdf.com/reader/full/europe2020stocktaking-annex-en 34/35
34
FLAGSHIP INITIATIVE "RESOURCE-EFFICIENT EUROPE"
1. Objective of the flagship initiative
The flagship initiative "Resource-efficient Europe" supports the shift towards a
resource-efficient and low-carbon economy. "Resource-efficient Europe" aims todecouple growth and resource use and provides a long-term framework for embedding
resource efficiency as a key principle in the design of policies, notably on climate change,energy, transport, industry, waste and raw materials, agriculture, fisheries, biodiversity andregional development. In light of the increasing strain on natural resources and theinternational dimension of this issue, "Resource-efficient Europe" aims to promote a smarteruse of resources by 2020, and anchor this logic to achieve further results in the 2050horizon. To this aim, it includes a series of initiatives launched since 2011.
2. State of play in 2014
2.1 Deliverables and impact
A range of actions contained in "Resource-efficient Europe" have already beeninitiated at EU level. Among the main measures covered by the initiative, all of them havealready been tabled by the Commission. In particular, a long-term policy framework up to2050 was presented in 2011. It consists of four roadmaps, namely the "Roadmap for
moving to a competitive low-carbon economy in 2050"23
, the "White Paper – Roadmap to aSingle European Transport Area – Towards a competitive and resource-efficient transportsystem"24, the "Energy Roadmap 2050"25 and the "Roadmap to a Resource EfficientEurope"26. This strategic framework was complemented by a number of mid-term initiatives,including a new biodiversity strategy "Our life insurance, our natural capital: an EUbiodiversity strategy to 2020"27 and "A Blueprint to Safeguard Europe's Water Resources"28
and the new "Clean Air Programme for Europe"29. The reform of the Common AgriculturalPolicy, with the introduction of a greening component, and the Common Fisheries Policy also
derive from the initiative. The Commission will continue working on the follow-up actionsannounced in the roadmaps or action plans delivered as part of this initiative. Moreover, theCommission further specified the 2050 roadmaps on climate and energy in itsCommunication on "A policy framework for climate and energy in the period from 2020 to2030" presented on 22 January 201430.
2.2 Lessons learnt
A more comprehensive approach is needed to measure resource efficiency.Resource efficiency spans many different policies and related resources. A single or limitedset of indicators would be useful to monitor improvements in the use of resources such asenergy, materials, land and water in an operational manner to drive policy development.However, it is difficult to analyse changes in the use of resources in a simplified way and to
design sufficiently precise indicator(s). Work thus needs to be pursued. The resource-efficiency scoreboard published by Eurostat with resource productivity as lead indicator is an
important step in this direction. Systematic monitoring with key indicators is also needed toassess progress towards a competitive, secure and sustainable energy use, as underlined inthe 2030 climate and energy policy framework.
23 COM(2011)112.24 COM(2011)144.25 COM(2011)885.26 COM(2011)571.27
COM(2011)244.28
COM(2012)673.
29 COM(2013)918.30 COM(2014)15.
7/21/2019 Europe2020stocktaking Annex En
http://slidepdf.com/reader/full/europe2020stocktaking-annex-en 35/35
FLAGSHIP INITIATIVE "THE EUROPEAN PLATFORM AGAINST POVERTY AND SOCIAL
EXCLUSION"
1. Objective of the flagship initiative
"The European platform against poverty and social exclusion" aims to ensureeconomic, social and territorial cohesion. Building on the 2010 European Year for
combating poverty and social exclusion, it strives to raise awareness and recognise thefundamental rights of people experiencing poverty and social exclusion, in order to enablethem to live in dignity and take an active part in society. The goal of the flagship initiativewas to come to an integrated approach to fight poverty, by joining up various policies in theeconomic, fiscal, social or single market areas. It also relied on a partnership approachbetween civil society, social partners and Member States. The initiative identified thecommitments for the Commission in 5 areas, (i) delivering actions across the policyspectrum, (ii) ensuring greater and more effective use of EU funds to support socialinclusion, (iii) promoting evidence-based social innovation, (iv) working in partnership and
harnessing the potential of the social economy and (v) fostering enhanced policycoordination among Member States. In particular, "The European platform against poverty
and social exclusion" identified 64 actions to be delivered by the Commission.
2. State of play in 2014
2.1 Deliverables and impact
Delivery of the initiative is happening at a fast pace. The Commission has deliveredapproximately two thirds of the 64 actions. To help Member States address these challengesthrough structural reforms in the context of a protracted crisis, the Commission has issuedpolicy guidance in the form of the Social Investment Package31 and the Recommendation
"Investing in children: breaking the cycle of disadvantage"32, the "EU Framework forNational Roma Integration Strategies up to 2020"33 and the White Paper on "An Agenda for
Adequate, Safe and Sustainable Pensions"34. The Commission has presented a proposal fora directive on payment accounts. To support the social economy and social entrepreneurs, ithas published the Social Business Initiative and established an EU Social EntrepreneurshipFund. The Commission has also published guiding principles for active ageing and solidaritybetween generations and launched an Active Ageing index. Another distinctive initiativecarried out in the context of "The European platform against poverty and social exclusion" isthe Annual Poverty Convention.
2.2 Lessons learnt
A number of obstacles have hindered full efficiency of the flagship initiative . Theadoption of the Social Investment Package has to a large extent shifted the policy focus andcommunication efforts away from the flagship initiative. The flagship initiative also did not
fully succeed in creating a coherent and integrated framework for social policies andexploiting the synergies between the different actions; it is rather a collection of initiatives
and the value added of the flagship initiative is not self-evident.
31 COM(2013)83.
322013/112/EU.
33 COM(2011)173.34 COM(2012)55