europe - the heritage foundation · europe: quick facts europe europe has served as the testing...
TRANSCRIPT

EUROPE
198 2017 Index of Economic Freedom
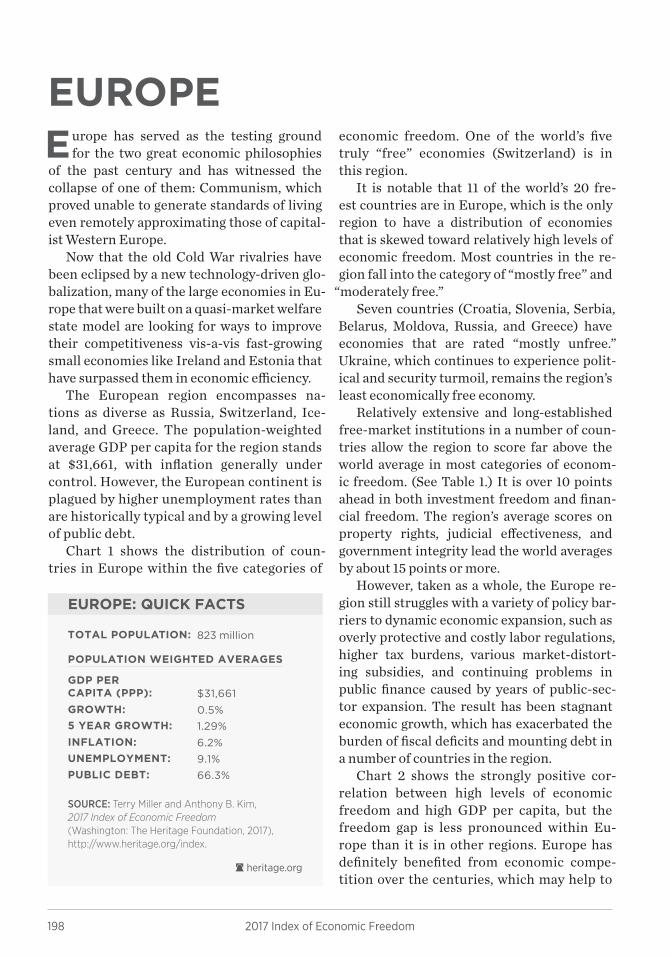
TOTAL POPULATION: 823 million
heritage.org
SOURCE: Terry Miller and Anthony B. Kim, 2017 Index of Economic Freedom (Washington: The Heritage Foundation, 2017), http://www.heritage.org/index.
GDP PER CAPITA (PPP): $31,661GROWTH: 0.5%5 YEAR GROWTH: 1.29%INFLATION: 6.2%UNEMPLOYMENT: 9.1%PUBLIC DEBT: 66.3%
POPULATION WEIGHTED AVERAGES
EUROPE: QUICK FACTS
EUROPEEurope has served as the testing ground
for the two great economic philosophies of the past century and has witnessed the collapse of one of them: Communism, which proved unable to generate standards of living even remotely approximating those of capital-ist Western Europe.
Now that the old Cold War rivalries have been eclipsed by a new technology-driven glo-balization, many of the large economies in Eu-rope that were built on a quasi-market welfare state model are looking for ways to improve their competitiveness vis-a-vis fast-growing small economies like Ireland and Estonia that have surpassed them in economic efficiency.
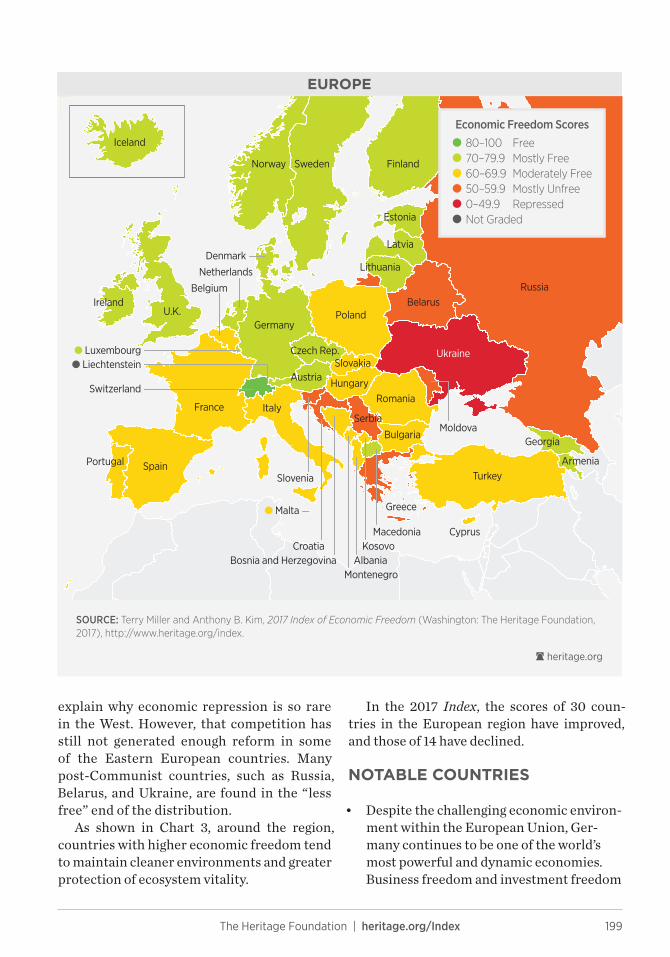
The European region encompasses na-tions as diverse as Russia, Switzerland, Ice-land, and Greece. The population-weighted average GDP per capita for the region stands at $31,661, with inflation generally under control. However, the European continent is plagued by higher unemployment rates than are historically typical and by a growing level of public debt.
Chart 1 shows the distribution of coun-tries in Europe within the five categories of
economic freedom. One of the world’s five truly “free” economies (Switzerland) is in this region.
It is notable that 11 of the world’s 20 fre-est countries are in Europe, which is the only region to have a distribution of economies that is skewed toward relatively high levels of economic freedom. Most countries in the re-gion fall into the category of “mostly free” and
“moderately free.”Seven countries (Croatia, Slovenia, Serbia,
Belarus, Moldova, Russia, and Greece) have economies that are rated “mostly unfree.” Ukraine, which continues to experience polit-ical and security turmoil, remains the region’s least economically free economy.
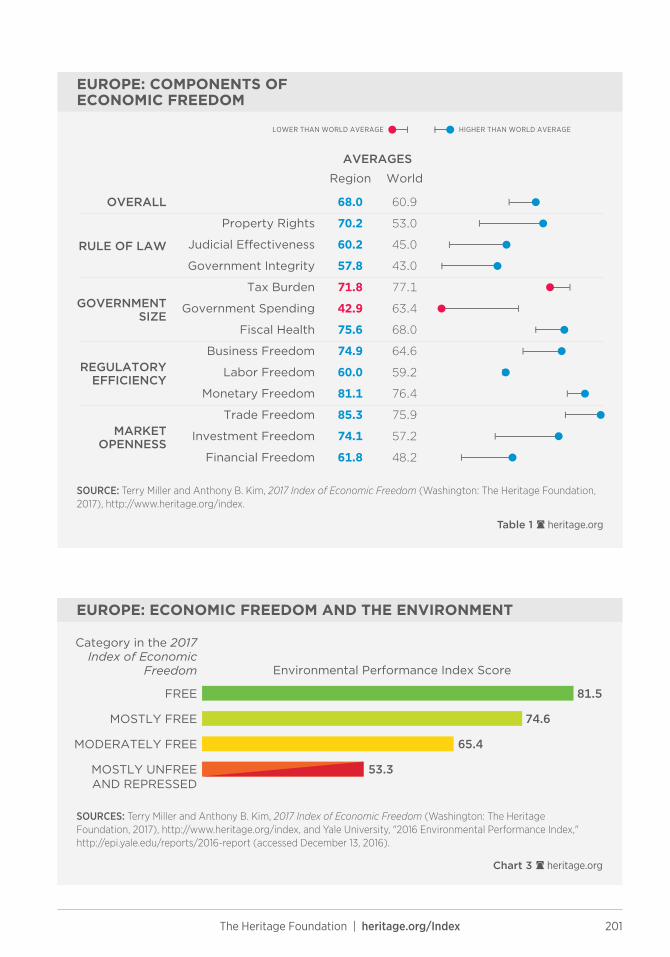
Relatively extensive and long-established free-market institutions in a number of coun-tries allow the region to score far above the world average in most categories of econom-ic freedom. (See Table 1.) It is over 10 points ahead in both investment freedom and finan-cial freedom. The region’s average scores on property rights, judicial effectiveness, and government integrity lead the world averages by about 15 points or more.
However, taken as a whole, the Europe re-gion still struggles with a variety of policy bar-riers to dynamic economic expansion, such as overly protective and costly labor regulations, higher tax burdens, various market-distort-ing subsidies, and continuing problems in public finance caused by years of public-sec-tor expansion. The result has been stagnant economic growth, which has exacerbated the burden of fiscal deficits and mounting debt in a number of countries in the region.
Chart 2 shows the strongly positive cor-relation between high levels of economic freedom and high GDP per capita, but the freedom gap is less pronounced within Eu-rope than it is in other regions. Europe has definitely benefited from economic compe-tition over the centuries, which may help to
199The Heritage Foundation | heritage.org/Index
EUROPE
heritage.org
SOURCE: Terry Miller and Anthony B. Kim, 2017 Index of Economic Freedom (Washington: The Heritage Foundation, 2017), http://www.heritage.org/index.
Russia
Ukraine
Belarus
Finland
Estonia
Latvia
Lithuania
SwedenNorway
Ireland
Portugal Spain
France Italy
U.K.
Netherlands
● Luxembourg● Liechtenstein
Belgium
Denmark
GermanyPoland
Slovakia
HungaryRomania
MoldovaSerbia
Bulgaria
Czech Rep.
Austria
AlbaniaMontenegro
Bosnia and HerzegovinaCroatia
● Malta
Slovenia
MacedoniaKosovo
Switzerland
Georgia
Turkey
Greece
Cyprus
Armenia
80–100 Free70–79.9 Mostly Free60–69.9 Moderately Free50–59.9 Mostly Unfree0–49.9 RepressedNot Graded
●
●
●
●
●
●
Economic Freedom ScoresIceland
explain why economic repression is so rare in the West. However, that competition has still not generated enough reform in some of the Eastern European countries. Many post-Communist countries, such as Russia, Belarus, and Ukraine, are found in the “less free” end of the distribution.
As shown in Chart 3, around the region, countries with higher economic freedom tend to maintain cleaner environments and greater protection of ecosystem vitality.
In the 2017 Index, the scores of 30 coun-tries in the European region have improved, and those of 14 have declined.
NOTABLE COUNTRIES
• Despite the challenging economic environ-ment within the European Union, Ger-many continues to be one of the world’s most powerful and dynamic economies. Business freedom and investment freedom

200 2017 Index of Economic Freedom
EUROPE: ECONOMIC FREEDOM SUMMARY
REPRESSED1
NOT GRADED1
MOSTLY UNFREE
7
MOSTLY FREE18
MODERATELY FREE
17
FREE1
heritage.orgChart 1
TOTAL45 COUNTRIES
SOURCE: Terry Miller and Anthony B. Kim, 2017 Index of Economic Freedom (Washington: The Heritage Foundation, 2017), http://www.heritage.org/index.
EUROPE: GDP PER CAPITA, BY ECONOMIC FREEDOM CATEGORY
heritage.orgChart 2
SOURCES: Terry Miller and Anthony B. Kim, 2017 Index of Economic Freedom (Washington: The Heritage Foundation, 2017), http://www.heritage.org/index, and International Monetary Fund, World Economic Outlook Database, April 2016, https://www.imf.org/external/pubs/ft/weo/2016/01/weodata/index.aspx (accessed December 13, 2016).
$0 $15000 $30000 $45000 $60000
FREE
MOSTLY FREE
MODERATELY FREE
MOSTLY UNFREE
REPRESSED
$58,647
$41,422
$27,140
$20,194
$7,987
are strong. Long-term competitiveness and entrepreneurial growth are supported by openness to global commerce, well-pro-tected property rights, and a sound busi-ness regulatory environment.
• The increasing dynamism of Latvia’s econ-omy has been facilitated by openness to global trade and investment. Supported by efficient business regulations that promote
entrepreneurial activity, the overall com-mercial environment has become condu-cive to business creation and risk-taking. Fiscal consolidation in recent years has kept government spending under control and ensured macroeconomic stability.
• The United Kingdom has continued its ef-forts to improve economic performance by reducing taxes and containing government
201The Heritage Foundation | heritage.org/Index
EUROPE: COMPONENTS OF ECONOMIC FREEDOM
heritage.orgTable 1
SOURCE: Terry Miller and Anthony B. Kim, 2017 Index of Economic Freedom (Washington: The Heritage Foundation, 2017), http://www.heritage.org/index.
Property Rights
Judicial E�ectiveness
Government Integrity
Tax Burden
Government Spending
Fiscal Health
Business Freedom
Labor Freedom
Monetary Freedom
Trade Freedom
Investment Freedom
Financial Freedom
68.0
70.2
60.2
57.8
71.8
42.9
75.6
74.9
60.0
81.1
85.3
74.1
61.8
60.9
53.0
45.0
43.0
77.1
63.4
68.0
64.6
59.2
76.4
75.9
57.2
48.2
RULE OF LAW
OVERALL
GOVERNMENT SIZE
REGULATORYEFFICIENCY
MARKET OPENNESS
LOWER THAN WORLD AVERAGE HIGHER THAN WORLD AVERAGE
Region World
AVERAGES
heritage.orgChart 3
SOURCES: Terry Miller and Anthony B. Kim, 2017 Index of Economic Freedom (Washington: The Heritage Foundation, 2017), http://www.heritage.org/index, and Yale University, "2016 Environmental Performance Index," http://epi.yale.edu/reports/2016-report (accessed December 13, 2016).
Category in the 2017 Index of Economic
Freedom Environmental Performance Index Score
EUROPE: ECONOMIC FREEDOM AND THE ENVIRONMENT
FREE
MOSTLY FREE
MODERATELY FREE
MOSTLY UNFREE AND REPRESSED
81.5
74.6
65.4
53.3
202 2017 Index of Economic Freedom
spending, and growth rates have picked up somewhat. The looming prospect of an exit from the European Union presents both major challenges and opportunities to improve regulatory and other policies that bear on economic freedom.
• Russia’s economy is severely hampered by blatant disdain for the rule of law and rejection of any concept of limited government. The private sector remains marginalized by structural and institu-tional constraints caused by ever-grow-ing government encroachment into the marketplace. Rising inflationary pressure jeopardizes macroeconomic stability.
• Spain’s economy has experienced a notable rebound facilitated by structural reforms. Ongoing efforts have focused on reducing the inefficient and oversized government sector and reforming the labor market. Top income tax rates on individuals and corporations have been lowered as well. Spain’s ongoing economic recovery, however, remains highly vul-nerable to challenges related to ensuring fiscal stability and restoring the financial sector’s competitiveness.
203The Heritage Foundation | heritage.org/Index
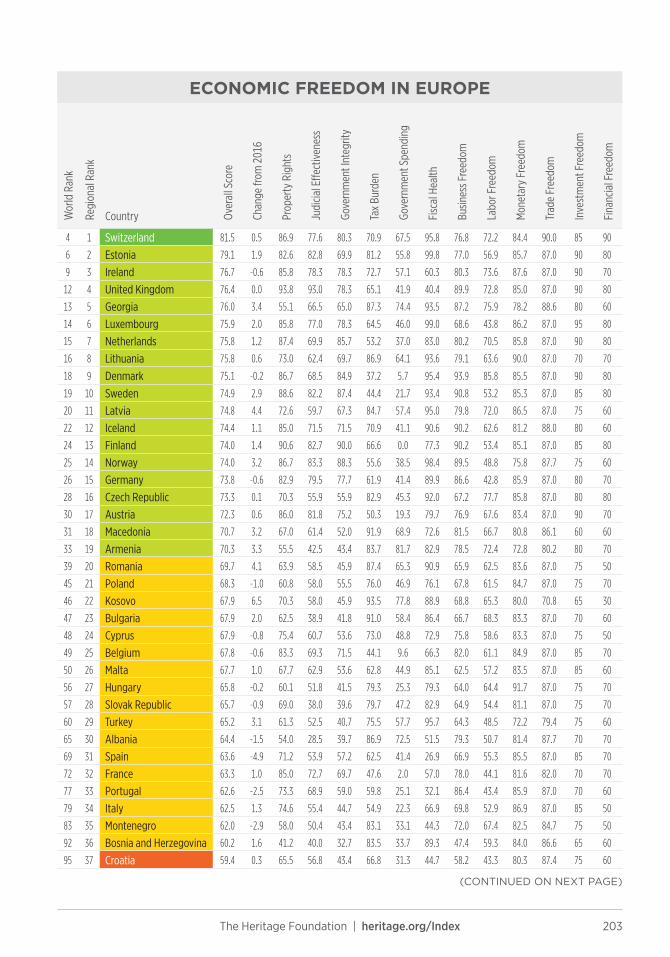
ECONOMIC FREEDOM IN EUROPEW
orld
Ran
k
Regi
onal
Ran
k
Country Over
all S
core
Chan
ge fr
om 2
016
Prop
erty
Rig
hts
Judi
cial E
� ect
iven
ess
Gove
rnm
ent I
nteg
rity
Tax
Burd
en
Gove
rnm
ent S
pend
ing
Fisc
al H
ealth
Busin
ess F
reed
om
Labo
r Fre
edom
Mon
etar
y Fr
eedo
m
Trad
e Fr
eedo
m
Inve
stm
ent F
reed
om
Fina
ncia
l Fre
edom
4 1 Switzerland 81.5 0.5 86.9 77.6 80.3 70.9 67.5 95.8 76.8 72.2 84.4 90.0 85 90
6 2 Estonia 79.1 1.9 82.6 82.8 69.9 81.2 55.8 99.8 77.0 56.9 85.7 87.0 90 80
9 3 Ireland 76.7 -0.6 85.8 78.3 78.3 72.7 57.1 60.3 80.3 73.6 87.6 87.0 90 70
12 4 United Kingdom 76.4 0.0 93.8 93.0 78.3 65.1 41.9 40.4 89.9 72.8 85.0 87.0 90 80
13 5 Georgia 76.0 3.4 55.1 66.5 65.0 87.3 74.4 93.5 87.2 75.9 78.2 88.6 80 60
14 6 Luxembourg 75.9 2.0 85.8 77.0 78.3 64.5 46.0 99.0 68.6 43.8 86.2 87.0 95 80
15 7 Netherlands 75.8 1.2 87.4 69.9 85.7 53.2 37.0 83.0 80.2 70.5 85.8 87.0 90 80
16 8 Lithuania 75.8 0.6 73.0 62.4 69.7 86.9 64.1 93.6 79.1 63.6 90.0 87.0 70 70
18 9 Denmark 75.1 -0.2 86.7 68.5 84.9 37.2 5.7 95.4 93.9 85.8 85.5 87.0 90 80
19 10 Sweden 74.9 2.9 88.6 82.2 87.4 44.4 21.7 93.4 90.8 53.2 85.3 87.0 85 80
20 11 Latvia 74.8 4.4 72.6 59.7 67.3 84.7 57.4 95.0 79.8 72.0 86.5 87.0 75 60
22 12 Iceland 74.4 1.1 85.0 71.5 71.5 70.9 41.1 90.6 90.2 62.6 81.2 88.0 80 60
24 13 Finland 74.0 1.4 90.6 82.7 90.0 66.6 0.0 77.3 90.2 53.4 85.1 87.0 85 80
25 14 Norway 74.0 3.2 86.7 83.3 88.3 55.6 38.5 98.4 89.5 48.8 75.8 87.7 75 60
26 15 Germany 73.8 -0.6 82.9 79.5 77.7 61.9 41.4 89.9 86.6 42.8 85.9 87.0 80 70
28 16 Czech Republic 73.3 0.1 70.3 55.9 55.9 82.9 45.3 92.0 67.2 77.7 85.8 87.0 80 80
30 17 Austria 72.3 0.6 86.0 81.8 75.2 50.3 19.3 79.7 76.9 67.6 83.4 87.0 90 70
31 18 Macedonia 70.7 3.2 67.0 61.4 52.0 91.9 68.9 72.6 81.5 66.7 80.8 86.1 60 60
33 19 Armenia 70.3 3.3 55.5 42.5 43.4 83.7 81.7 82.9 78.5 72.4 72.8 80.2 80 70
39 20 Romania 69.7 4.1 63.9 58.5 45.9 87.4 65.3 90.9 65.9 62.5 83.6 87.0 75 50
45 21 Poland 68.3 -1.0 60.8 58.0 55.5 76.0 46.9 76.1 67.8 61.5 84.7 87.0 75 70
46 22 Kosovo 67.9 6.5 70.3 58.0 45.9 93.5 77.8 88.9 68.8 65.3 80.0 70.8 65 30
47 23 Bulgaria 67.9 2.0 62.5 38.9 41.8 91.0 58.4 86.4 66.7 68.3 83.3 87.0 70 60
48 24 Cyprus 67.9 -0.8 75.4 60.7 53.6 73.0 48.8 72.9 75.8 58.6 83.3 87.0 75 50
49 25 Belgium 67.8 -0.6 83.3 69.3 71.5 44.1 9.6 66.3 82.0 61.1 84.9 87.0 85 70
50 26 Malta 67.7 1.0 67.7 62.9 53.6 62.8 44.9 85.1 62.5 57.2 83.5 87.0 85 60
56 27 Hungary 65.8 -0.2 60.1 51.8 41.5 79.3 25.3 79.3 64.0 64.4 91.7 87.0 75 70
57 28 Slovak Republic 65.7 -0.9 69.0 38.0 39.6 79.7 47.2 82.9 64.9 54.4 81.1 87.0 75 70
60 29 Turkey 65.2 3.1 61.3 52.5 40.7 75.5 57.7 95.7 64.3 48.5 72.2 79.4 75 60
65 30 Albania 64.4 -1.5 54.0 28.5 39.7 86.9 72.5 51.5 79.3 50.7 81.4 87.7 70 70
69 31 Spain 63.6 -4.9 71.2 53.9 57.2 62.5 41.4 26.9 66.9 55.3 85.5 87.0 85 70
72 32 France 63.3 1.0 85.0 72.7 69.7 47.6 2.0 57.0 78.0 44.1 81.6 82.0 70 70
77 33 Portugal 62.6 -2.5 73.3 68.9 59.0 59.8 25.1 32.1 86.4 43.4 85.9 87.0 70 60
79 34 Italy 62.5 1.3 74.6 55.4 44.7 54.9 22.3 66.9 69.8 52.9 86.9 87.0 85 50
83 35 Montenegro 62.0 -2.9 58.0 50.4 43.4 83.1 33.1 44.3 72.0 67.4 82.5 84.7 75 50
92 36 Bosnia and Herzegovina 60.2 1.6 41.2 40.0 32.7 83.5 33.7 89.3 47.4 59.3 84.0 86.6 65 60
95 37 Croatia 59.4 0.3 65.5 56.8 43.4 66.8 31.3 44.7 58.2 43.3 80.3 87.4 75 60
(CONTINUED ON NEXT PAGE)
204 2017 Index of Economic Freedom
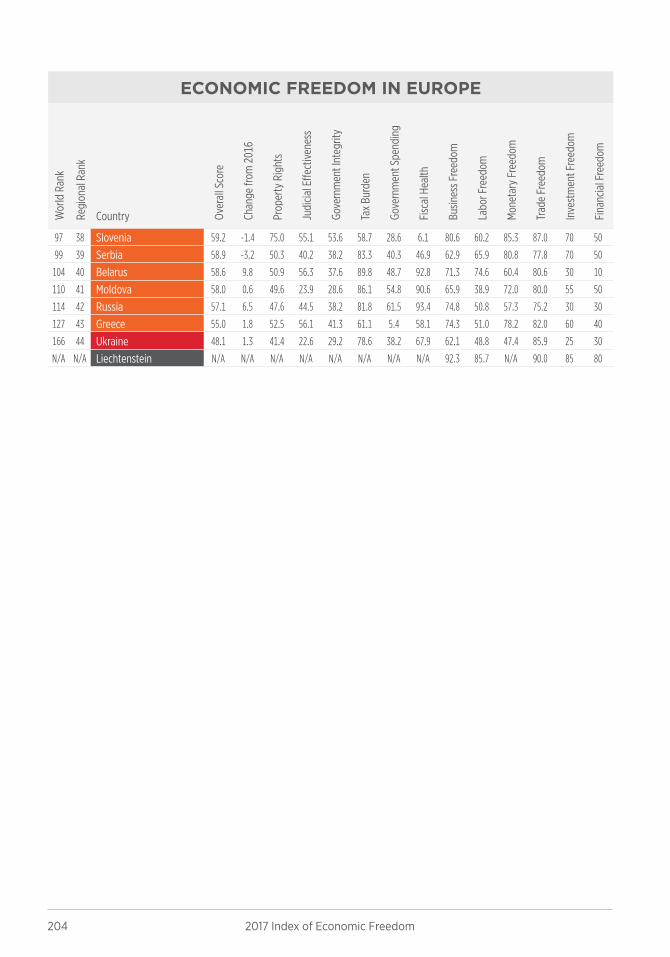
ECONOMIC FREEDOM IN EUROPE
Wor
ld R
ank
Regi
onal
Ran
k
Country Over
all S
core
Chan
ge fr
om 2
016
Prop
erty
Rig
hts
Judi
cial E
� ect
iven
ess
Gove
rnm
ent I
nteg
rity
Tax
Burd
en
Gove
rnm
ent S
pend
ing
Fisc
al H
ealth
Busin
ess F
reed
om
Labo
r Fre
edom
Mon
etar
y Fr
eedo
m
Trad
e Fr
eedo
m
Inve
stm
ent F
reed
om
Fina
ncia
l Fre
edom
97 38 Slovenia 59.2 -1.4 75.0 55.1 53.6 58.7 28.6 6.1 80.6 60.2 85.3 87.0 70 50
99 39 Serbia 58.9 -3.2 50.3 40.2 38.2 83.3 40.3 46.9 62.9 65.9 80.8 77.8 70 50
104 40 Belarus 58.6 9.8 50.9 56.3 37.6 89.8 48.7 92.8 71.3 74.6 60.4 80.6 30 10
110 41 Moldova 58.0 0.6 49.6 23.9 28.6 86.1 54.8 90.6 65.9 38.9 72.0 80.0 55 50
114 42 Russia 57.1 6.5 47.6 44.5 38.2 81.8 61.5 93.4 74.8 50.8 57.3 75.2 30 30
127 43 Greece 55.0 1.8 52.5 56.1 41.3 61.1 5.4 58.1 74.3 51.0 78.2 82.0 60 40
166 44 Ukraine 48.1 1.3 41.4 22.6 29.2 78.6 38.2 67.9 62.1 48.8 47.4 85.9 25 30
N/A N/A Liechtenstein N/A N/A N/A N/A N/A N/A N/A N/A 92.3 85.7 N/A 90.0 85 80

206 2017 Index of Economic Freedom
ECONOMIC FREEDOM SCORE
FREEDOM TREND QUICK FACTS
80706050 1000
2008 2009 2010 2011 2012 2013 2014 2015 2016 2017
40
50
60
70
80
REGIONAL AVERAGE(EUROPE REGION)
WORLD AVERAGE
60.9 68.0
64.4( ▼ DOWN 1.5 POINTS )( ▼ DOWN 1.5 POINTS )
MODERATELY FREE
3065ECONOMIC FREEDOM STATUS:
REGIONAL RANK: WORLD RANK:
2015 data unless otherwise noted. Data compiled as of September 2016
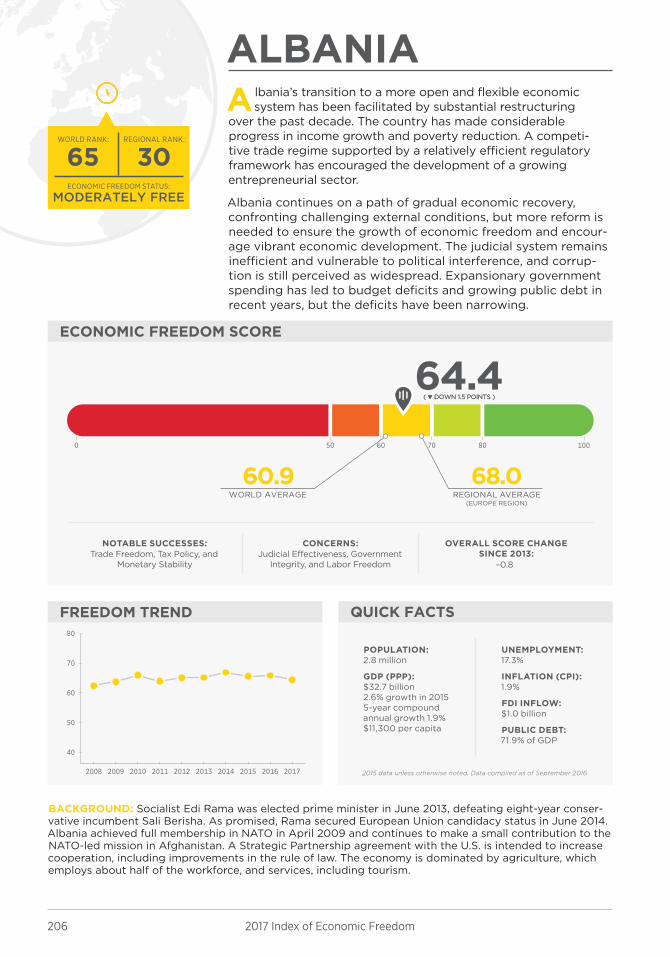
ALBANIA
BACKGROUND: Socialist Edi Rama was elected prime minister in June 2013, defeating eight-year conser-vative incumbent Sali Berisha. As promised, Rama secured European Union candidacy status in June 2014. Albania achieved full membership in NATO in April 2009 and continues to make a small contribution to the NATO-led mission in Afghanistan. A Strategic Partnership agreement with the U.S. is intended to increase cooperation, including improvements in the rule of law. The economy is dominated by agriculture, which employs about half of the workforce, and services, including tourism.
A lbania’s transition to a more open and flexible economic system has been facilitated by substantial restructuring
over the past decade. The country has made considerable progress in income growth and poverty reduction. A competi-tive trade regime supported by a relatively efficient regulatory framework has encouraged the development of a growing entrepreneurial sector.
Albania continues on a path of gradual economic recovery, confronting challenging external conditions, but more reform is needed to ensure the growth of economic freedom and encour-age vibrant economic development. The judicial system remains inefficient and vulnerable to political interference, and corrup-tion is still perceived as widespread. Expansionary government spending has led to budget deficits and growing public debt in recent years, but the deficits have been narrowing.
NOTABLE SUCCESSES:Trade Freedom, Tax Policy, and
Monetary Stability
CONCERNS:Judicial Effectiveness, Government
Integrity, and Labor Freedom
OVERALL SCORE CHANGE SINCE 2013:
–0.8
POPULATION: 2.8 million
GDP (PPP): $32.7 billion2.6% growth in 20155-year compound annual growth 1.9%$11,300 per capita
UNEMPLOYMENT: 17.3%
INFLATION (CPI): 1.9%
FDI INFLOW: $1.0 billion
PUBLIC DEBT: 71.9% of GDP
207The Heritage Foundation | heritage.org/Index
WORLD AVERAGEKEY:
RULE OF LAW GOVERNMENT SIZERank
REGULATORY EFFICIENCY OPEN MARKETSRank
Property Rights
Judicial E�ectiveness
Government Integrity
TaxBurden
Government Spending
FiscalHealth
Business Freedom
Labor Freedom
Monetary Freedom
Trade Freedom
Investment Freedom
Financial Freedom
80
60
70
100
50
0
80
60
70
100
50
0
80
60
70
100
50
0
80
60
70
100
50
0
17th59th13th58th135th32nd
137th81st38th79th135th81st
70.070.087.781.450.779.3
51.572.586.939.728.554.0
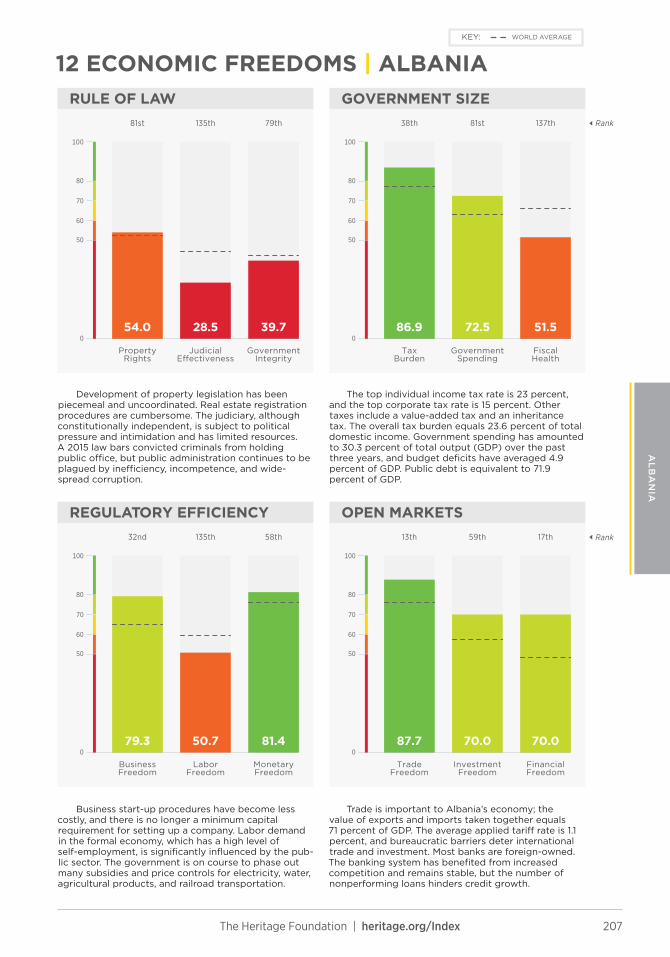
Development of property legislation has been piecemeal and uncoordinated. Real estate registration procedures are cumbersome. The judiciary, although constitutionally independent, is subject to political pressure and intimidation and has limited resources. A 2015 law bars convicted criminals from holding public office, but public administration continues to be plagued by inefficiency, incompetence, and wide-spread corruption.
The top individual income tax rate is 23 percent, and the top corporate tax rate is 15 percent. Other taxes include a value-added tax and an inheritance tax. The overall tax burden equals 23.6 percent of total domestic income. Government spending has amounted to 30.3 percent of total output (GDP) over the past three years, and budget deficits have averaged 4.9 percent of GDP. Public debt is equivalent to 71.9 percent of GDP.
Business start-up procedures have become less costly, and there is no longer a minimum capital requirement for setting up a company. Labor demand in the formal economy, which has a high level of self-employment, is significantly influenced by the pub-lic sector. The government is on course to phase out many subsidies and price controls for electricity, water, agricultural products, and railroad transportation.
Trade is important to Albania’s economy; the value of exports and imports taken together equals 71 percent of GDP. The average applied tariff rate is 1.1 percent, and bureaucratic barriers deter international trade and investment. Most banks are foreign-owned. The banking system has benefited from increased competition and remains stable, but the number of nonperforming loans hinders credit growth.
12 ECONOMIC FREEDOMS | ALBANIA
AL
BA
NIA
208 2017 Index of Economic Freedom
ECONOMIC FREEDOM SCORE
FREEDOM TREND QUICK FACTS
80706050 1000
2008 2009 2010 2011 2012 2013 2014 2015 2016 2017
50
60
70
80
90
REGIONAL AVERAGE(EUROPE REGION)
WORLD AVERAGE
60.9 68.0
70.3( ▲ UP 3.3 POINTS )( ▲ UP 3.3 POINTS )
MOSTLY FREE
1933ECONOMIC FREEDOM STATUS:
REGIONAL RANK: WORLD RANK:
2015 data unless otherwise noted. Data compiled as of September 2016
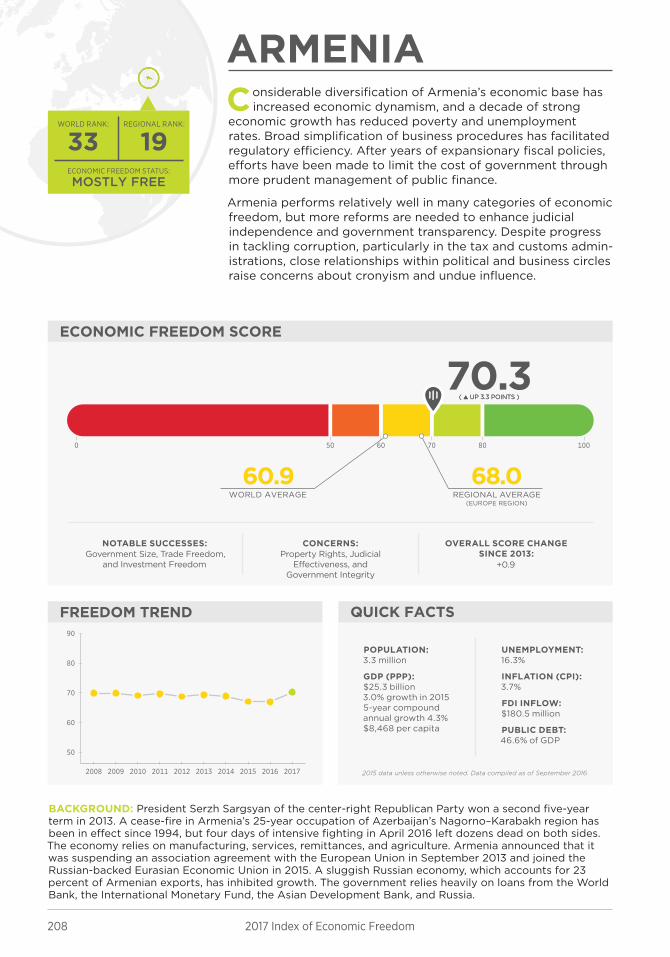
ARMENIA
BACKGROUND: President Serzh Sargsyan of the center-right Republican Party won a second five-year term in 2013. A cease-fire in Armenia’s 25-year occupation of Azerbaijan’s Nagorno–Karabakh region has been in effect since 1994, but four days of intensive fighting in April 2016 left dozens dead on both sides. The economy relies on manufacturing, services, remittances, and agriculture. Armenia announced that it was suspending an association agreement with the European Union in September 2013 and joined the Russian-backed Eurasian Economic Union in 2015. A sluggish Russian economy, which accounts for 23 percent of Armenian exports, has inhibited growth. The government relies heavily on loans from the World Bank, the International Monetary Fund, the Asian Development Bank, and Russia.
Considerable diversification of Armenia’s economic base has increased economic dynamism, and a decade of strong
economic growth has reduced poverty and unemployment rates. Broad simplification of business procedures has facilitated regulatory efficiency. After years of expansionary fiscal policies, efforts have been made to limit the cost of government through more prudent management of public finance.
Armenia performs relatively well in many categories of economic freedom, but more reforms are needed to enhance judicial independence and government transparency. Despite progress in tackling corruption, particularly in the tax and customs admin-istrations, close relationships within political and business circles raise concerns about cronyism and undue influence.
NOTABLE SUCCESSES:Government Size, Trade Freedom,
and Investment Freedom
CONCERNS:Property Rights, Judicial
Effectiveness, and Government Integrity
OVERALL SCORE CHANGE SINCE 2013:
+0.9
POPULATION: 3.3 million
GDP (PPP): $25.3 billion3.0% growth in 20155-year compound annual growth 4.3%$8,468 per capita
UNEMPLOYMENT: 16.3%
INFLATION (CPI): 3.7%
FDI INFLOW: $180.5 million
PUBLIC DEBT: 46.6% of GDP
209The Heritage Foundation | heritage.org/Index
WORLD AVERAGEKEY:
RULE OF LAW GOVERNMENT SIZERank
REGULATORY EFFICIENCY OPEN MARKETSRank
Property Rights
Judicial E�ectiveness
Government Integrity
TaxBurden
Government Spending
FiscalHealth
Business Freedom
Labor Freedom
Monetary Freedom
Trade Freedom
Investment Freedom
Financial Freedom
80
60
70
100
50
0
80
60
70
100
50
0
80
60
70
100
50
0
80
60
70
100
50
0
17th21st79th135th36th35th
76th41st56th61st88th72nd
70.080.080.272.872.478.5
82.981.783.743.442.555.5
Armenian law protects secured interests in personal and real property. The judiciary lacks independence and transparency. All disputes involving contracts, ownership of property, or commercial matters are resolved in the courts of general jurisdic-tion, which handle both civil and criminal cases and have long backlogs. Pervasive corruption has been aggravated by Russia’s consolidation of its influence over Armenia’s economy and regional security.
The top individual income tax rate is 26 percent, and the top corporate tax rate is 20 percent. Other taxes include a value-added tax and excise taxes. The overall tax burden equals 23.5 percent of total domes-tic income. Government spending has amounted to 24.7 percent of total output (GDP) over the past three years, and budget deficits have averaged 2.8 percent of GDP. Public debt is equivalent to 46.6 percent of GDP.
The regulatory framework is relatively efficient. The minimum capital requirement for business start-ups has been eliminated, and bankruptcy procedures have been modernized. The nonsalary cost of labor is moderate, but the informal labor market is sizable. The government and a Russian–Armenian billionaire jointly funded electricity subsidies for more than a year after massive public protests in June 2015 against a proposed rate increase.
Trade is important to Armenia’s economy; the value of exports and imports taken together equals 71 percent of GDP. The average applied tariff rate is 2.4 percent. Bureaucratic barriers interfere with interna-tional trade, and foreign citizens may not own land. The state no longer has a stake in any bank, but the banking sector, which accounts for over 90 percent of total financial-sector assets, still struggles to provide adequate long-term credit.
12 ECONOMIC FREEDOMS | ARMENIA
AR
ME
NIA
210 2017 Index of Economic Freedom
ECONOMIC FREEDOM SCORE
FREEDOM TREND QUICK FACTS
80706050 1000
2008 2009 2010 2011 2012 2013 2014 2015 2016 2017
50
60
70
80
90
REGIONAL AVERAGE(EUROPE REGION)
WORLD AVERAGE
60.9 68.0
72.3( ▲ UP 0.6 POINT )( ▲ UP 0.6 POINT )
MOSTLY FREE
1730ECONOMIC FREEDOM STATUS:
REGIONAL RANK: WORLD RANK:
2015 data unless otherwise noted. Data compiled as of September 2016
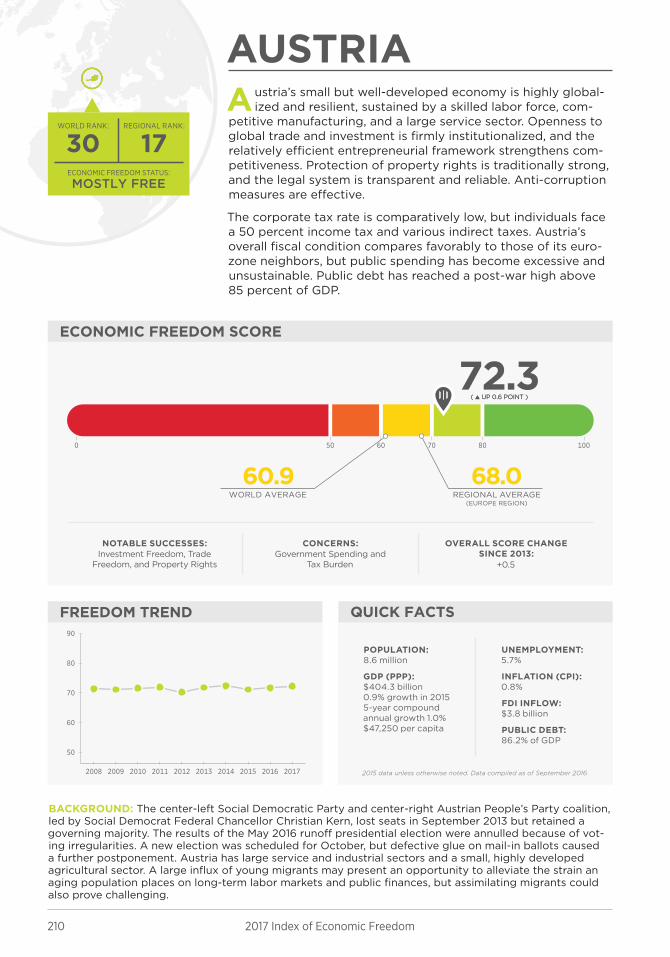
AUSTRIA
BACKGROUND: The center-left Social Democratic Party and center-right Austrian People’s Party coalition, led by Social Democrat Federal Chancellor Christian Kern, lost seats in September 2013 but retained a governing majority. The results of the May 2016 runoff presidential election were annulled because of vot-ing irregularities. A new election was scheduled for October, but defective glue on mail-in ballots caused a further postponement. Austria has large service and industrial sectors and a small, highly developed agricultural sector. A large influx of young migrants may present an opportunity to alleviate the strain an aging population places on long-term labor markets and public finances, but assimilating migrants could also prove challenging.
Austria’s small but well-developed economy is highly global-ized and resilient, sustained by a skilled labor force, com-
petitive manufacturing, and a large service sector. Openness to global trade and investment is firmly institutionalized, and the relatively efficient entrepreneurial framework strengthens com-petitiveness. Protection of property rights is traditionally strong, and the legal system is transparent and reliable. Anti-corruption measures are effective.
The corporate tax rate is comparatively low, but individuals face a 50 percent income tax and various indirect taxes. Austria’s overall fiscal condition compares favorably to those of its euro-zone neighbors, but public spending has become excessive and unsustainable. Public debt has reached a post-war high above 85 percent of GDP.
NOTABLE SUCCESSES:Investment Freedom, Trade
Freedom, and Property Rights
CONCERNS:Government Spending and
Tax Burden
OVERALL SCORE CHANGE SINCE 2013:
+0.5
POPULATION: 8.6 million
GDP (PPP): $404.3 billion0.9% growth in 20155-year compound annual growth 1.0%$47,250 per capita
UNEMPLOYMENT: 5.7%
INFLATION (CPI): 0.8%
FDI INFLOW: $3.8 billion
PUBLIC DEBT: 86.2% of GDP

211The Heritage Foundation | heritage.org/Index
WORLD AVERAGEKEY:
RULE OF LAW GOVERNMENT SIZERank
REGULATORY EFFICIENCY OPEN MARKETSRank
Property Rights
Judicial E�ectiveness
Government Integrity
TaxBurden
Government Spending
FiscalHealth
Business Freedom
Labor Freedom
Monetary Freedom
Trade Freedom
Investment Freedom
Financial Freedom
80
60
70
100
50
0
80
60
70
100
50
0
80
60
70
100
50
0
80
60
70
100
50
0
17th2nd20th40th58th42nd
85th172nd176th17th12th14th
70.090.087.083.467.676.9
79.719.350.375.281.886.0
Austria’s land registry is a reliable and publicly accessible system for recording interests in property. The investment climate has been enhanced by the country’s reputation for relatively high political stability and strong rule of law. The independent judiciary provides an effective means for protecting property rights (including intellectual property rights) and the contractual rights of nationals and foreigners. Corrup-tion is relatively rare.
The top income tax rate is 50 percent, and the top corporate tax rate is 25 percent. High social security contributions are shared between employers and employees. The overall tax burden equals 43 percent of total domestic income. Government spending has amounted to 51.9 percent of total output (GDP) over the past three years, and budget deficits have averaged 1.9 percent of GDP. Public debt is equivalent to 86.2 percent of GDP.
Austria’s transparent and efficient regulatory framework facilitates business innovation and produc-tivity growth. The cost of fringe benefits is among the highest in the world. VERBUND, 51 percent owned by the state and Austria’s largest provider of power, lost a third of its market value in 2015 as a result of falling electricity prices and government subsidies for renew-ables in neighboring European countries.
Trade is extremely important to Austria’s econ-omy; the value of exports and imports taken together equals 102 percent of GDP. The average applied tariff rate is 1.5 percent. Austria is very open to trade and investment, but complex regulations may impede investment. The competitive and stable financial sector offers a wide range of services. There are no controls on currency transfers, access to foreign exchange, or repatriation of profits.
12 ECONOMIC FREEDOMS | AUSTRIA
AU
ST
RIA
212 2017 Index of Economic Freedom
ECONOMIC FREEDOM SCORE
FREEDOM TREND QUICK FACTS
80706050 1000
2008 2009 2010 2011 2012 2013 2014 2015 2016 2017
40
50
60
70
80
REGIONAL AVERAGE(EUROPE REGION)
WORLD AVERAGE
60.9 68.0
58.6( ▲ UP 9.8 POINTS )( ▲ UP 9.8 POINTS )
MOSTLY UNFREE
40104ECONOMIC FREEDOM STATUS:
REGIONAL RANK: WORLD RANK:
2015 data unless otherwise noted. Data compiled as of September 2016
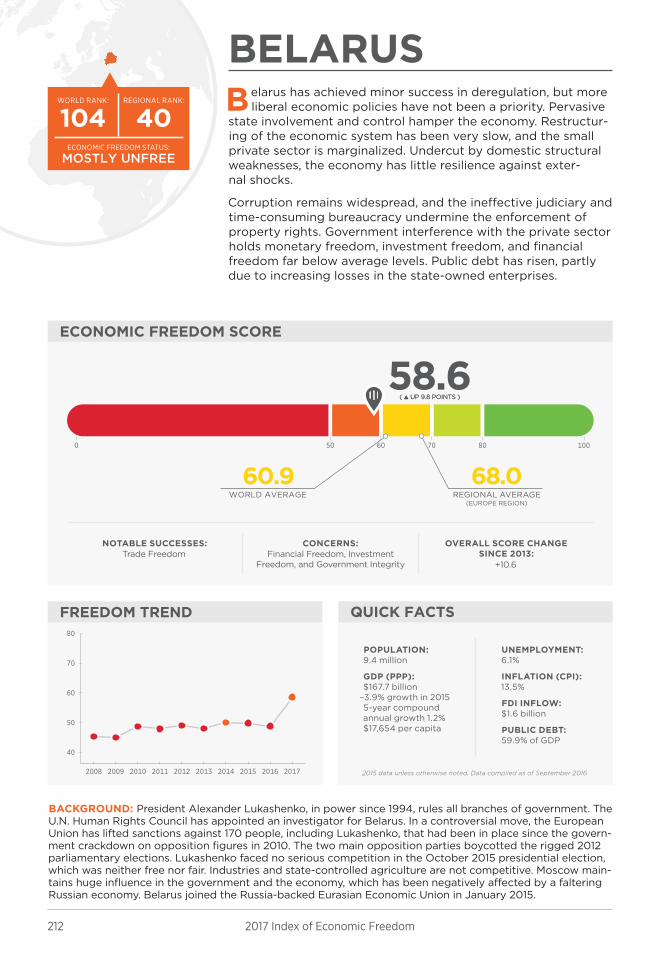
BELARUS
BACKGROUND: President Alexander Lukashenko, in power since 1994, rules all branches of government. The U.N. Human Rights Council has appointed an investigator for Belarus. In a controversial move, the European Union has lifted sanctions against 170 people, including Lukashenko, that had been in place since the govern-ment crackdown on opposition figures in 2010. The two main opposition parties boycotted the rigged 2012 parliamentary elections. Lukashenko faced no serious competition in the October 2015 presidential election, which was neither free nor fair. Industries and state-controlled agriculture are not competitive. Moscow main-tains huge influence in the government and the economy, which has been negatively affected by a faltering Russian economy. Belarus joined the Russia-backed Eurasian Economic Union in January 2015.
Belarus has achieved minor success in deregulation, but more liberal economic policies have not been a priority. Pervasive
state involvement and control hamper the economy. Restructur-ing of the economic system has been very slow, and the small private sector is marginalized. Undercut by domestic structural weaknesses, the economy has little resilience against exter-nal shocks.
Corruption remains widespread, and the ineffective judiciary and time-consuming bureaucracy undermine the enforcement of property rights. Government interference with the private sector holds monetary freedom, investment freedom, and financial freedom far below average levels. Public debt has risen, partly due to increasing losses in the state-owned enterprises.
NOTABLE SUCCESSES:Trade Freedom
CONCERNS:Financial Freedom, Investment
Freedom, and Government Integrity
OVERALL SCORE CHANGE SINCE 2013:
+10.6
POPULATION: 9.4 million
GDP (PPP): $167.7 billion
–3.9% growth in 20155-year compound annual growth 1.2%$17,654 per capita
UNEMPLOYMENT: 6.1%
INFLATION (CPI): 13.5%
FDI INFLOW: $1.6 billion
PUBLIC DEBT: 59.9% of GDP

213The Heritage Foundation | heritage.org/Index
WORLD AVERAGEKEY:
RULE OF LAW GOVERNMENT SIZERank
REGULATORY EFFICIENCY OPEN MARKETSRank
Property Rights
Judicial E�ectiveness
Government Integrity
TaxBurden
Government Spending
FiscalHealth
Business Freedom
Labor Freedom
Monetary Freedom
Trade Freedom
Investment Freedom
Financial Freedom
80
60
70
100
50
0
80
60
70
100
50
0
80
60
70
100
50
0
80
60
70
100
50
0
173rd154th76th174th27th61st
45th141st30th94th54th91st
10.030.080.660.474.671.3
92.848.789.837.656.350.9
Soviet-era property laws remain in effect. The constitution vests most power in the president, giving him control of the government, the courts, and even the legislative process by stating that presidential decrees have a higher legal force than ordinary legis-lation. The state controls 70 percent of the economy, feeding widespread corruption. Graft is also encour-aged by an overall lack of government transparency and accountability.
The personal income tax rate is 13 percent. The top corporate tax rate remains 18 percent. Other taxes include excise taxes and a value-added tax. The overall tax burden equals 23.0 percent of total domestic income. Government spending has amounted to 41.3 percent of total output (GDP) over the past three years, and small budget surpluses have averaged 0.04 percent of GDP. Public debt is equivalent to 59.9 percent of GDP.
Simplifying registration formalities and abolishing the minimum capital requirement have facilitated busi-ness formation. Procedural requirements for necessary permits have also been reduced. An efficient labor market is not fully developed. Heavily dependent on subsidized Russian energy, the government subsidizes its inefficient agricultural sector, but it cut some of those subsidies and liberalized food prices in 2016.
Trade is extremely important to Belarus’s econ-omy; the value of exports and imports taken together equals 119 percent of GDP. The average applied tariff rate is 2.2 percent. State-owned enterprises distort the economy, and extensive government control severely limits investment and financial activity. Many industries are primarily or exclusively state-run to the detriment of private investment and enterprises.
12 ECONOMIC FREEDOMS | BELARUS
BE
LA
RU
S

214 2017 Index of Economic Freedom
ECONOMIC FREEDOM SCORE
FREEDOM TREND QUICK FACTS
80706050 1000
2008 2009 2010 2011 2012 2013 2014 2015 2016 2017
50
60
70
80
90
REGIONAL AVERAGE(EUROPE REGION)
WORLD AVERAGE
60.9 68.0
67.8( ▼ DOWN 0.6 POINT )( ▼ DOWN 0.6 POINT )
MODERATELY FREE
2549ECONOMIC FREEDOM STATUS:
REGIONAL RANK: WORLD RANK:
2015 data unless otherwise noted. Data compiled as of September 2016
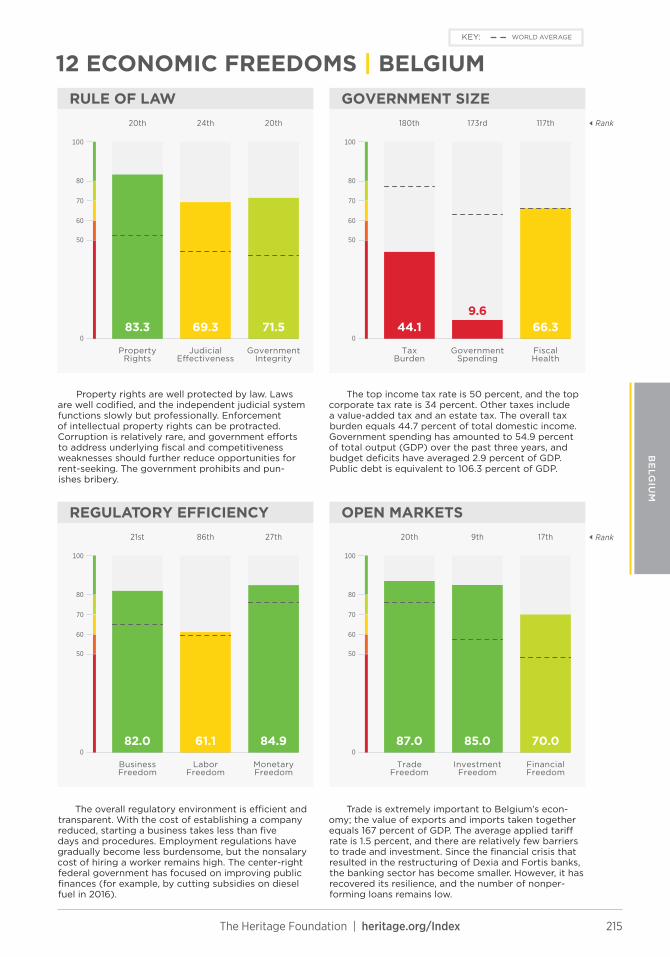
BELGIUM
BACKGROUND: Belgium is a federal state with three culturally different regions: Flanders, Wallonia, and the capital city of Brussels. Brussels also serves as the headquarters of NATO and the European Union. The center-right New Flemish Alliance won a plurality in the May 2014 federal elections, the first since electoral reform, and is part of a coalition government. Charles Michel of the liberal francophone Reformist Move-ment Party is Belgium’s youngest prime minister since 1845. Neighboring countries have a strong political and economic impact on Belgium. Terrorist attacks in March 2016 have cost the nation billions in additional security measures and lost business and tax revenue. Tourism has been particularly affected.
Generally friendly to free-market competition, Belgium’s economy has long benefited from openness to global trade
and investment. Among the notable reforms instituted during the past two years to address fiscal weaknesses and enhance competitiveness are pension reforms raising the retirement age and gradually reducing the employers’ social secu-rity contribution.
However, lingering structural weaknesses persist. The tax system is burdensome, and the extensive welfare state is supported by a high level of government spending. Belgium’s public spending rate (around 55 percent of GDP) is among the world’s highest. Government debt is now larger than the size of the economy. Despite some progress, labor market rigidities impede produc-tivity and job growth.
NOTABLE SUCCESSES:Trade Freedom, Investment
Freedom, and Monetary Stability
CONCERNS:Government Spending, Tax Burden,
and Labor Freedom
OVERALL SCORE CHANGE SINCE 2013:
–1.4
POPULATION: 11.2 million
GDP (PPP): $494.1 billion1.4% growth in 20155-year compound annual growth 0.9%$43,585 per capita
UNEMPLOYMENT: 8.7%
INFLATION (CPI): 0.6%
FDI INFLOW: $31.0 billion
PUBLIC DEBT: 106.3% of GDP
215The Heritage Foundation | heritage.org/Index
WORLD AVERAGEKEY:
RULE OF LAW GOVERNMENT SIZERank
REGULATORY EFFICIENCY OPEN MARKETSRank
Property Rights
Judicial E�ectiveness
Government Integrity
TaxBurden
Government Spending
FiscalHealth
Business Freedom
Labor Freedom
Monetary Freedom
Trade Freedom
Investment Freedom
Financial Freedom
80
60
70
100
50
0
80
60
70
100
50
0
80
60
70
100
50
0
80
60
70
100
50
0
17th9th20th27th86th21st
117th173rd180th20th24th20th
70.085.087.084.961.182.0
66.39.6
44.171.569.383.3
Property rights are well protected by law. Laws are well codified, and the independent judicial system functions slowly but professionally. Enforcement of intellectual property rights can be protracted. Corruption is relatively rare, and government efforts to address underlying fiscal and competitiveness weaknesses should further reduce opportunities for rent-seeking. The government prohibits and pun-ishes bribery.
The top income tax rate is 50 percent, and the top corporate tax rate is 34 percent. Other taxes include a value-added tax and an estate tax. The overall tax burden equals 44.7 percent of total domestic income. Government spending has amounted to 54.9 percent of total output (GDP) over the past three years, and budget deficits have averaged 2.9 percent of GDP. Public debt is equivalent to 106.3 percent of GDP.
The overall regulatory environment is efficient and transparent. With the cost of establishing a company reduced, starting a business takes less than five days and procedures. Employment regulations have gradually become less burdensome, but the nonsalary cost of hiring a worker remains high. The center-right federal government has focused on improving public finances (for example, by cutting subsidies on diesel fuel in 2016).
Trade is extremely important to Belgium’s econ-omy; the value of exports and imports taken together equals 167 percent of GDP. The average applied tariff rate is 1.5 percent, and there are relatively few barriers to trade and investment. Since the financial crisis that resulted in the restructuring of Dexia and Fortis banks, the banking sector has become smaller. However, it has recovered its resilience, and the number of nonper-forming loans remains low.
12 ECONOMIC FREEDOMS | BELGIUM
BE
LGIU
M

216 2017 Index of Economic Freedom
ECONOMIC FREEDOM SCORE
FREEDOM TREND QUICK FACTS
80706050 1000
2008 2009 2010 2011 2012 2013 2014 2015 2016 2017
40
50
60
70
80
REGIONAL AVERAGE(EUROPE REGION)
WORLD AVERAGE
60.9 68.0
60.2( ▲ UP 1.6 POINTS )( ▲ UP 1.6 POINTS )
MODERATELY FREE
3692ECONOMIC FREEDOM STATUS:
REGIONAL RANK: WORLD RANK:
2015 data unless otherwise noted. Data compiled as of September 2016
BOSNIA AND HERZEGOVINA
BACKGROUND: The 1995 Dayton Agreement ended three years of war in the former Yugoslavia and finalized Bosnia and Herzegovina’s independence. Two separate entities exist under a loose central gov-ernment: the Republika Srpska (Serbian) and Federation of Bosnia and Herzegovina (Muslim/Croat). The official results of a 2013 census, published in 2016, showed that the two entities remain ethnically split. A Stabilization and Association Agreement signed by Bosnia and Herzegovina and the European Union took effect in June 2015. In February 2016, Bosnia formally applied to join the EU. Bosnia also received a NATO Membership Action Plan in 2010 and is one of three official candidates for NATO membership.
Bosnia and Herzegovina’s economic development has been driven by reconstruction efforts. Trade has been an engine of
growth, but the overall entrepreneurial environment remains one of the region’s most burdensome, hindering the emergence of a dynamic private sector. In an effort to modernize the labor mar-ket, a new labor law intended to introduce more flexible working practices was adopted in July 2015.
Inefficient and high government spending, weak protection of property rights, and widespread corruption discourage entre-preneurial activity. The rule of law is weak, and local courts are subject to substantial political interference. Intrusive bureau-cracy and costly registration procedures reflect a history of central planning. The informal economy remains quite large.
NOTABLE SUCCESSES:Fiscal Policy, Trade Freedom, and
Monetary Policy
CONCERNS:Government Spending, Rule of Law,
and Business Freedom
OVERALL SCORE CHANGE SINCE 2013:
+2.9
POPULATION: 3.9 million
GDP (PPP): $40.5 billion2.8% growth in 20155-year compound annual growth 1.3%$10,492 per capita
UNEMPLOYMENT: 30.3%
INFLATION (CPI): –1.0%
FDI INFLOW: $249.5 million
PUBLIC DEBT: 45.5% of GDP

217The Heritage Foundation | heritage.org/Index
WORLD AVERAGEKEY:
RULE OF LAW GOVERNMENT SIZERank
REGULATORY EFFICIENCY OPEN MARKETSRank
Property Rights
Judicial E�ectiveness
Government Integrity
TaxBurden
Government Spending
FiscalHealth
Business Freedom
Labor Freedom
Monetary Freedom
Trade Freedom
Investment Freedom
Financial Freedom
80
60
70
100
50
0
80
60
70
100
50
0
80
60
70
100
50
0
80
60
70
100
50
0
39th73rd45th34th90th169th
59th163rd59th117th97th123rd
60.065.086.684.059.347.4
89.333.783.532.740.041.2
Largely unreliable property registries leave trans-fers open to dispute and create a major barrier to the development of real property and mortgage markets. The complex system of government lends itself to deadlock and has bred a large informal economy. The judiciary remains susceptible to influence by nation-alist political parties and pressure from the executive branch. Inefficiency and corruption are widespread at all levels of government.
The top income and corporate tax rates are 10 percent, but various governing entities have different tax policies. The overall tax burden equals 38.1 percent of total domestic income. Government spending has amounted to 47 percent of total output (GDP) over the past three years, and budget deficits have averaged 2 percent of GDP. Public debt is equivalent to 45.5 percent of GDP.
Regulatory inefficiency still impairs the business environment and limits the private investment needed for faster economic growth. Obtaining business licenses and launching a business remain vulnerable to bureaucratic delays. The recently adopted labor code is intended to enhance labor market flexibility. The government subsidizes energy and, according to the World Bank, targets its agricultural subsidies poorly.
Trade is important to Bosnia and Herzegovina’s economy; the value of exports and imports taken together equals 91 percent of GDP. The average applied tariff rate is 1.7 percent. The government’s official policy is to treat foreign and domestic investors equally under the law. Foreign-owned banks account for over 80 percent of banking assets. Long-term lending is still hindered by insufficient enforcement of contracts.
12 ECONOMIC FREEDOMS | BOSNIA AND HERZEGOVINA
BO
SN
IA A
ND
H
ER
ZE
GO
VIN
A

218 2017 Index of Economic Freedom
ECONOMIC FREEDOM SCORE
FREEDOM TREND QUICK FACTS
80706050 1000
2008 2009 2010 2011 2012 2013 2014 2015 2016 2017
40
50
60
70
80
REGIONAL AVERAGE(EUROPE REGION)
WORLD AVERAGE
60.9 68.0
67.9( ▲ UP 2.0 POINTS )( ▲ UP 2.0 POINTS )
MODERATELY FREE
2347ECONOMIC FREEDOM STATUS:
REGIONAL RANK: WORLD RANK:
2015 data unless otherwise noted. Data compiled as of September 2016
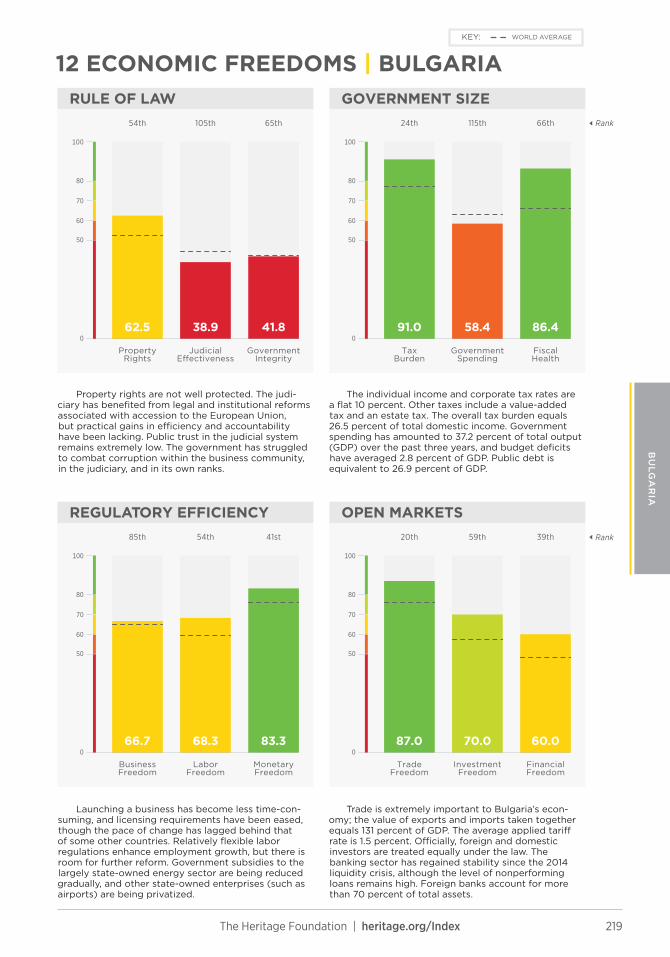
BULGARIA
BACKGROUND: From May 2013 to October 2014, Bulgaria held a European Parliament election and two national parliamentary elections. A year after the 2013 parliamentary election and amid protests against low living standards, high energy costs, and corruption, President Rosen Plevneliev dissolved the parlia-ment because of banking instability. Boyko Borissov of the center-right GERB party formed a minority coalition government with the center-right Reformist bloc and became prime minister for the second time. Recovery from the eurozone crisis has been slow but steady. Tourism, information technology and telecommunications, agriculture, pharmaceuticals, and textiles are leading industries. Migrant flows are an issue, and Bulgaria has taken steps to secure its border with Turkey.
Bulgaria’s transition to a more open and flexible economic system has been facilitated by substantial restructuring.
Competitive flat tax rates and an open trade regime, supported by a relatively efficient regulatory framework, have encouraged development of a growing private sector. The financial sector demonstrated a relatively high level of resilience during the 2014 liquidity crisis.
The management of public finance has been relatively sound. The level of public debt continues to be among the lowest in the region, with budget deficits declining. However, deeper and more committed institutional reforms are needed in areas like judicial effectiveness and government integrity to help ensure long-term economic development.
NOTABLE SUCCESSES:Tax Policy, Trade Freedom, and
Fiscal Policy
CONCERNS:Judicial Effectiveness, Government Integrity, and Government Spending
OVERALL SCORE CHANGE SINCE 2013:
+2.9
POPULATION: 7.2 million
GDP (PPP): $136.9 billion3.0% growth in 20155-year compound annual growth 1.5%$19,097 per capita
UNEMPLOYMENT: 9.8%
INFLATION (CPI): –1.1%
FDI INFLOW: $1.8 billion
PUBLIC DEBT: 26.9% of GDP
219The Heritage Foundation | heritage.org/Index
WORLD AVERAGEKEY:
RULE OF LAW GOVERNMENT SIZERank
REGULATORY EFFICIENCY OPEN MARKETSRank
Property Rights
Judicial E�ectiveness
Government Integrity
TaxBurden
Government Spending
FiscalHealth
Business Freedom
Labor Freedom
Monetary Freedom
Trade Freedom
Investment Freedom
Financial Freedom
80
60
70
100
50
0
80
60
70
100
50
0
80
60
70
100
50
0
80
60
70
100
50
0
39th59th20th41st54th85th
66th115th24th65th105th54th
60.070.087.083.368.366.7
86.458.491.041.838.962.5
Property rights are not well protected. The judi-ciary has benefited from legal and institutional reforms associated with accession to the European Union, but practical gains in efficiency and accountability have been lacking. Public trust in the judicial system remains extremely low. The government has struggled to combat corruption within the business community, in the judiciary, and in its own ranks.
The individual income and corporate tax rates are a flat 10 percent. Other taxes include a value-added tax and an estate tax. The overall tax burden equals 26.5 percent of total domestic income. Government spending has amounted to 37.2 percent of total output (GDP) over the past three years, and budget deficits have averaged 2.8 percent of GDP. Public debt is equivalent to 26.9 percent of GDP.
Launching a business has become less time-con-suming, and licensing requirements have been eased, though the pace of change has lagged behind that of some other countries. Relatively flexible labor regulations enhance employment growth, but there is room for further reform. Government subsidies to the largely state-owned energy sector are being reduced gradually, and other state-owned enterprises (such as airports) are being privatized.
Trade is extremely important to Bulgaria’s econ-omy; the value of exports and imports taken together equals 131 percent of GDP. The average applied tariff rate is 1.5 percent. Officially, foreign and domestic investors are treated equally under the law. The banking sector has regained stability since the 2014 liquidity crisis, although the level of nonperforming loans remains high. Foreign banks account for more than 70 percent of total assets.
12 ECONOMIC FREEDOMS | BULGARIA
BU
LGA
RIA
220 2017 Index of Economic Freedom
ECONOMIC FREEDOM SCORE
FREEDOM TREND QUICK FACTS
80706050 1000
2008 2009 2010 2011 2012 2013 2014 2015 2016 2017
40
50
60
70
80
REGIONAL AVERAGE(EUROPE REGION)
WORLD AVERAGE
60.9 68.0
59.4( ▲ UP 0.3 POINT )( ▲ UP 0.3 POINT )
MOSTLY UNFREE
3795ECONOMIC FREEDOM STATUS:
REGIONAL RANK: WORLD RANK:
2015 data unless otherwise noted. Data compiled as of September 2016
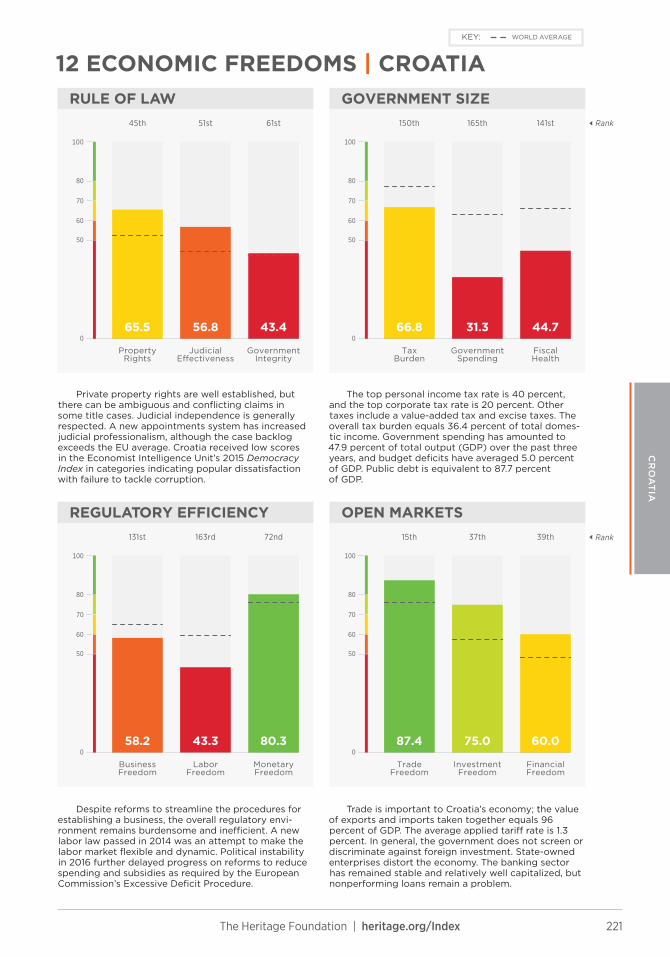
CROATIA
BACKGROUND: Croatia declared its independence in 1991, contributing to the breakup of Yugoslavia along ethnic and religious lines. Years of Croat–Serb conflict ended formally in 1995 with the Dayton Peace Accords. Croatia joined NATO in 2009 and the European Union in 2013. In October 2016, after months of political instability, President Kolinda Grabar-Kitarović appointed Andrej Plenković, leader of the cen-ter-right HDZ party, as prime minister after his party and a small populist group agreed to form a coalition government. Political uncertainty continues to endanger much-needed economic reform. Tourism and shipbuilding are major industries. While domestic demand has picked up in recent years, high indebted-ness, a weak export base, and the slow pace of privatization continue to limit growth.
C roatia lags behind many of its neighbors in structural economic reform, and institutional shortcomings continue
to hold back entrepreneurial growth. Recent fiscal reforms have been limited in scope and depth. Political volatility and perva-sive corruption undermine the rule of law, and protection of property rights remains weak.
The state’s presence in private-sector activity remains intrusive, and the level of government spending is high. Few meaning-ful efforts have been made to reduce or control government spending, and the bloated public sector severely constrains private-sector dynamism, prolonging the economic downturn. Government ownership in such key sectors as transport, natural resources, and banking remains considerable.
NOTABLE SUCCESSES:Trade Freedom and Monetary Stability
CONCERNS:Government Spending, Labor
Freedom, and Government Integrity
OVERALL SCORE CHANGE SINCE 2013:
–1.9
POPULATION: 4.2 million
GDP (PPP): $91.1 billion1.6% growth in 20155-year compound annual growth–0.4%$21,581 per capita
UNEMPLOYMENT: 16.1%
INFLATION (CPI): –0.5%
FDI INFLOW: $173.9 million
PUBLIC DEBT: 87.7% of GDP
221The Heritage Foundation | heritage.org/Index
WORLD AVERAGEKEY:
RULE OF LAW GOVERNMENT SIZERank
REGULATORY EFFICIENCY OPEN MARKETSRank
Property Rights
Judicial E�ectiveness
Government Integrity
TaxBurden
Government Spending
FiscalHealth
Business Freedom
Labor Freedom
Monetary Freedom
Trade Freedom
Investment Freedom
Financial Freedom
80
60
70
100
50
0
80
60
70
100
50
0
80
60
70
100
50
0
80
60
70
100
50
0
39th37th15th72nd163rd131st
141st165th150th61st51st45th
60.075.087.480.343.358.2
44.731.366.843.456.865.5
Private property rights are well established, but there can be ambiguous and conflicting claims in some title cases. Judicial independence is generally respected. A new appointments system has increased judicial professionalism, although the case backlog exceeds the EU average. Croatia received low scores in the Economist Intelligence Unit’s 2015 Democracy Index in categories indicating popular dissatisfaction with failure to tackle corruption.
The top personal income tax rate is 40 percent, and the top corporate tax rate is 20 percent. Other taxes include a value-added tax and excise taxes. The overall tax burden equals 36.4 percent of total domes-tic income. Government spending has amounted to 47.9 percent of total output (GDP) over the past three years, and budget deficits have averaged 5.0 percent of GDP. Public debt is equivalent to 87.7 percent of GDP.
Despite reforms to streamline the procedures for establishing a business, the overall regulatory envi-ronment remains burdensome and inefficient. A new labor law passed in 2014 was an attempt to make the labor market flexible and dynamic. Political instability in 2016 further delayed progress on reforms to reduce spending and subsidies as required by the European Commission’s Excessive Deficit Procedure.
Trade is important to Croatia’s economy; the value of exports and imports taken together equals 96 percent of GDP. The average applied tariff rate is 1.3 percent. In general, the government does not screen or discriminate against foreign investment. State-owned enterprises distort the economy. The banking sector has remained stable and relatively well capitalized, but nonperforming loans remain a problem.
12 ECONOMIC FREEDOMS | CROATIA
CR
OA
TIA
222 2017 Index of Economic Freedom
ECONOMIC FREEDOM SCORE
FREEDOM TREND QUICK FACTS
80706050 1000
2008 2009 2010 2011 2012 2013 2014 2015 2016 2017
50
60
70
80
90
REGIONAL AVERAGE(EUROPE REGION)
WORLD AVERAGE
60.9 68.0
67.9( ▼ DOWN 0.8 POINT )( ▼ DOWN 0.8 POINT )
MODERATELY FREE
2448ECONOMIC FREEDOM STATUS:
REGIONAL RANK: WORLD RANK:
2015 data unless otherwise noted. Data compiled as of September 2016
CYPRUS
BACKGROUND: A U.N. buffer zone has separated the Greek Cypriot Republic of Cyprus from the Turkish Republic of Northern Cyprus since 1974. The Republic of Cyprus joined the European Union in 2004 and acts as the island’s internationally recognized administration. Despite deep mutual hostility, Greek and Turkish leaders continue to negotiate on possible reunification through U.N.-brokered talks. Center-right Cyprus President Nicos Anastasiades has been head of state and head of government since taking office in February 2013. In May 2016, eight political parties won seats in parliament in an election that was marked by low voter turnout.
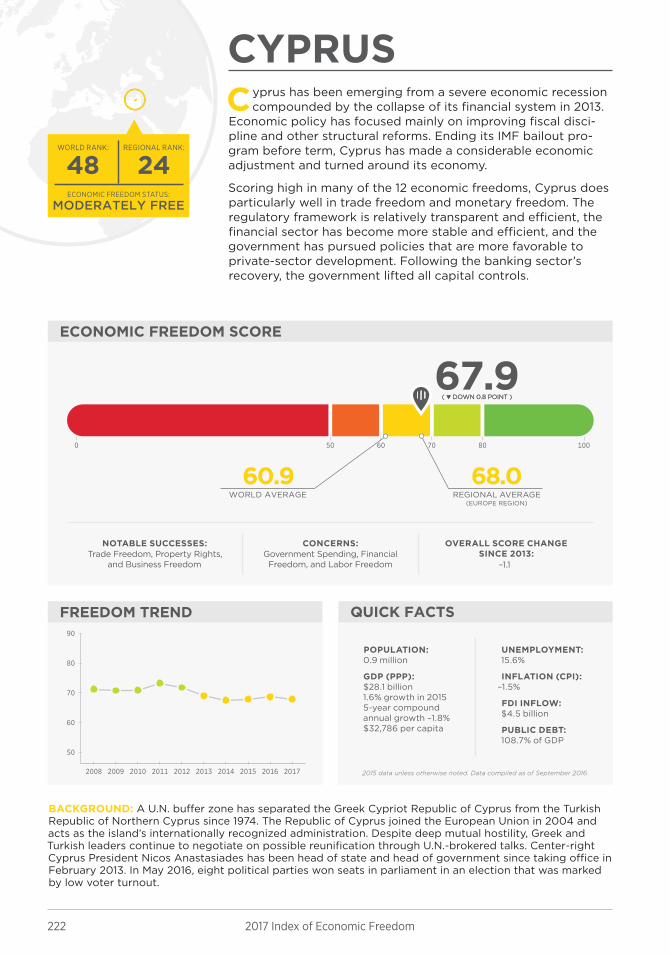
Cyprus has been emerging from a severe economic recession compounded by the collapse of its financial system in 2013.
Economic policy has focused mainly on improving fiscal disci-pline and other structural reforms. Ending its IMF bailout pro-gram before term, Cyprus has made a considerable economic adjustment and turned around its economy.
Scoring high in many of the 12 economic freedoms, Cyprus does particularly well in trade freedom and monetary freedom. The regulatory framework is relatively transparent and efficient, the financial sector has become more stable and efficient, and the government has pursued policies that are more favorable to private-sector development. Following the banking sector’s recovery, the government lifted all capital controls.
NOTABLE SUCCESSES:Trade Freedom, Property Rights,
and Business Freedom
CONCERNS:Government Spending, Financial Freedom, and Labor Freedom
OVERALL SCORE CHANGE SINCE 2013:
–1.1
POPULATION: 0.9 million
GDP (PPP): $28.1 billion1.6% growth in 20155-year compound annual growth –1.8%$32,786 per capita
UNEMPLOYMENT: 15.6%
INFLATION (CPI): –1.5%
FDI INFLOW: $4.5 billion
PUBLIC DEBT: 108.7% of GDP
223The Heritage Foundation | heritage.org/Index
WORLD AVERAGEKEY:
RULE OF LAW GOVERNMENT SIZERank
REGULATORY EFFICIENCY OPEN MARKETSRank
Property Rights
Judicial E�ectiveness
Government Integrity
TaxBurden
Government Spending
FiscalHealth
Business Freedom
Labor Freedom
Monetary Freedom
Trade Freedom
Investment Freedom
Financial Freedom
80
60
70
100
50
0
80
60
70
100
50
0
80
60
70
100
50
0
80
60
70
100
50
0
70th37th20th41st94th46th
102nd140th128th40th42nd27th
50.075.087.083.358.675.8
72.948.873.053.660.775.4
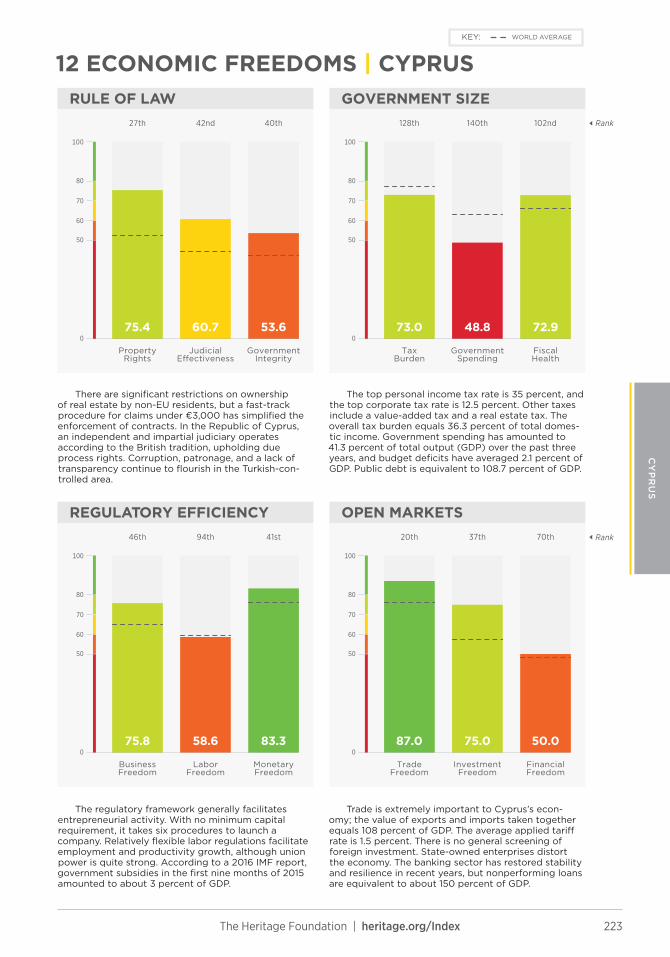
There are significant restrictions on ownership of real estate by non-EU residents, but a fast-track procedure for claims under €3,000 has simplified the enforcement of contracts. In the Republic of Cyprus, an independent and impartial judiciary operates according to the British tradition, upholding due process rights. Corruption, patronage, and a lack of transparency continue to flourish in the Turkish-con-trolled area.
The top personal income tax rate is 35 percent, and the top corporate tax rate is 12.5 percent. Other taxes include a value-added tax and a real estate tax. The overall tax burden equals 36.3 percent of total domes-tic income. Government spending has amounted to 41.3 percent of total output (GDP) over the past three years, and budget deficits have averaged 2.1 percent of GDP. Public debt is equivalent to 108.7 percent of GDP.
The regulatory framework generally facilitates entrepreneurial activity. With no minimum capital requirement, it takes six procedures to launch a company. Relatively flexible labor regulations facilitate employment and productivity growth, although union power is quite strong. According to a 2016 IMF report, government subsidies in the first nine months of 2015 amounted to about 3 percent of GDP.
Trade is extremely important to Cyprus’s econ-omy; the value of exports and imports taken together equals 108 percent of GDP. The average applied tariff rate is 1.5 percent. There is no general screening of foreign investment. State-owned enterprises distort the economy. The banking sector has restored stability and resilience in recent years, but nonperforming loans are equivalent to about 150 percent of GDP.
12 ECONOMIC FREEDOMS | CYPRUS
CY
PR
US
224 2017 Index of Economic Freedom
ECONOMIC FREEDOM SCORE
FREEDOM TREND QUICK FACTS
80706050 1000
2008 2009 2010 2011 2012 2013 2014 2015 2016 2017
50
60
70
80
90
REGIONAL AVERAGE(EUROPE REGION)
WORLD AVERAGE
60.9 68.0
73.3( ▲ UP 0.1 POINT )( ▲ UP 0.1 POINT )
MOSTLY FREE
1628ECONOMIC FREEDOM STATUS:
REGIONAL RANK: WORLD RANK:
2015 data unless otherwise noted. Data compiled as of September 2016
CZECH REPUBLIC
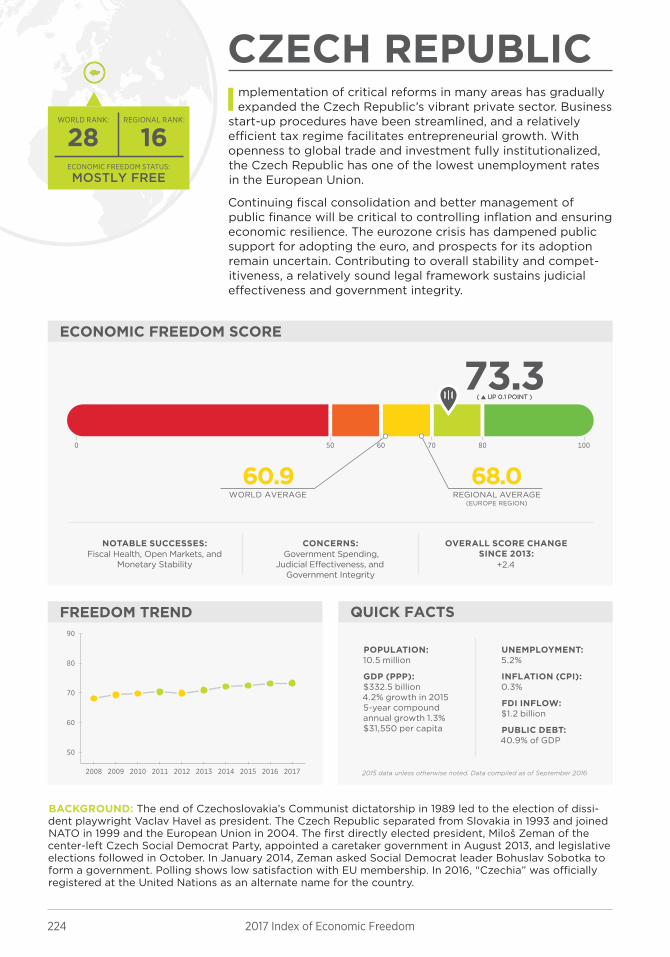
BACKGROUND: The end of Czechoslovakia’s Communist dictatorship in 1989 led to the election of dissi-dent playwright Vaclav Havel as president. The Czech Republic separated from Slovakia in 1993 and joined NATO in 1999 and the European Union in 2004. The first directly elected president, Miloš Zeman of the center-left Czech Social Democrat Party, appointed a caretaker government in August 2013, and legislative elections followed in October. In January 2014, Zeman asked Social Democrat leader Bohuslav Sobotka to form a government. Polling shows low satisfaction with EU membership. In 2016, “Czechia” was officially registered at the United Nations as an alternate name for the country.
Implementation of critical reforms in many areas has gradually expanded the Czech Republic’s vibrant private sector. Business
start-up procedures have been streamlined, and a relatively efficient tax regime facilitates entrepreneurial growth. With openness to global trade and investment fully institutionalized, the Czech Republic has one of the lowest unemployment rates in the European Union.
Continuing fiscal consolidation and better management of public finance will be critical to controlling inflation and ensuring economic resilience. The eurozone crisis has dampened public support for adopting the euro, and prospects for its adoption remain uncertain. Contributing to overall stability and compet-itiveness, a relatively sound legal framework sustains judicial effectiveness and government integrity.
NOTABLE SUCCESSES:Fiscal Health, Open Markets, and
Monetary Stability
CONCERNS:Government Spending,
Judicial Effectiveness, and Government Integrity
OVERALL SCORE CHANGE SINCE 2013:
+2.4
POPULATION: 10.5 million
GDP (PPP): $332.5 billion4.2% growth in 20155-year compound annual growth 1.3%$31,550 per capita
UNEMPLOYMENT: 5.2%
INFLATION (CPI): 0.3%
FDI INFLOW: $1.2 billion
PUBLIC DEBT: 40.9% of GDP
225The Heritage Foundation | heritage.org/Index
WORLD AVERAGEKEY:
RULE OF LAW GOVERNMENT SIZERank
REGULATORY EFFICIENCY OPEN MARKETSRank
Property Rights
Judicial E�ectiveness
Government Integrity
TaxBurden
Government Spending
FiscalHealth
Business Freedom
Labor Freedom
Monetary Freedom
Trade Freedom
Investment Freedom
Financial Freedom
80
60
70
100
50
0
80
60
70
100
50
0
80
60
70
100
50
0
80
60
70
100
50
0
4th21st20th15th19th81st
48th147th64th36th57th36th
80.080.087.085.877.767.2
92.045.382.955.955.970.3
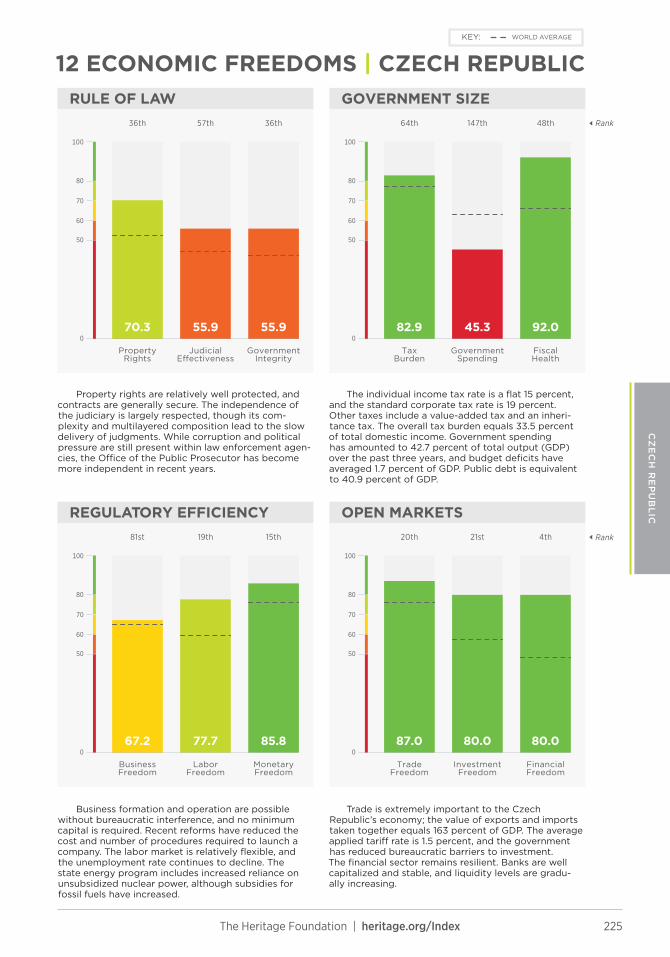
Property rights are relatively well protected, and contracts are generally secure. The independence of the judiciary is largely respected, though its com-plexity and multilayered composition lead to the slow delivery of judgments. While corruption and political pressure are still present within law enforcement agen-cies, the Office of the Public Prosecutor has become more independent in recent years.
The individual income tax rate is a flat 15 percent, and the standard corporate tax rate is 19 percent. Other taxes include a value-added tax and an inheri-tance tax. The overall tax burden equals 33.5 percent of total domestic income. Government spending has amounted to 42.7 percent of total output (GDP) over the past three years, and budget deficits have averaged 1.7 percent of GDP. Public debt is equivalent to 40.9 percent of GDP.
Business formation and operation are possible without bureaucratic interference, and no minimum capital is required. Recent reforms have reduced the cost and number of procedures required to launch a company. The labor market is relatively flexible, and the unemployment rate continues to decline. The state energy program includes increased reliance on unsubsidized nuclear power, although subsidies for fossil fuels have increased.
Trade is extremely important to the Czech Republic’s economy; the value of exports and imports taken together equals 163 percent of GDP. The average applied tariff rate is 1.5 percent, and the government has reduced bureaucratic barriers to investment. The financial sector remains resilient. Banks are well capitalized and stable, and liquidity levels are gradu-ally increasing.
12 ECONOMIC FREEDOMS | CZECH REPUBLIC
CZ
EC
H R
EP
UB
LIC

226 2017 Index of Economic Freedom
ECONOMIC FREEDOM SCORE
FREEDOM TREND QUICK FACTS
80706050 1000
2008 2009 2010 2011 2012 2013 2014 2015 2016 2017
50
60
70
80
90
REGIONAL AVERAGE(EUROPE REGION)
WORLD AVERAGE
60.9 68.0
75.1( ▼ DOWN 0.2 POINT )( ▼ DOWN 0.2 POINT )
MOSTLY FREE
918ECONOMIC FREEDOM STATUS:
REGIONAL RANK: WORLD RANK:
2015 data unless otherwise noted. Data compiled as of September 2016
DENMARK
BACKGROUND: Lars Løkke Rasmussen’s center-right Venstre party came in third in the June 2015 parlia-mentary elections, but Rasmussen became prime minister after forming a minority government. He also served as prime minister from 2009–2011. The center-left Social Democrats came in first in the election, and the Eurosceptic Danish People’s Party came in second. Denmark has been a member of the European Union since 1973. Its economy depends heavily on foreign trade, and the private sector includes many small and medium-size companies. Measures put in place to decrease immigration, including delayed family reunification and temporary border controls, appear to be having an impact.
Denmark’s economy performs notably well in regulatory effi-ciency. Open-market policies sustain flexibility, competitive-
ness, and large flows of trade and investment, and the transpar-ent and efficient regulatory and legal environment encourages robust entrepreneurial activity. Banking regulations are sensible, and lending practices have been prudent. Monetary stability is well maintained, and the judicial system provides strong protec-tion for property rights.
Government spending has been expansive, and the overall tax regime needed to finance the ever-growing scope of govern-ment has become more burdensome and complex. However, such institutional assets as high degrees of business efficiency and regulatory flexibility have counterbalanced some of the shortcomings of heavy social spending.
NOTABLE SUCCESSES:Business Freedom and
Open Markets
CONCERNS:Government Spending and
Tax Burden
OVERALL SCORE CHANGE SINCE 2013:
–1.0
POPULATION: 5.6 million
GDP (PPP): $258.7 billion1.2% growth in 20155-year compound annual growth 0.7%$45,709 per capita
UNEMPLOYMENT: 6.3%
INFLATION (CPI): 0.5%
FDI INFLOW: $3.6 billion
PUBLIC DEBT: 45.6% of GDP

227The Heritage Foundation | heritage.org/Index
WORLD AVERAGEKEY:
RULE OF LAW GOVERNMENT SIZERank
REGULATORY EFFICIENCY OPEN MARKETSRank
Property Rights
Judicial E�ectiveness
Government Integrity
TaxBurden
Government Spending
FiscalHealth
Business Freedom
Labor Freedom
Monetary Freedom
Trade Freedom
Investment Freedom
Financial Freedom
80
60
70
100
50
0
80
60
70
100
50
0
80
60
70
100
50
0
80
60
70
100
50
0
4th2nd20th18th8th3rd
35th174th181st8th29th11th
80.090.087.085.585.893.9
95.45.7
37.284.968.586.7
With a trustworthy, independent, and fair judicial system institutionalized throughout the economy, pro-tection of property rights is strongly enforced. Intellec-tual property rights are respected, and enforcement is consistent with world standards. Levels of corruption are generally very low in Denmark, which was ranked first out of 168 countries surveyed in Transparency International’s 2015 Corruption Perceptions Index.
The top personal income tax rate is 56 percent, and the top corporate tax rate is 23.5 percent. Other taxes include a value-added tax and an inheritance tax. The overall tax burden equals 50.9 percent of total domestic income. Government spending has amounted to 56.1 percent of total output (GDP) over the past three years, and budget deficits have averaged 0.5 percent of GDP. Public debt is equivalent to 45.6 percent of GDP.
The overall regulatory environment remains trans-parent and efficient. Launching a business takes fewer days and procedures than the world averages. Flexible and modern employment regulations sustain the labor market. Monetary stability is well established. Energy prices fell in 2016. Denmark has increased subsidies to maintain its renewable energy program but has declined to buy expensive new wind turbines.
Trade is extremely important to Denmark’s econ-omy; the value of exports and imports taken together equals 100 percent of GDP. The average applied tariff rate is 1.5 percent, and there are few barriers to foreign trade and investment. The financial system is compet-itive and resilient. The banking sector, characterized by relatively prudent lending in a sound regulatory framework, has regained its stability after a period of uncertainty.
12 ECONOMIC FREEDOMS | DENMARK
DE
NM
AR
K

228 2017 Index of Economic Freedom
ECONOMIC FREEDOM SCORE
FREEDOM TREND QUICK FACTS
80706050 1000
2008 2009 2010 2011 2012 2013 2014 2015 2016 2017
50
60
70
80
90
REGIONAL AVERAGE(EUROPE REGION)
WORLD AVERAGE
60.9 68.0
79.1( ▲ UP 1.9 POINTS )( ▲ UP 1.9 POINTS )
MOSTLY FREE
26ECONOMIC FREEDOM STATUS:
REGIONAL RANK: WORLD RANK:
2015 data unless otherwise noted. Data compiled as of September 2016
ESTONIA
BACKGROUND: Estonia regained its independence from the Soviet Union in 1991 and is a stable multi-party democracy. It joined NATO and the European Union in 2004 and the Organisation for Economic Co-operation and Development in 2010. In 2011, it became the first former Soviet state to adopt the euro. With a liberal investment climate, foreign investment has risen substantially since independence. In 2014, Estonia became the world’s first country to issue “E-Residency” status to noncitizens, which makes it easier to do business in Estonia. Jüri Ratas, leader of the Centre Party, became prime minister in Novem-ber 2016 after his party joined a coalition in a parliamentary power struggle to defeat the center-right, pro-market Reform Party of former Prime Minister Taavi Rõivas.
E stonia’s economy continues to benefit from government pol-icies that sustain a high level of economic freedom. The rule
of law remains strongly buttressed and enforced by an indepen-dent and efficient judicial system. A simplified tax system with flat rates and low indirect taxation, openness to foreign invest-ment, and a liberal trade regime have supported the resilient and well-functioning economy.
Prudent and sound management of public finance has been notable. In particular, revitalized efforts to move even further toward limited government and ensure long-term fiscal sustain-ability have helped to sustain economic vitality. Fiscal adjust-ments have brought down budget deficits and kept levels of public debt among the lowest in the world.
NOTABLE SUCCESSES:Fiscal Health, Open Markets, and
Monetary Stability
CONCERNS:Government Spending and
Labor Freedom
OVERALL SCORE CHANGE SINCE 2013:
+3.8
POPULATION: 1.3 million
GDP (PPP): $37.5 billion1.1% growth in 20155-year compound annual growth 3.7%$28,592 per capita
UNEMPLOYMENT: 5.9%
INFLATION (CPI): 0.1%
FDI INFLOW: $207.7 million
PUBLIC DEBT: 10.1% of GDP

229The Heritage Foundation | heritage.org/Index
WORLD AVERAGEKEY:
RULE OF LAW GOVERNMENT SIZERank
REGULATORY EFFICIENCY OPEN MARKETSRank
Property Rights
Judicial E�ectiveness
Government Integrity
TaxBurden
Government Spending
FiscalHealth
Business Freedom
Labor Freedom
Monetary Freedom
Trade Freedom
Investment Freedom
Financial Freedom
80
60
70
100
50
0
80
60
70
100
50
0
80
60
70
100
50
0
80
60
70
100
50
0
4th2nd20th17th107th40th
4th124th71st26th8th22nd
80.090.087.085.756.977.0
99.855.881.269.982.882.6
Property rights and contracts are well enforced and secure. Commercial codes are applied consistently. The judiciary is independent and well insulated from government influence. The government has effective mechanisms to investigate and punish abuse and corruption. There have been no reports of impunity involving the security forces, but several high-ranking state officials have been convicted of corruption and criminal misconduct.
The top personal income and corporate tax rates are 20 percent. Undistributed profits are not taxed. Other taxes include a value-added tax and excise taxes. The overall tax burden equals 32.9 percent of total domestic income. Government spending has amounted to 38.4 percent of total output (GDP) over the past three years, and budget surpluses have averaged 0.3 percent of GDP. Public debt is equivalent to 10.1 percent of GDP.
The business start-up process is straightforward, and the cost of completing licensing requirements has been substantially reduced. Enhancing labor produc-tivity and employment growth has been a key goal in ongoing efforts to reform the labor market. Estonian Air, a small airline, went out of business in late 2015 after the European Commission ruled that it benefited from unfair advantages because of heavy govern-ment subsidies.
Trade is extremely important to Estonia’s econ-omy; the value of exports and imports taken together equals 155 percent of GDP. The average applied tariff rate is 1.5 percent. Estonia is very open to foreign investment, but several state-owned enterprises distort the economy. The competitive banking sector provides a wide range of financial services with little state intervention.
12 ECONOMIC FREEDOMS | ESTONIA
ES
TO
NIA

230 2017 Index of Economic Freedom
ECONOMIC FREEDOM SCORE
FREEDOM TREND QUICK FACTS
80706050 1000
2008 2009 2010 2011 2012 2013 2014 2015 2016 2017
50
60
70
80
90
REGIONAL AVERAGE(EUROPE REGION)
WORLD AVERAGE
60.9 68.0
74.0( ▲ UP 1.4 POINTS )( ▲ UP 1.4 POINTS )
MOSTLY FREE
1324ECONOMIC FREEDOM STATUS:
REGIONAL RANK: WORLD RANK:
2015 data unless otherwise noted. Data compiled as of September 2016
FINLAND
BACKGROUND: Prime Minister Juha Sipilä of the Centre Party formed a coalition with the Eurosceptic conservative Finns Party and center-right National Coalition Party following elections in April 2015. Finland joined the European Union in 1995 and adopted the euro in 1999. It became a member of NATO’s Partner-ship for Peace in 1994 and sits on the Euro–Atlantic Council. In 2014, Finland became one of five nations to deepen their cooperation with NATO as enhanced opportunity partners. Recent Russian aggression against Ukraine has prompted renewed public debate about full NATO membership. Declining exports and flagging business for key Finnish companies have negatively affected the economy.
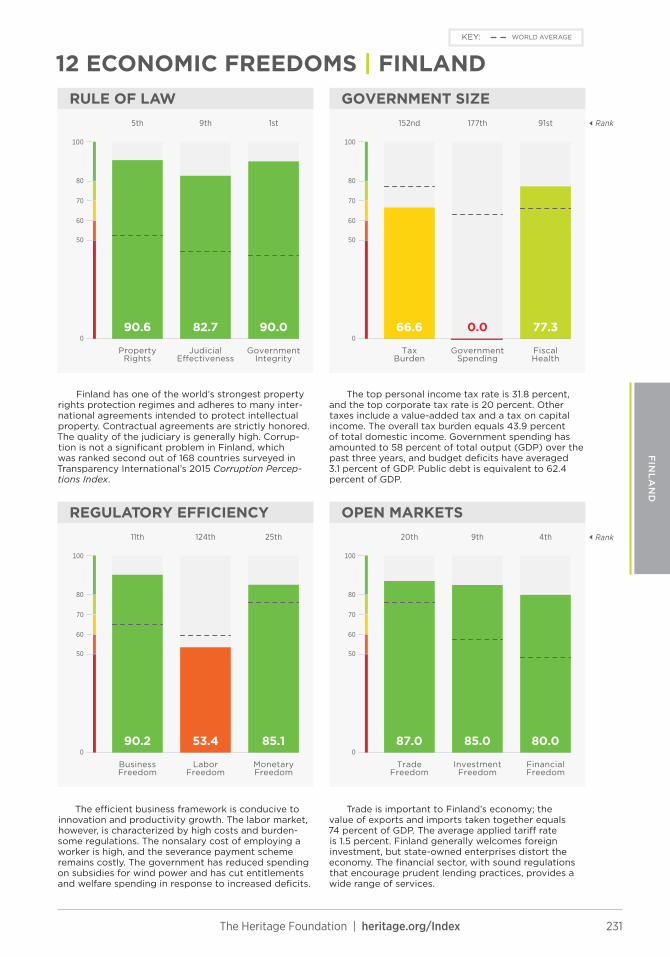
F inland’s economy is characterized by openness and transpar-ency. The quality of the legal framework is among the world’s
highest, providing effective protection of property rights. The rule of law is well maintained, and a strong tradition of minimum tolerance for corruption continues.
Over the past five years, the economy has experienced eco-nomic slowdown and uncertainty. Efforts to restore economic growth, increase competitiveness, and reduce public debt continue to be at the top of the policy agenda. Government spending accounts for over half of GDP and has proven to be a drag on the economy instead of a stimulus, and public debt continues to rise.
NOTABLE SUCCESSES:Rule of Law, Open Markets, and
Business Freedom
CONCERNS:Labor Freedom, Government
Spending, and Tax Policy
OVERALL SCORE CHANGE SINCE 2013:
0.0
POPULATION: 5.5 million
GDP (PPP): $225.0 billion0.4% growth in 20155-year compound annual growth 0.0%$41,120 per capita
UNEMPLOYMENT: 9.6%
INFLATION (CPI): –0.2%
FDI INFLOW: $8.3 billion
PUBLIC DEBT: 62.4% of GDP
231The Heritage Foundation | heritage.org/Index
WORLD AVERAGEKEY:
RULE OF LAW GOVERNMENT SIZERank
REGULATORY EFFICIENCY OPEN MARKETSRank
Property Rights
Judicial E�ectiveness
Government Integrity
TaxBurden
Government Spending
FiscalHealth
Business Freedom
Labor Freedom
Monetary Freedom
Trade Freedom
Investment Freedom
Financial Freedom
80
60
70
100
50
0
80
60
70
100
50
0
80
60
70
100
50
0
80
60
70
100
50
0
4th9th20th25th124th11th
91st177th152nd1st9th5th
80.085.087.085.153.490.2
77.30.066.690.082.790.6
Finland has one of the world’s strongest property rights protection regimes and adheres to many inter-national agreements intended to protect intellectual property. Contractual agreements are strictly honored. The quality of the judiciary is generally high. Corrup-tion is not a significant problem in Finland, which was ranked second out of 168 countries surveyed in Transparency International’s 2015 Corruption Percep-tions Index.
The top personal income tax rate is 31.8 percent, and the top corporate tax rate is 20 percent. Other taxes include a value-added tax and a tax on capital income. The overall tax burden equals 43.9 percent of total domestic income. Government spending has amounted to 58 percent of total output (GDP) over the past three years, and budget deficits have averaged 3.1 percent of GDP. Public debt is equivalent to 62.4 percent of GDP.
The efficient business framework is conducive to innovation and productivity growth. The labor market, however, is characterized by high costs and burden-some regulations. The nonsalary cost of employing a worker is high, and the severance payment scheme remains costly. The government has reduced spending on subsidies for wind power and has cut entitlements and welfare spending in response to increased deficits.
Trade is important to Finland’s economy; the value of exports and imports taken together equals 74 percent of GDP. The average applied tariff rate is 1.5 percent. Finland generally welcomes foreign investment, but state-owned enterprises distort the economy. The financial sector, with sound regulations that encourage prudent lending practices, provides a wide range of services.
12 ECONOMIC FREEDOMS | FINLAND
FIN
LA
ND

232 2017 Index of Economic Freedom
ECONOMIC FREEDOM SCORE
FREEDOM TREND QUICK FACTS
80706050 1000
2008 2009 2010 2011 2012 2013 2014 2015 2016 2017
40
50
60
70
80
REGIONAL AVERAGE(EUROPE REGION)
WORLD AVERAGE
60.9 68.0
63.3( ▲ UP 1.0 POINT )( ▲ UP 1.0 POINT )
MODERATELY FREE
3272ECONOMIC FREEDOM STATUS:
REGIONAL RANK: WORLD RANK:
2015 data unless otherwise noted. Data compiled as of September 2016
FRANCE
BACKGROUND: François Hollande was elected president in May 2012, and his Socialist Party has major-ity control of the National Assembly. Hollande’s poor handling of the economy and public fears related to security have led to consistently low approval ratings. A recent spate of horrific terrorist attacks has shaken public confidence. France was a leading participant in NATO’s March 2011 military engagement in Libya and has sent troops to Mali and the Central African Republic to counter advancing Islamic militants. France began airstrikes against ISIS in spring 2015 and remains a major contributor to the anti-ISIS coali-tion. The economy is diversified with tourism, manufacturing, and pharmaceuticals as major industries.
F rance’s economy has proven to be relatively resilient, with entrepreneurial activity facilitated by such institutional
strengths as strong protection of property rights and a fairly efficient regulatory framework. Various reform measures have been adopted to increase the economy’s competitiveness and flexibility, but overall progress has been marginal.
The state dominates major sectors of the economy and remains a large shareholder in many semipublic enterprises. Government spending accounts for more than half of total domestic output, and the budget has been chronically in deficit. Various stimu-lus measures have resulted in a deterioration of public finance, increasing the fiscal burdens imposed on French taxpayers.
NOTABLE SUCCESSES:Rule of Law and Open Markets
CONCERNS:Government Spending, Labor Freedom, and Fiscal Health
OVERALL SCORE CHANGE SINCE 2013:
–0.8
POPULATION: 64.2 million
GDP (PPP): $2.6 trillion1.1% growth in 20155-year compound annual growth 0.8%$41,181 per capita
UNEMPLOYMENT: 10.6%
INFLATION (CPI): 0.1%
FDI INFLOW: $42.9 billion
PUBLIC DEBT: 96.8% of GDP
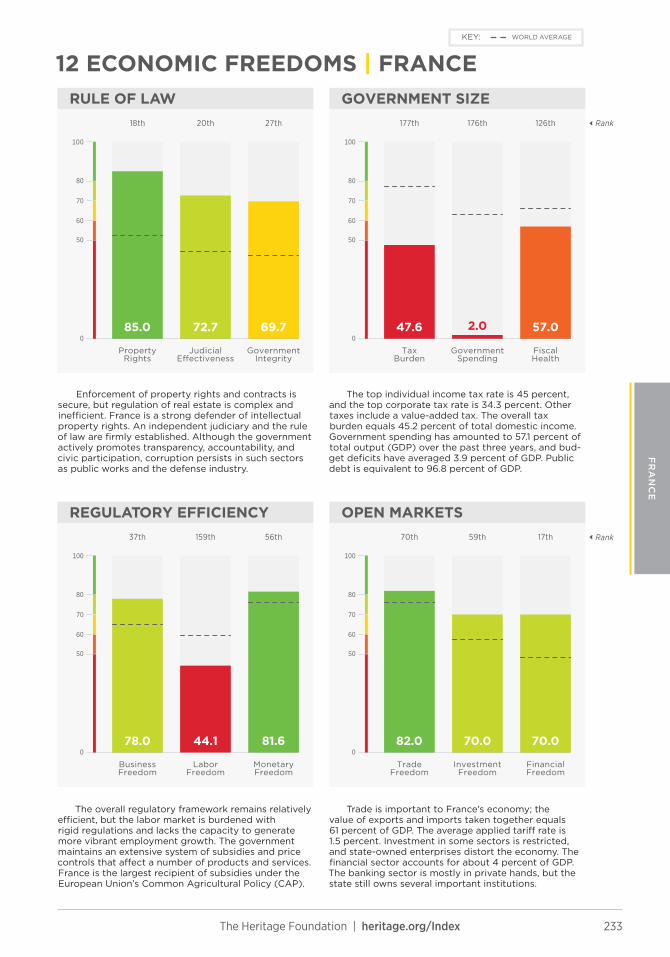
233The Heritage Foundation | heritage.org/Index
WORLD AVERAGEKEY:
RULE OF LAW GOVERNMENT SIZERank
REGULATORY EFFICIENCY OPEN MARKETSRank
Property Rights
Judicial E�ectiveness
Government Integrity
TaxBurden
Government Spending
FiscalHealth
Business Freedom
Labor Freedom
Monetary Freedom
Trade Freedom
Investment Freedom
Financial Freedom
80
60
70
100
50
0
80
60
70
100
50
0
80
60
70
100
50
0
80
60
70
100
50
0
17th59th70th56th159th37th
126th176th177th27th20th18th
70.070.082.081.644.178.0
57.02.047.669.772.785.0
Enforcement of property rights and contracts is secure, but regulation of real estate is complex and inefficient. France is a strong defender of intellectual property rights. An independent judiciary and the rule of law are firmly established. Although the government actively promotes transparency, accountability, and civic participation, corruption persists in such sectors as public works and the defense industry.
The top individual income tax rate is 45 percent, and the top corporate tax rate is 34.3 percent. Other taxes include a value-added tax. The overall tax burden equals 45.2 percent of total domestic income. Government spending has amounted to 57.1 percent of total output (GDP) over the past three years, and bud-get deficits have averaged 3.9 percent of GDP. Public debt is equivalent to 96.8 percent of GDP.
The overall regulatory framework remains relatively efficient, but the labor market is burdened with rigid regulations and lacks the capacity to generate more vibrant employment growth. The government maintains an extensive system of subsidies and price controls that affect a number of products and services. France is the largest recipient of subsidies under the European Union’s Common Agricultural Policy (CAP).
Trade is important to France’s economy; the value of exports and imports taken together equals 61 percent of GDP. The average applied tariff rate is 1.5 percent. Investment in some sectors is restricted, and state-owned enterprises distort the economy. The financial sector accounts for about 4 percent of GDP. The banking sector is mostly in private hands, but the state still owns several important institutions.
12 ECONOMIC FREEDOMS | FRANCE
FR
AN
CE

234 2017 Index of Economic Freedom
MOSTLY FREE
513ECONOMIC FREEDOM STATUS:
REGIONAL RANK: WORLD RANK:
ECONOMIC FREEDOM SCORE
FREEDOM TREND QUICK FACTS
80706050 1000
2008 2009 2010 2011 2012 2013 2014 2015 2016 2017
50
60
70
80
90
REGIONAL AVERAGE(EUROPE REGION)
WORLD AVERAGE
60.9 68.0
76.0( ▲ UP 3.4 POINTS )( ▲ UP 3.4 POINTS )
2015 data unless otherwise noted. Data compiled as of September 2016
GEORGIA
BACKGROUND: Russia invaded Georgia in 2008 and continues to occupy its South Ossetia and Abkhazia regions, which make up about 20 percent of Georgia’s territory. In 2012, billionaire Bidzina Ivanishvili and his Georgian Dream coalition defeated President Mikheil Saakashvili’s United National Movement. Victory by Prime Minister Giorgi Kvirikashvili and his Georgian Dream party in the 2016 parliamentary elections reinforced the party’s political dominance. Georgia has been affected by the economic downturn in Russia and by low oil prices. Agriculture or related industries employ over half of the workforce. Georgia signed an Association Agreement with the European Union in June 2014 and is an official aspirant country for NATO membership.
Georgia’s government has maintained strong momentum in liberalizing economic activity while taking steps to restore
fiscal discipline. Public debt and budget deficits remain under control. Open-market policies, supported by competitively low tax rates and regulatory efficiency, have facilitated flows of trade and investment. Large-scale privatization has advanced, and anticorruption efforts have yielded some notable results.
With monetary stability and the overall soundness of fiscal health relatively well maintained, Georgia has enjoyed mac-roeconomic resilience. Nonetheless, deeper and more rapid institutional reforms to enhance judicial independence and effectiveness remain critical to ensuring further dynamic and lasting economic development.
NOTABLE SUCCESSES:Fiscal Policy, Regulatory Efficiency,
and Open Markets
CONCERNS:Property Rights, Judicial
Effectiveness, and Government Integrity
OVERALL SCORE CHANGE SINCE 2013:
+3.8
POPULATION: 4.5 million
GDP (PPP): $35.6 billion2.8% growth in 20155-year compound annual growth 4.9%$9,630 per capita
UNEMPLOYMENT: 12.3%
INFLATION (CPI): 4.0%
FDI INFLOW: $1.4 billion
PUBLIC DEBT: 41.2% of GDP
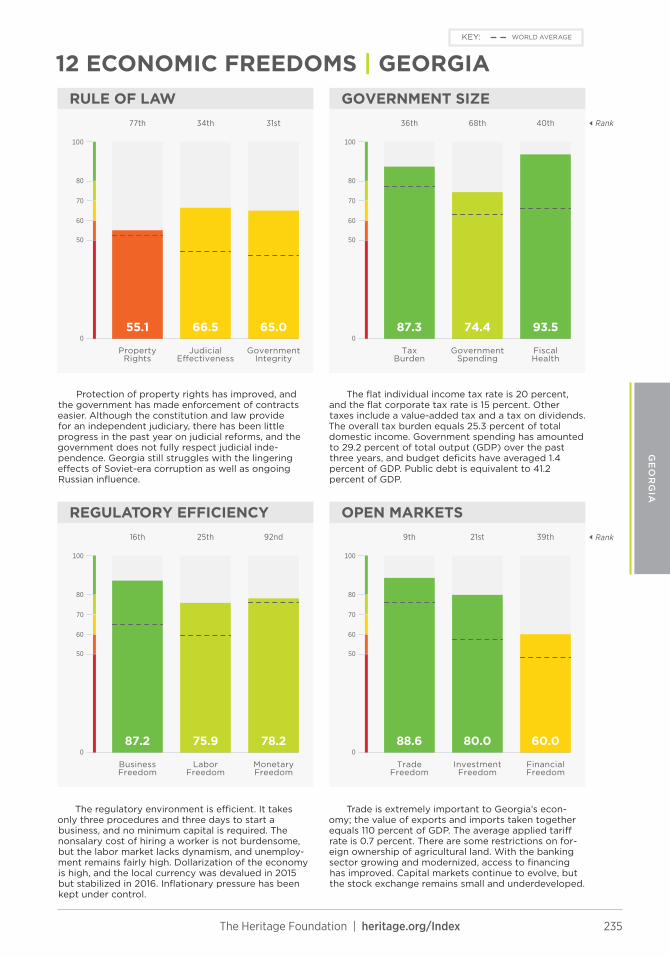
235The Heritage Foundation | heritage.org/Index
WORLD AVERAGEKEY:
RULE OF LAW GOVERNMENT SIZERank
REGULATORY EFFICIENCY OPEN MARKETSRank
Property Rights
Judicial E�ectiveness
Government Integrity
TaxBurden
Government Spending
FiscalHealth
Business Freedom
Labor Freedom
Monetary Freedom
Trade Freedom
Investment Freedom
Financial Freedom
80
60
70
100
50
0
80
60
70
100
50
0
80
60
70
100
50
0
80
60
70
100
50
0
39th21st9th92nd25th16th
40th68th36th31st34th77th
60.080.088.678.275.987.2
93.574.487.365.066.555.1
Protection of property rights has improved, and the government has made enforcement of contracts easier. Although the constitution and law provide for an independent judiciary, there has been little progress in the past year on judicial reforms, and the government does not fully respect judicial inde-pendence. Georgia still struggles with the lingering effects of Soviet-era corruption as well as ongoing Russian influence.
The flat individual income tax rate is 20 percent, and the flat corporate tax rate is 15 percent. Other taxes include a value-added tax and a tax on dividends. The overall tax burden equals 25.3 percent of total domestic income. Government spending has amounted to 29.2 percent of total output (GDP) over the past three years, and budget deficits have averaged 1.4 percent of GDP. Public debt is equivalent to 41.2 percent of GDP.
The regulatory environment is efficient. It takes only three procedures and three days to start a business, and no minimum capital is required. The nonsalary cost of hiring a worker is not burdensome, but the labor market lacks dynamism, and unemploy-ment remains fairly high. Dollarization of the economy is high, and the local currency was devalued in 2015 but stabilized in 2016. Inflationary pressure has been kept under control.
Trade is extremely important to Georgia’s econ-omy; the value of exports and imports taken together equals 110 percent of GDP. The average applied tariff rate is 0.7 percent. There are some restrictions on for-eign ownership of agricultural land. With the banking sector growing and modernized, access to financing has improved. Capital markets continue to evolve, but the stock exchange remains small and underdeveloped.
12 ECONOMIC FREEDOMS | GEORGIA
GE
OR
GIA
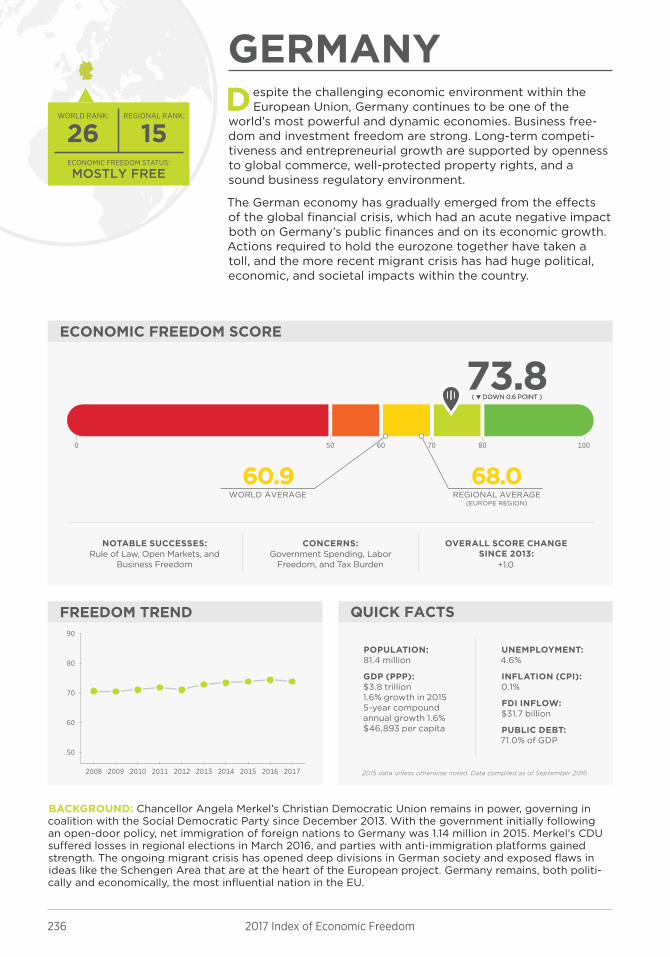
236 2017 Index of Economic Freedom
MOSTLY FREE
1526ECONOMIC FREEDOM STATUS:
REGIONAL RANK: WORLD RANK:
ECONOMIC FREEDOM SCORE
FREEDOM TREND QUICK FACTS
80706050 1000
2008 2009 2010 2011 2012 2013 2014 2015 2016 2017
50
60
70
80
90
REGIONAL AVERAGE(EUROPE REGION)
WORLD AVERAGE
60.9 68.0
73.8( ▼ DOWN 0.6 POINT )( ▼ DOWN 0.6 POINT )
2015 data unless otherwise noted. Data compiled as of September 2016
GERMANY
BACKGROUND: Chancellor Angela Merkel’s Christian Democratic Union remains in power, governing in coalition with the Social Democratic Party since December 2013. With the government initially following an open-door policy, net immigration of foreign nations to Germany was 1.14 million in 2015. Merkel’s CDU suffered losses in regional elections in March 2016, and parties with anti-immigration platforms gained strength. The ongoing migrant crisis has opened deep divisions in German society and exposed flaws in ideas like the Schengen Area that are at the heart of the European project. Germany remains, both politi-cally and economically, the most influential nation in the EU.
Despite the challenging economic environment within the European Union, Germany continues to be one of the
world’s most powerful and dynamic economies. Business free-dom and investment freedom are strong. Long-term competi-tiveness and entrepreneurial growth are supported by openness to global commerce, well-protected property rights, and a sound business regulatory environment.
The German economy has gradually emerged from the effects of the global financial crisis, which had an acute negative impact both on Germany’s public finances and on its economic growth. Actions required to hold the eurozone together have taken a toll, and the more recent migrant crisis has had huge political, economic, and societal impacts within the country.
NOTABLE SUCCESSES:Rule of Law, Open Markets, and
Business Freedom
CONCERNS:Government Spending, Labor
Freedom, and Tax Burden
OVERALL SCORE CHANGE SINCE 2013:
+1.0
POPULATION: 81.4 million
GDP (PPP): $3.8 trillion1.6% growth in 20155-year compound annual growth 1.6%$46,893 per capita
UNEMPLOYMENT: 4.6%
INFLATION (CPI): 0.1%
FDI INFLOW: $31.7 billion
PUBLIC DEBT: 71.0% of GDP

237The Heritage Foundation | heritage.org/Index
WORLD AVERAGEKEY:
RULE OF LAW GOVERNMENT SIZERank
REGULATORY EFFICIENCY OPEN MARKETSRank
Property Rights
Judicial E�ectiveness
Government Integrity
TaxBurden
Government Spending
FiscalHealth
Business Freedom
Labor Freedom
Monetary Freedom
Trade Freedom
Investment Freedom
Financial Freedom
80
60
70
100
50
0
80
60
70
100
50
0
80
60
70
100
50
0
80
60
70
100
50
0
17th21st20th13th166th17th
56th150th165th16th14th21st
70.080.087.085.942.886.6
89.941.461.977.779.582.9
German law fully protects the property rights of German citizens and foreigners alike. Secured interests in property, both chattel and real, are recognized and enforced. Germany boasts a robust regime for the protection of intellectual property rights. The judiciary is independent, and the rule of law prevails. Corrupt acts by public officials are vigorously prosecuted and punished.
The top personal income tax rate is 45 percent. The federal corporate tax rate is 15.8 percent, but other taxes, including a solidarity tax, make the effective rate more than 30 percent. The overall tax burden equals 36.1 percent of total domestic income. Government spending has amounted to 44.2 percent of total output (GDP) over the past three years, and budget surpluses have averaged 0.4 percent of GDP. Public debt is equivalent to 71.0 percent of GDP.
The efficient regulatory framework strongly facilitates entrepreneurial activity, allowing business operation to be as dynamic in Germany as anywhere else in the world. A nationwide statutory minimum wage was introduced in 2015. Monetary stability is well maintained, but electricity costs are among the highest in Europe because of the government’s commitment to renewable energy.
Trade is important to Germany’s economy; the value of exports and imports taken together equals 86 percent of GDP. The average applied tariff rate is 1.5 percent. Barriers to foreign investment are low, but state-owned enterprises distort the economy. The well-functioning and modern financial sector offers a full range of services. The banking sector consists of the traditional three-tiered system of private, public, and cooperative banks.
12 ECONOMIC FREEDOMS | GERMANY
GE
RM
AN
Y

238 2017 Index of Economic Freedom
MOSTLY UNFREE
43127ECONOMIC FREEDOM STATUS:
REGIONAL RANK: WORLD RANK:
ECONOMIC FREEDOM SCORE
FREEDOM TREND QUICK FACTS
80706050 1000
2008 2009 2010 2011 2012 2013 2014 2015 2016 2017
40
50
60
70
80
REGIONAL AVERAGE(EUROPE REGION)
WORLD AVERAGE
60.9 68.0
55.0( ▲ UP 1.8 POINTS )( ▲ UP 1.8 POINTS )
2015 data unless otherwise noted. Data compiled as of September 2016
GREECE
BACKGROUND: Greece joined NATO in 1952 and the European Union in 1981. It adopted the euro in 2002. Prime Minister Alexis Tsipras of the Coalition of the Radical Left (Syriza) was able to reestablish a coalition government following snap elections in September 2015. Greece remains mired in political and economic uncertainty. In May 2016, an IMF–EU deal on Greek debt relief led to the release of $11.5 billion in new bail-out funds. Greece has been beset by a series of crippling strikes and protests in the face of new austerity measures and has had to deal with high numbers of migrants.
G reece has made progress in restoring macroeconomic stabil-ity and implementing much-needed initial fiscal adjustments.
However, the public sector accounts for more than 50 percent of GDP, and the country continues to confront a daunting debt burden and severe erosion of competitiveness.
Serious challenges remain in such areas as government spend-ing and labor freedom. The fiscal deficit remains approximately 4 percent of GDP, and public debt exceeds 170 percent of GDP. Fading business confidence and the lack of competitiveness are serious impediments to economic revival. The economy, stifled by powerful public unions, does not support entrepreneurship. The rigid labor market impedes productivity and job growth, and corruption continues to be a problem.
NOTABLE SUCCESSES:Trade Freedom
CONCERNS:Rule of Law, Government Spending,
and Financial Freedom
OVERALL SCORE CHANGE SINCE 2013:
–0.4
POPULATION: 11.0 million
GDP (PPP): $286.0 billion
–0.2% growth in 20155-year compound annual growth –3.8%$26,449 per capita
UNEMPLOYMENT: 24.9%
INFLATION (CPI): –1.1%
FDI INFLOW: –$289.5 million
PUBLIC DEBT: 178.4% of GDP
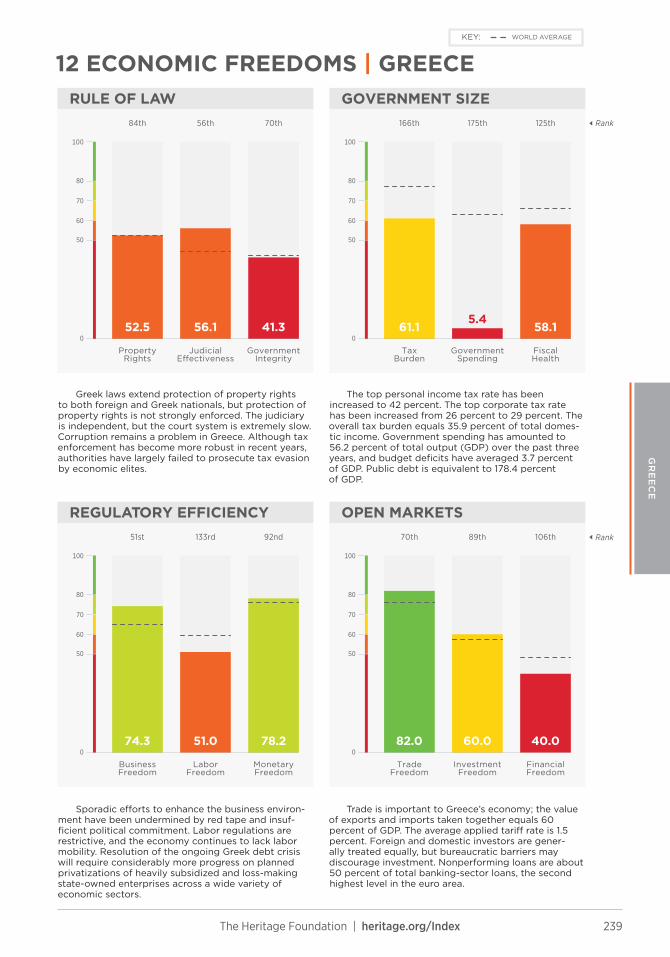
239The Heritage Foundation | heritage.org/Index
WORLD AVERAGEKEY:
RULE OF LAW GOVERNMENT SIZERank
REGULATORY EFFICIENCY OPEN MARKETSRank
Property Rights
Judicial E�ectiveness
Government Integrity
TaxBurden
Government Spending
FiscalHealth
Business Freedom
Labor Freedom
Monetary Freedom
Trade Freedom
Investment Freedom
Financial Freedom
80
60
70
100
50
0
80
60
70
100
50
0
80
60
70
100
50
0
80
60
70
100
50
0
106th89th70th92nd133rd51st
125th175th166th70th56th84th
40.060.082.078.251.074.3
58.15.4
61.141.356.152.5
Greek laws extend protection of property rights to both foreign and Greek nationals, but protection of property rights is not strongly enforced. The judiciary is independent, but the court system is extremely slow. Corruption remains a problem in Greece. Although tax enforcement has become more robust in recent years, authorities have largely failed to prosecute tax evasion by economic elites.
The top personal income tax rate has been increased to 42 percent. The top corporate tax rate has been increased from 26 percent to 29 percent. The overall tax burden equals 35.9 percent of total domes-tic income. Government spending has amounted to 56.2 percent of total output (GDP) over the past three years, and budget deficits have averaged 3.7 percent of GDP. Public debt is equivalent to 178.4 percent of GDP.
Sporadic efforts to enhance the business environ-ment have been undermined by red tape and insuf-ficient political commitment. Labor regulations are restrictive, and the economy continues to lack labor mobility. Resolution of the ongoing Greek debt crisis will require considerably more progress on planned privatizations of heavily subsidized and loss-making state-owned enterprises across a wide variety of economic sectors.
Trade is important to Greece’s economy; the value of exports and imports taken together equals 60 percent of GDP. The average applied tariff rate is 1.5 percent. Foreign and domestic investors are gener-ally treated equally, but bureaucratic barriers may discourage investment. Nonperforming loans are about 50 percent of total banking-sector loans, the second highest level in the euro area.
12 ECONOMIC FREEDOMS | GREECE
GR
EE
CE

240 2017 Index of Economic Freedom
MODERATELY FREE
2756ECONOMIC FREEDOM STATUS:
REGIONAL RANK: WORLD RANK:
ECONOMIC FREEDOM SCORE
FREEDOM TREND QUICK FACTS
80706050 1000
2008 2009 2010 2011 2012 2013 2014 2015 2016 2017
40
50
60
70
80
REGIONAL AVERAGE(EUROPE REGION)
WORLD AVERAGE
60.9 68.0
65.8( ▼ DOWN 0.2 POINT )( ▼ DOWN 0.2 POINT )
2015 data unless otherwise noted. Data compiled as of September 2016
HUNGARY
BACKGROUND: Hungary has been a member of NATO since 1999 and a member of the European Union since 2004. In the April 2014 parliamentary election, held in accordance with a new constitution that took effect in January 2012, the center-right Fidesz–Hungarian Civic Alliance won the majority of seats, and Prime Minister Viktor Orbán, in office since May 2010, was able to form a new government. Robust exports and increased domestic demand have helped Hungary’s economy to achieve strong growth. Public works programs, including building border fences, have succeeded in lowering unemployment but also have swallowed a growing percentage of GDP. Hard-currency indebtedness and a shortage of labor remain key vulnerabilities.
Hungary has implemented critical reforms in many areas. Licensing procedures have been streamlined, and the overall
entrepreneurial environment is further aided by strong trade freedom, business freedom, and investment freedom. Since January 2016, the personal income tax rate has been lowered to a flat rate of 15 percent, down from 16 percent.
The economy has grown at a robust pace over the past few years and now has significant momentum. Consolidating pub-lic finances and further encouraging economic growth remain policy priorities. Additional fiscal adjustments are needed to put public debt on a firmly downward path and provide more space for vibrant private-sector activity.
NOTABLE SUCCESSES:Open Markets, Monetary Stability,
and Tax Policy
CONCERNS:Government Spending,
Judicial Effectiveness, and Government Integrity
OVERALL SCORE CHANGE SINCE 2013:
–1.5
POPULATION: 9.9 million
GDP (PPP): $258.4 billion2.9% growth in 20155-year compound annual growth 1.7%$26,222 per capita
UNEMPLOYMENT: 7.0%
INFLATION (CPI): –0.1%
FDI INFLOW: $1.3 billion
PUBLIC DEBT: 75.5% of GDP
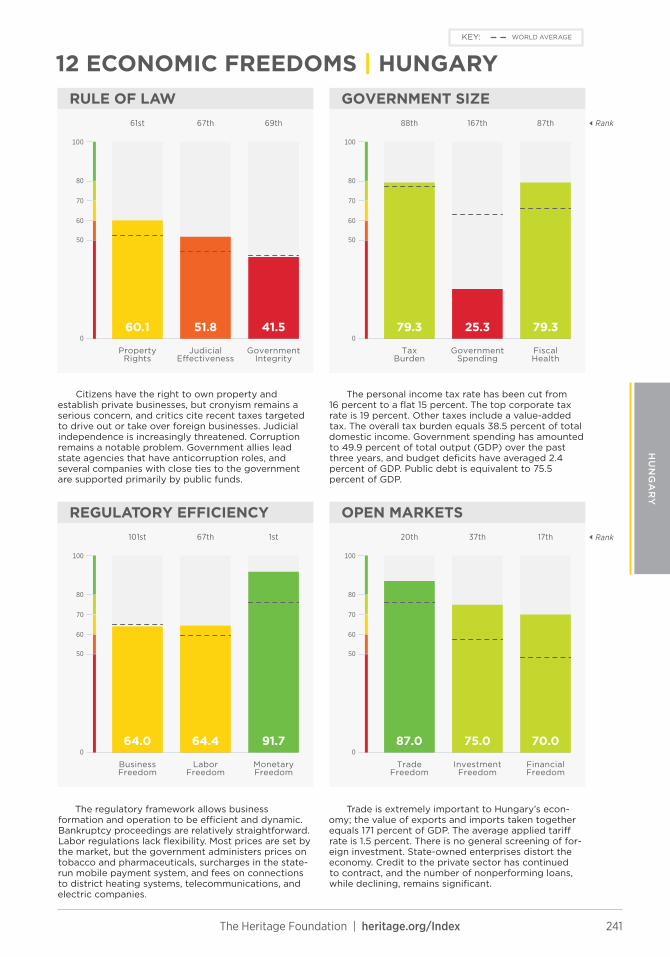
241The Heritage Foundation | heritage.org/Index
WORLD AVERAGEKEY:
RULE OF LAW GOVERNMENT SIZERank
REGULATORY EFFICIENCY OPEN MARKETSRank
Property Rights
Judicial E�ectiveness
Government Integrity
TaxBurden
Government Spending
FiscalHealth
Business Freedom
Labor Freedom
Monetary Freedom
Trade Freedom
Investment Freedom
Financial Freedom
80
60
70
100
50
0
80
60
70
100
50
0
80
60
70
100
50
0
80
60
70
100
50
0
17th37th20th1st67th101st
87th167th88th69th67th61st
70.075.087.091.764.464.0
79.325.379.341.551.860.1
Citizens have the right to own property and establish private businesses, but cronyism remains a serious concern, and critics cite recent taxes targeted to drive out or take over foreign businesses. Judicial independence is increasingly threatened. Corruption remains a notable problem. Government allies lead state agencies that have anticorruption roles, and several companies with close ties to the government are supported primarily by public funds.
The personal income tax rate has been cut from 16 percent to a flat 15 percent. The top corporate tax rate is 19 percent. Other taxes include a value-added tax. The overall tax burden equals 38.5 percent of total domestic income. Government spending has amounted to 49.9 percent of total output (GDP) over the past three years, and budget deficits have averaged 2.4 percent of GDP. Public debt is equivalent to 75.5 percent of GDP.
The regulatory framework allows business formation and operation to be efficient and dynamic. Bankruptcy proceedings are relatively straightforward. Labor regulations lack flexibility. Most prices are set by the market, but the government administers prices on tobacco and pharmaceuticals, surcharges in the state-run mobile payment system, and fees on connections to district heating systems, telecommunications, and electric companies.
Trade is extremely important to Hungary’s econ-omy; the value of exports and imports taken together equals 171 percent of GDP. The average applied tariff rate is 1.5 percent. There is no general screening of for-eign investment. State-owned enterprises distort the economy. Credit to the private sector has continued to contract, and the number of nonperforming loans, while declining, remains significant.
12 ECONOMIC FREEDOMS | HUNGARY
HU
NG
AR
Y

242 2017 Index of Economic Freedom
MOSTLY FREE
1222ECONOMIC FREEDOM STATUS:
REGIONAL RANK: WORLD RANK:
ECONOMIC FREEDOM SCORE
FREEDOM TREND QUICK FACTS
80706050 1000
2008 2009 2010 2011 2012 2013 2014 2015 2016 2017
50
60
70
80
90
REGIONAL AVERAGE(EUROPE REGION)
WORLD AVERAGE
60.9 68.0
74.4( ▲ UP 1.1 POINTS )( ▲ UP 1.1 POINTS )
2015 data unless otherwise noted. Data compiled as of September 2016
ICELAND
BACKGROUND: Sigurður Ingi Jóhannsson became prime minister in April 2016 following the resignation of Sigmundur Davíð Gunnlaugsson after revelations in the Panama Papers of ownership in an offshore company. The Progressive Party has ruled in a coalition with the Independence Party since parliamentary elections in April 2013. Public distrust of politicians helped propel Guðni Jóhannesson, an independent historian, to the largely ceremonial presidency following elections in June 2016. Iceland officially withdrew its application for membership in the European Union in March 2015. Its relationship with the EU includes free trade and movement of capital, labor, goods, and services within the region. Domestic consumption and tourism have fueled growth in recent years.
Iceland’s modern and competitive economy benefits from a strong commitment to open-market policies that facilitate
dynamic flows of trade and investment. Transparent and effi-cient regulations are applied evenly in most cases and encour-age vigorous private-sector entrepreneurial activity. Measures to lift capital controls imposed in the wake of the 2008 financial crisis are underway.
The strength of Iceland’s economic and social institutions is reinforced by robust protection of property rights and an independent judiciary that enforces anticorruption measures. Management of public finance has been comparatively prudent, with continued attention to the size and scope of government. Monetary stability has been well maintained.
NOTABLE SUCCESSES:Property Rights, Business Freedom,
and Trade Freedom
CONCERNS:Government Spending, Financial Freedom, and Labor Freedom
OVERALL SCORE CHANGE SINCE 2013:
+2.3
POPULATION: 0.3 million
GDP (PPP): $15.2 billion4.0% growth in 20155-year compound annual growth 2.7%$46,097 per capita
UNEMPLOYMENT: 4.4%
INFLATION (CPI): 1.6%
FDI INFLOW: –$76.2 million
PUBLIC DEBT: 67.6% of GDP
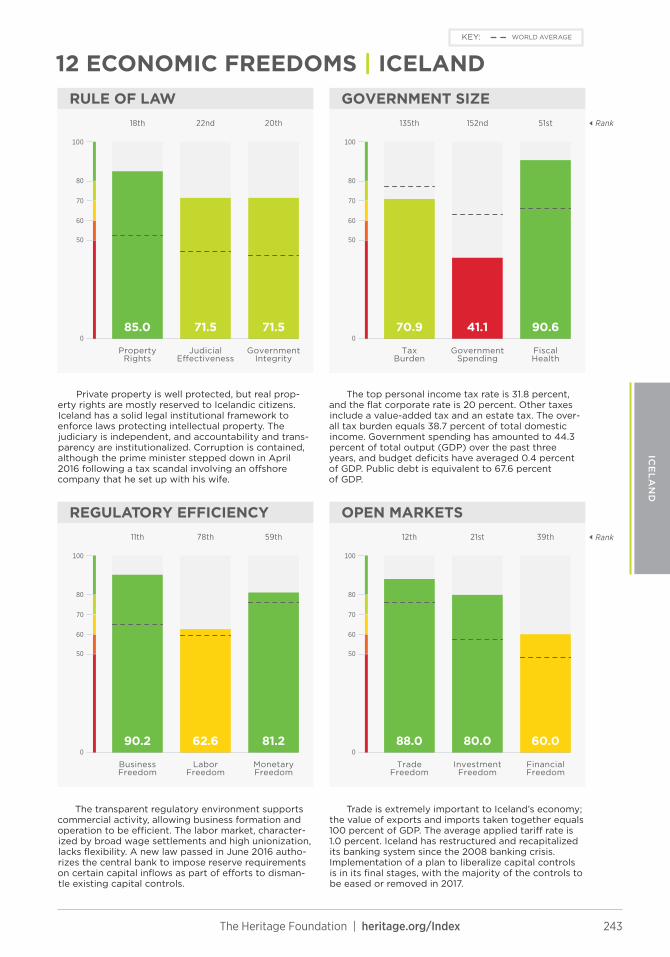
243The Heritage Foundation | heritage.org/Index
WORLD AVERAGEKEY:
RULE OF LAW GOVERNMENT SIZERank
REGULATORY EFFICIENCY OPEN MARKETSRank
Property Rights
Judicial E�ectiveness
Government Integrity
TaxBurden
Government Spending
FiscalHealth
Business Freedom
Labor Freedom
Monetary Freedom
Trade Freedom
Investment Freedom
Financial Freedom
80
60
70
100
50
0
80
60
70
100
50
0
80
60
70
100
50
0
80
60
70
100
50
0
39th21st12th59th78th11th
51st152nd135th20th22nd18th
60.080.088.081.262.690.2
90.641.170.971.571.585.0
Private property is well protected, but real prop-erty rights are mostly reserved to Icelandic citizens. Iceland has a solid legal institutional framework to enforce laws protecting intellectual property. The judiciary is independent, and accountability and trans-parency are institutionalized. Corruption is contained, although the prime minister stepped down in April 2016 following a tax scandal involving an offshore company that he set up with his wife.
The top personal income tax rate is 31.8 percent, and the flat corporate rate is 20 percent. Other taxes include a value-added tax and an estate tax. The over-all tax burden equals 38.7 percent of total domestic income. Government spending has amounted to 44.3 percent of total output (GDP) over the past three years, and budget deficits have averaged 0.4 percent of GDP. Public debt is equivalent to 67.6 percent of GDP.
The transparent regulatory environment supports commercial activity, allowing business formation and operation to be efficient. The labor market, character-ized by broad wage settlements and high unionization, lacks flexibility. A new law passed in June 2016 autho-rizes the central bank to impose reserve requirements on certain capital inflows as part of efforts to disman-tle existing capital controls.
Trade is extremely important to Iceland’s economy; the value of exports and imports taken together equals 100 percent of GDP. The average applied tariff rate is 1.0 percent. Iceland has restructured and recapitalized its banking system since the 2008 banking crisis. Implementation of a plan to liberalize capital controls is in its final stages, with the majority of the controls to be eased or removed in 2017.
12 ECONOMIC FREEDOMS | ICELAND
ICE
LA
ND
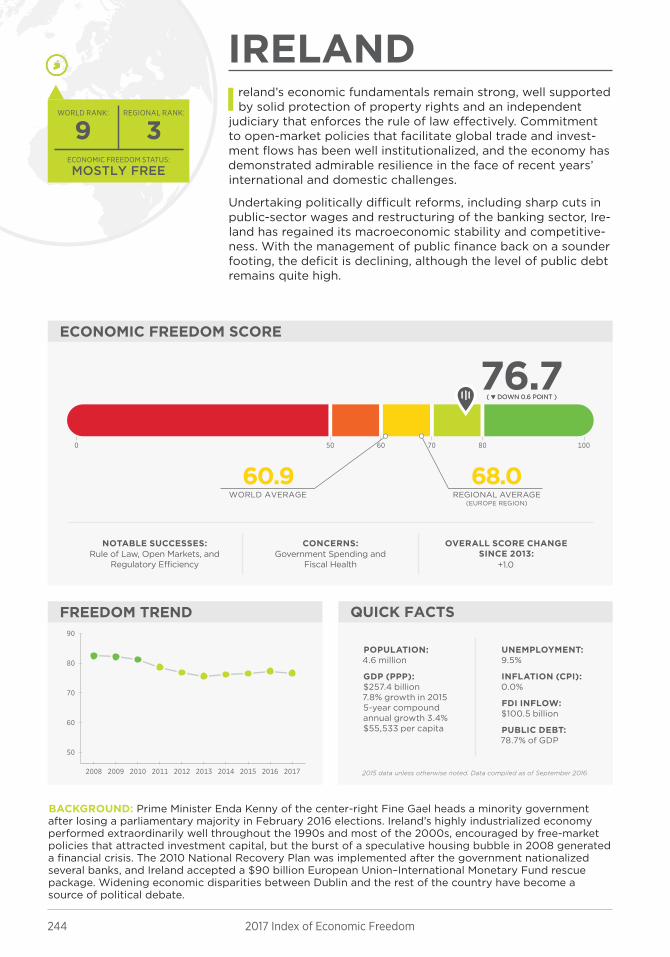
244 2017 Index of Economic Freedom
MOSTLY FREE
39ECONOMIC FREEDOM STATUS:
REGIONAL RANK: WORLD RANK:
ECONOMIC FREEDOM SCORE
FREEDOM TREND QUICK FACTS
80706050 1000
2008 2009 2010 2011 2012 2013 2014 2015 2016 2017
50
60
70
80
90
REGIONAL AVERAGE(EUROPE REGION)
WORLD AVERAGE
60.9 68.0
76.7( ▼ DOWN 0.6 POINT )( ▼ DOWN 0.6 POINT )
2015 data unless otherwise noted. Data compiled as of September 2016
IRELAND
BACKGROUND: Prime Minister Enda Kenny of the center-right Fine Gael heads a minority government after losing a parliamentary majority in February 2016 elections. Ireland’s highly industrialized economy performed extraordinarily well throughout the 1990s and most of the 2000s, encouraged by free-market policies that attracted investment capital, but the burst of a speculative housing bubble in 2008 generated a financial crisis. The 2010 National Recovery Plan was implemented after the government nationalized several banks, and Ireland accepted a $90 billion European Union–International Monetary Fund rescue package. Widening economic disparities between Dublin and the rest of the country have become a source of political debate.
I reland’s economic fundamentals remain strong, well supported by solid protection of property rights and an independent
judiciary that enforces the rule of law effectively. Commitment to open-market policies that facilitate global trade and invest-ment flows has been well institutionalized, and the economy has demonstrated admirable resilience in the face of recent years’ international and domestic challenges.
Undertaking politically difficult reforms, including sharp cuts in public-sector wages and restructuring of the banking sector, Ire-land has regained its macroeconomic stability and competitive-ness. With the management of public finance back on a sounder footing, the deficit is declining, although the level of public debt remains quite high.
NOTABLE SUCCESSES:Rule of Law, Open Markets, and
Regulatory Efficiency
CONCERNS:Government Spending and
Fiscal Health
OVERALL SCORE CHANGE SINCE 2013:
+1.0
POPULATION: 4.6 million
GDP (PPP): $257.4 billion7.8% growth in 20155-year compound annual growth 3.4%$55,533 per capita
UNEMPLOYMENT: 9.5%
INFLATION (CPI): 0.0%
FDI INFLOW: $100.5 billion
PUBLIC DEBT: 78.7% of GDP

245The Heritage Foundation | heritage.org/Index
WORLD AVERAGEKEY:
RULE OF LAW GOVERNMENT SIZERank
REGULATORY EFFICIENCY OPEN MARKETSRank
Property Rights
Judicial E�ectiveness
Government Integrity
TaxBurden
Government Spending
FiscalHealth
Business Freedom
Labor Freedom
Monetary Freedom
Trade Freedom
Investment Freedom
Financial Freedom
80
60
70
100
50
0
80
60
70
100
50
0
80
60
70
100
50
0
80
60
70
100
50
0
17th2nd20th5th31st28th
124th122nd131st12th15th15th
70.090.087.087.673.680.3
60.357.172.778.378.385.8
Property rights are well protected, and secured interests in property are recognized and enforced. Contracts are secure, and expropriation is rare. Ireland’s legal system is based on common law, and the judiciary is independent. Allegations of outright public corruption are investigated and prosecuted, but cronyism remains a recurring problem that affects all levels of Irish politics.
The top personal income tax rate is 41 percent, and the top corporate tax rate is 12.5 percent. Other taxes include a value-added tax and a capital gains tax. The overall tax burden equals 29.9 percent of total domes-tic income. Government spending has amounted to 37.8 percent of total output (GDP) over the past three years, and budget deficits have averaged 3.7 percent of GDP. Public debt is equivalent to 78.7 percent of GDP.
The streamlined regulatory process is very con-ducive to dynamic investment and supports business decisions that enhance productivity. The nonsalary cost of employing a worker is low, and the severance payment system is not overly burdensome. In Novem-ber 2015, the government rejected calls to impose rent controls but did act to restrict landlords to rent increases every two years instead of annually.
Trade is extremely important to Ireland’s econ-omy; the value of exports and imports taken together equals 222 percent of GDP. The average applied tariff rate is 1.5 percent, and there are relatively few barriers to international trade and investment. Recapitalization and restructuring have taken place to restore bank-ing-sector stability. The state still retains its ownership in banks, but there has been some divestment.
12 ECONOMIC FREEDOMS | IRELAND
IRE
LA
ND

246 2017 Index of Economic Freedom
MODERATELY FREE
3479ECONOMIC FREEDOM STATUS:
REGIONAL RANK: WORLD RANK:
ECONOMIC FREEDOM SCORE
FREEDOM TREND QUICK FACTS
80706050 1000
2008 2009 2010 2011 2012 2013 2014 2015 2016 2017
40
50
60
70
80
REGIONAL AVERAGE(EUROPE REGION)
WORLD AVERAGE
60.9 68.0
62.5( ▲ UP 1.3 POINTS )( ▲ UP 1.3 POINTS )
2015 data unless otherwise noted. Data compiled as of September 2016
ITALY
BACKGROUND: Matteo Renzi became Italy’s youngest prime minister in February 2014, leading a coali-tion government of the center-left Democratic, New Centre-Right, Union of the Centre, and Civic Choice parties. Renzi tried to reform entitlements, taxes, and labor laws. He promised to resign if voters rejected a December 2016 referendum on constitutional reforms. They did, and he was replaced by Paolo Gentiloni. The populist 5 Star Movement won 19 of 20 cities and elected Rome’s first woman mayor in June 2016 municipal elections. Italy has struggled with increased pressure from large numbers of Muslim migrants crossing the Mediterranean and Adriatic Seas.
I taly’s economy has been mired in a protracted slowdown since 2011. Despite repeated attempts at reform, economic com-
petitiveness has flagged. Much-needed structural reforms have not been implemented effectively, and the economy remains burdened by political interference, corruption, and the poor management of public finance. Due to the complexity of the regulatory framework and the high cost of conducting business, considerable economic activity remains in the informal sector.
Sharp increases in the debt burden and instability in the financial sector, aggravated by structural weaknesses, are undermining Italy’s long-term development prospects. With public debt over 130 percent of GDP and growing, policy options are increas-ingly constrained.
NOTABLE SUCCESSES:Trade Freedom and Monetary Stability
CONCERNS:Government Spending,
Judicial Effectiveness, and Government Integrity
OVERALL SCORE CHANGE SINCE 2013:
+1.9
POPULATION: 60.2 million
GDP (PPP): $2.2 trillion0.8% growth in 20155-year compound annual growth –0.7%$35,708 per capita
UNEMPLOYMENT: 12.1%
INFLATION (CPI): 0.1%
FDI INFLOW: $20.3 billion
PUBLIC DEBT: 132.6% of GDP
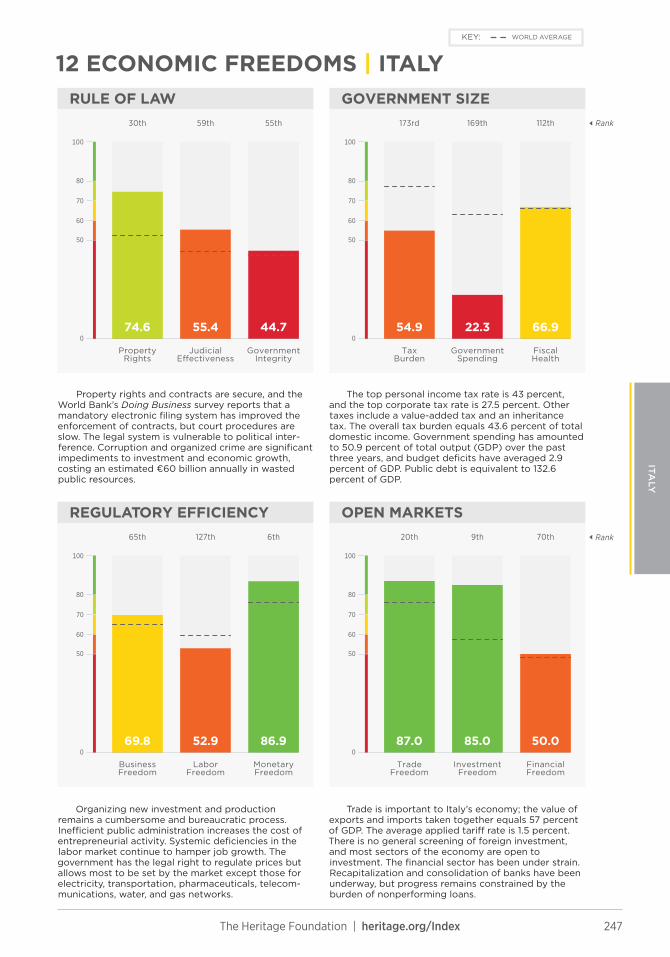
247The Heritage Foundation | heritage.org/Index
WORLD AVERAGEKEY:
RULE OF LAW GOVERNMENT SIZERank
REGULATORY EFFICIENCY OPEN MARKETSRank
Property Rights
Judicial E�ectiveness
Government Integrity
TaxBurden
Government Spending
FiscalHealth
Business Freedom
Labor Freedom
Monetary Freedom
Trade Freedom
Investment Freedom
Financial Freedom
80
60
70
100
50
0
80
60
70
100
50
0
80
60
70
100
50
0
80
60
70
100
50
0
70th9th20th6th127th65th
112th169th173rd55th59th30th
50.085.087.086.952.969.8
66.922.354.944.755.474.6
Property rights and contracts are secure, and the World Bank’s Doing Business survey reports that a mandatory electronic filing system has improved the enforcement of contracts, but court procedures are slow. The legal system is vulnerable to political inter-ference. Corruption and organized crime are significant impediments to investment and economic growth, costing an estimated €60 billion annually in wasted public resources.
The top personal income tax rate is 43 percent, and the top corporate tax rate is 27.5 percent. Other taxes include a value-added tax and an inheritance tax. The overall tax burden equals 43.6 percent of total domestic income. Government spending has amounted to 50.9 percent of total output (GDP) over the past three years, and budget deficits have averaged 2.9 percent of GDP. Public debt is equivalent to 132.6 percent of GDP.
Organizing new investment and production remains a cumbersome and bureaucratic process. Inefficient public administration increases the cost of entrepreneurial activity. Systemic deficiencies in the labor market continue to hamper job growth. The government has the legal right to regulate prices but allows most to be set by the market except those for electricity, transportation, pharmaceuticals, telecom-munications, water, and gas networks.
Trade is important to Italy’s economy; the value of exports and imports taken together equals 57 percent of GDP. The average applied tariff rate is 1.5 percent. There is no general screening of foreign investment, and most sectors of the economy are open to investment. The financial sector has been under strain. Recapitalization and consolidation of banks have been underway, but progress remains constrained by the burden of nonperforming loans.
12 ECONOMIC FREEDOMS | ITALY
ITALY
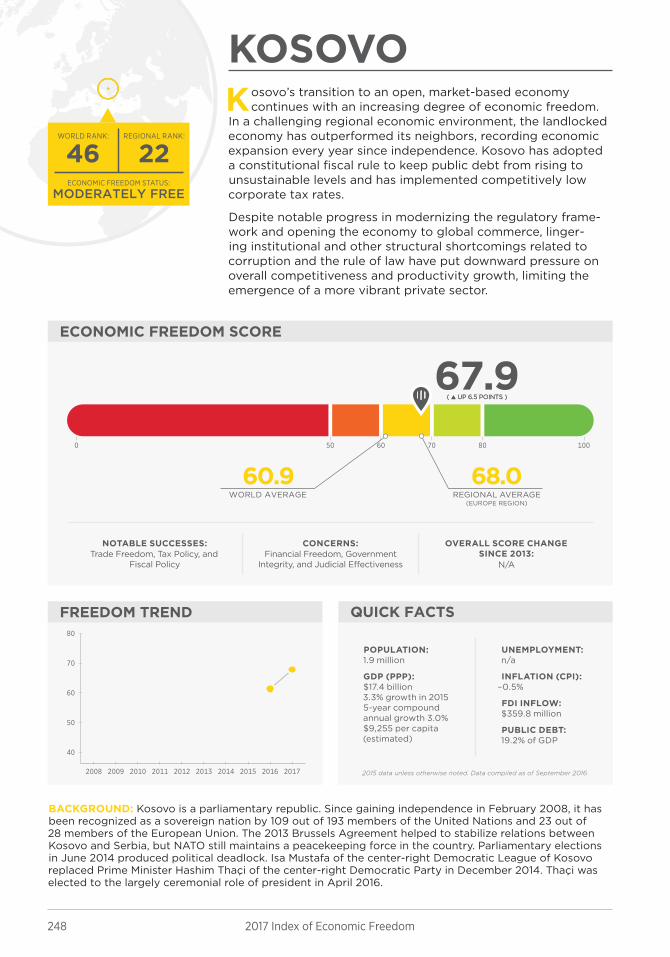
248 2017 Index of Economic Freedom
MODERATELY FREE
2246ECONOMIC FREEDOM STATUS:
REGIONAL RANK: WORLD RANK:
ECONOMIC FREEDOM SCORE
FREEDOM TREND QUICK FACTS
80706050 1000
2008 2009 2010 2011 2012 2013 2014 2015 2016 2017
40
50
60
70
80
REGIONAL AVERAGE(EUROPE REGION)
WORLD AVERAGE
60.9 68.0
67.9( ▲ UP 6.5 POINTS )( ▲ UP 6.5 POINTS )
2015 data unless otherwise noted. Data compiled as of September 2016
KOSOVO
BACKGROUND: Kosovo is a parliamentary republic. Since gaining independence in February 2008, it has been recognized as a sovereign nation by 109 out of 193 members of the United Nations and 23 out of 28 members of the European Union. The 2013 Brussels Agreement helped to stabilize relations between Kosovo and Serbia, but NATO still maintains a peacekeeping force in the country. Parliamentary elections in June 2014 produced political deadlock. Isa Mustafa of the center-right Democratic League of Kosovo replaced Prime Minister Hashim Thaçi of the center-right Democratic Party in December 2014. Thaçi was elected to the largely ceremonial role of president in April 2016.
Kosovo’s transition to an open, market-based economy continues with an increasing degree of economic freedom.
In a challenging regional economic environment, the landlocked economy has outperformed its neighbors, recording economic expansion every year since independence. Kosovo has adopted a constitutional fiscal rule to keep public debt from rising to unsustainable levels and has implemented competitively low corporate tax rates.
Despite notable progress in modernizing the regulatory frame-work and opening the economy to global commerce, linger-ing institutional and other structural shortcomings related to corruption and the rule of law have put downward pressure on overall competitiveness and productivity growth, limiting the emergence of a more vibrant private sector.
NOTABLE SUCCESSES:Trade Freedom, Tax Policy, and
Fiscal Policy
CONCERNS:Financial Freedom, Government
Integrity, and Judicial Effectiveness
OVERALL SCORE CHANGE SINCE 2013:
N/A
POPULATION: 1.9 million
GDP (PPP): $17.4 billion3.3% growth in 20155-year compound annual growth 3.0%$9,255 per capita (estimated)
UNEMPLOYMENT: n/a
INFLATION (CPI): –0.5%
FDI INFLOW: $359.8 million
PUBLIC DEBT: 19.2% of GDP

249The Heritage Foundation | heritage.org/Index
WORLD AVERAGEKEY:
RULE OF LAW GOVERNMENT SIZERank
REGULATORY EFFICIENCY OPEN MARKETSRank
Property Rights
Judicial E�ectiveness
Government Integrity
TaxBurden
Government Spending
FiscalHealth
Business Freedom
Labor Freedom
Monetary Freedom
Trade Freedom
Investment Freedom
Financial Freedom
80
60
70
100
50
0
80
60
70
100
50
0
80
60
70
100
50
0
80
60
70
100
50
0
133rd73rd125th76th66th69th
60th55th14th51st49th36th
30.065.070.880.065.368.8
88.977.893.545.958.070.3
There are numerous property disputes between Kosovar Albanians and the Serb minority. The constitu-tion provides for an independent judiciary, but courts do not always provide due process in practice. Accord-ing to the European Commission, the administration of justice is slow, and there is insufficient accountability for judicial officials, who are prone to political interfer-ence. Corruption remains a problem.
The top personal income tax and corporate tax rates are 10 percent. Other taxes include a value-added tax and a property tax. The overall tax burden equals 21.1 percent of total domestic income. Government spending has amounted to 27.2 percent of total output (GDP) over the past three years, and budget deficits have averaged 2.5 percent of GDP. Public debt is equivalent to 19.2 percent of GDP.
Regulatory efficiency has improved. Launching a business no longer requires minimum capital, and licensing requirements, although they still take over 100 days on average, have become less costly. The formal labor market is not fully developed, and informal labor activity remains substantial. Agricultural and energy-related subsidies from the government and international donors are massive, amounting to more than one-third of GDP.
Trade is important to Kosovo’s economy; the value of exports and imports taken together equals 69 percent of GDP. The average applied tariff rate is 7.1 percent. In general, foreign and domestic inves-tors are treated equally under the law. State-owned enterprises distort the economy. The financial system continues to evolve. The banking sector, dominated by foreign banks, remains stable. Capital markets are underdeveloped.
12 ECONOMIC FREEDOMS | KOSOVO
KO
SO
VO
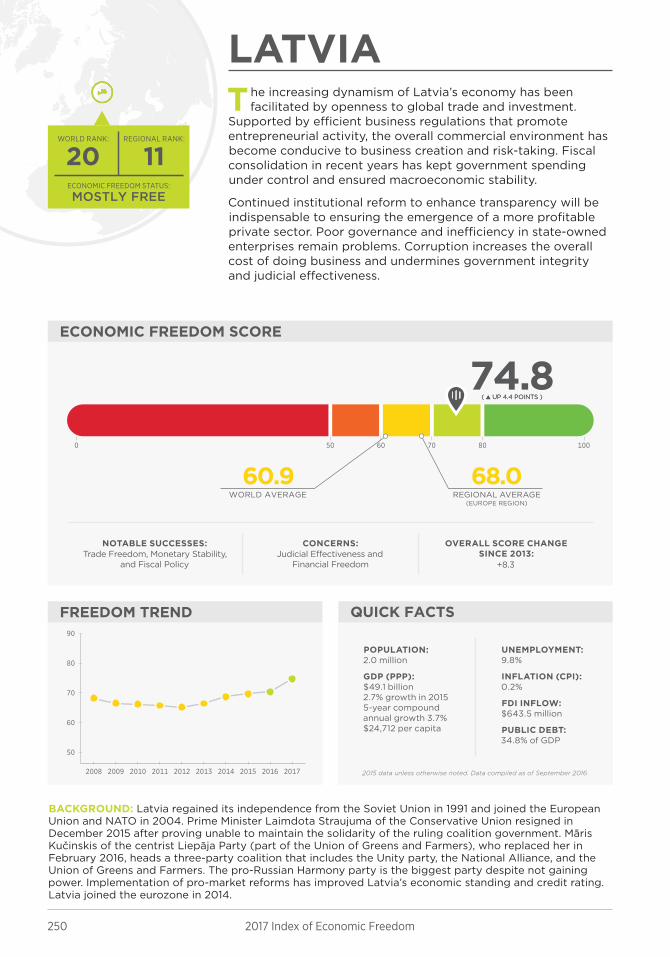
250 2017 Index of Economic Freedom
MOSTLY FREE
1120ECONOMIC FREEDOM STATUS:
REGIONAL RANK: WORLD RANK:
ECONOMIC FREEDOM SCORE
FREEDOM TREND QUICK FACTS
80706050 1000
2008 2009 2010 2011 2012 2013 2014 2015 2016 2017
50
60
70
80
90
REGIONAL AVERAGE(EUROPE REGION)
WORLD AVERAGE
60.9 68.0
74.8( ▲ UP 4.4 POINTS )( ▲ UP 4.4 POINTS )
2015 data unless otherwise noted. Data compiled as of September 2016
LATVIA
BACKGROUND: Latvia regained its independence from the Soviet Union in 1991 and joined the European Union and NATO in 2004. Prime Minister Laimdota Straujuma of the Conservative Union resigned in December 2015 after proving unable to maintain the solidarity of the ruling coalition government. Māris Kučinskis of the centrist Liepāja Party (part of the Union of Greens and Farmers), who replaced her in February 2016, heads a three-party coalition that includes the Unity party, the National Alliance, and the Union of Greens and Farmers. The pro-Russian Harmony party is the biggest party despite not gaining power. Implementation of pro-market reforms has improved Latvia’s economic standing and credit rating. Latvia joined the eurozone in 2014.
The increasing dynamism of Latvia’s economy has been facilitated by openness to global trade and investment.
Supported by efficient business regulations that promote entrepreneurial activity, the overall commercial environment has become conducive to business creation and risk-taking. Fiscal consolidation in recent years has kept government spending under control and ensured macroeconomic stability.
Continued institutional reform to enhance transparency will be indispensable to ensuring the emergence of a more profitable private sector. Poor governance and inefficiency in state-owned enterprises remain problems. Corruption increases the overall cost of doing business and undermines government integrity and judicial effectiveness.
NOTABLE SUCCESSES:Trade Freedom, Monetary Stability,
and Fiscal Policy
CONCERNS:Judicial Effectiveness and
Financial Freedom
OVERALL SCORE CHANGE SINCE 2013:
+8.3
POPULATION: 2.0 million
GDP (PPP): $49.1 billion2.7% growth in 20155-year compound annual growth 3.7%$24,712 per capita
UNEMPLOYMENT: 9.8%
INFLATION (CPI): 0.2%
FDI INFLOW: $643.5 million
PUBLIC DEBT: 34.8% of GDP

251The Heritage Foundation | heritage.org/Index
WORLD AVERAGEKEY:
RULE OF LAW GOVERNMENT SIZERank
REGULATORY EFFICIENCY OPEN MARKETSRank
Property Rights
Judicial E�ectiveness
Government Integrity
TaxBurden
Government Spending
FiscalHealth
Business Freedom
Labor Freedom
Monetary Freedom
Trade Freedom
Investment Freedom
Financial Freedom
80
60
70
100
50
0
80
60
70
100
50
0
80
60
70
100
50
0
80
60
70
100
50
0
39th37th20th9th38th31st
37th121st53rd29th46th33rd
60.075.087.086.572.079.8
95.057.484.767.359.772.6
The World Bank’s Doing Business survey reports that Latvia has made contract enforcement and property transfers easier by restructuring its courts and introducing other new procedures. Although judicial independence is generally respected and property rights are protected, the public distrusts the judicial system, which it views as inefficient, politicized, and corrupt. There are significant concerns regarding accountability for corruption.
The individual income tax rate is a flat 23 percent, and the corporate tax rate is a flat 15 percent. Other taxes include a value-added tax and excise taxes. The overall tax burden equals 27.8 percent of total domes-tic income. Government spending has amounted to 37.7 percent of total output (GDP) over the past three years, and budget deficits have averaged 1.3 percent of GDP. Public debt is equivalent to 34.8 percent of GDP.
The overall regulatory framework is relatively efficient. In general, rules regarding the formation and operation of private enterprises are easy and not burdensome. The nonsalary cost of employing a worker is relatively high, and dismissing an employee can be difficult. In 2016, the government told the IMF that it is making progress on governance reforms in state-owned enterprises and plans to liberalize the natural gas market in 2017.
Trade is extremely important to Latvia’s economy; the value of exports and imports taken together equals 119 percent of GDP. The average applied tariff rate is 1.5 percent. Foreign investment in some sectors is restricted, and state-owned enterprises distort the economy. The financial sector is dominated by banks and has undertaken significant regulatory adjustments since early 2009. Capital markets are not fully developed.
12 ECONOMIC FREEDOMS | LATVIA
LA
TV
IA
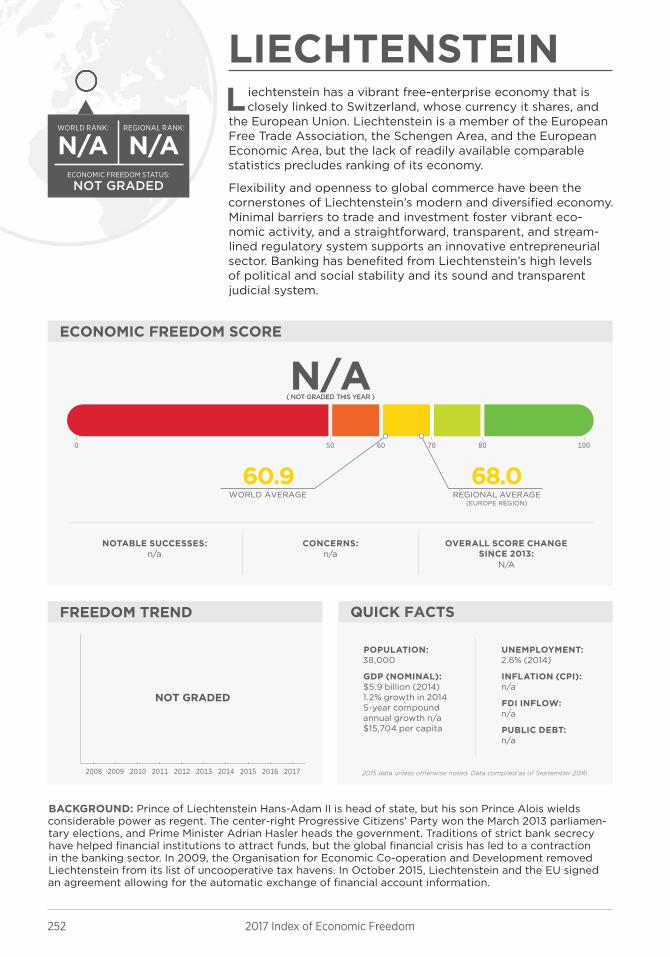
252 2017 Index of Economic Freedom
NOT GRADED
N/AN/AECONOMIC FREEDOM STATUS:
REGIONAL RANK: WORLD RANK:
ECONOMIC FREEDOM SCORE
FREEDOM TREND QUICK FACTS
80706050 1000
NOT GRADED
2008 2009 2010 2011 2012 2013 2014 2015 2016 2017
REGIONAL AVERAGE(EUROPE REGION)
WORLD AVERAGE
60.9 68.0
N/A( NOT GRADED THIS YEAR )( NOT GRADED THIS YEAR )
2015 data unless otherwise noted. Data compiled as of September 2016
LIECHTENSTEIN
BACKGROUND: Prince of Liechtenstein Hans-Adam II is head of state, but his son Prince Alois wields considerable power as regent. The center-right Progressive Citizens’ Party won the March 2013 parliamen-tary elections, and Prime Minister Adrian Hasler heads the government. Traditions of strict bank secrecy have helped financial institutions to attract funds, but the global financial crisis has led to a contraction in the banking sector. In 2009, the Organisation for Economic Co-operation and Development removed Liechtenstein from its list of uncooperative tax havens. In October 2015, Liechtenstein and the EU signed an agreement allowing for the automatic exchange of financial account information.
L iechtenstein has a vibrant free-enterprise economy that is closely linked to Switzerland, whose currency it shares, and
the European Union. Liechtenstein is a member of the European Free Trade Association, the Schengen Area, and the European Economic Area, but the lack of readily available comparable statistics precludes ranking of its economy.
Flexibility and openness to global commerce have been the cornerstones of Liechtenstein’s modern and diversified economy. Minimal barriers to trade and investment foster vibrant eco-nomic activity, and a straightforward, transparent, and stream-lined regulatory system supports an innovative entrepreneurial sector. Banking has benefited from Liechtenstein’s high levels of political and social stability and its sound and transparent judicial system.
NOTABLE SUCCESSES:n/a
CONCERNS:n/a
OVERALL SCORE CHANGE SINCE 2013:
N/A
POPULATION: 38,000
GDP (NOMINAL): $5.9 billion (2014)1.2% growth in 20145-year compound annual growth n/a$15,704 per capita
UNEMPLOYMENT: 2.6% (2014)
INFLATION (CPI): n/a
FDI INFLOW: n/a
PUBLIC DEBT: n/a
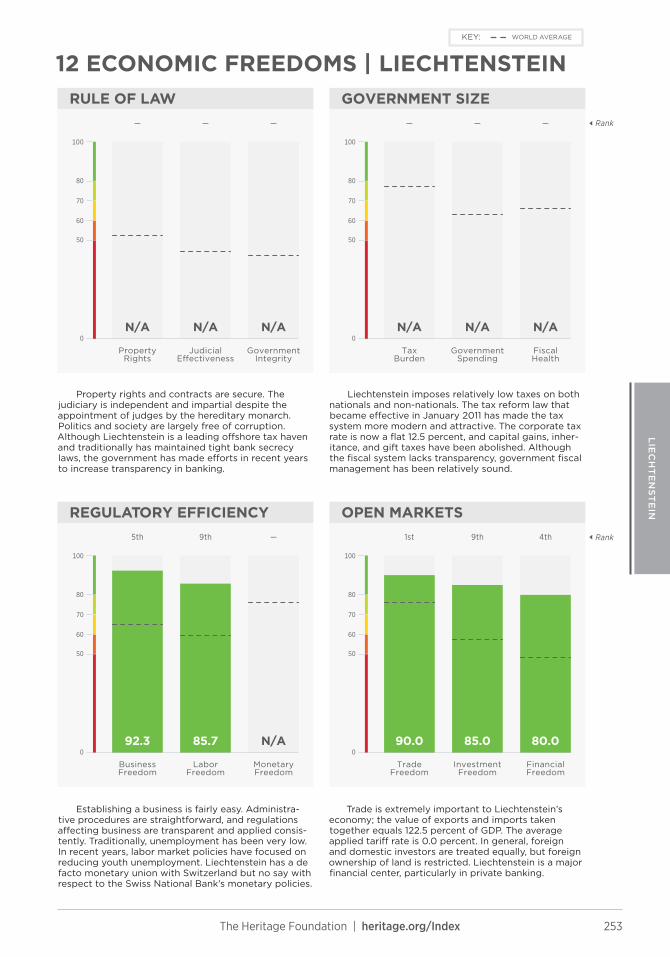
253The Heritage Foundation | heritage.org/Index
WORLD AVERAGEKEY:
RULE OF LAW GOVERNMENT SIZERank
REGULATORY EFFICIENCY OPEN MARKETSRank
Property Rights
Judicial E�ectiveness
Government Integrity
TaxBurden
Government Spending
FiscalHealth
Business Freedom
Labor Freedom
Monetary Freedom
Trade Freedom
Investment Freedom
Financial Freedom
80
60
70
100
50
0
80
60
70
100
50
0
80
60
70
100
50
0
80
60
70
100
50
0
4th9th1st—9th5th
——————
80.085.090.0N/A85.792.3
N/AN/AN/AN/AN/AN/A
Property rights and contracts are secure. The judiciary is independent and impartial despite the appointment of judges by the hereditary monarch. Politics and society are largely free of corruption. Although Liechtenstein is a leading offshore tax haven and traditionally has maintained tight bank secrecy laws, the government has made efforts in recent years to increase transparency in banking.
Liechtenstein imposes relatively low taxes on both nationals and non-nationals. The tax reform law that became effective in January 2011 has made the tax system more modern and attractive. The corporate tax rate is now a flat 12.5 percent, and capital gains, inher-itance, and gift taxes have been abolished. Although the fiscal system lacks transparency, government fiscal management has been relatively sound.
Establishing a business is fairly easy. Administra-tive procedures are straightforward, and regulations affecting business are transparent and applied consis-tently. Traditionally, unemployment has been very low. In recent years, labor market policies have focused on reducing youth unemployment. Liechtenstein has a de facto monetary union with Switzerland but no say with respect to the Swiss National Bank’s monetary policies.
Trade is extremely important to Liechtenstein’s economy; the value of exports and imports taken together equals 122.5 percent of GDP. The average applied tariff rate is 0.0 percent. In general, foreign and domestic investors are treated equally, but foreign ownership of land is restricted. Liechtenstein is a major financial center, particularly in private banking.
12 ECONOMIC FREEDOMS | LIECHTENSTEIN
LIE
CH
TE
NS
TE
IN

254 2017 Index of Economic Freedom
MOSTLY FREE
816ECONOMIC FREEDOM STATUS:
REGIONAL RANK: WORLD RANK:
ECONOMIC FREEDOM SCORE
FREEDOM TREND QUICK FACTS
80706050 1000
2008 2009 2010 2011 2012 2013 2014 2015 2016 2017
50
60
70
80
90
REGIONAL AVERAGE(EUROPE REGION)
WORLD AVERAGE
60.9 68.0
75.8( ▲ UP 0.6 POINT )( ▲ UP 0.6 POINT )
2015 data unless otherwise noted. Data compiled as of September 2016
LITHUANIA
BACKGROUND: Lithuania, largest of the three Baltic States, regained its independence from the Soviet Union in 1991 and joined the European Union and NATO in 2004. Lithuania is a parliamentary republic with some attributes of a presidential system. Under President Dalia Grybauskaitė, reelected in May 2014, the country has worked to improve transparency in parliamentary elections, pass judicial reforms, and increase energy and financial security. Until recently, Lithuania depended heavily on Russia for natural gas. However, in 2016, Norway overtook Russia as Lithuania’s top gas supplier thanks to the recent completion of the largest offshore liquefied natural gas terminal in the region.
Despite global and regional challenges, Lithuania’s economy has demonstrated considerable resilience. Efforts to crack
down on corruption and enhance fiscal soundness by revital-izing the commitment to limited government have borne fruit. Budgetary consolidation has kept government spending under control and has enhanced macroeconomic stability.
A new labor code scheduled to come into force in January 2017 should bring greater flexibility to Lithuania’s labor market. Notable features of the law include new types of contracts, an increase in the legally permitted number of working hours, and reduced statutory notice periods and severance payments in cases of dismissal. Lithuania’s relatively sound legal framework sustains judicial effectiveness and government integrity.
NOTABLE SUCCESSES:Fiscal Policy, Monetary Stability, and
Open Markets
CONCERNS:Judicial Effectiveness, Labor Freedom, and
Government Spending
OVERALL SCORE CHANGE SINCE 2013:
+3.7
POPULATION: 2.9 million
GDP (PPP): $82.4 billion1.6% growth in 20155-year compound annual growth 3.6%$28,359 per capita
UNEMPLOYMENT: 9.5%
INFLATION (CPI): –0.7%
FDI INFLOW: $863.4 million
PUBLIC DEBT: 42.5% of GDP
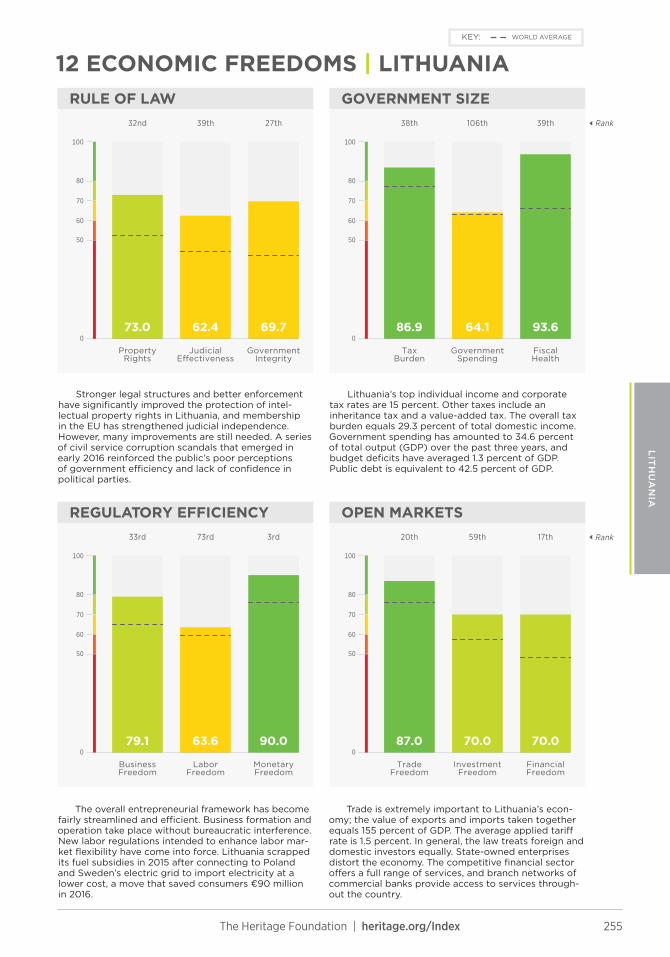
255The Heritage Foundation | heritage.org/Index
WORLD AVERAGEKEY:
RULE OF LAW GOVERNMENT SIZERank
REGULATORY EFFICIENCY OPEN MARKETSRank
Property Rights
Judicial E�ectiveness
Government Integrity
TaxBurden
Government Spending
FiscalHealth
Business Freedom
Labor Freedom
Monetary Freedom
Trade Freedom
Investment Freedom
Financial Freedom
80
60
70
100
50
0
80
60
70
100
50
0
80
60
70
100
50
0
80
60
70
100
50
0
17th59th20th3rd73rd33rd
39th106th38th27th39th32nd
70.070.087.090.063.679.1
93.664.186.969.762.473.0
Stronger legal structures and better enforcement have significantly improved the protection of intel-lectual property rights in Lithuania, and membership in the EU has strengthened judicial independence. However, many improvements are still needed. A series of civil service corruption scandals that emerged in early 2016 reinforced the public’s poor perceptions of government efficiency and lack of confidence in political parties.
Lithuania’s top individual income and corporate tax rates are 15 percent. Other taxes include an inheritance tax and a value-added tax. The overall tax burden equals 29.3 percent of total domestic income. Government spending has amounted to 34.6 percent of total output (GDP) over the past three years, and budget deficits have averaged 1.3 percent of GDP. Public debt is equivalent to 42.5 percent of GDP.
The overall entrepreneurial framework has become fairly streamlined and efficient. Business formation and operation take place without bureaucratic interference. New labor regulations intended to enhance labor mar-ket flexibility have come into force. Lithuania scrapped its fuel subsidies in 2015 after connecting to Poland and Sweden’s electric grid to import electricity at a lower cost, a move that saved consumers €90 million in 2016.
Trade is extremely important to Lithuania’s econ-omy; the value of exports and imports taken together equals 155 percent of GDP. The average applied tariff rate is 1.5 percent. In general, the law treats foreign and domestic investors equally. State-owned enterprises distort the economy. The competitive financial sector offers a full range of services, and branch networks of commercial banks provide access to services through-out the country.
12 ECONOMIC FREEDOMS | LITHUANIA
LIT
HU
AN
IA
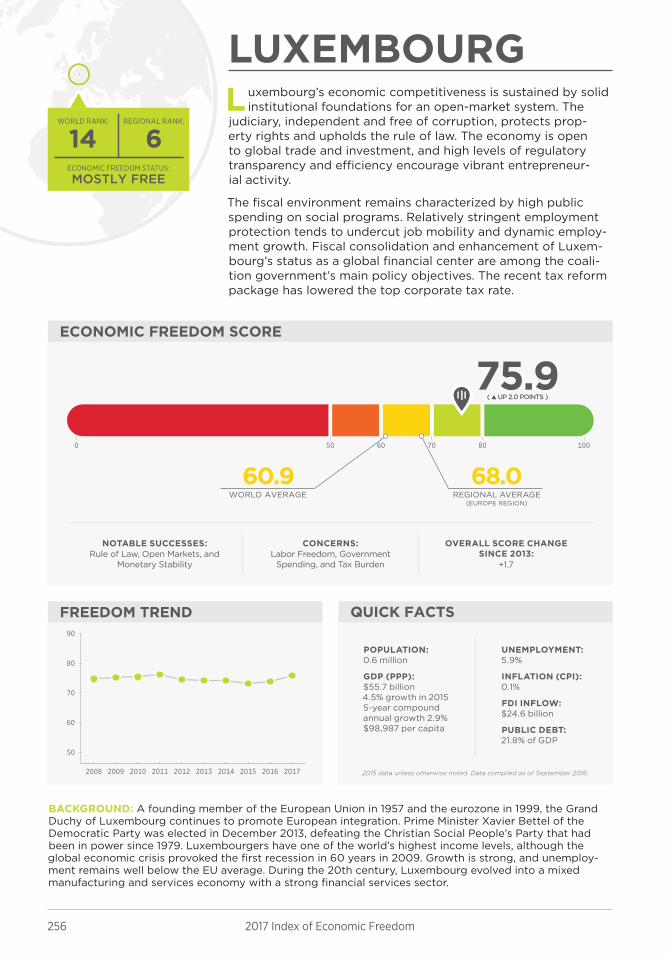
256 2017 Index of Economic Freedom
MOSTLY FREE
614ECONOMIC FREEDOM STATUS:
REGIONAL RANK: WORLD RANK:
ECONOMIC FREEDOM SCORE
FREEDOM TREND QUICK FACTS
80706050 1000
2008 2009 2010 2011 2012 2013 2014 2015 2016 2017
50
60
70
80
90
REGIONAL AVERAGE(EUROPE REGION)
WORLD AVERAGE
60.9 68.0
75.9( ▲ UP 2.0 POINTS )( ▲ UP 2.0 POINTS )
2015 data unless otherwise noted. Data compiled as of September 2016
LUXEMBOURG
BACKGROUND: A founding member of the European Union in 1957 and the eurozone in 1999, the Grand Duchy of Luxembourg continues to promote European integration. Prime Minister Xavier Bettel of the Democratic Party was elected in December 2013, defeating the Christian Social People’s Party that had been in power since 1979. Luxembourgers have one of the world’s highest income levels, although the global economic crisis provoked the first recession in 60 years in 2009. Growth is strong, and unemploy-ment remains well below the EU average. During the 20th century, Luxembourg evolved into a mixed manufacturing and services economy with a strong financial services sector.
Luxembourg’s economic competitiveness is sustained by solid institutional foundations for an open-market system. The
judiciary, independent and free of corruption, protects prop-erty rights and upholds the rule of law. The economy is open to global trade and investment, and high levels of regulatory transparency and efficiency encourage vibrant entrepreneur-ial activity.
The fiscal environment remains characterized by high public spending on social programs. Relatively stringent employment protection tends to undercut job mobility and dynamic employ-ment growth. Fiscal consolidation and enhancement of Luxem-bourg’s status as a global financial center are among the coali-tion government’s main policy objectives. The recent tax reform package has lowered the top corporate tax rate.
NOTABLE SUCCESSES:Rule of Law, Open Markets, and
Monetary Stability
CONCERNS:Labor Freedom, Government
Spending, and Tax Burden
OVERALL SCORE CHANGE SINCE 2013:
+1.7
POPULATION: 0.6 million
GDP (PPP): $55.7 billion4.5% growth in 20155-year compound annual growth 2.9%$98,987 per capita
UNEMPLOYMENT: 5.9%
INFLATION (CPI): 0.1%
FDI INFLOW: $24.6 billion
PUBLIC DEBT: 21.8% of GDP

257The Heritage Foundation | heritage.org/Index
WORLD AVERAGEKEY:
RULE OF LAW GOVERNMENT SIZERank
REGULATORY EFFICIENCY OPEN MARKETSRank
Property Rights
Judicial E�ectiveness
Government Integrity
TaxBurden
Government Spending
FiscalHealth
Business Freedom
Labor Freedom
Monetary Freedom
Trade Freedom
Investment Freedom
Financial Freedom
80
60
70
100
50
0
80
60
70
100
50
0
80
60
70
100
50
0
80
60
70
100
50
0
4th1st20th11th160th71st
13th146th159th12th17th15th
80.095.087.086.243.868.6
99.046.064.578.377.085.8
Private property rights are well protected, contracts are secure, and steps have been taken to implement and enforce the World Trade Organization’s TRIPS (Trade-Related Aspects of Intellectual Property Rights) agreement. The judiciary is independent, and the legal framework strongly supports the rule of law. Luxembourg has laws, regulations, and penal-ties to combat corruption effectively, and they are enforced impartially.
The top individual income tax rate is 42 percent, and the top corporate tax rate has been reduced from 21 percent to 19 percent. Other taxes include a value-added tax. The overall tax burden equals 37.8 percent of total domestic income. Government spending has amounted to 42.4 percent of total output (GDP) over the past three years, and budget surpluses have averaged 1.0 percent of GDP. Public debt is equiv-alent to 21.8 percent of GDP.
The overall freedom to start, operate, and close a business is relatively well protected under the trans-parent regulatory environment. However, labor reg-ulations are costly, unemployment benefits are quite generous, and the minimum wage is high. Monetary stability has been well maintained. Luxembourg has a highly subsidized agricultural sector and the highest rate of fuel subsidies per citizen in Europe.
Trade is extremely important to Luxembourg’s economy; the value of exports and imports taken together equals 391 percent of GDP. The average applied tariff rate is 1.5 percent. In general, foreign and domestic investors are treated equally under the law. The sophisticated banking sector is well capitalized, competitive, and supported by transparent and effec-tive regulations. Many of the world’s leading banks have subsidiaries in Luxembourg.
12 ECONOMIC FREEDOMS | LUXEMBOURG
LU
XE
MB
OU
RG
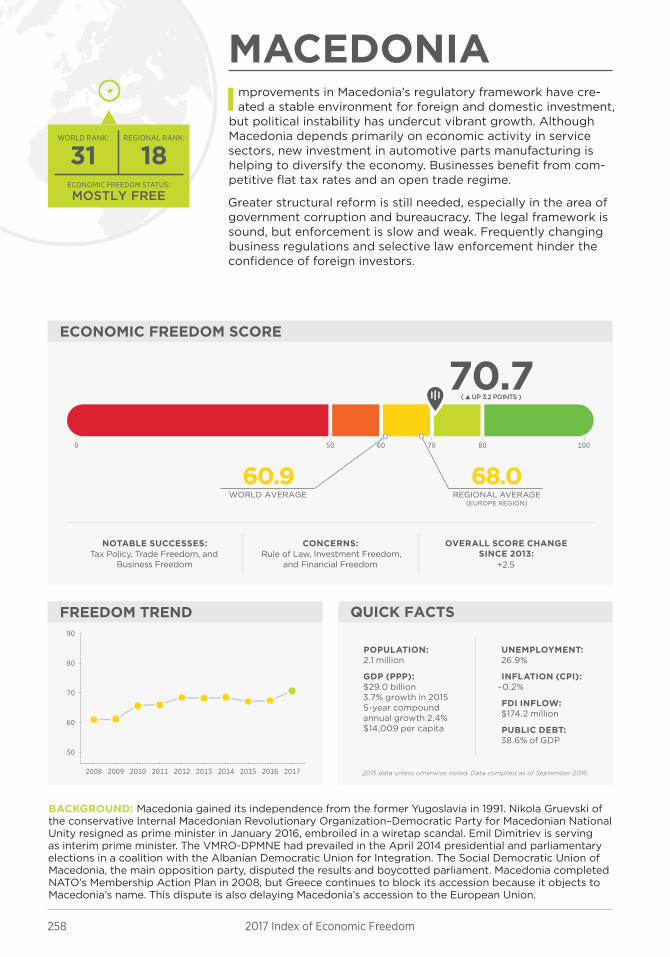
258 2017 Index of Economic Freedom
MOSTLY FREE
1831ECONOMIC FREEDOM STATUS:
REGIONAL RANK: WORLD RANK:
ECONOMIC FREEDOM SCORE
FREEDOM TREND QUICK FACTS
80706050 1000
2008 2009 2010 2011 2012 2013 2014 2015 2016 2017
50
60
70
80
90
REGIONAL AVERAGE(EUROPE REGION)
WORLD AVERAGE
60.9 68.0
70.7( ▲ UP 3.2 POINTS )( ▲ UP 3.2 POINTS )
2015 data unless otherwise noted. Data compiled as of September 2016
MACEDONIA
BACKGROUND: Macedonia gained its independence from the former Yugoslavia in 1991. Nikola Gruevski of the conservative Internal Macedonian Revolutionary Organization–Democratic Party for Macedonian National Unity resigned as prime minister in January 2016, embroiled in a wiretap scandal. Emil Dimitriev is serving as interim prime minister. The VMRO-DPMNE had prevailed in the April 2014 presidential and parliamentary elections in a coalition with the Albanian Democratic Union for Integration. The Social Democratic Union of Macedonia, the main opposition party, disputed the results and boycotted parliament. Macedonia completed NATO’s Membership Action Plan in 2008, but Greece continues to block its accession because it objects to Macedonia’s name. This dispute is also delaying Macedonia’s accession to the European Union.
Improvements in Macedonia’s regulatory framework have cre-ated a stable environment for foreign and domestic investment,
but political instability has undercut vibrant growth. Although Macedonia depends primarily on economic activity in service sectors, new investment in automotive parts manufacturing is helping to diversify the economy. Businesses benefit from com-petitive flat tax rates and an open trade regime.
Greater structural reform is still needed, especially in the area of government corruption and bureaucracy. The legal framework is sound, but enforcement is slow and weak. Frequently changing business regulations and selective law enforcement hinder the confidence of foreign investors.
NOTABLE SUCCESSES:Tax Policy, Trade Freedom, and
Business Freedom
CONCERNS:Rule of Law, Investment Freedom,
and Financial Freedom
OVERALL SCORE CHANGE SINCE 2013:
+2.5
POPULATION: 2.1 million
GDP (PPP): $29.0 billion3.7% growth in 20155-year compound annual growth 2.4%$14,009 per capita
UNEMPLOYMENT: 26.9%
INFLATION (CPI): –0.2%
FDI INFLOW: $174.2 million
PUBLIC DEBT: 38.6% of GDP
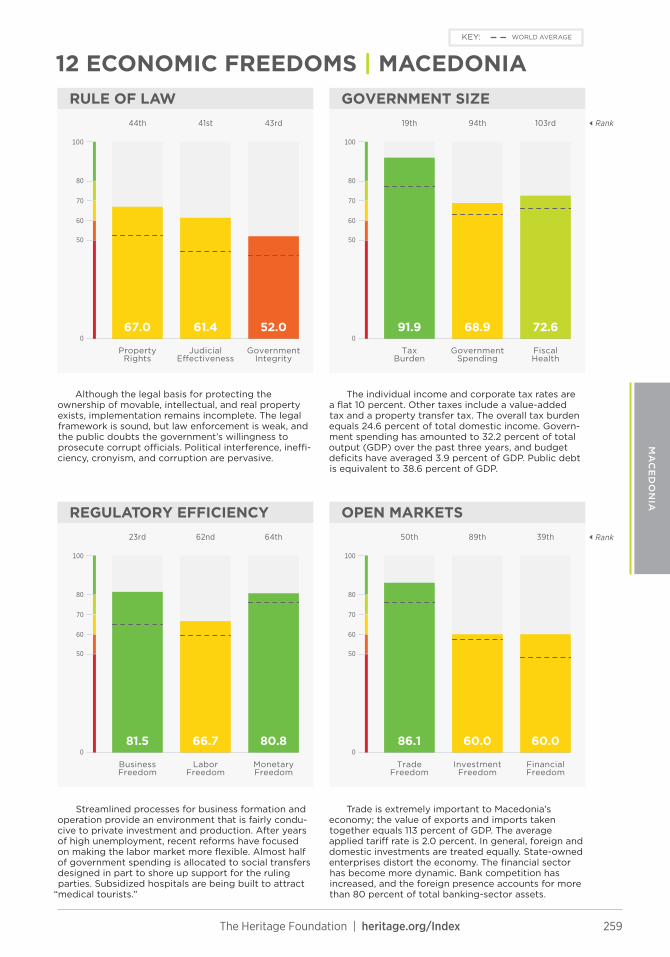
259The Heritage Foundation | heritage.org/Index
WORLD AVERAGEKEY:
RULE OF LAW GOVERNMENT SIZERank
REGULATORY EFFICIENCY OPEN MARKETSRank
Property Rights
Judicial E�ectiveness
Government Integrity
TaxBurden
Government Spending
FiscalHealth
Business Freedom
Labor Freedom
Monetary Freedom
Trade Freedom
Investment Freedom
Financial Freedom
80
60
70
100
50
0
80
60
70
100
50
0
80
60
70
100
50
0
80
60
70
100
50
0
39th89th50th64th62nd23rd
103rd94th19th43rd41st44th
60.060.086.180.866.781.5
72.668.991.952.061.467.0
Although the legal basis for protecting the ownership of movable, intellectual, and real property exists, implementation remains incomplete. The legal framework is sound, but law enforcement is weak, and the public doubts the government’s willingness to prosecute corrupt officials. Political interference, ineffi-ciency, cronyism, and corruption are pervasive.
The individual income and corporate tax rates are a flat 10 percent. Other taxes include a value-added tax and a property transfer tax. The overall tax burden equals 24.6 percent of total domestic income. Govern-ment spending has amounted to 32.2 percent of total output (GDP) over the past three years, and budget deficits have averaged 3.9 percent of GDP. Public debt is equivalent to 38.6 percent of GDP.
Streamlined processes for business formation and operation provide an environment that is fairly condu-cive to private investment and production. After years of high unemployment, recent reforms have focused on making the labor market more flexible. Almost half of government spending is allocated to social transfers designed in part to shore up support for the ruling parties. Subsidized hospitals are being built to attract
“medical tourists.”
Trade is extremely important to Macedonia’s economy; the value of exports and imports taken together equals 113 percent of GDP. The average applied tariff rate is 2.0 percent. In general, foreign and domestic investments are treated equally. State-owned enterprises distort the economy. The financial sector has become more dynamic. Bank competition has increased, and the foreign presence accounts for more than 80 percent of total banking-sector assets.
12 ECONOMIC FREEDOMS | MACEDONIA
MA
CE
DO
NIA
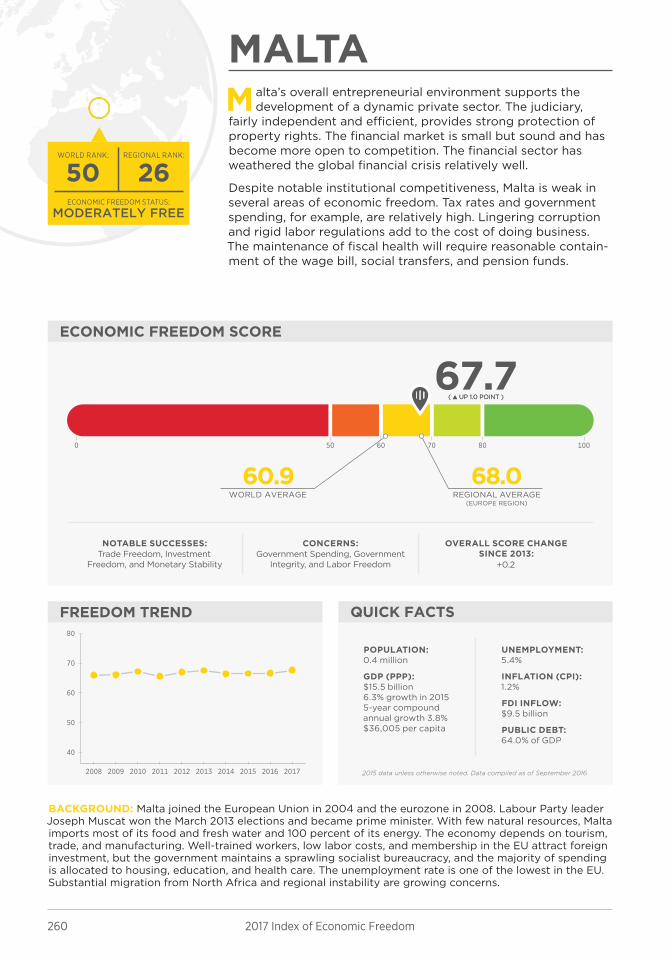
260 2017 Index of Economic Freedom
MODERATELY FREE
2650ECONOMIC FREEDOM STATUS:
REGIONAL RANK: WORLD RANK:
ECONOMIC FREEDOM SCORE
FREEDOM TREND QUICK FACTS
80706050 1000
2008 2009 2010 2011 2012 2013 2014 2015 2016 2017
40
50
60
70
80
REGIONAL AVERAGE(EUROPE REGION)
WORLD AVERAGE
60.9 68.0
67.7( ▲ UP 1.0 POINT )( ▲ UP 1.0 POINT )
2015 data unless otherwise noted. Data compiled as of September 2016
MALTA
BACKGROUND: Malta joined the European Union in 2004 and the eurozone in 2008. Labour Party leader Joseph Muscat won the March 2013 elections and became prime minister. With few natural resources, Malta imports most of its food and fresh water and 100 percent of its energy. The economy depends on tourism, trade, and manufacturing. Well-trained workers, low labor costs, and membership in the EU attract foreign investment, but the government maintains a sprawling socialist bureaucracy, and the majority of spending is allocated to housing, education, and health care. The unemployment rate is one of the lowest in the EU. Substantial migration from North Africa and regional instability are growing concerns.
Malta’s overall entrepreneurial environment supports the development of a dynamic private sector. The judiciary,
fairly independent and efficient, provides strong protection of property rights. The financial market is small but sound and has become more open to competition. The financial sector has weathered the global financial crisis relatively well.
Despite notable institutional competitiveness, Malta is weak in several areas of economic freedom. Tax rates and government spending, for example, are relatively high. Lingering corruption and rigid labor regulations add to the cost of doing business. The maintenance of fiscal health will require reasonable contain-ment of the wage bill, social transfers, and pension funds.
NOTABLE SUCCESSES:Trade Freedom, Investment
Freedom, and Monetary Stability
CONCERNS:Government Spending, Government
Integrity, and Labor Freedom
OVERALL SCORE CHANGE SINCE 2013:
+0.2
POPULATION: 0.4 million
GDP (PPP): $15.5 billion6.3% growth in 20155-year compound annual growth 3.8%$36,005 per capita
UNEMPLOYMENT: 5.4%
INFLATION (CPI): 1.2%
FDI INFLOW: $9.5 billion
PUBLIC DEBT: 64.0% of GDP

261The Heritage Foundation | heritage.org/Index
WORLD AVERAGEKEY:
RULE OF LAW GOVERNMENT SIZERank
REGULATORY EFFICIENCY OPEN MARKETSRank
Property Rights
Judicial E�ectiveness
Government Integrity
TaxBurden
Government Spending
FiscalHealth
Business Freedom
Labor Freedom
Monetary Freedom
Trade Freedom
Investment Freedom
Financial Freedom
80
60
70
100
50
0
80
60
70
100
50
0
80
60
70
100
50
0
80
60
70
100
50
0
39th9th20th39th103rd108th
68th148th161st40th38th41st
60.085.087.083.557.262.5
85.144.962.853.662.967.7
Property rights are protected in Malta, and expropriation is unlikely, but foreigners do not have full rights to buy property. The judiciary is independent both constitutionally and in practice. The police and the Permanent Commission Against Corruption are responsible for combating official corruption and have prosecuted cases, but they do not publish information about such cases.
The top individual income and corporate tax rates are 35 percent. Other taxes include a value-added tax and a capital gains tax. The overall tax burden equals 35.6 percent of total domestic income. Government spending has amounted to 42.8 percent of total output (GDP) over the past three years, and budget deficits have averaged 2.0 percent of GDP. Public debt is equivalent to 64.0 percent of GDP.
Existing regulations are relatively straightforward and applied uniformly most of the time. Transparent and effective policies and regulations have been adopted to foster competition. Labor regulations are relatively rigid, and there is a minimum wage. The government plans to reduce the fiscal deficit from around 2 percent of GDP in 2014 to almost zero by 2018, in part by reducing subsidies such as support for a state-owned airline.
Trade is extremely important to Malta’s economy; the value of exports and imports taken together equals 101 percent of GDP. The average applied tariff rate is 1.5 percent. In general, foreign investment is not screened by the government. Many state-owned enterprises have been privatized. Supervision and regulation of the financial sector have gradually become more transparent and effective. The stock exchange is small but active.
12 ECONOMIC FREEDOMS | MALTA
MA
LTA
262 2017 Index of Economic Freedom
MOSTLY UNFREE
41110ECONOMIC FREEDOM STATUS:
REGIONAL RANK: WORLD RANK:
ECONOMIC FREEDOM SCORE
FREEDOM TREND QUICK FACTS
80706050 1000
2008 2009 2010 2011 2012 2013 2014 2015 2016 2017
30
40
50
60
70
REGIONAL AVERAGE(EUROPE REGION)
WORLD AVERAGE
60.9 68.0
58.0( ▲ UP 0.6 POINT )( ▲ UP 0.6 POINT )
2015 data unless otherwise noted. Data compiled as of September 2016
MOLDOVA
BACKGROUND: Moldova gained independence after the collapse of the Soviet Union in 1991 but faces a secessionist pro-Russian movement in its Transnistria region, currently home to more than 1,100 Russian troops. The country is poor, and excessive economic dependence on Russia threatens its sovereignty. The pro-Russia PSRM party won the most seats in the December 2014 parliamentary election. It was blocked from forming a government, however, by a pro–European integration coalition of the center-right Liberal Democratic Party, the Liberal Party, and the center-left Democratic Party of current Prime Minister Pavel Filip. Association agreements signed with the European Union in June 2014 include Deep and Comprehen-sive Free Trade Area (DCFTA) accords.
Moldova has gradually recovered from a sharp economic slowdown over the past three years, with growth driven
largely by remittance-based consumption and modest credit expansion. Some new momentum has been generated for improving the business environment and further liberalizing the trade regime.
However, the transition to a more stable market-oriented econ-omy remains fragile. The government’s overall commitment to enhancing the entrepreneurial climate and advancing economic freedom has been uneven. Despite several privatizations, the public sector still plays a dominant role in the economy. The foundations of economic freedom are not firmly institutionalized, and the judiciary remains vulnerable to political interference and corruption.
NOTABLE SUCCESSES:Trade Freedom, Tax Policy, and
Fiscal Policy
CONCERNS:Rule of Law, Labor Freedom, and
Financial Freedom
OVERALL SCORE CHANGE SINCE 2013:
+2.5
POPULATION: 3.6 million
GDP (PPP): $17.8 billion
–1.1% growth in 20155-year compound annual growth 3.8%$5,006 per capita
UNEMPLOYMENT: 5.0%
INFLATION (CPI): 9.6%
FDI INFLOW: $228.5 million
PUBLIC DEBT: 42.0% of GDP
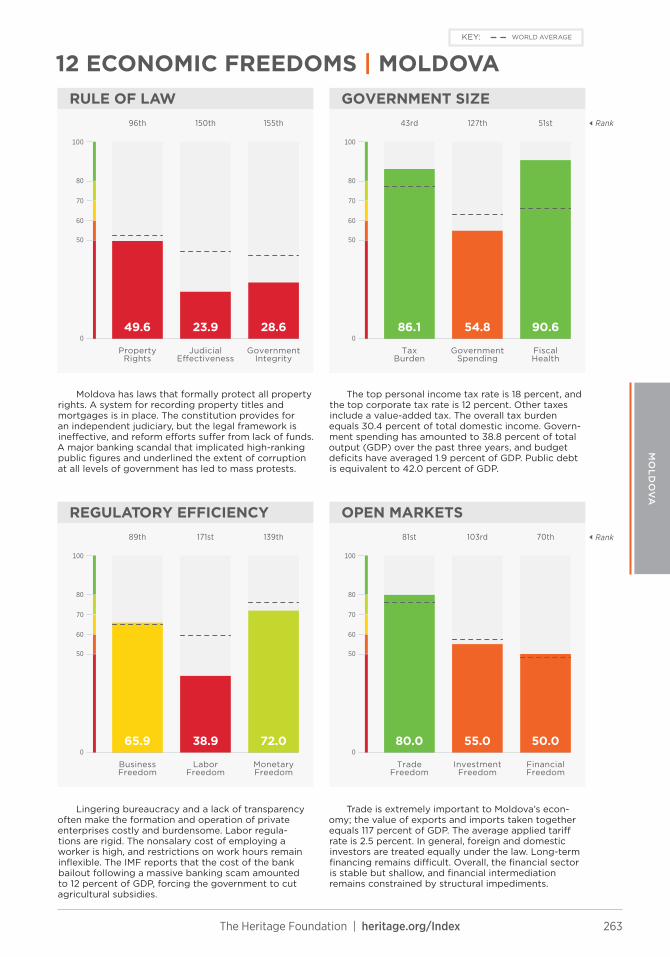
263The Heritage Foundation | heritage.org/Index
WORLD AVERAGEKEY:
RULE OF LAW GOVERNMENT SIZERank
REGULATORY EFFICIENCY OPEN MARKETSRank
Property Rights
Judicial E�ectiveness
Government Integrity
TaxBurden
Government Spending
FiscalHealth
Business Freedom
Labor Freedom
Monetary Freedom
Trade Freedom
Investment Freedom
Financial Freedom
80
60
70
100
50
0
80
60
70
100
50
0
80
60
70
100
50
0
80
60
70
100
50
0
70th103rd81st139th171st89th
51st127th43rd155th150th96th
50.055.080.072.038.965.9
90.654.886.128.623.949.6
Moldova has laws that formally protect all property rights. A system for recording property titles and mortgages is in place. The constitution provides for an independent judiciary, but the legal framework is ineffective, and reform efforts suffer from lack of funds. A major banking scandal that implicated high-ranking public figures and underlined the extent of corruption at all levels of government has led to mass protests.
The top personal income tax rate is 18 percent, and the top corporate tax rate is 12 percent. Other taxes include a value-added tax. The overall tax burden equals 30.4 percent of total domestic income. Govern-ment spending has amounted to 38.8 percent of total output (GDP) over the past three years, and budget deficits have averaged 1.9 percent of GDP. Public debt is equivalent to 42.0 percent of GDP.
Lingering bureaucracy and a lack of transparency often make the formation and operation of private enterprises costly and burdensome. Labor regula-tions are rigid. The nonsalary cost of employing a worker is high, and restrictions on work hours remain inflexible. The IMF reports that the cost of the bank bailout following a massive banking scam amounted to 12 percent of GDP, forcing the government to cut agricultural subsidies.
Trade is extremely important to Moldova’s econ-omy; the value of exports and imports taken together equals 117 percent of GDP. The average applied tariff rate is 2.5 percent. In general, foreign and domestic investors are treated equally under the law. Long-term financing remains difficult. Overall, the financial sector is stable but shallow, and financial intermediation remains constrained by structural impediments.
12 ECONOMIC FREEDOMS | MOLDOVA
MO
LD
OV
A

264 2017 Index of Economic Freedom
MODERATELY FREE
3583ECONOMIC FREEDOM STATUS:
REGIONAL RANK: WORLD RANK:
ECONOMIC FREEDOM SCORE
FREEDOM TREND QUICK FACTS
80706050 1000
2008 2009 2010 2011 2012 2013 2014 2015 2016 2017
40
50
60
70
80
REGIONAL AVERAGE(EUROPE REGION)
WORLD AVERAGE
60.9 68.0
62.0( ▼ DOWN 2.9 POINTS )( ▼ DOWN 2.9 POINTS )
2015 data unless otherwise noted. Data compiled as of September 2016
MONTENEGRO
BACKGROUND: Montenegro declared its independence from Serbia in 2006, introduced significant privat-ization, and adopted the euro despite not being a member of the eurozone. Milo Đukanović has served as president or prime minister for nearly all of the past 25 years. Although his Democratic Party of Socialists won the most seats in the October 2016 parliamentary elections, it failed to secure a majority, and his longtime political ally Duško Marković became prime minister in a coalition government. Đukanović may seek the presidency again in 2018. He has steered Montenegro in a pro-Western direction and has accused Russia of financing opposition parties. Montenegro was formally invited to join NATO in May 2016 and would become the first nation to join since 2009.
Montenegro’s evolution into a modern, dynamic econ-omy has made considerable gains. The trade regime is
increasingly open, and the regulatory and legal frameworks governing investment and production have become more efficient, supporting the development of a growing private sector. Other previous reforms, which included further reduction of the already competitive flat tax rates and implementation of labor market reforms, have also contributed to an upsurge in entrepreneurship.
Despite the great strides made overall, Montenegro’s economic freedom is still curtailed by the lack of institutional commitment to the strong protection of property rights or effective measures against corruption. The court system remains vulnerable to political interference and inefficiency.
NOTABLE SUCCESSES:Trade Freedom and Tax Policy
CONCERNS:Rule of Law, Government Spending,
and Fiscal Health
OVERALL SCORE CHANGE SINCE 2013:
–0.6
POPULATION: 0.6 million
GDP (PPP): $10.0 billion4.1% growth in 20155-year compound annual growth 2.0%$16,123 per capita
UNEMPLOYMENT: 18.2%
INFLATION (CPI): 1.6%
FDI INFLOW: $699.1 million
PUBLIC DEBT: 66.4% of GDP
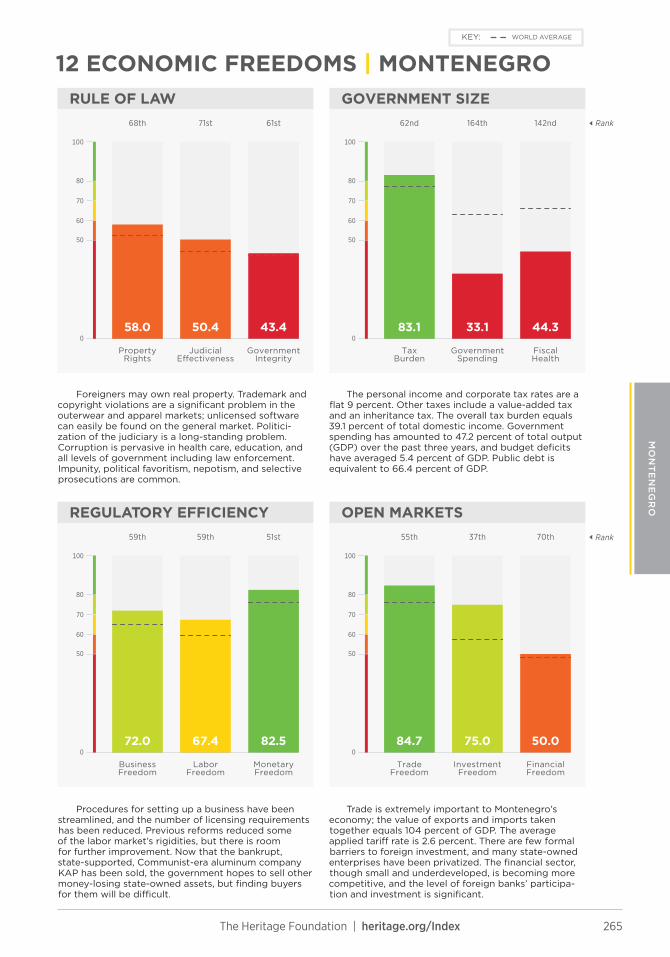
265The Heritage Foundation | heritage.org/Index
WORLD AVERAGEKEY:
RULE OF LAW GOVERNMENT SIZERank
REGULATORY EFFICIENCY OPEN MARKETSRank
Property Rights
Judicial E�ectiveness
Government Integrity
TaxBurden
Government Spending
FiscalHealth
Business Freedom
Labor Freedom
Monetary Freedom
Trade Freedom
Investment Freedom
Financial Freedom
80
60
70
100
50
0
80
60
70
100
50
0
80
60
70
100
50
0
80
60
70
100
50
0
70th37th55th51st59th59th
142nd164th62nd61st71st68th
50.075.084.782.567.472.0
44.333.183.143.450.458.0
Foreigners may own real property. Trademark and copyright violations are a significant problem in the outerwear and apparel markets; unlicensed software can easily be found on the general market. Politici-zation of the judiciary is a long-standing problem. Corruption is pervasive in health care, education, and all levels of government including law enforcement. Impunity, political favoritism, nepotism, and selective prosecutions are common.
The personal income and corporate tax rates are a flat 9 percent. Other taxes include a value-added tax and an inheritance tax. The overall tax burden equals 39.1 percent of total domestic income. Government spending has amounted to 47.2 percent of total output (GDP) over the past three years, and budget deficits have averaged 5.4 percent of GDP. Public debt is equivalent to 66.4 percent of GDP.
Procedures for setting up a business have been streamlined, and the number of licensing requirements has been reduced. Previous reforms reduced some of the labor market’s rigidities, but there is room for further improvement. Now that the bankrupt, state-supported, Communist-era aluminum company KAP has been sold, the government hopes to sell other money-losing state-owned assets, but finding buyers for them will be difficult.
Trade is extremely important to Montenegro’s economy; the value of exports and imports taken together equals 104 percent of GDP. The average applied tariff rate is 2.6 percent. There are few formal barriers to foreign investment, and many state-owned enterprises have been privatized. The financial sector, though small and underdeveloped, is becoming more competitive, and the level of foreign banks’ participa-tion and investment is significant.
12 ECONOMIC FREEDOMS | MONTENEGRO
MO
NT
EN
EG
RO
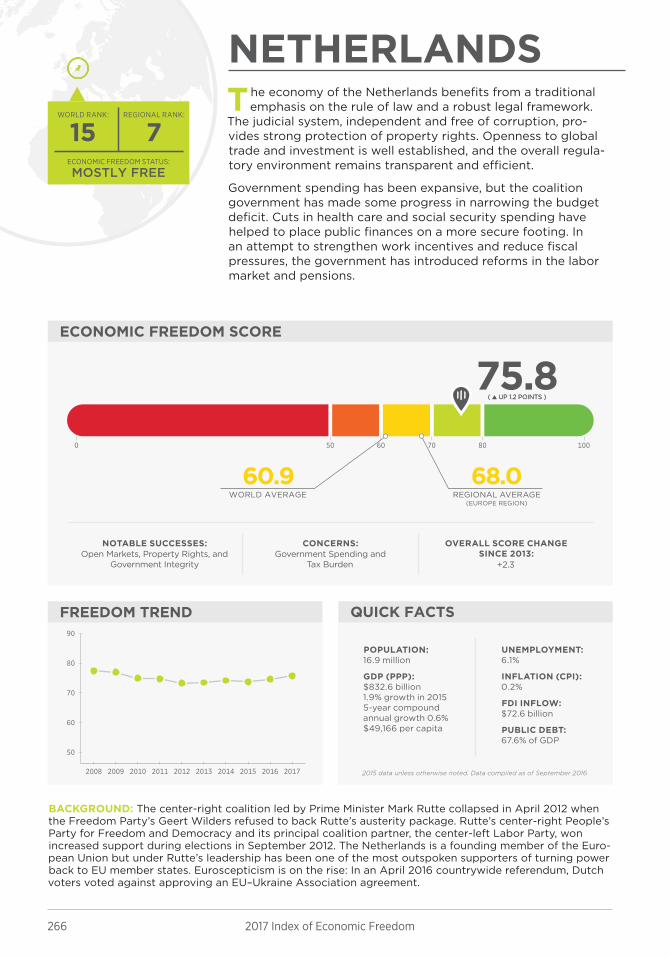
266 2017 Index of Economic Freedom
ECONOMIC FREEDOM SCORE
FREEDOM TREND QUICK FACTS
80706050 1000
2008 2009 2010 2011 2012 2013 2014 2015 2016 2017
50
60
70
80
90
REGIONAL AVERAGE(EUROPE REGION)
WORLD AVERAGE
60.9 68.0
75.8( ▲ UP 1.2 POINTS )( ▲ UP 1.2 POINTS )
MOSTLY FREE
715ECONOMIC FREEDOM STATUS:
REGIONAL RANK: WORLD RANK:
2015 data unless otherwise noted. Data compiled as of September 2016
NETHERLANDS
BACKGROUND: The center-right coalition led by Prime Minister Mark Rutte collapsed in April 2012 when the Freedom Party’s Geert Wilders refused to back Rutte’s austerity package. Rutte’s center-right People’s Party for Freedom and Democracy and its principal coalition partner, the center-left Labor Party, won increased support during elections in September 2012. The Netherlands is a founding member of the Euro-pean Union but under Rutte’s leadership has been one of the most outspoken supporters of turning power back to EU member states. Euroscepticism is on the rise: In an April 2016 countrywide referendum, Dutch voters voted against approving an EU–Ukraine Association agreement.
The economy of the Netherlands benefits from a traditional emphasis on the rule of law and a robust legal framework.
The judicial system, independent and free of corruption, pro-vides strong protection of property rights. Openness to global trade and investment is well established, and the overall regula-tory environment remains transparent and efficient.
Government spending has been expansive, but the coalition government has made some progress in narrowing the budget deficit. Cuts in health care and social security spending have helped to place public finances on a more secure footing. In an attempt to strengthen work incentives and reduce fiscal pressures, the government has introduced reforms in the labor market and pensions.
NOTABLE SUCCESSES:Open Markets, Property Rights, and
Government Integrity
CONCERNS:Government Spending and
Tax Burden
OVERALL SCORE CHANGE SINCE 2013:
+2.3
POPULATION: 16.9 million
GDP (PPP): $832.6 billion1.9% growth in 20155-year compound annual growth 0.6%$49,166 per capita
UNEMPLOYMENT: 6.1%
INFLATION (CPI): 0.2%
FDI INFLOW: $72.6 billion
PUBLIC DEBT: 67.6% of GDP

267The Heritage Foundation | heritage.org/Index
WORLD AVERAGEKEY:
RULE OF LAW GOVERNMENT SIZERank
REGULATORY EFFICIENCY OPEN MARKETSRank
Property Rights
Judicial E�ectiveness
Government Integrity
TaxBurden
Government Spending
FiscalHealth
Business Freedom
Labor Freedom
Monetary Freedom
Trade Freedom
Investment Freedom
Financial Freedom
80
60
70
100
50
0
80
60
70
100
50
0
80
60
70
100
50
0
80
60
70
100
50
0
4th2nd20th15th43rd30th
75th159th174th7th23rd9th
80.090.087.085.870.580.2
83.037.053.285.769.987.4
The legal framework ensures strong protection of private property rights and enforcement of contracts. Independent of political interference, the judiciary is respected and provides fair adjudication of disputes. There are few problems with political corruption. Effective anticorruption measures and minimal toler-ance for corruption ensure government integrity. The Netherlands is a signatory to all major international anticorruption conventions.
The top personal income tax rate is 52 percent, and the top corporate tax rate is 25 percent. Other taxes include a value-added tax and environmental taxes. The overall tax burden equals 36.7 percent of total domestic income. Government spending has amounted to 45.8 percent of total output (GDP) over the past three years, and budget deficits have averaged 2.2 percent of GDP. Public debt is equivalent to 67.6 percent of GDP.
The overall regulatory framework is transparent and competitive. The efficient business framework is conducive to innovation and productivity growth. Monetary stability has been well maintained. Labor regulations are relatively rigid. The nonsalary cost of employing a worker is high, and dismissing an employee is relatively costly. Price controls are in place only for pharmaceuticals.
Trade is extremely important to the economy of the Netherlands; the value of exports and imports taken together equals 154 percent of GDP. The average applied tariff rate is 1.5 percent. There is no general screening of foreign investment, and investment in most sectors of the economy is not restricted. Sensible banking regulations facilitate dynamic entrepreneurial activity, and lending practices are prudent.
12 ECONOMIC FREEDOMS | NETHERLANDS
NE
TH
ER
LA
ND
S

268 2017 Index of Economic Freedom
ECONOMIC FREEDOM SCORE
FREEDOM TREND QUICK FACTS
80706050 1000
2008 2009 2010 2011 2012 2013 2014 2015 2016 2017
50
60
70
80
90
REGIONAL AVERAGE(EUROPE REGION)
WORLD AVERAGE
60.9 68.0
74.0( ▲ UP 3.2 POINTS )( ▲ UP 3.2 POINTS )
MOSTLY FREE
1425ECONOMIC FREEDOM STATUS:
REGIONAL RANK: WORLD RANK:
2015 data unless otherwise noted. Data compiled as of September 2016
NORWAY
BACKGROUND: Norway has been a member of NATO since 1949. Voters have twice rejected membership in the European Union, but Norway is a party to a European Free Trade Association agreement. Prime Min-ister Erna Solberg of the Conservative Party was elected in September 2013 and leads a center-right coali-tion minority government. Norway is one of the world’s most prosperous countries. It saves a large portion of its petroleum-sector revenues, including dividends from the partially state-owned Statoil and taxes from oil and gas companies operating in Norway. Low oil prices have been a drag on the economy, and Norway made a withdrawal from its Government Pension Fund Global for the first time ever in March 2016.
Norway’s competitive economy benefits from openness to global commerce and a regulatory environment that
encourages entrepreneurial activity. Monetary stability is well maintained, and the independent judicial system provides strong protection of property rights.
The accumulation of assets from hydrocarbon production in the National Wealth Fund has provided a cushion for fiscal stimu-lus. In an effort to attract foreign investment and diversify the oil-dependent economy, a multi-year measure to reduce the top corporate tax rate has lowered the tax rate to 25 percent, with further planned reductions to 24 percent in 2017 and 23 percent in 2018.
NOTABLE SUCCESSES:Rule of Law, Business Freedom, and
Trade Freedom
CONCERNS:Government Spending, Labor
Freedom, and Tax Burden
OVERALL SCORE CHANGE SINCE 2013:
+3.5
POPULATION: 5.2 million
GDP (PPP): $356.2 billion1.6% growth in 20155-year compound annual growth 1.7%$68,430 per capita
UNEMPLOYMENT: 4.2%
INFLATION (CPI): 2.2%
FDI INFLOW: –$4.2 billion
PUBLIC DEBT: 27.9% of GDP
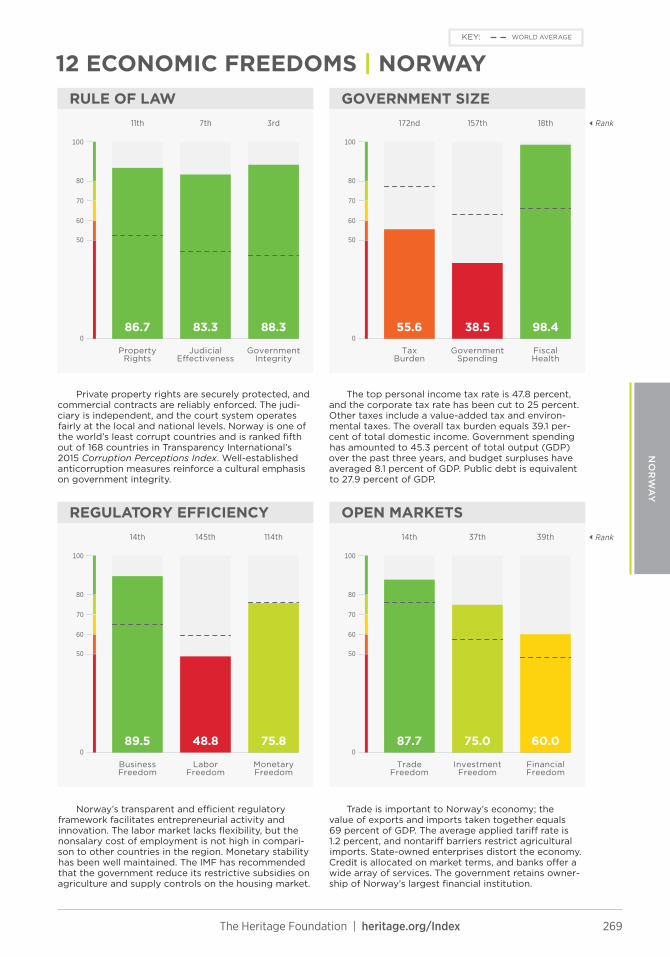
269The Heritage Foundation | heritage.org/Index
WORLD AVERAGEKEY:
RULE OF LAW GOVERNMENT SIZERank
REGULATORY EFFICIENCY OPEN MARKETSRank
Property Rights
Judicial E�ectiveness
Government Integrity
TaxBurden
Government Spending
FiscalHealth
Business Freedom
Labor Freedom
Monetary Freedom
Trade Freedom
Investment Freedom
Financial Freedom
80
60
70
100
50
0
80
60
70
100
50
0
80
60
70
100
50
0
80
60
70
100
50
0
39th37th14th114th145th14th
18th157th172nd3rd7th11th
60.075.087.775.848.889.5
98.438.555.688.383.386.7
Private property rights are securely protected, and commercial contracts are reliably enforced. The judi-ciary is independent, and the court system operates fairly at the local and national levels. Norway is one of the world’s least corrupt countries and is ranked fifth out of 168 countries in Transparency International’s 2015 Corruption Perceptions Index. Well-established anticorruption measures reinforce a cultural emphasis on government integrity.
The top personal income tax rate is 47.8 percent, and the corporate tax rate has been cut to 25 percent. Other taxes include a value-added tax and environ-mental taxes. The overall tax burden equals 39.1 per-cent of total domestic income. Government spending has amounted to 45.3 percent of total output (GDP) over the past three years, and budget surpluses have averaged 8.1 percent of GDP. Public debt is equivalent to 27.9 percent of GDP.
Norway’s transparent and efficient regulatory framework facilitates entrepreneurial activity and innovation. The labor market lacks flexibility, but the nonsalary cost of employment is not high in compari-son to other countries in the region. Monetary stability has been well maintained. The IMF has recommended that the government reduce its restrictive subsidies on agriculture and supply controls on the housing market.
Trade is important to Norway’s economy; the value of exports and imports taken together equals 69 percent of GDP. The average applied tariff rate is 1.2 percent, and nontariff barriers restrict agricultural imports. State-owned enterprises distort the economy. Credit is allocated on market terms, and banks offer a wide array of services. The government retains owner-ship of Norway’s largest financial institution.
12 ECONOMIC FREEDOMS | NORWAY
NO
RW
AY

270 2017 Index of Economic Freedom
ECONOMIC FREEDOM SCORE
FREEDOM TREND QUICK FACTS
80706050 1000
2008 2009 2010 2011 2012 2013 2014 2015 2016 2017
50
60
70
80
90
REGIONAL AVERAGE(EUROPE REGION)
WORLD AVERAGE
60.9 68.0
68.3( ▼ DOWN 1.0 POINT )( ▼ DOWN 1.0 POINT )
MODERATELY FREE
2145ECONOMIC FREEDOM STATUS:
REGIONAL RANK: WORLD RANK:
2015 data unless otherwise noted. Data compiled as of September 2016
POLAND
BACKGROUND: Poland joined NATO in 1999 and the European Union in 2004. The center-right Civic Platform Party was ousted following parliamentary elections in October 2015. The conservative, Euroscep-tic Law and Justice Party headed by Prime Minister Beata Szydlo won a parliamentary majority. Buoyed by its strong institutions, Poland was the only European country to experience economic growth during the 2009 credit crisis. Poland hosted the 2016 NATO Summit in Warsaw, and a rotational battalion of U.S. troops is to be deployed to Poland beginning in 2017. The private sector now accounts for two-thirds of GDP. A geographic split exists between a poor rural eastern region and the industrialized, more prosperous western region.
Poland’s economy has demonstrated a fairly high degree of macroeconomic resilience. Structural reforms that have
included trade liberalization, implementation of a competitively low corporate tax rate, and modernization of the regulatory environment have facilitated the transition to a market-ori-ented economy.
Fiscal consolidation and prudent management of public finance are ongoing concerns. The government needs to further reduce the budget deficit and curb the growth of public debt. In 2016, an additional tax on financial-services companies was imposed to help finance increased social spending. Continued reform, particularly in strengthening the independence of the judiciary and eradicating corruption, is needed to ensure greater eco-nomic dynamism.
NOTABLE SUCCESSES:Open Markets and Monetary Stability
CONCERNS:Government Spending, Government Integrity, and Judicial Effectiveness
OVERALL SCORE CHANGE SINCE 2013:
+2.3
POPULATION: 38.0 million
GDP (PPP): $1.0 trillion3.6% growth in 20155-year compound annual growth 3.0%$26,455 per capita
UNEMPLOYMENT: 7.4%
INFLATION (CPI): –0.9%
FDI INFLOW: $7.5 billion
PUBLIC DEBT: 51.3% of GDP
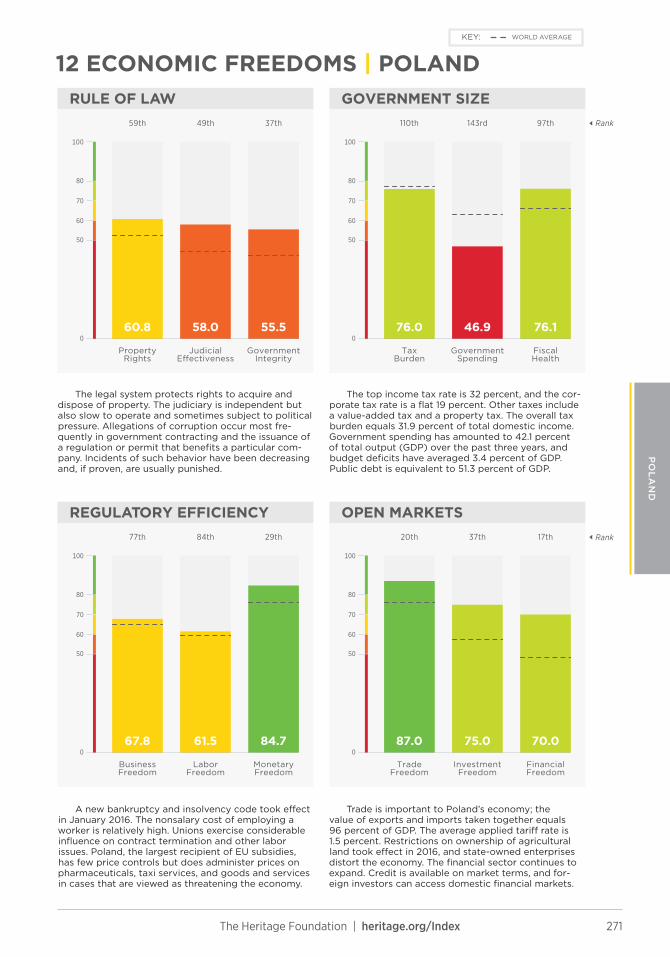
271The Heritage Foundation | heritage.org/Index
WORLD AVERAGEKEY:
RULE OF LAW GOVERNMENT SIZERank
REGULATORY EFFICIENCY OPEN MARKETSRank
Property Rights
Judicial E�ectiveness
Government Integrity
TaxBurden
Government Spending
FiscalHealth
Business Freedom
Labor Freedom
Monetary Freedom
Trade Freedom
Investment Freedom
Financial Freedom
80
60
70
100
50
0
80
60
70
100
50
0
80
60
70
100
50
0
80
60
70
100
50
0
17th37th20th29th84th77th
97th143rd110th37th49th59th
70.075.087.084.761.567.8
76.146.976.055.558.060.8
The legal system protects rights to acquire and dispose of property. The judiciary is independent but also slow to operate and sometimes subject to political pressure. Allegations of corruption occur most fre-quently in government contracting and the issuance of a regulation or permit that benefits a particular com-pany. Incidents of such behavior have been decreasing and, if proven, are usually punished.
The top income tax rate is 32 percent, and the cor-porate tax rate is a flat 19 percent. Other taxes include a value-added tax and a property tax. The overall tax burden equals 31.9 percent of total domestic income. Government spending has amounted to 42.1 percent of total output (GDP) over the past three years, and budget deficits have averaged 3.4 percent of GDP. Public debt is equivalent to 51.3 percent of GDP.
A new bankruptcy and insolvency code took effect in January 2016. The nonsalary cost of employing a worker is relatively high. Unions exercise considerable influence on contract termination and other labor issues. Poland, the largest recipient of EU subsidies, has few price controls but does administer prices on pharmaceuticals, taxi services, and goods and services in cases that are viewed as threatening the economy.
Trade is important to Poland’s economy; the value of exports and imports taken together equals 96 percent of GDP. The average applied tariff rate is 1.5 percent. Restrictions on ownership of agricultural land took effect in 2016, and state-owned enterprises distort the economy. The financial sector continues to expand. Credit is available on market terms, and for-eign investors can access domestic financial markets.
12 ECONOMIC FREEDOMS | POLAND
PO
LA
ND

272 2017 Index of Economic Freedom
ECONOMIC FREEDOM SCORE
FREEDOM TREND QUICK FACTS
80706050 1000
2008 2009 2010 2011 2012 2013 2014 2015 2016 2017
40
50
60
70
80
REGIONAL AVERAGE(EUROPE REGION)
WORLD AVERAGE
60.9 68.0
62.6( ▼ DOWN 2.5 POINTS )( ▼ DOWN 2.5 POINTS )
MODERATELY FREE
3377ECONOMIC FREEDOM STATUS:
REGIONAL RANK: WORLD RANK:
2015 data unless otherwise noted. Data compiled as of September 2016
PORTUGAL
BACKGROUND: The governing center-right coalition won the most seats in the October 2015 parliamen-tary elections but lost its majority. Shortly thereafter, Socialist former Lisbon Mayor António Costa joined leftist parties in the parliament to topple the government. In November 2015, Costa was appointed prime minister. The anti-austerity government has slowed economic reforms, causing friction with the European Union and International Monetary Fund. Adherence to strict budgetary discipline had allowed Portugal to move beyond the worst of its economic crisis, but growth has slowed, and Portugal failed to meet the EU-mandated deficit reduction target. Unemployment is high, especially among younger Portuguese, many of whom have moved abroad for work.
Portugal continues to face challenges that require urgent economic policy adjustment. Previous reforms, which had
helped to modify and diversify the economy’s productive base, have lost their momentum. Despite sound institutional settings such as an efficient business framework and an independent judicial system, the indebted and inefficient public sector has worn away the dynamism of the private sector and reduced the economy’s overall competitiveness.
Reform priorities include reducing budget deficits that have ele-vated the level of public debt to more than 100 percent of GDP and enhancing the flexibility of the labor market. However, the pace of reform has slowed. The banking system remains weak.
NOTABLE SUCCESSES:Trade Freedom and Business Freedom
CONCERNS:Government Size, Labor Freedom,
and Government Integrity
OVERALL SCORE CHANGE SINCE 2013:
–0.5
POPULATION: 10.4 million
GDP (PPP): $289.8 billion1.5% growth in 20155-year compound annual growth –0.9%$27,835 per capita
UNEMPLOYMENT: 12.1%
INFLATION (CPI): 0.5%
FDI INFLOW: $6.0 billion
PUBLIC DEBT: 128.8% of GDP

273The Heritage Foundation | heritage.org/Index
WORLD AVERAGEKEY:
RULE OF LAW GOVERNMENT SIZERank
REGULATORY EFFICIENCY OPEN MARKETSRank
Property Rights
Judicial E�ectiveness
Government Integrity
TaxBurden
Government Spending
FiscalHealth
Business Freedom
Labor Freedom
Monetary Freedom
Trade Freedom
Investment Freedom
Financial Freedom
80
60
70
100
50
0
80
60
70
100
50
0
80
60
70
100
50
0
80
60
70
100
50
0
39th59th20th13th162nd18th
151st168th169th32nd25th31st
60.070.087.085.943.486.4
32.125.159.859.068.973.3
Registration of property is fairly easy and can be done quickly online. According to the World Bank’s 2015 Doing Business report, registration is faster and simpler than in most other OECD countries. The constitution provides for an independent judiciary, but staff shortages and inefficiency have contributed to a considerable case backlog. Portugal continued to struggle with corruption scandals during the past year.
The top personal income tax rate is 48 percent, and the top corporate tax rate is 21 percent. Other taxes include a value-added tax. The overall tax burden equals 34.4 percent of total domestic income. Government spending has amounted to 50 percent of total output (GDP) over the past three years, and bud-get deficits have averaged 5.5 percent of GDP. Public debt is equivalent to 128.8 percent of GDP.
The overall regulatory framework is efficient. Rules regarding the formation and operation of private enterprises are relatively straightforward. Labor regula-tions on dismissals and the use of temporary contracts remain burdensome and costly. The continuing ineffi-cient operation of remaining state-owned enterprises requires ongoing subsidization. A multi-year bailout of the banking system has cost the government billions.
Trade is important to Portugal’s economy; the value of exports and imports taken together equals 80 percent of GDP. The average applied tariff rate is 1.5 percent. In general, the government does not screen or discriminate against foreign investment. Despite some progress toward stability, the financial system continues to face substantial risks. The banking sector remains weak, and the share of nonperforming loans is rising.
12 ECONOMIC FREEDOMS | PORTUGAL
PO
RT
UG
AL

274 2017 Index of Economic Freedom
ECONOMIC FREEDOM SCORE
FREEDOM TREND QUICK FACTS
80706050 1000
2008 2009 2010 2011 2012 2013 2014 2015 2016 2017
50
60
70
80
90
REGIONAL AVERAGE(EUROPE REGION)
WORLD AVERAGE
60.9 68.0
69.7( ▲ UP 4.1 POINTS )( ▲ UP 4.1 POINTS )
MODERATELY FREE
2039ECONOMIC FREEDOM STATUS:
REGIONAL RANK: WORLD RANK:
2015 data unless otherwise noted. Data compiled as of September 2016
ROMANIA
BACKGROUND: Former Prime Minister Victor Ponta of the center-left Social Democrat Party resigned in November 2015 following protests against government corruption that were sparked by a fatal nightclub fire. A caretaker government of technocrats managed the country for about a year until President Klaus Iohannis designated Prime Minister Sorin Grindeanu as the head of a new Social Democrat Party–led coalition government at the end of 2016. Romania’s transition to a free-market economy began with the adoption of its new constitution in 1991. In the post–Cold War period, Romania developed closer ties with Western Europe and was accepted into NATO in 2004 and the EU in 2007. In addition to its strategic posi-tion on the Black Sea, Romania has extensive natural resources and a productive agriculture sector.
Romania continues to recover from the recent global eco-nomic slowdown and has made fiscal sustainability a priority.
Economic growth rates have improved, but the benefits have not been felt by all Romanians. The country continues to have the highest poverty rate in the European Union.
Progress on implementing reforms and improving the business environment has been uneven. The unpredictable and uneven regulatory system discourages foreign investors from doing business in Romania. Efforts to privatize state-owned enter-prises have stalled in the past two years. Corruption is endemic at all levels of government and undermines the rule of law.
NOTABLE SUCCESSES:Trade Freedom and Monetary Stability
CONCERNS:Rule of Law, Financial Freedom, and
Labor Freedom
OVERALL SCORE CHANGE SINCE 2013:
+4.6
POPULATION: 19.8 million
GDP (PPP): $413.8 billion3.7% growth in 20155-year compound annual growth 2.4%$20,787 per capita
UNEMPLOYMENT: 6.9%
INFLATION (CPI): –0.6%
FDI INFLOW: $3.4 billion
PUBLIC DEBT: 39.4% of GDP

275The Heritage Foundation | heritage.org/Index
WORLD AVERAGEKEY:
RULE OF LAW GOVERNMENT SIZERank
REGULATORY EFFICIENCY OPEN MARKETSRank
Property Rights
Judicial E�ectiveness
Government Integrity
TaxBurden
Government Spending
FiscalHealth
Business Freedom
Labor Freedom
Monetary Freedom
Trade Freedom
Investment Freedom
Financial Freedom
80
60
70
100
50
0
80
60
70
100
50
0
80
60
70
100
50
0
80
60
70
100
50
0
70th37th20th37th79th89th
49th104th35th51st48th52nd
50.075.087.083.662.565.9
90.965.387.445.958.563.9
Romania’s constitution guarantees the right to ownership of private property, and procedures for the enforcement of contracts have been streamlined. The inadequately resourced courts suffer from chronic cor-ruption and political influence. Under pressure to meet the European Union’s anticorruption requirements, authorities charged Prime Minister Victor Ponta with fraud, tax evasion, and money laundering. He resigned from office in November 2015.
Both the personal income and corporate tax rates are a flat 16 percent. Other taxes include a value-added tax and an environmental tax. The overall tax burden equals 27.4 percent of total domestic income. Govern-ment spending has amounted to 34 percent of total output (GDP) over the past three years, and budget deficits have averaged 1.9 percent of GDP. Public debt is equivalent to 39.4 percent of GDP.
Enforcement of commercial regulations is not always consistent, and efficient procedures and rules for bankruptcy have not been fully implemented. Labor regulations remain rigid, although several amendments to improve the flexibility of the labor code have been adopted. The IMF has urged the government to reform inefficient and subsidized state-owned enterprises in the transportation and energy sectors.
Trade is important to Romania’s economy; the value of exports and imports taken together equals 83 percent of GDP. The average applied tariff rate is 1.5 percent. The government does not screen or discrimi-nate against foreign investment, but the regulatory and judicial systems may be deterrents. The banking sector is relatively sound and stable, with a high degree of capitalization. Foreign-owned banks account for over 70 percent of total assets.
12 ECONOMIC FREEDOMS | ROMANIA
RO
MA
NIA
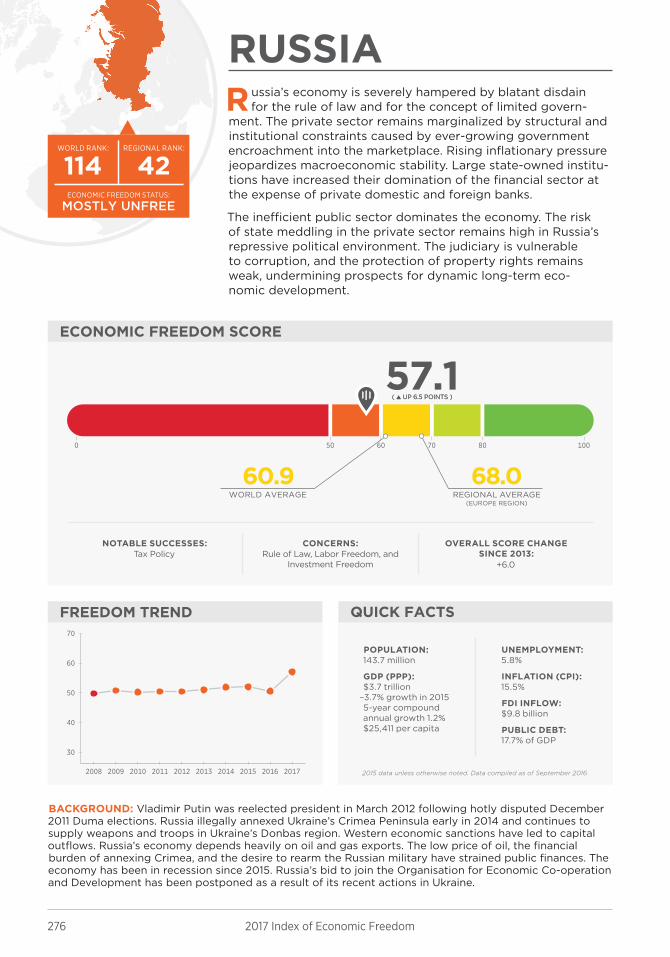
276 2017 Index of Economic Freedom
ECONOMIC FREEDOM SCORE
FREEDOM TREND QUICK FACTS
80706050 1000
2008 2009 2010 2011 2012 2013 2014 2015 2016 2017
30
40
50
60
70
REGIONAL AVERAGE(EUROPE REGION)
WORLD AVERAGE
60.9 68.0
57.1( ▲ UP 6.5 POINTS )( ▲ UP 6.5 POINTS )
MOSTLY UNFREE
42114ECONOMIC FREEDOM STATUS:
REGIONAL RANK: WORLD RANK:
2015 data unless otherwise noted. Data compiled as of September 2016
RUSSIA
BACKGROUND: Vladimir Putin was reelected president in March 2012 following hotly disputed December 2011 Duma elections. Russia illegally annexed Ukraine’s Crimea Peninsula early in 2014 and continues to supply weapons and troops in Ukraine’s Donbas region. Western economic sanctions have led to capital outflows. Russia’s economy depends heavily on oil and gas exports. The low price of oil, the financial burden of annexing Crimea, and the desire to rearm the Russian military have strained public finances. The economy has been in recession since 2015. Russia’s bid to join the Organisation for Economic Co-operation and Development has been postponed as a result of its recent actions in Ukraine.
Russia’s economy is severely hampered by blatant disdain for the rule of law and for the concept of limited govern-
ment. The private sector remains marginalized by structural and institutional constraints caused by ever-growing government encroachment into the marketplace. Rising inflationary pressure jeopardizes macroeconomic stability. Large state-owned institu-tions have increased their domination of the financial sector at the expense of private domestic and foreign banks.
The inefficient public sector dominates the economy. The risk of state meddling in the private sector remains high in Russia’s repressive political environment. The judiciary is vulnerable to corruption, and the protection of property rights remains weak, undermining prospects for dynamic long-term eco-nomic development.
NOTABLE SUCCESSES:Tax Policy
CONCERNS:Rule of Law, Labor Freedom, and
Investment Freedom
OVERALL SCORE CHANGE SINCE 2013:
+6.0
POPULATION: 143.7 million
GDP (PPP): $3.7 trillion
–3.7% growth in 20155-year compound annual growth 1.2%$25,411 per capita
UNEMPLOYMENT: 5.8%
INFLATION (CPI): 15.5%
FDI INFLOW: $9.8 billion
PUBLIC DEBT: 17.7% of GDP
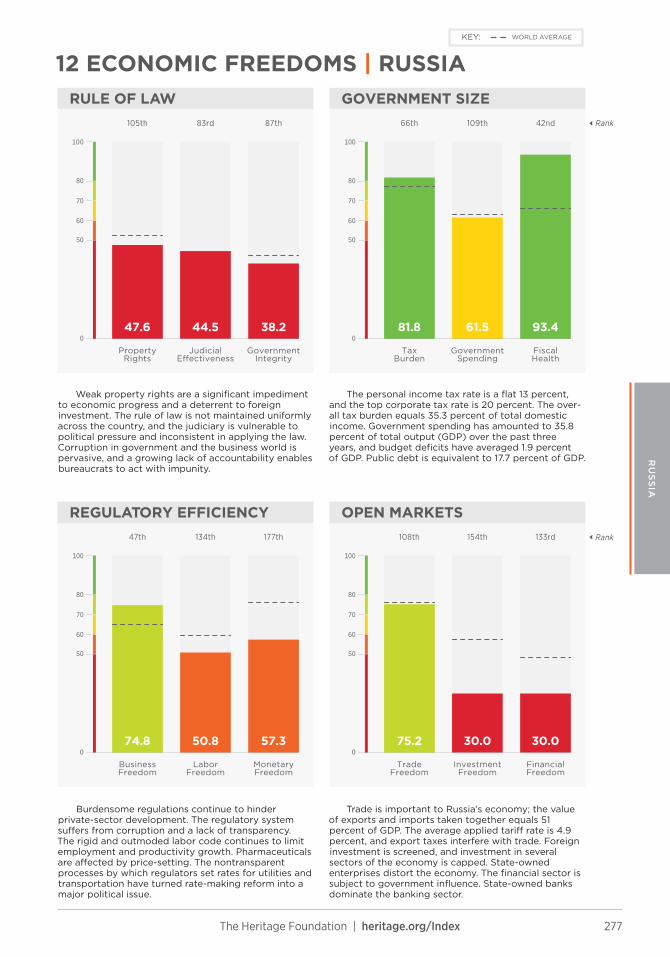
277The Heritage Foundation | heritage.org/Index
WORLD AVERAGEKEY:
RULE OF LAW GOVERNMENT SIZERank
REGULATORY EFFICIENCY OPEN MARKETSRank
Property Rights
Judicial E�ectiveness
Government Integrity
TaxBurden
Government Spending
FiscalHealth
Business Freedom
Labor Freedom
Monetary Freedom
Trade Freedom
Investment Freedom
Financial Freedom
80
60
70
100
50
0
80
60
70
100
50
0
80
60
70
100
50
0
80
60
70
100
50
0
133rd154th108th177th134th47th
42nd109th66th87th83rd105th
30.030.075.257.350.874.8
93.461.581.838.244.547.6
Weak property rights are a significant impediment to economic progress and a deterrent to foreign investment. The rule of law is not maintained uniformly across the country, and the judiciary is vulnerable to political pressure and inconsistent in applying the law. Corruption in government and the business world is pervasive, and a growing lack of accountability enables bureaucrats to act with impunity.
The personal income tax rate is a flat 13 percent, and the top corporate tax rate is 20 percent. The over-all tax burden equals 35.3 percent of total domestic income. Government spending has amounted to 35.8 percent of total output (GDP) over the past three years, and budget deficits have averaged 1.9 percent of GDP. Public debt is equivalent to 17.7 percent of GDP.
Burdensome regulations continue to hinder private-sector development. The regulatory system suffers from corruption and a lack of transparency. The rigid and outmoded labor code continues to limit employment and productivity growth. Pharmaceuticals are affected by price-setting. The nontransparent processes by which regulators set rates for utilities and transportation have turned rate-making reform into a major political issue.
Trade is important to Russia’s economy; the value of exports and imports taken together equals 51 percent of GDP. The average applied tariff rate is 4.9 percent, and export taxes interfere with trade. Foreign investment is screened, and investment in several sectors of the economy is capped. State-owned enterprises distort the economy. The financial sector is subject to government influence. State-owned banks dominate the banking sector.
12 ECONOMIC FREEDOMS | RUSSIA
RU
SS
IA
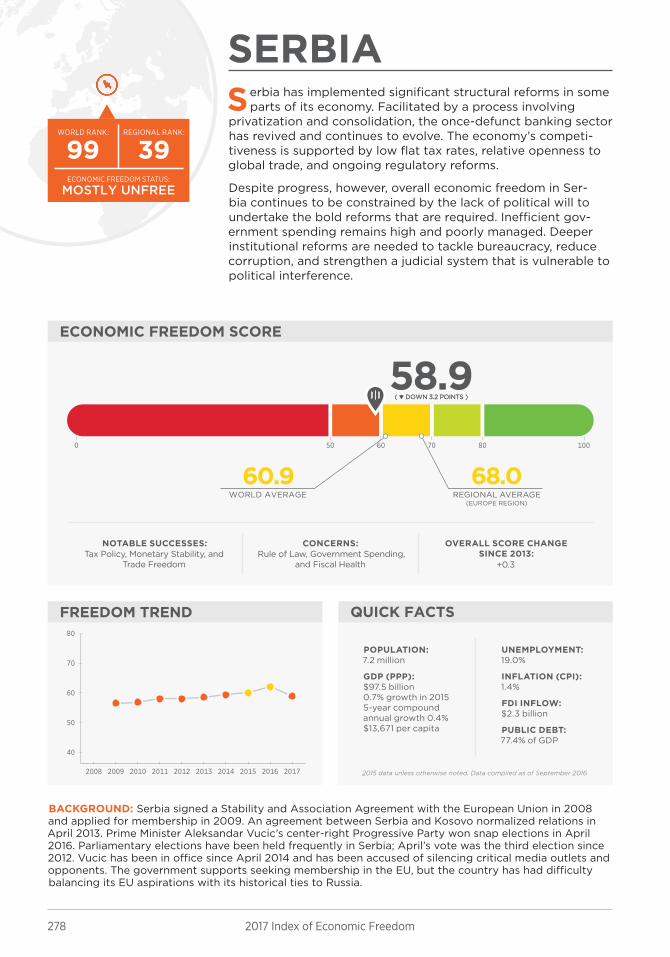
278 2017 Index of Economic Freedom
ECONOMIC FREEDOM SCORE
FREEDOM TREND QUICK FACTS
80706050 1000
2008 2009 2010 2011 2012 2013 2014 2015 2016 2017
40
50
60
70
80
REGIONAL AVERAGE(EUROPE REGION)
WORLD AVERAGE
60.9 68.0
58.9( ▼ DOWN 3.2 POINTS )( ▼ DOWN 3.2 POINTS )
MOSTLY UNFREE
3999ECONOMIC FREEDOM STATUS:
REGIONAL RANK: WORLD RANK:
2015 data unless otherwise noted. Data compiled as of September 2016
SERBIA
BACKGROUND: Serbia signed a Stability and Association Agreement with the European Union in 2008 and applied for membership in 2009. An agreement between Serbia and Kosovo normalized relations in April 2013. Prime Minister Aleksandar Vucic’s center-right Progressive Party won snap elections in April 2016. Parliamentary elections have been held frequently in Serbia; April’s vote was the third election since 2012. Vucic has been in office since April 2014 and has been accused of silencing critical media outlets and opponents. The government supports seeking membership in the EU, but the country has had difficulty balancing its EU aspirations with its historical ties to Russia.
Serbia has implemented significant structural reforms in some parts of its economy. Facilitated by a process involving
privatization and consolidation, the once-defunct banking sector has revived and continues to evolve. The economy’s competi-tiveness is supported by low flat tax rates, relative openness to global trade, and ongoing regulatory reforms.
Despite progress, however, overall economic freedom in Ser-bia continues to be constrained by the lack of political will to undertake the bold reforms that are required. Inefficient gov-ernment spending remains high and poorly managed. Deeper institutional reforms are needed to tackle bureaucracy, reduce corruption, and strengthen a judicial system that is vulnerable to political interference.
NOTABLE SUCCESSES:Tax Policy, Monetary Stability, and
Trade Freedom
CONCERNS:Rule of Law, Government Spending,
and Fiscal Health
OVERALL SCORE CHANGE SINCE 2013:
+0.3
POPULATION: 7.2 million
GDP (PPP): $97.5 billion0.7% growth in 20155-year compound annual growth 0.4%$13,671 per capita
UNEMPLOYMENT: 19.0%
INFLATION (CPI): 1.4%
FDI INFLOW: $2.3 billion
PUBLIC DEBT: 77.4% of GDP

279The Heritage Foundation | heritage.org/Index
WORLD AVERAGEKEY:
RULE OF LAW GOVERNMENT SIZERank
REGULATORY EFFICIENCY OPEN MARKETSRank
Property Rights
Judicial E�ectiveness
Government Integrity
TaxBurden
Government Spending
FiscalHealth
Business Freedom
Labor Freedom
Monetary Freedom
Trade Freedom
Investment Freedom
Financial Freedom
80
60
70
100
50
0
80
60
70
100
50
0
80
60
70
100
50
0
80
60
70
100
50
0
70th59th98th64th63rd105th
138th154th61st87th96th94th
50.070.077.880.865.962.9
46.940.383.338.240.250.3
Serbian citizens and foreign investors enjoy full rights to ownership of private property, but enforce-ment of those rights can be extremely slow. The judi-ciary in Serbia operates independently, but endemic problems continue to plague the judicial system. Cor-ruption remains a problem in many sectors, including the security, education, housing, and labor sectors, as well as in privatization processes and the judiciary.
The top personal income tax rate is 15 percent, and the corporate tax rate is a flat 15 percent. Other taxes include a value-added tax and a property tax. The overall tax burden equals 35.0 percent of total domes-tic income. Government spending has amounted to 44.6 percent of total output (GDP) over the past three years, and budget deficits have averaged 5.1 percent of GDP. Public debt is equivalent to 77.4 percent of GDP.
Despite some progress in streamlining the process for launching a business, other time-consuming requirements reduce the regulatory system’s efficiency. In an effort to make the labor market more flexible, the government recently introduced amendments to the rigid labor law that was implemented in 2005. The IMF program for Serbia emphasizes rationalization of state-owned enterprises to cut subsidies, but reforms are lagging.
Trade is extremely important to Serbia’s economy; the value of exports and imports taken together equals 105 percent of GDP. The average applied tariff rate is 6.1 percent. Legislation in 2015 liberalized Serbia’s foreign investment climate, but state-owned enter-prises distort the economy. Financial intermediation is relatively low, and the percentage of nonperforming loans in banks is one of the highest in the region.
12 ECONOMIC FREEDOMS | SERBIA
SE
RB
IA

280 2017 Index of Economic Freedom
ECONOMIC FREEDOM SCORE
FREEDOM TREND QUICK FACTS
80706050 1000
2008 2009 2010 2011 2012 2013 2014 2015 2016 2017
50
60
70
80
90
REGIONAL AVERAGE(EUROPE REGION)
WORLD AVERAGE
60.9 68.0
65.7( ▼ DOWN 0.9 POINT )( ▼ DOWN 0.9 POINT )
MODERATELY FREE
2857ECONOMIC FREEDOM STATUS:
REGIONAL RANK: WORLD RANK:
2015 data unless otherwise noted. Data compiled as of September 2016
SLOVAKIA
BACKGROUND: After Slovakia gained independence in 1993, market reforms made it one of Europe’s rising economic stars. The country entered the European Union in 2004 and has been part of the eurozone since 2009. Unemployment remains high; 25 percent of young people are unemployed. Prime Minister Robert Fico has been in office since 2012. His center-left Direction-Social Democracy Party lost its par-liamentary majority in March 2016 but returned to power as leader of a coalition government with three other parties. Andrej Kiska was elected president in 2014 as an Independent. Slovakia, which has rebuffed EU plans for mandatory migrant quotas, took over the rotating presidency of the Council of the European Union in July 2016.
Openness to global trade and investment, facilitated by improvements in regulatory efficiency, has aided Slovakia’s
transition to a more market-based system. Recent changes in corporate taxation include reduction of the top corporate tax rate from 22 percent to 21 percent. Continued transformation and restructuring are needed to capitalize on the well-educated labor force and broaden the production base.
Progress on combating corruption and enhancing the quality of the public sector has been uneven. The judicial system remains inefficient and vulnerable to political interference. Corruption is still perceived as widespread, undermining judicial effectiveness and public trust in government.
NOTABLE SUCCESSES:Open Markets and Monetary Stability
CONCERNS:Judicial Effectiveness, Government Integrity, and Government Spending
OVERALL SCORE CHANGE SINCE 2013:
–3.0
POPULATION: 5.4 million
GDP (PPP): $161.0 billion3.6% growth in 20155-year compound annual growth 2.4%$29,720 per capita
UNEMPLOYMENT: 11.3%
INFLATION (CPI): –0.3%
FDI INFLOW: $802.5 million
PUBLIC DEBT: 52.6% of GDP
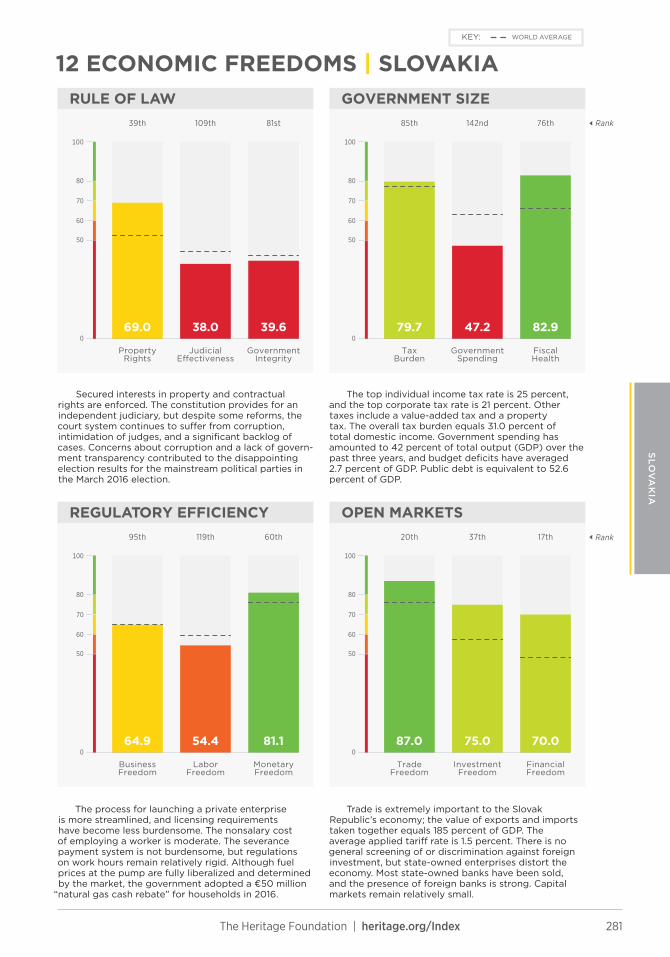
281The Heritage Foundation | heritage.org/Index
WORLD AVERAGEKEY:
RULE OF LAW GOVERNMENT SIZERank
REGULATORY EFFICIENCY OPEN MARKETSRank
Property Rights
Judicial E�ectiveness
Government Integrity
TaxBurden
Government Spending
FiscalHealth
Business Freedom
Labor Freedom
Monetary Freedom
Trade Freedom
Investment Freedom
Financial Freedom
80
60
70
100
50
0
80
60
70
100
50
0
80
60
70
100
50
0
80
60
70
100
50
0
17th37th20th60th119th95th
76th142nd85th81st109th39th
70.075.087.081.154.464.9
82.947.279.739.638.069.0
Secured interests in property and contractual rights are enforced. The constitution provides for an independent judiciary, but despite some reforms, the court system continues to suffer from corruption, intimidation of judges, and a significant backlog of cases. Concerns about corruption and a lack of govern-ment transparency contributed to the disappointing election results for the mainstream political parties in the March 2016 election.
The top individual income tax rate is 25 percent, and the top corporate tax rate is 21 percent. Other taxes include a value-added tax and a property tax. The overall tax burden equals 31.0 percent of total domestic income. Government spending has amounted to 42 percent of total output (GDP) over the past three years, and budget deficits have averaged 2.7 percent of GDP. Public debt is equivalent to 52.6 percent of GDP.
The process for launching a private enterprise is more streamlined, and licensing requirements have become less burdensome. The nonsalary cost of employing a worker is moderate. The severance payment system is not burdensome, but regulations on work hours remain relatively rigid. Although fuel prices at the pump are fully liberalized and determined by the market, the government adopted a €50 million
“natural gas cash rebate” for households in 2016.
Trade is extremely important to the Slovak Republic’s economy; the value of exports and imports taken together equals 185 percent of GDP. The average applied tariff rate is 1.5 percent. There is no general screening of or discrimination against foreign investment, but state-owned enterprises distort the economy. Most state-owned banks have been sold, and the presence of foreign banks is strong. Capital markets remain relatively small.
12 ECONOMIC FREEDOMS | SLOVAKIA
SLO
VA
KIA
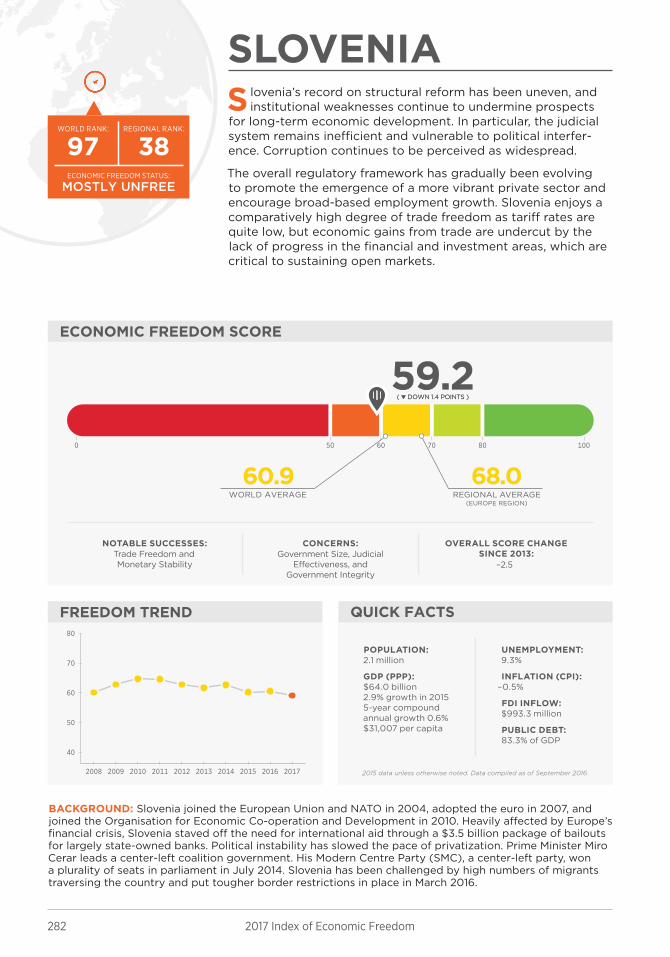
282 2017 Index of Economic Freedom
ECONOMIC FREEDOM SCORE
FREEDOM TREND QUICK FACTS
80706050 1000
2008 2009 2010 2011 2012 2013 2014 2015 2016 2017
40
50
60
70
80
REGIONAL AVERAGE(EUROPE REGION)
WORLD AVERAGE
60.9 68.0
59.2( ▼ DOWN 1.4 POINTS )( ▼ DOWN 1.4 POINTS )
MOSTLY UNFREE
3897ECONOMIC FREEDOM STATUS:
REGIONAL RANK: WORLD RANK:
2015 data unless otherwise noted. Data compiled as of September 2016
SLOVENIA
BACKGROUND: Slovenia joined the European Union and NATO in 2004, adopted the euro in 2007, and joined the Organisation for Economic Co-operation and Development in 2010. Heavily affected by Europe’s financial crisis, Slovenia staved off the need for international aid through a $3.5 billion package of bailouts for largely state-owned banks. Political instability has slowed the pace of privatization. Prime Minister Miro Cerar leads a center-left coalition government. His Modern Centre Party (SMC), a center-left party, won a plurality of seats in parliament in July 2014. Slovenia has been challenged by high numbers of migrants traversing the country and put tougher border restrictions in place in March 2016.
S lovenia’s record on structural reform has been uneven, and institutional weaknesses continue to undermine prospects
for long-term economic development. In particular, the judicial system remains inefficient and vulnerable to political interfer-ence. Corruption continues to be perceived as widespread.
The overall regulatory framework has gradually been evolving to promote the emergence of a more vibrant private sector and encourage broad-based employment growth. Slovenia enjoys a comparatively high degree of trade freedom as tariff rates are quite low, but economic gains from trade are undercut by the lack of progress in the financial and investment areas, which are critical to sustaining open markets.
NOTABLE SUCCESSES:Trade Freedom and Monetary Stability
CONCERNS:Government Size, Judicial
Effectiveness, and Government Integrity
OVERALL SCORE CHANGE SINCE 2013:
–2.5
POPULATION: 2.1 million
GDP (PPP): $64.0 billion2.9% growth in 20155-year compound annual growth 0.6%$31,007 per capita
UNEMPLOYMENT: 9.3%
INFLATION (CPI): –0.5%
FDI INFLOW: $993.3 million
PUBLIC DEBT: 83.3% of GDP
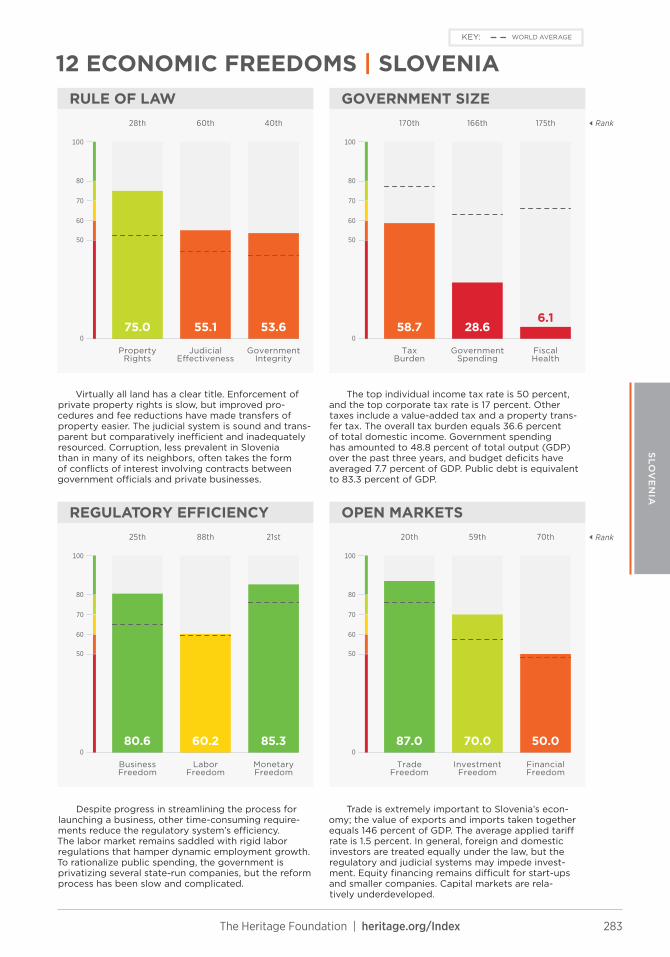
283The Heritage Foundation | heritage.org/Index
WORLD AVERAGEKEY:
RULE OF LAW GOVERNMENT SIZERank
REGULATORY EFFICIENCY OPEN MARKETSRank
Property Rights
Judicial E�ectiveness
Government Integrity
TaxBurden
Government Spending
FiscalHealth
Business Freedom
Labor Freedom
Monetary Freedom
Trade Freedom
Investment Freedom
Financial Freedom
80
60
70
100
50
0
80
60
70
100
50
0
80
60
70
100
50
0
80
60
70
100
50
0
70th59th20th21st88th25th
175th166th170th40th60th28th
50.070.087.085.360.280.6
6.128.658.753.655.175.0
Virtually all land has a clear title. Enforcement of private property rights is slow, but improved pro-cedures and fee reductions have made transfers of property easier. The judicial system is sound and trans-parent but comparatively inefficient and inadequately resourced. Corruption, less prevalent in Slovenia than in many of its neighbors, often takes the form of conflicts of interest involving contracts between government officials and private businesses.
The top individual income tax rate is 50 percent, and the top corporate tax rate is 17 percent. Other taxes include a value-added tax and a property trans-fer tax. The overall tax burden equals 36.6 percent of total domestic income. Government spending has amounted to 48.8 percent of total output (GDP) over the past three years, and budget deficits have averaged 7.7 percent of GDP. Public debt is equivalent to 83.3 percent of GDP.
Despite progress in streamlining the process for launching a business, other time-consuming require-ments reduce the regulatory system’s efficiency. The labor market remains saddled with rigid labor regulations that hamper dynamic employment growth. To rationalize public spending, the government is privatizing several state-run companies, but the reform process has been slow and complicated.
Trade is extremely important to Slovenia’s econ-omy; the value of exports and imports taken together equals 146 percent of GDP. The average applied tariff rate is 1.5 percent. In general, foreign and domestic investors are treated equally under the law, but the regulatory and judicial systems may impede invest-ment. Equity financing remains difficult for start-ups and smaller companies. Capital markets are rela-tively underdeveloped.
12 ECONOMIC FREEDOMS | SLOVENIA
SLO
VE
NIA
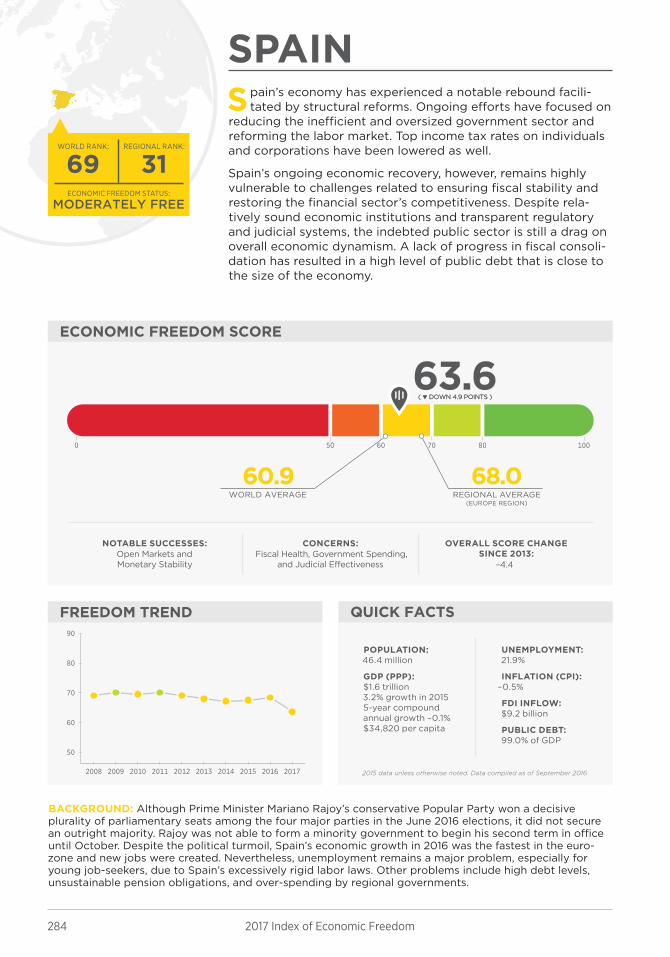
284 2017 Index of Economic Freedom
ECONOMIC FREEDOM SCORE
FREEDOM TREND QUICK FACTS
80706050 1000
2008 2009 2010 2011 2012 2013 2014 2015 2016 2017
50
60
70
80
90
REGIONAL AVERAGE(EUROPE REGION)
WORLD AVERAGE
60.9 68.0
63.6( ▼ DOWN 4.9 POINTS )( ▼ DOWN 4.9 POINTS )
MODERATELY FREE
3169ECONOMIC FREEDOM STATUS:
REGIONAL RANK: WORLD RANK:
2015 data unless otherwise noted. Data compiled as of September 2016
SPAIN
BACKGROUND: Although Prime Minister Mariano Rajoy’s conservative Popular Party won a decisive plurality of parliamentary seats among the four major parties in the June 2016 elections, it did not secure an outright majority. Rajoy was not able to form a minority government to begin his second term in office until October. Despite the political turmoil, Spain’s economic growth in 2016 was the fastest in the euro-zone and new jobs were created. Nevertheless, unemployment remains a major problem, especially for young job-seekers, due to Spain’s excessively rigid labor laws. Other problems include high debt levels, unsustainable pension obligations, and over-spending by regional governments.
Spain’s economy has experienced a notable rebound facili-tated by structural reforms. Ongoing efforts have focused on
reducing the inefficient and oversized government sector and reforming the labor market. Top income tax rates on individuals and corporations have been lowered as well.
Spain’s ongoing economic recovery, however, remains highly vulnerable to challenges related to ensuring fiscal stability and restoring the financial sector’s competitiveness. Despite rela-tively sound economic institutions and transparent regulatory and judicial systems, the indebted public sector is still a drag on overall economic dynamism. A lack of progress in fiscal consoli-dation has resulted in a high level of public debt that is close to the size of the economy.
NOTABLE SUCCESSES:Open Markets and Monetary Stability
CONCERNS:Fiscal Health, Government Spending,
and Judicial Effectiveness
OVERALL SCORE CHANGE SINCE 2013:
–4.4
POPULATION: 46.4 million
GDP (PPP): $1.6 trillion3.2% growth in 20155-year compound annual growth –0.1%$34,820 per capita
UNEMPLOYMENT: 21.9%
INFLATION (CPI): –0.5%
FDI INFLOW: $9.2 billion
PUBLIC DEBT: 99.0% of GDP
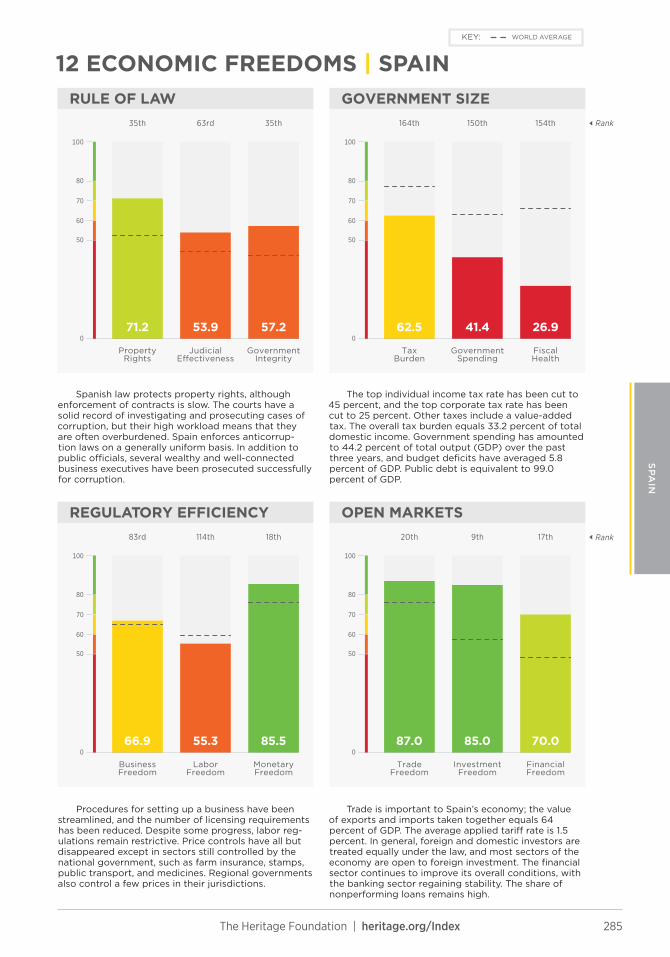
285The Heritage Foundation | heritage.org/Index
WORLD AVERAGEKEY:
RULE OF LAW GOVERNMENT SIZERank
REGULATORY EFFICIENCY OPEN MARKETSRank
Property Rights
Judicial E�ectiveness
Government Integrity
TaxBurden
Government Spending
FiscalHealth
Business Freedom
Labor Freedom
Monetary Freedom
Trade Freedom
Investment Freedom
Financial Freedom
80
60
70
100
50
0
80
60
70
100
50
0
80
60
70
100
50
0
80
60
70
100
50
0
17th9th20th18th114th83rd
154th150th164th35th63rd35th
70.085.087.085.555.366.9
26.941.462.557.253.971.2
Spanish law protects property rights, although enforcement of contracts is slow. The courts have a solid record of investigating and prosecuting cases of corruption, but their high workload means that they are often overburdened. Spain enforces anticorrup-tion laws on a generally uniform basis. In addition to public officials, several wealthy and well-connected business executives have been prosecuted successfully for corruption.
The top individual income tax rate has been cut to 45 percent, and the top corporate tax rate has been cut to 25 percent. Other taxes include a value-added tax. The overall tax burden equals 33.2 percent of total domestic income. Government spending has amounted to 44.2 percent of total output (GDP) over the past three years, and budget deficits have averaged 5.8 percent of GDP. Public debt is equivalent to 99.0 percent of GDP.
Procedures for setting up a business have been streamlined, and the number of licensing requirements has been reduced. Despite some progress, labor reg-ulations remain restrictive. Price controls have all but disappeared except in sectors still controlled by the national government, such as farm insurance, stamps, public transport, and medicines. Regional governments also control a few prices in their jurisdictions.
Trade is important to Spain’s economy; the value of exports and imports taken together equals 64 percent of GDP. The average applied tariff rate is 1.5 percent. In general, foreign and domestic investors are treated equally under the law, and most sectors of the economy are open to foreign investment. The financial sector continues to improve its overall conditions, with the banking sector regaining stability. The share of nonperforming loans remains high.
12 ECONOMIC FREEDOMS | SPAIN
SP
AIN

286 2017 Index of Economic Freedom
ECONOMIC FREEDOM SCORE
FREEDOM TREND QUICK FACTS
80706050 1000
2008 2009 2010 2011 2012 2013 2014 2015 2016 2017
50
60
70
80
90
REGIONAL AVERAGE(EUROPE REGION)
WORLD AVERAGE
60.9 68.0
74.9( ▲ UP 2.9 POINTS )( ▲ UP 2.9 POINTS )
MOSTLY FREE
1019ECONOMIC FREEDOM STATUS:
REGIONAL RANK: WORLD RANK:
2015 data unless otherwise noted. Data compiled as of September 2016
SWEDEN
BACKGROUND: Sweden joined the European Union in 1995 but rejected adoption of the euro in 2003. The public opposes membership in the eurozone. A general election was held in September 2014. After difficult negotiations, a new center-left Social Democratic Party–Green Party coalition government took office, led by Prime Minister Stefan Löfven. The government has cut spending and increased borrowing to cover the surging costs of unprecedented numbers of migrant arrivals in Sweden. Due to a number of security incidents in the region that have been linked to Russia, the debate about possible NATO membership has resurfaced, but it remains unlikely that Sweden will join the alliance in the near future.
Sweden’s economy performs notably well in regulatory efficiency, with open-market policies that sustain flexibility,
competitiveness, and large flows of trade and investment. The transparent and efficient regulatory environment encourages robust entrepreneurial activity. Banking regulations are sensible, and lending practices have been prudent. The legal system pro-vides strong protection for property rights, buttressing judicial effectiveness and government integrity.
Government spending accounts for over half of GDP, and the tax regime needed to finance the wide scope of government has become more burdensome. However, institutional assets such as high degrees of business efficiency and transparency have coun-terbalanced some of the shortcomings of heavy social spending.
NOTABLE SUCCESSES:Rule of Law, Open Markets, and
Business Freedom
CONCERNS:Government Spending, Tax Burden,
and Labor Freedom
OVERALL SCORE CHANGE SINCE 2013:
+2.0
POPULATION: 9.8 million
GDP (PPP): $473.4 billion4.1% growth in 20155-year compound annual growth 2.0%$47,922 per capita
UNEMPLOYMENT: 7.4%
INFLATION (CPI): 0.7%
FDI INFLOW: $12.6 billion
PUBLIC DEBT: 44.1% of GDP
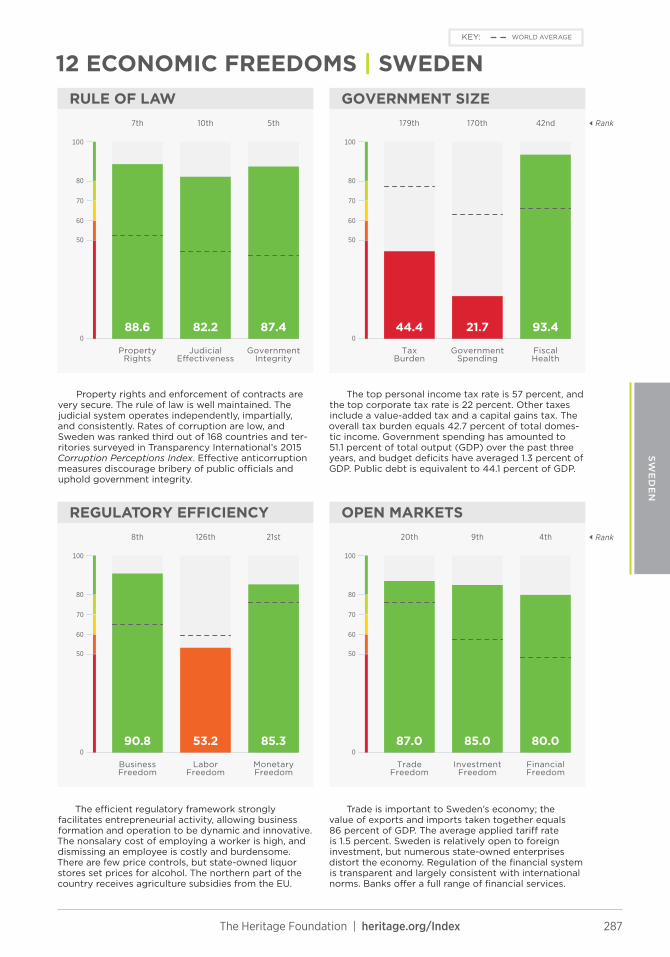
287The Heritage Foundation | heritage.org/Index
WORLD AVERAGEKEY:
RULE OF LAW GOVERNMENT SIZERank
REGULATORY EFFICIENCY OPEN MARKETSRank
Property Rights
Judicial E�ectiveness
Government Integrity
TaxBurden
Government Spending
FiscalHealth
Business Freedom
Labor Freedom
Monetary Freedom
Trade Freedom
Investment Freedom
Financial Freedom
80
60
70
100
50
0
80
60
70
100
50
0
80
60
70
100
50
0
80
60
70
100
50
0
4th9th20th21st126th8th
42nd170th179th5th10th7th
80.085.087.085.353.290.8
93.421.744.487.482.288.6
Property rights and enforcement of contracts are very secure. The rule of law is well maintained. The judicial system operates independently, impartially, and consistently. Rates of corruption are low, and Sweden was ranked third out of 168 countries and ter-ritories surveyed in Transparency International’s 2015 Corruption Perceptions Index. Effective anticorruption measures discourage bribery of public officials and uphold government integrity.
The top personal income tax rate is 57 percent, and the top corporate tax rate is 22 percent. Other taxes include a value-added tax and a capital gains tax. The overall tax burden equals 42.7 percent of total domes-tic income. Government spending has amounted to 51.1 percent of total output (GDP) over the past three years, and budget deficits have averaged 1.3 percent of GDP. Public debt is equivalent to 44.1 percent of GDP.
The efficient regulatory framework strongly facilitates entrepreneurial activity, allowing business formation and operation to be dynamic and innovative. The nonsalary cost of employing a worker is high, and dismissing an employee is costly and burdensome. There are few price controls, but state-owned liquor stores set prices for alcohol. The northern part of the country receives agriculture subsidies from the EU.
Trade is important to Sweden’s economy; the value of exports and imports taken together equals 86 percent of GDP. The average applied tariff rate is 1.5 percent. Sweden is relatively open to foreign investment, but numerous state-owned enterprises distort the economy. Regulation of the financial system is transparent and largely consistent with international norms. Banks offer a full range of financial services.
12 ECONOMIC FREEDOMS | SWEDEN
SW
ED
EN
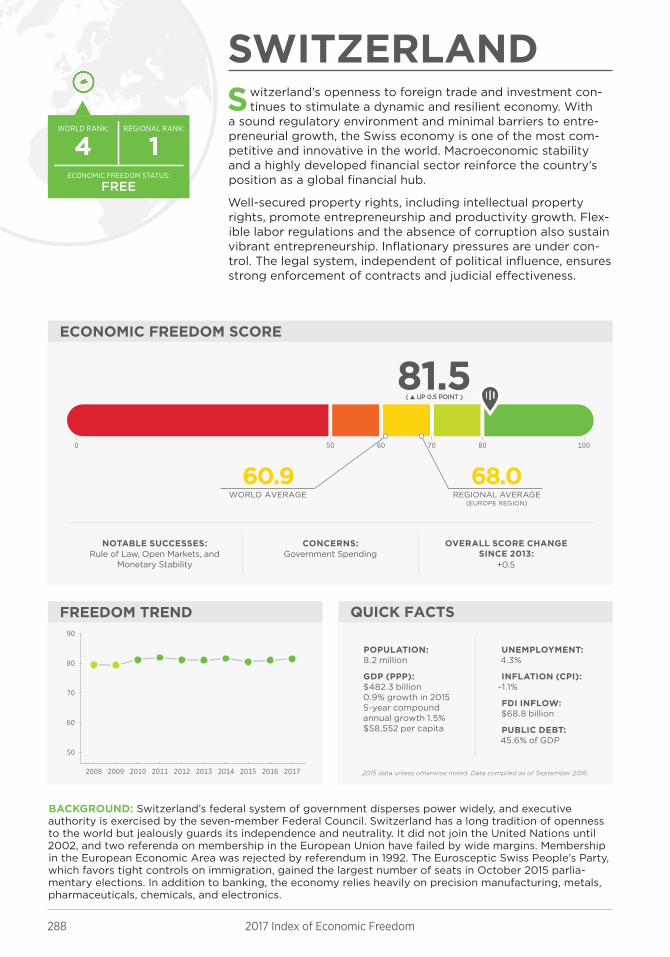
288 2017 Index of Economic Freedom
ECONOMIC FREEDOM SCORE
FREEDOM TREND QUICK FACTS
80706050 1000
2008 2009 2010 2011 2012 2013 2014 2015 2016 2017
50
60
70
80
90
REGIONAL AVERAGE(EUROPE REGION)
WORLD AVERAGE
60.9 68.0
81.5( ▲ UP 0.5 POINT )( ▲ UP 0.5 POINT )
FREE
14ECONOMIC FREEDOM STATUS:
REGIONAL RANK: WORLD RANK:
2015 data unless otherwise noted. Data compiled as of September 2016
SWITZERLAND
BACKGROUND: Switzerland’s federal system of government disperses power widely, and executive authority is exercised by the seven-member Federal Council. Switzerland has a long tradition of openness to the world but jealously guards its independence and neutrality. It did not join the United Nations until 2002, and two referenda on membership in the European Union have failed by wide margins. Membership in the European Economic Area was rejected by referendum in 1992. The Eurosceptic Swiss People’s Party, which favors tight controls on immigration, gained the largest number of seats in October 2015 parlia-mentary elections. In addition to banking, the economy relies heavily on precision manufacturing, metals, pharmaceuticals, chemicals, and electronics.
Switzerland’s openness to foreign trade and investment con-tinues to stimulate a dynamic and resilient economy. With
a sound regulatory environment and minimal barriers to entre-preneurial growth, the Swiss economy is one of the most com-petitive and innovative in the world. Macroeconomic stability and a highly developed financial sector reinforce the country’s position as a global financial hub.
Well-secured property rights, including intellectual property rights, promote entrepreneurship and productivity growth. Flex-ible labor regulations and the absence of corruption also sustain vibrant entrepreneurship. Inflationary pressures are under con-trol. The legal system, independent of political influence, ensures strong enforcement of contracts and judicial effectiveness.
NOTABLE SUCCESSES:Rule of Law, Open Markets, and
Monetary Stability
CONCERNS:Government Spending
OVERALL SCORE CHANGE SINCE 2013:
+0.5
POPULATION: 8.2 million
GDP (PPP): $482.3 billion0.9% growth in 20155-year compound annual growth 1.5%$58,552 per capita
UNEMPLOYMENT: 4.3%
INFLATION (CPI): –1.1%
FDI INFLOW: $68.8 billion
PUBLIC DEBT: 45.6% of GDP
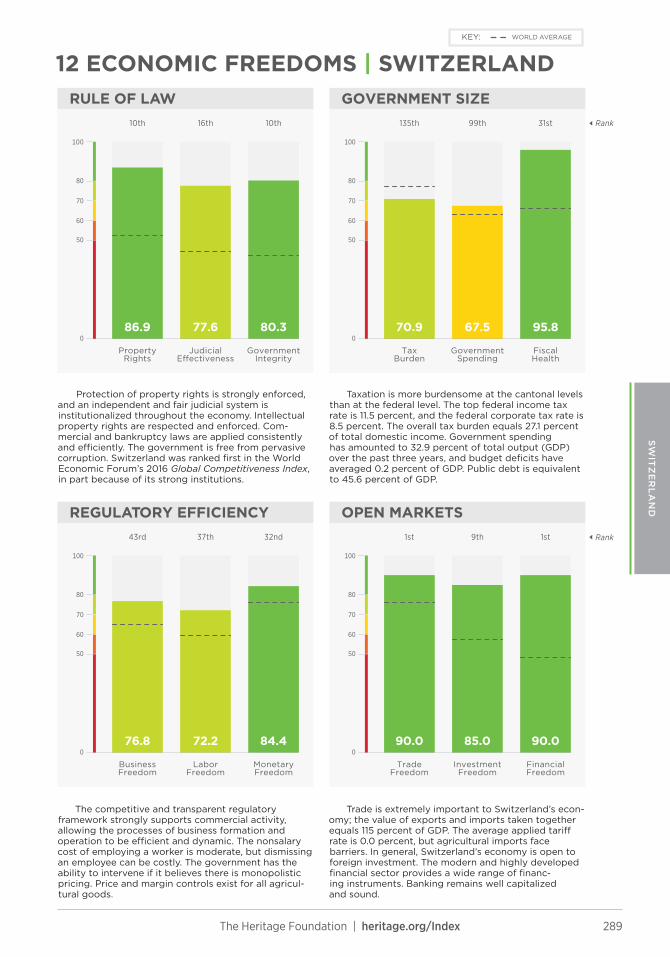
289The Heritage Foundation | heritage.org/Index
WORLD AVERAGEKEY:
RULE OF LAW GOVERNMENT SIZERank
REGULATORY EFFICIENCY OPEN MARKETSRank
Property Rights
Judicial E�ectiveness
Government Integrity
TaxBurden
Government Spending
FiscalHealth
Business Freedom
Labor Freedom
Monetary Freedom
Trade Freedom
Investment Freedom
Financial Freedom
80
60
70
100
50
0
80
60
70
100
50
0
80
60
70
100
50
0
80
60
70
100
50
0
1st9th1st32nd37th43rd
31st99th135th10th16th10th
90.085.090.084.472.276.8
95.867.570.980.377.686.9
Protection of property rights is strongly enforced, and an independent and fair judicial system is institutionalized throughout the economy. Intellectual property rights are respected and enforced. Com-mercial and bankruptcy laws are applied consistently and efficiently. The government is free from pervasive corruption. Switzerland was ranked first in the World Economic Forum’s 2016 Global Competitiveness Index, in part because of its strong institutions.
Taxation is more burdensome at the cantonal levels than at the federal level. The top federal income tax rate is 11.5 percent, and the federal corporate tax rate is 8.5 percent. The overall tax burden equals 27.1 percent of total domestic income. Government spending has amounted to 32.9 percent of total output (GDP) over the past three years, and budget deficits have averaged 0.2 percent of GDP. Public debt is equivalent to 45.6 percent of GDP.
The competitive and transparent regulatory framework strongly supports commercial activity, allowing the processes of business formation and operation to be efficient and dynamic. The nonsalary cost of employing a worker is moderate, but dismissing an employee can be costly. The government has the ability to intervene if it believes there is monopolistic pricing. Price and margin controls exist for all agricul-tural goods.
Trade is extremely important to Switzerland’s econ-omy; the value of exports and imports taken together equals 115 percent of GDP. The average applied tariff rate is 0.0 percent, but agricultural imports face barriers. In general, Switzerland’s economy is open to foreign investment. The modern and highly developed financial sector provides a wide range of financ-ing instruments. Banking remains well capitalized and sound.
12 ECONOMIC FREEDOMS | SWITZERLAND
SW
ITZ
ER
LA
ND
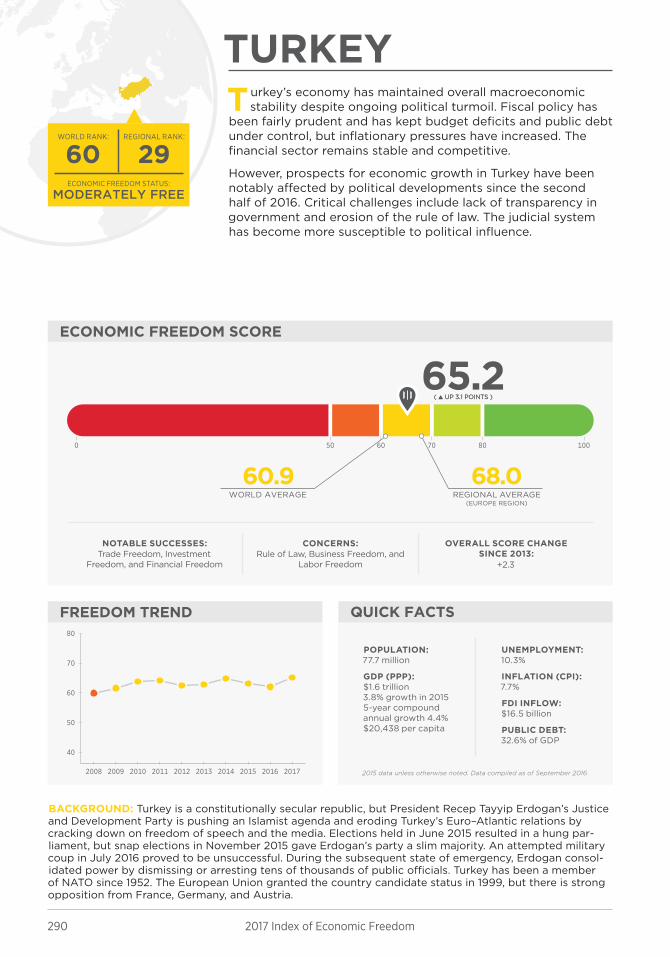
290 2017 Index of Economic Freedom
ECONOMIC FREEDOM SCORE
FREEDOM TREND QUICK FACTS
80706050 1000
2008 2009 2010 2011 2012 2013 2014 2015 2016 2017
40
50
60
70
80
REGIONAL AVERAGE(EUROPE REGION)
WORLD AVERAGE
60.9 68.0
65.2( ▲ UP 3.1 POINTS )( ▲ UP 3.1 POINTS )
MODERATELY FREE
2960ECONOMIC FREEDOM STATUS:
REGIONAL RANK: WORLD RANK:
2015 data unless otherwise noted. Data compiled as of September 2016
TURKEY
BACKGROUND: Turkey is a constitutionally secular republic, but President Recep Tayyip Erdogan’s Justice and Development Party is pushing an Islamist agenda and eroding Turkey’s Euro–Atlantic relations by cracking down on freedom of speech and the media. Elections held in June 2015 resulted in a hung par-liament, but snap elections in November 2015 gave Erdogan’s party a slim majority. An attempted military coup in July 2016 proved to be unsuccessful. During the subsequent state of emergency, Erdogan consol-idated power by dismissing or arresting tens of thousands of public officials. Turkey has been a member of NATO since 1952. The European Union granted the country candidate status in 1999, but there is strong opposition from France, Germany, and Austria.
Turkey’s economy has maintained overall macroeconomic stability despite ongoing political turmoil. Fiscal policy has
been fairly prudent and has kept budget deficits and public debt under control, but inflationary pressures have increased. The financial sector remains stable and competitive.
However, prospects for economic growth in Turkey have been notably affected by political developments since the second half of 2016. Critical challenges include lack of transparency in government and erosion of the rule of law. The judicial system has become more susceptible to political influence.
NOTABLE SUCCESSES:Trade Freedom, Investment
Freedom, and Financial Freedom
CONCERNS:Rule of Law, Business Freedom, and
Labor Freedom
OVERALL SCORE CHANGE SINCE 2013:
+2.3
POPULATION: 77.7 million
GDP (PPP): $1.6 trillion3.8% growth in 20155-year compound annual growth 4.4%$20,438 per capita
UNEMPLOYMENT: 10.3%
INFLATION (CPI): 7.7%
FDI INFLOW: $16.5 billion
PUBLIC DEBT: 32.6% of GDP

291The Heritage Foundation | heritage.org/Index
WORLD AVERAGEKEY:
RULE OF LAW GOVERNMENT SIZERank
REGULATORY EFFICIENCY OPEN MARKETSRank
Property Rights
Judicial E�ectiveness
Government Integrity
TaxBurden
Government Spending
FiscalHealth
Business Freedom
Labor Freedom
Monetary Freedom
Trade Freedom
Investment Freedom
Financial Freedom
80
60
70
100
50
0
80
60
70
100
50
0
80
60
70
100
50
0
80
60
70
100
50
0
39th37th88th137th147th100th
33rd117th111th76th65th57th
60.075.079.472.248.564.3
95.757.775.540.752.561.3
Property rights are generally enforced, although the courts are slow. The judiciary is independent but has shown that it can be swayed by the executive through appointments, promotions, and financing. That influence intensified after President Erdogan’s purges of the military, judiciary, and police in the wake of the failed July 2016 military coup. Corruption, cronyism, and nepotism in government and in daily life are growing concerns.
The top personal income tax rate is 35 percent, and the top corporate tax rate is 20 percent. Other taxes include a value-added tax and an environment tax. The overall tax burden equals 28.7 percent of total domes-tic income. Government spending has amounted to 37.6 percent of total output (GDP) over the past three years, and budget deficits have averaged 1.2 percent of GDP. Public debt is equivalent to 32.6 percent of GDP.
Bureaucratic red tape and ineffective enforcement of regulations continue to be substantial drags on entrepreneurship. The rigidity of the labor market limits the emergence of a more dynamic economy. The statutory minimum wage was raised by approxi-mately 30 percent in January 2016. The government sets prices for products provided by state-owned enterprises and controls prices for some agricultural products and electricity.
Trade is important to Turkey’s economy; the value of exports and imports taken together equals 59 percent of GDP. The average applied tariff rate is 2.8 percent. There is no general screening of or discrimina-tion against foreign investment, and many state-owned enterprises have been privatized. The banking sector, which dominates the financial system, remains well capitalized and resilient. The presence of foreign banks is relatively small.
12 ECONOMIC FREEDOMS | TURKEY
TU
RK
EY

292 2017 Index of Economic Freedom
ECONOMIC FREEDOM SCORE
FREEDOM TREND QUICK FACTS
80706050 1000
2008 2009 2010 2011 2012 2013 2014 2015 2016 2017
30
40
50
60
70
REGIONAL AVERAGE(EUROPE REGION)
WORLD AVERAGE
60.9 68.0
48.1( ▲ UP 1.3 POINTS )( ▲ UP 1.3 POINTS )
REPRESSED
44166ECONOMIC FREEDOM STATUS:
REGIONAL RANK: WORLD RANK:
2015 data unless otherwise noted. Data compiled as of September 2016
UKRAINE
BACKGROUND: Ukraine gained independence after the Soviet Union collapsed in 1991. Pro-Euro–Atlantic members of parliament ousted President Victor Yanukovych in February 2014, and Petro Poroshenko was elected to replace him in May. Parliamentary elections in October 2014 led to a pro-European government under Prime Minister Arseniy Yatesenyuk of the center-right People’s Front. In April 2016, Yatesenyuk resigned and was replaced by Volodymyr Groysman. Russia has illegally annexed the Crimea, and Rus-sian-backed separatists continue to destabilize the eastern part of the country. The shaky Minsk II cease-fire agreement remains in effect but is violated daily by the Russian-backed separatists.
U kraine’s economy has contracted deeply and remains very fragile. Ongoing disruptions of the country’s productive
and export capacities and significant capital outflows have put increasing pressure on the currency and reserves, severely undermining monetary stability. The overall soundness of fiscal policy has deteriorated substantially, and public deficits and debt have increased sharply. The rule of law remains fragile and is further undercut by judicial ineffectiveness.
A strong commitment to structural reforms to reduce corrup-tion and open the economy further to Western investment and financial institutions will be crucial in helping to stabilize the economy. The government has launched a comprehensive set of reforms to restore growth, but progress is not yet evident.
NOTABLE SUCCESSES:Trade Freedom and Tax Policy
CONCERNS:Rule of Law, Government Spending,
and Investment Freedom
OVERALL SCORE CHANGE SINCE 2013:
+1.8
POPULATION: 42.7 million
GDP (PPP): $339.5 billion
–9.9% growth in 20155-year compound annual growth –2.1%$7,971 per capita
UNEMPLOYMENT: 9.9%
INFLATION (CPI): 48.7%
FDI INFLOW: $3.0 billion
PUBLIC DEBT: 80.2% of GDP
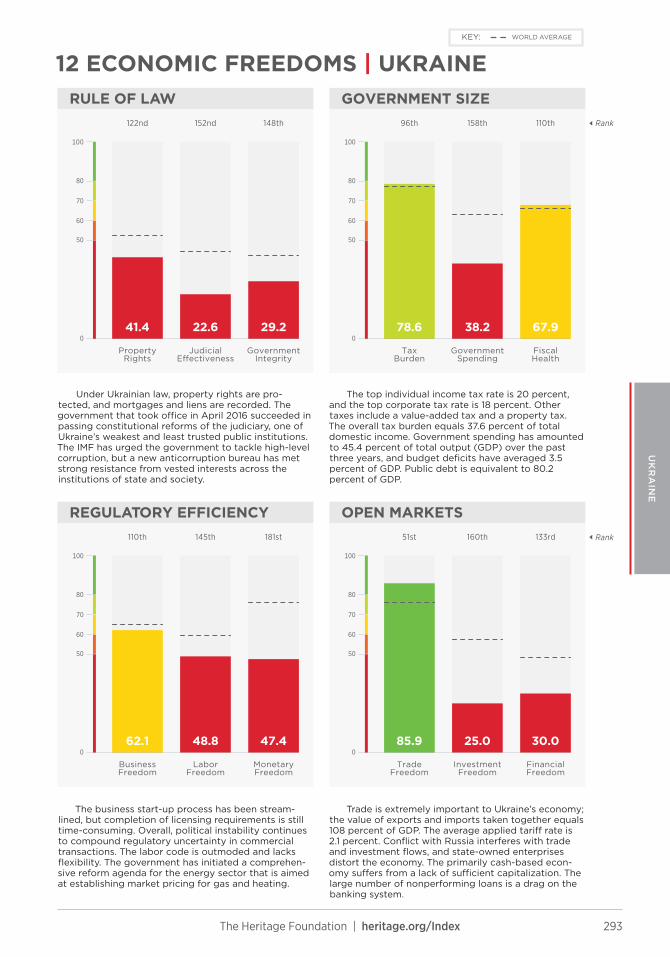
293The Heritage Foundation | heritage.org/Index
WORLD AVERAGEKEY:
RULE OF LAW GOVERNMENT SIZERank
REGULATORY EFFICIENCY OPEN MARKETSRank
Property Rights
Judicial E�ectiveness
Government Integrity
TaxBurden
Government Spending
FiscalHealth
Business Freedom
Labor Freedom
Monetary Freedom
Trade Freedom
Investment Freedom
Financial Freedom
80
60
70
100
50
0
80
60
70
100
50
0
80
60
70
100
50
0
80
60
70
100
50
0
133rd160th51st181st145th110th
110th158th96th148th152nd122nd
30.025.085.947.448.862.1
67.938.278.629.222.641.4
Under Ukrainian law, property rights are pro-tected, and mortgages and liens are recorded. The government that took office in April 2016 succeeded in passing constitutional reforms of the judiciary, one of Ukraine’s weakest and least trusted public institutions. The IMF has urged the government to tackle high-level corruption, but a new anticorruption bureau has met strong resistance from vested interests across the institutions of state and society.
The top individual income tax rate is 20 percent, and the top corporate tax rate is 18 percent. Other taxes include a value-added tax and a property tax. The overall tax burden equals 37.6 percent of total domestic income. Government spending has amounted to 45.4 percent of total output (GDP) over the past three years, and budget deficits have averaged 3.5 percent of GDP. Public debt is equivalent to 80.2 percent of GDP.
The business start-up process has been stream-lined, but completion of licensing requirements is still time-consuming. Overall, political instability continues to compound regulatory uncertainty in commercial transactions. The labor code is outmoded and lacks flexibility. The government has initiated a comprehen-sive reform agenda for the energy sector that is aimed at establishing market pricing for gas and heating.
Trade is extremely important to Ukraine’s economy; the value of exports and imports taken together equals 108 percent of GDP. The average applied tariff rate is 2.1 percent. Conflict with Russia interferes with trade and investment flows, and state-owned enterprises distort the economy. The primarily cash-based econ-omy suffers from a lack of sufficient capitalization. The large number of nonperforming loans is a drag on the banking system.
12 ECONOMIC FREEDOMS | UKRAINE
UK
RA
INE

294 2017 Index of Economic Freedom
ECONOMIC FREEDOM SCORE
FREEDOM TREND QUICK FACTS
80706050 1000
2008 2009 2010 2011 2012 2013 2014 2015 2016 2017
50
60
70
80
90
REGIONAL AVERAGE(EUROPE REGION)
WORLD AVERAGE
60.9 68.0
76.4( NO CHANGE )( NO CHANGE )
MOSTLY FREE
412ECONOMIC FREEDOM STATUS:
REGIONAL RANK: WORLD RANK:
2015 data unless otherwise noted. Data compiled as of September 2016
UNITED KINGDOM
BACKGROUND: Following the market reforms instituted by Prime Minister Margaret Thatcher in the 1980s, Britain experienced steady economic growth throughout the 1990s and is now the world’s fifth-largest economy. Government spending grew significantly under successive Labour governments in the early 2000s but has moderated under Conservative governments since 2010. In June 2016, the U.K. voted in a popular referendum to leave the European Union. The exit vote resulted in the resignation of Prime Minister David Cameron, who was replaced by Theresa May. The overall policy direction of the May government, which has argued for an industrial policy, remains to be seen, but negotiating “Brexit” will undoubtedly be a top priority.
The United Kingdom has demonstrated good economic resilience with effective rule of law, an open trading envi-
ronment, and a well-developed financial sector. A labor market that is relatively liberal by European standards has comple-mented one of the world’s most efficient business and invest-ment environments.
Fiscal consolidation has progressed through spending cuts that have reduced the fiscal deficit to a more manageable though still high level. The U.K. continues to benefit from strong insti-tutional assets such as an independent judiciary and stable currency, and the services sector accounts for 75 percent of the nation’s GDP.
NOTABLE SUCCESSES:Rule of Law, Regulatory Efficiency,
and Open Markets
CONCERNS:Fiscal Health, Government Spending,
and Tax Burden
OVERALL SCORE CHANGE SINCE 2013:
+1.6
POPULATION: 64.9 million
GDP (PPP): $2.7 trillion2.2% growth in 20155-year compound annual growth 2.1%$41,159 per capita
UNEMPLOYMENT: 5.5%
INFLATION (CPI): 0.1%
FDI INFLOW: $39.5 billion
PUBLIC DEBT: 89.3% of GDP
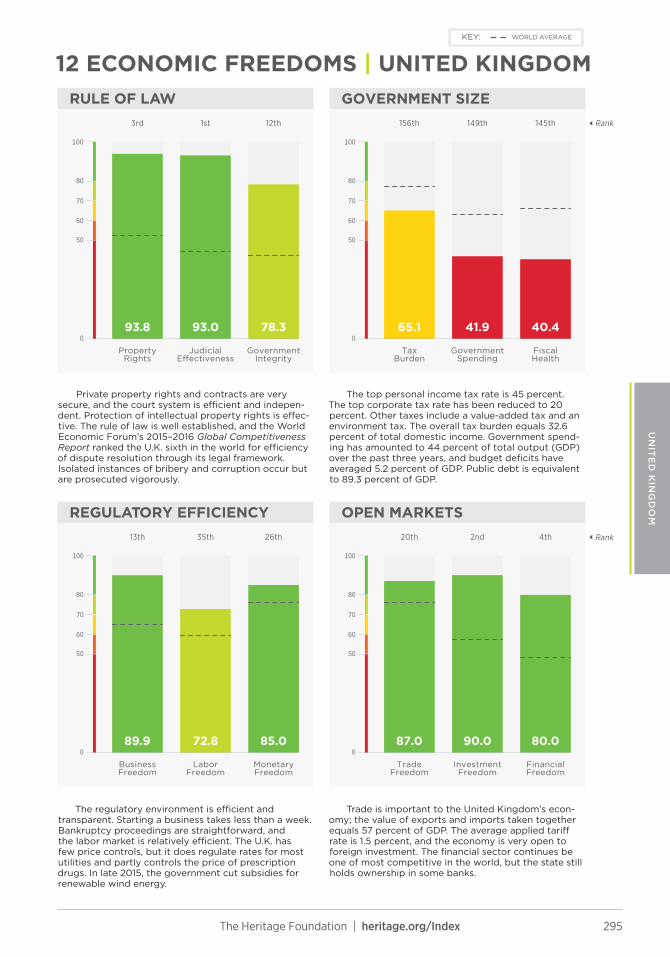
295The Heritage Foundation | heritage.org/Index
WORLD AVERAGEKEY:
RULE OF LAW GOVERNMENT SIZERank
REGULATORY EFFICIENCY OPEN MARKETSRank
Property Rights
Judicial E�ectiveness
Government Integrity
TaxBurden
Government Spending
FiscalHealth
Business Freedom
Labor Freedom
Monetary Freedom
Trade Freedom
Investment Freedom
Financial Freedom
80
60
70
100
50
0
80
60
70
100
50
0
80
60
70
100
50
0
80
60
70
100
50
0
4th2nd20th26th35th13th
145th149th156th12th1st3rd
80.090.087.085.072.889.9
40.441.965.178.393.093.8
Private property rights and contracts are very secure, and the court system is efficient and indepen-dent. Protection of intellectual property rights is effec-tive. The rule of law is well established, and the World Economic Forum’s 2015–2016 Global Competitiveness Report ranked the U.K. sixth in the world for efficiency of dispute resolution through its legal framework. Isolated instances of bribery and corruption occur but are prosecuted vigorously.
The top personal income tax rate is 45 percent. The top corporate tax rate has been reduced to 20 percent. Other taxes include a value-added tax and an environment tax. The overall tax burden equals 32.6 percent of total domestic income. Government spend-ing has amounted to 44 percent of total output (GDP) over the past three years, and budget deficits have averaged 5.2 percent of GDP. Public debt is equivalent to 89.3 percent of GDP.
The regulatory environment is efficient and transparent. Starting a business takes less than a week. Bankruptcy proceedings are straightforward, and the labor market is relatively efficient. The U.K. has few price controls, but it does regulate rates for most utilities and partly controls the price of prescription drugs. In late 2015, the government cut subsidies for renewable wind energy.
Trade is important to the United Kingdom’s econ-omy; the value of exports and imports taken together equals 57 percent of GDP. The average applied tariff rate is 1.5 percent, and the economy is very open to foreign investment. The financial sector continues be one of most competitive in the world, but the state still holds ownership in some banks.
12 ECONOMIC FREEDOMS | UNITED KINGDOM
UN
ITE
D K
ING
DO
M