europe: portfolio strategy the next leg: the path to mid...
TRANSCRIPT

June 19, 2009 Europe: Portfolio Strategy
Goldman Sachs Global Economics, Commodities and Strategy Research 1
June 19, 2009
Europe: Portfolio Strategy
The next leg: The path to mid-cycle valuation
Target of 420 for Stoxx 600 by year-end 2013 We estimate EPS of 28 euros by 2013, assuming that future earnings
growth will drive the ROE back to its historical average of 11.4%. We
anticipate a mid-cycle P/E multiple of 15x by feeding long-run
assumptions on the economy through GS DDM. Historical experience
suggests that the market may pay for some of this in advance.
Upside scenario driven by higher margins We decompose the ROE for non-Financials into leverage, asset turn and
margins. We believe margins for non-Financials may have increased
structurally, while the ROE for Financials is set to decrease. Our base
case assumes that these two effects net out and keep the ROE for the
index unchanged. If the margin increase is in the high end of our
estimated range, it may more than offset the decline in ROE for
Financials. This result gives our upside scenario of a structurally higher
ROE, and an index level of 480.
Downside scenario driven by a higher ERP If the economy is slow to recover, the ERP could still be higher than its
normalized level of 3% by year-end 2013. Although this would likely be
partly offset by bond yields being lower than 5%, it may still lead to a
lower P/E multiple. This possibility drives our downside scenario of an
index level of 364.
Three scenarios for year-end 2013 Stoxx 600 index levels
Index as of June 18, 2009: 206
Downside scenario
Basecase
Upsidescenario
Assumptions (%)Margins 4.8 4.8 6.310-year yield 4.5 5.0 5.0ERP 4.0 3.0 3.0ROE 11.4 11.4 13.0
OutcomesEPS (€) 28 28 32P/E multiple (x) 13 15 15
Market value 364 420 480
Source: Goldman Sachs Global ECS Research.
Anders Nielsen
+44(20)7552-3000 | [email protected] Goldman Sachs International
Sharon Bell, CFA
+44(20)7552-1341 | [email protected] Goldman Sachs International
Peter Oppenheimer
+44(20)7552-5782 | [email protected] Goldman Sachs International
Jessica Binder, CFA
+44(20)7051-0460 | [email protected] Goldman Sachs International
Gerald Moser
+44(20)7774-5725 | [email protected] Goldman Sachs International
The Goldman Sachs Group, Inc. does and seeks to do business with companies covered in its research reports. As a result, investors should be aware that the firm may have a conflict of interest that could affect the objectivity of this report. Investors should consider this report as only a single factor in making their investment decision. For Reg AC certification, see the end of the text. Other important disclosures follow the Reg AC certification, or go to www.gs.com/research/hedge.html. Analysts employed by non-US affiliates are not registered/qualified as research analysts with FINRA in the U.S.
The Goldman Sachs Group, Inc. Goldman Sachs Global Economics, Commodities and Strategy Research

June 19, 2009 Europe: Portfolio Strategy
Goldman Sachs Global Economics, Commodities and Strategy Research 2
Table of contents
Executive summary 3
Our approach to valuing the market at year-end 2013 4
What is the right mid-cycle P/E multiple? 6
What will the level of earnings per share be when the ROE has normalized? 11
What is the time frame to fully reach the normalized index level? 18
Disclosures 21

June 19, 2009 Europe: Portfolio Strategy
Goldman Sachs Global Economics, Commodities and Strategy Research 3
Executive summary
Given the sharp rise in equity prices since March, many investors are now focused on how
much further progress the market can make. The answer to this question lies in
understanding both the likely normalized valuation that the market should trade on, and
what the future level and trajectory of profits growth will be. Of course, at the inflection
point in the market investors tend to lengthen their investment horizons and start to look at
‘mid-cycle’ multiples, paying for a part of this expected future value in advance. In effect,
therefore, the important issues are both what the market is likely to deliver over the period
of normalization in valuations and profits, and how quickly this will happen. On our base
case we expect the Stoxx 600 will reach 420 by the end of 2013, which compares with its
current level of around 206. We divide our analysis into three questions.
Q1: What is the right mid-cycle P/E multiple?
A1: Our base-case estimate is that the market will trade at 15x on normalized earnings. We
estimate this mid-cycle P/E using our GS-DDM framework. The most important drivers are
the equity risk premium (ERP) and the 10-year bond yield. In our base case, we assume a
historical average of 3% for the ERP (from 5.6% currently) and a 5% bond yield. The 5%
bond yield is roughly the result of feeding the consensus macroeconomic outlook through
our economists’ Sudoku model for fair value bond yields. However, our economists
believe that the risks to this are on the downside given the likely profile for growth and
inflation. Under a slow recovery there could be upside risk to the ERP estimate. However,
we believe that this upside risk to the ERP would be partly offset by downside risk to the
bond yield. Nevertheless, if this risk materializes we could end up in our downside
scenario, with a Stoxx 600 index level of 364.
Q2: What will the level of earnings per share be when the ROE has normalized?
A2: Our base-case estimate for the Stoxx 600 is €28 by 2013. This is derived by assuming
that earnings growth will be strong enough to bring the return on equity (ROE) back to its
long run average of 11.4% (measured on a net income basis). We decompose the ROE for
the non-Financial sector into asset turn, leverage and margins to assess the risk around
this average ROE assumption. We believe that the levels of asset turn and leverage over
the next cycle will be comparable to the levels of the last cycle but that there is upside risk
to margins in the non-Financial sectors. In our upside scenario, we increase non-Financial
margins by 150 basis points to 6.3%, based on structural improvements, while keeping
asset turn and leverage constant. At the same time we use an ROE of 10.1% for the
Financial sector (much lower than recent history) to compensate for the lower leverage in
that sector. The result is an upside scenario index level of 480 by 2013.
Q3: What is the time frame to fully reach the normalized index level?
In the aftermath of the last three recessions the maximum time taken for the market to
return to long-run average ERP and ROE from the trough in earnings was 45 and 31
months, respectively. We expect earnings to trough at the end of 2009 and for the market
to reach long-run average value by the end of 2013. This is longer than the historical
experience suggests but is, we believe, realistic given the severity of the current downturn.
This helps us to assess the likely returns that should accrue to investors over the next four
years when we expect normalization of earnings and ‘mid-cycle’ valuations, but it does not
tell us anything about the time profile of those returns in the stock market. We have long
argued that the inflection point in the market, triggered by confidence that the economy
has passed its worst point of deterioration, results in a fall in the ERP and a sharp jump in
equity prices; investors effectively lengthen their investment time horizons and pay
forward for future expected earnings.

June 19, 2009 Europe: Portfolio Strategy
Goldman Sachs Global Economics, Commodities and Strategy Research 4
Our approach to valuing the market at year-end 2013
Given the size of the current economic downturn, the structural changes to the world
economy and the likely upcoming changes in the regulatory environment, investors are
questioning how the market should be valued.
Their questions fall into two parts – first, what the fair value of the market should be today,
given that the risk premium is still high, and earnings likely to fall even further, and second
where the market should trade once the economy has normalized and the next cycle is
well under way.
We have covered the first question at length in the reports “Finding ‘Fair Value’ in Global
Equities; Part I” and “Forecasting returns: ‘Fair Value’ Part II”. Our year-end target for the
Stoxx 600 is 235, representing 14% upside from the current level. In this paper we focus on
the second question.
Our analytical framework is outlined in Exhibit 1. We examine the appropriate mid-cycle
multiple by looking at the discount rate – a function of both the ERP and bond yield. We
analyse the level of earnings by assuming that earnings growth will be high enough to
bring the ROE back to its long-term average. We analyse the potential for structural
changes to the index level ROE. We break it into the ROE for Financials and the ROE for
non-Financials. We then break down the ROE for non-Financials into its components:
margins, asset turnover and leverage.
Exhibit 1: The path to a year-end 2013 target of 420 for the Stoxx 600
P/E, 15x
Stoxx 600 market value: 420 Potential annual price return: 17%
EPS, €28
ERP, 3%
ROE, 11.4%Discount rate, 8%
10-year bond yield, 5% LeverageAsset turnoverMargin
Source: Goldman Sachs Global ECS Research.
The central assumptions give an overall expected index level of 420 for the DJ Stoxx,
which we believe is likely to be reached by the end of 2013, generating an expected
annualized return of 17%. There are, of course, risks around this central case. Exhibit 2
summarises what we believe to be the most likely ranges based on upside and downside
scenarios.
June 19, 2009 Europe: Portfolio Strategy
Goldman Sachs Global Economics, Commodities and Strategy Research 5
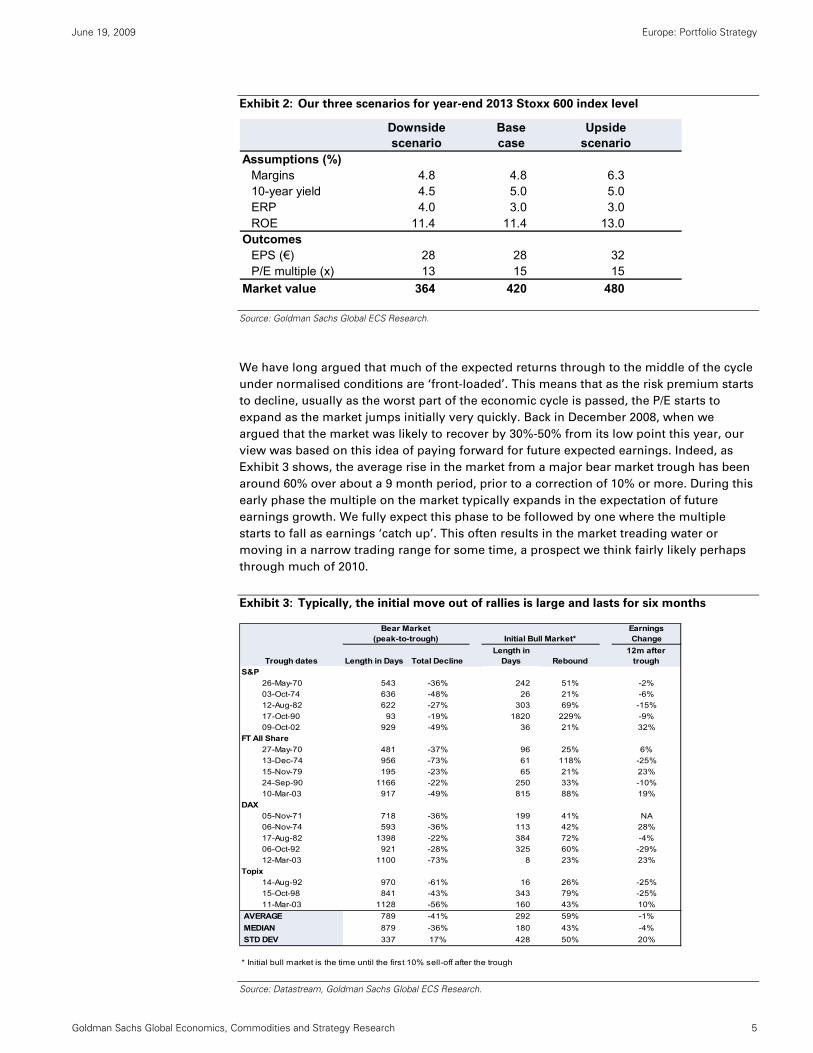
Exhibit 2: Our three scenarios for year-end 2013 Stoxx 600 index level
Downside scenario
Basecase
Upsidescenario
Assumptions (%)Margins 4.8 4.8 6.310-year yield 4.5 5.0 5.0ERP 4.0 3.0 3.0ROE 11.4 11.4 13.0
OutcomesEPS (€) 28 28 32P/E multiple (x) 13 15 15
Market value 364 420 480
Source: Goldman Sachs Global ECS Research.
We have long argued that much of the expected returns through to the middle of the cycle
under normalised conditions are ‘front-loaded’. This means that as the risk premium starts
to decline, usually as the worst part of the economic cycle is passed, the P/E starts to
expand as the market jumps initially very quickly. Back in December 2008, when we
argued that the market was likely to recover by 30%-50% from its low point this year, our
view was based on this idea of paying forward for future expected earnings. Indeed, as
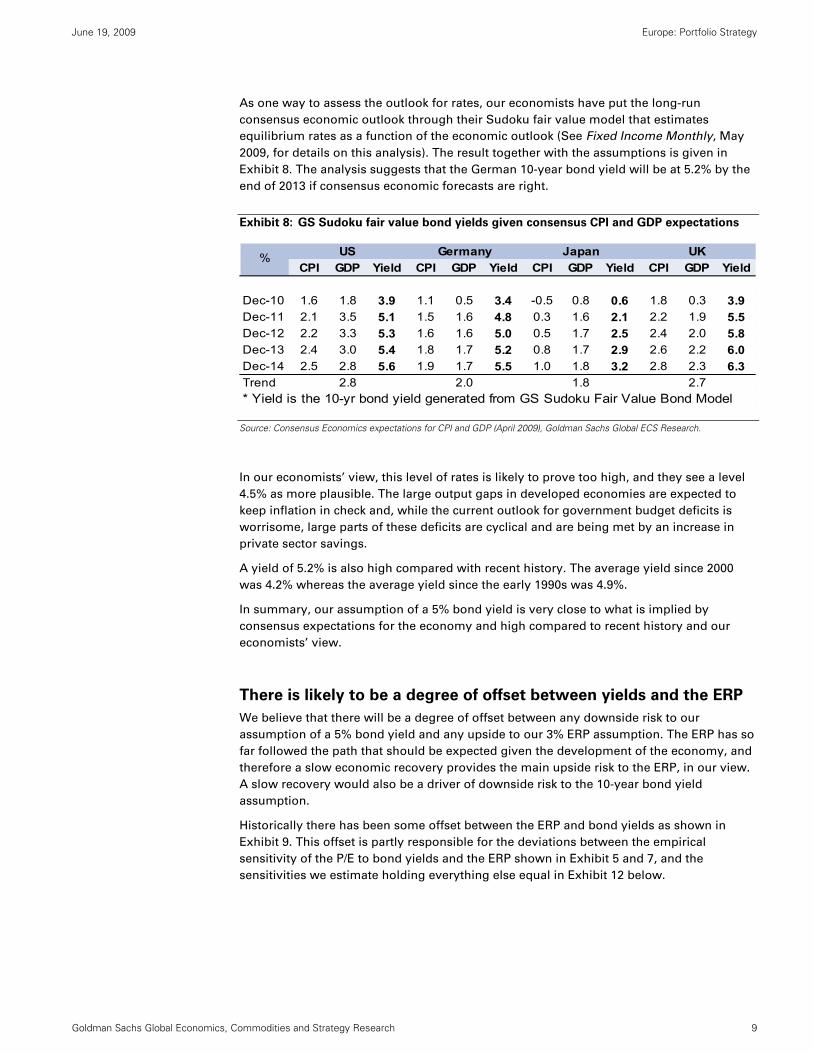
Exhibit 3 shows, the average rise in the market from a major bear market trough has been
around 60% over about a 9 month period, prior to a correction of 10% or more. During this
early phase the multiple on the market typically expands in the expectation of future
earnings growth. We fully expect this phase to be followed by one where the multiple
starts to fall as earnings ‘catch up’. This often results in the market treading water or
moving in a narrow trading range for some time, a prospect we think fairly likely perhaps
through much of 2010.
Exhibit 3: Typically, the initial move out of rallies is large and lasts for six months
Bear Market(peak-to-trough) Initial Bull Market*
Earnings Change
Length in Days Total DeclineLength in
Days Rebound12m after
troughS&P
26-May-70 543 -36% 242 51% -2%03-Oct-74 636 -48% 26 21% -6%12-Aug-82 622 -27% 303 69% -15%17-Oct-90 93 -19% 1820 229% -9%09-Oct-02 929 -49% 36 21% 32%
FT All Share27-May-70 481 -37% 96 25% 6%13-Dec-74 956 -73% 61 118% -25%15-Nov-79 195 -23% 65 21% 23%24-Sep-90 1166 -22% 250 33% -10%10-Mar-03 917 -49% 815 88% 19%
DAX05-Nov-71 718 -36% 199 41% NA06-Nov-74 593 -36% 113 42% 28%17-Aug-82 1398 -22% 384 72% -4%06-Oct-92 921 -28% 325 60% -29%12-Mar-03 1100 -73% 8 23% 23%
Topix14-Aug-92 970 -61% 16 26% -25%15-Oct-98 841 -43% 343 79% -25%11-Mar-03 1128 -56% 160 43% 10%
AVERAGE 789 -41% 292 59% -1% MEDIAN 879 -36% 180 43% -4% STD DEV 337 17% 428 50% 20% * Initial bull market is the time until the first 10% sell-off after the trough
Trough dates
Source: Datastream, Goldman Sachs Global ECS Research.

June 19, 2009 Europe: Portfolio Strategy
Goldman Sachs Global Economics, Commodities and Strategy Research 6
In this report, rather than focusing on the specific profile of the returns, we are more
concerned with looking at the aggregate returns through the period until normalization in
valuations and earnings is reached, which we expect by the end of 2013. Specifically there
are three key questions we focus on in:
• What is the right mid-cycle P/E multiple?
• What will the level of earnings per share be when the ROE has normalized?
• What is the time frame to fully reach the normalized index level?
What is the right mid-cycle P/E multiple?
Our year-end 2013 target P/E of 15x is derived by assuming a discount rate of 8%,
split between a 3% ERP and a 5% 10-year German bond yield. In this cycle, the ERP
has increased in line with what should be expected given the economic deterioration
and we therefore believe that it is also likely to return to its 3% normalized level when
the economy recovers. The 5% bond yield assumption is in line with the results of
feeding the current consensus economic outlook through our economists’ Sudoku fair
value model for bond yields.
The simplest approach to estimating a mid-cycle P/E would be to take the long-term
average historical P/E. This simple approach is complicated by the fact that the P/E, while
being impacted by the cycle, also responds to slower moving trends such as the reduction
in real bond yields and inflation that has occurred over the last 30 years (Exhibit 4), making
an average somewhat misleading.
Exhibit 4: Europe P/E – trended up from 1988 to 2000 and has trended down since 2000
5
7
9
11
13
15
17
19
21
23
25
88 90 92 94 96 98 00 02 04 06 08
12 month forw ard P/E
DJ Stoxx 600
Source: I/B/E/S, Goldman Sachs Global ECS Research.
We account for the trends in inflation and bond yields using our GS DDM framework. Here
the most important drivers of the P/E multiple are the 10-year bond yield and the ERP, and
we therefore analyze the impact of each of these variables in detail.

June 19, 2009 Europe: Portfolio Strategy
Goldman Sachs Global Economics, Commodities and Strategy Research 7
The ERP: 3% is our base case, but the risks are to the upside
The importance of the relationship between the ERP and the P/E multiple can be seen from
the scatter plot in Exhibit 5. On average, an increase in the ERP of 1pp has been associated
with a decrease of 1.2 multiple points in the P/E.
Exhibit 5: A 1pp increase in the ERP corresponds to a 1.2 multiple point P/E contraction
12 month trailing P/E plotted against the ERP, 1989-2009
PE vs ERP
y = -1.224x + 19.551R2 = 0.2891
5
10
15
20
25
30
-1 0 1 2 3 4 5 6 7 8 9ERP (%)
P/E
Source: Datastream, Goldman Sachs Global ECS Research.
We believe that a return to the long-run average ERP by the end of 2013 is the most
reasonable point forecast, but we see the risks to that forecast as being skewed to the
upside. Equity investors have just been through a decade of very low returns, and a crisis
that has emphasized the risk of holding equities. This combined history of low returns and
high risk could lead to investors demanding a higher risk premium going forward.
Furthermore, the degree of government intervention necessary to contain the crisis, has
created a strong demand for regulatory reforms, particularly in the Financial sector. This
uncertainty about the future regulatory regime, and its impact on the long-run value of the
stock market, could also lead to demands for a higher equity risk premium.
An encouraging sign in this respect is that the increase in the ERP we have seen so far this
cycle has been in line with what should have been expected given the deterioration in the
economy. The flip side of this is that the ERP is likely to normalize once the economy does.
This is represented in Exhibit 6, which shows the ERP implied by the observed market
prices together with the ERP that we would predict given our model of the historical
relationship between the ERP, the output gap and the ERP a year ago (for details on this
model see “Forecasting returns: ‘Fair Value’ Part II”).

June 19, 2009 Europe: Portfolio Strategy
Goldman Sachs Global Economics, Commodities and Strategy Research 8
Exhibit 6: The increase in the implied ERP has tracked the economic deterioration
Implied and fitted ERP from GS DDM
Continental Europe
-1
0
1
2
3
4
5
6
7
8
Dec-88 Dec-91 Dec-94 Dec-97 Dec-00 Dec-03 Dec-06 Dec-09Implied ERP Predicted ERP
Source: Goldman Sachs Global ECS Research.
10-year yield: 5% is our base case, but the risks are to the downside
The 10-year bond yield has a similar correlation with the P/E as the ERP has. Exhibit 7
shows that a 1pp rise in the bond yield has been associated with a 1.2 multiple point
decline in the P/E multiple.
Exhibit 7: A 1pp increase in the 10-year yield corresponds to a 1.2 point P/E contraction
12 month trailing P/E plotted against the 10-year German bond yield
PE vs 10 year bond yieldsy = -1.1628x + 21.388R2 = 0.293
0
5
10
15
20
25
30
3 4 5 6 7 8 9 10 11 12Bond yields (%)
P/E
Source: Datastream, Haver Analytics, Goldman Sachs Global ECS Research.
The long-run outlook for interest rates is heavily debated as investors are divided between
those concerned about inflation and those concerned about deflation.
June 19, 2009 Europe: Portfolio Strategy
Goldman Sachs Global Economics, Commodities and Strategy Research 9
As one way to assess the outlook for rates, our economists have put the long-run
consensus economic outlook through their Sudoku fair value model that estimates
equilibrium rates as a function of the economic outlook (See Fixed Income Monthly, May
2009, for details on this analysis). The result together with the assumptions is given in
Exhibit 8. The analysis suggests that the German 10-year bond yield will be at 5.2% by the
end of 2013 if consensus economic forecasts are right.
Exhibit 8: GS Sudoku fair value bond yields given consensus CPI and GDP expectations
CPI GDP Yield CPI GDP Yield CPI GDP Yield CPI GDP Yield
Dec-10 1.6 1.8 3.9 1.1 0.5 3.4 -0.5 0.8 0.6 1.8 0.3 3.9Dec-11 2.1 3.5 5.1 1.5 1.6 4.8 0.3 1.6 2.1 2.2 1.9 5.5Dec-12 2.2 3.3 5.3 1.6 1.6 5.0 0.5 1.7 2.5 2.4 2.0 5.8Dec-13 2.4 3.0 5.4 1.8 1.7 5.2 0.8 1.7 2.9 2.6 2.2 6.0Dec-14 2.5 2.8 5.6 1.9 1.7 5.5 1.0 1.8 3.2 2.8 2.3 6.3Trend 2.8 2.0 1.8 2.7* Yield is the 10-yr bond yield generated from GS Sudoku Fair Value Bond Model
% US UKJapanGermany
Source: Consensus Economics expectations for CPI and GDP (April 2009), Goldman Sachs Global ECS Research.
In our economists’ view, this level of rates is likely to prove too high, and they see a level
4.5% as more plausible. The large output gaps in developed economies are expected to
keep inflation in check and, while the current outlook for government budget deficits is
worrisome, large parts of these deficits are cyclical and are being met by an increase in
private sector savings.
A yield of 5.2% is also high compared with recent history. The average yield since 2000
was 4.2% whereas the average yield since the early 1990s was 4.9%.
In summary, our assumption of a 5% bond yield is very close to what is implied by
consensus expectations for the economy and high compared to recent history and our
economists’ view.
There is likely to be a degree of offset between yields and the ERP
We believe that there will be a degree of offset between any downside risk to our
assumption of a 5% bond yield and any upside to our 3% ERP assumption. The ERP has so
far followed the path that should be expected given the development of the economy, and
therefore a slow economic recovery provides the main upside risk to the ERP, in our view.
A slow recovery would also be a driver of downside risk to the 10-year bond yield
assumption.
Historically there has been some offset between the ERP and bond yields as shown in
Exhibit 9. This offset is partly responsible for the deviations between the empirical
sensitivity of the P/E to bond yields and the ERP shown in Exhibit 5 and 7, and the
sensitivities we estimate holding everything else equal in Exhibit 12 below.

June 19, 2009 Europe: Portfolio Strategy
Goldman Sachs Global Economics, Commodities and Strategy Research 10
Exhibit 9: There has been a degree of offset between the ERP and 10-year bond yield
1989-2009
y = -0.4842x + 7.1315R2 = 0.2204
2
3
4
5
6
7
8
9
10
-1 0 1 2 3 4 5 6 7 8
10 yr bond yield, %
ERP, %
Source: Haver Analytics, Worldscope, Goldman Sachs Global ECS Research.
This offset is not stable, however. There was virtually no relationship between the ERP and
the 10-year nominal bond yield from 1989 (where our ERP time series begins) until the end
of 2000 (Exhibit 10), but a strong relationship from 2001 to 2009 (Exhibit 11). We believe
that the difference is related to the sources of shocks to the economy. Inflation shocks
should push both the ERP and yields up, whereas growth shocks should increase yields
and decrease the ERP. It is likely that growth shocks have become relatively more
important, as central bank credibility has improved, and led to a larger degree of observed
offset between bond yields and the ERP. This interpretation is consistent with the findings
in our May 22 Strategy Matters, “The bond-equity correlation: Not a threat to equities”,
where we showed that the correlation between bond yields and equities prices had shifted
upwards over the last cycle.
Exhibit 10: The offset was absent in 1989-2000 Exhibit 11: But was strong in 2001-2009
1989-2000y = 0.0894x + 6.437
R2 = 0.0078
3
4
5
6
7
8
9
10
-1 0 1 2 3 4 5ERP
10 yr bond yield, %
2001-2009
y = -0.3153x + 5.5239R2 = 0.5435
3.0
3.5
4.0
4.5
5.0
5.5
0 2 4 6 8 10ERP
10 yr bond yield, %
Source: Haver Analytics, Worldscope, Goldman Sachs Global ECS Research.
Source: Haver Analytics, Worldscope, Goldman Sachs Global ECS Research.

June 19, 2009 Europe: Portfolio Strategy
Goldman Sachs Global Economics, Commodities and Strategy Research 11
Sensitivity analysis
We estimate the sensitivity of our P/E multiple and index level forecasts to changes in the
ERP and the 10-year nominal bond yield in Exhibits 12 and 13. For a fixed 10-year bond
yield of 5%, an ERP of 2% would lead to a market value of 551 whereas an ERP of 4%
would give a value of 332. We consider both of these values for the ERP within the set of
reasonable possibilities, but as noted in the previous section, any valuation impact of a
higher or lower ERP is likely to be partly offset by changes in the 10-year bond yield.
Exhibit 12: P/E sensitivity to ERP and 10-year bond yield Exhibit 13: Year-end 2013 market level sensitivity to ERP
and 10-year yield
ERP 4.0% 4.5% 5.0% 5.5% 6.0%2.0% 26.9 22.8 19.6 17.0 14.92.5 22.8 19.6 17.0 14.9 13.23.0 19.6 17.0 14.9 13.2 11.83.5 17.0 14.9 13.2 11.8 10.64.0 14.9 13.2 11.8 10.6 9.6
10 ye a r bond yie ld
ERP 4.0% 4.5% 5.0% 5.5% 6.0%2.0% 759 642 551 478 4202.5 642 551 478 420 3723.0 551 478 420 372 3323.5 478 420 372 332 2984.0 420 372 332 298 270
10 year bond yield
Source: Goldman Sachs Global ECS Research.
Source: Goldman Sachs Global ECS Research.
What will the level of earnings per share be when the ROE has normalized?
Our base case is for year-end 2013 earnings per share to be €28 for the DJ Stoxx 600.
This is derived assuming that the index level ROE will return to its long-run average of
11.4% on a net income basis. To understand the risks to this estimate we analyze the
drivers of the ROE. For non-Financials we divide the ROE into its three components:
margins, asset turn and leverage. We believe that asset turn and leverage in the next
cycle will be comparable to the last, whereas margins could surprise on the upside by
around 150 bp versus the long-run average. For the market ex financials, that could
push trend ROE up to 14.6%. For Financials, we expect the ROE to decline. Our
analysis suggests that an 11.4% ROE for the index overall is conservative.
In our GS DDM framework the long-term average ROE is used as an anchor for earnings.
The reason is that the ROE has a strong tendency to mean revert (see Exhibit 19 below),
and therefore provides a guide to the catch-up earnings growth that can reasonably be
expected from the trough of the cycle.
We model the catch-up earnings growth as the growth rate that will bring the ROE back to
its long-run average by the end of 2013, assuming that the part of earnings which are not
paid out as dividends each period will be added to common equity.
We believe that the long-term average ROE is a good starting point to assess mid-cycle
earnings, but the forces of globalization and restructuring of the financial system raise the
question of whether the ROE could be structurally different over the next cycle. We analyze
the components of the ROE in detail, and conclude that while an ROE of 11.4% is within the
set of reasonable possibilities, the risks to that estimate are skewed to the upside. This
upside risk is reflected in our upside scenario of an index level of 480.
June 19, 2009 Europe: Portfolio Strategy
Goldman Sachs Global Economics, Commodities and Strategy Research 12
Net margins in non-Financials could average 6.3% in the next cycle
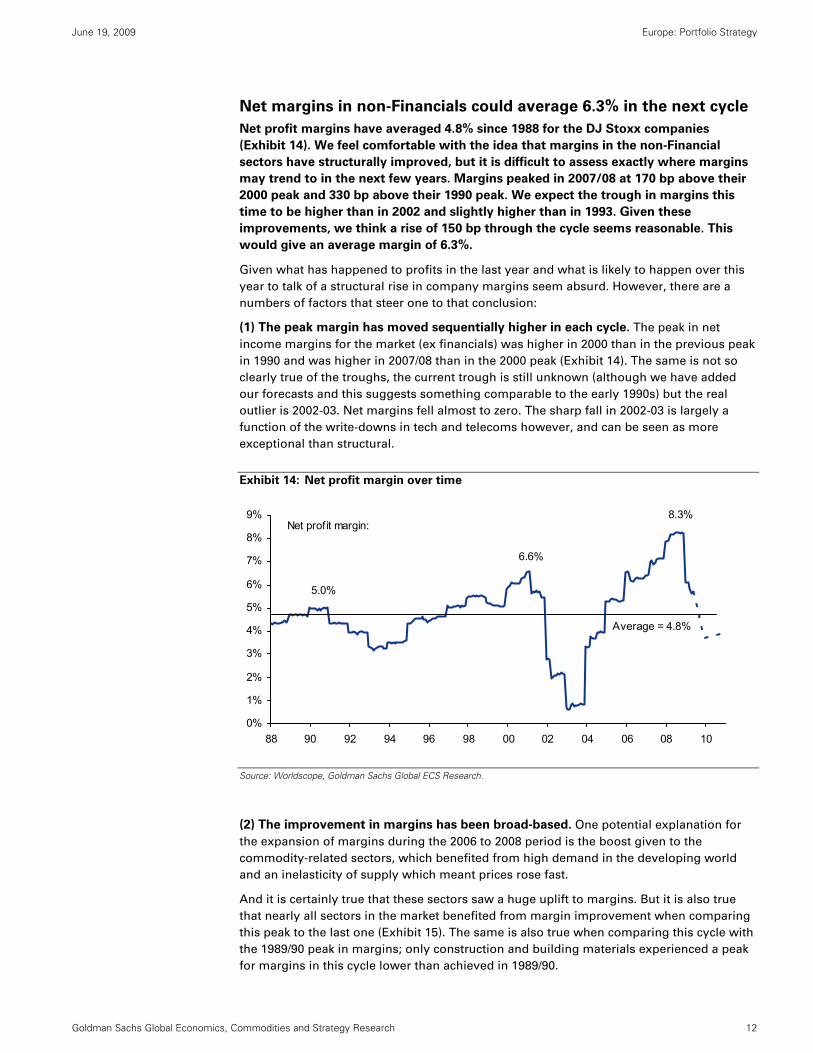
Net profit margins have averaged 4.8% since 1988 for the DJ Stoxx companies
(Exhibit 14). We feel comfortable with the idea that margins in the non-Financial
sectors have structurally improved, but it is difficult to assess exactly where margins
may trend to in the next few years. Margins peaked in 2007/08 at 170 bp above their
2000 peak and 330 bp above their 1990 peak. We expect the trough in margins this
time to be higher than in 2002 and slightly higher than in 1993. Given these
improvements, we think a rise of 150 bp through the cycle seems reasonable. This
would give an average margin of 6.3%.
Given what has happened to profits in the last year and what is likely to happen over this
year to talk of a structural rise in company margins seem absurd. However, there are a
numbers of factors that steer one to that conclusion:
(1) The peak margin has moved sequentially higher in each cycle. The peak in net
income margins for the market (ex financials) was higher in 2000 than in the previous peak
in 1990 and was higher in 2007/08 than in the 2000 peak (Exhibit 14). The same is not so
clearly true of the troughs, the current trough is still unknown (although we have added
our forecasts and this suggests something comparable to the early 1990s) but the real
outlier is 2002-03. Net margins fell almost to zero. The sharp fall in 2002-03 is largely a
function of the write-downs in tech and telecoms however, and can be seen as more
exceptional than structural.
Exhibit 14: Net profit margin over time
0%
1%
2%
3%
4%
5%
6%
7%
8%
9%
88 90 92 94 96 98 00 02 04 06 08 10
Net profit margin:
Average = 4.8%
5.0%
6.6%
8.3%
Source: Worldscope, Goldman Sachs Global ECS Research.
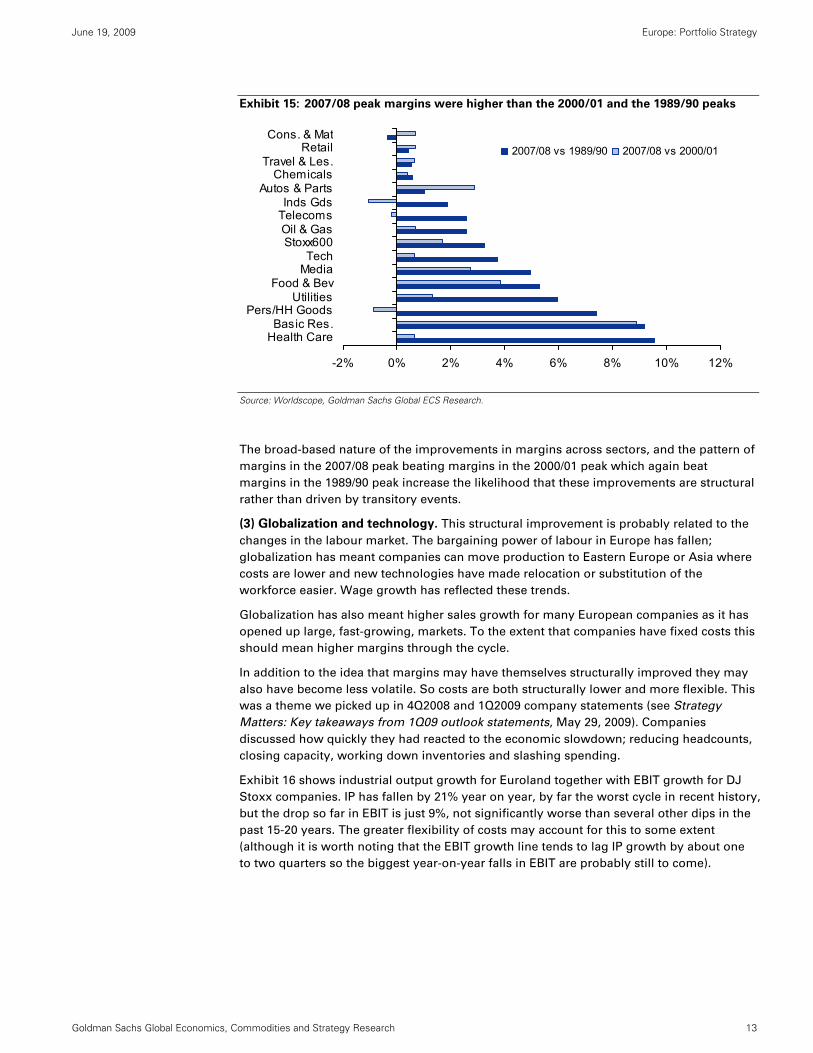
(2) The improvement in margins has been broad-based. One potential explanation for
the expansion of margins during the 2006 to 2008 period is the boost given to the
commodity-related sectors, which benefited from high demand in the developing world
and an inelasticity of supply which meant prices rose fast.
And it is certainly true that these sectors saw a huge uplift to margins. But it is also true
that nearly all sectors in the market benefited from margin improvement when comparing
this peak to the last one (Exhibit 15). The same is also true when comparing this cycle with
the 1989/90 peak in margins; only construction and building materials experienced a peak
for margins in this cycle lower than achieved in 1989/90.
June 19, 2009 Europe: Portfolio Strategy
Goldman Sachs Global Economics, Commodities and Strategy Research 13
Exhibit 15: 2007/08 peak margins were higher than the 2000/01 and the 1989/90 peaks
-2% 0% 2% 4% 6% 8% 10% 12%
Health CareBasic Res.
Pers/HH GoodsUtilities
Food & BevMediaTech
Stoxx600Oil & GasTelecomsInds Gds
Autos & PartsChemicals
Travel & Les.Retail
Cons. & Mat2007/08 vs 1989/90 2007/08 vs 2000/01
Source: Worldscope, Goldman Sachs Global ECS Research.
The broad-based nature of the improvements in margins across sectors, and the pattern of
margins in the 2007/08 peak beating margins in the 2000/01 peak which again beat
margins in the 1989/90 peak increase the likelihood that these improvements are structural
rather than driven by transitory events.
(3) Globalization and technology. This structural improvement is probably related to the
changes in the labour market. The bargaining power of labour in Europe has fallen;
globalization has meant companies can move production to Eastern Europe or Asia where
costs are lower and new technologies have made relocation or substitution of the
workforce easier. Wage growth has reflected these trends.
Globalization has also meant higher sales growth for many European companies as it has
opened up large, fast-growing, markets. To the extent that companies have fixed costs this
should mean higher margins through the cycle.
In addition to the idea that margins may have themselves structurally improved they may
also have become less volatile. So costs are both structurally lower and more flexible. This
was a theme we picked up in 4Q2008 and 1Q2009 company statements (see Strategy
Matters: Key takeaways from 1Q09 outlook statements, May 29, 2009). Companies
discussed how quickly they had reacted to the economic slowdown; reducing headcounts,
closing capacity, working down inventories and slashing spending.
Exhibit 16 shows industrial output growth for Euroland together with EBIT growth for DJ
Stoxx companies. IP has fallen by 21% year on year, by far the worst cycle in recent history,
but the drop so far in EBIT is just 9%, not significantly worse than several other dips in the
past 15-20 years. The greater flexibility of costs may account for this to some extent
(although it is worth noting that the EBIT growth line tends to lag IP growth by about one
to two quarters so the biggest year-on-year falls in EBIT are probably still to come).

June 19, 2009 Europe: Portfolio Strategy
Goldman Sachs Global Economics, Commodities and Strategy Research 14
Exhibit 16: The fall so far in EBIT has been small when compared with the collapse in IP
-25%
-20%
-15%
-10%
-5%
0%
5%
10%
15%
89 90 91 92 93 94 95 96 97 98 99 00 01 02 03 04 05 06 07 08 09-30%
-20%
-10%
0%
10%
20%
30%
IP grow th EBIT grow th ex w rite-dow ns (RHS)
Source: Worldscope, Haver Analytics, Goldman Sachs Global ECS Research.
Asset turn – on par with the recent history at 0.77x
Asset turnover has declined sharply since the 1980s; companies are making fewer sales for
each unit of assets on their balance sheets (Exhibit 17).
Exhibit 17: Adjusting asset turnover for the replacement costs of assets
0.55
0.60
0.65
0.70
0.75
0.80
0.85
0.90
0.95
Dec-88 Dec-90 Dec-92 Dec-94 Dec-96 Dec-98 Dec-00 Dec-02 Dec-04 Dec-06 Dec-08
Asset turnover (Sales/Assets at replacement cost)
Asset turnover (Sales/Assets at book value)
Source: Worldscope, Goldman Sachs Global ECS Research.
This seems strange, given that one would expect improved productivity over time.
However, two factors have affected the measurement of assets, effectively resulting in
more assets being recognized on company balance sheets:
• Accounting changes. There has been an ongoing push by accounting standards
authorities and regulators to recognize more assets on company balance sheets. One

June 19, 2009 Europe: Portfolio Strategy
Goldman Sachs Global Economics, Commodities and Strategy Research 15
example is the move to IFRS accounting where goodwill is not amortized but subject
to an impairment test/review every year.
• Falling inflation. Inflation affects the value of assets on the balance sheet because
assets are held at historical cost (book value) rather than replacement cost. Inflation
was higher on average in the 1980s and early 1990s and this means that the assets as
valued on the balance sheet in say 1990 or 1995 would underestimate pretty
substantially what it would have cost back then to replace those assets.
In the light blue line in Exhibit 17, we have estimated replacement cost of assets at each
point in time and compared this with sales. This is a rough measure only but it shows that
on a replacement cost basis there has been no downward trend. (This measure will always
be lower so long as inflation has been positive as the replacement value of assets is higher
than the historical book value.)
In the future we would expect asset turnover to be similar to the average since 2006 (0.77x)
when inflation rates and accounting standards have been relatively stable.
Financial leverage (outside the financials) has been stable
In contrast to the banks where financial leverage expanded rapidly from 2003
onwards, for the market ex financials the ratio of assets on the balance sheet to
common equity has remained pretty constant over the last 20 years in a range
between 2.8x and 3.2x.
We are currently toward the top of that historical range, but that is due to a sudden tick-up
in financial leverage that has been driven to a large extent by big moves in about six
companies rather than a widespread increase across the entire market (see Exhibit 18).
Whatever the underlying cause, we would expect financial leverage to come down
relatively quickly in the next year as companies carry out more rights and new equity
issues to restore balance sheet strength.
For the average over the next cycle we would regard 3x common equity as an appropriate
leverage ratio for the non-financials. There are, however, some downside risks to this if
companies de-leverage more in this cycle given the problems they have experienced
gaining assess to the credit markets and bank debt over the last 18 months.
Exhibit 18: Financial leverage for Europe
2.4
2.6
2.8
3.0
3.2
3.4
3.6
3.8
4.0
88 90 92 94 96 98 00 02 04 06 0818
20
22
24
26
28
30
32
Market ex f inancials Banks (RHS)
Total assets / Shareholders equity
Source: Worldscope, Datastream, Goldman Sachs Global ECS Research.

June 19, 2009 Europe: Portfolio Strategy
Goldman Sachs Global Economics, Commodities and Strategy Research 16
Could trend ROE have risen in the non-financial sectors?
The average ROE ex Financials has been 11.9% but if margins have improved the mid-
cycle or trend level in the next cycle could be as high as 14%-15%.
Based on the analysis above we make the following assumptions for trend of mid-cycle
ROE for non-financials: (1) financial leverage falls slightly to 3x as companies rebuild
balance sheets; (2) asset turnover stays at 0.77x, the average of the last three years, a point
since which inflation and accounting standards have not moved markedly; and (3) net
profit margins return to their long-run average of 4.8%. This would give us a mid-cycle
ROE of 11.1% for the market ex financials.
But this may understate the true level at which ROE could trend to as it doesn’t allow for
any structural improvement in margins. From the discussion above, we think a rise in
margins of 150 bp on average through the cycle is not implausible; this would push
margins up to 6.3% and, without changing asset turn or financial leverage, that would
mean a mid-cycle ROE of 14.6%, which we would expect to be achieved by around 2013.
Exhibit 19: ROE ex financials with forecasts
0%
2%
4%
6%
8%
10%
12%
14%
16%
18%
20%
88 90 92 94 96 98 00 02 04 06 08 10 12
History of ROE
Our explicit ROE forecasts
Source: Worldscope, Goldman Sachs Global ECS Research.
But it may be that financial leverage of the non-Financial sector falls below the long-term
average of 3x – companies have been badly impacted by the effective closing down of the
credit markets for some months and this may discourage many from gearing up their
balance sheets. The low in terms of financial leverage in recent years has been about 2.8x.
Using this, but assuming higher margins (6.3%), would give us a mid-cycle ROE of 12.4%
for the market ex financials.
ROE of Financials is likely to decrease
The largest question mark over long-term earnings for the Stoxx 600 index is the earnings
power of Financials.
During 2003-2007, Financials contributed on average 33% on the total earnings of the
Stoxx 600 index. This was significantly above the average contribution of 25.6% of total
index level earnings in 1993-2000. This rise in earnings was matched by a significant
increase in the ROE of the Financial sector (Exhibit 20).

June 19, 2009 Europe: Portfolio Strategy
Goldman Sachs Global Economics, Commodities and Strategy Research 17
Exhibit 20: The ROE of Financials was higher in the last cycle
-10%
-5%
0%
5%
10%
15%
20%
88 90 92 94 96 98 00 02 04 06 08
ROE Financials
Source. Worldscope, Goldman Sachs Global ECS Research.
The increase in earnings contribution and ROE was fuelled by an increase in leverage as
shown in Exhibit 18 above. Going forward there is significant uncertainty about the
regulatory framework but it is reasonable to expect that leverage and earnings will be
lower.
Given the level of uncertainty, the precise impact is very hard to estimate and we therefore
limit ourselves to a back of the envelope calculation. To assess whether our base case of
an ROE for the index of 11.4% is realistic, we assume that the ROE of Financials falls back
to the 1993-2000 average and then ask what the ROE of non-Financials has to be in order
for the market ROE (which would be the common equity weighted average of the two) to
be 11.4%.
In 1993-2000, the average ROE of the Financial sector was 10.1%, much lower than the
12.9% average during 2003-2007. Currently the common equity of Financials constitutes
35% of the total common equity of the index. If we assume that the ROE on Financials falls
back to the 10.1% average, we would need an ROE of 12.1% for the Stoxx 600 ex Financials
in order for the ROE of the Stoxx 600 index overall to equal 11.4% (0.35*10.1% +
0.65*12.1% = 11.4%).
A 12% ROE in the non-Financial sectors is within the range of possible ROEs discussed
in the previous section. If margins in non-Financials increase 150 bp so that the ROE in
the non-Financial sectors reach the high-end of the range at 14.6%, and the ROE of
Financials still fall to 10.1% the ROE for the market overall would be 13.0%. This
possibility is the basis for our upside scenario of an index level of 480.
Crises often see the earnings power of particular sectors reduced. Yet, the ROE of the
index overall has had a strong tendency to mean revert as new sectors have taken over the
generation of earnings from the sectors in decline.
In the next cycle we believe that there will be stronger than average earnings in the
commodities sector and in companies with high exposure to the faster growth of the BRICs
economies. Our analysis suggests that this will more than compensate for the drop in the
earnings of Financials. We therefore see our assumption of a historical average ROE for
the index overall as somewhat conservative.
June 19, 2009 Europe: Portfolio Strategy
Goldman Sachs Global Economics, Commodities and Strategy Research 18
ROE sensitivity analysis
Exhibits 21 and 22 provide a more detailed analysis of the sensitivity of the year-end 2013
index level to changes in the long-run ROE. As stressed above, the main effect of a higher
ROE is an increase in earnings. That is the reason why the ROE has a limited effect on the
P/E multiple but still a significant impact on the market level (see Exhibit 22). For example,
a change in long-run ROE from 9.4% to 13.4% at an 8% discount rate will increase the P/E
multiple only one point, but move the value of the Stoxx 600 from 342 to 505.
Exhibit 21: P/E sensitivity to the discount rate and ROE Exhibit 22: Year-end 2013 market level sensitivity to the
discount rate and ROE
DiscountRate 9.4 10.4 11.4 12.4 13.46% 26.1 26.5 27.0 27.4 27.97 18.9 19.2 19.6 19.9 20.28 14.4 14.7 14.9 15.2 15.49 11.4 11.6 11.8 12.0 12.2
10 9.3 9.4 9.6 9.7 9.9
Long Run ROE
DiscountRate 9.4 10.4 11.4 12.4 13.46% 618 684 759 834 9137 449 497 551 605 6638 342 379 420 461 5059 271 300 332 365 399
10 220 244 270 297 325
Long Run ROE
Source: Goldman Sachs Global ECS Research.
Source: Goldman Sachs Global ECS Research.
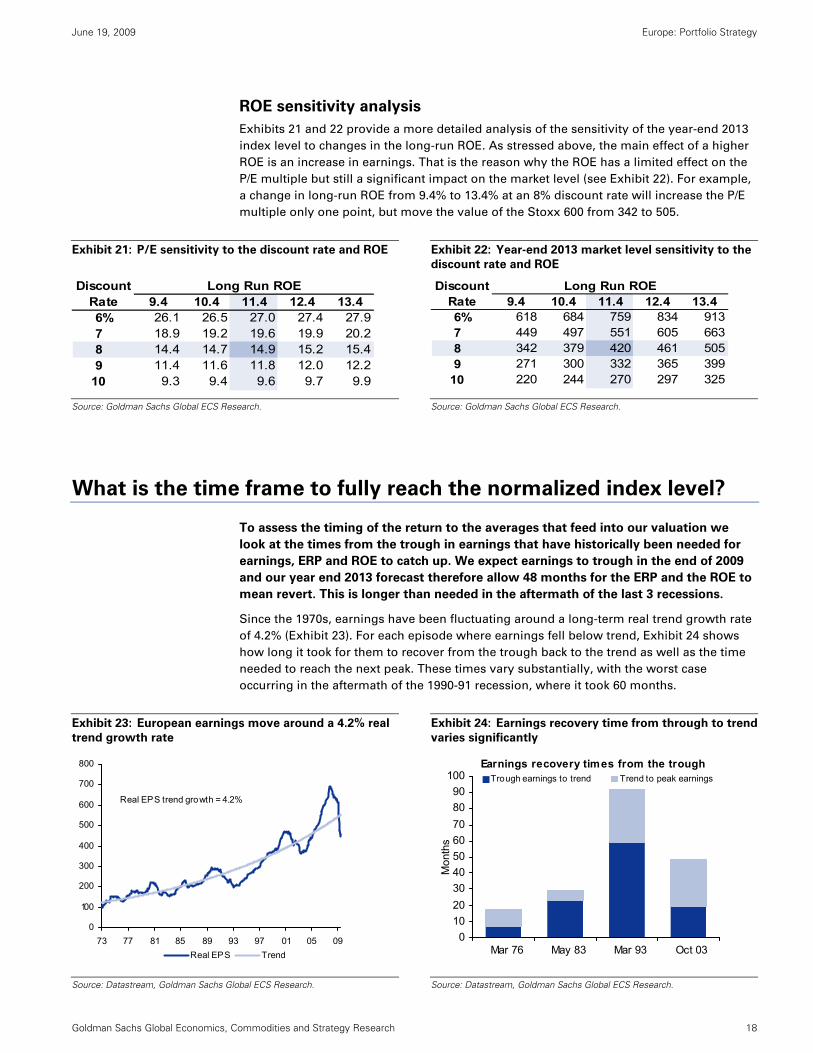
What is the time frame to fully reach the normalized index level?
To assess the timing of the return to the averages that feed into our valuation we
look at the times from the trough in earnings that have historically been needed for
earnings, ERP and ROE to catch up. We expect earnings to trough in the end of 2009
and our year end 2013 forecast therefore allow 48 months for the ERP and the ROE to
mean revert. This is longer than needed in the aftermath of the last 3 recessions.
Since the 1970s, earnings have been fluctuating around a long-term real trend growth rate
of 4.2% (Exhibit 23). For each episode where earnings fell below trend, Exhibit 24 shows
how long it took for them to recover from the trough back to the trend as well as the time
needed to reach the next peak. These times vary substantially, with the worst case
occurring in the aftermath of the 1990-91 recession, where it took 60 months.
Exhibit 23: European earnings move around a 4.2% real
trend growth rate
Exhibit 24: Earnings recovery time from through to trend
varies significantly
0
100
200
300
400
500
600
700
800
73 77 81 85 89 93 97 01 05 09Real EPS Trend
Real EPS trend growth = 4.2%
0102030405060708090
100
Mar 76 May 83 Mar 93 Oct 03
Mon
ths
Trough earnings to trend Trend to peak earningsEarnings recovery times from the trough
Source: Datastream, Goldman Sachs Global ECS Research.
Source: Datastream, Goldman Sachs Global ECS Research.

June 19, 2009 Europe: Portfolio Strategy
Goldman Sachs Global Economics, Commodities and Strategy Research 19
Our valuation analysis does not assume that earnings recover to trend, but merely that the
ROE has. To the extent that the equity position of firms is damaged during recessions it
could be that the ROE catches up to trend before earnings, as it takes time to rebuild the
equity base. This has generally been the case as can be seen by comparing the recovery
times in Exhibit 24 and 25.
Last week’s Strategy Matters “Bumper supply shouldn’t derail recovery” showed that 2009
has so far seen €98 bn of equity raised. We expect the total equity issuance this year
excluding Financials to fall in the €100-300 bn range. This rapid pace of issuance will speed
up the rebuilding of the equity base and is, in our view, likely to lead to a relatively short
lag between the mean-reversion of the ROE and the catch-up of earnings to their long-run
trend.
Exhibit 25: The ROE recovered faster after the 1990-91 recession than earnings did
0
10
20
30
40
50
60
70
80
May-83 Mar-93 Oct-03 Current Assumption
Trend ROE to peak ROEEarnings trough to trend ROE
Months ROE recovery times from the trough of earnings
48 monthsto trend ROE
Source: Worldscope, Datastream, Goldman Sachs Global ECS Research.
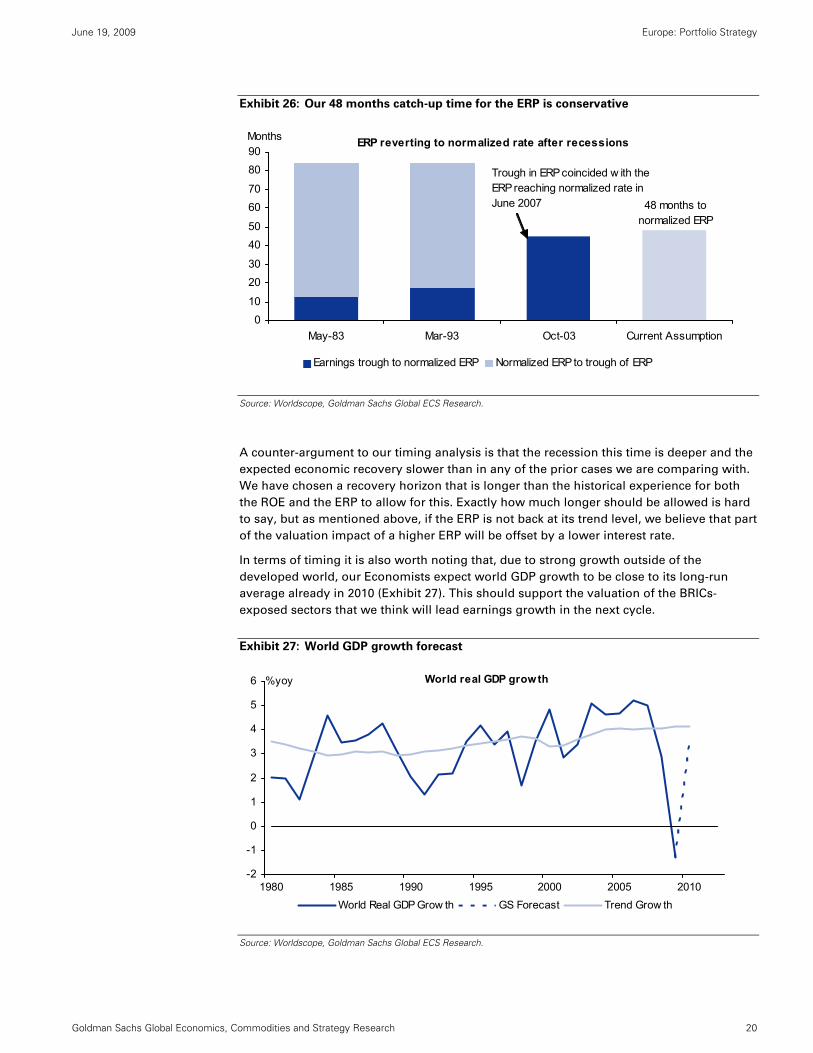
Our valuation also assumes that the ERP will revert to its long-run average by the end of
2013. Exhibit 26 shows how long it has historically taken for the ERP to reach its long-run
average from the trough of earnings, as well as the time needed for the ERP to reach its
trough of the cycle. The recovery time was particularly long in the aftermath of the 2001
recession. We believe that this time around it will again be a long way back to a 3% ERP,
but that investor confidence eventually will re-emerge, as the economy and earnings
recover.
June 19, 2009 Europe: Portfolio Strategy
Goldman Sachs Global Economics, Commodities and Strategy Research 20
Exhibit 26: Our 48 months catch-up time for the ERP is conservative
010
2030
4050
6070
8090
May-83 Mar-93 Oct-03 Current Assumption
Earnings trough to normalized ERP Normalized ERP to trough of ERP
Months ERP reverting to normalized rate after recessions
Trough in ERP coincided w ith the ERP reaching normalized rate in June 2007 48 months to
normalized ERP
Source: Worldscope, Goldman Sachs Global ECS Research.
A counter-argument to our timing analysis is that the recession this time is deeper and the
expected economic recovery slower than in any of the prior cases we are comparing with.
We have chosen a recovery horizon that is longer than the historical experience for both
the ROE and the ERP to allow for this. Exactly how much longer should be allowed is hard
to say, but as mentioned above, if the ERP is not back at its trend level, we believe that part
of the valuation impact of a higher ERP will be offset by a lower interest rate.
In terms of timing it is also worth noting that, due to strong growth outside of the
developed world, our Economists expect world GDP growth to be close to its long-run
average already in 2010 (Exhibit 27). This should support the valuation of the BRICs-
exposed sectors that we think will lead earnings growth in the next cycle.
Exhibit 27: World GDP growth forecast
-2
-1
0
1
2
3
4
5
6
1980 1985 1990 1995 2000 2005 2010
%yoy
World Real GDP Grow th GS Forecast Trend Grow th
World real GDP growth
Source: Worldscope, Goldman Sachs Global ECS Research.

June 19, 2009 Europe: Portfolio Strategy
Goldman Sachs Global Economics, Commodities and Strategy Research 21
Reg AC
We, Anders Nielsen, Sharon Bell, CFA, Peter Oppenheimer, Jessica Binder, CFA and Gerald Moser, hereby certify that all of the views expressed in
this report accurately reflect our personal views about the subject company or companies and its or their securities. We also certify that no part of
our compensation was, is or will be, directly or indirectly, related to the specific recommendations or views expressed in this report.
Disclosures
Distribution of ratings/investment banking relationships
Goldman Sachs Investment Research global coverage universe
Rating Distribution Investment Banking Relationships
Buy Hold Sell Buy Hold Sell
Global 25% 53% 22% 54% 51% 43%
As of April 1, 2009, Goldman Sachs Global Investment Research had investment ratings on 2,718 equity securities. Goldman Sachs assigns stocks as
Buys and Sells on various regional Investment Lists; stocks not so assigned are deemed Neutral. Such assignments equate to Buy, Hold and Sell for
the purposes of the above disclosure required by NASD/NYSE rules. See 'Ratings, Coverage groups and views and related definitions' below.
Disclosures required by United States laws and regulations
See company-specific regulatory disclosures above for any of the following disclosures required as to companies referred to in this report: manager
or co-manager in a pending transaction; 1% or other ownership; compensation for certain services; types of client relationships; managed/co-
managed public offerings in prior periods; directorships; market making and/or specialist role.
The following are additional required disclosures: Ownership and material conflicts of interest: Goldman Sachs policy prohibits its analysts,
professionals reporting to analysts and members of their households from owning securities of any company in the analyst's area of coverage.
Analyst compensation: Analysts are paid in part based on the profitability of Goldman Sachs, which includes investment banking revenues. Analyst as officer or director: Goldman Sachs policy prohibits its analysts, persons reporting to analysts or members of their households from serving as
an officer, director, advisory board member or employee of any company in the analyst's area of coverage. Non-U.S. Analysts: Non-U.S. analysts
may not be associated persons of Goldman, Sachs & Co. and therefore may not be subject to NASD Rule 2711/NYSE Rules 472 restrictions on
communications with subject company, public appearances and trading securities held by the analysts. Distribution of ratings: See the distribution
of ratings disclosure above. Price chart: See the price chart, with changes of ratings and price targets in prior periods, above, or, if electronic format
or if with respect to multiple companies which are the subject of this report, on the Goldman Sachs website at
http://www.gs.com/research/hedge.html. Goldman, Sachs & Co. is a member of SIPC(http://www.sipc.org).
Additional disclosures required under the laws and regulations of jurisdictions other than the United States
The following disclosures are those required by the jurisdiction indicated, except to the extent already made above pursuant to United States laws
and regulations. Australia: This research, and any access to it, is intended only for "wholesale clients" within the meaning of the Australian
Corporations Act. Canada: Goldman Sachs Canada Inc. has approved of, and agreed to take responsibility for, this research in Canada if and to the
extent it relates to equity securities of Canadian issuers. Analysts may conduct site visits but are prohibited from accepting payment or
reimbursement by the company of travel expenses for such visits. Hong Kong: Further information on the securities of covered companies referred
to in this research may be obtained on request from Goldman Sachs (Asia) L.L.C. India: Further information on the subject company or companies
referred to in this research may be obtained from Goldman Sachs (India) Securities Private Limited; Japan: See below. Korea: Further information
on the subject company or companies referred to in this research may be obtained from Goldman Sachs (Asia) L.L.C., Seoul Branch. Russia: Research reports distributed in the Russian Federation are not advertising as defined in Russian law, but are information and analysis not having
product promotion as their main purpose and do not provide appraisal within the meaning of the Russian Law on Appraisal. Singapore: Further
information on the covered companies referred to in this research may be obtained from Goldman Sachs (Singapore) Pte. (Company Number:
198602165W). Taiwan: This material is for reference only and must not be reprinted without permission. Investors should carefully consider their
own investment risk. Investment results are the responsibility of the individual investor. United Kingdom: Persons who would be categorized as
retail clients in the United Kingdom, as such term is defined in the rules of the Financial Services Authority, should read this research in conjunction
with prior Goldman Sachs research on the covered companies referred to herein and should refer to the risk warnings that have been sent to them
by Goldman Sachs International. A copy of these risks warnings, and a glossary of certain financial terms used in this report, are available from
Goldman Sachs International on request.
European Union: Disclosure information in relation to Article 4 (1) (d) and Article 6 (2) of the European Commission Directive 2003/126/EC is
available at http://www.gs.com/client_services/global_investment_research/europeanpolicy.html
Japan: Goldman Sachs Japan Co., Ltd. Is a Financial Instrument Dealer under the Financial Instrument and Exchange Law, registered with the Kanto Financial Bureau (Registration No. 69), and is a member of Japan Securities Dealers Association (JSDA) and Financial Futures Association of Japan (FFJAJ). Sales and purchase of equities are subject to commission pre-determined with clients plus consumption tax. See company-specific disclosures as to any applicable disclosures required by Japanese stock exchanges, the
Japanese Securities Dealers Association or the Japanese Securities Finance Company.

June 19, 2009 Europe: Portfolio Strategy
Goldman Sachs Global Economics, Commodities and Strategy Research 22
Ratings, coverage groups and views and related definitions
Buy (B), Neutral (N), Sell (S) -Analysts recommend stocks as Buys or Sells for inclusion on various regional Investment Lists. Being assigned a Buy
or Sell on an Investment List is determined by a stock's return potential relative to its coverage group as described below. Any stock not assigned as
a Buy or a Sell on an Investment List is deemed Neutral. Each regional Investment Review Committee manages various regional Investment Lists to
a global guideline of 25%-35% of stocks as Buy and 10%-15% of stocks as Sell; however, the distribution of Buys and Sells in any particular coverage
group may vary as determined by the regional Investment Review Committee. Regional Conviction Buy and Sell lists represent investment
recommendations focused on either the size of the potential return or the likelihood of the realization of the return.
Return potential represents the price differential between the current share price and the price target expected during the time horizon associated
with the price target. Price targets are required for all covered stocks. The return potential, price target and associated time horizon are stated in
each report adding or reiterating an Investment List membership.
Coverage groups and views: A list of all stocks in each coverage group is available by primary analyst, stock and coverage group at
http://www.gs.com/research/hedge.html. The analyst assigns one of the following coverage views which represents the analyst's investment outlook
on the coverage group relative to the group's historical fundamentals and/or valuation. Attractive (A). The investment outlook over the following 12
months is favorable relative to the coverage group's historical fundamentals and/or valuation. Neutral (N). The investment outlook over the
following 12 months is neutral relative to the coverage group's historical fundamentals and/or valuation. Cautious (C). The investment outlook over
the following 12 months is unfavorable relative to the coverage group's historical fundamentals and/or valuation.
Not Rated (NR). The investment rating and target price, if any, have been removed pursuant to Goldman Sachs policy when Goldman Sachs is
acting in an advisory capacity in a merger or strategic transaction involving this company and in certain other circumstances. Rating Suspended (RS). Goldman Sachs Research has suspended the investment rating and price target, if any, for this stock, because there is not a sufficient
fundamental basis for determining an investment rating or target. The previous investment rating and price target, if any, are no longer in effect for
this stock and should not be relied upon. Coverage Suspended (CS). Goldman Sachs has suspended coverage of this company. Not Covered (NC). Goldman Sachs does not cover this company. Not Available or Not Applicable (NA). The information is not available for display or is not applicable.
Not Meaningful (NM). The information is not meaningful and is therefore excluded.
Ratings, coverage views and related definitions prior to June 26, 2006
Our rating system requires that analysts rank order the stocks in their coverage groups and assign one of three investment ratings (see definitions
below) within a ratings distribution guideline of no more than 25% of the stocks should be rated Outperform and no fewer than 10% rated
Underperform. The analyst assigns one of three coverage views (see definitions below), which represents the analyst's investment outlook on the
coverage group relative to the group's historical fundamentals and valuation. Each coverage group, listing all stocks covered in that group, is
available by primary analyst, stock and coverage group at http://www.gs.com/research/hedge.html.
Definitions
Outperform (OP). We expect this stock to outperform the median total return for the analyst's coverage universe over the next 12 months. In-Line (IL). We expect this stock to perform in line with the median total return for the analyst's coverage universe over the next 12 months. Underperform (U). We expect this stock to underperform the median total return for the analyst's coverage universe over the next 12 months.
Coverage views: Attractive (A). The investment outlook over the following 12 months is favorable relative to the coverage group's historical
fundamentals and/or valuation. Neutral (N). The investment outlook over the following 12 months is neutral relative to the coverage group's
historical fundamentals and/or valuation. Cautious (C). The investment outlook over the following 12 months is unfavorable relative to the coverage
group's historical fundamentals and/or valuation.
Current Investment List (CIL). We expect stocks on this list to provide an absolute total return of approximately 15%-20% over the next 12 months.
We only assign this designation to stocks rated Outperform. We require a 12-month price target for stocks with this designation. Each stock on the
CIL will automatically come off the list after 90 days unless renewed by the covering analyst and the relevant Regional Investment Review
Committee.
Global product; distributing entities
The Global Investment Research Division of Goldman Sachs produces and distributes research products for clients of Goldman Sachs, and pursuant
to certain contractual arrangements, on a global basis. Analysts based in Goldman Sachs offices around the world produce equity research on
industries and companies, and research on macroeconomics, currencies, commodities and portfolio strategy.
This research is disseminated in Australia by Goldman Sachs JBWere Pty Ltd (ABN 21 006 797 897) on behalf of Goldman Sachs; in Canada by
Goldman Sachs Canada Inc. regarding Canadian equities and by Goldman Sachs & Co. (all other research); in Germany by Goldman Sachs & Co.
oHG; in Hong Kong by Goldman Sachs (Asia) L.L.C.; in India by Goldman Sachs (India) Securities Private Ltd.; in Japan by Goldman Sachs Japan Co.,
Ltd.; in the Republic of Korea by Goldman Sachs (Asia) L.L.C., Seoul Branch; in New Zealand by Goldman Sachs JBWere (NZ) Limited on behalf of
Goldman Sachs; in Singapore by Goldman Sachs (Singapore) Pte. (Company Number: 198602165W); and in the United States of America by
Goldman, Sachs & Co. Goldman Sachs International has approved this research in connection with its distribution in the United Kingdom and
European Union.
European Union: Goldman Sachs International, authorised and regulated by the Financial Services Authority, has approved this research in
connection with its distribution in the European Union and United Kingdom; Goldman, Sachs & Co. oHG, regulated by the Bundesanstalt für
Finanzdienstleistungsaufsicht, may also be distributing research in Germany.
General disclosures in addition to specific disclosures required by certain jurisdictions
This research is for our clients only. Other than disclosures relating to Goldman Sachs, this research is based on current public information that we
consider reliable, but we do not represent it is accurate or complete, and it should not be relied on as such. We seek to update our research as
appropriate, but various regulations may prevent us from doing so. Other than certain industry reports published on a periodic basis, the large
majority of reports are published at irregular intervals as appropriate in the analyst's judgment.

June 19, 2009 Europe: Portfolio Strategy
Goldman Sachs Global Economics, Commodities and Strategy Research 23
Goldman Sachs conducts a global full-service, integrated investment banking, investment management, and brokerage business. We have
investment banking and other business relationships with a substantial percentage of the companies covered by our Global Investment Research
Division.
Our salespeople, traders, and other professionals may provide oral or written market commentary or trading strategies to our clients and our
proprietary trading desks that reflect opinions that are contrary to the opinions expressed in this research. Our asset management area, our
proprietary trading desks and investing businesses may make investment decisions that are inconsistent with the recommendations or views
expressed in this research.
We and our affiliates, officers, directors, and employees, excluding equity analysts, will from time to time have long or short positions in, act as
principal in, and buy or sell, the securities or derivatives (including options and warrants) thereof of covered companies referred to in this research.
This research is not an offer to sell or the solicitation of an offer to buy any security in any jurisdiction where such an offer or solicitation would be
illegal. It does not constitute a personal recommendation or take into account the particular investment objectives, financial situations, or needs of
individual clients. Clients should consider whether any advice or recommendation in this research is suitable for their particular circumstances and,
if appropriate, seek professional advice, including tax advice. The price and value of the investments referred to in this research and the income from
them may fluctuate. Past performance is not a guide to future performance, future returns are not guaranteed, and a loss of original capital may
occur. Fluctuations in exchange rates could have adverse effects on the value or price of, or income derived from, certain investments.
Certain transactions, including those involving futures, options, and other derivatives, give rise to substantial risk and are not suitable for all
investors. Investors should review current options disclosure documents which are available from Goldman Sachs sales representatives or at
http://www.theocc.com/publications/risks/riskchap1.jsp. Transactions cost may be significant in option strategies calling for multiple purchase and
sales of options such as spreads. Supporting documentation will be supplied upon request.
Our research is disseminated primarily electronically, and, in some cases, in printed form. Electronic research is simultaneously available to all
clients.
Disclosure information is also available at http://www.gs.com/research/hedge.html or from Research Compliance, One New York Plaza, New York,
NY 10004.
Copyright 2009 The Goldman Sachs Group, Inc.
No part of this material may be (i) copied, photocopied or duplicated in any form by any means or (ii) redistributed without the prior written consent of The Goldman Sachs Group, Inc.