europe in crisis: political trust, corruption and austerity
TRANSCRIPT

EuropE in crisis: political trust, corruption and austErity
Georgios Melios
October 2020
Institute for Global Prosperity

EuropE in crisis: political trust, corruption and austErity
Georgios Melios
October 2020
Europe in crisis: political trust, corruption and austerity
Georgios Melios 1
This version - October 2020
Abstract
Over the past decade European citizens’ confidence in different political insti-tutions has declined sharply. This paper explores the different determinantsof political trust in EU28 countries and the role perceived corruption and aus-terity hold in this decline. At first, the paper reviews the literature on whataffects trust decisions and the role of institutions in them. Subsequently,using data from the Eurobarometer (2005-2018) the paper identifies differ-ent determinants of political trust. Using hierarchical modelling, the papercombines micro and macro characteristics to identify the importance of per-ceived corruption and austerity measures in this process. Results suggestthat corruption is a significant determinant of trust in national governments,particularly in countries where austerity was present.
Keywords: Trust in government, Corruption, Europe, Austerity
1 Introduction
Over the past decade political stability in European democracies appearsto be volatile. Cases of snap elections, coalition governments with weak ma-jority, protest votes and the rise of populist parties became more frequentsince the Financial Crisis of 2008. At the same time, the levels of trust Eu-ropean citizens report towards their national institutions, politicians and po-litical parties are in decline (Hooghe, 2011; Torcal, 2014; Foster and Frieden,
1Institute for Global Prosperity, University College London, 149 Tottenham court road- [email protected]. I would like to thank Susan Rose-Ackerman, Bo Rothstein, NigelO’Leary, Henrietta L. Moore, David Blackaby, James Foreman-Peck and Brian Varianfor numerous discussions and valuable comments. Additionally, I would like to thankparticipants of the IOEA, SIOE, WINIR and Public Choice Society (2019) conferencesand Swansea, Cardiff, AUEB, Panteion, UCL, Oxford workshops/seminars for providingimportant feedback. All interpretations and errors are solely the author’s responsibility.
1
2017; Algan et al., 2017). Public opinion trends for European institutions are also similar. It is unclear whether the drivers of this decline are solely socio-economic, political, or both. What seems to be evident though in most western democracies is that the financial crisis uncovered a fomenting demo-cratic deficit. The response to the crisis and its aftermaths, both on national and European level, did not meet citizens expectations. Can that deviation between political actions and citizens’ expectations account for the decline of political trust? To answer that one must first discuss the nature of trust and how it is related to political institutions.
What drives people to trust and cooperate with each other, has been for millennia one of the main quests of philosophers and scientists. In the course of this journey, different determinants of trust were identified with some ev-idence suggesting that it might be partly genetic (Fehr, 2009), that it might be partly encoded in our cultural beliefs and norms (Tabellini, 2008) and transferred to us at an early age (Erikson, 1994) or that it is a continuous process of social learning (Glanville and Paxton, 2007). All of them, how-ever, implicitly suggest that trust is essentially a process of accumulation and evaluation of information. Information that are acquired with different mechanisms (e.g. genetics, norms, education) and are always subjectively assessed from the perspective of the individual attempting to make a trust decision. Recent empirical works confirm the trust as an evaluation process theory (see Van der Meer and Hakhverdian (2017) for a recent review of the relevant literature).
The scope of this paper is to examine empirically the determinants of po-litical trust in Europe based on data from the Eurobarometer public opinion survey. By combining information both on the level of individuals as well as on the country the paper explores how much of the variation in answers on trust questions can be explained by which factors. This paper brings together both analytical and empirical considerations about what determines politi-cal trust and how corruption influences this process. In the next section, a review of the relevant literature about political institutions, corruption, and trust is provided; upon which the basis of the empirical analysis will then be formed. In Section 3, the theoretical framework is provided, followed by data and methodology. Section 5 includes the empirical analysis and robustness checks, followed by conclusions in the last section.
2
2 Trust
Before proceeding with the analysis on why individuals report a particular level of trust, one must first attempt to understand the broader phenomenon of trust. Uslaner (2018) claims that we can observe two broad categories of trust: generalised and particularised. The first is broadly related to the probability that an individual will show general signs of trust to anyone or anything, whilst the latter refers to the probability that an individual will trust something or someone specific. Whilst these concepts appear to be similar and probably interlinked, the fundamental difference between them is that particularised trust requires the acquisition and evaluation of additional information about the subject to be deemed as trustworthy or not. One could claim that particularised trust encompasses generalised in the sense that generalised trust reflects individual’s perception about how the world works and particularised trust reflects the additional case specific informa-tion required for the trust decision. In other words, we could see the notion of generalised trust as one’s ”moral compass” used as a benchmark upon which people acquire and compare further information to decide whether someone/something is worth trusting.
The nature of trust has been the subject of numerous multidisciplinary enquiries over the years. Philosophers have wondered about the essence of trust for millennia. Aristotle claimed that trust is a virtue, a characteristic attitude that good citizens have towards others and towards governance2. In his ideal social structure ”Polis” each person is assigned the matter he is the best at and therefore each person should trust others on their role as they are the best fit for it3. Modern philosophers, such as Hume, also wondered about the nature of trust as a motive of cooperation and social cohesion. For social psychologists, trust refers to a one’s confident belief that another individual’s motivation are benevolent towards him/her and that the other person will therefore be responsive to his/her needs (Rousseau et al., 1998).
For economists, the concept of trust is ambiguous and is often associ-ated with the faith or confidence that one has that a favourable outcome will turn out of a process of any kind of human interactions in economic, social, and political domains (Guiso et al., 2006). The role of trust was ne-
2Aristotle’s Politics Book III - Bookman (1992)3Note: In this case he is used instead of he/she as in Aristotle’s Polis only men were
participating in governance
3
glected by economists until the seminal work of Arrow (1974) who noted that in the face of transaction costs, trust is ubiquitous to almost every eco-nomic transaction, arguing that much of the economic backwardness in the world could be explained by the lack of mutual confidence and our under-standing of its mechanisms. Since Arrow’s claim, a vast empirical literature now investigates the link between aggregate trust and economic outcomes, revealing a positive, mostly monotonic, relationship (Guiso et al., 2009). Ag-gregate trust is correlated with GDP per capita, GDP growth and growth of firm sizes (Knack and Keefer, 1995; Zack and Knack, 2001; Guiso et al., 2006). These correlations were enforced by analytical works such as the one of Tabellini (2008) who identified strategies to isolate the causal effect of trust on economic performance. Although the link between aggregate trust and aggregate economic performance seems to be at causally established, there is little known about the micro economic foundations of trust. Questions such as what determines trust in the individual level and why individuals decide to report certain levels of trust in surveys remain broadly unexplored.
One of the main subcategories of particularised trust that is key area of research in the field is that of political trust that was brought in the research agenda of political scientists by the protest movements in 1960s. Analytical and empirical works on the subject attempted to answer explicitly or implic-itly whether political trust is another form of trust or if its characteristics are distinctive. In the literature, questions such as the following are explored: Do people trust all institutions the same way? Does the level of governance play a role? Is political trust driven solely by economic outcomes or do in-stitutional and political processes affect it as well? (see Uslaner (2018) for an analytical overview of the literature).
2.1 Political institutions and TrustThe relationship between institutions, trust and cooperation is important
for many avenues of inquiry in social and political sciences (Farrell, 2009). In order to understand it though, one must first try to set out important questions about the political economy of institutions as well as that of trust. For example, what implications do informal and formal institutions have for the workings of the economy? How can we best understand the sources and consequences of trust and cooperation? Bringing these questions together, what effects do institutions have on the way that individuals decide to trust and cooperate (or not to) with each other?
4
The empirical observations with regard to these questions are limited and Uslaner (2018) argues that the main reason for the poor accounts of the re-lationship between institutions and trust is because of the weakness of our underlying theories of this relationship. Thus, one can argue that a more coherent theoretical account for the institutions-trust relationship is a nec-essary initial step towards a better understanding of the causal mechanisms between trust and institutions. For now, the most sophisticated accounts of trust have very little room for institutions, stressing instead personal relation-ships as the key source of information underlying trusting beliefs. However, institutional literature suggests not only that institutions are relevant and can be modelled in this relationship, but also that different kinds of institu-tions are likely to have quite different consequences for trust and cooperation Uslaner (2018).
In order to develop such theoretical accounts of the institutions-trust relationship, Farrell (2009) claims that one should first understand the role of institutions in providing information about actors (i.e. different institutional actors, politicians) to agents (citizens). An initial step to such account would be the work of Hardin (2002) who with his encapsulated interest approach provided insights on the mechanisms of trust by considering trust as a set of expectations about the trustworthiness of others in imperfectly defined future situations. That might allow us to understand how institutions can provide information about other types of actors, and how they are likely to behave in such situations, contributing in that way to trust/distrust among these actors Farrell (2009). In that sense, Hardin’s proposition is that institutions are best conceived as mechanisms of equilibrium selection that make some equilibria more likely, and other less, to be chosen by the relevant actors. By bringing together these theories of institutions and trust, the concept of trust should only be invoked in circumstances where institutional rules do not have fully determinate effects (imperfect institutions). By that, we are allowed to explore phenomena such as how variations in institutional frameworks are associated with different levels of trust.
In addition to that, the literature identifies two alternatives, although probably complementary, explanations for the determinants of institutional trust. Cultural theorists argue that trust in institutions is exogenous and based on the notion of generalised trust transmitted through generations with cultural norms (see Uslaner (2018) for a recent review of the relevant literature). As such, it is frequently viewed as being learned early in life and is partly inherited through inter-generational processes and genes. Institu-
5
tional theories on the other hand argue that it is endogenous and influenced by institutional performance (Hetherington (1998); Hudson (2006); Uslaner (2018)). These two hypotheses have different implications for the analysis of institutional trust. In that way, it is not obvious why it should vary with personal characteristics such as age or education. However, evidence show that trust is heterogeneous across different groups suggesting that in fact it might not be the case that it is solely learned at an early age and remains stable in the course of an individual's life without any updating (Uslaner, 2018).
Empirical evidence confirms the complementary of these two approaches. Mishler and Rose (2001) analysing determinants of institutional trust in Cen-tral and Eastern Europe, found a weak association with socioeconomic vari-ables and a stronger association with country level characteristics such as corruption perceptions. Brewer et al. (2004) concluded that in the USA in-ternational trust or trust in other nations is dependent upon social trust,(domestic) political trust and declines with age. More recent analyses with respect to European countries find that socio-economic (Foster and Frieden, 2017), economic freedom (Berggren and Nilsson, 2020), financial (Drakos et al.) and political factors (Algan et al., 2017) such as political efficacy (Geurkink et al., 2020) affect trust in national and European institutions. Camussi and Mancini (2019) take another perspective on this focusing more on the micro level and providing evidence that the quality of local services also affects political trust in Europe.
2.2 Institutional trust and Measurements
Institutional trust is central to how citizens relate to political institutions as it reflects citizens’ beliefs regarding decision making processes and actors. There is empirical evidence suggesting that these beliefs are directly corre-lated with the propensity to pay taxes (Scholz and Lubell 1998) as well as with citizens compliance with collective obligations (Marien 2011). The im-portance of political trust for democracy or good governance drove a large portion of empirical research on developed democracies and non-democracies (Lipset and Schneider, 1983; Hetherington, 1998; Marien, 2011). Therefore, measuring this sort of particularised trust accurately is key to infer the drivers and determinants of public support.
For more than 5 decades, researchers have tried to develop robust mea-sures of support to a political system and considerable effort was devoted
6
to measures of trust. Despite these efforts and consensus regarding the im-portance of political trust, there is little consensus about the accuracy of different measurements (Schneider, 2017). Measurements of trust depend on national or international extensive surveys where individuals are being asked about their trust in different political and social institutions. Political trust was measured in that way for the first time via a battery of survey questions on the US National Election Study (NES) in 1958 (Seyd, 2015).
These indicators, however, have been criticised to suffer from method-ological weaknesses, which undermine their ability to serve as robust mea-surement instruments (Seyd, 2015). Hooghe (2011), for example, criticises researchers' dependence on standard trust in government survey questions without questioning their validity or even wondering what political trust ac-tually refers to, or what place the concept could have in democratic society. In response to that, Schneider (2017) attempted to answer whether standard trust in government survey indicators represent a single, comprehensive atti-tude of political trust and whether different measurement models of political trust are equivalent in all countries. Employing group confirmatory factor analysis, she suggests that while in some indicators respondents with diverse backgrounds do not have equivalent understanding of political trust, account-ing for these differences researchers can rely on trust indicators to distinguish trust in different institutions.
Rodet (2015) claims however that one of the critiques which still remains unanswered about survey responses on political trust is that of the system-representative problem. In other words, whether in a survey question about political trust the respondent answers based on his/her beliefs and trust towards the current representative agent of the institution under question, on his/her notion and beliefs about the quality and necessity of the underlying institution over time or a combination of both. If the latter is true what would the appropriate way to decompose this be? In the case of national parliaments, does the individual respond based on beliefs and information about current MPs or based on his/her beliefs on whether the parliament as an institution will perform satisfactorily irrespective of who is currently representing it.
2.3 Corruption and trustCorruption is an old, ambiguous and complex phenomenon, the study of
which is central to a large body of multidisciplinary research over the past decades. The complexity of the term and its hidden nature are obstacles
7
in the attempts to provide a single and inclusive definition. Transparency International defines corruption as the abuse of entrusted power for private gain4. Corruption includes a wide range of activities, in both private and public sectors, including but not limited to bribery, extortion, exchange of favours, fraud, embezzlement, nepotism and cronyism (Rose-Ackerman and Palifka, 2016).
Both trust and corruption have long been recognised as important top-ics by social scientists. Empirical studies on their relationship though were scarce until the mid-1990s mainly due to the lack of available data. Trust is based on an individual’s belief or expectations about another party’s trust-worthiness. There are two distinct, probably complimentary, ways to see trust. Some argue that it is learned early in life (Erikson, 1994) while others believe that it is a process of social learning over the course of an individ-ual’s life (Glanville and Paxton, 2007). According to the latter view the decision to trust a stranger will largely depend on one’s expected trustwor-thiness of average people based on one’s own experiences. The only way to assess though other people’s trustworthiness is through repeated interac-tions, making accounts every time of whether the other actor reciprocates your expectations or not. In the case of political trust or trust in institu-tions it is usually implied not only confidence on the integrity and fairness of the political/institutional actor but also in its competence to behave in a particular way under specific circumstances.
Corruption on the other hand can be considered as a form of untrust-worthy behaviour. Particularly in the case of public corruption, when a bu-reaucrat engages in corruption by abusing the power entrusted in him/her, he/she is betraying the trust each individual citizen has on his/her integrity. In that sense, corruption is a form of untrustworthy behaviour that affects individuals with direct experiences or direct interests. Even if individuals of the same society have homogeneous views in regard to corruption, it will be impossible for them to know the exact levels of corruption due to corrup-tion’s hidden nature (You, 2018). Therefore, regarding public opinion and subsequently individuals’ trust in different political institutions, the level of perceived corruption might be more important than the actual corruption
4Transparency international is an international anti-corruption NGO. For a completelist of definitions on the term visit the Transparency International website on what iscorruption, https://www.transparency.org/what-is-corruption (Last accessed 24/02/2019)
8
levels that are not observed.The relationship between different forms trust and corruption has seen
unprecedented interest since the seminal work of Putnam et al. (1994) and the development ways to measure corruption in the mid-1990s. There is evidence supporting both a causal effect of trust on corruption similar to the one Putnam et al. (1994) described when correlating lower levels of social trust and higher levels of political corruption in Italy. La Porta et al. (1997) tested Putnam’s hypothesis with data from the World Values Survey to find robust evidence of positive effects of trust in corruption control, bureaucratic quality and tax compliance. Subsequent cross-sectional studies also confirm these results (Bjørnskov (2010); Graeff and Svendsen (2013); Uslaner (2004, 2008b)). Uslaner (2004) finds that changes in social trust can explain changes in the perceived levels of corruption whilst the reverse effect is insignificant. Uslaner (2008b) describes a causal chain of vicious circle, the ”inequality trap”, where high inequality causes low social trust which in turn causes higher levels of corruption that lead to more inequalities. Bjørnskov (2010) connects social trust to good governance through two distinct mechanisms. The bureaucratic mechanism results a moral cost to corrupt bureaucrats which is higher in more trusting societies, whilst the electoral mechanism through which social trust affect corruption results costs due to the demand for punishment of corrupt actors. The argument for both mechanisms is that trusting citizens are more civic minded than non-trusting ones.
These studies support the hypothesis that there is a causal effect running from social trust to corruption. However, this causality direction is hard to establish robustly due to endogeneity and reverse causality. Without micro level evidence suggesting that trusting public officials engage in corruption less frequently than non-trusting ones, the causal chain is subject to spurious circles (Serritzlew et al., 2014). On the other hand, there are studies on the reverse causal effect.
A number of studies have explored the effect of institutional quality and corruption on social and political trust. Rothstein and Stolle (2008) when considering institutional trust, distinguish between partisan institutions (par-liament, government, political parties), neutral and order institutions (army, police) and power controlling institutions (press). Uslaner (2008a) using instrumental variables attempts to identify a causal effect of perceived cor-ruption on trust in Estonia. Using data from the National Elections Survey (NES) Richey (2010) also supports the effect of corruption on generalised trust. Herreros and Criado (2008) describe a trust game where state efficacy
9
fosters social trust, and they support that claim using a multilevel analysis of data from the European Social Survey. Using the same hierarchical struc-ture of analysis Freitag and Bulham (2009) find that corruption among other factors is affecting trust, a result later also supported by You (2012).
You (2018) suggests that through the variety of methods (panel data, experimental studies, multilevel analysis, instrumental variables) as well as the wide coverage of data (Europe, US, country specific), there is very strong and robust empirical evidence of the causal effect of corruption on trust.
3 Theoretical framework
Considering the literature and insights from Mishler and Rose (2001), the ith individual will trust the jth institution, (Tij ), provided that the per-ceived probability from the perspective of individual i that the institution j(pij ) is trustworthy is not less than a critical point (p∗ij ), given all available information.
Tij = pij ⇔ pij ≥ p∗ij (1)
Following the literature on the determinants of trust, I hypothesise thatthis perceived probability (Tij = pij) can be thought of as a function of Xi,Zi and W , pij = f(Xi, Zi,W ) where:
• Xi is a vector of personal, social and demographic characteristics thatdefine an individual’s personality and therefore his/her preferences to-wards risk and trust. These characteristics vary across individuals butremain the same irrespective of the institution that is under judgement
• Zi is a vector with the individuals’ set of information about the under-lying institution’s quality (beliefs and evaluation of past performance)
• W is a vector of country, time and institutions specific characteristics
A potential approximation of this critical point p∗ij could therefore be ex-plored by rational choice theory. Farrell (2009) suggests that rational choiceinstitutionalism might be the more holistic theoretical tool to explore themechanisms of institutional trust. According to Hudson (2006) we can ex-pect trust decisions to vary depending on individuals’ income, education,employment status and family background. One would a expect a positiveassociation between income and trust in government as individuals use dif-ferences in their income as their primary mean of evaluating the state of
10
the economy and therefore the performance of the government in the pre-vious period. Foster and Frieden (2017) find that more educated tend totrust more national and European institutions, so a positive relationship canalso be hypothesised. Employment status can also impact on an individual’sopinion about the performance of the government. Hudson (2006) suggeststhat people tend to blame others instead of themselves for adverse events intheir life and one such case could be the event of sudden unemployment withthe government taking the blame.
In terms of institutional and country specific factors, the main hypothesisof the paper is that the level of perceived corruption negatively affects trustin the government. Other political factors might also have a role in thisprocess such as the stability, ideology and tenure of each government. Morestable governments are an indication of better performance and more supportby the public. Additionally, the state of the economy is hypothesised to besignificant in such a process and we expect that weaker economies with highlevels of unemployment and under austerity programs to be associated withlower levels of trust in government.
For this chapter the main estimation results are derived using data fromthe Eurobarometer survey between 2005-2018.5 In terms of coverage, thedataset includes the European Union 28 countries. The sample excludingnon-responses, missing values and ”Don’t know” answers is roughly 785.000individual observations, depending the variables included in each specifica-tion.
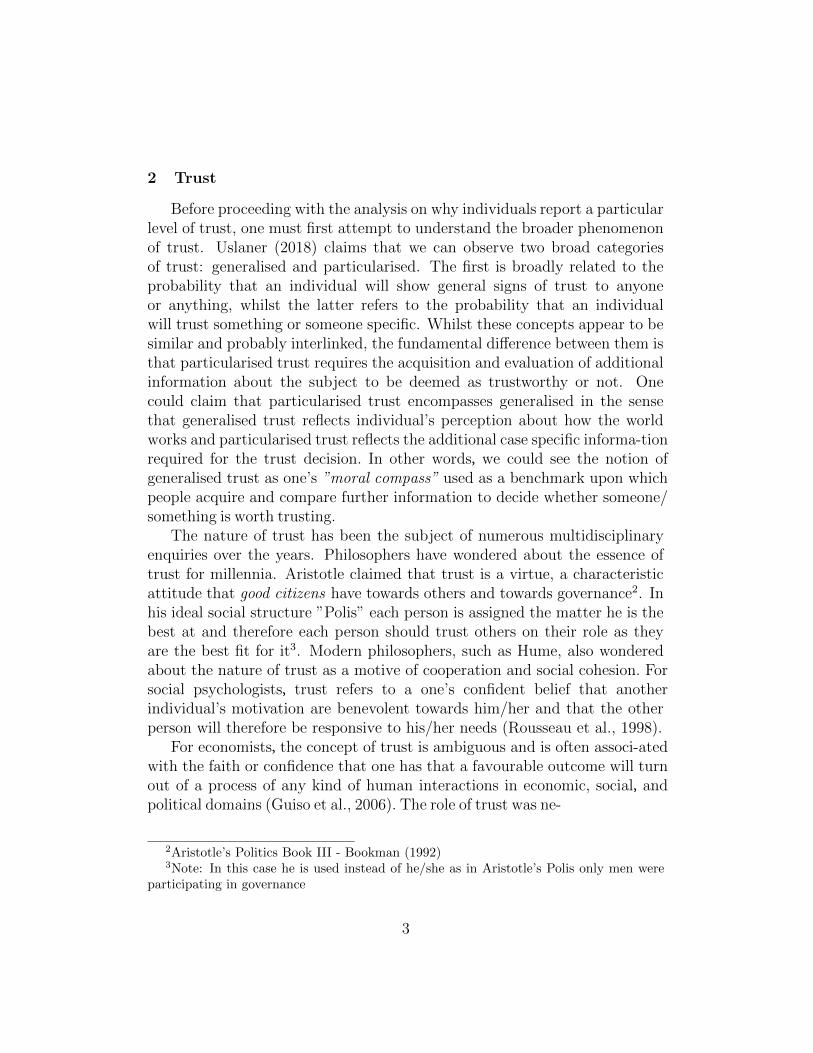
The main dependent variable of focus here is trust in the national govern-ment. The answers in this survey question are binary (0-1) and correspondto whether the respondent trusts the country’s government (0=Tend not totrust, 1=Tend to trust). As found in Figure 3 of the Appendix, in onlythree countries (Finland, Luxembourg and Malta) citizens tend to trust thegovernment on average. In 8 countries the percentage of responses on bothcategories is close to 50% (Austria, Belgium, Cyprus, Denmark, Estonia,Germany, Netherlands and Sweden), whilst in the remaining 17 countriesthe citizens clearly tend not to trust their government. In the Appendix asimilar graph (4 on the evolution of these responses over time is available.The map in Figure 1 depicts the average levels of trust in national govern-
5Eurobarometer is a public opinion survey conducted biannually by the European Com-mission across Europe in independent samples since 1974
11
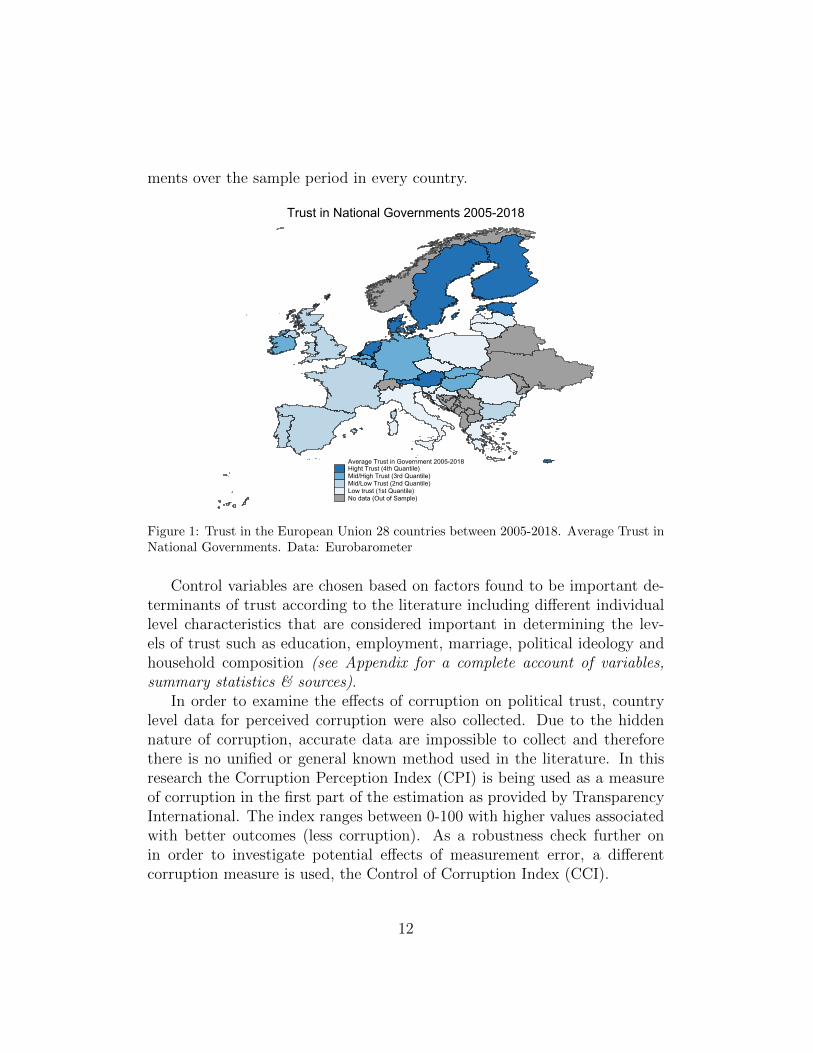
ments over the sample period in every country.
Average Trust in Government 2005-2018Hight Trust (4th Quantile)Mid/High Trust (3rd Quantile)Mid/Low Trust (2nd Quantile)Low trust (1st Quantile)No data (Out of Sample)
Trust in National Governments 2005-2018
Figure 1: Trust in the European Union 28 countries between 2005-2018. Average Trust inNational Governments. Data: Eurobarometer
Control variables are chosen based on factors found to be important de-terminants of trust according to the literature including different individuallevel characteristics that are considered important in determining the lev-els of trust such as education, employment, marriage, political ideology andhousehold composition (see Appendix for a complete account of variables,summary statistics & sources).
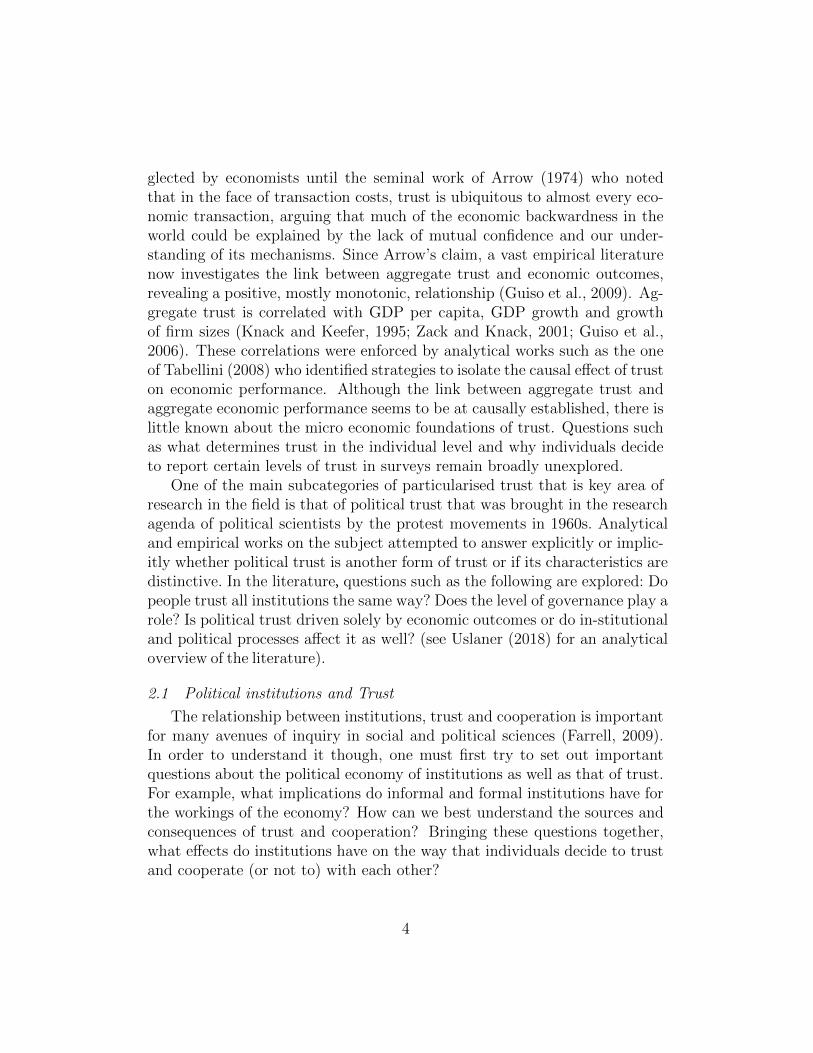
In order to examine the effects of corruption on political trust, countrylevel data for perceived corruption were also collected. Due to the hiddennature of corruption, accurate data are impossible to collect and thereforethere is no unified or general known method used in the literature. In thisresearch the Corruption Perception Index (CPI) is being used as a measureof corruption in the first part of the estimation as provided by TransparencyInternational. The index ranges between 0-100 with higher values associatedwith better outcomes (less corruption). As a robustness check further onin order to investigate potential effects of measurement error, a differentcorruption measure is used, the Control of Corruption Index (CCI).
12
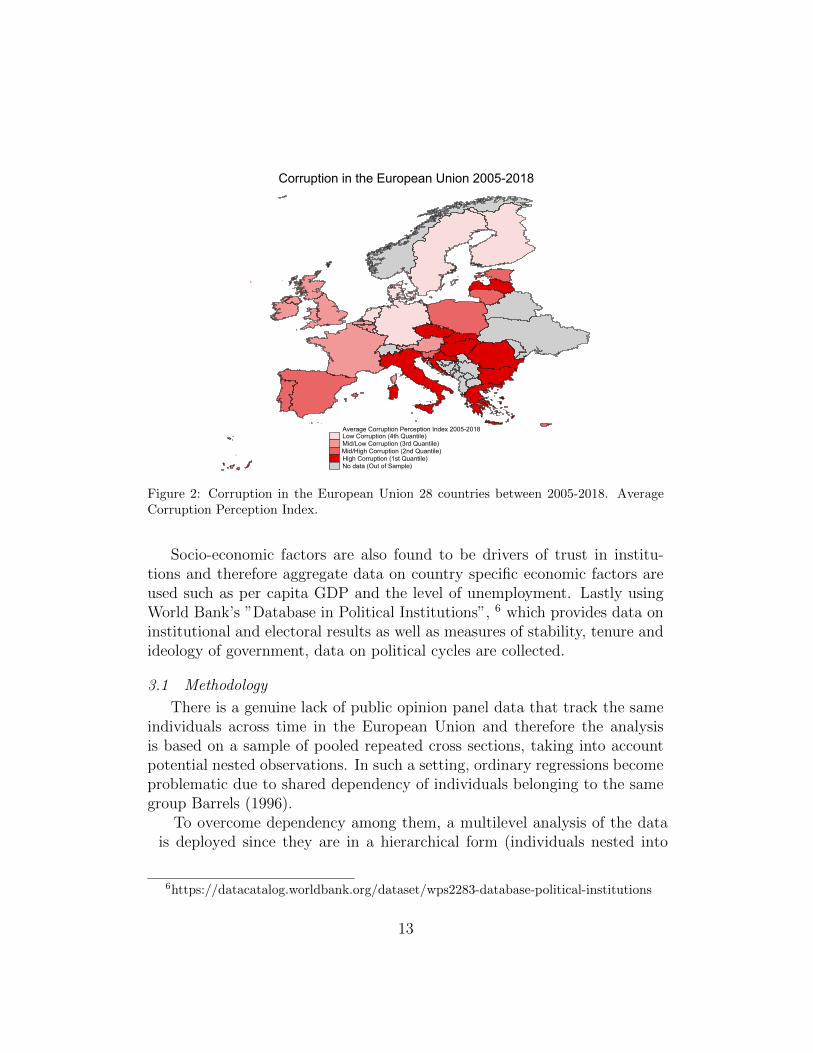
Average Corruption Perception Index 2005-2018Low Corruption (4th Quantile)Mid/Low Corruption (3rd Quantile)Mid/High Corruption (2nd Quantile)High Corruption (1st Quantile)No data (Out of Sample)
Corruption in the European Union 2005-2018
Figure 2: Corruption in the European Union 28 countries between 2005-2018. Average Corruption Perception Index.
Socio-economic factors are also found to be drivers of trust in institu-tions and therefore aggregate data on country specific economic factors are used such as per capita GDP and the level of unemployment. Lastly using World Bank’s ”Database in Political Institutions”, 6 which provides data on institutional and electoral results as well as measures of stability, tenure and ideology of government, data on political cycles are collected.
3.1 Methodology
There is a genuine lack of public opinion panel data that track the same individuals across time in the European Union and therefore the analysis is based on a sample of pooled repeated cross sections, taking into account potential nested observations. In such a setting, ordinary regressions become problematic due to shared dependency of individuals belonging to the same group Barrels (1996).
To overcome dependency among them, a multilevel analysis of the datais deployed since they are in a hierarchical form (individuals nested into
6https://datacatalog.worldbank.org/dataset/wps2283-database-political-institutions
13
survey waves nested into countries).7 Multilevel analysis is considered thecompromise between complete and no pooling at all. In that way, both crosssectional and across time effects can be explored in order to account for thevariance in a dependent variable measured at the lowest level by analysinginformation from all levels of the analysis.
3.2 Hypotheses and results
Control variables are chosen based on the assumptions of the model spec-ification presented above, supplemented by additional variables found to beimportant determinants of trust according to the literature. The main questof this research is to explore what drives political trust in the EuropeanUnion and whether perceptions of corruption are an important determinant.In addition to that, this research explores whether the effect of corruption onpolitical trust is homogeneous across countries, time and social subgroups.
Given that the variables of political trust in the Eurobarometer surveyare either dichotomous or ordinal, it is appropriate to use logit and orderedlogit regressions respectively. Assume that there is a latent variable Y ∗ ∈(−∞,∞) that captures the levels of political trust and that it is represented(with incomplete information) through an observed variable Y.
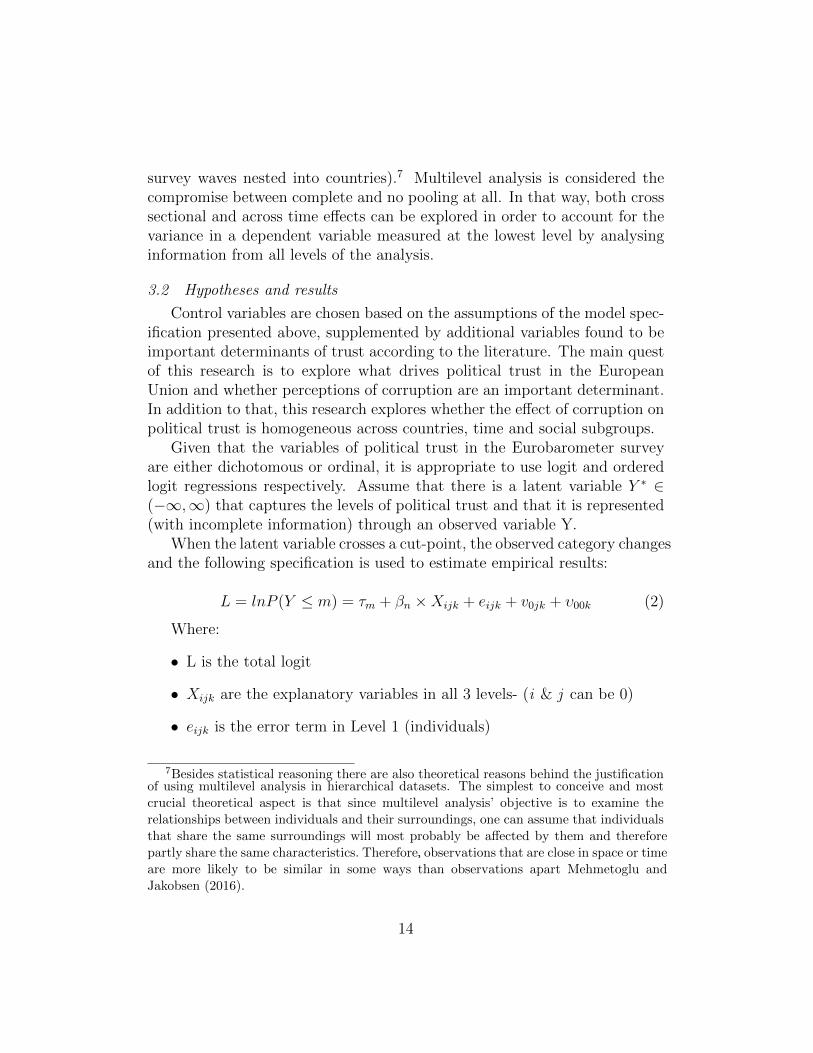
When the latent variable crosses a cut-point, the observed category changesand the following specification is used to estimate empirical results:
L = lnP (Y ≤ m) = τm + βn ×Xijk + eijk + v0jk + υ00k (2)
Where:
• L is the total logit
• Xijk are the explanatory variables in all 3 levels- (i & j can be 0)
• eijk is the error term in Level 1 (individuals)
7Besides statistical reasoning there are also theoretical reasons behind the justification of using multilevel analysis in hierarchical datasets. The simplest to conceive and most crucial theoretical aspect is that since multilevel analysis’ objective is to examine the relationships between individuals and their surroundings, one can assume that individuals that share the same surroundings will most probably be affected by them and therefore partly share the same characteristics. Therefore, observations that are close in space or time are more likely to be similar in some ways than observations apart Mehmetoglu and Jakobsen (2016).
14
• u0jk is the error term in Level 2 (survey years)
• υ00k the error term in Level 3 (countries) 8
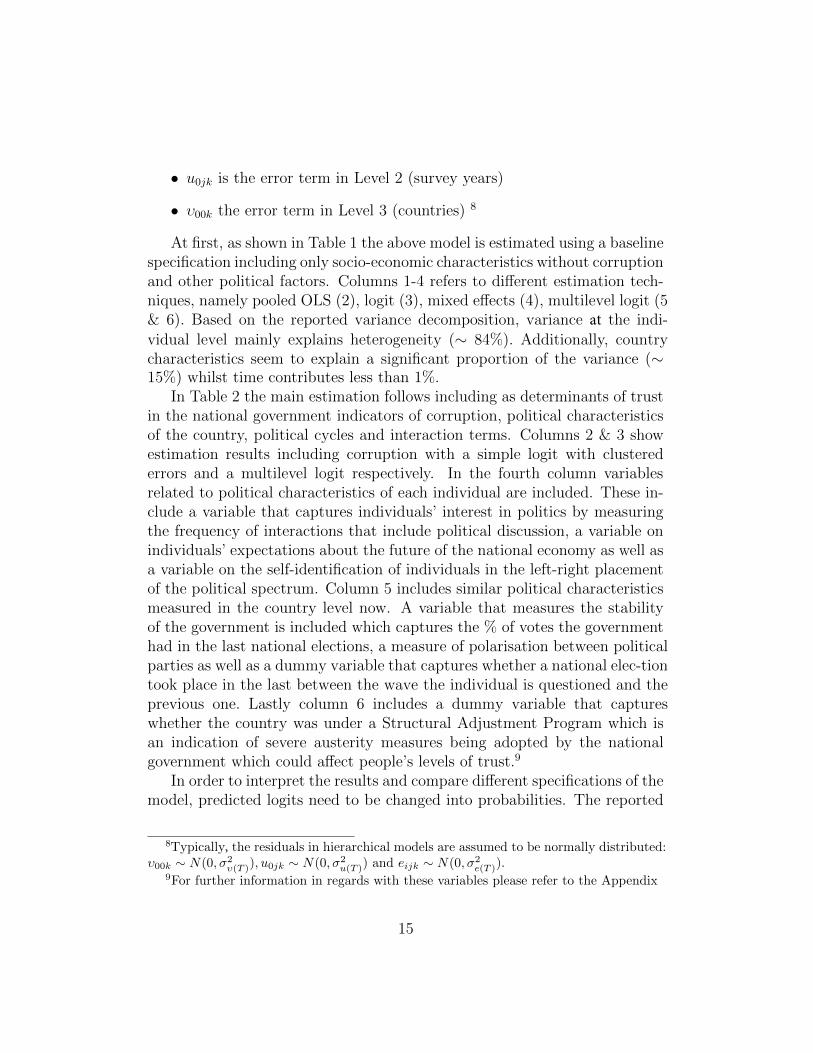
At first, as shown in Table 1 the above model is estimated using a baseline specification including only socio-economic characteristics without corruption and other political factors. Columns 1-4 refers to different estimation tech-niques, namely pooled OLS (2), logit (3), mixed effects (4), multilevel logit (5 & 6). Based on the reported variance decomposition, variance at the indi-
vidual level mainly explains heterogeneity (∼ 84%). Additionally, country characteristics seem to explain a significant proportion of the variance (∼ 15%) whilst time contributes less than 1%.
In Table 2 the main estimation follows including as determinants of trust in the national government indicators of corruption, political characteristics of the country, political cycles and interaction terms. Columns 2 & 3 show estimation results including corruption with a simple logit with clustered errors and a multilevel logit respectively. In the fourth column variables related to political characteristics of each individual are included. These in-clude a variable that captures individuals’ interest in politics by measuring the frequency of interactions that include political discussion, a variable on individuals’ expectations about the future of the national economy as well as a variable on the self-identification of individuals in the left-right placement of the political spectrum. Column 5 includes similar political characteristics measured in the country level now. A variable that measures the stability of the government is included which captures the % of votes the government had in the last national elections, a measure of polarisation between political parties as well as a dummy variable that captures whether a national elec-tion took place in the last between the wave the individual is questioned and the previous one. Lastly column 6 includes a dummy variable that captures whether the country was under a Structural Adjustment Program which is an indication of severe austerity measures being adopted by the national government which could affect people’s levels of trust.9
In order to interpret the results and compare different specifications of the model, predicted logits need to be changed into probabilities. The reported
8Typically, the residuals in hierarchical models are assumed to be normally distributed:υ00k ∼ N(0, σ2
υ(T )), u0jk ∼ N(0, σ2u(T )) and eijk ∼ N(0, σ2
e(T )).9For further information in regards with these variables please refer to the Appendix
15
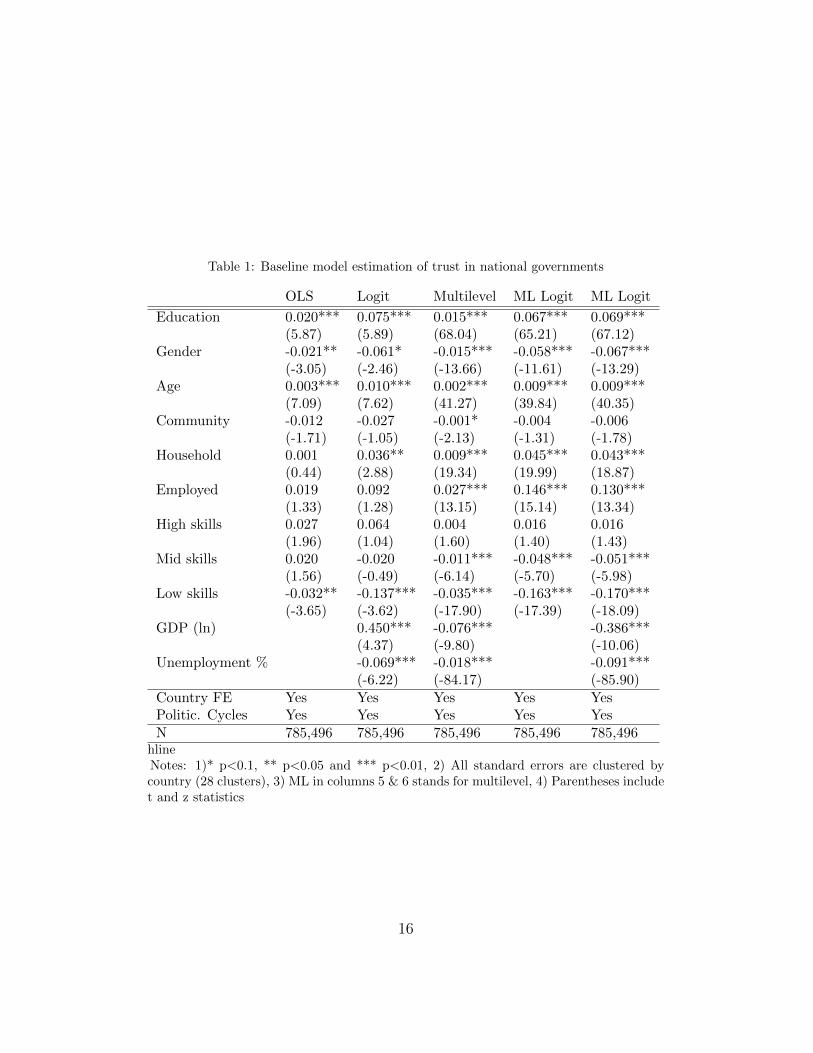
Table 1: Baseline model estimation of trust in national governments
OLS Logit Multilevel ML Logit ML Logit
Education 0.020*** 0.075*** 0.015*** 0.067*** 0.069***(5.87) (5.89) (68.04) (65.21) (67.12)
Gender -0.021** -0.061* -0.015*** -0.058*** -0.067***(-3.05) (-2.46) (-13.66) (-11.61) (-13.29)
Age 0.003*** 0.010*** 0.002*** 0.009*** 0.009***(7.09) (7.62) (41.27) (39.84) (40.35)
Community -0.012 -0.027 -0.001* -0.004 -0.006(-1.71) (-1.05) (-2.13) (-1.31) (-1.78)
Household 0.001 0.036** 0.009*** 0.045*** 0.043***(0.44) (2.88) (19.34) (19.99) (18.87)
Employed 0.019 0.092 0.027*** 0.146*** 0.130***(1.33) (1.28) (13.15) (15.14) (13.34)
High skills 0.027 0.064 0.004 0.016 0.016(1.96) (1.04) (1.60) (1.40) (1.43)
Mid skills 0.020 -0.020 -0.011*** -0.048*** -0.051***(1.56) (-0.49) (-6.14) (-5.70) (-5.98)
Low skills -0.032** -0.137*** -0.035*** -0.163*** -0.170***(-3.65) (-3.62) (-17.90) (-17.39) (-18.09)
GDP (ln) 0.450*** -0.076*** -0.386***(4.37) (-9.80) (-10.06)
Unemployment % -0.069*** -0.018*** -0.091***(-6.22) (-84.17) (-85.90)
Country FE Yes Yes Yes Yes YesPolitic. Cycles Yes Yes Yes Yes YesN 785,496 785,496 785,496 785,496 785,496
hlineNotes: 1)* p<0.1, ** p<0.05 and *** p<0.01, 2) All standard errors are clustered bycountry (28 clusters), 3) ML in columns 5 & 6 stands for multilevel, 4) Parentheses includet and z statistics
16
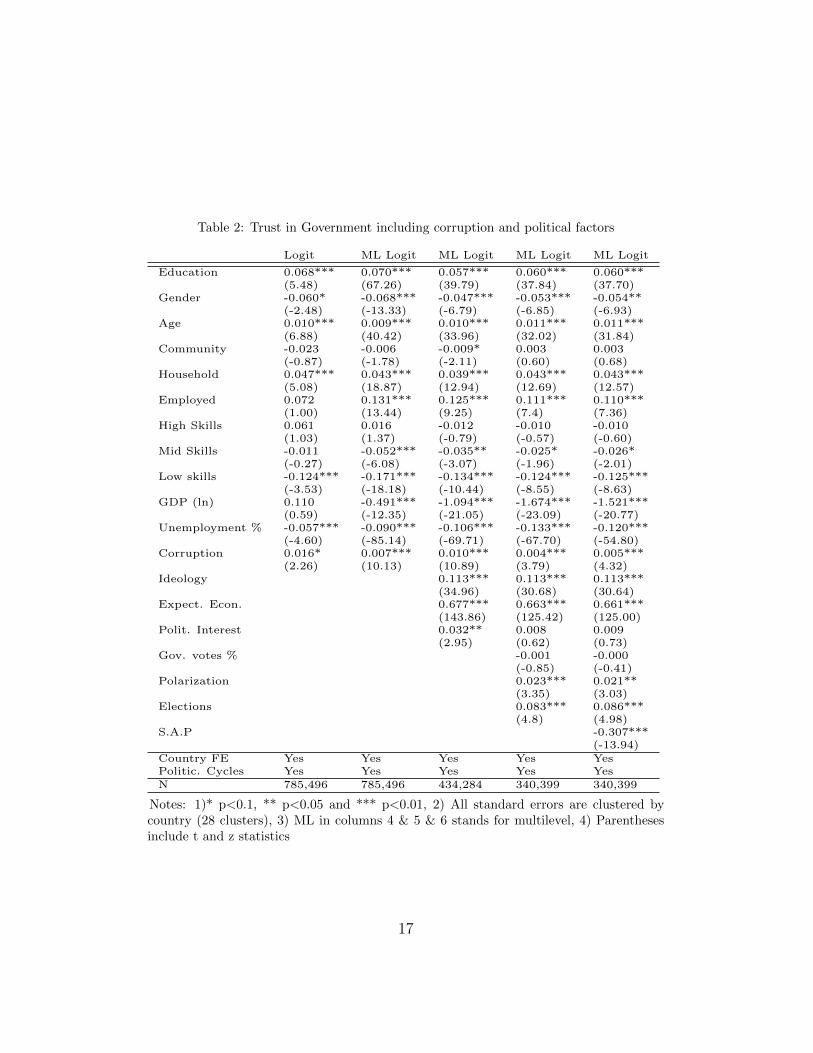
Table 2: Trust in Government including corruption and political factors
Logit ML Logit ML Logit ML Logit ML Logit
Education 0.068*** 0.070*** 0.057*** 0.060*** 0.060***(5.48) (67.26) (39.79) (37.84) (37.70)
Gender -0.060* -0.068*** -0.047*** -0.053*** -0.054**(-2.48) (-13.33) (-6.79) (-6.85) (-6.93)
Age 0.010*** 0.009*** 0.010*** 0.011*** 0.011***(6.88) (40.42) (33.96) (32.02) (31.84)
Community -0.023 -0.006 -0.009* 0.003 0.003(-0.87) (-1.78) (-2.11) (0.60) (0.68)
Household 0.047*** 0.043*** 0.039*** 0.043*** 0.043***(5.08) (18.87) (12.94) (12.69) (12.57)
Employed 0.072 0.131*** 0.125*** 0.111*** 0.110***(1.00) (13.44) (9.25) (7.4) (7.36)
High Skills 0.061 0.016 -0.012 -0.010 -0.010(1.03) (1.37) (-0.79) (-0.57) (-0.60)
Mid Skills -0.011 -0.052*** -0.035** -0.025* -0.026*(-0.27) (-6.08) (-3.07) (-1.96) (-2.01)
Low skills -0.124*** -0.171*** -0.134*** -0.124*** -0.125***(-3.53) (-18.18) (-10.44) (-8.55) (-8.63)
GDP (ln) 0.110 -0.491*** -1.094*** -1.674*** -1.521***(0.59) (-12.35) (-21.05) (-23.09) (-20.77)
Unemployment % -0.057*** -0.090*** -0.106*** -0.133*** -0.120***(-4.60) (-85.14) (-69.71) (-67.70) (-54.80)
Corruption 0.016* 0.007*** 0.010*** 0.004*** 0.005***(2.26) (10.13) (10.89) (3.79) (4.32)
Ideology 0.113*** 0.113*** 0.113***(34.96) (30.68) (30.64)
Expect. Econ. 0.677*** 0.663*** 0.661***(143.86) (125.42) (125.00)
Polit. Interest 0.032** 0.008 0.009(2.95) (0.62) (0.73)
Gov. votes % -0.001 -0.000(-0.85) (-0.41)
Polarization 0.023*** 0.021**(3.35) (3.03)
Elections 0.083*** 0.086***(4.8) (4.98)
S.A.P -0.307***(-13.94)
Country FE Yes Yes Yes Yes YesPolitic. Cycles Yes Yes Yes Yes YesN 785,496 785,496 434,284 340,399 340,399
Notes: 1)* p<0.1, ** p<0.05 and *** p<0.01, 2) All standard errors are clustered bycountry (28 clusters), 3) ML in columns 4 & 5 & 6 stands for multilevel, 4) Parenthesesinclude t and z statistics
17
probabilities for each of the specifications are available at Tables 1 & 2. The reported numbers refer to the change in probability for Y=1 instead of Y=0 for 1 point change of each variable while keeping all other variables at their mean. When using that method in multilevel modelling, the mean for every variable is taken from the mean value of the group that each individual be-longs to and not the overall population mean. To understand the magnitude of each effect, it is important to take into account the measure used for every variable.
For the main variable of interest in this paper, corruption, the coefficient is statistically significant in all specifications of Table 2 and the reported probabilities change reported in column 6 is 0.7%. That means that 1 point increase in the Corruption Perception Index (lower corruption) will increase the probability of trusting a government by 0.7% keeping everything else at the mean. This effect might seem low at first but looking at differences in the Corruption Perception Index (CPI) over the sample the magnitude of the effect becomes clearer. For example, if Greece recovered from its lowest point (36/100 in 2009) to its highest CPI values (48/100 in 2006) the probability of trusting the government would increase by 8,4%. That would be of equal magnitude to the effect of a 0.7% change in the overall unemployment rate on the probability of trusting the national government or a 5.8% in GDP per capita. Immediately it is obvious that according to the results the effects of corruption on the probability to trust a national government are significant both statistically and in nominal terms.
Looking at other control variables, as evidenced by previous literature ed-ucation, age, family and employment are associated with higher probabilities of trusting the national government. In contrast to Mishler and Rose (2001) findings, in this sample individuals living in large towns appear to be more trusting towards the national government than individuals in smaller towns or rural areas. That could be explained partly because citizens of urban ar-eas are closer to the places of decision-making processes and therefore feel a higher level of involvement. The level of overall unemployment rate of the economy seems to have negative impacts on the probability of trusting the government as it is considered an indication of instability in the economy and insecurity about the future. As seen from the variable on expectations about the future of the economy, feeling more secure about the future increases one’s probability to trust the government. The effect of income, approxi-mated by the ln of per capita GDP, paradoxically but in accordance with the existing literature appears to negatively affect trust. Foster and Frieden
18
(2017) in a similar sample of countries and time frame hold that in countries with higher levels of income per capita individuals tend to view institutions less positively, because of the higher expectations for better governance that come from socio-economic development.
With regard to factors related to political cycles, polarisation and electoral events appear to have significant results in levels of political trust. Less po-larised parliaments are correlated with higher probabilities of trusting the government. That could be explained by the fact that in less polarised en-vironments, consensus on legislation can be achieved with more ease and therefore governmental efficacy increases. In addition to that, newly elected governments, less than 12 months of tenure at the time of questionnaire, seem to be associated with higher levels of trust. That can be an indication that individuals mediate their expectations during each government tenure and that expectations in the first period are higher.
4 Robustness Checks
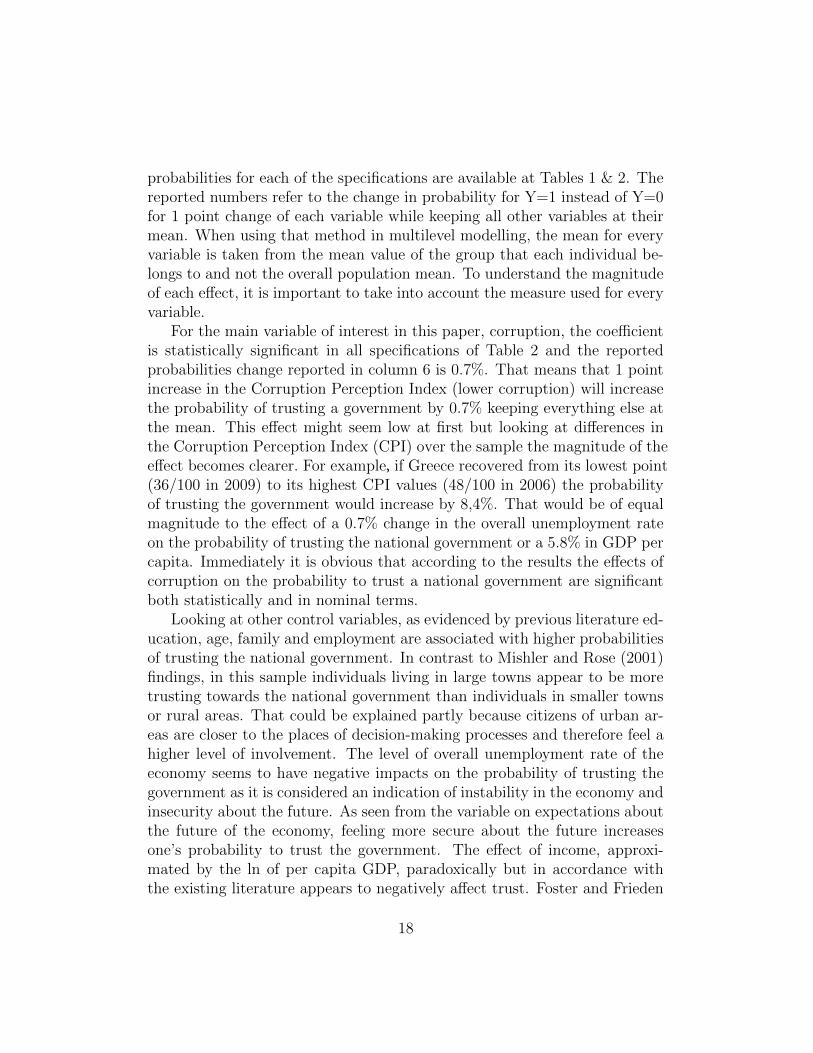
In order to test the validity and robustness of these results, a set of ro-bustness checks are employed. At first, it is necessary to see if any particular subset of the sample is driving the results. As corruption is mostly a phe-nomenon that varies across countries, the tests begin by removing one coun-try by one from the sample and re-estimate the results. Following that, to take into account whether unobserved macroeconomic fluctuations or other random effects of time are affecting this process, years of the sample are re-moved one by one. Results following on Tables 3 & 4 suggest that in the full specification of the model, as in Table 2, corruption remains robustly significant in all subsets both in regard to countries and years.
In Table 4, some outlier values on the coefficients of corruption appear in 2005, 2010, 2017 where the effect of corruption appears to be larger. That is that in these three dates major political and economic events took place in the year prior to the survey and therefore trust levels experiences decreases. Immediately before 2005, in 2004, the first signs of a global economic down-fall started to show with an increase of unemployment rates. Additionally, particularly for the European Countries the ”Treaty establishing a Constitu-tion for Europe” was signed in 2004 that raised dissatisfaction with national governments in countries where the public was against the treaty. The next outlier, 2010, coincides with the collapse of Lehman Brothers and the out-burst of the global financial crisis and the European debt crisis of 2010,
19
events that lead to a significant decrease in the levels of political trust. Fi-nally, 2017 answers follow the 2016 referendum on Brexit and the subsequentnegotiations between European Union and the UK government which wereassociated with lower levels of trust in political institutions.
Table 3: Effect of Corruption Perception Index excluding country by country
Excluded Country Logit Multilevel ML logit ML logit Obs. 2-3 Obs. 4-5 CPI CCR
Austria 0.019** 0.006*** 0.008*** 0.008*** 772,409 450,981 77.543 92.075Belgium 0.016* 0.007*** 0.009*** 0.008*** 755,312 439,090 74.117 90.989Bulgaria 0.016* 0.008*** 0.009*** 0.009*** 758,108 444,163 39.724 52.036Croatia 0.016* 0.005*** 0.008*** 0.008*** 758,018 441,935 44.171 60.442Cyprus 0.018* 0.008*** 0.009*** 0.007*** 771,150 451,323 60.743 81.061Czech Rep. 0.014 0.008*** 0.011*** 0.010*** 754,948 439,491 50.105 67.439Denmark 0.017* 0.006*** 0.008*** 0.007*** 755,608 438,993 92.193 99.499Estonia 0.012 0.007*** 0.009*** 0.009*** 757,869 443,872 66.866 83.430Finland 0.013 0.005*** 0.007*** 0.006*** 755,907 439,766 90.867 98.980France 0.016* 0.007*** 0.008*** 0.008*** 757,038 441,346 70.613 89.780Germany 0.017* 0.007*** 0.009*** 0.008*** 740,965 429,982 79.864 93.688Greece 0.019** 0.006*** 0.009*** 0.010*** 754,745 440,906 41.989 58.138Hungary 0.017* 0.009*** 0.009*** 0.009*** 756,134 441,282 50.447 66.618Ireland 0.016* 0.007*** 0.009*** 0.009*** 757,643 442,461 74.890 92.093Italy 0.014 0.007*** 0.009*** 0.010*** 758,018 444,254 45.395 62.458Latvia 0.017* 0.007*** 0.008*** 0.008*** 756,667 442,860 49.657 66.551Lithuania 0.016* 0.004*** 0.006*** 0.005*** 757,164 445,110 52.918 67.245Luxembourg 0.019** 0.006*** 0.008*** 0.008*** 772,409 450,981 82.792 95.745Malta 0.017* 0.008*** 0.009*** 0.008*** 772,925 453,094 57.177 77.834Netherlands 0.016* 0.007*** 0.009*** 0.008*** 755,412 438,398 85.675 96.204Poland 0.017* 0.007*** 0.009*** 0.008*** 758,486 44,385 52.420 70.847Portugal 0.016* 0.007*** 0.009*** 0.008*** 756,712 443,329 62.466 81.479Romania 0.016* 0.007*** 0.010*** 0.009*** 756,711 443,728 42.069 53.102Slovakia 0.018* 0.008*** 0.010*** 0.008*** 755,729 440,474 47.053 64.471Slovenia 0.016* 0.004*** 0.006*** 0.005*** 755,438 443,067 61.753 78.633Spain 0.016* 0.005*** 0.006*** 0.005*** 757,344 442,661 62.037 78.500Sweden 0.015* 0.008*** 0.011*** 0.010*** 755,423 438,841 90.009 98.405UK 0.018** 0.007*** 0.009*** 0.008*** 748,869 436,948 79.690 93.222Personal Charact. Yes Yes Yes Yes Yes Yes - -Country Charact. Yes Yes Yes Yes Yes Yes - -Political Identity No No Yes Yes No Yes - -Political Climate No No Yes Yes No Yes - -SAP No No Yes Yes No Yes - -
Notes: 1)* p<0.1, ** p<0.05 and *** p<0.01, 2) All standard errors are clustered bycountry (28 clusters) and time (14 years), 3) ML in columns 4 & 5 stands for multilevel,4) Columns 6-7 show the number of observations for columns 2-3 and 4-5 respectively,5) Columns 8-9 show the average scores of Corruption Perception Index & Control forCorruption Rank per country between 2005-2018 respectively
Following the check of subsets related to aggregate characteristics, the
20
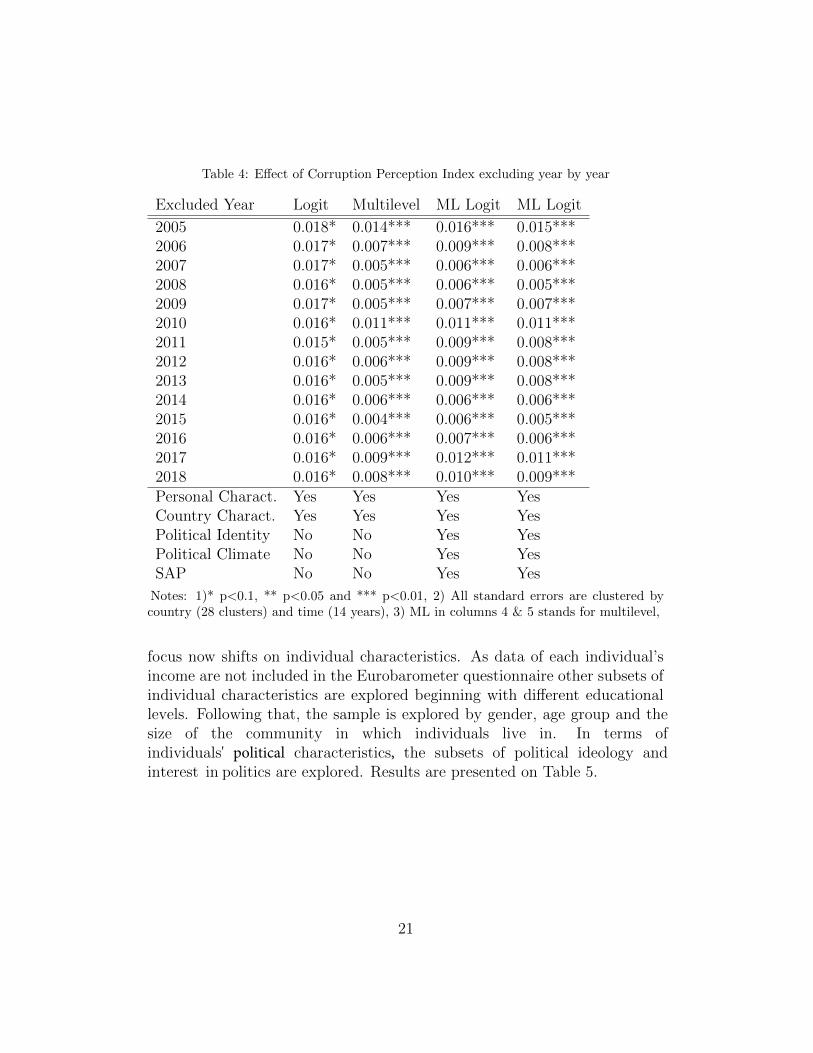
Table 4: Effect of Corruption Perception Index excluding year by year
Excluded Year Logit Multilevel ML Logit ML Logit
2005 0.018* 0.014*** 0.016*** 0.015***2006 0.017* 0.007*** 0.009*** 0.008***2007 0.017* 0.005*** 0.006*** 0.006***2008 0.016* 0.005*** 0.006*** 0.005***2009 0.017* 0.005*** 0.007*** 0.007***2010 0.016* 0.011*** 0.011*** 0.011***2011 0.015* 0.005*** 0.009*** 0.008***2012 0.016* 0.006*** 0.009*** 0.008***2013 0.016* 0.005*** 0.009*** 0.008***2014 0.016* 0.006*** 0.006*** 0.006***2015 0.016* 0.004*** 0.006*** 0.005***2016 0.016* 0.006*** 0.007*** 0.006***2017 0.016* 0.009*** 0.012*** 0.011***2018 0.016* 0.008*** 0.010*** 0.009***Personal Charact. Yes Yes Yes YesCountry Charact. Yes Yes Yes YesPolitical Identity No No Yes YesPolitical Climate No No Yes YesSAP No No Yes Yes
Notes: 1)* p<0.1, ** p<0.05 and *** p<0.01, 2) All standard errors are clustered by country (28 clusters) and time (14 years), 3) ML in columns 4 & 5 stands for multilevel,
focus now shifts on individual characteristics. As data of each individual’s income are not included in the Eurobarometer questionnaire other subsets of individual characteristics are explored beginning with different educational levels. Following that, the sample is explored by gender, age group and the size of the community in which individuals live in. In terms of individuals' political characteristics, the subsets of political ideology and interest in politics are explored. Results are presented on Table 5.
21
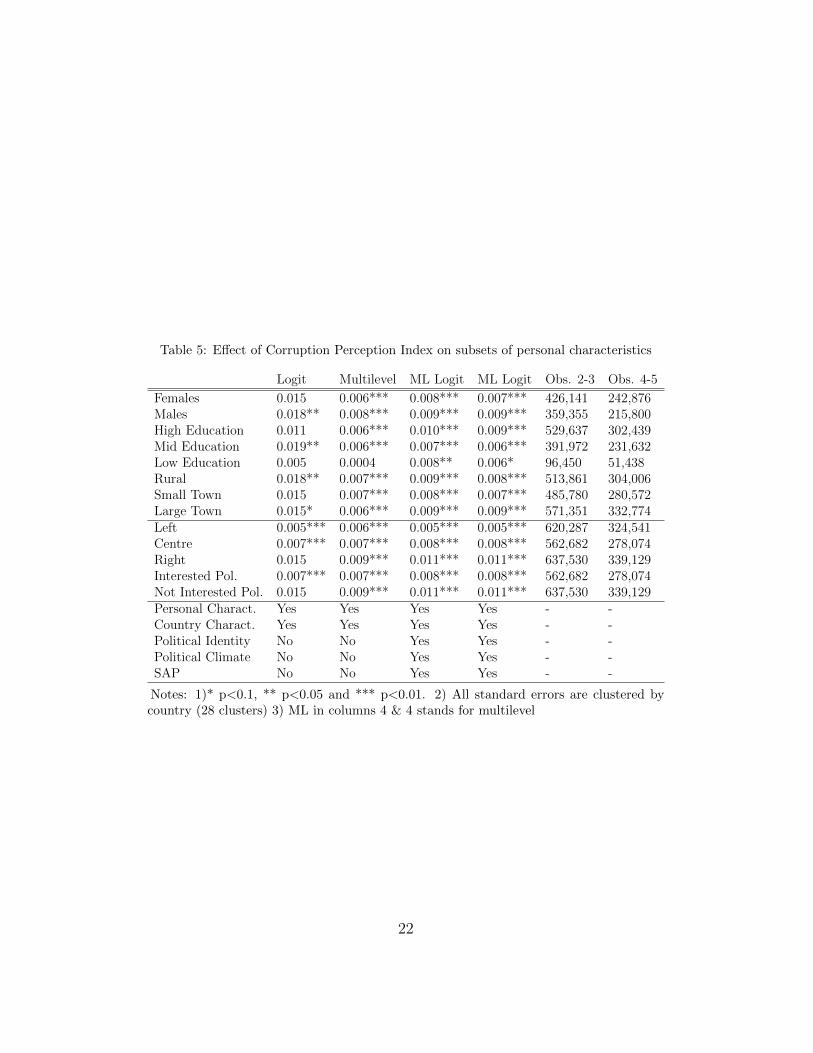
Table 5: Effect of Corruption Perception Index on subsets of personal characteristics
Logit Multilevel ML Logit ML Logit Obs. 2-3 Obs. 4-5
Females 0.015 0.006*** 0.008*** 0.007*** 426,141 242,876Males 0.018** 0.008*** 0.009*** 0.009*** 359,355 215,800High Education 0.011 0.006*** 0.010*** 0.009*** 529,637 302,439Mid Education 0.019** 0.006*** 0.007*** 0.006*** 391,972 231,632Low Education 0.005 0.0004 0.008** 0.006* 96,450 51,438Rural 0.018** 0.007*** 0.009*** 0.008*** 513,861 304,006Small Town 0.015 0.007*** 0.008*** 0.007*** 485,780 280,572Large Town 0.015* 0.006*** 0.009*** 0.009*** 571,351 332,774Left 0.005*** 0.006*** 0.005*** 0.005*** 620,287 324,541Centre 0.007*** 0.007*** 0.008*** 0.008*** 562,682 278,074Right 0.015 0.009*** 0.011*** 0.011*** 637,530 339,129Interested Pol. 0.007*** 0.007*** 0.008*** 0.008*** 562,682 278,074Not Interested Pol. 0.015 0.009*** 0.011*** 0.011*** 637,530 339,129Personal Charact. Yes Yes Yes Yes - -Country Charact. Yes Yes Yes Yes - -Political Identity No No Yes Yes - -Political Climate No No Yes Yes - -SAP No No Yes Yes - -
Notes: 1)* p<0.1, ** p<0.05 and *** p<0.01. 2) All standard errors are clustered bycountry (28 clusters) 3) ML in columns 4 & 4 stands for multilevel
22
4.1 Control for Corruption IndexIn this subsection, the specifications of Table 2 are re-estimated using
a different index for corruption to test whether results are driven by that choice. To do so, the Control for Corruption Index by Kaufmann et al. (2011) is employed. This index captures perceptions of the extent to which public power is exercised for private gain, including both petty and grand forms of corruption, as well as the levels of how ”captured the state” is by elites and private interests. The index is in the form of percentile rank which indicates the country’s rank among all countries covered by the aggregate indicator, with 0 corresponding to lowest rank, and 100 to highest rank (Kaufmann et al., 2011). Results shown in Table 6 suggest that the effect of corruption on trust in national government is persistently significant and robust across indices used. To compare the magnitude of the two indices, using the same example of Greece, the change of corruption from the lowest point to the highest one of the samples will result a % increase in the probability of trusting the national government.
4.2 Reverse causalityOne of the main problems that needs to be addressed in regards with
the relationship of political trust and corruption is the possibility of reverse causality. Part of the literature suggests that political trust can affect the formation of institutions and its quality (Uslaner, 2008b). The ideal way to deal with this issue would be to observe a representative sample of the same individuals over time, record their views on trust and corruption, and the frequency of their interactions with the public sector. Then one could investigate whether trusting the government can result more corruption and a form of clientelist relationship between individuals and governments. Since there is a lack of such data, a different methodology is employed.
For political trust to be able to affect corruption levels it has to be trans-formed to a form of active support to the government, which is mostly demon-strated through elections. In that case, each individual’s decision to trust a government is important, but the most crucial role lies with the aggregation of individual decisions that form a government. Therefore, one could claim that the aggregate levels of political trust towards the national government matter rather than individual ones in determining the quality of governance. To explore that, the levels of political trust are aggregated for each year, and their lagged values for 3 years are computed. These lagged variables are then regressed in a panel data setting on the levels of perceived corruption
23
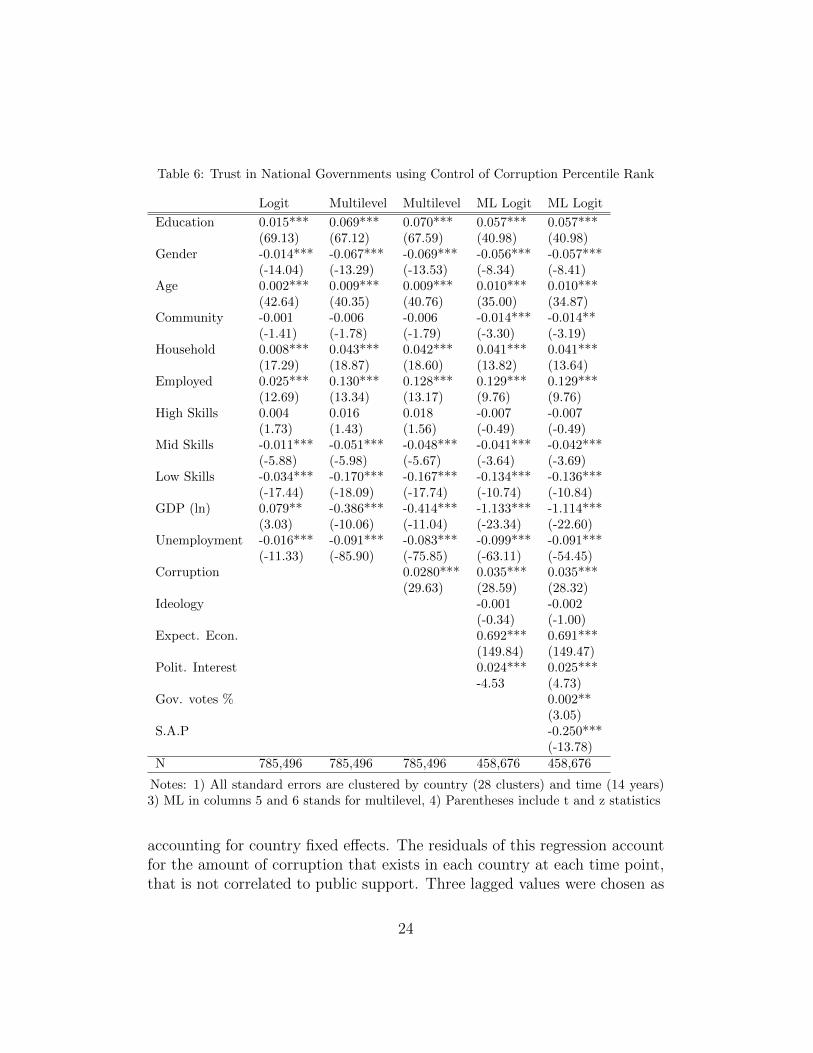
Table 6: Trust in National Governments using Control of Corruption Percentile Rank
Logit Multilevel Multilevel ML Logit ML Logit
Education 0.015*** 0.069*** 0.070*** 0.057*** 0.057***(69.13) (67.12) (67.59) (40.98) (40.98)
Gender -0.014*** -0.067*** -0.069*** -0.056*** -0.057***(-14.04) (-13.29) (-13.53) (-8.34) (-8.41)
Age 0.002*** 0.009*** 0.009*** 0.010*** 0.010***(42.64) (40.35) (40.76) (35.00) (34.87)
Community -0.001 -0.006 -0.006 -0.014*** -0.014**(-1.41) (-1.78) (-1.79) (-3.30) (-3.19)
Household 0.008*** 0.043*** 0.042*** 0.041*** 0.041***(17.29) (18.87) (18.60) (13.82) (13.64)
Employed 0.025*** 0.130*** 0.128*** 0.129*** 0.129***(12.69) (13.34) (13.17) (9.76) (9.76)
High Skills 0.004 0.016 0.018 -0.007 -0.007(1.73) (1.43) (1.56) (-0.49) (-0.49)
Mid Skills -0.011*** -0.051*** -0.048*** -0.041*** -0.042***(-5.88) (-5.98) (-5.67) (-3.64) (-3.69)
Low Skills -0.034*** -0.170*** -0.167*** -0.134*** -0.136***(-17.44) (-18.09) (-17.74) (-10.74) (-10.84)
GDP (ln) 0.079** -0.386*** -0.414*** -1.133*** -1.114***(3.03) (-10.06) (-11.04) (-23.34) (-22.60)
Unemployment -0.016*** -0.091*** -0.083*** -0.099*** -0.091***(-11.33) (-85.90) (-75.85) (-63.11) (-54.45)
Corruption 0.0280*** 0.035*** 0.035***(29.63) (28.59) (28.32)
Ideology -0.001 -0.002(-0.34) (-1.00)
Expect. Econ. 0.692*** 0.691***(149.84) (149.47)
Polit. Interest 0.024*** 0.025***-4.53 (4.73)
Gov. votes % 0.002**(3.05)
S.A.P -0.250***(-13.78)
N 785,496 785,496 785,496 458,676 458,676
Notes: 1) All standard errors are clustered by country (28 clusters) and time (14 years)3) ML in columns 5 and 6 stands for multilevel, 4) Parentheses include t and z statistics
accounting for country fixed effects. The residuals of this regression accountfor the amount of corruption that exists in each country at each time point,that is not correlated to public support. Three lagged values were chosen as
24
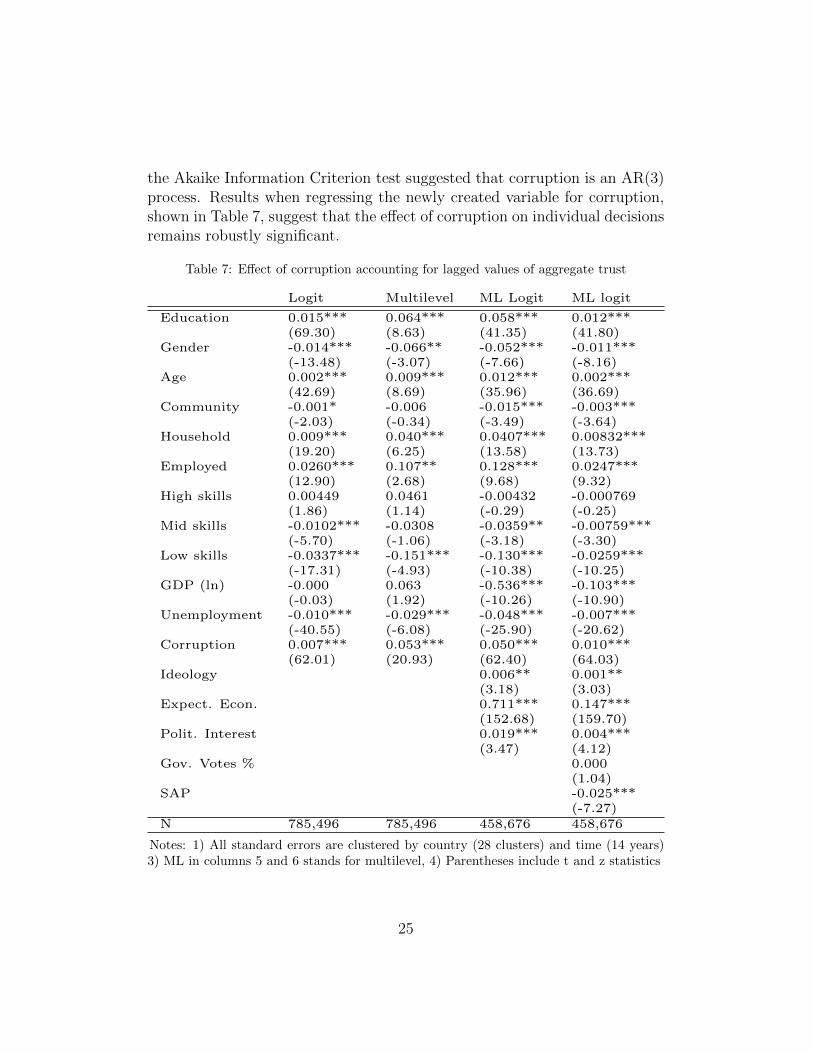
the Akaike Information Criterion test suggested that corruption is an AR(3)process. Results when regressing the newly created variable for corruption,shown in Table 7, suggest that the effect of corruption on individual decisionsremains robustly significant.
Table 7: Effect of corruption accounting for lagged values of aggregate trust
Logit Multilevel ML Logit ML logit
Education 0.015*** 0.064*** 0.058*** 0.012***(69.30) (8.63) (41.35) (41.80)
Gender -0.014*** -0.066** -0.052*** -0.011***(-13.48) (-3.07) (-7.66) (-8.16)
Age 0.002*** 0.009*** 0.012*** 0.002***(42.69) (8.69) (35.96) (36.69)
Community -0.001* -0.006 -0.015*** -0.003***(-2.03) (-0.34) (-3.49) (-3.64)
Household 0.009*** 0.040*** 0.0407*** 0.00832***(19.20) (6.25) (13.58) (13.73)
Employed 0.0260*** 0.107** 0.128*** 0.0247***(12.90) (2.68) (9.68) (9.32)
High skills 0.00449 0.0461 -0.00432 -0.000769(1.86) (1.14) (-0.29) (-0.25)
Mid skills -0.0102*** -0.0308 -0.0359** -0.00759***(-5.70) (-1.06) (-3.18) (-3.30)
Low skills -0.0337*** -0.151*** -0.130*** -0.0259***(-17.31) (-4.93) (-10.38) (-10.25)
GDP (ln) -0.000 0.063 -0.536*** -0.103***(-0.03) (1.92) (-10.26) (-10.90)
Unemployment -0.010*** -0.029*** -0.048*** -0.007***(-40.55) (-6.08) (-25.90) (-20.62)
Corruption 0.007*** 0.053*** 0.050*** 0.010***(62.01) (20.93) (62.40) (64.03)
Ideology 0.006** 0.001**(3.18) (3.03)
Expect. Econ. 0.711*** 0.147***(152.68) (159.70)
Polit. Interest 0.019*** 0.004***(3.47) (4.12)
Gov. Votes % 0.000(1.04)
SAP -0.025***(-7.27)
N 785,496 785,496 458,676 458,676
Notes: 1) All standard errors are clustered by country (28 clusters) and time (14 years)3) ML in columns 5 and 6 stands for multilevel, 4) Parentheses include t and z statistics
25
5 Conclusions
This chapter attempts to explore what are the determinants of trust in government in Europe and what is the role of corruption in this process. Motivated by the declining levels of political trust in European countries in the era of austerity, data from the Eurobarometer (2005-2018) were used to see which factors affect the decision to trust a national government. Foster and Frieden (2017) showed in a similar sample that socio-economic factors are the key drivers for these decisions whilst Torcal (2014) holds that the observed decline of political trust in some European Countries (Spain and Portugal) is primarily due to political responsiveness rather than to responses on economic performance.
Taking the analysis a step forward, this work provides empirical evidence suggesting that this response to political outcomes does not stem from a significant institutional change (structural break) but rather is a realisation of citizens of a fomenting problem of institutional quality. Results suggest that under all specifications, the levels of perceived corruption negatively affect the probability of reporting trust in the national government. The impact of corruption is considered significant and remains robust across all specifications as a 10% change in the Corruption Perception Index has the same effect on the probability of trusting the government with a 4,83% change in GDP per capita.
The limitations of this research are centred around the fact that due to the lack of genuine panel data tracking the same individuals over time, it is not possible to address issues of endogeneity and indirect effects of corruption on political trust. However, through the use of multilevel analysis that allows to capture country and time specific effects, potential biases are reduced to a minimum. The paper adds to an increasing body of the literature of compar-ative political economy on what determines trust in political institutions and whether political factors are as important factors as socio-economic ones.
26
Appendix
Data Description
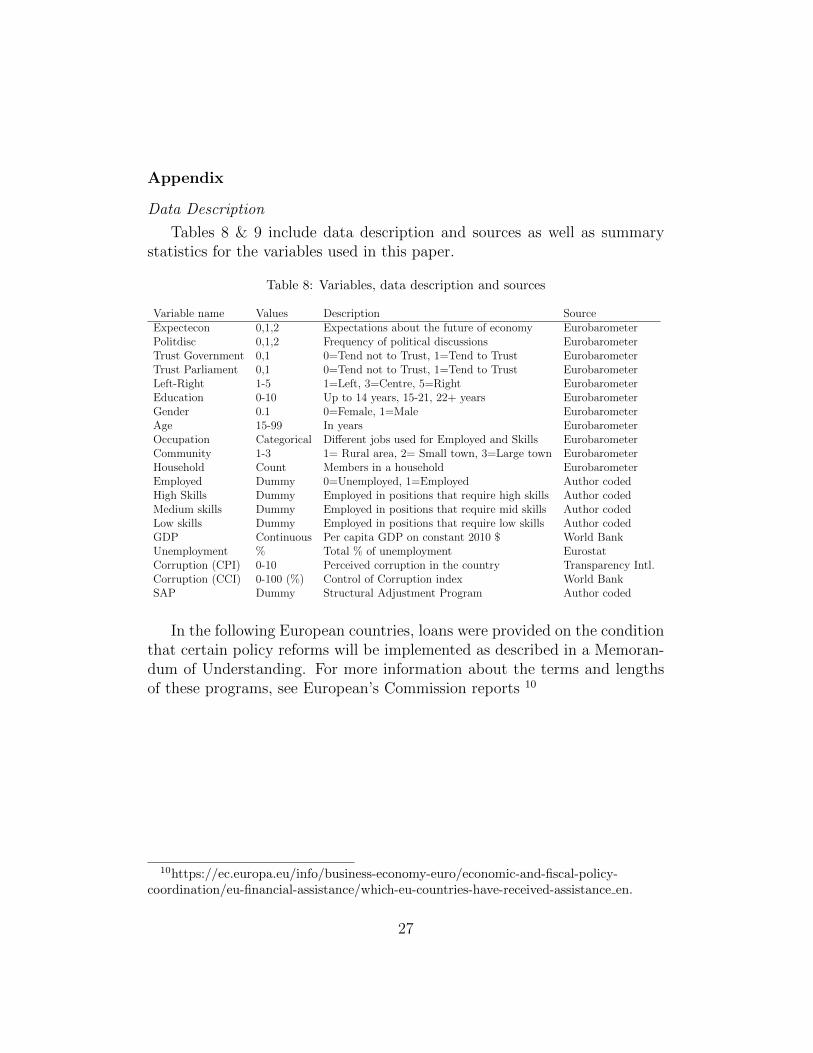
Tables 8 & 9 include data description and sources as well as summarystatistics for the variables used in this paper.
Table 8: Variables, data description and sources
Variable name Values Description SourceExpectecon 0,1,2 Expectations about the future of economy EurobarometerPolitdisc 0,1,2 Frequency of political discussions EurobarometerTrust Government 0,1 0=Tend not to Trust, 1=Tend to Trust EurobarometerTrust Parliament 0,1 0=Tend not to Trust, 1=Tend to Trust EurobarometerLeft-Right 1-5 1=Left, 3=Centre, 5=Right EurobarometerEducation 0-10 Up to 14 years, 15-21, 22+ years EurobarometerGender 0.1 0=Female, 1=Male EurobarometerAge 15-99 In years EurobarometerOccupation Categorical Different jobs used for Employed and Skills EurobarometerCommunity 1-3 1= Rural area, 2= Small town, 3=Large town EurobarometerHousehold Count Members in a household EurobarometerEmployed Dummy 0=Unemployed, 1=Employed Author codedHigh Skills Dummy Employed in positions that require high skills Author codedMedium skills Dummy Employed in positions that require mid skills Author codedLow skills Dummy Employed in positions that require low skills Author codedGDP Continuous Per capita GDP on constant 2010 $ World BankUnemployment % Total % of unemployment EurostatCorruption (CPI) 0-10 Perceived corruption in the country Transparency Intl.Corruption (CCI) 0-100 (%) Control of Corruption index World BankSAP Dummy Structural Adjustment Program Author coded
In the following European countries, loans were provided on the conditionthat certain policy reforms will be implemented as described in a Memoran-dum of Understanding. For more information about the terms and lengthsof these programs, see European’s Commission reports 10
10https://ec.europa.eu/info/business-economy-euro/economic-and-fiscal-policy-coordination/eu-financial-assistance/which-eu-countries-have-received-assistance en.
27
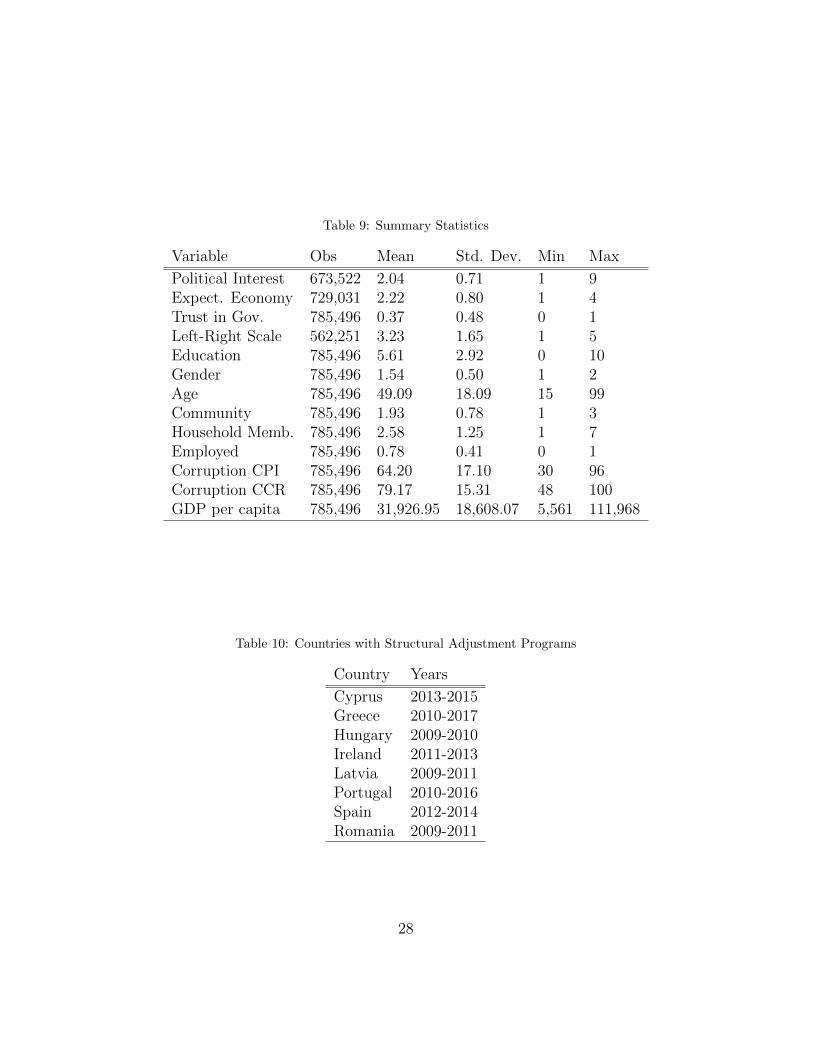
Table 9: Summary Statistics
Variable Obs Mean Std. Dev. Min Max
Political Interest 673,522 2.04 0.71 1 9Expect. Economy 729,031 2.22 0.80 1 4Trust in Gov. 785,496 0.37 0.48 0 1Left-Right Scale 562,251 3.23 1.65 1 5Education 785,496 5.61 2.92 0 10Gender 785,496 1.54 0.50 1 2Age 785,496 49.09 18.09 15 99Community 785,496 1.93 0.78 1 3Household Memb. 785,496 2.58 1.25 1 7Employed 785,496 0.78 0.41 0 1Corruption CPI 785,496 64.20 17.10 30 96Corruption CCR 785,496 79.17 15.31 48 100GDP per capita 785,496 31,926.95 18,608.07 5,561 111,968
Table 10: Countries with Structural Adjustment Programs
Country Years
Cyprus 2013-2015Greece 2010-2017Hungary 2009-2010Ireland 2011-2013Latvia 2009-2011Portugal 2010-2016Spain 2012-2014Romania 2009-2011
28
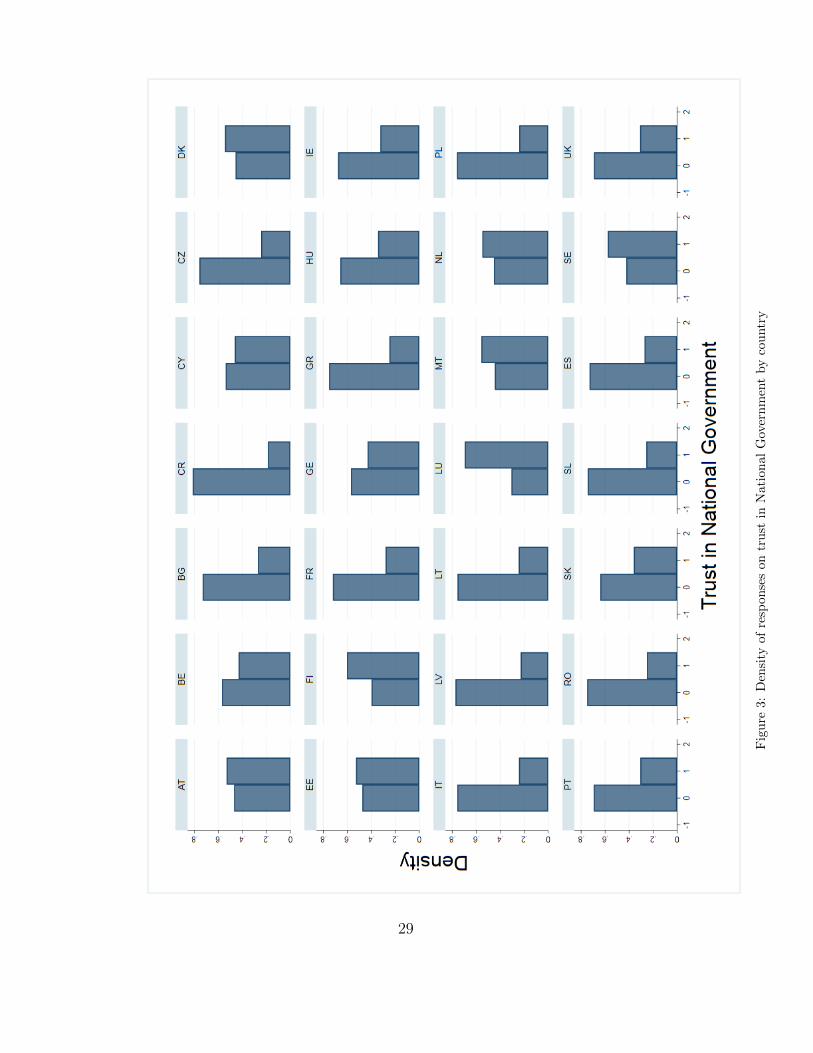
Fig
ure
3:D
ensi
tyof
resp
on
ses
on
tru
stin
Nati
on
al
Gov
ern
men
tby
cou
ntr
y
29
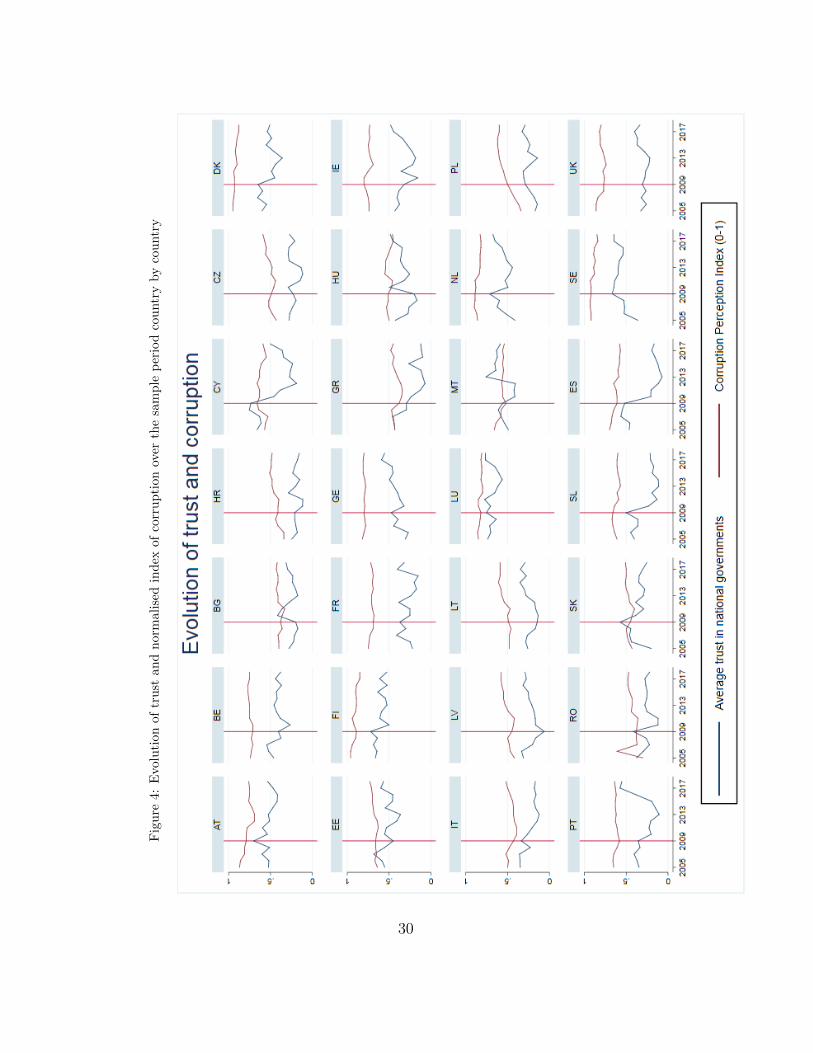
Fig
ure
4:E
volu
tion
oftr
ust
an
dn
orm
ali
sed
ind
exof
corr
up
tion
over
the
sam
ple
per
iod
cou
ntr
yby
cou
ntr
y
30
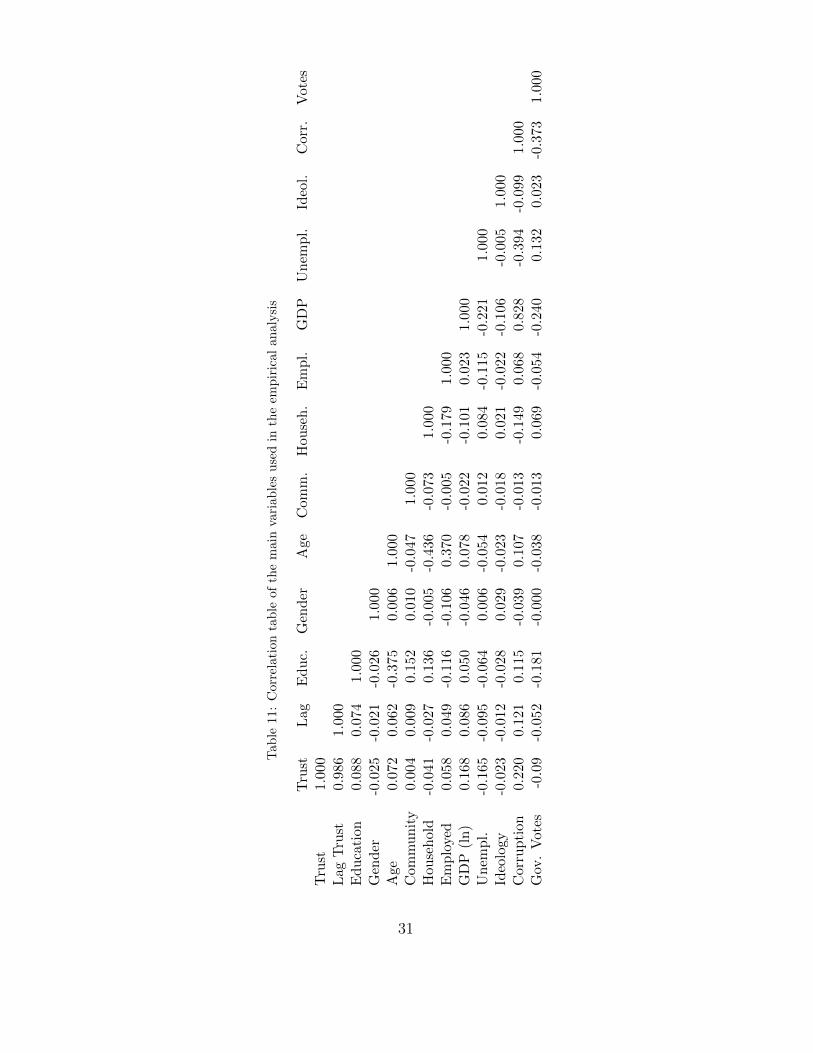
Tab
le11
:C
orre
lati
on
tab
leof
the
main
vari
ab
les
use
din
the
emp
iric
al
an
aly
sis
Tru
stL
agE
du
c.G
end
erA
geC
omm
.H
ouse
h.
Em
pl.
GD
PU
nem
pl.
Ideo
l.C
orr
.V
ote
sT
rust
1.00
0L
agT
rust
0.98
61.
000
Ed
uca
tion
0.08
80.
074
1.00
0G
end
er-0
.025
-0.0
21-0
.026
1.00
0A
ge0.
072
0.06
2-0
.375
0.00
61.
000
Com
mu
nit
y0.
004
0.00
90.
152
0.01
0-0
.047
1.00
0H
ouse
hol
d-0
.041
-0.0
270.
136
-0.0
05-0
.436
-0.0
731.
000
Em
plo
yed
0.05
80.
049
-0.1
16-0
.106
0.37
0-0
.005
-0.1
791.
000
GD
P(l
n)
0.16
80.
086
0.05
0-0
.046
0.07
8-0
.022
-0.1
010.
023
1.00
0U
nem
pl.
-0.1
65-0
.095
-0.0
640.
006
-0.0
540.
012
0.08
4-0
.115
-0.2
211.
000
Ideo
logy
-0.0
23-0
.012
-0.0
280.
029
-0.0
23-0
.018
0.02
1-0
.022
-0.1
06-0
.005
1.00
0C
orru
pti
on0.
220
0.12
10.
115
-0.0
390.
107
-0.0
13-0
.149
0.06
80.
828
-0.3
94-0
.099
1.0
00
Gov
.V
otes
-0.0
9-0
.052
-0.1
81-0
.000
-0.0
38-0
.013
0.06
9-0
.054
-0.2
400.
132
0.023
-0.3
73
1.0
00
31
References
Algan, Y., Guriev, S., Papaioannou, E., Passari, E., 2017. The uropean trustcrisis and the rise of populism. Brookings Papers on Economic Activity2017, 309–400.
Arrow, K.J., 1974. The limits of organization. WW Norton & Company.
Barrels, L., 1996. Pooling disparate observations. American Journal of Po-litical Science 40, 905–942.
Berggren, N., Nilsson, T., 2020. Economic freedom as a driver of trust andtolerance .
Bjørnskov, C., 2010. How does social trust lead to better governance? anattempt to separate electoral and bureaucratic mechanisms. Public Choice144, 323–346.
Bookman, J., 1992. The wisdom of the many: an analysis of the argumentsof books iii and iv of aristotle’s politics. History of Political Thought 13,1–12.
Brewer, P.R., Gross, K., Aday, S., Willnat, L., 2004. International trust andpublic opinion about world affairs. American Journal of Political Science48, 93–109.
Camussi, S., Mancini, A.L., 2019. Individual trust: does quality of localinstitutions matter? Journal of Institutional Economics 15, 487–503.
Drakos, K., Kallandranis, C., Karidis, S., . Determinants of trust in institu-tions: Survey-based evidence from the european union .
Erikson, E.H., 1994. Identity and the life cycle. WW Norton & Company.
Farrell, H., 2009. The political economy of trust: Institutions, interests, andinter-firm cooperation in Italy and Germany. Cambridge University Press.
Fehr, E., 2009. On the economics and biology of trust. Journal of theEuropean economic association 7, 235–266.
Foster, C., Frieden, J., 2017. Crisis of trust: Socio-economic determinants of Europeans confidence in government. European Union Politics 18, 511–535.
32
Geurkink, B., Zaslove, A., Sluiter, R., Jacobs, K., 2020. Populist attitudes,political trust, and external political efficacy: Old wine in new bottles?Political Studies 68, 247–267.
Glanville, J.L., Paxton, P., 2007. How do we learn to trust? a confirma-tory tetrad analysis of the sources of generalized trust. Social PsychologyQuarterly 70, 230–242.
Graeff, P., Svendsen, G.T., 2013. Trust and corruption: The influence ofpositive and negative social capital on the economic development in the European Union. Quality & Quantity 47, 2829–2846.
Guiso, L., Sapienza, P., Zingales, L., 2006. Does culture affect economicoutcomes? Journal of Economic perspectives 20, 23–48.
Guiso, L., Sapienza, P., Zingales, L., 2009. Cultural biases in economicexchange? The Quarterly Journal of Economics 124, 1095–1131.
Hardin, R., 2002. Liberal distrust. European Review 10, 73–89.
Hetherington, M.J., 1998. The political relevance of political trust. Americanpolitical science review 92, 791–808.
Hooghe, M., 2011. Why there is basically only one form of political trust.The British Journal of Politics & International Relations 13, 269–275.
Hudson, J., 2006. Institutional trust and subjective well-being across the eu.Kyklos 59, 43–62.
Kaufmann, D., Kraay, A., Mastruzzi, M., 2011. The Worldwide GovernanceIndicators: Methodology and Analytical Issues. Hague Journal on the Ruleof Law 3, 220–246. doi:10.1017/S1876404511200046.
Knack, S., Keefer, P., 1995. Institutions and economic performance: cross-country tests using alternative institutional measures. Economics & Poli-tics 7, 207–227.
La Porta, R., Lopez-de Silanes, F., Shleifer, A., Vishny, R., 1997. LegalDeterminants of External Finance. NBER Working Papers 3. NationalBureau of Economic Research, Inc. doi:10.2307/2329518.
33
Lipset, S.M., Schneider, W., 1983. The decline of confidence in Americaninstitutions. Political Science Quarterly 98, 379–402.
Marien, S., 2011. The effect of electoral outcomes on political trust: Amulti–level analysis of 23 countries. Electoral Studies 30, 712–726.
Van der Meer, T., Hakhverdian, A., 2017. Political trust as the evaluation ofprocess and performance: A cross-national study of 42 European countries. Political Studies 65, 81–102.
Mehmetoglu, M., Jakobsen, T.G., 2016. Applied statistics using Stata: aguide for the social sciences. Sage.
Mishler, W., Rose, R., 2001. What are the origins of political trust? testinginstitutional and cultural theories in post-communist societies. Compara-tive political studies 34, 30–62.
Putnam, R.D., Leonardi, R., Nanetti, R.Y., 1994. Making Democracy Work:Civic Traditions in Modern Italy. Princeton paperbacks, Princeton Uni-versity Press.
Rodet, C.S., 2015. An experiment in political trust. Journal of Behavioraland Experimental Economics 57, 17–25.
Rose-Ackerman, S., Palifka, B.J., 2016. Corruption and government: Causes,consequences, and reform. Cambridge university press.
Rothstein, B., Stolle, D., 2008. The state and social capital: An institutionaltheory of generalized trust. Comparative politics 40, 441–459.
Rousseau, D.M., Sitkin, S.B., Burt, R.S., Camerer, C., 1998. Not so differentafter all: A cross-discipline view of trust. Academy of management review23, 393–404.
Schneider, I., 2017. Can we trust measures of political trust? assessing mea-surement equivalence in diverse regime types. Social indicators research133, 963–984.
Scholz, J.T., Lubell, M., 1998. Adaptive political attitudes: Duty, trust,and fear as monitors of tax policy. American Journal of Political Science, 903–920.
34
Serritzlew, S., Sønderskov, K.M., Svendsen, G.T., 2014. Do corruption andsocial trust affect economic growth? a review. Journal of ComparativePolicy Analysis: Research and Practice 16, 121–139.
Seyd, B., 2015. Exploring political disappointment. Parliamentary Affairs69, 327–347.
Tabellini, G., 2008. The scope of cooperation: Values and incentives. TheQuarterly Journal of Economics 123, 905–950.
Torcal, M., 2014. The decline of political trust in Spain and Portugal: eco-nomic performance or political responsiveness? American Behavioral Sci-entist 58, 1542–1567.
Uslaner, E.M., 2004. Trust and corruption, in: The new institutional eco-nomics of corruption. Routledge, pp. 90–106.
Uslaner, E.M., 2008a. Corruption, inequality, and the rule of law: Thebulging pocket makes the easy life. Cambridge University Press.
Uslaner, E.M., 2008b. Where you stand depends upon where your grandpar-ents sat: The inheritability of generalized trust. Public opinion quarterly72, 725–740.
Uslaner, E.M., 2018. The Oxford Handbook of Social and Political Trust.Oxford University Press.
You, J.s., 2018. Trust and corruption. The Oxford Handbook of Social andPolitical Trust , 473.
Zack, P., Knack, S., 2001. Trust and growth, 295–321 in. Economic Journal111.
35
Research at the Institute for Global Prosperity at UCL aims to generate new insights about sustainable and inclusive prosperity and provide new models for developing and interpreting evidence.
Underlying our research is a rethinking of what we mean by prosperity. Prosperity must mean enabling people to flourish in ways beyond financial growth –and doing so equitably and sustainably, for humankind and the planet. We work with businesses, NGOs and citizens to produce interdisciplinary methodologies and problem-focused research.
For more information about our wide range of current projects and our innovative Masters and
PhD programmes please see: www.ucl.ac.uk/bartlett/igp/
The Institute for Global ProsperityMaple House, 149 Tottenham Court RoadLondon, W1T 7NF
Institute for Global Prosperity

ISBN: 978-1-913041-16-8
CONTACT
www.seriouslydifferent.org [email protected]
@glo_pro @glo_pro@instituteforglobalprosperity