europe and the international agricultural and food trade… · 2006-08-04 · europe and the...
TRANSCRIPT

EUROPE AND THE
INTERNATIONAL
AGRICULTURAL AND FOOD
TRADE, 1870-2000.
Gema Aparicio (*), Vicente Pinilla (**) and Raúl Serrano (**)1
1. Introduction
Between 1870 and the year 2000, international trade in food and agricultural raw
materials underwent unprecedented growth, in which Europe played a key role. This long
period may be divided into two distinct stages. In the first of these, lasting until the Second
World War, agricultural and food trade grew at a very similar rate to that of total trade. In the
second period, however, its relative growth, both in terms of volume and value, was
considerably lower, meaning that by the end of the period it represented a very minor part of
trade as a whole.
1 (*) Research Group on the History of the Agrifood Economy (XIX and XX centuries), University of Zaragoza,
Spain. E-mail: [email protected]
(**) Department of Applied Economics and Economic History, University of Zaragoza, Spain. E-mail:
[email protected], [email protected]
1
IEHC 2006 Helsinki Session 60
The expansion of international trade in the XIX century, continuing until the First
World War, is an undisputed fact of economic history, and the reasons for this growth are
also clear; incomes rose as the cost of maritime and overland transport fell, resulting in
market integration and a general trend towards free trade, encouraged most particularly by
the United Kingdom. Moreover, a highly stable international monetary system, based on the
gold standard, gradually included more and more countries (O’Rourke and Williamson,
1999; Estevadeordal et al., 2003). Farm products were a key component of the increase in
international trade, approximately half of which consisted of food products and agricultural
commodities. Moreover, inter-industrial trade (i.e. between manufactures and primary goods)
is fundamental to the explanation of international exchanges of goods. The increasing
integration of markets, sometimes called the first globalisation, also had a significant impact
on agriculture. Thus, the agricultural depression widespread at the end of the XIX century
was a direct outcome of intensifying competition, in European markets, between continental
farmers and those from other countries, mainly the Americas and the eastern fringes of
Europe, where huge tracts of new land were being brought into cultivation (Tracy, 1964;
O’Rourke, 1997).
The First World War and, above all, the disruption of the international economy
caused by the crisis of 1929 and the collapse of the free trade system, radically affected trade
patterns (Findlay and O’Rourke, 2003). Firstly, the war caused a temporary contraction of
trade, which gradually recovered during the 1920s and resumed a clear growth path by the
end of the decade. The crash, however, had far-reaching effects; international trade shrank in
terms in terms of both volume and value. Agricultural products were not immune to these
problems, suffering heavily from falling prices and the protectionist barriers erected in this
period.
Following the Second World War, and especially during the years of the "golden age
of capitalism", the world economy accelerated at an unprecedented pace. Generalized
growth, the liberalization of international trade and improvements in transport and
communications and exchange rate stability provided a tremendous boost to international
trade. According to Maddison (2001), trade flows increased rapidly between 1950 and 1973
and, despite the slowdown between 1973 and 1988, such growth in the second half of the
2

twentieth century exceeded that of all previous epochs. Furthermore, trade grew at a faster
rate than production, causing markets to become intensively integrated.
Thus, agricultural trade experienced unprecedented growth between 1951 and 2000,
expanding much faster than in earlier periods. Simultaneously, agricultural markets became
increasingly and rapidly integrated, especially in the case of Europe, since within the
European Economic Community/European Union the barriers to trade were progressively
eliminated.
This period also witnessed changes in the direction, constitution and structure of
international trade, in favour of the exchange of manufactured goods between industrialised
nations (Krugman and Obstfeld, 2001). Thus, trade between the developed countries
increasingly took the form of exchanges of differentiated products and the circulation of
semi-finished goods and parts between the subsidiaries of vertically integrated multinational
companies.
Consequently, the percentage of total international trade represented by agricultural
goods declined sharply in this period; from a figure of 43.0% in 1951, this share had shrunk
to merely 6.7% (at current values) by the year 2000.
2. The evolution of the international agricultural and food trade
2.1. Rise and fall of the complementarity of the international agricultural and
food trade and industrialisation: 1870-1938
In the second half of the XIX century international trade expanded rapidly. Although
data for exclusively agricultural products are not available, the estimations performed by
Lewis (1952 and 1981) for primary products as a whole indicate an annual growth rate of
3.7% between 1850 and 1900. This rate of expansion was considerably higher in the third
quarter of the century than in the fourth, which is logical if we take into account the first
globalisation which began around 1850, the low initial level of exchanges and the return to
protectionism which took place in the last two decades of the century, as a result of the
"invasion" of Europe by agricultural products from overseas and the Russian Empire.
3

It has been emphasised that, in addition to rising incomes, falling transport costs were
a key factor in this pronounced growth in international trade (O’Rourke and Williamson,
1999). The trend towards liberalism, in the form of a multilateral trade network in which
bilateral treaties played a central role, and the existence of the gold standard, which other
countries (following the example of Great Britain) progressively adopted, smoothed the way
for this expansion of world trade.
TABLE 1 Agricultural and food trade (by volume) - Average annual growth
1850-1902 3.7
1850-1875 4.6 1875-1902 3.0
1903-1938 1.4 1903-1913 3.3 1913-1918 -10.9 1918-1929 7.8
1929-1938 -1.1
1951-2000 4.0 1951-1973 4.6 1974-2000 3.5
Source: 1850-1902, Lewis (1981); 1903-1908, Aparicio (2000); 1951-2000 authors' calculations, based on FAO (1947-2000), Faostat, FAO (2004a), UN Comtrade (2003) and WTO (2003) - see Statistical Appendix. The data for 1850-1902 are all for primary products and include non-agricultural commodities
For the first third of the XX century we are able to use our own data, which in this
case refer exclusively to agricultural and food products. The trend until 1913 prolonged the
growth witnessed in the preceding century, which then fell sharply during the First World
War, to then recover and expand rapidly until the crash of 1929, when it initally dipped and
then stagnated. Over this period as a whole, agricultural trade grew at an average annual rate
of 1.4%, considerably less than the rate of 3.7% achieved in the second half of the XIX
century2. The sharp slowdown in the growth of trade in this period does not reflect the
deceleration that occurred in the final quarter of the XIX century, when growth slowed from
4.6% between 1850 and 1875 to 3.0% between 1875 and 1902 (Lewis, 1981). Instead, it is
2 Comparing Lewis’ (1981) data for all primary products with our figures (which include only agricultural products) for the period 1903 to 1938, the resulting growth rate is 1.44% in the former case and 1.35% in the latter. It would thus appear that the growth in agricultural products in the second half of the XIX century may, in fact, have been very similar to that of primary products as a whole.
4

the result of an external political shock (World War I) and of the economic shock resulting
from the crisis that began in 1929 and which, logically, affected international trade.
This is clearly consistent with the fact that the volume of international trade in
agricultural raw materials and food grew at an annual rate of 3.3%, very similar to that of the
preceding three decades. Thus, we may conclude that the pattern of international trade until
1914 was very similar to that of the late XIX century, and was only interrupted by the
outbreak of war.
The 1913 trade volume of $13,743 million fell to just $7,704 million in 1918 (at 1925
prices), representing a negative annual growth rate of 10.9% during the war years.
Source: 1870-1902: Lewis (1951) and (1981); 1903-1938: authors' calculation. See appendix.
Chart 1. International Agricultural and Food Trade (by volume), 1870-1938 (1913=100)
0
20
40
60
80
100
120
140
1870 1875 1880 1885 1890 1895 1900 1905 1910 1915 1920 1925 1930 1935
Initially, trade plunged during these years, since Europe (the principal importer of
agricultural products in this period) was the region most affected by the war and its countries
were obliged to divert huge sums of money in order to finance the conflict. Consequently,
there was little cash available to fund food imports, although these were needed more than
ever to compensate for the distortion of production caused by the war; such money, if
available, was spent on war material. Secondly, one of the Allied strategies was to blockade
Germany, in the hope of achieving a swift victory by undermining the morale of soldiers at
5

the front through war weariness and food shortages at home and the effects of hunger on the
civilian population3. Finally, the shortage of merchant shipping to carry cargoes not directly
related to the conflict and the potential risk to maritime traffic considerably increased
transport costs, further depressing agricultural trade.
The period between the end of the First World War and the beginning of the
Depression was marked by a rapid recovery in international trade in physical terms. This
process commenced in 1919 and by 1925 trade was once again at 1913 levels, and between
1921 and 1929 the world volume of exports grew at an annual rate of 7%.
The recovery in the volume of trade was mainly due, in the short term, to strong
European demand. After the war the blockade was lifted, while other obstacles to trade that
were directly related to the war disappeared. Furthermore, European agricultural production
had suffered severely from the war, and these countries had no alternative but to purchase
food or agricultural raw materials in international markets until output recovered4.
In the case of the United States and Japan, these newly industrialised nations also
accounted for a significant share of world demand for agricultural products. American
imports of food rose as a result of dynamic demographic growth, urbanisation and rapid
industrialisation.
Similarly, Japan was rapidly becoming urbanised as a result of industrialisation. This
produced strong demand for food products, particularly rice, which were supplied by the
countries of Southeast Asia.
Despite strong growth in the world demand for food, problems soon became apparent
in the countries producing and exporting primary goods.
European agriculture began to recover during the 1920s, although international prices
for some foodstuffs and agricultural commodities fell. At the same time, many European
3 Offer (1991) 4 The decline in European agricultural production during the war years was largely a result of the mobilization of the rural population, which was transferred from farm labour to war service (whether at the front, in the armaments industry or in other war-related employment). Federico (2004) estimates that production fell, between 1913 and 1920, by 40.7% in Eastern Europe, 19.6% in Northeastern Europe and 7.1% in Southern Europe.
6

countries erected tariff barriers against food imports, thereby intensifying protectionism. In
the majority of cases, tariffs were established with a view to negotiating a network of bilateral
trade deals through which “negotiation” or “war” tariffs were lowered, and then generalized
to include all those countries granted most-favored-nation status. Nevertheless, the initial
increases in tariffs were generally more enduring than the subsequent reductions established
by such bilateral agreements.
In some countries, however, such as Germany and Italy, the objective was to achieve
self-sufficiency in the production of foodstuffs. These countries not only established
extremely high tariffs for agricultural imports but also stimulated the domestic production of
food products, thereby contributing to the increase in international capacity.
The United States also played its part in the consolidation of protectionism. The
passing of the Fordney-McCumber Act in 1922 allowed tariffs to be raised, but far more
serious was the amendment of this tariff legislation in order to increase protection still
further; this legislative proposal was made in January 1929, only a few months before the
Wall Street crash and the onset of the Great Depression. The new legislation, known as the
Hawley-Smoot Act, was clearly influenced by its predecessor and came into force on June
19, 1930, raising US import tariffs to their highest ever level. By 1931, almost all European
countries had significantly increased their own import tariffs in response; the average level of
tariffs in continental Europe rose to 39.5% in 1931, compared to 24.6% in 1913 and 24.9% in
19275. The tendency to seek protection from economic depression by insulating domestic
markets gained strength in the following years, as further restrictions upon foreign trade, such
as quotas, import licenses, exchange controls, etc. were adopted.
Economic crisis, and the general spread of protectionism worldwide, caused average
international prices to fall by approximately 50%, which particularly affected countries
producing agricultural goods; between 1929 and 1932, the value of international trade
declined even more sharply than its volume, a phenomenon known as the contractive spiral
of international trade. 5 Bairoch (1989, pp. 91-92) calculates average import tariffs for continental Europe by adjusting Liepmann’s indices (1938, p. 415), based on the value of imports for each country in this period. For an estimation of the development of protectionism which highlights its worldwide expansion in these years, see Clemens and Williamson (2001).
7

From 1929 to 1934 the volume of international trade in agricultural products
diminished by 13% in absolute terms, although a slight recovery in the latter years of the
decade resulted in an average annual negative growth rate of 1.2% for the 1930s as a whole.
Source: 1850-1902 Lewis (1981); 1903-1938 Aparicio (2000), Maddison (2001) and authors' elaboration, based on FAO (1947-2000), Faostat, FAO (2004a), UN Comtrade (2003) and WTO (2003)
Chart 2. Ratio of international agricultural trade to world agricultural output 1870-2000.
(Also Ratio to Total and Manufactures Trade)
0.00
0.05
0.10
0.15
0.20
0.25
0.30
0.35
0.40
0.45
0.50
1865 1875 1885 1895 1905 1915 1925 1935 1945 1955 1965 1975 1985 1995
Agricultural Trade Total TradeManufactures Trade Total Trade. Maddison (2001)
Finally, if we compare the growth of international agricultural trade with that of
production it is apparent (Graph 2) that the former increased considerably more rapidly;
between 1870 and 1938, the ratio of trade with respect to production doubled, which clearly
demonstrates the increasing importance of agricultural products in the international market.
Nevertheless, the pace of this integration was not uniform; it increased from the second half
of the XIX century onwards, until the end-of-century depression and the protectionist
measures adopted by various countries caused the trend to be reversed. Subsequently,
significant growth reoccurred until 1913, when the war and the initial postwar years saw a
marked fall, from which, from 1925 onwards, recovery was evident; this reached its zenith
for the entire period in 1927. During the recession of the 1930s the tendency was slightly
reversed, but nevertheless the trade/production ratio was maintained at very high levels,
compared to the starting point.
8

2.2. Dynamism, integration and the relative decline of agricultural trade: 1939-2000
The Second World War profoundly affected world trade and both agricultural
production and its trade. In fact, prewar income levels were not reached until 1950
(Maddison, 1995). Nevertheless, the effects of the international conflict varied greatly; on the
one hand, the war zones (Europe, the USSR, large parts of Asia, North Africa and the
Pacific) were the most affected, and reduced their imports and suffered massive devastation
of their agriculture; elsewhere, Latin America and parts of Africa and Asia were only
indirectly affected by the conflict, since their traditional export markets were radically
reduced. By contrast, various countries, whose territories had been relatively immune from
the war (Canada, the United States, Australia and Argentina), became the principal suppliers
of food for their allies, as in the First World War.
After the Second World War, a reorganised world economy enjoyed unprecedented
economic growth. Per capita incomes rose worldwide until the crisis of the 1970s, and
expansion in fact continued to be general in the following decades, although the pattern of
development varied widely. This was reflected in the spectacular growth of agricultural trade;
between 1951 and 2000, it grew at an average annual rate of 4.0% in terms of volume, the
fastest rate for any period in the XIX and XX centuries. Serrano and Pinilla (2006) have
demonstrated that income growth was the principal reason for this expansion, while
exchange rate stability and the relative decrease in agricultural prices had only a minor
impact, and other factors (e.g. trade liberalization and trade costs) exerted no influence6.
The situation, however, appears much less positive if we compare the growth in
agricultural trade with that of total world trade (see Table 2). While agricultural trade was
central to the first great expansion of international commerce (beginning in the mid-
nineteenth century and ending with World War I), the period from 1950 to the present
witnessed a gradual decline of agricultural products in the share of total trade. This process
was particularly acute during the period 1951 to 1973, when the share of agricultural exports
in total trade dropped sharply, by 17.3 percentage points in volume and 25.5 percentage 6 Irwin (2002), Estevadeordal, Frantz and Taylor (2003) and Baier and Bergstrand (2001) have also demonstrated that income is the factor with the greatest explanatory power for the evolution of overall trade and, Coyle et al. (1998) for agricultural trade (in the period 1985-1995).
9

points in value. This decrease subsequently bottomed out, with the average rate of growth of
the volume of agricultural trade approaching that of total trade.
TABLE 2 Trends in income and international trade (by volume and value). Average annual growth
Element
1951-2000
1951-1973
1973-2000
World GDP (U.S. $ 1990) 3.9 4.9 3.1 Total trade (current value) 9.7 10.0 9.4 Agricultural trade (current value) 5.6 5.6 5.5
Share of agricultural trade (value) 43.0 (1951) 17.6 (1973) 6.7 (2000) Total trade (volume) 6.7 8.9 4.9 Agricultural trade (volume) 4.0 4.6 3.5
Share of agricultural trade (volume) 29.6 (1951) 12.3 (1973) 8.5 (2000) Source: GDP from Maddison (2001) and author's elaboration, based on FAO (9147-2000), Faostat, FAO (2004a), UN Comtrade (2003) and WTO (2003)
Some of the reasons for the differences in the performance of agricultural and food
products were the following: the lower income elasticity of demand for agricultural and food
products7; the self-sufficiency achieved as a result of the "green revolution" and the marked
agricultural protectionism prevalent in most developed countries, due to the exclusion of
agricultural commodities in successive versions of the General Agreement on Tariffs and
Trade (GATT)8; the limited impact of falling transport costs (Hummels, 2001) and the
reduced share of agricultural processed products in intra-industrial trade. In order to explain
the falling share of trade in value terms, these factors must be broadened to include the
significant relative decrease in their prices. This was particularly marked between 1973 and
1982 and especially affected the revenue of the economies specialised in exporting the most
basic products9.
7 Yates (1960), Yu et al. (2002) and Cranfield et al. (2003), demonstrate the progressive income inelasticity of most agricultural products.. 8 Agriculture was excluded from the substantial reduction, in both tariffs and other trade barriers, agreed at the first round of GATT negotiations, held in Geneva in 1947, as a result of pressure from the founders of the organisation (principally the United States). Unfortunately, agricultural protectionism was largely ignored in subsequent GATT talks; it was only as a result of the Uruguay Round (1986-94) that a gradual and slight reduction of barriers to agricultual trade was agreed. 9 According to our estimates, by 1982 agricultural products had lost approximately 35% of their relative value, compared to the general price index for 1973.
10

Source: Authors' compilation, based on FAO (1947-2000), Faostat, FAO (2004a) , UN Comtrade (2003) and WTO (2003)
Chart 3. International Agricultural and Food Trade (by volume), 1951-2000. (Thousands $ 1980). Includes imports by
economic regions.
0
100,000,000
200,000,000
300,000,000
400,000,000
500,000,000
1951 1956 1961 1966 1971 1976 1981 1986 1991 1996
Asia Intra EU 15Europe (excluding Intra EU-15) North and Central AmericaOceania South AmericaAfrica
Two clearly distinct phases can be observed in the evolution of agricultural trade in
the second half of the XX century. The first of these took place between 1951 and 1973,
when international agricultural trade grew continuously, at an average annual rate of 4.6%.
The second, between 1973 and 2000, saw trade grow at an average annual rate of 3.5%, a
pace somewhat lower and more unstable than in the preceding years.
As mentioned above, the rapid expansion of trade during the "golden age of
capitalism" can be explained, fundamentally, by the generalised increase in income
throughout all the economic regions. Within these, the growth of European and Asian
demand played an important role. In the former case, this was a return to natural pre-war
levels, while in Asia this was due to intensive demographic growth, the increase of
urbanisation and the rapid process of industrialisation of Southeast Asian countries. In
addition to income, other institutional factors helped to stimulate trade, one example being
exchange rate stability under the Bretton Woods system.
11

The rapid economic growth that had begun following the Second World War came to
an end in the early 1970s; the world economy was wracked by the energy crisis, inflation,
exchange rate instability (due to the collapse of the Bretton Woods system) and slower
growth rates in the industrialised nations. Trade in agricultural products fell, due in part to the
stagnation of demand (Cho, Sheldon and McCorriston, 2002), while the decline in the rate of
growth of the world population and the saturation of a mature international market also
played their role. An exception to the general situation was East Asia (especially in the newly
industrialised countries) and Gulf oil exporting countries, where rapid economic growth
continued, thereby encouraging the consumption of agricultural products (Rae, 1997) .
The situation worsened in the first half of the 1980s, in which problems of
overcapacity became apparent and contributed to the marked fall in international commodity
prices and trade in them10, giving rise to increased protectionism with regard to agricultural
products. In an effort to protect farmers from the crisis, Europe, Japan and the United States,
among others, significantly raised non-tariff barriers and attempted to isolate their agriculture
from falling prices and volatility11.
Finally, from the mid-1980s to the end of the century, the rate of growth in
agricultural trade gradually recovered, to around 3.6% per annum, once more exceeding the
growth in agricultural output and leading to a greater integration of markets. The economic
situation was characterised by wide divergence among the economies of the leading
industrialised nations, the drive toward European integration (via the European Union), rapid
economic growth in the United States and, by contrast, a severe recession in Japan and
desorganization within Eastern Europe. In addition, two consequences of events in the
preceding period (i.e. the massive debt of many developing countries and the deterioration in
the terms of trade) were to have a positive influence on agricultural trade. Those countries
that had formerly implemented policies penalising the agro-export sector now sought to
expand production for export as a way of increasing revenues, despite the sluggish demand
for agricultural exports in this period.
10 Diakosavvas and Scandizzo (1991) and Ocampo and Parra (2003) 11 Tyres and Anderson (1992)
12

The dynamism displayed by agricultural trade from 1973 onwards is remarkable;
between 1973 and 2000 the volume of trade in agricultural products and food outgrew that of
world income (a trend which was not apparent between 1951 and 1973) and, moreover,
approached the growth rates of total trade in terms of volume (see Table 2). This dynamism
is more than a little surprising, in view of the sharp divergence in the trends of the main
variables that traditionally explain the evolution of international trade. Thus, it would seem
self-evident that other factors had begun to play a significant role in the evolution of trade.
According to a study by Coyle et al. (1998), the traditional factors determining the
evolution of international trade provide only a partial explanation of the changes occurring in
agricultural trade since the mid-1970s, since this was increasingly based on processed
foodstuffs. It was in this period that the change in the pattern of agricultural trade, as
mentioned earlier for manufactures, from an inter-industrial system (between countries with
very different production specialities) to an intra-industrial system (between countries
specialising in similar goods), began to play a significant role.
At the same time, this pattern was reinforced by the proliferation of Regional Trade
Agreements (RTAs), which reduced protectionism and thereby strengthened the expansion of
agricultural trade among their signatories. On this point, various authors have documented a
marked increase in intra-regional trade12; specially trade integration within the European
Economic Community.
3. Composition of international agricultural and food trade by groups of
products
3.1. Increasing incomes and trade policies: 1870-1938
The most significant product groups in international trade in agricultural goods
during this period were plantation crops, fibres and cereals. These three groups jointly
accounted for some 75% of total agricultural trade during the first third of the XX century.
None of the other product groups defined accounted for more than 10% of total international
agricultural trade, and at no time did all of them together represent over 30% (Table 3).
12 Frankel (1997) and Jayasinghe and Sarker (2004).
13
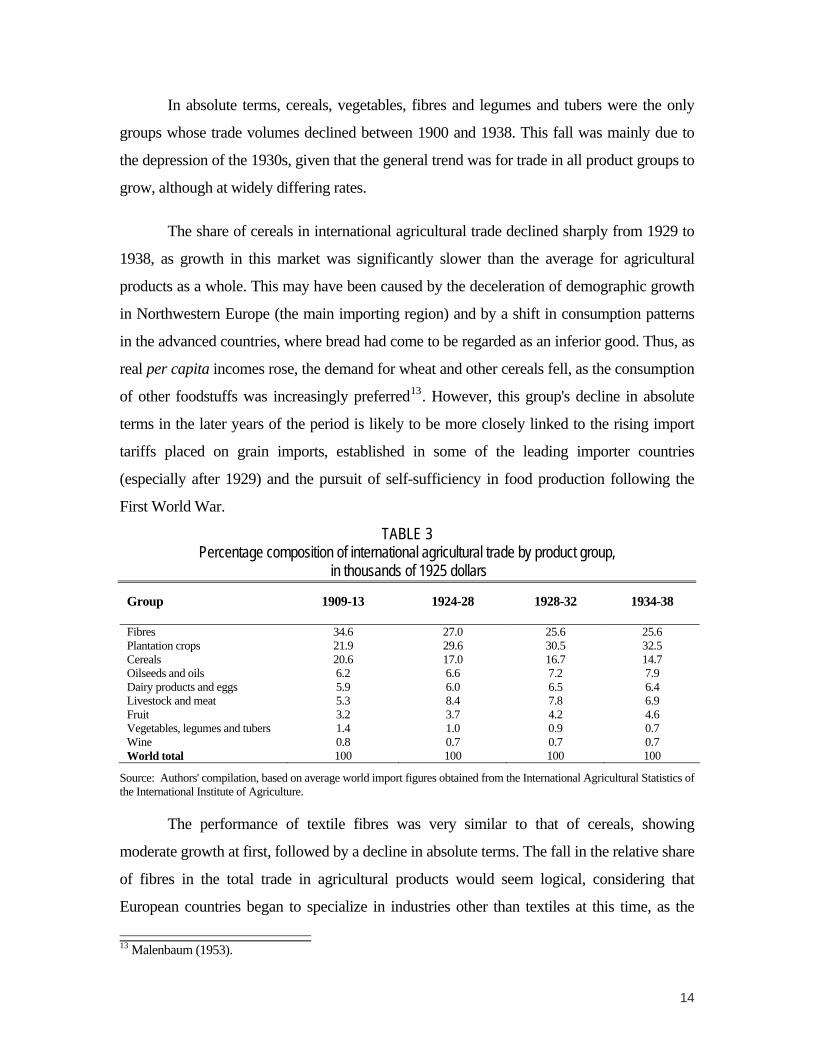
In absolute terms, cereals, vegetables, fibres and legumes and tubers were the only
groups whose trade volumes declined between 1900 and 1938. This fall was mainly due to
the depression of the 1930s, given that the general trend was for trade in all product groups to
grow, although at widely differing rates.
The share of cereals in international agricultural trade declined sharply from 1929 to
1938, as growth in this market was significantly slower than the average for agricultural
products as a whole. This may have been caused by the deceleration of demographic growth
in Northwestern Europe (the main importing region) and by a shift in consumption patterns
in the advanced countries, where bread had come to be regarded as an inferior good. Thus, as
real per capita incomes rose, the demand for wheat and other cereals fell, as the consumption
of other foodstuffs was increasingly preferred13. However, this group's decline in absolute
terms in the later years of the period is likely to be more closely linked to the rising import
tariffs placed on grain imports, established in some of the leading importer countries
(especially after 1929) and the pursuit of self-sufficiency in food production following the
First World War.
TABLE 3 Percentage composition of international agricultural trade by product group,
in thousands of 1925 dollars
Group 1909-13 1924-28 1928-32 1934-38
Fibres 34.6 27.0 25.6 25.6 Plantation crops 21.9 29.6 30.5 32.5 Cereals 20.6 17.0 16.7 14.7 Oilseeds and oils 6.2 6.6 7.2 7.9 Dairy products and eggs 5.9 6.0 6.5 6.4 Livestock and meat 5.3 8.4 7.8 6.9 Fruit 3.2 3.7 4.2 4.6 Vegetables, legumes and tubers 1.4 1.0 0.9 0.7 Wine 0.8 0.7 0.7 0.7 World total 100 100 100 100
Source: Authors' compilation, based on average world import figures obtained from the International Agricultural Statistics of the International Institute of Agriculture.
The performance of textile fibres was very similar to that of cereals, showing
moderate growth at first, followed by a decline in absolute terms. The fall in the relative share
of fibres in the total trade in agricultural products would seem logical, considering that
European countries began to specialize in industries other than textiles at this time, as the
13 Malenbaum (1953).
14

process of industrialization intensified. In many cases, the fibre-exporting countries started to
manufacture textiles themselves, tending to reduce the share of the necessary raw materials in
international trade. Meanwhile, the manufacture of lighter, softer fabrics, using synthetic
fibres such as rayon, also led to the reduction of trade in textile fibres, while the more
efficient use and recycling of these raw materials was a further factor14.
The most dynamic products were those which enjoyed higher income elasticity or did
not directly compete with the agricultural output of the industrialized countries since, to a
certain extent, they were able to avoid the impact of protectionism at the end of the period.
As incomes rose, dietary habits changed toward a greater consumption of fats, meat, fruit,
vegetables and dairy products. This clearly benefited the most dynamic product groups, such
as fruit and plantation crops. Oilseeds and oils, livestock and meat and dairy products and
eggs also performed strongly, although some of these products were adversely affected by
falling incomes in the developed countries during the Depression. Growth in oilseeds and oils
was also directly related to the dissemination of industrial and technical advance, which
resulted in greater use of these products in numerous industrial applications.
Higher income elasticity of demand, and the fact that such crops could not usually be
grown in Europe, were the principal reasons behind the strong growth of trade in plantation
products, the most dynamic group. These were imported relatively freely, although they were
taxed in order to boost government revenues15. As a result of increasing imports, trade in this
group would eventually exceed that of all others, and plantation products became the group
with the largest share in international trade in agricultural products after the end of the First
World War.
In the expansion of trade in plantation crops, natural rubber played a predominant
role; trade in rubber displayed extraordinary growth as a result of demand from the
automobile industry. Thus, of the total increase in trade in plantation products, 59% was
exclusively due to the increase in the rubber trade.
14 Aldcroft (1978). 15 Some plantation products did suffer the consequences of high tariffs; this occurred in the case, for example, of sugar (following the decision of European countries to protect the production of sugar beet) and that of rubber (due to the manufacture and/or use of synthetic substitutes).
15

3.2. Trade boom in processed agricultural products: 1951-2000
Following the Second World War, rapid growth in incomes, increasing urbanisation,
improved transportation, changing lifestyles and advances in marketing combined to produce
a change in consumption patterns, resulting in high-value-added processed foods tending to
replace traditional foodstuffs (Rae and Josling, 2003).
In fact, as Table 4 shows, the share in world agricultural trade of bulk commodities
declined in favour of non-bulk commodities, such as fresh fruit and vegetables, meats, dairy
products, edible oils and processed products (Athukorola and Sen, 1998). This change in
world agricultural trade was highly asymmetrical; the developing countries were net
exporters of bulk or low processed products, while the developed countries were net
exporters of more processed products16.
TABLE 4 Percentage composition of international agricultural trade by product group,
in thousands of 1980 dollars Group 1952-59 1959-66 1966-73 1973-80 1980-87 1987-94 1994-00Bulk commodities 37.3 38.0 35.4 35.1 34.0 30.2 28.0 Bulk cereals 14.9 16.0 14.9 16.7 16.3 13.6 12.4 Textile fibres, not manufactured, and waste 12.3 10.7 8.4 6.4 5.4 4.8 4.0 Livestock 7.3 8.0 8.6 8.1 8.1 8.1 7.7 Oil seeds, oil nuts and oil kernels 2.9 3.4 3.6 3.9 4.1 3.7 4.1 Plantation crops 31.1 27.0 26.1 23.0 21.9 22.4 21.9 Sugar, sugar preparations and honey 11.0 9.4 8.6 6.6 7.0 7.1 7.5 Coffee, tea, cocoa, spices & manufacs. 12.6 11.3 11.6 10.7 10.0 10.8 9.5 Tobacco, unmanufactured 3.6 3.6 3.5 3.5 3.0 2.7 3.1 Natural rubber 3.8 2.7 2.6 2.2 1.9 1.7 1.7 High value food 19.6 22.6 25.0 27.2 26.9 27.4 27.2 Meat and preparations 8.1 8.1 8.4 8.7 9.0 9.5 10.1 Dairy products and eggs 4.0 4.3 4.5 5.2 5.7 5.1 4.8 Fruit and vegetables 7.5 10.3 12.1 13.3 12.2 12.8 12.2 Processed products 12.0 12.4 13.5 14.8 17.2 20.1 22.9 Prepared cereals 0.8 0.8 1.1 1.3 1.8 3.4 4.5 Feed. Stuff for animals excl. Unmilled cereals 1.7 2.4 2.9 3.6 4.5 5.4 5.4 Miscellaneous food preparations 0.7 0.9 1.1 1.3 1.8 2.6 3.6 Beverages 5.9 5.4 5.2 4.8 4.3 3.6 3.7 Animal and vegetable oils and fats 3.0 2.9 3.2 3.9 4.8 5.1 5.9 Total 100 100 100 100 100 100 100
Source: Authors' compilation, based on FAO (1947-2000), Faostat, FAO (2004a), UN Comtrade (2003) and WTO (2003)
The most basic products (i.e. grain cereals, plantation products and textile fibres),
which during the previous period formed the basis of agricultural trade, accounted for 58% of
such commerce in the 1950s but only 38% by the end of the century, and may be divided into
two groups. The first of these comprises raw materials and foodstuffs (textile fibres, rubber
16 Diaz-Bonilla and Reca (2000) and Matthews (1994)
16

and sugar) which were substituted, due to technological advances, by industrial products. The
chemical industry permitted, as had been occurring since the 1920s, the partial substitution of
natural fibres, such as cotton, by new materials e.g. nylon and polyester (Baffes, 2005). The
same may be said of rubber, a star product in the previous period, which was replaced by its
industrial counterpart. Something similar occurred in the case of various foodstuffs, such as
sugar, which was increasingly replaced by sweeteners extracted from corn (isoglucose,
glucose, dextrose) and even by synthetic sweeteners (saccharine).
The second group comprises low value foodstuffs which, as had begun to occur well
before the Second World War, continued to be replaced in standard diets by others of higher
value (meat, dairy products, fruit and vegetables) and their processed derivatives17. The
principal cause of this process was economic growth and consequently, rising incomes
(Coyle et al., 1998; Gehlhar and Coyle, 2001)18. As per capita income grew, there was a
tendency for diets to become more varied, with the consumption of meat, beverages, and fruit
rising, while that of food staples, such as cereals and legumes, fell (Cranfield et al. 1998).
In addition to the sluggish growth in demand throughout the second half of the XX
century, the decreasing share of agricultural products was in part due to the excessive and
continuous level of protectionism from which they suffered. Natural fibres, grain cereals and
tropical products, especially coffee, tea and cacao were clearly affected by this obstacle.
Finally, processed foods (edible oils, pastry and prepared food among others)
emerged as the group with the highest potential for export growth. In addition to their greater
income elasticity they, in comparison to other agricultural products, benefited from a lower
17 Innovations reducing the deterioration of food products have helped to extend the marketing reach of perishable products. As a result, horticultural and livestock products can travel greater distances (Coyle, Hall and Balleger, 2001) 18 A study by Ludena and Hertel (2005) also includes supply factors. This increase in demand can be met by either domestic or foreign production; the extent to which increased demand can be satisfied by the domestic production of processed products depends, essentially, on the rate of productivity growth of the various farm components. Thus, the relative rate of productivity growth of crops and livestock is believed to be an important factor in determining the changing composition of food production and trade.
17

degree of protectionism19 and were more suited to the innovations occurring in transport, and
as a result improved their share of the agricultural and food trade20.
Source: For manufactures, Brülhart and Elliott (1998); for processed agricultural products, authors' compilation, based on FAO (1947-2000), Faostat, FAO (2004a)
Chart 4. Gruber-Lloyd Index of Intra-Industry trade, 1951-2000.
0,00
0,10
0,20
0,30
0,40
0,50
0,60
0,70
1951 1955 1959 1963 1967 1971 1975 1979 1983 1987 1991 1995 1999
Europe Processed Agriculture SITC 0-4 World Processed Agriculture SITC 0-4EU Manufactures SITC 5-8
Trade in processed products between developed countries increasingly became an
intra-industry trade; as food processing grew more complex, agricultural production became
increasingly integrated with the agri-food industry (Berkun and Meijl, 2000), meaning that
intermediate products sometimes crossed borders several times, thereby elevating trade
figures. As can be seen in Graph 4, the boom in agricultural and foodstuff processed products
from the 1970s on is partly explained by the corresponding boom of this new trade pattern
(see the Statistical Appendix). This increased growth has been particularly noticeable in the
case of Europe, although it is still very far from the degree of intra-industrial trade displayed
by other sectors, such as manufacturing21.
19 Rae and Josling (2003). 20Despite the limited fall in transport costs for agricultural products at the aggregate level, changes in transport and improvements in the preservation of products, due to refrigeration and other innovations, may explain the significant increase in the trade in perishables and processed foods, in contrast to the declining trade in commodities (Wang et al. , 2001; Coyle et al., 2001; Hummels, 2001). 21 Brülhart and Elliots (1998)
18

4. The integration of Europe into the international agricultural and food trade
4.1 Europe in the centre of the international agricultural and food trade: 1870-
1935
The expansion of international trade throughout the XIX century was closely linked
to the evolution of the processes of industrialisation and economic modernisation taking
place in continental Europe and, especially, to the pivotal role played by Great Britain in the
international economy in that century. Its increasing specialisation in manufactured products
generated intense British demand for raw materials and foodstuffs; such needs were met both
by various lesser-developed European countries and the rest of the world. Countries with vast
tracts of land, situated in warm regions (i.e. the "new Europes", such as Canada, Argentina or
Australia) became highly specialised in agroexports, and as a result underwent spectacular
economic growth (Denoon, 1983; Schedvin,1990). Countries in tropical zones, both in the
Americas and in Asia or Africa, were also integrated into international trade, principally as
exporters of primary products and importers of manufactures, and although this degree of
insertion varied enormously among countries, it affected both the Latin American republics
and the European colonial possessions, which in many cases tended to specialise in those
products most in demand in their respective metropoles (Latham, 1978 and 1981; Lewis,
1970).
The articulation of the international markets and the increasing division of labour
which had been taking place since the mid-XIX century marked various directions and
patterns of trade which would, in general, be maintained almost unchanged until the interwar
period. The industrialised countries (and those in which the process of industrialisation was
well advanced) imported predominantly primary products. Simultaneously, their principal
exports were of competitive manufactures to those economies which were still highly
specialised in the primary sector.
The end-of-century depression, the first economic crisis of international scope, did
not significantly alter the situation. As is well known, the arrival in Europe of agricultural
products from the Russian Empire or from overseas, at highly competitive prices, represented
a formidable challenge to continental Europe's agriculture. The different reactions (whether
19

the extension of free trade, in cases such as Great Britain or Denmark, or a certain swing
towards protectionism, as in Germany, France or Spain) did not disrupt the established
system of trade or its patterns and directions, although it did produce a slight deceleration in
the process of international economic integration and the incorporation of certain countries
into the trade system.
TABLE. 5 Percentage composition of international agricultural imports by economic region,
(1909-1938 at 1925 prices, 1951-2000 at 1980 prices)
Europe (a) (b) North and Central America
South America
Asia Africa Oceania Total
1909-1913 76.0 13.5 1.3 7.4 1.3 0.5 100 1924-1928 62.8 20.9 1.5 12.8 1.5 0.6 100 1928-1932 61.9 19.9 1.6 14.3 1.9 0.6 100 1934-1938 59.9 20.5 1.6 15.1 2.2 0.7 100 1952-1959 59.2 18.6 3.9 14.0 3.5 0.9 100 1959-1966 58.5 17.4 41.1 16.5 2.5 16.9 4.7 0.9 100 1966-1973 58.2 21.8 36.5 16.1 2.2 18.4 4.3 0.9 100 1973-1980 57.2 24.5 32.6 12.9 2.5 21.3 5.3 0.8 100 1980-1987 53.9 27.2 26.7 12.9 2.3 23.8 6.3 0.8 100 1987-1994 53.8 30.2 23.5 12.3 2.1 25.9 5.1 0.9 100 1994-2000 47.7 28.3 19.4 13.8 3.3 29.1 5.1 1.0 100
(a) Intra-European Union 15 and (b) Europe excluding Intra-EU 15. Source: Authors' compilation, based on average world import figures obtained from the International Agricultural Statistics of the International Institute of Agriculture, based on FAO (1947-2000), Faostat, FAO (2004a), UN Comtrade (2003) and WTO (2003)
The data contained in Table 5 clearly depict the central role of Europe in the
international agricultural and food trade at the beginning of the XX century; it accounted for
over three-quarters of the imports of such products, although their origins were extremely
varied. Europe itself was the principal exporter, followed by North and Central America,
Asia and South America; no other continent displayed such concentration in the export of
manufactures and the import of primary products.
Nevertheless, the interwar period saw significant changes in these trends, which had
been looming since the middle of the XIX century. On the one hand, the decrease in the
relative weight of Europe as the principal importer of agricultural and food products is
notable. Its share of exports shrunk by 50% (Table 6). If we seek the crucial years in which
this change in trend became apparent, we may observe that it occurred during and
20
immediately following the First World War; from 1925 until 1938, despite the economic
depression, only minor changes occurred.
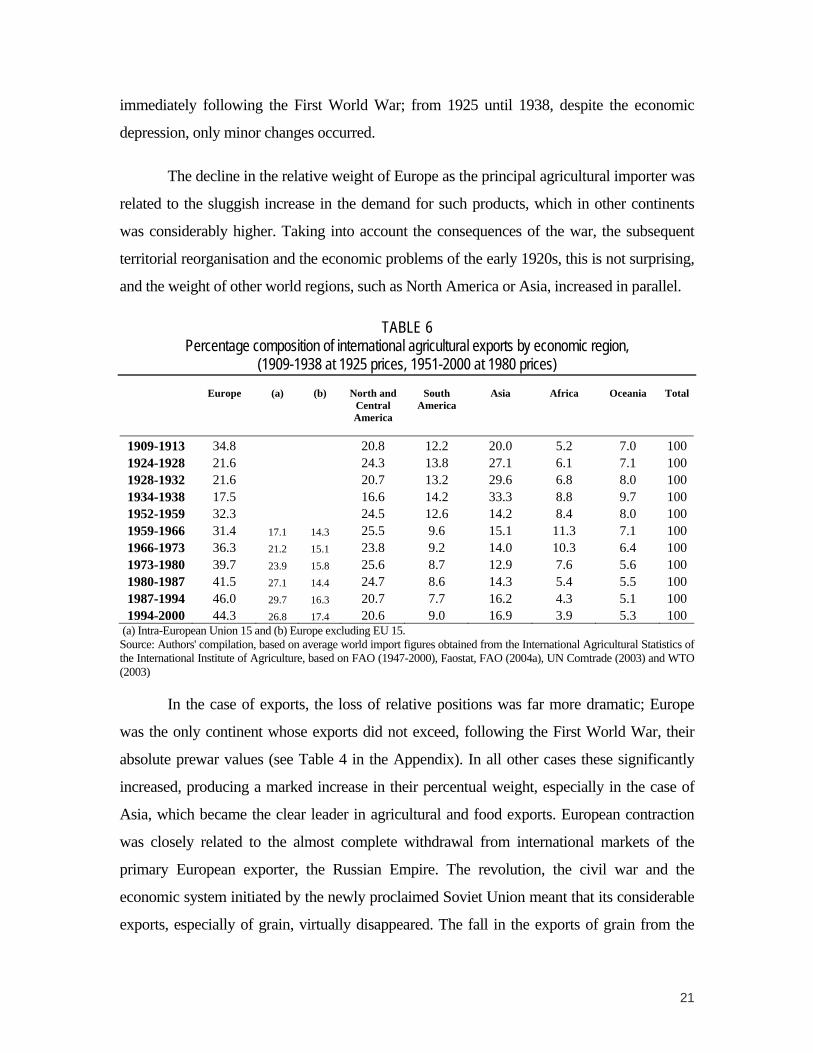
The decline in the relative weight of Europe as the principal agricultural importer was
related to the sluggish increase in the demand for such products, which in other continents
was considerably higher. Taking into account the consequences of the war, the subsequent
territorial reorganisation and the economic problems of the early 1920s, this is not surprising,
and the weight of other world regions, such as North America or Asia, increased in parallel.
TABLE 6 Percentage composition of international agricultural exports by economic region,
(1909-1938 at 1925 prices, 1951-2000 at 1980 prices)
Europe (a) (b) North and Central America
South America
Asia Africa Oceania Total
1909-1913 34.8 20.8 12.2 20.0 5.2 7.0 100 1924-1928 21.6 24.3 13.8 27.1 6.1 7.1 100 1928-1932 21.6 20.7 13.2 29.6 6.8 8.0 100 1934-1938 17.5 16.6 14.2 33.3 8.8 9.7 100 1952-1959 32.3 24.5 12.6 14.2 8.4 8.0 100 1959-1966 31.4 17.1 14.3 25.5 9.6 15.1 11.3 7.1 100 1966-1973 36.3 21.2 15.1 23.8 9.2 14.0 10.3 6.4 100 1973-1980 39.7 23.9 15.8 25.6 8.7 12.9 7.6 5.6 100 1980-1987 41.5 27.1 14.4 24.7 8.6 14.3 5.4 5.5 100 1987-1994 46.0 29.7 16.3 20.7 7.7 16.2 4.3 5.1 100 1994-2000 44.3 26.8 17.4 20.6 9.0 16.9 3.9 5.3 100
(a) Intra-European Union 15 and (b) Europe excluding EU 15. Source: Authors' compilation, based on average world import figures obtained from the International Agricultural Statistics of the International Institute of Agriculture, based on FAO (1947-2000), Faostat, FAO (2004a), UN Comtrade (2003) and WTO (2003)
In the case of exports, the loss of relative positions was far more dramatic; Europe
was the only continent whose exports did not exceed, following the First World War, their
absolute prewar values (see Table 4 in the Appendix). In all other cases these significantly
increased, producing a marked increase in their percentual weight, especially in the case of
Asia, which became the clear leader in agricultural and food exports. European contraction
was closely related to the almost complete withdrawal from international markets of the
primary European exporter, the Russian Empire. The revolution, the civil war and the
economic system initiated by the newly proclaimed Soviet Union meant that its considerable
exports, especially of grain, virtually disappeared. The fall in the exports of grain from the
21

countries of the Danube basin, following the agricultural reforms which took place there, the
disintegration of the Austro-Hungarian empire, the reorientation of crops and the increase in
domestic consumption accentuated this decline; as a result, the specialisation in exports
which had been progressively created throughout the XIX century, consisting of the
production of cereals in large estates for export to the selfsame European continent, tended to
disappear.
TABLE 7 European agricultural imports and exports, 1900-1938.
Imports Plantation
crops Fibres Cereals Oilseeds and oils Fruits Vegetables
Livestock and meat
Dairy products Wine Total
Composition 1909-13 13.0 41.7 24.2 7.1 2.1 0.7 5.4 4.8 0.9 100.0 1924-28 15.5 31.4 20.3 7.7 2.7 0.7 12.0 8.7 1.0 100.0 1928-32 19.5 27.6 18.6 8.2 4.0 1.0 10.7 9.2 1.0 100.0 1934-38 22.1 28.5 15.5 8.7 4.6 0.7 9.4 9.5 1.1 100.0 Share of Europe to World 1909-13 47.9 84.9 82.7 83.0 53.9 79.3 89.9 86.6 80.8 76.0 1924-28 35.2 69.7 71.7 71.3 53.4 78.2 85.3 86.5 89.0 62.8 1928-32 39.7 66.8 69.1 70.3 60.1 67.4 84.4 88.5 91.0 61.9 1934-38 40.8 66.7 63.0 66.3 59.1 56.7 81.7 89.1 91.7 59.9
Exports Plantation
crops Fibres Cereals Oilseeds and oils Fruits Vegetables
Livestock and meat
Dairy products Wine Total
Composition 1909-13 13.0 28.9 33.3 4.9 4.0 1.7 3.5 9.2 1.7 100.0 1924-28 15.0 20.8 12.1 5.3 5.4 2.1 17.1 20.3 2.0 100.0 1928-32 13.6 18.1 14.4 5.5 5.7 2.8 18.0 20.2 1.6 100.0 1934-38 12.7 20.3 14.4 5.4 5.9 2.4 15.3 22.4 1.2 100.0 Share of Europe to World 1909-13 22.0 27.3 49.9 26.7 52.6 86.8 25.9 77.5 56.9 34.8 1924-28 11.9 16.0 14.7 17.0 33.5 78.9 41.6 67.4 52.0 21.6 1928-32 10.0 15.0 18.5 16.7 29.5 65.5 49.2 66.9 40.7 21.6 1934-38 7.1 13.6 17.0 12.1 22.4 55.4 37.6 60.7 24.6 17.5 Source: Authors' compilation, based on average world import figures obtained from the International Agricultural Statistics of the International Institute of Agriculture.
The composition and evolution of European imports were no different to those of
world trade analysed above; fibres, cereals and plantation crops were by far the three most
important groups and, in addition, developed in the same way as their worldwide
counterparts i.e. the relative weight of the first two fell while that of the third rose. Perhaps
the principal differences were the lesser relative importance of plantation crops and greater
22

diversification; that is to say, the other groups attained slightly more importance. In some
product groups, such as dairy products and eggs, wine or cattle and meats, European imports
accounted for an extremely high percentage of world trade, normally in excess of 85%.
However, following the First World War and the decline of the major cereal
exporters, the composition of European exports was very different to that of worldwide
agricultural and food trade. The former were highly concentrated on products derived from
livestock (dairy products and eggs, cattle and meats) and textile fibres, both vegetable and
animal (silk, hemp, linen and wool). Initially, cereals accounted for almost one-third of total
exports, but the withdrawal of the Soviet Union from international markets and the decline of
exports from the Danube region enormously reduced their importance22. This concentration
of exports in certain product groups was also highlighted by the international share of
European exports; these were predominant in the case of dairy products and eggs, vegetables
and legumes and wine, and extremely important in the case of fruit, cattle and meats. In
summary, such concentration demonstrated the existence of two types of export
specialisation in agricultural and food products which had been taking shape in Europe. The
first of these was evident in the north of the continent, in which livestock products (meat,
milk, eggs) were predominant, and the second in the Mediterranean south (fruits, vegetables,
wine and oil). In general, the majority of such foodstuffs had in common high income
elasticity, a relatively high degree of preparation and the fact of not being raw materials.
These two specialisations were different, although they coincided in being oriented towards
products appropriate for the agroclimatic environments of northern and southern Europe,
possessing relatively high added value and being predominantly aimed at European trade
itself, which in addition was normally quite short distance trade.
22 Prior to the First World War, Russia exported more than 20% of its production of wheat, but subsequently no more than 5%.
23

4.2. The quest for and achievement of European self-sufficiency: 1951-2000
The second half of the XX century witnessed a strong revival of international
economic integration. Nevertheless, the pattern of complementarity between north and south,
forged during the first globalisation, totally disappeared. In fact, agricultural trade became
increasingly concentrated among developed countries (Hertel et al., 1999); in general, the
industrialised nations stimulated their agricultural sectors, with the aim of attaining self-
sufficiency in the production of foodstuffs and other commodities. Following the scarcity of
the war and post-war years, most such countries had become convinced of the importance of
guaranteeing the supply of foodstuffs and were therefore wary of excessive dependence on
imports.
This strategy of import substitution agriculture, or ISA (Diaz-Bonilla and Tin, 2002)
was adopted in the most advanced regions i.e. Europe, Japan and the United States. Access to
new agricultural technologies made self-sufficiency possible23, reduced the growth of imports
and even enabled the developed countries to become net exporters in the early stages of the
process24. The counterpoint was the boom in the importation of foodstuffs from Asia, which
was immersed in a deep-seated process of industrialisation, demographic growth and
urbanisation.
In the case of exports, the changes in the geographical composition of exchanges
were even more pronounced. Governments in the developed nations encouraged agriculture
more than any other sector, in contrast to the developing countries, which discriminated
against it25; furthermore, agriculture was affected by changes in the development policies of
some traditional exporters, especially in Latin America26. These countries opted, in early
periods, for development policies based on import substitution industrialization (ISI), which
heavily penalised the agro-export sector.
23 Hayami and Ruttan (1989) conclude that technological innovation (the "green revolution") following World War II created a new agricultural production function at the international level, based on capital and technological inputs. This new function put an end to trade based on differences in natural conditions and resources. See also Federico (2005). 24 Thorbeche and Condliffe (1963). 25 Many developing countries attempted to suppress producer prices for agricultural commodities, through government procurement policies, export taxation, and export quotas (Krueger, Schiff and Valdes, 1998). 26 Lindert (1991), Diaz-Bonilla and Tin (2002) and Diaz-Bonilla and Reca (2002).
24

As a result, the countries whose trade was most dependent upon the export of basic
products (Africa and Latin America) saw their relative share of world agricultural trade fall.
Furthermore, some of these not only experienced a relative decline in their exports, but also
suffered a serious reduction in their exports ratio with regard to agricultural imports. Africa
and Asia soon became net importers instead of, as previously, net exporters of agricultural
products27.
The counterweight to these losses has been the increasing importance of the
developed countries, especially European nations, which together provided 32% of world
exports in the 1950s and 44% by the end of the century. The bulk of this increase was due to
the combination of two factors. The first of these, as stated above, was rising self-supply,
facilitated by the technological advances of the "green revolution", marked protectionism and
the support provided to the sector by the Common Agricultural Policy (CAP). The second
was the progressive liberalisation of their internal markets, which was largely responsible for
the boom in intra-regional trade.
Income growth, geographical proximity and free trade among many European
countries, together with increasingly heterogeneous tastes, food cultures and food marketing
systems, strongly encouraged the integration of agricultural trade within the region (Red,
(2001)28. As Graph 5 shows, in the data it provides regarding the degree of openness of
agricultural trade, integration started strongly at the beginning of the 1970s and progressively
increased as various countries became members of, firstly, the European Economic
Community and, subsequently, the European Union. The relative degree of openness of
European agricultural trade compared to its worldwide counterpart shows that (especially
from the 1980s onward) the strengthening of the CAP accelerated integration, markedly
stimulating trade29 and diverting traditional imports30.
27 Specialisation in tropical products (i.e. coffee, cacao, cotton and sugar) suffered most from the changes in composition, especially from the 1980s onwards (Daviron and Gibbon, 2002). 28 More empirically, and based on a gravity model, Badinger and Breuss (2004) have proved that income growth was the driving force, accounting for approximately two-thirds of total growth of intra-EU trade from 1960 to 2000. Trade liberalization continued to exert a significant influence, while other factors (income convergence, changes in real effective exchange rates) had only a minor impact or no influence at all (trade costs). 29 By combining data for trade and GDP, a symmetrical index of relative trade openness was obtained; this is related to the internal and external trade-creation effects of regional integration. The index is higher than zero if the region´s degree of trade openness exceeds the world average, due to forces stimulating market integration being stronger than in other regions, or the effect of preferential trade agreements. More such definitions may be found in Iapadre, (2004).
25

Source: Source: Authors' elaboration, based on World Bank (2004), Faostat, FAO (2004a) and UN Comtrade (2003)
Chart 5. Openess Index and Retaltive openess index for European Union.
(Agricultural exports + imports to output at current dollars)
0,00
0,10
0,20
0,30
0,40
0,50
0,60
0,70
0,80
1962 1966 1970 1974 1978 1982 1986 1990 1994 1998
World agricultural trade EU-15 agricultural trade openessSymetrical indicator of relative opennes
In the second half of the XX century changes in the composition of European imports
were similar to the patterns displayed in the rest of the world. The share of high value
foodstuffs and processed agricultural products increased at the expense of basic products.
The CAP, in conjunction with technological advances, allowed the EEC to become self-
sufficient in numerous basic products and even to rapidly expand its exports (as in the case of
cereals)31. With regard to the relative importance of European imports, this declined in all
product categories, except for plantation crops (coffee, cacao and cotton), the cultivation of
which was scarce or non-existent in Europe.
In the composition of exports, the specialisation in high value and processed
foodstuffs, which commenced at the start of the century, was consolidated. This
concentration becomes even clearer if we observe its increasing international weight;
specifically, the EEC became the world's biggest exporter of dairy products, sugar and beef.
This was a reflection of the marked increase in European productivity in intermediate
30 Frankel (1997) has shown that from the 1980s onwards the trade-creation effect for agricultural products and foodstuffs accelerated. 31 Federico (2005) provides various estimations of the Total Factor Productivity of European agriculture which demonstrate its strong growth.
26

products for crops and livestock and, similarly, of the support and protection provided to the
rise of the agroindustrial sector.
TABLE 8 European agricultural imports and exports, 1951-2000
Imports 1952-59 1959-66 1966-73 1973-80 1980-87 1987-94 1994-00 Composition Bulk commodities 40.8 38.0 34.3 31.6 29.2 24.4 20.8 Plantation crops 22.9 21.0 21.5 20.2 19.8 21.1 22.4 High value food 24.5 28.0 30.1 32.4 32.0 32.9 32.8 Processed products 11.9 12.9 14.0 15.8 19.0 21.7 24.1 Share of Europe to World Bulk commodities 62.7 58.1 55.6 52.4 46.2 44.5 38.5 Plantation crops 40.7 42.4 44.3 45.8 41.7 47.2 48.7 High value food 68.4 67.1 64.2 61.6 55.1 60.8 58.5 Processed products 55.6 54.9 54.9 54.6 50.3 54.5 50.8
Exports 1952-59 1959-66 1966-73 1973-80 1980-87 1987-94 1994-00 Composition Bulk commodities 22.0 24.2 24.5 22.8 23.9 22.4 19.0 Plantation crops 19.3 14.4 13.4 12.8 12.8 16.3 17.8 High value food 37.9 40.0 39.7 41.9 39.1 35.7 34.5 Processed products 20.8 21.4 22.4 22.5 24.3 25.6 28.7 Share of Europe to World Bulk commodities 17.8 18.3 21.6 22.9 25.7 29.8 27.5 Plantation crops 18.6 14.4 16.9 20.1 23.0 32.8 35.2 High value food 52.5 53.0 57.5 64.8 63.8 65.0 60.3 Processed products 45.4 47.1 53.1 58.1 58.9 59.7 56.2
Source: Authors' compilation, based on FAO (1947-2000), Faostat, FAO (2004a), UN Comtrade (2003) and WTO (2003)
As various authors have indicated, there existed a general tendency towards increased
concentration in the food processing and retailing industries in the E.U., which produced a
greater degree of intra-industrial trade32. This is also a key factor in explaining the growth of
trade in this typology of agricultural products.
In summary, the European share of international agricultural trade in foodstuffs and
agricultural products was essentially determined, until the depression of the 1930s, by the
industrialisation of the continent, which produced a division of labour within the international
economy; this, in turn, gave rise to a trade system in which different regions of the world
exchanged, principally, manufactures for primary products. The stable share of the latter in
total international trade between 1880 and the Second World War (approximately 63%, with
32 McCorriston and Sheldon (1998); Brülhart and Elliot 1998).
27

only minor variations), demonstrates the steadiness of this pattern of exchanges (Lewis,
1952). Foodstuffs and agricultural raw materials accounted for, in those years, approximately
50% of total international trade, while the importance of trade between industrialised and
non-industrialised countries increased and trade between industrialised countries accounted
for 45% of total world trade in 1876-80, 40% in 1928 and 39.5% in 1938 (Yates, 1959).
The role of the European colonial system was not removed from this system of trade;
indeed, it accentuated it; in many colonies the most dynamic economic activities were
managed by Europeans, who sought to produce those goods for which demand was high in
their native continent.
Following the rupture produced by the Second World War, world agricultural trade
adopted other patterns, which bore little resemblance to the complementarity between
industrial and agro-exporting economies. Moreover, in the second half of the century (and
especially in the years of fastest growth), this complementarity became decreasingly
important in international markets. Even more surprisingly, the countries most dependent
upon income from this type of trade diminished in importance, to the benefit of more
developed countries. Specifically, Europe, with a protected and subsidised agriculture and an
increasingly liberalised internal market, has not only achieved the self-sufficiency it defended
in the difficult postwar years, but has also become the principal actor in agricultural
exchanges, especially in the group of products whose performance was most dynamic within
international agricultural trade in the second half of the XX century.
28

References.
Aldcroft, D. (1985): From Versailles to Wall Street, 1919-192.
Aparicio, G (2000): El comercio internacional de alimentos y materias primas agrícolas
entre 1900 y 1938. Tesis Doctoral. Universidad de Zaragoza.
Athukorala, P. and Sen, D., (1998): “Processed food exports from developing countries:
patterns and determinants”. Food Policy, vol 23, pp 41-54.
Baffes, J. (2005): “Cotton: Market setting, trade policies and issues” in Askoy, M. and
Beghin, J. Global agricultural trade and developing countries. World Bank.
Washington DC.
Baier, S. and Bergstrand, J. (2001): “The growth of world trade: tariffs, transport costs, and
income similarity”. Journal of International Economics, Vol. 53, pp 1-27.
Bairoch, P. (1989): “European trade policy, 1815-1914”, in P. Mathias and S. Pollard, The
Cambridge Economic History of Europe, Vol. VIII, Cambridge University Press,
Cambridge, pp. 1-160.
Berkun, S, and Mejil, H (2000): “The application of trade and growth theories to agriculture:
a survey” The Australian Journal of Agricultural and Resource Economics, Vol. 44,
pp 505-542.
Brülhart, M. and Elliott, R. (1998): “Adjustment to the European single market: inferences
from intra-industry trade patterns”. Journal of Economic Studies. Vol, 25, No. 3, pp.
225-247.
Cho, G., Sheldon, I., and McCorriston, S. (2002): “Exchange rate uncertainty and agricultural
trade” American Journal of AgriculturalEeconomics, Vol. 84, 4, pp. 931-942.
Clemens, M.A. and Williamson, J.G. (2001): “A tariff-growth paradox? Protection’s impact
around the world 1875-1997”, NBER Working Paper No. 8459, Cambridge, Ma.
Coyle, W., Gehlhar, M., Hertel, T., Wang, Z., and Yu, W., (1998): “Understanding the
Determinants of Structural Change in World Food Markets” American Journal of
Agricultural Economics. Vol. 80, 5, pp. 1051-1061.
29

Coyle, W., Hall, W. and Ballenger, N (2001): “Transportation technology and the rising
share of U.S. perishable food trade” In Agriculture and Trade Report, WRS-01-1, The
changing structure of global food consumption and trade. Economic Research
Service/U.S. Department of Agriculture. Whasington DC.
Cranfield J., Eales, J., Hertel, T. and Preckel, P. (2003): “Model selection when estimating
and predicting consumer demands using international cross section data” Empirical
Economics, Vol. 28, pp. 353-364
Daviron, B and Gibbon, P. (2002) “Global Commodity Chains and African Export
Agriculture”. Journal of Agricultural Change, Vol. 2, No. 2, pp.137-161.
Denoon, D., (1983): aquí y siempre- hace falta dos puntos? Settler Capitalism. The Dynamics
of Dependent Development in the Southern Hemisphere. Clarendon Press. Oxford.
Diakosavvas, D., and Scandizzo, P, (1991): “Trends in the Terms of Trade of Primary
Commodities, 1990-1982: The Controversy and its Origins” Economic Development
and Cultural Change. Vol. 39, 2, pp. 231-264.
Díaz-Bonilla, E. and Reca, L (2002): “Trade and agroindustrialization in developing
countries: trends and policy impacts” Agricultural Economics. No. 23, pp. 219-229.
Diaz-Bonilla, E. and Tin, J. (2002): “That was then but this is now: Multifunctionality in
industry and agriculture” TMD Discussion paper No. 94. International Food Policy
Research Institute (IFPRI) Trade and Macroeconomics Division. Washington, DC.
Estevadeordal, A. Frantz, B. and Taylor, A.M. (2003): “The Rise and Fall of World Trade,
1870-1939”, Quarterly Journal of Economics, Vol. CXVIII, 2, pp. 359-407.
FAO (1947-2000): Trade Yerabook FAO de comercio. Food and Agricultura Organization
of the United Nations. Roma. Several years.
FAO (2004 a): FAOSTAT-agriculture. Database, Rome
(http://faostat.fao.org/faostat/collections?subset=agriculture&language=ES).
Federico, G. (2004): “ The Growth of World Agricultural Production 1800-1938”, Research
in Economic History, Vol. 22, pp. 125-182.
30

Federico, G (2005) Feeding the World. An Economic History of Agriculture, 1800-2000.
Princeton University Press, New Jersey.
Findlay, R. and O’Rourke, K. (2003): “Commodity Market Integration, 1500-2000”, in M.
D. Bordo et al. (eds.), Globalization in Historical Perspective, NBER and University
of Chicago Press, Chicago, pp. 13-62.
Frankel, J. (1997) Regional trading blocs in the world economic system. Institute for
International Economics. Washington, DC.
Gehlhar, M and Coyle, W. (2001): “Global food consumption and impacts on trade patterns”
In Regmi, ed. Agriculture and trade report WRS-01-1, Changing structure of global
food consumption and trade. Economic Research Service/U.S. Department of
Agriculture. Washington DC.
Gruber-Lloyd, ?? (1975) Intra-Industry Trade. Macmillan.
Hayami, J. and Ruttan, V. (1989): “El desequilibrio en la agricultural mundial” In Desarrollo
agrícola: Una perspectiva internacional. Edited by Hayami, J and Ruttan, V. Fondo
de Cultura Económica, S.A. Mexico D.F., pp. 407-459.
Hertel, T.W., Anderson, K., Francois, J.F., Hoekman, B and Martin, W. (1999) “Agricultural
and non-agricultural liberalisation in the Milleniun Round” paper presented at the
Conference on Agriculture and the New Trade Agenda in the WTO 2000
Negotiations, October-1999, Geneva
Hummels, D. (2001): “Time as a barrier” Working paper Purdue University.
Iapadre, L. (2004) “Regional integration agreements and the geography of world trade:
statistical indicators and empirical evidence” mimeo. (**Preliminary version),
University of L’Aquilia,
Irwin, D.A. (2002): “Long-run trends in world trade and income”. World Trade Review, 1:1,
pp. 89-100.
Jayasinghe, S. and Sarker, R. (2004): “Effects of Regional Trade Agreements on trade in
agrifood products: evidence from gravity modelling using disaggregated data”
31

Working Paper 04-WP374, Center for Agricultural and Rural Development, Iowa
State University.
Krueger, A. Schiff, M. and Valdés, A. (1998) “Agricultural Incentives in Developing
Countries: Measuring the Effect of Sectoral and Economywide Policy”. The World
Bank Economic Review, Vol. 2, No 3, pp. 252-271.
Krugman, P. and Obstfeld, M. (2001): Economía Internacional. Teoría y Política. Pearson
Educación, S.A. Madrid.
Latham, A.J.H. (1978): The internacional Economy and the undeveloped world, 1865-1914.
Croom Helm. London.
Latham, A.J.H. (1981): The Depression and the Developing World, 1914-1939, (Asia &
Africa) Croom Helm. London.
League of Nations (1945): Industrialisation and Foreign Trade, Geneva.
Lewis, A.W. (1952): “World Production, Prices and Trade, 1870-1960”, The Manchester
School of Economic and Social Studies, Vol. XX. No. 2. pp. 105-138.
Lewis, A.W. (1970): Tropical Development 1880-1913, Allen & Unwin, London.
Lewis, A. W. (1981): "The Rate of Growth of World Trade, 1830-1973", in L.S. Grassman
and E. Lundberg (eds.), The World Economic Order, London, pp.??
Liepmann, H. (1938): Tariff Levels and the Economic Unity of Europe. An Examination of
Tariff Policy, Export Movements and the Economic Integration of Europe, 1913-
1931, Allen & Unwin, London.
Lindert, P. (1991): “Historical Patterns of Agricultural Policy”, in. Timmer P.C, Agriculture
and the State. Growth, Employment, and Poverty in Developing Countries, Cornell
University Press, Ithaca, pp. 1-29.
Ludena, C. and Hertel, T. (2005) “Effects of Productivity Growth in Primary Agriculture on
the? Processed Food Trade and the Food Processing Sector” Working paper for
presentation at the 15th Annual IAMA World Forum, June 2005. Chicago, United
States.
Maddison, A., (1995): Monitoring the?World Economy, 1820-1992. OECD. Paris.
32

Maddison, A., (2001): The world economy: a millennial perspective. OECD. Paris.
Madsen, J. (2001): “Agricultural Crises and the International Transmission of the Great
Depression” The Journal of Economic History, Vol. 61, No 2, pp. 327-365
Malenbaum, W. (1953): The World Wheat Economy, 1885-1939, Harvard University Press,
Cambridge, Massachusetts.
Matthews, A. (1994) “Trade Reform and the Prospects for Processed Food Exports from
Developing Countries” Journal of Agricultural Economics, 45: 177-188.
McCorriston, S., and Sheldon, I.M. (1998) “EU agriculture and the economics of vertically-
related markets” in Antle et al. Agriculture and Trade and the Environment: The
Impact of Liberalisation on Sustainable Development, Edward Elgar Publishing.
Cheltenham.
O’Rourke, K.H. and Williamson, J.G. (1999): Globalization and History. The Evolution of a
Nineteenth-Century Atlantic Economy, The MIT Press, Cambridge, MA.,
O’Rourke, K.H. (1997): “The European Grain Invasion, 1870-1913”, Journal of Economic
History, Vol. 57, 4, pp. 775-801.
Ocampo, J.A. and Parra, M.A. (2003): “The terms of trade for commodities in the twentieth
century” CEPAL Review, No 79, April 2003, pp. 7-35
Offer, A. (1989): The First World War: An Agricultural Interpretation, Oxford University
Press, New York.
(http://www.wto.org/spanish/res_s/statis_s/its2003_s/its03_longterm_s.htm)
Rae, A. (1997) “Changing Food Consumption Patterns in East Asia: Implications of the
Trend Towards Livestock Products”. Agribusiness, Vol. 13, No.1, pp. 33-44.
Rae, A. and Josling, T., (2003): “Processed food trade and developing countries: protection
and trade liberalization” Food Policy (2003), pp. 147-166.
Reed, M. (2001) International Trade in Agricultural Products. Prentice Hall. New Jersey.
Reimer, J. and Hertel, T. (2004): “Estimation of International Demand Behaviour for Use
with Input-Output Based Data” Economic Systems Research, Vol. 16, No. 4.
33

Rose, A. (2000): “One Money, One Market: Estimating the Effect of Common Currencies on
Trade”. Economic Policy, Vol. 30, pp. 7-45.
Schedvin, C.B. (1990) Staples and Regions of Pax Britannica. Economic History Review, 2nd
ser., XLIII, 4, pp. 533-559.
Serrano, R. and Pinilla, V., (2006): “Determinants of World Trade Growth in Agricultural
and Food Products, 1951 – 2000”, mimeo.
Thorbecke, E. and Condliffe, J.(1963):”The pattern of world trade in foodstuffs: past and
present” in Food. One Tool in International Economic development, Iowa State
University Press, pp. 177-218.
Tracy, M. (1964). Agriculture in Western Europe. Frederick A. Praeger, New York.
Tyres, R and Anderson, K. (1992): Disarray in World Food Markets: A Quantitative
assessment. Cambridge University Press, Hong Kong
UN COMTRADE (2003): UN Commodity Trade Statistics Database. Statistical Division of
the United Nations, New York.
(www.un.org //unstats.un.org/unsd/comtrade)
United Nations (1987): “Métodos utilizados por las Naciones Unidas para construir Índices
de Precios del Comercio Internacional, Volumen I” Informes Estadísticos serie M,
No.82, Vol. 1. United Nations, Nueva York.
Wang, Z., Coyle, W., Gehlhar, M. and Wollrath, T.(2001): “The impact of distance on U.S.
agricultural exports: an econometric analysis” In Agriculture and Trade Report, MP-
1566 Technological Changes, Transportation Sector. Economic Research
Service/U.S. Department of Agriculture, Washington DC.
World Bank (2004) World development Indicators. World Bank. Washington DC.
WTO (2003): “Selected long-term trends” International Trade Statistics 2003. World Trade
Organization. Geneva.
Yates, P. L. (1959): Forty Years of Foreign Trade, Allen & Unwin. London.
34

Yates, P. L. (1960): Food, Land, and Manpower in Western Europe, Macmillan & Coltd.
New York.
Yu, W., Hertel, T., Preckel, P. and Eales, J. (2002) “Projecting World Food Demand Using
Alternative Demand Systems” Economic Modelling, 21, pp. 99-129
35

Statistical Appendix.
1. Methodology and data utilized for the construction of agricultural trade series
by? volume.
a. 1870-1938
For the period 1870-1902 we have employed the series for trade in primary products,
by volume, constructed by Lewis (1981). The main problem of this series is that it is not
sufficiently detailed to throw light on the evolution of different groups of products, or even to
permit the calculation of the total value of trade in agricultural products, which are presented
together with other commodities,
In order to overcome these problems, we have constructed an annual series for the
volume of international agricultural trade between 1903 and 1938, based on data for that
period contained in International Agricultural Statistics, published by the now defunct
International Institute of Agriculture.
The disparities in the number of products and countries for which data are given in
the International Institute of Agriculture Yearbooks were a serious problem for our study33.
In order to obtain a homogeneous series, we were obliged to perform numerous estimates to
ensure the inclusion of international trade volumes covering the largest possible number of
products and countries.
The series finally constructed is an estimation of annual trade volumes for the 62
products which comprise our sample of total trade in agricultural products in the first third of
the XX century. Estimates are based on physical volumes (imports)34; however, we have also
multiplied these physical volumes by their prices in 1925 US dollars, due to the necessity of
aggregating the amounts obtained.
33 While data for only fourteen products are available for the years 1903 to 1908, seventy-two products are included for the period 1933 to 1938. The number of countries included also increases progressively. 34 In general, figures for imports are more accurate than those for exports as the former were subjected to tighter fiscal control.
36

In order to combine both series, we have estimated, using the data for 1903, the
absolute values for 1870-1902 employing the index numbers of Lewis' series (1981).
The disaggregation by products was obtained by estimating the components of
international agricultural trade in four sub-periods. For each sub-period we calculated the
average imports of each product and multiplied them by their prices in 1925 dollars. The
averages for a majority of the products in the first four sub-periods were taken directly from
International Institute of Agriculture statistics. However, it was necessary to estimate some
of these, and all of the averages for the last sub-period, on the basis of the IIA annual series
or with the help of British foreign trade statistics.
We divided the 62 products comprising the sample into nine standard groups, based
on the function of each in human nutrition, or on production processes in the case of raw
materials. These groups are plantation crops, fibres, cereals, oilseed and oils, livestock and
meat, dairy products and eggs, fruit, vegetables, legumes and tubers and wine.
b. 1951-2000
Data for the second half of the XX century were mainly compiled from the trade
figures collated by the Food and Agriculture Organization (FAO) of the United Nations.
These figures are available in paper format (FAO Trade Yearbooks, FAO, 1947-2000)) and
in electronic format (FAOSTAT database)35.
We reconstructed import and export figures at current values (US dollars) for five
economic regions36 and 19 product groups37. We then aggregated countries and products to
obtain two uniform and representative series38. The first series runs from 1951 to 1961 and
35 FAO (2004a) 36Africa, Asia, Europe (including the ex-USSR), North and Central America, Oceania and South America. 37The products included in section 0 to 4 of the Standard International Trade Classification (SITC Revision 2) were treated as agricultural products. Specifically, these comprise the following 19 subgroups: (00) Live animals, (01) Fresh and prepared meat, (02) Dairy products and eggs, (04) Cereals and processed cereals, (05) Fruit and vegetables, (06) Sugar and honey, (07) Coffee, tea and cocoa, (08) Animal feeds, (09) Miscellaneous products, (11) Beverages, (12) Tobacco, (21) Leather and hides, (22) Oil seeds, (232) Natural rubber, (29) Other commodities, (Ex26) Textile fibres, (41) Animal fats, (42) Fixed vegetable oils, (43) Processed oils. 38 Data for the period 1951-1961 are based on the FAO Trade Yearbooks using the Standard International Trade Classification (SITC Revision _____) for that period. Elsewhere, data for the period 1961-2000 are compiled from the FAOSTAT database, which utilizes the Standard International Trade Classification (SITC Revision 2). Both classifications are based on the Brussels Customs Tariff Nomenclature (BCTN). The problems arising from the differences in these classification systems have been
37

reflects international trade for a representative sample of 66 countries39. The second series
(1961-2000) shows trade for all countries, since the FAO provided estimates when the actual
data were unavailable. These series were then linked, on the basis of the hypothesis that the
countries included in the 1951-1961 sample accounted for a similar share of international
trade during those years as in 1961-65.
In order to obtain a series for international agricultural trade by volume, we have
prepared price indices for the various groups of products, applying these to deflate the
relevant current price series. This method of constructing our series is the principal difference
between our study and the agricultural trade series of the World Trade Organisation (the only
one which exists for the second half of the XX century, which employs a general index of
agricultural products to deflate the agricultural trade series to current prices40.
We obtained trade data at current prices and volumes for a sample of 66 products in
agricultural trade41, based on the data from 1961 to 2000 extracted from the FAOSTAT
database. We then obtained the present unit prices (Pt) for all of these products, allowing us
to construct a price index for each product between 1961 and 2000. We then integrated these
price indices with the United Nations estimates (1987) for the period 1950-1961, which
reflect movements in the prices of the same 66 products. On the basis of the 66 price indices
calculated, we constructed weighted indices reflecting the products’ share in agricultural
trade for the 19 product groups (see Note 3). These indices were used to deflate the different
series of product groups at current values.
For the purposes of disaggregating by products, we prepared annual export and
import series (in volume terms) for the agricultural products included in our sample, which
have been divided into 19 standard groups based on the Standard International Trade
Classification (SITC), Revision 2.
resolved using the UN COMTRADE database (2003), created by the Statistical Division of the United Nations, which includes data from both trade classification systems for the period 1961-2000. 39 These countries accounted for approximately 80% of international trade in 1961 (82% of exports and 78% of imports). 40 The principal advantage is that in the future we will be able to work with series disaggregated by product groups in terms of volume, which we will have deflated with their own price indices. 41 In 1961 these products represented 82% of international agricultural trade, and despite their declining share at the end of the period they still accounted for 60% in 2000.
38

2.Tables.
TABLE. 1. Agricultural and food trade in volume terms.
1870-1938 (Thousands Dollars 1925) 1951-2000 (Thousands Dollars 1980)
1870 3,380,747 1910 11,851,473 1951 71,745,095 1991 354,542,8821871 3,642,061 1911 12,577,561 1952 75,910,539 1992 385,048,6051872 3,904,631 1912 13,544,709 1953 77,142,855 1993 378,094,6451873 4,093,079 1913 13,742,929 1954 74,893,958 1994 397,566,8361874 4,192,328 1914 11,020,308 1955 93,269,072 1995 407,227,8731875 4,270,219 1915 10,958,111 1956 95,215,384 1996 412,434,1321876 4,360,674 1916 10,241,463 1957 100,468,574 1997 422,046,0521877 4,399,620 1917 8,641,384 1958 103,178,324 1998 440,662,0061878 4,644,602 1918 7,704,431 1959 105,428,294 1999 470,711,2161879 4,791,591 1919 10,191,301 1960 111,464,128 2000 490,335,2441880 4,961,194 1920 10,907,586 1961 112,293,301 1881 5,020,240 1921 12,115,692 1962 120,117,271 1882 5,145,053 1922 12,522,556 1963 123,381,703 1883 5,366,942 1923 12,822,791 1964 130,478,561 1884 5,408,546 1924 12,871,200 1965 135,507,026 1885 5,436,282 1925 15,927,495 1966 142,903,847 1886 5,699,776 1926 16,136,649 1967 141,710,519 1887 5,893,929 1927 17,282,775 1968 148,498,114 1888 6,018,741 1928 15,715,485 1969 153,814,826 1889 6,490,256 1929 17,627,010 1970 167,469,378 1890 6,712,145 1930 16,500,926 1971 171,697,538 1891 6,934,034 1931 16,516,792 1972 182,931,513 1892 6,864,693 1932 15,446,612 1973 192,172,351 1893 6,809,221 1933 15,968,096 1974 188,306,846 1894 7,308,471 1934 15,387,814 1975 193,115,474 1895 7,821,590 1935 16,055,306 1976 206,849,561 1896 8,029,611 1936 16,114,446 1977 213,175,495 1897 8,459,521 1937 17,200,397 1978 226,441,082 1898 8,972,640 1938 16,029,499 1979 240,666,604 1899 9,097,452 1980 252,224,413 1900 8,667,542 1981 265,041,761 1901 9,097,452 1982 268,575,297 1902 9,541,230 1983 269,591,189 1903 9,985,009 1984 278,806,936 1904 10,044,253 1985 289,175,942 1905 10,585,757 1986 292,766,039 1906 10,363,442 1987 317,984,778 1907 11,231,360 1988 317,973,518 1908 10,269,573 1989 327,741,017 1909 11,828,275 1990 339,023,184
39

TABLE. 2. International agricultural imports by groups of products, 1909-193.( In thousands of 1925 dollars)
Group 1909-13
1924-28
1928-32
1934-38
Cereals 2,565,501 2,761,311 2,880,691 2,384,736 Vegetables, legumes and tubers 170,424 156,790 159,629 115,882 Fruit 398,447 607,261 716,022 750,609 Wine 101,924 108,857 122,495 115,629 Plantation crops 2,725,562 4,803,372 5,258,864 5,264,077 Oilseeds and oils 773,332 1,073,789 1,244,315 1,275,021 Livestock and meat 657,387 1,368,364 1,351,798 1,113,145 Dairy products and eggs 735,123 977,023 1,112,919 1,034,611 Fibres 4,302,742 4,377,638 4,418,256 4,141,835 World total 12,430,443 16,234,406 17,264,990 16,195,545
TABLE. 3. International agricultural imports by groups of products, 1952-2000. (In thousands of 1980 dollars)
Group
1952-59
1959-66
1966-73
1973-80
1980-87
1987-94
1994-00
Bulk commodities 33,866,857 46,673,387 57,635,038 75,133,192 94,817,092 106,260,300 121,782,906Bulk cereals 13,491,552 19,584,444 24,223,727 35,648,227 45,558,010 47,787,109 53,727,130Textile fibres, not manufactured, and waste 11,121,030 13,155,807 13,619,730 13,711,755 15,115,736 16,893,548 17,143,690Livestock 6,595,049 9,772,763 13,902,664 17,387,050 22,653,697 28,442,833 33,249,762Oil seeds, oil nuts and oil kernels 2,659,225 4,160,374 5,888,917 8,386,159 11,489,649 13,136,810 17,662,324Plantation crops 28,159,007 33,094,693 42,496,092 49,150,184 61,237,919 78,752,618 95,112,255Sugar, sugar preparations and honey 10,014,602 11,481,121 13,909,770 14,065,219 19,657,218 24,984,775 32,783,915Coffee, tea, cocoa, spices & manufacs. 11,465,494 13,851,909 18,808,117 22,870,394 27,897,334 38,064,071 41,377,786Tobacco, unmanufactured 3,218,383 4,400,110 5,621,666 7,511,433 8,477,132 9,601,823 13,384,435Natural rubber 3,460,527 3,361,553 4,156,540 4,703,138 5,206,235 6,101,950 7,566,119High value food 17,792,954 27,711,828 40,621,721 58,194,094 74,984,032 96,368,575 117,993,029Meat and preparations 7,373,143 9,873,867 13,668,596 18,600,038 25,056,998 33,308,885 44,075,294Dairy products and eggs 3,631,751 5,261,370 7,335,314 11,035,772 15,778,572 17,857,489 21,037,384Fruit and vegetables 6,788,060 12,576,592 19,617,810 28,558,284 34,148,462 45,202,202 52,880,351Processed products 10,869,558 15,233,677 21,928,828 31,666,106 48,080,811 70,581,825 99,625,098Prepared cereals 687,650 1,006,042 1,749,229 2,824,844 5,064,352 11,883,694 19,480,282Feed. Stuff for animals excl. Unmilled cereals 1,498,368 2,918,729 4,742,996 7,674,146 12,622,176 19,023,555 23,382,515Miscellaneous food preparations 629,462 1,108,216 1,740,763 2,687,992 4,919,254 9,136,046 15,413,846Beverages 5,350,073 6,664,382 8,472,341 10,196,862 12,079,842 12,754,143 15,882,860Animal and vegetable oils and fats 90,688,375 122,713,586 162,681,679 214,143,575 279,119,854 351,963,318 434,513,289
40

TABLE. 4. International agricultural trade by economic regions, 1909-1938 (In thousands of 1925 dollars)
Imports by region
1909-1913 1924-1928 1928-1932 1934-1938
Europe 8,755,989 9,729,936,67 10,680,785,38 9,704,671,99North and Central America 1,559,453 3,231,869,57 3,433,769,38 3,314,276,70South America 150,516 239,248,44 271,186,57 257,231,32Asia 853,525 1,978,674,34 2,460,769,76 2,452,030,72Africa 150,434 229,768,79 319,269,02 347,640,81Oceania 58,409 90,807,79 99,210,03 119,693,14Total 11,528,329 15,500,305,59 17,264,990,14 16,195,544,68
Export by region
1909-1913 1924-1928 1928-1932 1934-1938
Europe 3,487,620 2,925,975 3,148,480 2,404,098North and Central America 2,081,236 3,290,014 3,015,602 2,270,044South America 1,220,119 1,872,024 1,923,663 1,949,332Asia 2,000,964 3,669,151 4,309,819 4,561,385Africa 524,169 822,698 991,661 1,204,673Oceania 704,294 965,033 1,161,833 1,325,994Total 10,018,440 13,544,895 14,551,057 13,715,526
TABLE. 5. International agricultural trade by economic regions, 1952-2000 (In thousands of 1980 dollars)
Imports by region
1952-59 1959-66 1966-73 1973-80 1980-87 1987-94 1994-00
Europe 53,660,236 71,749,320 94,712,668 122,435,552 150,540,290 197,152,079 207,168,871N & C America 16,835,317 20,246,920 26,127,053 27,561,082 35,956,939 43,198,947 59,802,549South America 3,498,054 3,008,303 3,503,716 5,323,475 6,505,576 7,416,988 14,214,901Asia 12,696,690 20,791,362 29,927,516 45,617,470 66,432,496 91,173,002 126,608,407Africa 3,147,832 5,812,980 6,950,997 11,437,109 17,531,873 17,928,143 22,214,297Oceania 850,246 1,087,881 1,427,811 1,744,290 2,303,620 3,119,189 4,417,169Total 90,688,375 122,696,766 162,649,761 214,118,978 279,270,794 359,988,348 434,426,194 Exports by region
1952-59 1959-66 1966-73 1973-80 1980-87 1987-94 1994-00
Europe 24,071,841 35,653,873 54,933,384 79,059,193 105,466,003 150,831,009 183,721,328N & C America 18,210,545 28,883,771 36,003,618 51,044,125 62,966,810 67,371,635 85,378,096South America 9,361,795 10,882,968 13,947,664 17,258,996 21,935,284 25,196,655 37,464,702Asia 10,574,431 17,087,808 21,104,811 25,744,819 36,299,785 52,781,880 70,281,318Africa 6,256,022 12,846,740 15,572,660 15,072,769 13,665,057 13,918,702 16,197,434Oceania 5,994,598 8,089,126 9,674,354 11,088,325 14,081,515 16,552,543 21,909,689Total 74,469,231 113,444,286 151,236,490 199,268,227 254,414,453 326,652,423 414,952,566
41

3.Notes.
1. Ratio of international agricultural trade to world agricultural output In order to obtain the ratio between trade in agricultural products and foodstuffs and agricultural production we were obliged, firstly to convert our trade series (by volume) for 1902-1938 at 1925 prices to a new series using 1913 prices. To this end, we utilised as a deflator the price index for agricultural trade developed by Lewis (1952). Subsequently, we employed our figure, at 1913 prices, for the year 1903, in order to obtain, using the quantity index of primary product trade constructed by Lewis (1981) a continuous series for 1870-1938 at 1913 prices. For the value of agricultural production we have used the figure for 1913 at that year's prices, for 25 countries, supplied most generously to us by Giovanni Federico. To obtain a complete series for the value of world production at that year's prices for the period 1870-1935 we employed the index numbers for world agricultural production compiled by Federico (2004) and his estimation of the weight of the 25 countries in world production. The calculation of the ration for the second half of the XX century was simpler. On the one hand we employed the series of for the volume of world imports of agricultural products and foodstuffs compiled by ourselves, valued at 1995 prices. On the other, for world agricultural production valued at 1995 prices we employed the World Development Indicators (WDI, 2004); to complete the series we utilised the index provided by the WTO (2003). Using the same source, it was possible to calculate the ratio for manufactures and for total trade [(comparing the latter with different periods, elaborated by Maddison (2001)]
2. Grubel-Lloyd index of intra-industrial trade. To measure the evolution of the share of intra-industrial exchanges in trade in agricultural processed products, the Grubel-Lloyd index (1975), considered as a standard measure of intra-industrial trade within a product/sector, was employed.
( )( )i
iiGL
MXi
MXiMXii
+
−+ −=
The numerator reflects the intra-industrial trade in the product/sector, and the denominator the total trade in the product/sector; Xi is the exports for the product i, and Xi the imports for the product i.. The index is comprised of a representative sample of 17 countries and 102 products (not listed due to problems of space). FAO offers both exports and imports, in its trade yearbooks (1945-1961), and in the FAOSTAT database (1961-2000). For the period 1945-1960 the sample comprises 36 products. For the calculation of an aggregate measure of the G-L index, this was calculated, firstly, for each of the sample products, weighting the share of each country by the weight of the sum of exports and imports in 1965. Secondly, in order to calculate the total G-L index of agricultural processed products the share of each product was weighted by its share in trade in 1965.
3. Agricultural openness and relative openness index. Internal and external trade creation effects could be measured by a (symmetrical) indicator of relative openness, based on the comparison between the regional trade-to-GDP ratio (Oi) and that of the rest of the world (O w-i) 5
( )( ) 1/
1/+−
=−
−
iwi
iwii
OOOOSO
This index is greater than zero if the region’s degree of trade openness exceeds the world average, showing that forces directing market integration are stronger than in other regions. Data for agricultural trade (exports plus imports in current values are based on UN Comtrade (2003) for both EU-15 agricultural trade and for that of the rest of the world (group O in the SITC classification), and data for production are based on current values, extracted from WDI (2004)
42