europe and central eurasia - usgs · 2012 minerals yearbook ... equal standing under international...
TRANSCRIPT

2012 Minerals Yearbook
U.S. Department of the Interior U.S. Geological Survey
EUROPE AND CENTRAL EURASIA
February 2015
EuropE and CEntral Eurasia—2012 1.1
The Mineral indusTries of europe and CenTral eurasia
By Alberto Alexander Perez, Elena Safirova, Steven T. Anderson, Alfredo C. Gurmendi, Harold R. Newman, Yadira Soto-Viruet, Glenn J. Wallace, and David R. Wilburn
The region of Europe and Central Eurasia as defined in this volume encompasses territory that extends from the Atlantic coast of Europe to the Pacific coast of the Russian Federation. It includes the British Isles, Iceland, and Greenland (a self-governing part of the Kingdom of Denmark).
The European Union (EU) is a supranational entity that at yearend 2012 comprised the following 27 countries: Austria, Belgium, Bulgaria, Cyprus, the Czech Republic, Denmark, Estonia, Finland, France, Germany, Greece, Hungary, Ireland, Italy, Latvia, Lithuania, Luxembourg, Malta, the Netherlands, Poland, Portugal, Romania, Slovakia, Slovenia, Spain, Sweden, and the United Kingdom. The euro (€) operates as a single currency for countries within the EU that have fulfilled the stated requirements of the European Central Bank (located in Frankfurt, Germany) for inclusion in the euro area. As of January 1, 2013, the EU countries that were part of the euro area were Austria, Belgium, Cyprus, Estonia, Finland, France, Germany, Greece, Ireland, Italy, Luxembourg, Malta, the Netherlands, Portugal, Slovakia, Slovenia, and Spain. Kosovo and Montenegro officially adopted the euro as their sole currency without an agreement with the euro area and therefore they did not have euro issuing rights in 2012 (European Commission, 2014a, b).
Other countries that were candidates to join the EU were Iceland, Macedonia, Montenegro, Serbia, and Turkey (although no date was given for expected accession, as they were all still in the negotiation stage). Albania, Bosnia and Herzegovina, and Kosovo (under UN Security Council Resolution 1244) were considered potential candidate countries and were expected to start negotiations for EU candidate country status (European Commission, 2014a).
The Commonwealth of Independent States (CIS) was founded in 1991 by several Republics of the former Soviet Union and later was extended to include all the former Soviet Republics except the Baltic States of Estonia, Latvia, and Lithuania. The countries that made up the CIS in 2012 were Armenia, Azerbaijan, Belarus, Kazakhstan, Kyrgyzstan, Moldova, Russia, Tajikistan, Turkmenistan, Ukraine, and Uzbekistan. Georgia withdrew from the CIS in 2008. The CIS does not have supranational powers, and all member countries have equal standing under international law. Although the member countries had pledged to work on economic integration, few actual measures have been taken to make the CIS a functioning integrated economic bloc similar to that of the EU. Some member states of the CIS, however, established the Eurasian Economic Community with the goal of creating a full-fledged common market (Korrespondent.net, 2008).
A Customs Union agreement among Belarus, Kazakhstan, and Russia went into effect on January 1, 2010. According to this
agreement, the countries form a joint customs territory where no customs duties or other economic restrictions on the movement of goods between the three countries apply. Each of the members of the Customs Union applies the same customs rates and trade regulations for goods traded with countries outside of the Customs Union. The members of the Customs Union were projected to save more than $400 billion by 2015 owing to reduced shipping times. Armenia, Kyrgyzstan, and Tajikistan expressed their interest in joining the Customs Union in the future but, as of the end of 2012, no decisions had been made (International Centre for Trade and Sustainable Development, 2010).
Starting on January 1, 2012, the Customs Union among the three countries was transformed into a Common Economic Space (CES), which was the next step in the Eurasian integration process. The CES agreement removed barriers to the movement of goods, capital, and labor between the three countries. It also included coordinated principles of business regulation and coordination of macroeconomic and monetary policies, although it did not imply the introduction of a common currency. The Eurasian Economic Commission, which was a new supranational body, was expected to govern the integration processes within the CES framework and had the right to make decisions that would become mandatory for all three states. In 2012, the CES court in Minsk, Belarus, which was to resolve economic disputes between member states as well as between individual economic agents, started operations. The complete package of CES integration documents included 17 international treaties and was signed in November 2011 in Moscow. The ultimate goal of the integration among the CES members is creation of a Eurasian Economic Union (an organization similar to the EU), which was planned for 2015 (Utro.ru, 2012).
The European Free Trade Association (EFTA), which is an alternative entity to the EU in Western Europe, comprised Iceland, Liechtenstein, Norway, and Switzerland. The agreement on the European Economic Area (EEA), which had been in force since 1994, brings all 27 EU members and 3 of the EFTA members (Iceland, Liechtenstein, and Norway) into a single internal market. The EEA provides for the free movement of goods, services, persons, and capital among the 30 EEA states. Switzerland was not part of the EEA but had a bilateral agreement with the EU that addresses the same issues covered by the EEA (European Free Trade Association, 2014).
The 49 countries in the Europe and Central Eurasia region encompass an area of 29.4 million square kilometers, which is about three times larger than that of the United States; 17.1 million square kilometers of the area is accounted for by Russia. In 2012, the 49 countries had a total population of 822 million. The EU population as of January 1, 2013, was

1.2 U.S. GEOLOGICAL SURVEY MINERALS YEARBOOK—2012
505.7 million, which was about 60% larger than that of the United States. The total gross domestic product (GDP) based on purchasing power parity of the 49 countries in the region was about $20.6 trillion, and the weighted average per capita GDP was $25,000; the per capita GDP ranged from $2,219 in Tajikistan to $84,450 in Luxembourg (tables 1, 2).
Acknowledgments
The U.S. Geological Survey (USGS) acknowledges and expresses its sincere appreciation to the following foreign Government agencies, international institutions, and private research organizations for providing mineral-production statistics, basic economic data, and other mineral-related information:
• Armenia—National Statistical Service;• Austria—Bundesministerium für Wirtschaft, Familie und
Jugend;• Belgium—Statistics Belgium (StatBel);• Bosnia and Herzegovina—Agency for Statistics of Bosnia
and Herzegovina;• Cyprus—The Mine Service; Ministry of Agriculture,
Natural Resources and Environment;• Estonia—Geological Survey of Estonia;• Finland—Geological Survey of Finland;• Georgia—National Statistics Office of Georgia
(GEOSTAT);• Germany—Bundesanstalt für Geowissenschaften und
Rohstoffe;• Greece—the Government of Greece;• Hungary—Magyar Köztársaság Gazdasági Ès Közlekedési
Minisztérium Magyar Geológiai Szogálat (Hungarian Geological Survey);
• Iceland—Statistics Iceland;• Latvia—Central Statistical Bureau of Latvia;• Lithuania—Statistics Lithuania;• Moldova—National Bureau of Statistics of the Republic of
Moldova;• Montenegro—Statistical Office of the Republic of
Montenegro;• Poland—Central Statistical Office;• Portugal—Instituto Geológico Minero (IGM), Division of
Statistical Studies;• Romania—National Institute of Statistics;• Serbia—Serbian Government;• Slovenia—Slovenian Government;• Tajikistan—Agency on Statistics under the President of the
Republic of Tajikistan; and• Ukraine—State Statistics Committee.
General Economic Conditions
Growth in the Europe and Central Eurasia region decelerated considerably in 2012 after relatively strong growth in 2011. All economies in the region had to deal with challenging external conditions, including the euro area’s recession and debt problems, volatile global financial markets, and a slowing global economy. Although the economy of the region as a whole had
average growth of 1.1%, the economies of a number of countries in the region grew at a much faster rate in 2012, including that of Turkmenistan (which expanded by 11.0%), Uzbekistan (8.0%), Tajikistan (7.5%), Armenia (7.2%), Georgia (6.5%), Latvia (5.8%), and Kazakhstan (5.0%) (International Monetary Fund, 2013; World Bank, The, 2013).
Uranium production in the region of Europe and Central Eurasia accounted for 51.6% of the world’s production of this mineral commodity (measured in U3o8 content); lignite coal, 49.9%; and titanium metal, 48.2%. The region’s output of potash (K2O equivalent) accounted for 43.7% of world production; secondary aluminum, 41.6%; refined palladium, 38.8%; nickel metal, 36.3%; refined platinum, 32.1%; ammonia (N content), 24.4%; secondary lead, 24.1%; and secondary copper, 23.5%. The region also produced 20.4% of the world’s output of primary aluminum, 19.4% of the world’s output of primary copper, and 18.3% of the world’s output of crude steel. The region was practically self-sufficient in the production of construction materials and remained among the world’s leading producers of natural gas (34.0% of world production). Russia accounted for 26.8% of total natural diamond (gemstone and industrial) production in the world (table 4). The region was a leading crude oil producer and had significant coal reserves.
The EU countries were substantial participants in the world mineral economy and occupied an important role mostly as processors and consumers of most major mineral commodities. In Central Eurasia, however, mining of several mineral commodities remained economically important and made significant contributions to the GDPs and export revenues of the countries that produced them. In 2012, Central Eurasia remained a major world supplier of mined and processed minerals, and the consumption of these commodities in the region had increased in the past few years. The countries of Central and Eastern Europe and the CIS produced mineral commodities mainly for export, and the output of mineral commodities in these countries was significantly influenced by economic conditions in the rest of the world. China and the EU were especially significant markets for mineral products from Central and Eastern Europe and the CIS. As economies began to show signs of recovering from the global economic crisis that began in 2008, consumption of mineral commodities increased and drove the recovery of production in the region.
In the CIS, Russia and Kazakhstan were the two leading producers of mineral commodities. In Russia, mining and quarrying contributed $179 billion (10.9%) to the total value added in the economy in 2012. Mineral products made up 71.4% of the total value of Russian exports, and crude oil alone contributed 34.4% to the total value of exports. Petroleum products, natural gas, and ferrous metals accounted for 19.7%, 11.8%, and 4.8%, respectively, of the total value of Russia’s exports (Federal State Statistics Service of the Russian Federation, 2013a, b).
Russia, which accounted for about 80% of the territory of the CIS, was by far the largest country in the CIS in terms of both population and territory, and it was the leading mineral producer. Many other CIS countries also were significant producers and processors of minerals. In 2012, Russia ranked among the top world producers or was a significant regional producer of such

EuropE and CEntral Eurasia—2012 1.3
mineral commodities as aluminum, antimony, arsenic, asbestos, barite, bauxite, boron, cadmium, cement, coal, cobalt, copper, diamond, diatomite, fluorspar, gallium, gemstones, germanium, gold, graphite, gypsum, indium, iodine, iron ore, lead, lime, magnesium compounds and metals, mica (flake, scrap, and sheet), molybdenum, natural gas, nickel, nitrogen, palladium, peat, petroleum, phosphate rock, pig iron, platinum, potash, rhenium, selenium, silicon, steel, sulfur, tellurium, titanium sponge, tungsten, uranium, vanadium, and vermiculite.
In Kazakhstan, total industrial production was valued at $113 billion, of which $68.7 billion (60.8%) was from mining and $13.1 billion (12%) was from metallurgy (including $4.8 billion from ferrous metallurgy). Extraction of crude petroleum alone contributed $57.9 billion to the country’s GDP. Overall, extractive industries contributed 34% to the country’s GDP and metallurgy contributed another 6.4% to the GDP. Kazakhstan was a leading producer of uranium (37% of the world’s production), the second-ranked producer of chromium (16%), the fourth-ranked producer of titanium sponge (11%) and magnesium metal (3%), and the fifth-ranked producer of rhenium (6%). The country was also a significant producer of bauxite, cadmium, copper, gallium, and zinc (Agency of Statistics of the Republic of Kazakhstan, 2013).
Ukraine was a significant producer of such mineral products as ferroalloys, iron ore, manganese ore, pig iron, steel, and titanium raw materials. Other CIS countries were significant world or regional producers of one or more mineral commodities, including Armenia (molybdenum), Azerbaijan (petroleum), Belarus (potash), Kyrgyzstan (antimony metal and mercury metal), Tajikistan (antimony ore), Turkmenistan (natural gas), and Uzbekistan (gold and uranium). All the CIS countries produced a number of other mineral commodities.
The EU was mostly dependent on imported mineral raw materials for metals, industrial minerals, and fuel minerals. The import dependence for many metal ores was 100% [including for antimony, cobalt, ilmenite, molybdenum, niobium, platinum-group metals (PGMs), rare-earth metals, rutile, tantalum, and vanadium], and the EU was from 70% to 90% import dependent for most other metallic ores. The EU’s dependence on imports of metallic mineral raw materials (such as concentrates, ores, and scrap) and obtaining sources of energy for its metal refining and processing industries were key concerns for the EU’s mineral industry (European Commission, 2008).
As a major world mineral processing and consuming area, the EU remained a significant determinant of world demand for nearly all mineral commodities. Its mineral processing and manufacturing industries accounted for a significant share of the world production of semimanufactured and fabricated ferrous and nonferrous metals. In 2012, Germany was still the EU’s dominant smelter and refiner of most metals. With a high per capita income and standard of living, the EU was one of the world’s major consumers of mineral fuels and of mineral products in consumer goods.
Legislation
In September, the President of Kyrgyzstan signed into law a new mining code that was adopted by the country’s Parliament
in June. The new code is intended to improve the investment climate in the country and it sets fees that mining companies are obligated to pay to the central and local governments for their use of the country’s natural resources. The main principles of the new code are protection of investment as a form of private property, noninvolvement of local and national authorities in management decisions of private enterprises, and provision of exclusive rights for the transition of licenses from exploration to mining. The new code also describes how mining contributes to socioeconomic development of localities, outlines the “social packet” to be included in the application for exploration and mining licenses, and establishes renewal fees for extending licenses (Knews.kg, 2012).
In July, Romania’s Zeta Petroleum plc announced that a new energy and gas law (law No.123/2012) had been published in the Romanian official Gazette No. 485, dated July 16, 2012. The main objective of this law is to put into Romanian law the provisions of the European Commission’s third energy package concerning rules for the internal market in natural gas. The new law provides a calendar for the elimination of regulated prices for end users. These regulated prices ended on December 1, 2012, for nonresidential customers and was to end on July 1, 2013, for residential customers (Zeta Petroleum plc, 2012).
Several changes in the law focused on the provisions concerning exploration. In Greenland, legislation setting the framework for foreign exploration and mining in the country was passed and became law in 2012. The new law defines what is to be classified as a large-scale project and regulates the minimum salary levels for foreign workers (Creamer Media’s Mining Weekly, 2012). According to Statistics Greenland, the number of exploration licenses granted in Greenland had increased to 75 in 2011 from 33 in 2005 (North of 60 Mining News, 2012).
A new tax law was ratified in Poland in 2012 that would tax copper and silver based on the mass of the extracted commodity and would be evaluated monthly. The maximum tax rate for the extraction of copper was 16,000 Polish zlotys (PLN), or US$5,000 per metric ton, and the maximum tax rate for the extraction of silver was PLN2,100 (US$660) per kilogram (U.S. Library of Congress, 2012).
In 2012, new export duties were imposed in Kazakhstan and Russia (Deloitte Development LLC, 2012). According to the March 2013 Fraser Institute survey, the top 10 destinations for mineral exploration based on favorable Government mineral policies in 2012 included Finland, Ireland, Norway, and Sweden. Finland, Greenland, and Sweden were included in the Fraser Institute 2012 survey of the top 10 destinations for mineral exploration based on their prospecting potential (assuming the regulations and land use restrictions that were in place in 2012) (Wilson, McMahon, and Cervantes, 2013).
Exploration
Information on exploration activities for Europe and Central Eurasia based on data provided by USGS compilations and economic data reported in U.S. nominal dollars by the SNL Metals Economics Group (SNL-MEG) has been included in a grouping of data for projects in mainland Asia, the CIS,
1.4 U.S. GEOLOGICAL SURVEY MINERALS YEARBOOK—2012
Europe, and the Middle East. As reported by SNL-MEG, the mineral exploration budget for this composite region increased by about 28% to about $3.1 billion in 2012 from the $2.4 billion in 2011. The exploration budget for Russia was reported to have increased to about $610 million in 2012 from about $337 million in 2011, and to account for about 3 percent of the world’s exploration budget in 2012. These figures for exploration activity in Russia do not include activity conducted by Government-controlled entities (SNL Metals Economics Group, 2012).
In terms of the number of exploration sites, the greatest amount of exploration in Europe and Central Eurasia took place primarily in Kazakhstan, Russia, and Scandinavia (particularly Finland and Sweden). On the basis of exploration site data compiled by the USGS, Russia accounted for about 24% of the sites actively being explored in this regional grouping in 2012, Sweden accounted for about 9%, Finland accounted for about 8%, and Greenland and Kazakhstan each accounted for about 7%. The remaining 45% took place in 22 other countries located in the CIS and the EU. Exploration activity in the CIS focused primarily on gold (65%), copper (12%), iron and silver (6% each), potash (4%), rare earths (3%), and other minerals (4%). European mineral exploration focused primarily on gold (38%), nonferrous base metals (32%), iron ore (6%), rare-earth elements (4%), and uranium (3%); the remaining 17% of the exploration activity focused on 11 other mineral commodities.
Commodity Overview
This report includes mineral commodity outlook tables. In tables 5 through 20, estimates for the production of major mineral commodities for 2015 and beyond have been based upon supply-side assumptions, such as announced plans for increased production/new capacity construction and bankable feasibility studies. The outlook tables in this summary chapter show historic and projected production trends; therefore, no indication is made about whether the data are estimated or reported, and revisions are not identified. Data on individual mineral commodities in the tables in the individual country chapters are labeled to indicate estimates and revisions. The outlook segments of the mineral commodity tables are based on projected trends that could affect current (2012) producing facilities and on planned new facilities that operating companies, consortia, or Governments have projected to come online within the indicated timeframes. Forward-looking information, which includes estimates of future production, exploration and mine development, cost of capital projects, and timing of the start of operations, is subject to a variety of risks and uncertainties that could cause actual events or results to differ significantly from expected outcomes. Projects listed in the following section are presented as an indication of industry plans and are not a USGS prediction of what will take place.
Metals
Bauxite and Alumina and Aluminum.—In 2012, Russia and Kazakhstan produced the majority of bauxite output in the region, accounting for 5.7 million metric tons (Mt) and 5.2 Mt, respectively. By 2019, bauxite production was likely to increase
slightly in both Russia and Kazakhstan to projected output levels of 6.0 million metric tons per year (Mt/yr) and 5.5 Mt/yr, respectively. In 2012, Russia was the leading source of alumina in Europe and Central Eurasia with annual production of 2.7 Mt. Ireland ranked second with 1.9 Mt and was followed by Kazakhstan and Spain (1.5 Mt each), and Ukraine (1.4 Mt) (tables 4, 5).
In 2012, Russia, which was the leading individual producer of primary and secondary aluminum in Europe and Central Eurasia, produced 3.9 Mt. The next-ranked producers in the region were Norway (2.05 Mt), Italy (1.11 Mt), and Germany (1.05 Mt). The projected output of primary and secondary aluminum in Russia was expected to remain unchanged through 2019. Production capacity was expected to be increased in Italy to 1.4 Mt/yr by 2019, but it was not expected to change significantly in Germany and Norway (tables 4, 6).
United Company RUSAL (RUSAL) of Russia was the world’s leading producer of aluminum. RUSAL operated 14 smelters in Russia and Europe (12 in Russia, 1 in Ukraine, and 1 in Sweden). In 2012, RUSAL produced 12.37 Mt of bauxite, 7.48 Mt of alumina, and 4.17 Mt of aluminum at its facilities worldwide. Because of low aluminum prices in 2012, RUSAL was involved in cost-cutting activities and was devising a plan to divert aluminum production to its Eastern Division (where energy prices were lower) from its Western Division (where energy was more expensive). Instead, the plants in the Western Division were to focus on production of aluminum ferroalloys and flat ingots, which were much less energy-intensive to produce.
Cobalt.—The Europe and Central Eurasia region produced 26.2% of the world’s total production of refined cobalt in 2012. According to the Cobalt Development Institute, Finland produced 10,547 metric tons (t) and was the second-ranked producer of refined cobalt in the world after China. The only producer in Finland was the OM Group of the United States. Umicore N.V. of Belgium (4,200 t) was the world’s fourth-ranked producer and Xstrata of Switzerland at its operations in Norway (2,969 t) was the world’s sixth-ranked producer. Other cobalt producers in the region were OAO GMK Norilsk Nickel (Nornickel) in Russia, which produced 2,186 t, and Eramet S.A. of France, which produced 326 t (table 7; Cobalt Development Institute, 2013, p. 3).
Copper.—In 2012, Russia was the region’s leading producer of both mined copper and refined copper. Russia’s mine production of copper was projected to increase to 1,000,000 metric tons per year (t/yr) by 2019 from 883,000 t in 2012. Other leading producers of mined copper in the region in 2012 were Poland (479,000 t), Kazakhstan (419,000 t), Bulgaria (108,000 t), and Uzbekistan (96,000 t). Russia’s production of refined copper was 875,000 in 2012 and was projected to stay at about the same level through 2019. Other leading producers of refined copper in the region in 2012 were Germany (686,000 t), Poland (566,000 t), Belgium (380,000 t), and Kazakhstan (367,000 t). Production in Kazakhstan was projected to increase to 410,000 t/yr by 2019, and production in Belgium, Germany, and Poland was expected to remain at about the same level (tables 8, 9).
Russia had three leading vertically integrated copper producing companies— Nornickel, OAO Ural’skaya

EuropE and CEntral Eurasia—2012 1.5
Gorno-Metallurgicheskaya Kompaniya (UGMK), and ZAO Russkaya Mednaya Kompaniya (RMK). In 2012, RMK was building two new mines in Chelyabinskaya Oblast’ in the South Urals and expected to commission them in late 2013 and 2014. When at full capacity, the two new mines were expected to produce 44 Mt/yr of copper ore. Metalloinvest Holding and State Corporation Gostechnologii continued to build a mine at the Udokan deposit in Zabaikal’skiy Kray. The mine was expected to start producing in 2014 and to reach projected capacity of 36 Mt/yr of copper ore by 2016.
Kazakhmys plc was the dominant producer of copper ore and metals in Kazakhstan. The company produced 306,100 t of copper contained in concentrate and 294,400 t of refined copper cathodes, which accounted for about 73% of the copper in concentrate and 89% of the refined copper produced in Kazakhstan in 2011, respectively. The average copper grade of crude ore produced by Kazakhmys decreased to 1.01% from 1.09% in 2010, resulting in a 6% decrease in the copper content of ore production despite a 1.5% increase in crude ore production. Ore grades were expected to continue to decrease, but Kazakhmys planned to partially offset this decrease by increasing crude ore production volumes. New mines at the Aktogai and the Bozshakol deposits were expected to open in 2015 and to produce, together, about 200,000 t/yr of copper in concentrate during the first 10 years of the life of the mines (Kazakhmys plc, 2013).
KGHM Polska Miedz S.A. was the only producer of mined copper and primary copper metal in Poland. In 2012, KGHM produced about 427,000 t of copper in concentrate and 566,000 t of electrolytically refined copper. The average copper content at the company’s mines had been decreasing in recent years and was 1.59% in 2012. KGHM tried to maintain refined copper production by increasing the amounts of mined ore and by using increasing amounts of purchased copper scrap and imported copper concentrates.
Uzbekistan produced an estimated 96,000 t of refined copper in 2012. The only copper producer in Uzbekistan was the Almalyk mining and metallurgical complex (Almalyk GMK), which was located in Toshkent Voliyati. The company had mining, beneficiation, and metallurgical facilities. Copper ore was mined from the Kalmakyr and the Sary-Cheku deposits; a new deposit, Dal’nee, which is similar in ore structure to Kalmakyr, was to serve as a replacement as the first two deposits become depleted. In 2012, Almalyk completed reconstruction and expansion of the Kalmakyr Mine, which was expected to increase the mine capacity to 31.5 Mt/yr of ore. The Almalyk GMK was also planning to start developing the Dal’nee deposit in 2014.
Gold.—In 2012, Europe and Central Eurasia accounted for about 15% of world gold production; the majority of gold produced in the region came from Central Eurasia. The principal producers, by volume, were Russia, which produced about 217,800 kilograms (kg) of primary gold, followed by Uzbekistan (93,000 kg), Kazakhstan (about 39,900 kg), Finland (about 10,800 kg), and Kyrgyzstan (about 10,300 kg). Russia’s production of gold is projected to increase to 240,000 kilograms per year (kg/yr) by 2019, and that of Uzbekistan and Kazakhstan is projected to increase
to 110,000 kg/yr and 54,000 kg/yr, respectively. Russia, Uzbekistan, and Kazakhstan are projected to remain the principal producers of gold in the Europe and Central Eurasia region for the foreseeable future (table 10).
In 2012, Russia produced a total 226.3 t of gold, which included 217.8 t of primary mine production. The primary mine production in 2012 constituted a 9.1% increase compared with the output in 2011. As of 2012, Russia had 26 large gold mining companies which together produced about 80% of all the gold produced in the country, and the rest of gold was mined by about 400 smaller scale producers. In 2012, the leading gold-producing regions in Russia were Krasnoyarskiy Kray (44.0 t), Amurskaya Oblast’ (29.3 t), Sakha Republic (Yakutiya) (21.2 t), Magadanskaya Oblast’ (19.7 t), Irkutskaya Oblast’ (19.0 t), and Chukotskiy Avtonomnyy Okrug (18.0 t). The leading producers of gold in 2012 were OAO Polyus Zoloto (48.8 t), Petropavlovsk plc (22.1 t), OAO Polymetall (15.2 t), and Kinross Gold Corp. (14.5 t). By the end of 2013, two new mining and beneficiation plants in Magadanskaya Oblast’—one at the Natalkinskoe deposit and one at the Pavlik deposit—were expected to become operational. The combined gold production of the two plants at full capacity was projected to reach 55 t/yr.
In 2012, Uzbekistan produced an estimated 96 t of gold. The main gold producer in Uzbekistan was the Navoi mining and metallurgical complex (Navoi GMK), which was responsible for more than 80% of Uzbekistan’s gold production. The resources of the Navoi GMK included 13 deposits that made up about 85% of all gold resources of Uzbekistan. The largest deposit, Muruntau (located in the central Qizilqum region), contains gold quartz ores and was mined by an open pit method. The Navoi GMK included four metallurgical plants in Navoiy, Uchkuduk, Zarafzhan, and Zarmitan. In 2012, the Navoi GMK was planning to complete construction of a new gold mining complex that would use bioleaching technology and produce 20 t/yr of gold when it reaches its full capacity. Other renovation and expansion projects at the Navoi GMK in 2012 included modernization of heap-leaching facilities at the Muruntau Mine and a series of improvements at the Zarmitan plant. Other gold producers in Uzbekistan included the Almalyk GMK and Amantaytau Goldfields, which was a joint venture of the Uzbekistan’s State Committee for Geology, the Navoi GMK, and Oxus Gold plc. of the United Kingdom. In 2012, the Almalyk GMK started construction of three new mines—the Samarchuk Mine, the Kairagach Mine, and the Uzun Mine, all located in Toshkent Viloyati.
The leading producers of gold in Kazakhstan were Kazzinc JSC and Kazakhmys plc, which accounted for 17,400 kg and about 4,000 kg, respectively, or 43.6% and 10%, respectively, of Kazakhstan’s total gold production in 2012. Kazakhmys’ substantial Bozshakol copper development project was reported to contain gold and could be a significant new source of production.
In 2012, Kyrgyzstan produced 10,333 kg of gold, which was a 44.6% decrease compared with the 2011 production level. The largest of the operating mines was the Kumtor gold mine, which is located about 350 kilometers (km) southeast of Bishkek. The Kumtor Mine was operated by Centerra Gold Inc. of Canada. In 2012, Centerra produced only 9.8 t of gold content compared with 18.1 t in 2011. The reason for the sharp reduction in output

1.6 U.S. GEOLOGICAL SURVEY MINERALS YEARBOOK—2012
was an unexpected movement of ice from a glacier into the mine’s open pit. Centerra expected production in 2013 to return to the level of about 18,000 kg/yr. In 2012, the Kumtor Mine contributed 5.5% to the GDP of Kyrgyzstan and 18.9% to the total industrial production of the country.
Dragon Mining Ltd. of Australia and Elgin Mining Inc. of Canada, which merged with Gold-Ore Resources Ltd. in May, had gold mines located in the Skelleftea mining district of Sweden. This district had been the focus of exploration for gold-rich polymetallic deposits since the mid-1920s. Dragon Mining’s Svartliden Mine is located 700 km north of Stockholm, and Elgin’s Bjorkdal Mine is located 750 km north of Stockholm. An updated measured and indicated mineral resource estimate for the Bjorkdal Mine’s open pit and underground mine of 30,295 kg of gold was released in February (Elgin Mining, 2012; Gold-Ore Resources Ltd., 2012; Dragon Mining Ltd., 2013).
Boliden is the other main producer of gold in Sweden. Its polymetallic mines have an estimated capacity of about 2,000 kg/yr of gold. Its major operations were the Aitik Mine, which was principally a copper-producing mine, and the operations at the Boliden and Garpenberg sites (table 10; Boliden AB, 2013, p. 19).
In Romania, Gabriel Resources Ltd. reported proven reserves of 5.9 million troy ounces (180 t) of gold and 32.6 million troy ounces (1,010 t) of silver, and probable reserves of 4.2 million troy ounces (130 t) of gold and 15 million troy ounces (470 t) of silver at its Rosia Montana project. The company estimated that the project could produce an average of 511,000 troy ounces per year of gold during a 16-year mine life and could make Romania a significant European gold producer. The company also reported that 62.45% of the people consulted in a referendum vote were in favor of resuming the mining operations at the Rosia Montana project. The referendum had been initiated by 35 local mayors and conducted on December 9, 2012. The referendum was advisory in nature and did not have the power to enforce or bind the Government to any particular action (Gabriel Resources Ltd., 2012a, b).
Carpathian Gold Inc. of Canada (a junior mine developer) reported that it would account for about 7.2 million troy ounces (220 t) of gold and 635,000 t of copper in contained metal in its final prefeasibility study of the Rovina Valley project. Rovina’s measured and indicated resources were estimated to be 406 Mt at grades of 0.55 gram per metric ton gold and 0.16% copper. Carpathian stated that, compared to a 2008 resource estimate, the copper grade decreased by 11%, and the gold grade, by 12% (Keen, 2012).
Iron and Steel.—Europe and Central Eurasia produced about 18.3% of the world’s crude steel output, which was a slight decrease compared with that of 2011, and it produced 15.8% of the pig iron and direct-reduced iron output in 2012, which was a slightly higher share of the world production than in 2011. Russia was the leading producer of crude steel in the region; its output in 2012 was 70.4 Mt, which was a 3.4% increase compared with that of 2011. Germany was the second-ranked producer, by volume, with production of 42.7 Mt (a decrease of 3.6%) followed by Ukraine, 32.4 Mt (a decrease of 8.2%), and Italy, 27.3 Mt (a decrease of 22.3%).
Russia’s production capacity was projected to increase to 74 Mt/yr by 2019. The production volume in Ukraine was expected to increase to 34 Mt/yr by 2019, and in Italy, to 32 Mt/yr. Germany’s production was projected to decrease to 43 Mt/yr by 2019 (tables 4, 12).
According to the World Steel Association, in 2012, Ukraine was the third-ranked net exporter of steel in the world; it exported about 22.3 Mt of steel, which was about 69% of the country’s total steel production. Ukraine was the 10th-ranked producer of steel, by volume, in the world. Metinvest Holding was the leading producer of crude steel in Ukraine and accounted for 41% of production. The iron and steel industry in Ukraine had the advantage of large domestic sources of iron ore, but it was dependent on export markets for product sales, and it operated inefficiently owing to a need for technical modernization.
Russia was the world’s fifth-ranked producer of steel and the fourth-ranked net exporter; it exported 19.8 Mt in 2012, which was 28.1% of its total production. Germany was the 7th-ranked producer of steel in the world and the 11th-ranked net exporter in the world; it exported 3.1 Mt, or 7.2% of its total production. Italy was the 11th-ranked crude steel producer in the world in 2012, and it was the 8th-ranked net exporter; it exported 4.3 Mt, or 15.6% of its total production. Russia’s apparent consumption of steel in 2012 increased by 2.2% to 41.8 Mt, and that of Italy, Ukraine, and Germany decreased by 18.1%, 9%, and 7.6%, respectively (World Steel Association, 2014).
Russia produced 52.9 Mt of pig iron in 2012, which was 29.2% of the total produced in Europe and Central Eurasia and 4.6% of the total world production. Germany produced 28.3 Mt, which was 15.6% of the total produced in Europe and Central Eurasia and 2.4% of total world production, and Ukraine produced 28.9 Mt, which was 16% of the total produced in Europe and Central Eurasia and 2.43% of total world production (World Steel Association, 2014).
Iron Ore.—Europe and Central Eurasia produced 10.3% of the world’s iron ore in 2012; Russia produced 61.4 Mt (measured in Fe content); Ukraine produced 45.1 Mt; Sweden, 17.2 Mt; and Kazakhstan, 14.3 Mt. Russia’s production was expected to increase to 64 Mt/yr by 2019; Ukraine’s, to 46 Mt/yr; Sweden’s, to 18,000 Mt/yr; and Kazakhstan’s, to 14.7 Mt/yr (table 11).
Sweden’s LKAB’s Kiruna Mine was the world’s largest underground iron ore mine in terms of volume; it has an ore body that is 4 km long and 80 meters wide and reaches to a depth of about 2 km. LKAB announced that it had been granted an environmental permit for a new open pit mine located at Gruvberget. This would be LKAB’s first new iron ore mine in 50 years. Production at the new Gruvberget Mine was expected to be 2 Mt/yr. The ore body contains both hematite and magnetite (table 11; Luossavaara-Kiirunavaara AB, 2012a, b).
Lead and Zinc.—Europe and Central Eurasia produced about 10.2% of the world’s production of mine output of zinc and about 21.8% of the world’s zinc metal output in 2012. Kazakhstan and Ireland were the leading producers of zinc ore (zinc content) and produced 369,700 t and 337,500 t, respectively. Other significant zinc ore (zinc content) producers were Sweden (188,300 t); Russia (179,800 t); and Poland (89,000 t).

EuropE and CEntral Eurasia—2012 1.7
The principal producers of primary and secondary zinc in Europe and Central Eurasia in 2012 were Spain, which produced 490,000 t; Kazakhstan, 319,000 t; Finland, 314,742 t; Belgium, 290,000 t; Russia, 260,000 t; and the Netherlands, 257,000 t (table 4).
Europe and Central Eurasia produced about 7.2% of the world’s production of mine output of lead and about 12.4% of primary lead metal production. Russia, Sweden, and Poland were the principal producers of mined lead, accounting for 93,000 t, 64,000 t and 58,000 t, respectively. Other producers of note were Ireland (47,000 t) and Kazakhstan (38,000 t). The United Kingdom was the principal producer of primary lead metal in the Europe and Central Eurasia region with an estimated production volume of 157,000 t, followed by Germany (134,000 t), Kazakhstan (88,000 t), Russia (85,000 t), and Sweden (62,000 t) (table 4).
Boliden Tara Mine’s operation in Navan, Co. Meath, Ireland, which was the leading zinc mine in Europe, produced about 170,000 t of zinc and about 35,000 t of lead in 2012. Since the mine began its operations in 1977, production had totaled 80.7 Mt grading an average of 8.2% zinc and 1.9% lead. The mine’s Joint Ore Reserves Committee (JORC)-classified ore reserves (proven and probable) were 14 Mt grading 7.2% zinc and 1.7% lead. The mine employed 718 people in 2012 (Boliden AB, 2013, p. 89, 117; Department of Communications, Energy and Natural Resources, 2013, p. 1). Galmoy Mines Ltd. (a subsidiary of Lundin Mining Corp. of Canada) ceased its underground mining operations at its mine in Galmoy in October 2012. The total mine production for 2012 amounted to 142,000 t of ore grading 14% zinc and 2.4% lead. The ore was processed at the Lisheen Mine operations located in Co. Kilkenny (Department of Communications, Energy and Natural Resources, 2013, p. 1; Lundin Mining Corp., 2013). Vedanta Resources Plc. (the owner of the Lisheen Mine) reported that it had produced 1.4 Mt of ore grading 11% zinc and 1.95% lead. The company also produced 321,000 t of zinc concentrates containing 53.3% zinc and 41,000 t of lead concentrates containing 60.3% lead. Since mining operations were started at Lisheen in 1999, a total of 19.72 Mt of ore grading an average of 11.8% zinc and 2% lead had been mined (Department of Communications, Energy and Natural Resources, 2013, p. 1).
In September 2011, Poland’s Ministry of the Treasury had posted an invitation for bids for the purchase of shares of Zaklady Gorniczo-Hutnicze (ZGH) “Boleslaw” S.A. (ZGH Boleslaw), which was Poland’s only producer of lead and zinc ore and the country’s leading producer of refined zinc. The plant is located in the Bukowno region of Poland and had an estimated capacity of about 110,000 t/yr of zinc and 30,000 t/yr of lead. ArcelorMittal held 33.77% share of Stalprodukt S.A., and in November, Stalprodukt acquired an 86.92% share of ZGH Boleslaw (Ministry of the Treasury of the Republic of Poland, 2011; Thomson Reuters, 2012; Stalprodukt S.A., 2013a, p.14, 2013b).
In 2012, Russia had two large zinc deposits (the Kholodninskoe and the Ozyornoe), which are located in the Republic of Buryatiya. In Russia, more than 60% of the zinc produced was used for the production of galvanized steel, mainly for the automobile and construction industries.
Nickel.—In 2012, Europe and Central Eurasia accounted for 10.8% of the world’s mined nickel and 36.3% of the world’s refined nickel production. Production of the region’s mine output of nickel was largely the result of Russian mining activity, and refined nickel production took place mainly in Russia and Western Europe. Russia accounted for about 70.2% of nickel mine output and 52.0% of nickel refinery production in the region in 2012. Other countries, most notably Finland and Greece, also mined nickel ore, but in smaller amounts. Production of refined nickel was more diversified across countries. Russia produced 258,000 t in 2012, and Norway, the United Kingdom, and Finland produced 92,000 t, 46,000 t, and 34,000 t, respectively (tables 4, 13).
Russia was one of the world’s leading nickel mining countries in 2012, accounting for about 8% of the world’s mined nickel. Nornickel was Russia’s leading nickel producer and the world’s leading nickel mining company; the company produced 8.9% of the world’s mined nickel from its worldwide operations. Nornickel’s operations in Russia were located on the Kola Peninsula in the northwest of the country and in the Norilsk region on the Taymyr Peninsula in East Siberia. Nornickel also owned assets in other countries; in particular, mines in Australia and Botswana and the Harjavalta smelter in Finland. In 2012, because of low prices on the world market, the company was considering reducing its investments and even halting the processing of ores mined on the Kola Peninsula by 2015, if the nickel prices remained low.
Finland’s Talvivaara nickel mine was the largest nickel mine in Europe; it operated at two polymetallic deposits—the Kolmisoppi and the Kuusilampi—which are located about 30 km from Sotkamo. Based on estimated proven reserves, the deposit could produce about 2.5% of the world’s nickel during its projected 24-year operating life. Talvivaara’s bioheap-leach project was planned to produce nickel from an open pit operation with cobalt, copper, and zinc as byproducts. In 2012, Talvivaara reported production of 12,916 t of nickel, which was a 20% decrease compared with output in 2011 and much lower than the capacity of between 25,000 t/yr and 30,000 t/yr that was expected to be reached in 2012 (Mining Technology, 2008; Talvivaara Mining Co., 2012, p. 8).
Platinum-Group Metals.—Within the region of Europe and Central Eurasia, almost all mining for platinum-group metals (PGMs) took place in Russia, although small amounts of PGMs were also mined in Finland, Poland, and Serbia. Russia and South Africa were the world’s leading PGM ore producers; Russia was the world’s leading producer of palladium, accounting for 82,400 kg, or 38.8% of the world’s production. It also produced 30,200 kg of platinum (tables 4, 14, 15).
The leading PGM producer in Russia was Nornickel, whose Zapolyarnyi division was mining three large PGM deposits in Krasnoyarskiy Kray—the Norilsk-1, the Oktyabr’skoye, and the Talnakhskoye deposits. Another division within Nornickel, Kol’skaya GMK, was mining several deposits in Murmanskaya Oblast’—the Kotsel’vaara-Kammikivi, the Semiletka, the Zapolyarnoye, and the Zhdanovskoye deposits. Altogether, Nornickel produced almost all the palladium and about 75% of the platinum output in Russia. Another platinum producer in Russia, Chernogorskaya Gornorudnaya Kompaniya (ChGRK),
1.8 U.S. GEOLOGICAL SURVEY MINERALS YEARBOOK—2012
was planning to start mining the Chernogorskoye deposit of nonferrous and precious metals in 2013. The company was expected to reach its production capacity of about 15,000 t/yr of copper, 8,000 t/yr of nickel, 12.5 t/yr of palladium, and 6 t/yr of platinum by 2016.
Silver.—Europe and Central Eurasia produced about 4.6% of the world’s production of mine output of silver in 2012. Russia was the principal silver producer, with an output of 1,679 t of silver content, which was about 40% of the total production of silver in Europe and Central Eurasia. Poland, which produced 1,149 t, was the second-ranked producer of silver, by volume, followed by Kazakhstan, which a produced 963 t. Other relevant producers were Sweden, which produced 309 t, and Finland, which produced 128 t (table 4).
Tin.—Europe and Central Eurasia produced only 0.1% of the total world production of mined tin and only 0.2% of the world production of tin metal, respectively. Russia and Portugal were the only producers of mined tin, and Russia was the only producer of tin metal in the region. Russia was at the lowest tin production point since 2010 and was trying to revive its tin industry. It was expected that, by 2019, mined tin production would increase to 3,000 t/yr from 100 t in 2012 and tin metal production would increase to 3,000 t/yr from 700 t in 2012. Data on tin mine and metal production and projections for future production are in tables 4, 16, and 17.
Titanium.—Europe and Central Eurasia produced about 4.2% of the world’s production of ilmenite (which is an ore mineral of titanium) and about 48.2% of world titanium metal sponge output in 2012. Ukraine was the leading producer of ilmenite; it produced about 146,000 t of TiO2 in 2012. Kazakhstan was a distant second, having produced 15,000 t of TiO2. Russia was the leading producer of titanium sponge, with production of 42,000 t; Kazakhstan and Ukraine produced 21,000 t and an estimated 8,500 t, respectively (table 4).
The titanium industry in Ukraine consisted of ilmenite and rutile concentrate production, titanium sponge production at the Government-owned Zaporozhye Titanium & Magnesium Complex (ZTMK), and titanium ingot production by a small number of producers that had a combined capacity of 12,000 t/yr of titanium ingots. The dominant producers of ilmenite and rutile ores and concentrate were the Irshansk mining and beneficiation complex (GOK) and the Volnogorsk State Mining-Metals Complex. In addition, there was considerable activity in new projects involving production of mined titanium. Velta LLC began production of ilmenite from the Birzulovskoye deposit in Kirovograd Oblast’ in December 2011 and was planning to open the second phase of mine production in the end of 2012. In January, the Government decided to privatize ZTMK, and, as of December, Tolexis Trading Ltd., which was part of the DF Group of Ukraine, had won the tender and acquired 49% of the shares of the titanium sponge producer.
The main producer of titanium sponge in Russia was OAO VSMPO-Avisma, which produced titanium sponge at its titanium and magnesium complex in Permskiy Kray. The raw material for the titanium production was imported, mostly from Ukraine. VSMPO-Avisma supplied titanium mill products to the world’s leading aircraft manufacturers. In 2012, VSMPO-Avisma acquired 75% of the shares of Limpeza Ltd.
of Cyprus (owner of the Demurinskiy GOK, which mined the Volchanskiy deposit containing alluvial titanium and zirconium in Ukraine). It was reported that VSMPO-Avisma was planning to build a beneficiation plant next to the Demurinskiy GOK.
Industrial Minerals
Cement.—Europe and Central Eurasia produced about 7.7% of the world’s production of hydraulic cement. Russia was the largest producer, in terms of volume, at 61.7 Mt, followed by Germany (32.4 Mt), Italy (26.2 Mt), and Spain (20 Mt). According to Cembureau, production in the 27 country members of the European Union decreased, on average, by 20%. Production in Spain and Italy (the countries with the most significant reduction in output) decreased by 39.5% and 20.8%, respectively. In Italy, the decrease was owing mostly to a slowdown in construction, including a decrease in residential construction of 6.3% and a decrease in civil engineering projects and nonresidential construction of 19.7%. In Spain, the decrease in the construction sector continued a 4-year trend. In 2012, the estimated decrease was 34% compared with that of the previous year and included decreased production in all construction sectors. The value of civil engineering projects decreased by 56%; nonresidential construction, by 23%; and residential construction, by 21%. Because of Spain’s economic conditions, the construction sector is highly unlikely to register any increases in production in the coming year, and production in the construction sector was also likely to decrease further. The production decreases were observed in all areas of the EU, including in Eastern Europe, where production in the Czech Republic decreased by 16%, and that in Poland, by 10% (table 4; Cembureau, 2013).
Diamond.—Russia was the world’s leading diamond producer and the only significant diamond mining country in Europe and Central Eurasia. Almost all Russia’s output of diamond was mined by the Joint Stock Company ALROSA (ALROSA) of Russia, which had its main operation in Sakha Republic (Yakutiya) in Eastern Siberia. ALROSA was one of the world’s leading companies in the field of diamond exploration, diamond mining, sales of rough diamond, and diamond processing, and the company accounted for 97% of Russia’s diamond production. Russia’s share of global natural, gemstone, and industrial diamond production was 26.8% in 2012. Data on historic and projected diamond production are in table 18.
According to the Antwerp World Diamond Centre, the city of Antwerp was the center of the world’s open rough diamond market. The city of Antwerp has 1,850 diamond companies and 4,500 diamond dealers, and about 10,000 people work in the industry in the city. In 2012, Belgium’s exports of polished diamond decreased sharply—by 18.91% in terms of volume, and by 17.63% in terms of value, to $997,878,263. The average price per carat of exported diamond was $1,866 in December 2012 (Antwerp World Diamond Centre, 2013a, b).
Lithium.—Portugal was the only lithium producer in the region. In 2012, lithium production in Portugal decreased to 20,700 t from 40,110 t in 2010. It was expected that, by 2015, lithium production would return to its 2010 level, and, by 2019, would increase to about 44,000 t/yr (table 19).

EuropE and CEntral Eurasia—2012 1.9
Potash.—In 2012, Europe and Central Eurasia produced 15.4 Mt of potash (in K2O equivalent), or 43.7% of the world’s production. Russia was the leading regional potash producer in 2012, with output of 5.6 Mt; it was followed by Belarus (4.8 Mt) and Germany (3.8 Mt) (table 4). In 2012, world prices of potash decreased and led to sluggish sales as well as to a slowdown in expansions in the industry.
OAO Uralkali (Uralkali) of Russia was the world’s second-ranked producer of potash. In 2012, Uralkali reduced its production of potash by 14.4% to 5.6 Mt in potassium dioxide equivalent. On average, only about 80% of the capacity of Uralkali’s mines was used. After completing the expansion of the Berezniki-4 Mine, Uralkali increased its annual capacity to 13 Mt/yr of potassium chloride. In addition to Uralkali, several other potash projects were underway. OOO Verkhnekamskaya Potash Co. was preparing the Talitskiy sector of the Verkhnekamskoye potash deposit for production, which was expected to begin in 2016. OAO MHK Eurokhim was continuing to build a mine at the Gremyachinskoye deposit, which was to start producing potassium chloride in 2014.
OAO Belaruskali of Belarus was one of the world’s leading producers of potash mineral fertilizers, and it had a 15% share of the world market. In 2012, the production of potash in Belarus decreased to about 4.8 Mt, or by 9.8%. In 2012, only 55.7% of the produced potash was exported compared with the 88.5% in 2011. Despite the slowdown, Belaruskali continued with expansion of its production facilities. In July, Belaruskali started operations in the Beryozovskiy section of the deposit and increased its annual capacity to 10.3 Mt/yr of potassium chloride. By 2015, the company was planning to increase its production capacity to 11 Mt/yr of potassium chloride.
Mineral Fuels and Related Materials
Coal.—In 2012, Europe and Central Eurasia accounted for 49.9% of the world’s lignite production, 9.8% of the world’s bituminous coal production, and 5.4% of the world’s anthracite production. In Central Eurasia, Kazakhstan, Russia, and Ukraine were the leading coal producers, and within the EU, Germany and Poland were the leading coal producers. A number of other countries throughout the region also mined coal (tables 4, 20).
The dynamics of coal consumption and production among the EU member countries and the CIS countries demonstrates the different priorities of those countries. Countries in the CIS (for example, Kyrgyzstan, Tajikistan, and Ukraine) made concerted efforts to switch their energy-intensive enterprises to coal from natural gas, in part because natural gas is more costly and entails regular conflicts with Russia, which was the main supplier of the natural gas in the region. The EU countries, on the other hand, had been trying to reduce coal production and consumption during the previous decade. By 2012, however, this trend was reversed. Coal consumption in Europe was 707 Mt in 2010 and increased to 762 Mt in 2011 and 784 Mt in 2012. The reason for the shift was that recent developments in the shale gas industry have led to record low prices for natural gas in the United States and, at the same time, reduced the demand for American coal. The oversupply of coal on world markets, in turn, put downward pressure on coal prices in Europe. One more important factor
is that the prices of carbon permits issued by the EU Emissions Trading Scheme (EU ETS) had also dropped and made the combined price (the sum of the price of coal and the price of a carbon permit) of using coal for electricity generation affordable. The drop of the EU ETS emissions prices came about because, during the Great Recession (the common term for the general economic decline observed in the world markets in the end of the first decade of the 21st century), production declined and the companies were able to accumulate significant amounts of emissiond permits that they did not need when the production was low. Many analysts think that the effect of the 2012 substitution from cleaner natural gas to dirtier coal is a random deviation from the general course toward greater use of renewable energy. They expect that, in the near future, coal consumption will continue to decrease compared with consumption of natural gas and renewable energy (Birnbaum, 2013).
Russia ranked sixth in the world in the total amount of coal mined following China, the United States, India, Indonesia, and Australia, and produced 366 Mt/yr. In 2011, the Russian Federation adopted a new program for development of the coal industry through 2030. The goal of the program was to increase Russia’s coal production to 450 Mt/yr in 2030 from 334.8 Mt in 2011. The more detailed goals included an increase in the share of Eastern Siberia in coal production, a 100% increase in the production of coking coal, and a 150% increase in coal exports (tables 4, 20; U.S. Energy Information Administration, 2013).
Ukraine was among the world’s leading coal mining countries. According to the BP Statistical Review of World Energy, proven resources of coal in Ukraine were 33,900 Mt, or about 4% of the world’s reserves (BP p.l.c., 2013, p. 30). In 2012, Ukraine produced 85.7 Mt of coal, which was a 4.6% increase compared with production in 2011. The country was the fourth-ranked coal producer in Europe after Russia, Germany, and Poland. Despite the increases in production, about 80% of all coal mines in Ukraine operated at a loss. Ukrainian coal was unable to compete with the coal from Germany either on price or quality. In 2012, the Government mandated that heating plants in the country switch from natural gas, which was imported from Russia, to domestic coal as their energy source. Many residents and environmental activists were concerned that the switch could significantly worsen the environmental situation in the country.
Natural Gas.—In 2012, Europe and Central Eurasia contributed 34.0% of the world’s production of natural gas. Russia was the leading producer in the region and the second-ranked producer in the world with 2012 production of 655 billion cubic meters; it was followed by Norway (106.7 billion cubic meters), the Netherlands (80.8 billion cubic meters), Turkmenistan (69 billion cubic meters), Uzbekistan (62.9 billion cubic meters), and the United Kingdom (an estimated 57 billion cubic meters). Russia was the world’s second-ranked (after the United States) natural gas producer and the leading exporter; it had the world’s largest natural gas reserves (47.6 trillion cubic meters), which was about 24% of the world’s total natural gas reserves. Many countries in the Europe and Central Eurasia region produced natural gas, but generally not in large volumes. Norway, the Netherlands,

1.10 U.S. GEOLOGICAL SURVEY MINERALS YEARBOOK—2012
and the United Kingdom, in order of volume, were significant regional producers of natural gas in Europe; Turkmenistan and Uzbekistan were notable regional natural gas producers in the CIS (table 4; U.S. Energy Information Administration, 2012).
Almost 90% of Russia’s natural gas was produced in the Ndym-Pur-Taz (NPT) region in northern West Siberia (the region’s name was derived from the names of three rivers that border it). The NPT region hosts three massive Russian gasfields (the Medvezh’ye, the Urengoy, and the Yamburg), which had been the country’s main producers and had supplied about 70% of the country’s gas production. These three fields were in decline, however, as reserves were being depleted. To keep up with the growth in the Russian economy and the country’s long-term export commitments to Europe to increase gas output, Russia was expected to have to incur greater costs to develop fields further north and to the east in an even more difficult physical environment than in the NPT region. A main target for future development would be the Yamal Peninsula, where large reserves were discovered in several fields. The newly developed Zapolyarnoye field on the Yamal Peninsula was a major contributor to replacing decreasing production from large older fields where reserves were more than 50% depleted.
OAO Gazprom, which was Russia’s leading gas producer, projected that between 2008 and 2030, Russia would increase natural gas output to between 885 billion and 940 billion cubic meters per year. Most of the increases in natural gas output were projected to come from independent gas companies in Russia, such as Itera, Northgaz, and Novatek, which, although blocked from the export market, had found a niche supplying the domestic market.
Petroleum.—In 2012, Europe and Central Eurasia produced 5.9 billion barrels (Gbbl), or 20.7% of total world production of petroleum. Russia was the leading oil producer in the region and a top exporting nation; in 2012, it produced 3.6 Gbbl of crude oil, or 61% of the total regional output. Other significant producers were Norway, which produced 694 million barrels (Mbbl); Kazakhstan (576 Mbbl); the United Kingdom (368 Mbbl), and Azerbaijan (321 Mbbl). Azerbaijan was engaged in major oil development projects offshore in the Caspian Sea, and Kazakhstan was engaged in major projects both onshore and offshore.
In May in the United Kingdom, Maersk Oil UK Ltd. (Maersk) signed an agreement with Noble Energy Inc. for the purchase of 30% of its interest in the Maersk-operated Dumbarton and Lochranza fields. Maersk reported that this agreement also included the control of the Global Producer III floating production, storage, and offloading installation in the United Kingdom’s central North Sea. With this investment, Maersk would hold a 100% interest in the Dumbarton and the Lochranza fields. Maersk stated that it had paid Noble Energy $127 million for the assets. The Dumbarton and the Lochranza fields produced a combined output of about 20,000 barrels per day of oil equivalent in 2012(Maersk Oil Ltd., 2012).
According to the BP Statistical Review of World Energy, at the end of 2012, Russia’s proven reserves of petroleum were 87,200 Mbbl (BP p.l.c., 2013, p. 6). For the coming decade, Russian oil production was projected to increase at an annual rate of between 1.5% and 2.5% owing in part to increased oil
output from Sakhalin Island. This increase would be coupled with a slowdown in growth from the major mature oilfields in West Siberia, a number of which had passed peak production. New fields that were under development were expected to account for almost all Russia’s increase in annual oil output in the next 5 years and would probably produce more than one-half of the country’s oil in 2020.
In 2012, crude petroleum was produced in Russia by nine vertically integrated oil and gas companies, the largest four of which were LUKOIL Group, OAO NK Rosneft’, OAO Surgutneftegaz, and TNK–BP Holding. The country had 28 large refineries and more than 200 small ones; the total refining capacity of the country was 290 Mt/yr of petroleum. More than 90% of the refining capacity belonged to the vertically integrated companies. Beginning in 2013, Russian law bans automotive gasoline for which the environmental requirements are below the Euro-3 standard.
Uranium.—In 2012, Central Eurasia accounted for 51.6% of the world’s uranium production. Kazakhstan was the leading uranium producer in the world, and its production volume amounted to 24,648 t (U3o8 content). The next-ranked producers in the region were Russia (3,348 t); Uzbekistan (3,190 t); Kyrgyzstan (an estimated 2,150 t), and Ukraine (1,132 t). Uranium mining took place in several other countries in the region (the Czech Republic, Germany, and Romania), but in smaller quantities (table 4).
In 2012, Kazakhstan remained the leading producer of mined uranium, having produced 36.5% of the world’s output. Kazakhstan had no nuclear powerplants, and all uranium production was exported. Within the past 9 years, Kazakhstan rapidly increased investment in its uranium industry, and the country’s production of uranium oxide increased to 24,648 t in 2012 from 3,300 t in 2003. AO NAK Kazatomprom (the leading Government-owned producer) mined 11,900 t of uranium, or about 20% of the world’s production. The leadership of Kazatomprom stated that the country could increase its uranium production to 30,000 t/yr within the next 3 years (World Nuclear Association, 2013).
References Cited
Agency of Statistics of the Republic of Kazakhstan, 2013, Statistical yearbook—Kazakhstan in 2011: Astana, Kazakhstan, Agency of Statistics of the Republic of Kazakhstan, November, 218 p.
Antwerp World Diamond Centre, 2013a, History: Antwerp World Diamond Centre. (Accessed July 14, 2013, at http://www.awdc.be/en/history.)
Antwerp World Diamond Centre, 2013b, Rough import and export figures show increase compared to December 2011: Antwerp World Diamond Centre. (Accessed November 30, 2013, at http://www.awdc.be/en/news?type=6.)
Birnbaum, Michael, 2013, Europe consuming more coal: The Washington Post, February 7. (Accessed June 9, 2014, at http://www.washingtonpost.com/world/europe-consuming-more-coal/2013/02/07/ec21026a-6bfe-11e2-bd36-c0fe61a205f6_story.html.)
Boliden AB, 2013, Annual report 2012: Boliden AB, 129 p. (Accessed November 14, 2013, at http://www.boliden.com/Documents/Press/Publications/Boliden_AR12_ENG.pdf.)
BP p.l.c., 2013, BP statistical review of world energy: BP p.l.c., June, 48 p. (Accessed April 22, 2014, at http://www.bp.com/assets/bp_internet/globalbp/globalbp_uk_english/reports_and_publications/statistical_energy_review_2012/STAGING/local_assets/pdf/statistical_review_of_world_energy_full_report_2013.pdf.)
Cembureau, 2013, Activity report 2011: Brussels, Belgium, Cembureau, 46 p.

EuropE and CEntral Eurasia—2012 1.11
Creamer Media’s Mining Weekly, 2012, Greenland passes mining projects bill, opens for cheap labor: Creamer Media’s Mining Weekly, December 8. (Accessed December 8, 2012, at http://www.miningweekly.com/print-version/greenland-passes-mining-projects-bill-opens-for-cheap-labour-2012-12-08.)
Cobalt Development Institute, 2013, Cobalt news—Production: Guildford, United Kingdom, Cobalt Development Institute, April, 6 p.
Deloitte Development LLC, 2012, Tracking the trends—The top 10 trends mining companies may face in the coming year: Deloitte Development LLC, 33 p. (Accessed February 2, 2013, at http://www.deloitte.com/assets/Dcom-SouthAfrica/Local Assets/Documents/Industries/Mining/Tracking the trends 2012.pdf.)
Department of Communications, Energy and Natural Resources, 2013, Ireland—Exploration and mining news: Dublin, Ireland, Department of Communications, Energy and Natural Resources, May 1, 6 p. (Accessed August 15, 2013, at http://www.dcenr.gov.ie/NR/rdonlyres/5695C011-D2A6-407A-A104-DE9A4909187A/0/IndustryNews_1stMay2013.pdf.)
Dragon Mining Ltd., 2013, Annual report 2012: Dragon Mining Ltd., 102 p. (Accessed November 19, 2013, at http://www.dragon-mining.com.au/sites/default/files/dragon_ar2012_final_web_version_0.pdf.)
Elgin Mining, 2012, Elgin Mining and Gold-Ore Resources announce closing of merger creating growth oriented international gold producer, developer, and explorer: Elgin Mining, May 2, 2 p. (Accessed November 19, 2013, at http://www.elginmining.com/s/NewsReleases.asp?ReportID=522555&_Type=News-Releases&_Title=Elgin-Mining-and-Gold-Ore-Resources-Announce-Closing-of-Merger-Creating-Gro... .)
European Commission, 2008, On the competitiveness of the metals industries: Brussels, Belgium, Communication from the Commission to the Council and the European Parliament, no. 108, February 22, 11 p.
European Commission, 2014a, Economic and financial affairs: Brussels, Belgium, European Commission. (Accessed May 30, 2014, at http://ec.europa.eu/economy_finance/euro/index_en.htm.)
European Commission, 2014b, European Union—Countries: Brussels, Belgium, European Commission. (Accessed May 30, 2014, at http://europa.eu/about-eu/countries/index_en.htm.)
European Free Trade Association, 2014, About EFTA: Geneva, Switzerland, European Free Trade Association. (Accessed May 30, 2014, at http://www.efta.int/about-efta/european-free-trade-association.)
Federal State Statistics Service of the Russian Federation, 2013a, Rossijskij statisticheskij ezhegodnik [Russian statistical yearbook]—Schet proizvodstva po vidam jekonomicheskoj dejatelnosti [Production account by economic activity]: Federal State Statistics Service of the Russian Federation. (Accessed June 5, 2014, at http://www.gks.ru/bgd/regl/b11_13/IssWWW.exe/Stg/d3/11-09-02.htm.)
Federal State Statistics Service of the Russian Federation, 2013b, Rossiyskiy statisticheskiy ezhegodnik [Russian statistical yearbook]—Tovarnaya struktura eksporta rossiyskoy federatsii [Commodity structure of exports of the Russian Federation]: Federal State Statistics Service of the Russian Federation. (Accessed June 5, 2014, at http://www.gks.ru/bgd/regl/b11_13/IssWWW.exe/Stg/d6/25-08.htm.)
Gabriel Resources Ltd., 2012a, Projects: Toronto, Ontario, Canada, Gabriel Resources Ltd. (Accessed November 9, 2013, at http://www.gabrielresources.com/site/projects.aspx.)
Gabriel Resources Ltd., 2012b, Referendum voting confirmed as overwhelmingly in favour of mining in Rosia Montana: Gabriel Resources Ltd. press release, December 12, 2 p. (Accessed August 9, 2013, http://www.gabrielresources.com/documents/GBU_Referendum_Results_000.pdf.)
Gold-Ore Resources Ltd., 2012, Gold-Ore reports increase in gold resource estimates at Bjorkdal gold mine: Gold-Ore Resources Ltd. (Accessed November 22, 2013, at http://www.businesswire.com/news/home/20120305005916/en/Gold-Ore-Reports-Increase-Gold-Resource-Estimates-Bjorkdal.)
International Centre for Trade and Sustainable Development, 2010, Vstupil v silu Edinyi kodeks Tamozhennogo Soyuza [Unified customs code of the Customs Union went into force]: International Centre for Trade and Sustainable Development, July 6. (Accessed June 5, 2014, at http://ictsd.org/i/news/bridgesrussiandigest/79510/.)
International Monetary Fund, 2013, Regional economic outlook—Faster, higher, stronger—Raising growth potential of CESEE: International Monetary Fund, October, 45 p. (Accessed June 5, 2014, at https://www.imf.org/external/pubs/ft/reo/2013/eur/eng/pdf/ereo1013.pdf.)
Kazakhmys plc, 2013, Annual report and accounts 2012: London, United Kingdom, Kazakhmys plc, April 10, 183 p.
Keen, Kip, 2012, Carpathian doubles gold-copper resource bound for Rovina prefeasibilty study: Mineweb.com, July 17. (Accessed August 13, 2013, at http://www.mineweb.com/mineweb/content/en/mineweb-europe-and-middle-east?oid=155250&sn=Detail.)
Knews.kg, 2012, V Kyrgyzstane vstupaet v silu novyi zakon o nedrakh [A new mining code goes into effect in Kyrgyzstan]: Knews.kg, August 14. (Accessed June 5, 2014, at http://www.knews.kg/econom/ 20287_v_kyirgyizstane_vstupaet_v_silu_novyiy_zakon_o_nedrah/.)
Korrespondent.net, 2008, SNG ofitsial’no isklyuchilo Gruziyu iz svoih ryadov [SIC officially removed Georgia from its members]: Korrespondent.net, October 9. (Accessed June 5, 2014, at http://korrespondent.net/world/609809-sng-oficialno-isklyuchilo-gruziyu-iz-svoih-ryadov.)
Lundin Mining Corp., 2013, Production statistics: Lundin Mining Corp. (Accessed August 15, 2013, at http://www.lundinmining.com/s/ProductionStats.asp.)
Luossavaara-Kiirunavaara AB, 2012a, Gruvberget: Luossavaara-Kiirunavaara AB. (Accessed November 15, 2013, at http://www.lkab.com/en/Future/Urban-Transformations/Why/What-is-Iron-Ore/The-Ore-in-Svappavaara1/Gruvberget/.)
Luossavaara-Kiirunavaara AB, 2012b, LKAB gets the go-ahead for new iron ore mine in Sweden: Luossavaara-Kiirunavaara AB. (Accessed November 15, 2013, at http://www.lkab.com/en/About-us/Overview/Operations-Areas/Kiruna/.)
Maersk Oil Ltd., 2012, Maersk Oil buys 30% interest in Dumbarton and Lochranza fields in UK North Sea: Maersk Oil Ltd. (Accessed January 5, 2014, at http://www.maerskoil.com/Media/Newsroom/Pages/MaerskOilbuys30interestinDumbartonandLochranzafieldsinUKNorthSea.aspx.)
Mining Technology, 2008, Talvivaara bioheapleach, Finland: Mining Technology. (Accessed June 5, 2014, at http://www.mining-technology.com/projects/talvivaara/.)
Ministry of the Treasury of the Republic of Poland, 2011, Invitation to negotiations regarding the purchase of shares of Zaklady Gorniczo-Hutnicze “Boleslaw” S.A. with its registered office in Bukowno: Ministry of the Treasury of the Republic of Poland, September 27. (Accessed December 6, 2013, at http://msp.gov.pl/portal/en/43/2677/Invitation_to_negotiations_regarding_the_purchase_of_shares_of_Zaklady_GorniczoH.html.)
North of 60 Mining News, 2012, Greenland—The next mining destination in the North: Petroleum Newspapers of Alaska, LLC, v. 6, no. 38, September 20. (Accessed September 27, 2012, at http://www.petroleumnews.com/mnarch/06-38-4.html.)
SNL Metals Economics Group, 2012, Trends in worldwide exploration budgets: Strategic Report, v. 25, no. 6, November/December, p. 1–10.
Stalprodukt S.A., 2013a, Report of the Stalprodukt S.A., supervisory board for the period from 1 January 2012 to 31 December 2012: Bochnia, Poland, Stalprodukt S.A., 20 p. (Accessed December 6, 2013, at http://www.stalprodukt.com.pl/pub/File/lad_korporacyjny_EN/Sprawozdanie Rady Nadzorczej_2012_English.pdf.)
Stalprodukt S.A., 2013b, Shares and shareholders: Bochnia, Poland, Stalprodukt S.A. (Accessed December 6, 2013, at http://www.stalprodukt.com.pl/akcje_akcjonariusze.)
Talvivaara Mining Co., 2012, Annual report: Talvivaara Mining Co., 178 p. (Accessed May 30, 2014, at http://www.talvivaara.com/files/talvivaara/CG2014/Annual Report 2013.pdf.)
Thomson Reuters, 2012, Stalprodukt SA updates on acquisition of Zaklady Gorniczo-Hutnicze Boleslaw SA: Thomson Reuters, November 7. (Accessed December 6, 2013, at http://www.reuters.com/finance/stocks/STPEUR.PAp/key-developments/article/2638729.)
U.S. Energy Information Administration, 2012, International energy statistics: Washington, DC, U.S. Energy Information Administration, 342 p.
U.S. Energy Information Administration, 2013, Russia: U.S. Energy Information Administration country analysis brief, September 18. (Accessed June 5, 2014, at http://www.eia.gov/countries/cab.cfm?fips=RS.)
U.S. Library of Congress, 2012, Poland—Tax on metal exploitation introduced: U.S. Library of Congress, Law Library of Congress, April 12. (Accessed February 5, 2013, at http://www.loc.gov/lawweb/servlet/ lloc_news?disp3_l205403087_text.)
Utro.ru, 2012, Tamozhennyi Soyuz pereros v Edinoe Prostranstvo [Customs Union graduated into Common Space]: Utro.ru, January 1. (Accessed June 5, 2014, at http://www.utro.ru/articles/2012/01/01/1020668.shtml.)
Wilson, Alana, McMahon, Fred, and Cervantes, Miguel, 2013, Fraser Institute annual survey of mining companies 2012/2013: Vancouver, British Columbia, Canada, Fraser Institute, February, 134 p. (Accessed March 1, 2013, at http://www.fraserinstitute.org/uploadedFiles/fraser-ca/Content/research-news/research/publications/mining-survey-2012-2013.pdf.)
1.12 U.S. GEOLOGICAL SURVEY MINERALS YEARBOOK—2012
World Bank, The, 2013, Global economic prospects: The World Bank, January, 178 p. (Accessed June 5, 2014, at http://siteresources.worldbank.org/INTPROSPECTS/Resources/334934-1322593305595/8287139-1358278153255/GEP13AFinalFullReport_.pdf .)
World Nuclear Association, 2013, World uranium mining production 2012: World Nuclear Association, May. (Accessed June 5, 2014, at http://www.world-nuclear.org/info/Nuclear-Fuel-Cycle/Mining-of-Uranium/World-Uranium-Mining-Production/.)
World Steel Association, 2014, World steel in figures 2013: Brussels, Belgium, World Steel Association, 17 p.
Zeta Petroleum plc, 2012, New energy and gas law; liberalises Romanian domestic gas market: Zeta Petroleum plc., July 26. (Accessed August 9, 2013, at http://www.zetapetroleum.com/files/files/70_120726_RomanianOfficialGazette_1_3.pdf.)

EuropE and CEntral Eurasia—2012 1.13
area1 Estimated population2
Country (square kilometers) (thousands)Albania 28,748 3,200Armenia 29,743 3,000Austria 83,871 8,400Azerbaijan 86,600 9,300Belarus 207,600 9,500Belgium 30,528 11,100Bosnia and Herzegovina 51,197 3,800Bulgaria 110,879 7,300Croatia 56,594 4,300Cyprus 9,251 1,100Czech Republic 78,867 10,500Denmark, including Greenland 2,209,180 5,700Estonia 45,228 1,300Finland 338,145 5,400France 551,500 65,700Georgia 69,700 4,500Germany 357,022 80,400Greece 131,957 11,100Hungary 93,028 9,900Iceland 103,000 300ireland 70,273 4,600italy 301,340 59,500Kazakhstan 2,724,900 16,800Kosovo 10,887 1,800Kyrgyzstan 199,951 5,600Latvia 64,589 2,000Lithuania 65,300 3,000Luxembourg 2,586 500Macedonia 25,713 2,100Malta 316 400Moldova 33,851 3,600Montenegro 13,812 600Netherlands 41,543 16,800norway 323,802 5,000poland 312,685 38,500Portugal 92,090 10,500Romania 238,391 20,100Russia 17,098,242 143,500Serbia 77,474 7,200Slovakia 49,035 5,400Slovenia 20,273 2,100Spain 505,370 46,800sweden 450,295 9,500Switzerland 41,277 8,000Tajikistan 143,100 8,000Turkmenistan 488,100 5,200Ukraine 603,550 45,600United Kingdom 243,610 63,600Uzbekistan 447,400 29,800
Regional total 29,362,393 821,900World total 510,072,000 7,046,368
taBlE 1EUROPE AND CENTRAL EURASIA: AREA AND POPULATION IN 2012
1Source: U.S. Central Intelligence Agency, The World Factbook 2013.2Source: The World Bank, 2013 World Development Indicators Database.

1.14 U.S. GEOLOGICAL SURVEY MINERALS YEARBOOK—2012
Gross value Per capitaCountry (million dollars) (dollars) 2010 2011 2012
Albania 26,110 8,159 3.5 2.0 1.3Armenia 19,649 6,550 2.1 4.4 7.2Austria 359,021 42,741 2.1 3.1 0.8Azerbaijan 96,768 10,405 5.0 0.0 2.2Belarus 146,745 15,447 7.6 5.3 1.5Belgium 420,307 37,865 2.1 1.9 -0.2Bosnia and Herzegovina 31,909 8,397 0.7 1.7 -0.7Bulgaria 103,816 14,221 0.2 1.7 0.8Croatia 78,400 18,233 -1.2 0.0 -0.2Cyprus 23,613 21,466 1.0 0.5 -2.4Czech Republic 286,952 27,329 2.3 1.7 -1.2Denmark, including Greenland 210,147 36,868 1.7 1.1 -1.6Estonia 29,088 22,375 3.1 7.6 3.2Finland 197,476 36,570 3.6 2.9 -0.2France 2,254,067 34,308 1.4 1.7 0.0Georgia 26,670 5,927 6.4 6.7 6.5Germany 3,197,069 39,765 3.6 3.1 0.9Greece 276,879 24,944 -4.4 -6.7 -6.4Hungary 195,630 19,761 1.2 1.7 -1.7Iceland 12,831 42,770 -3.5 3.1 1.6ireland 192,223 41,788 -0.4 0.7 0.9italy 1,832,916 30,805 1.3 0.4 -2.4Kazakhstan 231,787 13,797 7.3 7.5 5.0Kosovo 13,369 7,427 4.0 5.0 2.1Kyrgyzstan 13,279 2,371 -1.4 5.7 -0.9Latvia 37,272 18,636 -0.3 5.5 5.8Lithuania 65,014 21,671 1.3 5.9 3.6Luxembourg 42,225 84,450 3.5 1.0 0.1Macedonia 21,861 10,410 1.8 3.0 -0.3Malta 11,260 28,150 3.1 2.1 0.8Moldova 12,156 3,377 6.9 6.4 -0.8Montenegro 7,340 12,233 1.1 2.5 0.0Netherlands 706,955 42,081 1.6 1.3 -0.9norway 277,152 55,430 0.3 1.7 3.0poland 800,934 20,803 3.8 4.4 2.0Portugal 246,523 23,478 1.3 -1.5 -3.1Romania 273,411 13,603 -1.3 2.5 0.3Russia 2,513,299 17,514 4.0 4.3 3.4Serbia 78,721 10,933 1.0 1.8 -1.8Slovakia 131,893 24,425 4.0 3.3 2.0Slovenia 57,955 27,598 1.2 -0.2 -2.3Spain 1,410,628 30,142 -0.1 0.7 -1.4sweden 392,956 41,364 5.7 4.0 1.2Switzerland 363,421 45,428 2.7 1.9 1.0Tajikistan 17,749 2,219 6.5 7.4 7.5Turkmenistan 48,948 9,413 9.2 14.7 11.0Ukraine 335,172 7,350 4.2 5.2 0.2United Kingdom 2,336,295 36,734 1.4 0.7 0.2Uzbekistan 104,694 3,513 8.5 8.3 8.0
Regional total 20,570,555 25,028 3 2.3 3 2.2 3 1.1 3
World total 83,193,418 12,154 3 5.1 3 3.9 3 3.2 3
taBlE 2EUROPE AND CENTRAL EURASIA: GROSS DOMESTIC PRODUCT1, 2
based on purchasing power parity Real gross domestic product growth rate(percentage)
1Source: International Monetary Fund, World Economic Outlook Database, April 2013.2Gross domestic product (GDP) listed may differ from that reported in individual country chapters owing to differences in source ordate of reporting.3Weighted average.
Gross domestic product in 2012

EuropE and CEntral Eurasia—2012 1.15
Cou
ntry
Type
1Si
teC
omm
odity
2C
ompa
nyR
esou
rce
note
s3,4
Aze
rbai
jan
pG
edab
ekA
u, C
u, A
gA
nglo
Asi
an M
inin
g pl
c.74
4,00
0 oz
Au,
60,
000
t Cu,
6.2
Moz
Ag
(R)
Portu
gal
pN
eves
-Cor
voC
u, Z
n, P
b, A
gLu
ndin
Min
ing
Cor
p.81
5,00
0 t C
u, 1
.9 M
t Zn,
454
kt P
b, 8
2 M
oz A
g (R
)
4 Bas
ed o
n 20
12 d
ata
repo
rted
from
var
ious
sour
ces.
R—
prov
en +
pro
babl
e. R
esou
rce
data
not
ver
ified
by
the
U.S
. Geo
logi
cal S
urve
y.
TAB
LE 3
SELE
CTE
D S
IGN
IFIC
AN
T EX
PLO
RA
TIO
N A
CTI
VIT
IES
IN E
UR
OPE
AN
D C
ENTR
AL
EUR
ASI
A IN
201
2
1 Expl
orat
ion
at p
rodu
cing
(P) s
ite.
2 Abb
revi
atio
ns u
sed
in th
is ta
ble
for c
omm
oditi
es a
re a
s fol
low
s: A
g, si
lver
; Au,
gol
d; C
u, c
oppe
r; Pb
, lea
d; Z
n, z
inc.
3 Abb
revi
atio
ns u
sed
in th
is ta
ble
for u
nits
of m
easu
rem
ent a
re a
s fol
low
s: o
z, tr
oy o
unce
s; M
oz, m
illio
n tro
y ou
nces
; Mt,
mill
ion
met
ric to
ns; t
, met
ric to
ns.
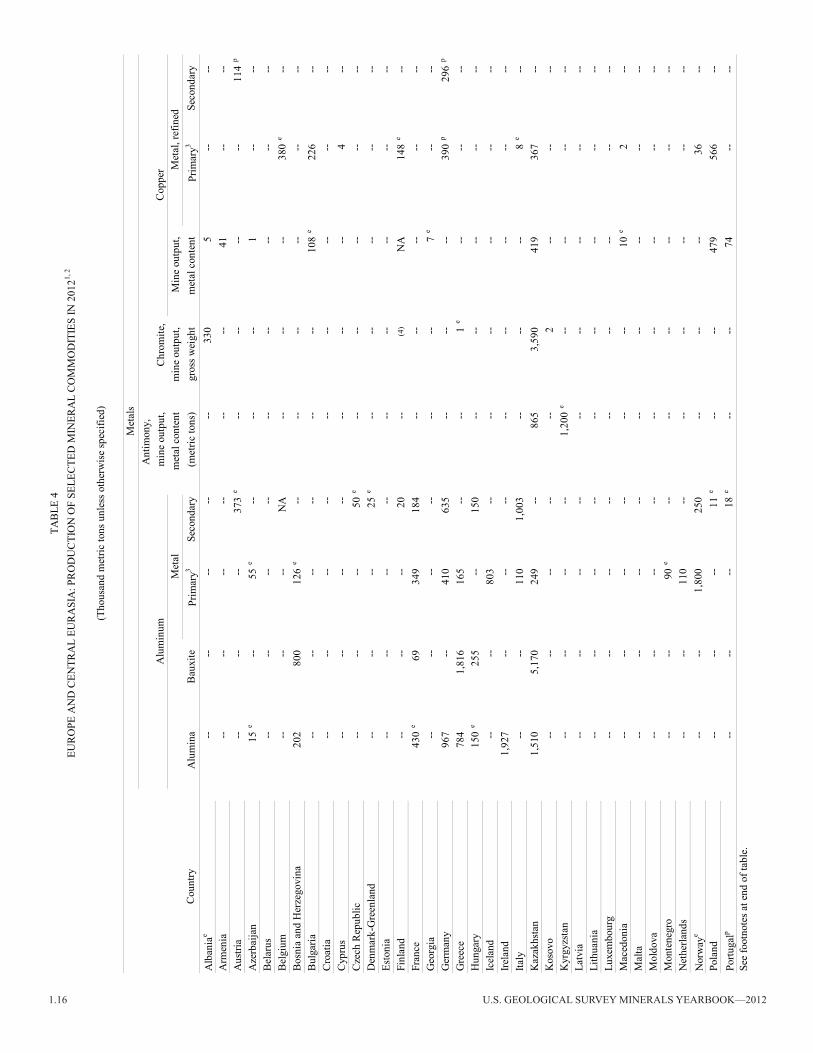
1.16 U.S. GEOLOGICAL SURVEY MINERALS YEARBOOK—2012
A
ntim
ony,
min
e ou
tput
,
C
hrom
ite,
met
al c
onte
ntm
ine
outp
ut,
Min
e ou
tput
,A
lum
ina
Bau
xite
Prim
ary3
Seco
ndar
y(m
etric
tons
)gr
oss w
eigh
tm
etal
con
tent
Prim
ary3
Seco
ndar
yA
lban
iae
----
----
--33
05
----
Arm
enia
----
----
----
41--
--A
ustri
a--
----
373
e--
----
--11
4p
Aze
rbai
jan
15e
--55
e--
----
1--
--B
elar
us--
----
----
----
----
Bel
gium
----
--n
a--
----
380
e--
Bos
nia
and
Her
zego
vina
202
800
126
e--
----
----
--B
ulga
ria--
----
----
--10
8e
226
--C
roat
ia--
----
----
----
----
Cyp
rus
----
----
----
--4
--C
zech
Rep
ublic
----
--50
e--
----
----
Den
mar
k-G
reen
land
----
--25
e--
----
----
Esto
nia
----
----
----
----
--Fi
nlan
d--
----
20--
(4)
na
148
e--
Fran
ce43
0e
6934
918
4--
----
----
Geo
rgia
----
----
----
7e
----
Ger
man
y96
7--
410
635
----
--39
0p
296
p
Gre
ece
784
1,81
616
5--
--1
e--
----
Hun
gary
150
e25
5--
150
----
----
--Ic
elan
d--
--80
3--
----
----
--ire
land
1,92
7--
----
----
----
--ita
ly--
--11
01,
003
----
--8
e--
Kaz
akhs
tan
1,51
05,
170
249
--86
53,
590
419
367
--K
osov
o--
----
----
2--
----
Kyr
gyzs
tan
----
----
1,20
0e
----
----
Latv
ia--
----
----
----
----
Lith
uani
a--
----
----
----
----
Luxe
mbo
urg
----
----
----
----
--M
aced
onia
----
----
----
10e
2--
Mal
ta--
----
----
----
----
Mol
dova
----
----
----
----
--M
onte
negr
o--
--90
e--
----
----
--N
ethe
rland
s--
--11
0--
----
----
--n
orw
aye
----
1,80
025
0--
----
36--
pola
nd--
----
11e
----
479
566
--Po
rtuga
lp--
----
18e
----
74--
--
Alu
min
umM
etal
TAB
LE 4
EUR
OPE
AN
D C
ENTR
AL
EUR
ASI
A: P
RO
DU
CTI
ON
OF
SELE
CTE
D M
INER
AL
CO
MM
OD
ITIE
S IN
201
21, 2
(Tho
usan
d m
etric
tons
unl
ess o
ther
wis
e sp
ecifi
ed)
Met
als
Met
al, r
efin
ed
See
foot
note
s at e
nd o
f tab
le.
Cou
ntry
Cop
per

EuropE and CEntral Eurasia—2012 1.17
A
ntim
ony,
min
e ou
tput
,
C
hrom
ite,
met
al c
onte
ntm
ine
outp
ut,
Min
e ou
tput
,A
lum
ina
Bau
xite
Prim
ary3
Seco
ndar
y(m
etric
tons
)gr
oss w
eigh
tm
etal
con
tent
Prim
ary3
Seco
ndar
yR
oman
ia45
0--
252
13--
--8
e--
--R
ussi
a2,
719
5,70
03,
924
--7,
300
e67
0e
883
e62
125
4Se
rbia
e--
----
----
--42
322
Slov
akia
----
181
----
----
----
Slov
enia
e--
--40
15--
----
----
Spai
ne1,
500
--40
824
3--
--75
255
e35
e
swed
en--
--12
930
e--
--82
179
40e
Switz
erla
nde
----
--(4
)--
----
----
Tajik
ista
n--
--27
3--
4,70
0e
----
----
Turk
men
ista
ne--
----
----
----
----
Ukr
aine
1,42
9--
1590
e--
----
--15
e
Uni
ted
Kin
gdom
----
6030
0e
----
----
--U
zbek
ista
n--
----
na
----
9696
--To
tal,
Euro
pe a
nd C
entra
l Eur
asia
12,1
0013
,800
9,55
03,
410
14,1
004,
590
2,28
03,
320
711
Shar
e of
wor
ld to
tal
12.7
%5.
4%20
.4%
41.6
%7.
6%14
.7%
13.6
%19
.4%
23.5
%U
nite
d St
ates
4,39
0n
a2,
070
----
--1,
170
962
39Sh
are
of w
orld
tota
l4.
6%n
a4.
4%--
----
7.0%
5.6%
1.3%
Wor
ld to
tal
95,0
0025
6,00
046
,800
8,20
018
5,00
031
,200
16,8
0017
,100
3,03
0Se
e fo
otno
tes a
t end
of t
able
.
Met
alA
lum
inum
Cop
per M
etal
, ref
ined
Met
als
(Tho
usan
d m
etric
tons
unl
ess o
ther
wis
e sp
ecifi
ed)
TAB
LE 4
—C
ontin
ued
EUR
OPE
AN
D C
ENTR
AL
EUR
ASI
A: P
RO
DU
CTI
ON
OF
SELE
CTE
D M
INER
AL
CO
MM
OD
ITIE
S IN
201
21, 2
Cou
ntry
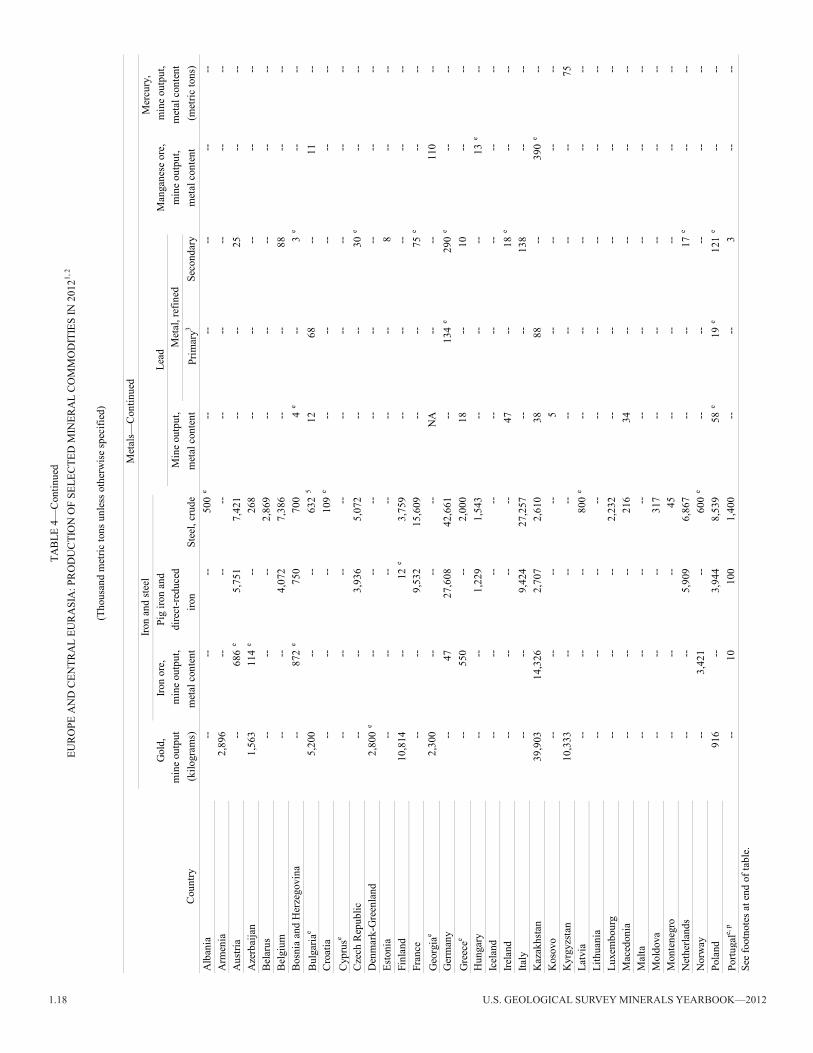
1.18 U.S. GEOLOGICAL SURVEY MINERALS YEARBOOK—2012
Mer
cury
,
G
old,
ir
on o
re,
Pig
iron
and
Man
gane
se o
re,
min
e ou
tput
,m
ine
outp
utm
ine
outp
ut,
dire
ct-re
duce
dM
ine
outp
ut,
m
ine
outp
ut,
met
al c
onte
nt(k
ilogr
ams)
met
al c
onte
ntiro
nSt
eel,
crud
em
etal
con
tent
Prim
ary3
Seco
ndar
y
met
al c
onte
nt(m
etric
tons
)A
lban
ia--
----
500
e--
----
----
Arm
enia
2,89
6--
----
----
----
--A
ustri
a--
686
e5,
751
7,42
1--
--25
----
Aze
rbai
jan
1,56
311
4e
--26
8--
----
----
Bel
arus
----
--2,
869
----
----
--B
elgi
um--
--4,
072
7,38
6--
--88
----
Bos
nia
and
Her
zego
vina
--87
2e
750
700
4e
--3
e--
--B
ulga
riae
5,20
0--
--63
25
1268
--11
--C
roat
ia--
----
109
e--
----
----
Cyp
ruse
----
----
----
----
--C
zech
Rep
ublic
----
3,93
65,
072
----
30e
----
Den
mar
k-G
reen
land
2,80
0e
----
----
----
----
Esto
nia
----
----
----
8--
--Fi
nlan
d10
,814
--12
e3,
759
----
----
--Fr
ance
----
9,53
215
,609
----
75e
----
Geo
rgia
e2,
300
----
--n
a--
--11
0--
Ger
man
y--
4727
,608
42,6
61--
134
e29
0e
----
Gre
ecee
--55
0--
2,00
018
--10
----
Hun
gary
----
1,22
91,
543
----
--13
e--
Icel
and
----
----
----
----
--ire
land
----
----
47--
18e
----
italy
----
9,42
427
,257
----
138
----
Kaz
akhs
tan
39,9
0314
,326
2,70
72,
610
3888
--39
0e
--K
osov
o--
----
--5
----
----
Kyr
gyzs
tan
10,3
33--
----
----
----
75La
tvia
----
--80
0e
----
----
--Li
thua
nia
----
----
----
----
--Lu
xem
bour
g--
----
2,23
2--
----
----
Mac
edon
ia--
----
216
34--
----
--M
alta
----
----
----
----
--M
oldo
va--
----
317
----
----
--M
onte
negr
o--
----
45--
----
----
Net
herla
nds
----
5,90
96,
867
----
17e
----
nor
way
--3,
421
--60
0e
----
----
--po
land
916
--3,
944
8,53
958
e19
e12
1e
----
Portu
gale,
p--
1010
01,
400
----
3--
--
Cou
ntry
EUR
OPE
AN
D C
ENTR
AL
EUR
ASI
A: P
RO
DU
CTI
ON
OF
SELE
CTE
D M
INER
AL
CO
MM
OD
ITIE
S IN
201
21, 2
lead
Iron
and
stee
l
See
foot
note
s at e
nd o
f tab
le.
(Tho
usan
d m
etric
tons
unl
ess o
ther
wis
e sp
ecifi
ed)
Met
als—
Con
tinue
d
Met
al, r
efin
ed
TAB
LE 4
—C
ontin
ued

EuropE and CEntral Eurasia—2012 1.19
Mer
cury
,
G
old,
ir
on o
re,
Pig
iron
and
Man
gane
se o
re,
min
e ou
tput
,m
ine
outp
utm
ine
outp
ut,
dire
ct-re
duce
dM
ine
outp
ut,
m
ine
outp
ut,
met
al c
onte
nt(k
ilogr
ams)
met
al c
onte
ntiro
nSt
eel,
crud
em
etal
con
tent
Prim
ary3
Seco
ndar
y
met
al c
onte
nt(m
etric
tons
)R
oman
iae
----
3,41
75
3,81
15
--7
53
----
Rus
siae
217,
800
561
,400
55,7
0070
,400
593
85--
3350
Serb
ia90
0--
312
345
2e
--1
e--
--Sl
ovak
ia54
6--
3,51
94,
403
----
----
--Sl
oven
ia--
----
632
----
10e
----
Spai
np3,
600
--3,
570
15,6
00--
--12
5e
----
swed
en6,
015
17,1
865,
253
4,32
664
62e
44e
----
Switz
erla
nd--
----
1,40
0e
----
3--
--Ta
jikis
tan
2,40
1--
----
1e
----
--32
e
Turk
men
ista
n--
----
----
----
----
Ukr
aine
--45
,100
e28
,514
32,3
94--
--14
e39
6e
--U
nite
d K
ingd
om--
--7,
183
9,57
9(4
)e
157
e15
5e
----
Uzb
ekis
tan
93,0
00e
----
736
----
----
--To
tal,
Euro
pe a
nd C
entra
l Eur
asia
401,
000
144,
000
182,
000
285,
000
375
620
1,18
095
215
7Sh
are
of w
orld
tota
l14
.8%
10.3
%15
.8%
18.3
%7.
2%12
.4%
24.1
%6.
1%10
.3%
Uni
ted
Stat
es23
5,00
033
,500
32,1
0088
,700
345
111
1,11
0--
na
Shar
e of
wor
ld to
tal
8.7%
2.4%
2.8%
5.7%
6.6%
2.2%
22.7
%--
na
Wor
ld to
tal
2,70
0,00
01,
440,
000
155,
000
1,56
0,00
05,
200
4,98
04,
900
15,6
001,
520
EUR
OPE
AN
D C
ENTR
AL
EUR
ASI
A: P
RO
DU
CTI
ON
OF
SELE
CTE
D M
INER
AL
CO
MM
OD
ITIE
S IN
201
21, 2
(Tho
usan
d m
etric
tons
unl
ess o
ther
wis
e sp
ecifi
ed)
lead
See
foot
note
s at e
nd o
f tab
le.
Cou
ntry
TAB
LE 4
—C
ontin
ued M
etal
s—C
ontin
ued
Iron
and
stee
l
Met
al, r
efin
ed

1.20 U.S. GEOLOGICAL SURVEY MINERALS YEARBOOK—2012
S
ilver
,
Ref
iner
ym
ine
outp
ut,
Min
e ou
tput
,
pro
duct
s,m
etal
con
tent
Min
e ou
tput
,
Met
al,
Ilm
enite
,M
etal
spon
ge,
met
al c
onte
ntm
etal
con
tent
Pa
lladi
um
Plat
inum
(met
ric to
ns)
met
al c
onte
nt p
rimar
y3Ti
O2 c
onte
ntm
etal
con
tent
Alb
ania
3e
----
----
----
----
Arm
enia
----
----
22--
----
--A
ustri
a--
1e
----
----
----
--A
zerb
aija
n--
----
--1
----
----
Bel
arus
----
----
----
----
--B
elgi
ume
----
----
----
----
--B
osni
a an
d H
erze
govi
na--
----
----
----
----
Bul
garia
----
----
55e
----
----
Cro
atia
----
----
----
----
--C
ypru
se--
----
----
----
----
Cze
ch R
epub
lic--
----
----
----
----
Den
mar
k-G
reen
land
e--
----
----
----
----
Esto
nia
----
----
----
----
--Fi
nlan
d80
e46
--83
0e
128
----
----
Fran
ce--
15--
----
----
----
Geo
rgia
----
----
1e
----
----
Ger
man
y--
--26
,114
16,6
70--
----
----
Gre
ecee
1419
5--
--32
----
----
Hun
gary
----
----
----
----
--Ic
elan
d--
----
----
----
----
irela
nd--
----
--6
e--
----
--ita
ly--
----
----
----
----
Kaz
akhs
tane
(4)
----
--96
35
----
15,0
0021
,000
Kos
ovo
4--
----
----
----
--K
yrgy
zsta
n--
----
----
----
----
Latv
iae
----
----
----
----
--Li
thua
nia
----
----
----
----
--Lu
xem
bour
g--
----
----
----
----
Mac
edon
ia--
19--
----
----
----
Mal
ta--
----
----
----
----
Mol
dova
----
----
----
----
--M
onte
negr
o--
----
----
----
----
Net
herla
ndse
----
----
----
----
--n
orw
aye
(4)
925
----
----
--40
0--
pola
nde
----
1525
1,14
95
----
----
Portu
galp
----
----
2742
----
--
Cou
ntry
Nic
kel
Tin
(met
ric to
ns)
prim
ary
and
seco
ndar
y
Met
als—
Con
tinue
d
(kilo
gram
s)
Plat
inum
-gro
up m
etal
s, re
fined
,
See
foot
note
s at e
nd o
f tab
le.
Tita
nium
(met
ric to
ns)
(Tho
usan
d m
etric
tons
unl
ess o
ther
wis
e sp
ecifi
ed)
TAB
LE 4
—C
ontin
ued
EUR
OPE
AN
D C
ENTR
AL
EUR
ASI
A: P
RO
DU
CTI
ON
OF
SELE
CTE
D M
INER
AL
CO
MM
OD
ITIE
S IN
201
21, 2

EuropE and CEntral Eurasia—2012 1.21
S
ilver
,
Ref
iner
ym
ine
outp
ut,
Min
e ou
tput
,
pro
duct
s,m
etal
con
tent
Min
e ou
tput
,
Met
al,
Ilm
enite
,M
etal
spon
ge,
met
al c
onte
ntm
etal
con
tent
Pa
lladi
um
Plat
inum
(met
ric to
ns)
met
al c
onte
nt p
rimar
y3Ti
O2 c
onte
ntm
etal
con
tent
Rom
ania
----
----
----
----
--R
ussi
a25
525
882
,400
30,2
001,
679
100
e50
0e
--42
,000
Serb
ia--
--22
35
----
----
Slov
akia
----
----
(4)
----
----
Slov
enia
----
----
----
----
--Sp
ain
6--
----
4e
----
----
swed
en--
----
--30
9--
----
--Sw
itzer
land
----
----
----
----
--Ta
jikis
tan
----
----
2--
----
--Tu
rkm
enis
tan
----
----
----
----
--U
krai
ne--
12e
----
----
--14
5,64
08,
500
e
Uni
ted
Kin
gdom
--34
----
----
----
--U
zbek
ista
n--
----
--60
e--
----
--To
tal,
Euro
pe a
nd C
entra
l Eur
asia
363
496
109,
000
47,7
004,
440
142
500
161,
000
71,5
00Sh
are
of w
orld
tota
l10
.8%
36.3
%38
.8%
32.1
%4.
6%0.
1%0.
2%4.
2%48
.2%
Uni
ted
Stat
es--
--12
,400
3,70
01,
060
----
167,
000
--Sh
are
of w
orld
tota
l--
--4.
4%2.
5%1.
1%--
--4.
4%--
Wor
ld to
tal
3,36
01,
370
280,
000
149,
000
97,2
0027
3,00
030
5,00
03,
830,
000
148,
000
EUR
OPE
AN
D C
ENTR
AL
EUR
ASI
A: P
RO
DU
CTI
ON
OF
SELE
CTE
D M
INER
AL
CO
MM
OD
ITIE
S IN
201
21, 2
Nic
kel
Plat
inum
-gro
up m
etal
s, re
fined
,
(kilo
gram
s)Ti
n (m
etric
tons
)Ti
tani
um (m
etric
tons
)
Cou
ntry
prim
ary
and
seco
ndar
y
TAB
LE 4
—C
ontin
ued
(Tho
usan
d m
etric
tons
unl
ess o
ther
wis
e sp
ecifi
ed)
Met
als—
Con
tinue
d
See
foot
note
s at e
nd o
f tab
le.

1.22 U.S. GEOLOGICAL SURVEY MINERALS YEARBOOK—2012
T
ungs
ten,
Dia
mon
d, n
atur
al,
min
e ou
tput
,
M
etal
,
gem
ston
es a
ndm
etal
con
tent
Min
e ou
tput
,pr
imar
y an
dA
mm
onia
,C
emen
t,
indu
stria
lPh
osph
ate
rock
,
Pot
ash,
(met
ric to
ns)
met
al c
onte
nt
sec
onda
ryN
con
tent
hydr
aulic
(thou
sand
car
ats)
p 2o
5 con
tent
K2O
equ
ival
ent
salt
Alb
ania
----
----
2,00
0e
----
--n
aA
rmen
ia--
10,7
00--
--43
8--
----
38A
ustri
a62
5e
----
400
e4,
455
----
--1,
064
Aze
rbai
jan
----
----
1,96
6--
----
5B
elar
us--
----
815
4,90
6--
--4,
840
1,70
0e
Bel
gium
e--
--29
0,00
083
06,
800
----
----
Bos
nia
and
Her
zego
vina
--7,
000
e--
--84
6--
----
862
Bul
garia
--12
,116
72,0
0032
0e
1,90
0e
----
--2,
100
Cro
atia
----
--35
0e
1,24
4--
----
18C
ypru
s--
----
--1,
080
----
----
Cze
ch R
epub
lic--
----
200
e3,
650
e--
----
--D
enm
ark-
Gre
enla
nd--
----
--16
e--
----
600
e
Esto
nia
----
----
450
e--
----
--Fi
nlan
de--
51,4
675
314,
742
572
1,30
0--
307
----
Fran
ce--
--16
1,00
02,
644
18,0
00--
----
5,45
7G
eorg
iae
--n
a--
150
870
----
--29
Ger
man
y--
--16
9,00
0e
2,82
332
,432
----
3,76
714
,445
Gre
ece
--41
,824
--13
0e
11,0
00e
----
--19
2H
unga
ry--
----
300
e1,
900
e--
----
--Ic
elan
d--
----
--14
6--
----
na
irela
nd--
337,
500
----
2,20
0e
----
----
italy
----
972,
365
26,2
00--
----
3,09
8K
azak
hsta
n--
369,
700
319,
900
--7,
800
e--
350
e--
464
Kos
ovo
--3,
800
----
600
e--
----
--K
yrgy
zsta
n--
----
--90
0e
----
--1
e
Latv
ia--
----
----
----
----
Lith
uani
a--
----
918
1,01
5--
----
--Lu
xem
bour
g--
----
--1,
217
----
----
Mac
edon
ia--
28,0
00e
----
683
----
----
Mal
ta--
----
----
----
--6
e
Mol
dova
----
----
1,50
0e
----
----
Mon
tene
gro
----
----
----
----
12e
Net
herla
ndse
----
257,
000
na
2,70
0--
----
na
nor
way
----
152,
647
320
1,70
0e
----
----
pola
nde
--89
,000
161,
000
2,10
015
,919
5--
----
3,91
65
Portu
galp
763
30,0
08--
244
e7,
200
e--
----
520
(Tho
usan
d m
etric
tons
unl
ess o
ther
wis
e sp
ecifi
ed)
EUR
OPE
AN
D C
ENTR
AL
EUR
ASI
A: P
RO
DU
CTI
ON
OF
SELE
CTE
D M
INER
AL
CO
MM
OD
ITIE
S IN
201
21, 2
Indu
stria
l min
eral
sZi
nc (m
etric
tons
)M
etal
s—C
ontin
ued
Cou
ntry
See
foot
note
s at e
nd o
f tab
le.
TAB
LE 4
—C
ontin
ued

EuropE and CEntral Eurasia—2012 1.23
T
ungs
ten,
Dia
mon
d, n
atur
al,
min
e ou
tput
,
M
etal
,
gem
ston
es a
ndm
etal
con
tent
Min
e ou
tput
,pr
imar
y an
dA
mm
onia
,C
emen
t,
indu
stria
lPh
osph
ate
rock
,
Pot
ash,
(met
ric to
ns)
met
al c
onte
nt
sec
onda
ryN
con
tent
hydr
aulic
(thou
sand
car
ats)
p 2o
5 con
tent
K2O
equ
ival
ent
salt
Rom
ania
----
300
115
e8,
082
----
--2,
240
e
Serb
ia--
na
--13
0e
1,83
1--
----
17Sl
ovak
ia--
----
486
2,91
5--
----
--Sl
oven
ia--
----
--1,
200
e--
----
6Sp
ain
----
490,
000
e--
20,0
00p
----
436
e4,
385
swed
en--
188,
300
----
3,00
0e
----
----
Switz
erla
nd--
----
30e
4,46
7--
----
528
Tajik
ista
n--
----
--23
2--
----
28Tu
rkm
enis
tane
----
--28
01,
900
----
--22
0U
krai
ne--
----
4,16
0e
9,80
1--
----
6,18
9U
nite
d K
ingd
ome
----
--1,
100
8,50
0r
----
770
6,00
0U
zbek
ista
ne--
--61
,100
1,30
06,
800
--18
7(4
)5
--To
tal,
Euro
pe a
nd C
entra
l Eur
asia
4,41
01,
350,
000
2,71
0,00
032
,900
295,
000
34,9
005,
340
15,4
0056
,000
Shar
e of
wor
ld to
tal
6.0%
10.2
%21
.8%
24.4
%7.
7%26
.8%
8.2%
43.7
%20
.7%
Uni
ted
Stat
es--
738,
000
261,
000
8,73
074
,900
--8,
590
900
37,2
00Sh
are
of w
orld
tota
l--
5.6%
2.1%
6.5%
2.0%
--13
.2%
2.6%
13.8
%W
orld
tota
l73
,800
13,3
00,0
0012
,400
,000
135,
000
3,81
0,00
013
0,00
065
,200
35,2
0027
0,00
0
TAB
LE 4
—C
ontin
ued
EUR
OPE
AN
D C
ENTR
AL
EUR
ASI
A: P
RO
DU
CTI
ON
OF
SELE
CTE
D M
INER
AL
CO
MM
OD
ITIE
S IN
201
21, 2
Indu
stria
l min
eral
sM
etal
s—C
ontin
ued
Zinc
(met
ric to
ns)
Cou
ntry
(Tho
usan
d m
etric
tons
unl
ess o
ther
wis
e sp
ecifi
ed)
See
foot
note
s at e
nd o
f tab
le.
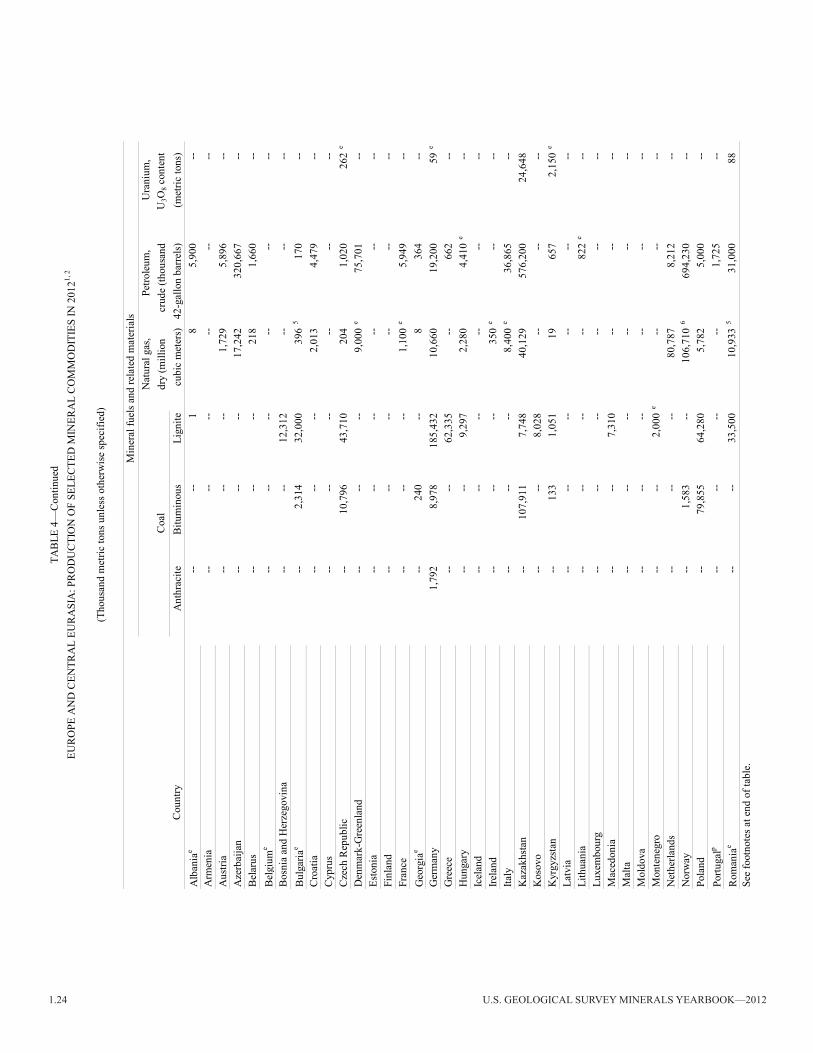
1.24 U.S. GEOLOGICAL SURVEY MINERALS YEARBOOK—2012
Nat
ural
gas
,
Pet
role
um,
Ura
nium
,dr
y (m
illio
ncr
ude
(thou
sand
u
3o8 c
onte
ntA
nthr
acite
Bitu
min
ous
Lign
itecu
bic
met
ers)
42-g
allo
n ba
rrels)
(met
ric to
ns)
Alb
ania
e--
--1
85,
900
--A
rmen
ia--
----
----
--A
ustri
a--
----
1,72
95,
896
--A
zerb
aija
n--
----
17,2
4232
0,66
7--
Bel
arus
----
--21
81,
660
--B
elgi
ume
----
----
----
Bos
nia
and
Her
zego
vina
----
12,3
12--
----
Bul
garia
e--
2,31
432
,000
396
517
0--
Cro
atia
----
--2,
013
4,47
9--
Cyp
rus
----
----
----
Cze
ch R
epub
lic--
10,7
9643
,710
204
1,02
026
2e
Den
mar
k-G
reen
land
----
--9,
000
e75
,701
--Es
toni
a--
----
----
--Fi
nlan
d--
----
----
--Fr
ance
----
--1,
100
e5,
949
--G
eorg
iae
--24
0--
836
4--
Ger
man
y1,
792
8,97
818
5,43
210
,660
19,2
0059
e
Gre
ece
----
62,3
35--
662
--H
unga
ry--
--9,
297
2,28
04,
410
e--
Icel
and
----
----
----
irela
nd--
----
350
e--
--ita
ly--
----
8,40
0e
36,8
65--
Kaz
akhs
tan
--10
7,91
17,
748
40,1
2957
6,20
024
,648
Kos
ovo
----
8,02
8--
----
Kyr
gyzs
tan
--13
31,
051
1965
72,
150
e
Latv
ia--
----
----
--Li
thua
nia
----
----
822
e--
Luxe
mbo
urg
----
----
----
Mac
edon
ia--
--7,
310
----
--M
alta
----
----
----
Mol
dova
----
----
----
Mon
tene
gro
----
2,00
0e
----
--N
ethe
rland
s--
----
80,7
878,
212
--n
orw
ay--
1,58
3--
106,
710
669
4,23
0--
pola
nd--
79,8
5564
,280
5,78
25,
000
--Po
rtuga
lp--
----
--1,
725
--R
oman
iae
----
33,5
0010
,933
531
,000
88
EUR
OPE
AN
D C
ENTR
AL
EUR
ASI
A: P
RO
DU
CTI
ON
OF
SELE
CTE
D M
INER
AL
CO
MM
OD
ITIE
S IN
201
21, 2
See
foot
note
s at e
nd o
f tab
le.
TAB
LE 4
—C
ontin
ued
(Tho
usan
d m
etric
tons
unl
ess o
ther
wis
e sp
ecifi
ed)
Cou
ntry
Min
eral
fuel
s and
rela
ted
mat
eria
ls
Coa
l
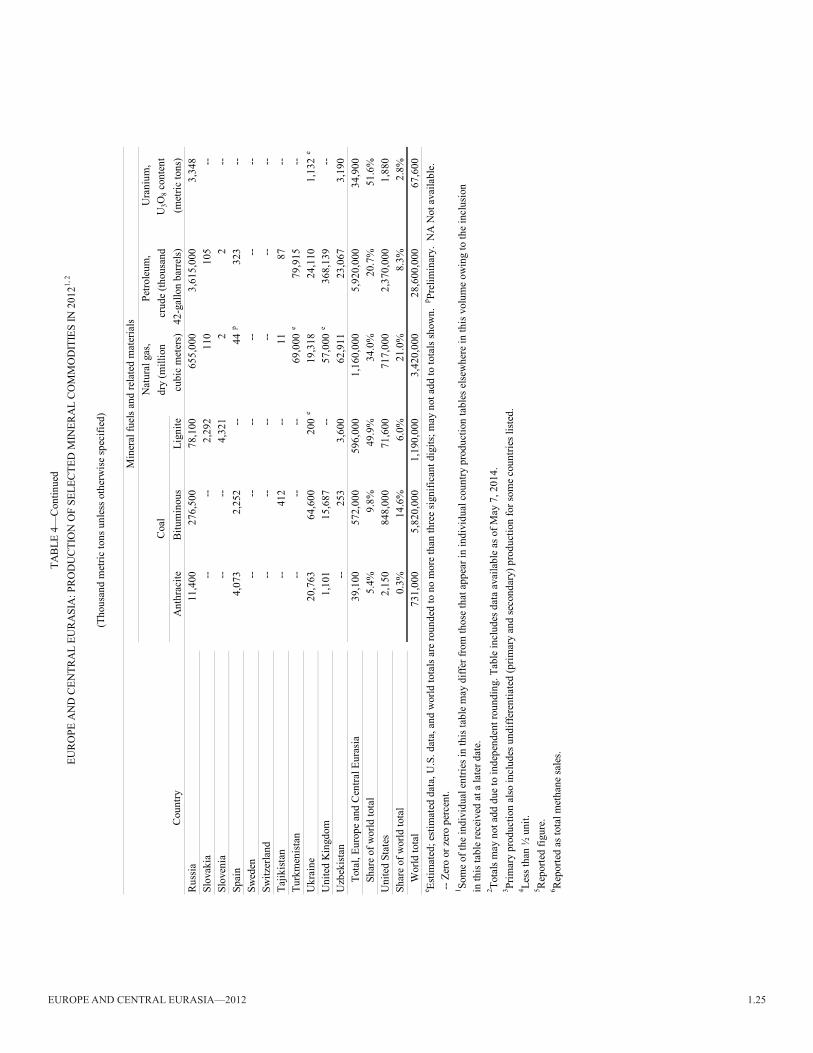
EuropE and CEntral Eurasia—2012 1.25
Nat
ural
gas
,
Pet
role
um,
Ura
nium
,dr
y (m
illio
ncr
ude
(thou
sand
u
3o8 c
onte
ntA
nthr
acite
Bitu
min
ous
Lign
itecu
bic
met
ers)
42-g
allo
n ba
rrels)
(met
ric to
ns)
Rus
sia
11,4
0027
6,50
078
,100
655,
000
3,61
5,00
03,
348
Slov
akia
----
2,29
211
010
5--
Slov
enia
----
4,32
12
2--
Spai
n4,
073
2,25
2--
44p
323
--sw
eden
----
----
----
Switz
erla
nd--
----
----
--Ta
jikis
tan
--41
2--
1187
--Tu
rkm
enis
tan
----
--69
,000
e79
,915
--U
krai
ne20
,763
64,6
0020
0e
19,3
1824
,110
1,13
2e
Uni
ted
Kin
gdom
1,10
115
,687
--57
,000
e36
8,13
9--
Uzb
ekis
tan
--25
33,
600
62,9
1123
,067
3,19
0To
tal,
Euro
pe a
nd C
entra
l Eur
asia
39,1
0057
2,00
059
6,00
01,
160,
000
5,92
0,00
034
,900
Shar
e of
wor
ld to
tal
5.4%
9.8%
49.9
%34
.0%
20.7
%51
.6%
Uni
ted
Stat
es2,
150
848,
000
71,6
0071
7,00
02,
370,
000
1,88
0Sh
are
of w
orld
tota
l0.
3%14
.6%
6.0%
21.0
%8.
3%2.
8%W
orld
tota
l73
1,00
05,
820,
000
1,19
0,00
03,
420,
000
28,6
00,0
0067
,600
(Tho
usan
d m
etric
tons
unl
ess o
ther
wis
e sp
ecifi
ed)
Min
eral
fuel
s and
rela
ted
mat
eria
ls
Coa
l
EUR
OPE
AN
D C
ENTR
AL
EUR
ASI
A: P
RO
DU
CTI
ON
OF
SELE
CTE
D M
INER
AL
CO
MM
OD
ITIE
S IN
201
21, 2
TAB
LE 4
—C
ontin
ued
-- Z
ero
or z
ero
perc
ent.
1 Som
e of
the
indi
vidu
al e
ntrie
s in
this
tabl
e m
ay d
iffer
from
thos
e th
at a
ppea
r in
indi
vidu
al c
ount
ry p
rodu
ctio
n ta
bles
else
whe
re in
this
vol
ume
owin
g to
the
incl
usio
n
e Estim
ated
; est
imat
ed d
ata,
U.S
. dat
a, a
nd w
orld
tota
ls ar
e ro
unde
d to
no
mor
e th
an th
ree
sign
ifica
nt d
igits
; may
not
add
to to
tals
show
n. p Pr
elim
inar
y. N
A N
ot a
vaila
ble.
Cou
ntry
2 Tota
ls m
ay n
ot a
dd d
ue to
inde
pend
ent r
ound
ing.
Tab
le in
clud
es d
ata
avai
labl
e as
of M
ay 7
, 201
4.3 Pr
imar
y pr
oduc
tion
also
incl
udes
und
iffer
entia
ted
(prim
ary
and
seco
ndar
y) p
rodu
ctio
n fo
r som
e co
untri
es li
sted
.
in th
is ta
ble
rece
ived
at a
late
r dat
e.
6 Rep
orte
d as
tota
l met
hane
sale
s.
5 Rep
orte
d fig
ure.
4 Less
than
½ u
nit.
1.26 U.S. GEOLOGICAL SURVEY MINERALS YEARBOOK—2012
Country 2005 2010 2012 2015e 2017e 2019e
Albania -- -- -- -- -- --Bosnia and Herzegovina 1,032 844 800 900 900 900Greece 2,441 1,816 1,900 2,000 2,000Hungary 535 365 255 250 250 250italy 300 -- -- -- -- --Kazakhstan 4,815 5,310 5,170 5,300 5,400 5,500Montenegro 672 61 -- -- -- --Romania -- -- -- -- -- --Russia 5,000 5,688 5,700 5,800 5,900 6,000
total 14,800 12,300 13,700 14,200 14,500 14,700
1Estimated data and totals are rounded to no more than three significant digits; may not add to totals shown.
TABLE 5EUROPE AND CENTRAL EURASIA: HISTORIC AND PROJECTED BAUXITE MINE PRODUCTION, 2005–20191
(Thousand metric tons)
eEstimated. -- Zero.
Country 2005 2010 2012 2015e 2017e 2019e
Austria 150 375 373 400 450 450Azerbaijan 32 -- 55 70 75 80Bosnia and Herzegovina 131 118 126 160 160 160Bulgaria 5 12 -- -- -- --Czech Republic 30 40 50 50 50 50Denmark-Greenland 20 25 25 25 25 25Finland 34 21 20 20 20 20France 664 540 533 530 540 540Germany 1,366 1,014 1,045 1,000 1,000 1,000Greece 163 137 165 140 140 140Hungary 82 234 150 150 150 150Iceland 273 826 803 800 800 800italy 1,314 1,414 1,112 1,300 1,400 1,400Kazakhstan -- 226 249 250 255 260Macedonia 4 -- -- -- -- --Montenegro 117 82 90 90 90 90Netherlands 391 300 300 300 300 300norway 1,376 1,060 1,070 1,100 1,100 1,100poland 66 16 11 11 11 11Portugal 18 18 18 18 18 18Romania 246 258 265 280 280 280Russia 3,647 3,947 3,924 4,000 4,000 4,000Serbia (2) 2 -- -- -- --Slovakia 162 163 160 160 160Slovenia 139 58 58 58 58Spain 637 651 651 650 650 650sweden 133 104 159 160 160 160Switzerland 238 25 -- -- -- --Tajikistan 380 349 273 320 350 350Ukraine 244 155 105 100 100 100United Kingdom 574 498 360 300 300 300Uzbekistan 3 -- -- -- -- --
total 12,600 12,700 11,900 12,400 12,600 12,700eEstimated. -- Zero.1Estimated data and totals are rounded to no more than three significant digits; may not add to totals shown.2Less than 1/2 unit.
TABLE 6EUROPE AND CENTRAL EURASIA: HISTORIC AND PROJECTED PRIMARY AND SECONDARY
ALUMINUM METAL PRODUCTION, 2005–20191
(Thousand metric tons)
EuropE and CEntral Eurasia—2012 1.27
Country 2005 2010 2012 2015e 2017e 2019e
Finland 6,158 9,413 10,547 12,000 12,000 12,000Kazakhstan -- -- -- -- -- --Russia 6,300 6,200 6,300 6,300 6,400 6,400
total 12,500 15,600 16,800 18,300 18,400 18,400
TABLE 7EUROPE AND CENTRAL EURASIA: HISTORIC AND PROJECTED COBALT MINE PRODUCTION, 2005–20191
(Co content in metric tons)
1Estimated data and totals are rounded to no more than three significant digits; may not add to totals shown.
eEstimated. -- Zero.
Country 2005 2010 2012 2015e 2017e 2019e
Albania 2 2 5 5 5 5Armenia 19 31 41 70 90 110Azerbaijan -- (2) 1 2 3 6Bulgaria 112 105 108 100 100 100Finland 16 15 na 16 16 16Georgia 10 7 7 7 8 8Kazakhstan 402 381 419 440 450 460Macedonia 22 8 10 10 10 10poland 512 481 479 480 480 480Portugal 90 74 74 76 80 85Romania 15 5 7 7 7 7Russia 700 703 883 900 950 1,000Serbia 27 28 41 50 60 60Spain 5 46 75 80 85 90sweden 98 77 82 85 85 85Uzbekistan 104 90 96 100 105 110
total 2,130 2,050 2,330 2,430 2,530 2,600eEstimated. -- Zero. NA Not available.1Estimated data and totals are rounded to no more than three significant digits; may not add to totals shown.2Less than 1/2 unit.
EUROPE AND CENTRAL EURASIA: HISTORIC AND PROJECTED COPPER MINE PRODUCTION, 2005–20191TABLE 8
(Cu content in thousand metric tons)
1.28 U.S. GEOLOGICAL SURVEY MINERALS YEARBOOK—2012
Country 2005 2010 2012 2015e 2017e 2019e
Armenia 10 8 10 10 11 11Austria 72 114 114 110 110 110Belgium 383 381 380 380 380 380Bulgaria 61 215 226 230 230 230Cyprus -- 3 4 4 4 4Czech Republic -- -- -- -- -- --Finland 125 146 148 150 150 150Germany 638 704 686 700 700 700Hungary -- -- -- -- -- --italy 32 2 8 7 7 7Kazakhstan 418 323 367 390 400 410Macedonia -- -- 2 2 2 2norway 39 3 36 36 35 34poland 560 547 566 570 570 570Romania 21 4 -- -- -- --Russia 958 830 875 890 900 900Serbia 27 22 35 40 50 50Slovakia -- 46 49 50 50 50Spain 302 270 270 270 270 270sweden 222 191 219 220 230 240Ukraine 25 20 15 15 15 15Uzbekistan 104 90 96 98 99 100
total 4,000 3,920 4,110 4,170 4,210 4,230
1Estimated data and totals are rounded to no more than three significant digits; may not add to totals shown.
(Thousand metric tons)
TABLE 9EUROPE AND CENTRAL EURASIA: HISTORIC AND PROJECTED REFINED COPPER METAL PRODUCTION
(PRIMARY AND SECONDARY), 2005–20191
eEstimated. -- Zero.

EuropE and CEntral Eurasia—2012 1.29
Country 2005 2010 2012 2015e 2017e 2019e
Armenia 1,400 974 2,896 3,300 3,400 3,500Azerbaijan -- 1,900 1,563 2,000 2,500 3,000Bulgaria 3,868 3,300 5,200 6,000 8,000 9,000Denmark-Greenland 1,000 1,600 2,800 3,000 3,000 4,000Finland 3,747 7,628 10,814 11,000 11,000 11,000France 1,500 1,500 -- -- -- --Georgia 1,620 2,000 2,300 2,300 2,350 2,400Kazakhstan 17,875 30,272 39,903 45,000 50,000 54,000Kyrgyzstan 16,751 18,072 10,333 18,000 18,000 18,000Macedonia 400 -- -- -- -- --poland 510 776 916 900 900 900Romania 400 400 -- -- -- --Russia 164,186 189,000 217,800 230,000 235,000 240,000Serbia 650 700 1,000 1,000 1,000 1,000Slovakia 109 534 546 550 600 600Spain 3,400 3,500 3,600 3,700 3,800 3,800sweden 6,600 6,242 6,015 6,300 6,300 6,300Tajikistan 1,927 2,049 2,401 2,700 2,900 3,100Ukraine 180 -- -- -- -- --Uzbekistan 84,210 90,000 93,000 100,000 105,000 110,000
total 310,000 360,000 401,000 436,000 454,000 471,000
1Estimated data and totals are rounded to no more than three significant digits; may not add to totals shown.
taBlE 10EUROPE AND CENTRAL EURASIA: HISTORIC AND PROJECTED GOLD MINE PRODUCTION, 2005–20191
(Kilograms)
eEstimated. -- Zero.
Average ironCountry content 2005 2010 2012 2015e 2017e 2019e
Austria 32% 665 662 686 700 700 700Azerbaijan 57% 4 33 114 130 140 150Bosnia and Herzegovina 42% 702 588 872 900 900 900Bulgaria 50% -- -- -- -- -- --Czech Republic 29% -- -- -- -- -- --Germany2 11% 38 41 47 45 45 45Greece 38% 575 560 550 500 500 400Kazakhstan 57% 11,100 13,800 14,326 14,500 14,600 14,700norway 62% 420 3,105 3,200 3,200 3,000 3,000Portugal 36% 12 14 14 14 14 14Romania 52% 69 -- -- -- -- --Russia 59% 56,100 56,600 61,400 62,000 63,000 64,000Slovakia 34% 182 -- -- -- -- --Spain 38% -- -- -- -- -- --sweden 60% 15,300 16,750 17,186 18,000 18,000 18,000Ukraine 55% 37,700 43,000 45,100 46,000 46,000 46,000United Kingdom 54% (3) -- -- -- -- --
total XX 123,000 135,000 143,000 146,000 147,000 148,000
1Estimated data and totals are rounded to no more than three significant digits; may not add to totals shown.
eEstimated. XX Not applicable. -- Zero.
2Iron ore is used domestically as an additive in cement and other construction materials but is of too low a grade to use in the steel industry.3Less than 1/2 unit.
taBlE 11EUROPE AND CENTRAL EURASIA: HISTORIC AND PROJECTED BENEFICIATED IRON ORE PRODUCTION (MINE OUTPUT), 2005–20191
(Fe content in thousand metric tons)
1.30 U.S. GEOLOGICAL SURVEY MINERALS YEARBOOK—2012
Country 2005 2010 2012 2015e 2017e 2019e
Albania 87 390 500 600 600 600Austria 7,031 7,206 7,421 7,800 7,500 7,200Azerbaijan 286 129 268 290 310 325Belarus 2,076 2,672 2,869 3,000 3,050 3,100Belgium 10,420 7,973 7,386 7,800 7,500 7,500Bosnia and Herzegovina 283 591 700 700 700 700Bulgaria 1,969 744 632 600 600 600Croatia 74 95 109 90 90 90Czech Republic 6,189 5,180 5,072 5,200 5,200 5,200Finland 4,738 4,023 3,759 4,000 4,000 4,000France 19,481 15,414 15,609 15,800 15,800 15,800Germany 44,524 43,830 42,661 43,000 43,000 43,000Greece 2,266 1,839 2,000 2,000 2,000 2,000Hungary 2,005 1,678 1,543 900 900 900italy 29,061 25,750 27,257 30,000 30,000 32,000Kazakhstan 4,477 3,338 2,610 3,000 3,200 3,400Latvia 550 655 800 800 800 800Luxembourg 2,194 2,563 2,232 2,500 2,500 2,500Macedonia 326 292 216 200 200 200Moldova 1,016 242 317 600 800 1,000Montenegro 104 45 45 42 40 40Netherlands 6,919 6,651 6,867 6,800 6,800 6,800norway 701 514 600 650 650 650poland 8,336 7,996 8,539 9,000 10,000 10,000Portugal 1,400 1,350 1,400 1,400 1,400 1,400Romania 6,280 3,724 3,417 4,000 4,000 4,000Russia 66,186 66,800 70,400 72,000 73,000 74,000Serbia 1,286 1,254 345 900 1,700 1,700Slovakia 4,242 4,580 4,403 4,450 4,500 4,500Slovenia 583 606 632 650 650 650Spain 17,800 16,340 15,600 16,000 16,500 17,000sweden 5,692 4,844 4,326 4,800 4,800 4,800Switzerland 1,158 1,330 1,400 1,400 1,500 1,600Ukraine 38,541 33,559 32,394 33,000 33,500 34,000United Kingdom 13,210 9,709 9,579 9,500 9,500 9,500Uzbekistan 607 731 736 740 740 740
total 312,000 285,000 285,000 294,000 298,000 302,000eEstimated. 1Estimated data and totals are rounded to no more than three significant digits; may not add to totals shown.
taBlE 12EUROPE AND CENTRAL EURASIA: HISTORIC AND PROJECTED CRUDE STEEL PRODUCTION, 2005–20191
(Thousand metric tons)

EuropE and CEntral Eurasia—2012 1.31
Country 2005 2010 2012 2015e 2017e 2019e
Albania na 3 3 3 3 3Finland 3,386 4,400 80,000 80,000 80,000 80,000Greece 23,210 13,800 14,000 14,000 14,000 14,000Kazakhstan 193 500 450 400 400 400Kosovo -- 9,080 4,400 4,400 4,200 4,000norway 100 351 351 350 350 350Russia 277,177 269,277 255,000 250,000 245,000 250,000Spain 5,386 5,400 6,200 6,600 6,900 7,200Ukraine 6,000 -- -- -- -- --
total 315,000 303,000 360,000 356,000 351,000 356,000eEstimated. NA Not available. -- Zero.1Estimated data and totals are rounded to no more than three significant digits; may not add to totals shown.
TABLE 13EUROPE AND CENTRAL EURASIA: HISTORIC AND PROJECTED NICKEL MINE PRODUCTION, 2005–20191
(Ni content in metric tons)
Country2 2005 2010 2012 2015e 2017e 2019e
poland 10 15 15 15 15 15Russia 97,400 84,700 82,400 81,000 80,000 80,000Serbia 19 22 22 20 20 20
total 97,400 84,700 82,400 81,000 80,000 80,000eEstimated.1Estimated data and totals are rounded to no more than three significant digits; may not add to totals shown.2Palladium production for Finland and Norway has not been estimated.
TABLE 14EUROPE AND CENTRAL EURASIA: HISTORIC AND PROJECTED PALLADIUM MINE PRODUCTION, 2005–20191
(Kilograms)
Country 2005 2010 2012 2015e 2017e 2019e
Finland 678 718 830 850 850 850poland 20 25 25 25 25 25Russia 29,000 25,700 30,200 32,000 34,000 36,000Serbia 3 -- 3 3 3 3
total 29,700 26,400 31,100 32,900 34,900 36,900
1Estimated data and totals are rounded to no more than three significant digits; may not add to totals shown.
TABLE 15EUROPE AND CENTRAL EURASIA: HISTORIC AND PROJECTED PLATINUM MINE PRODUCTION, 2005–20191
(Kilograms)
eEstimated. -- Zero.
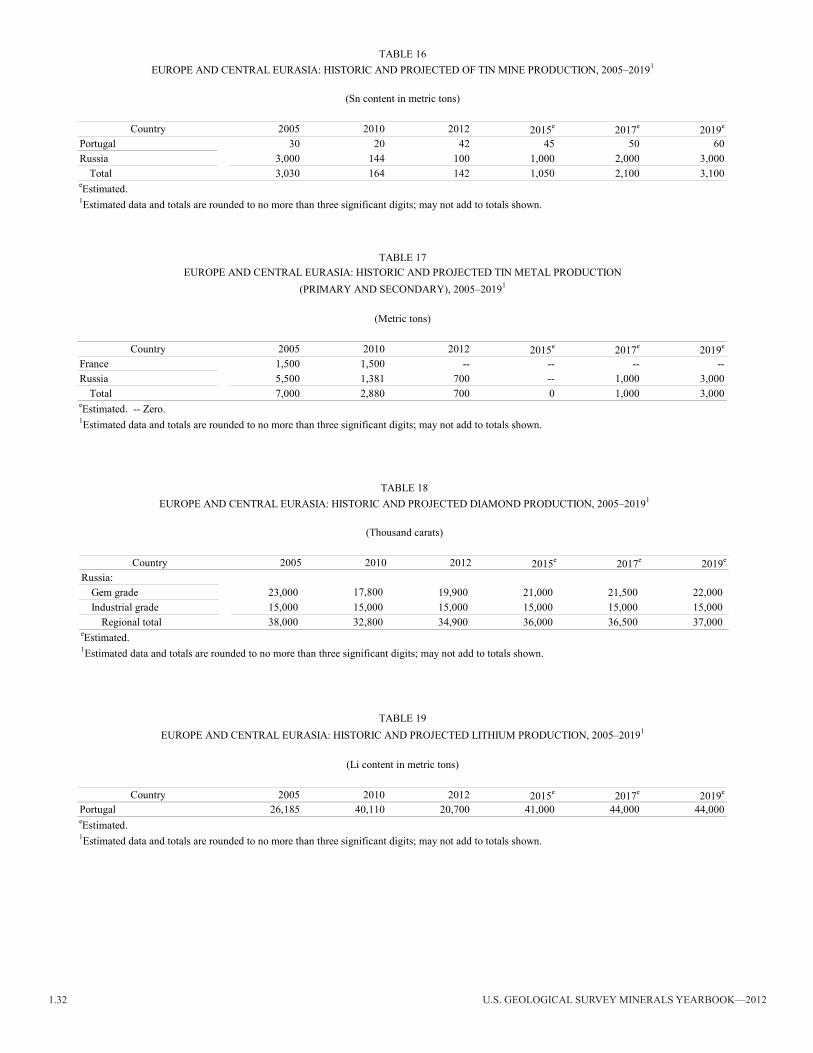
1.32 U.S. GEOLOGICAL SURVEY MINERALS YEARBOOK—2012
Country 2005 2010 2012 2015e 2017e 2019e
Portugal 30 20 42 45 50 60Russia 3,000 144 100 1,000 2,000 3,000
total 3,030 164 142 1,050 2,100 3,100
1Estimated data and totals are rounded to no more than three significant digits; may not add to totals shown.
TABLE 16EUROPE AND CENTRAL EURASIA: HISTORIC AND PROJECTED OF TIN MINE PRODUCTION, 2005–20191
(Sn content in metric tons)
eEstimated.
Country 2005 2010 2012 2015e 2017e 2019e
France 1,500 1,500 -- -- -- --Russia 5,500 1,381 700 -- 1,000 3,000
total 7,000 2,880 700 0 1,000 3,000
1Estimated data and totals are rounded to no more than three significant digits; may not add to totals shown.
TABLE 17EUROPE AND CENTRAL EURASIA: HISTORIC AND PROJECTED TIN METAL PRODUCTION
(PRIMARY AND SECONDARY), 2005–20191
(Metric tons)
eEstimated. -- Zero.
Country 2005 2010 2012 2015e 2017e 2019e
Russia:Gem grade 23,000 17,800 19,900 21,000 21,500 22,000Industrial grade 15,000 15,000 15,000 15,000 15,000 15,000
Regional total 38,000 32,800 34,900 36,000 36,500 37,000
1Estimated data and totals are rounded to no more than three significant digits; may not add to totals shown.
TABLE 18EUROPE AND CENTRAL EURASIA: HISTORIC AND PROJECTED DIAMOND PRODUCTION, 2005–20191
(Thousand carats)
eEstimated.
Country 2005 2010 2012 2015e 2017e 2019e
Portugal 26,185 40,110 20,700 41,000 44,000 44,000
(Li content in metric tons)
TABLE 19EUROPE AND CENTRAL EURASIA: HISTORIC AND PROJECTED LITHIUM PRODUCTION, 2005–20191
eEstimated.1Estimated data and totals are rounded to no more than three significant digits; may not add to totals shown.

EuropE and CEntral Eurasia—2012 1.33
Country 2005 2010 2012 2015e 2017e 2019e
Albania 3 3 1 1 1 1Austria 14 -- -- -- -- --Bosnia and Herzegovina 9,144 10,976 12,312 12,000 12,000 12,000Bulgaria 24,909 29,700 34,300 34,000 34,000 34,000Czech Republic 61,903 55,124 54,506 55,000 55,000 55,000Georgia 5 241 240 270 290 310Germany 202,621 182,303 196,202 190,000 185,000 180,000Greece 73,585 53,600 62 62 63 64Hungary 9,580 9,114 9,297 9,500 9,500 9,500Kazakhstan 86,586 106,568 115,659 140,000 160,000 180,000Kosovo 6,391 7,958 8,028 8,500 8,500 8,500Kyrgyzstan 396 575 1,184 1,500 1,800 2,100Macedonia 6,949 6,583 7,310 8,000 9,000 9,000Montenegro 1,297 1,938 2,000 2,000 2,000 2,000norway 300 1,685 1,583 1,600 1,600 1,500poland 159,039 133,238 144,135 144,000 144,000 144,000Romania 34,201 30,000 33,500 34,000 35,000 35,000Russia 282,881 321,600 366,000 380,000 390,000 400,000Serbia 34,993 38,598 38,728 39,000 39,000 39,000Slovakia 2,511 2,378 2,292 2,300 2,300 2,100Slovenia 4,539 4,430 4,321 4,400 4,100 4,000Spain 19,350 8,430 6,325 6,000 5,500 5,500Tajikistan 99 200 412 600 750 900Ukraine 74,559 75,200 85,700 91,000 95,000 100,000United Kingdom 20,498 18,159 16,788 18,000 18,000 18,000Uzbekistan 3,003 3,100 3,600 4,200 4,600 5,000
total 1,120,000 1,100,000 1,140,000 1,190,000 1,220,000 1,250,000
1Estimated data and totals are rounded to no more than three significant digits; may not add to totals shown.2Includes anthracite, bituminous, and run-of-mine lignite.
taBlE 20EUROPE AND CENTRAL EURASIA: HISTORIC AND PROJECTED SALABLE COAL PRODUCTION, 2005–20191, 2
(Thousand metric tons)
eEstimated. -- Zero.