europe and central asia (eca) affected...
TRANSCRIPT

B E L A R U S
M O L D O V A
P O L A N D
R O M A N I A
R U S S I A N F E D E R A T I O N
T U R K E Y
Cherkas'ka
Chernihivs'ka
Chernivets'ka Dnipropetrovs'kaDonets'ka
Ivano-frankivs'ka
Kharkivs'ka
Khersons'ka
Khmel'nyts'ka
Kirovohrads'ka
Krym
Kyyivs'ka
L'vivs'ka
Luhans'ka
Mykolayivs'ka
Odes'ka
Poltavs'ka
Rivnens'ka Sums'ka
Ternopil's'ka
Vinnyts'ka
Volyns'ka
Zakarpats'ka
Zaporiz'ka
Zhytomyrs'kaKiev
B L A C K S E A
0.843.2 4.8 9.1
21
GDP (billions of $)
FLOOD
EARTHQUAKE
3
1
Negligible
Annual Average of Affected GDP (%)
There is a high correlation(r=0.95) between the
population and GDP of a province.
TOP AFFECTED PROVINCES
FLOOD EARTHQUAKEANNUAL AVERAGE OF AFFECTED GDP (%)
ANNUAL AVERAGE OF AFFECTED GDP (%)
Kharkivs’kaZakarpats’kaKirovohrads’kaLuhans’kaChernihivs’kaPoltavs’kaVinnyts’kaMykolayivs’kaKhersons’kaZhytomyrs’ka
3322222222
KrymOdes’kaZakarpats’kaChernivets’kaIvano -frankivs’kaVinnyts’kaL’vivs’kaTernopil’s’kaKhmel’nyts’kaKhersons’ka
21111
00000
Ukraine’s population and econo-my are exposed to earthquakes and floods, with floods posing
the greater risk. The model results for present-day risk shown in this risk pro-file are based on population and gross domestic product (GDP) estimates for 2015. The estimated damage caused by historical events is inflated to 2015 US dollars.
Close to 70 percent of Ukraine’s pop-ulation lives in urban environments. The country’s GDP was approximately US$89.2 billion in 2015, with about 60 percent derived from services, most of the remainder generated by industry,
UkraineEUROPE AND CENTRAL ASIA (ECA) RISK PROFILES
10
GDP $89.2 billion*
Population 44.9 million*
AFFECTED BY 100-YEAR FLOOD
AFFECTED BY 250-YEAR EARTHQUAKE
CAPITAL LOSS FROM 250-YEAR EARTHQUAKE
$4 billion (4%)
2 million (5%)
$6 billion (7%)
4 million (9%)
$2 billion (2%)
700 (<1%)
*2015 estimates
and agriculture making a small contribution. Ukraine’s per capita GDP was $1,990.
This map displays GDP by prov-ince in Ukraine, with greater color saturation indicating greater GDP within a province. The blue circles indicate the risk of experiencing floods and the orange circles the risk of earthquakes in terms of nor-malized annual average of affected GDP. The largest circles represent the greatest normalized risk. The risk is estimated using flood and earthquake risk models.
The table displays the provinces at greatest normalized risk for each peril. In relative terms, as shown in the table, the province at greatest risk of floods is Kharkivs’ka, and the one at greatest risk of earthquakes is Krym. In absolute terms, the province at greatest risk of floods is Kharkivs’ka, and the one at greatest risk of earthquakes is Odes’ka.
123

B E L A R U S
M O L D O V A
P O L A N D
R O M A N I A
R U S S I A N F E D E R A T I O N
T U R K E Y
Cherkas'ka
Chernihivs'ka
Chernivets'ka Dnipropetrovs'kaDonets'ka
Ivano-frankivs'ka
Kharkivs'ka
Khersons'ka
Khmel'nyts'ka
Kirovohrads'ka
Krym
Kyyivs'ka
L'vivs'ka
Luhans'ka
Mykolayivs'ka
Odes'ka
Poltavs'ka
Rivnens'ka Sums'ka
Ternopil's'ka
Vinnyts'ka
Volyns'ka
Zakarpats'ka
Zaporiz'ka
Zhytomyrs'ka Kiev
B L A C K S E A
The most devastating flood in Ukraine since it gained its in-dependence in 1991 occurred
in 2008, causing nearly 40 fatalities and about $1 billion in damage. Flooding in 1993 caused about $300 million in damage, and a 1998 flood killed nearly 20 people. Further flooding in 2006 and 2013 caused no fatalities but over $20 million in damage in each year.
This map depicts the impact of flood-ing on provinces’ GDPs, represented as percentages of their annual aver-age GDPs affected, with greater color saturation indicating higher percent-ages. The bar graphs represent GDP affected by floods with return periods of 10 years (white) and 100 years (black). The horizontal line across the bars also shows the annual average of GDP affected by floods.
When a flood has a 10-year return period, it means the probability of occurrence of a flood of that magni-tude or greater is 10 percent per year. A 100-year flood has a probability of occurrence of 1 percent per year. This means that over a long period of time, a flood of that magnitude will, on average, occur once every 100 years. It does not mean a 100-year flood will occur exactly once every 100 years. In fact, it is possible for a flood of any return period to occur more than once in the same year, or to appear in consecutive years, or not
to happen at all over a long period of time.
If the 10- and 100-year bars are the same height, then the impact of a 10-year event is as large as that of a 100-year event, and the annual average of affected GDP is dominated by events that happen relatively frequently. If the impact of a 100-year event is much greater than that of a 10-year event, then less frequent events make a larger contribution to the annual average of affected GDP. Thus, even if a province’s annual affected GDP seems small, less frequent and more intense events can still have large impacts.
The annual average population affect-ed by flooding in Ukraine is about 600,000 and the annual average GDP about $1 billion. Within the various provinces, the 10- and 100-year im-pacts do not differ much, so relatively frequent floods have large impacts on these averages.
EUROPE AND CENTRAL ASIA (ECA) RISK PROFILESFLOODUkraine
0 1 2 4 8
Annual Average of Affected GDP (%)
610
52
Affected GDP (%) for
10 and 100-year return periods
Annual average
10-year 100-year
One block = 1%
124

B E L A R U S
M O L D O V A
P O L A N D
R O M A N I A
R U S S I A N F E D E R A T I O N
T U R K E Y
Cherkas'ka
Chernihivs'ka
Chernivets'ka Dnipropetrovs'kaDonets'ka
Ivano-frankivs'ka
Kharkivs'ka
Khersons'ka
Khmel'nyts'ka
Kirovohrads'ka
Krym
Kyyivs'ka
L'vivs'ka
Luhans'ka
Mykolayivs'ka
Odes'ka
Poltavs'ka
Rivnens'ka Sums'ka
Ternopil's'ka
Vinnyts'ka
Volyns'ka
Zakarpats'ka
Zaporiz'ka
Zhytomyrs'ka Kiev
B L A C K S E A
Ukraine’s worst earthquake since 1900 took place in 1927 in Crimea, with a magnitude
of 6.8. It caused about 15 fatalities and close to $200 million in damage. Other major earthquakes affecting Ukraine occurred in 1170 in Kiev and in 1751 and 1872 in Crimea.
This map depicts the impact of earthquakes on provinces’ GDPs, represented as percentages of their annual average GDPs affected, with greater color saturation indicating higher percentages. The bar graphs represent GDP affected by earth-quakes with return periods of 10 years (white) and 100 years (black). The horizontal line across the bars also shows the annual average of GDP affected by earthquakes.
When an earthquake has a 10-year return period, it means the probabil-ity of occurrence of an earthquake of that magnitude or greater is 10 percent per year. A 100-year earth-quake has a probability of occurrence of 1 percent per year. This means that over a long period of time, an earthquake of that magnitude will, on average, occur once every 100 years. It does not mean a 100-year earth-quake will occur exactly once every 100 years. In fact, it is possible for an earthquake of any return period to occur more than once in the same year, or to appear in consecutive
years, or not to happen at all over a long period of time.
If the 10- and 100-year bars are the same height, then the impact of a 10-year event is as large as that of a 100-year event, and the annual average of affected GDP is dominated by events that happen relatively frequently. If the impact of a 100-year event is much greater than that of a 10-year event, then less frequent events make larger contributions to the annual av-erage of affected GDP. Thus, even if a province’s annual affected GDP seems small, less frequent and more intense events can still have large impacts.
The annual average population affect-ed by earthquakes in Ukraine is about 100,000 and the annual average affected GDP about $100 million. The annual averages of fatalities and capital losses caused by earth-quakes are about 20 and about $60 million, respectively. The fatalities and capital losses caused by more intense, less frequent events can be substantially larger than the annual averages. For example, an earthquake with a 0.4 percent annual probability of occurrence (a 250-year return period event) could cause about 700 fatalities and $2 billion in capital loss (about 2 percent of GDP).
EUROPE AND CENTRAL ASIA (ECA) RISK PROFILESEARTHQUAKEUkraine
0 1 2 4 8
Annual Average of Affected GDP (%)
630
15
Affected GDP (%) for
10 and 100-year return periods
Annual average
10-year 100-year
One block = 5%
125
B E L A R U S
M O L D O V A
P O L A N D
R O M A N I A
R U S S I A N F E D E R A T I O N
T U R K E Y
Cherkas'ka
Chernihivs'ka
Chernivets'ka Dnipropetrovs'kaDonets'ka
Ivano-frankivs'ka
Kharkivs'ka
Khersons'ka
Khmel'nyts'ka
Kirovohrads'ka
Krym
Kyyivs'ka
L'vivs'ka
Luhans'ka
Mykolayivs'ka
Odes'ka
Poltavs'ka
Rivnens'ka Sums'ka
Ternopil's'ka
Vinnyts'ka
Volyns'ka
Zakarpats'ka
Zaporiz'ka
Zhytomyrs'ka Kiev
B L A C K S E A
A F G H A N I S T A N
C H I N A
I N D I A
K A Z A K H S T A N
K Y R G Y Z R E P U B L I C
P A K I S T A N
T A J I K I S T A N
T U R K M E N I S T A N
I S L A M I C R E P U B L I C O F I R A N
Andijan
BukharaFergana
Karakalpakstan
Kashkadarya
Khorezm
Namangan
Samarkand
Surkhandarya
Sirdarya
Tashkent
Jizzakh
Navoiy Tashkent City
Tashkent
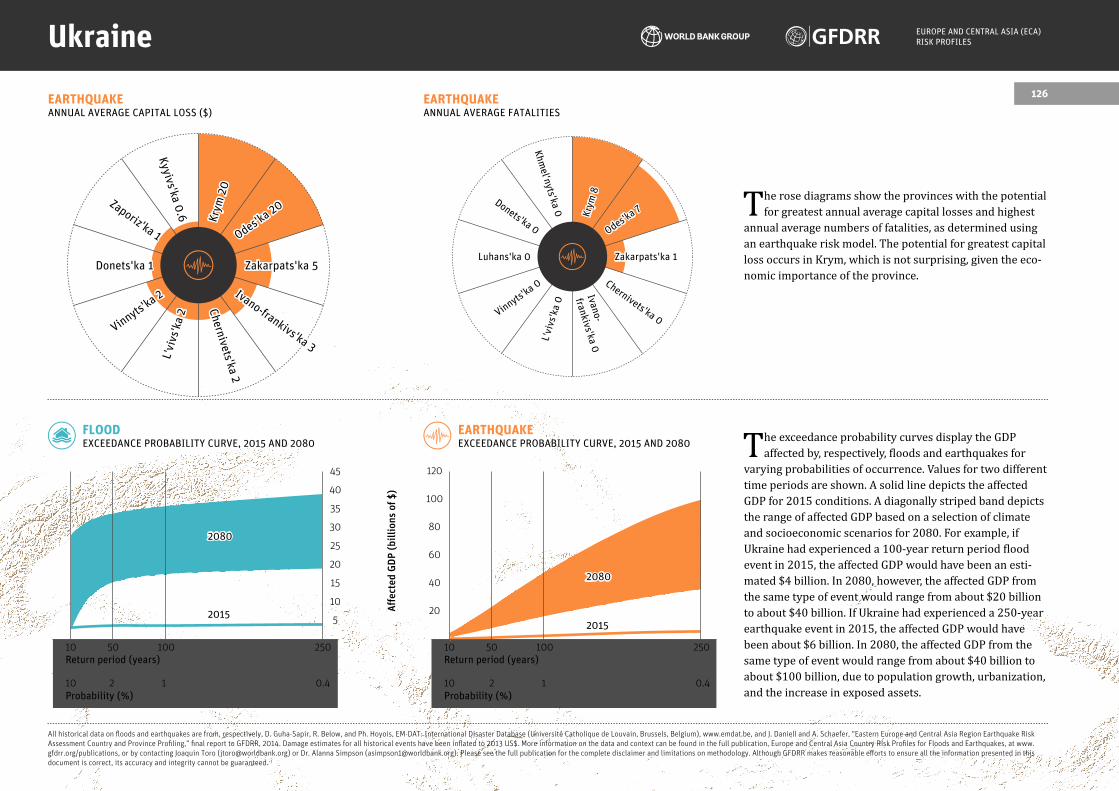
The rose diagrams show the provinces with the potential for greatest annual average capital losses and highest
annual average numbers of fatalities, as determined using an earthquake risk model. The potential for greatest capital loss occurs in Krym, which is not surprising, given the eco-nomic importance of the province.
EUROPE AND CENTRAL ASIA (ECA) RISK PROFILESUkraine
EARTHQUAKEEXCEEDANCE PROBABILITY CURVE, 2015 AND 2080
FLOODEXCEEDANCE PROBABILITY CURVE, 2015 AND 2080 The exceedance probability curves display the GDP
affected by, respectively, floods and earthquakes for varying probabilities of occurrence. Values for two different time periods are shown. A solid line depicts the affected GDP for 2015 conditions. A diagonally striped band depicts the range of affected GDP based on a selection of climate and socioeconomic scenarios for 2080. For example, if Ukraine had experienced a 100-year return period flood event in 2015, the affected GDP would have been an esti-mated $4 billion. In 2080, however, the affected GDP from the same type of event would range from about $20 billion to about $40 billion. If Ukraine had experienced a 250-year earthquake event in 2015, the affected GDP would have been about $6 billion. In 2080, the affected GDP from the same type of event would range from about $40 billion to about $100 billion, due to population growth, urbanization, and the increase in exposed assets.
All historical data on floods and earthquakes are from, respectively, D. Guha-Sapir, R. Below, and Ph. Hoyois, EM-DAT: International Disaster Database (Université Catholique de Louvain, Brussels, Belgium), www.emdat.be, and J. Daniell and A. Schaefer, “Eastern Europe and Central Asia Region Earthquake Risk Assessment Country and Province Profiling,” final report to GFDRR, 2014. Damage estimates for all historical events have been inflated to 2013 US$. More information on the data and context can be found in the full publication, Europe and Central Asia Country Risk Profiles for Floods and Earthquakes, at www.gfdrr.org/publications, or by contacting Joaquin Toro ([email protected]) or Dr. Alanna Simpson ([email protected]). Please see the full publication for the complete disclaimer and limitations on methodology. Although GFDRR makes reasonable efforts to ensure all the information presented in this document is correct, its accuracy and integrity cannot be guaranteed.
Aff
ecte
d G
DP
(b
illi
on
s o
f $
)
EARTHQUAKEANNUAL AVERAGE FATALITIES
EARTHQUAKEANNUAL AVERAGE CAPITAL LOSS ($)
Return period (years)
Probability (%)
10
10
250
0.4
50
2
100
1
40
20
60
80
120
100
2080
2015
Return period (years)
Probability (%)
10
10
250
0.4
50
2
100
1
10
15
5
20
25
45
30
35
40
2080
2015
Zakarpats'ka 5Donets'ka 1
Odes'ka 20
Vinnyts'ka 2
Krym
20
L'vi
vs'k
a 2
Ivano-frankivs'ka 3
Zaporiz'ka 1
Chernivets'ka 2
Kyyivs'ka 0.6
Zakarpats'ka 1Luhans'ka 0
Odes'ka 7
Vinnyts'ka 0
Krym
8
L'vi
vs'k
a 0
Chernivets'ka 0
Donets'ka 0
Ivano-
frankivs'ka 0
Khmel'nyts'ka 0
126