eurocypria the chartered airline of cyprus challenges eleftherios ioannou executive chairman
TRANSCRIPT

Eurocypria
The Chartered Airline of Cyprus • Challenges
Eleftherios Ioannou
Executive Chairman

Global Tourism has shown robust growth over time, despite a number of negative
external shocks
• Challenges
438
534
684 686 706 694
764804
853904 922
0
100
200
300
400
500
600
700
800
900
1,000
1990 1995 2000 2001 2002 2003 2004 2005 2006 2007 2008
Glo
bal
Inte
rnat
ion
al T
ou
rist
Arr
ival
s, M
illio
ns
CAGR 1990-20084.2%
International Tourist Arrivals (millions), 1990-2008
Sep 11SARS, 2nd Gulf War
Financial crisis
Source: World Tourism Organisation &

Europe is the largest tourism region in the world with 53% of total arrivals in 2008, but it
is growing more slowly than other regions
266315
396 393 404 407 424 442 459 480 489.4
439
540
922898
687 686 706 694764
806842
0
100
200
300
400
500
600
700
800
900
1000
1990 1995 2000 2001 2002 2003 2004 2005 2006 2007 2008
Inte
rnat
ion
al T
ou
rist
Arr
ival
s, M
illio
ns
Europe
World
CAGR 1990-20084.3%
CAGR 1990-20083.5%
European Tourist Arrivals (millions), 1990-2008
Source: World Tourism Organisation &

International Tourist Arrivals to Europe by Sub-regions, (millions), 1990 – 2008
32 40 46 46 50 53 55 56 57
109 112140 136 139 143 150 155 153
3260
70 79 86 88 91 93 100
94
103
141 147150 158
165 176 180
0
50
100
150
200
250
300
350
400
450
500
1990 1995 2000 2003 2004 2005 2006 2007 2008
Inte
rnat
ion
al T
ou
rist
Arr
ival
s, M
illio
ns
Southern/MediterraneanEurope
Central/ EasternEurope
Western Europe
Northern Europe
Within Europe, the Southern/Mediterranean region attracts the most tourist arrivals, and
also, along with CE Europe, shows the fastest growth
Source: World Tourism Organisation &

Spain34.6%
Italy30.8%
Greece10.1%
Portugal9.4%
Other1.2%
Croatia1.5%
Malta1.1%
Cyprus2.1%Israel
2.2%Turkey
7.0%
Spain34.0%
Italy29.3%
Greece9.3%
Portugal8.6%
Israel1.7%
Malta0.9%
Slovenia0.8%
Croatia4.1%
Turkey6.8%
Andorra2.1%
Cyprus1.9%
Other0.5%
1990
2000
2005
Total: 103 million
Total: 141 million
Total: 150 million
Source: UNWTO &
Croatia and Turkey have grown share
Traditionally, the Western Mediterranean has been the main destination of European leisure travel; there
are however some signs that other countries are increasing their share
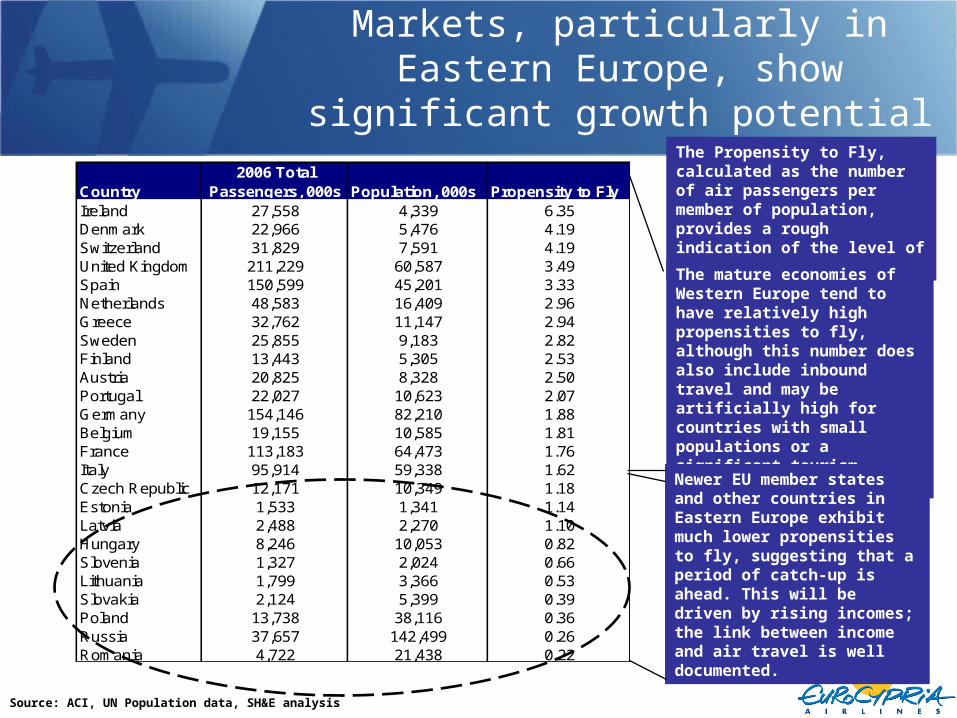
Markets, particularly in Eastern Europe, show significant growth potential
Country2006 Total
Passengers, 000s Population, 000s Propensity to FlyIreland 27,558 4,339 6.35Denmark 22,966 5,476 4.19Switzerland 31,829 7,591 4.19United Kingdom 211,229 60,587 3.49Spain 150,599 45,201 3.33Netherlands 48,583 16,409 2.96Greece 32,762 11,147 2.94Sweden 25,855 9,183 2.82Finland 13,443 5,305 2.53Austria 20,825 8,328 2.50Portugal 22,027 10,623 2.07Germany 154,146 82,210 1.88Belgium 19,155 10,585 1.81France 113,183 64,473 1.76Italy 95,914 59,338 1.62Czech Republic 12,171 10,349 1.18Estonia 1,533 1,341 1.14Latvia 2,488 2,270 1.10Hungary 8,246 10,053 0.82Slovenia 1,327 2,024 0.66Lithuania 1,799 3,366 0.53Slovakia 2,124 5,399 0.39Poland 13,738 38,116 0.36Russia 37,657 142,499 0.26Romania 4,722 21,438 0.22
The Propensity to Fly, calculated as the number of air passengers per member of population, provides a rough indication of the level of maturity
The mature economies of Western Europe tend to have relatively high propensities to fly, although this number does also include inbound travel and may be artificially high for countries with small populations or a significant tourism market
Newer EU member states and other countries in Eastern Europe exhibit much lower propensities to fly, suggesting that a period of catch-up is ahead. This will be driven by rising incomes; the link between income and air travel is well documented.
Source: ACI, UN Population data, SH&E analysis
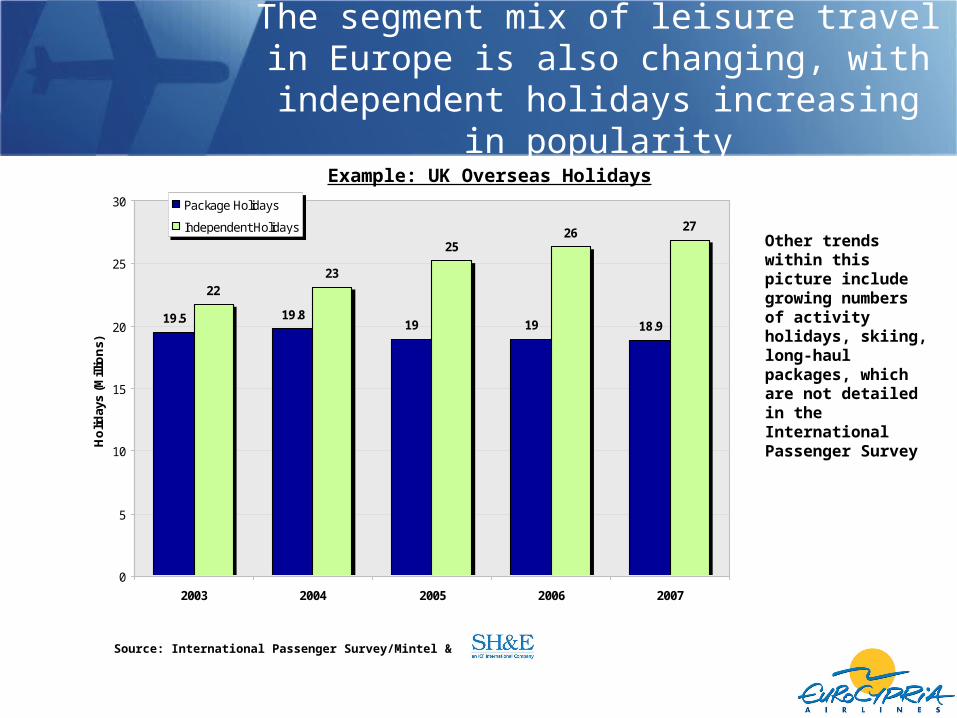
The segment mix of leisure travel in Europe is also changing, with independent holidays
increasing in popularity
19.5 19.819 19 18.9
2223
2526 27
0
5
10
15
20
25
30
2003 2004 2005 2006 2007
Ho
liday
s (M
illio
ns)
Package Holidays
Independent Holidays
Source: International Passenger Survey/Mintel &
Example: UK Overseas Holidays
Other trends within this picture include growing numbers of activity holidays, skiing, long-haul packages, which are not detailed in the International Passenger Survey

The growth in individual (seat only) travel has had a significant impact on the
traditional charter market
30 33 34 36 39 36 33 34 36 38 37 36 36 36 33 30 29
43 4348 46
51 59 6775
8189
101 107 105115
131148
162
0
50
100
150
200
1990 1992 1994 1996 1998 2000 2002 2004 2006
Pas
sen
ger
s (m
illio
ns)
Scheduled
Non-scheduled
Source: DGAC Spain &
Passengers at Spanish airports (1990-2006)• In Spain the charter
market peaked in 1994 and has declined by 25% in 12 years
• In the same period the total market has trebled, with scheduled carriers growing four fold.
• Much of the scheduled growth since 2002 has been with Low Cost Carriers

There are four main airline types competing for European leisure travellers
The boundaries between the models are however increasingly blurred, as traditional charter airlines offer scheduled ‘low-cost’ services (e.g. Monarch), low cost carriers such as Air Berlin also operate in the charter and long-haul markets, and integrated tour operators move into flight-only sales on their charter flights
Scheduled network carriers
Integrated tour operators
Independent charter carriers
Low cost carriers
Source:

Low Cost carriers have been the most significant development in the competitive
environment, increasing capacity, stimulating leisure demand, and driving down prices
ZRH
ZTHXRY
VIE
ZAD VAR
WAWTXL
VCETSF
TRF
TRD
TJM
VKO
SZG
SXF
ZAG
TLL
SVX
SVQVLC
SVG
SUF
STR
STN
ZAZ
WRO
VST
VLLVBS
TUF
TRSTRN
TOS
TMP
TLN
SZZ
SPU SOF
SOB
SNN
SMI
SKG
SJJSKP
SDRSCQ
SCN
SAW
RZE
RTM
ROVRNS
SOU
RMIRJK
RIX
RHO
RLG
REU
REG
RDZ PUYPUF
PSRPSA
TPS
PRN
PRG
POZ
PMO
VRN
PMI
PMF
PIS
PIK
PGF PEG
PEE
PAD
OVD
OSR
OSL
VNOPLQ
ORY
TLS
ORK
OPOOMO
OLB
NYO
NUE
VOL
NTE
NQY
NOC NCL
NCE
NAP
MXPOTP
MUC
PVK
MST
MRSMPL
MMX
MMK
MLA
MJV MJT
MANNWI
MAHMAD
SBZLYS
LTN
TATLRH
LPL
LNZLJU
LIS
LINLIG
LHRLGW
VGO
LEJ
LEI
LED
LDY
LCJ
LCG
LBCLBA
KZN
KVA
KUN
KUF
KTWKSC
KRS
KRN
LLA
KRKLIL
KLU
KKN
KIR
KGS
KGD
JTRJMK
JERSEN
IST
USQ
IOM
INV
INN
IBZ
HHN
HER
HEL
VAA
RVNOUL
KUO
HAU
HAMHAJ
GWT
GVALUG
LTT
KBP
GSE
GRZ
THF
GRX
GRO
MME
GPA
GOT
GOAGNB
GLA
GIB
GDN
TKU
GCI
FRL
FRA
FNI
FMO
FLR
FKBFDH
FCO
PNL
FAO
EXT
EVE
ESB
ERF
EMA
EIN
EGC
EDO
EDI
EBA
DUS
VXO
KEF
DUB
DTM DRSDNR
DME
DLM
DBV
CWLCVT
CTA
CRL
CPH
CNDCLJ
CKZCIA
CHQ
CGN
OSI
CLY
CFU
CEK
CDG
CCF
CAG
BZR
BZG
BVA
BUD TGMBTSBSL
BRUBRS
BRQ
BRI
BRE
BOO
BOJ
BOH
BODBNXBLQ
BLLBLK
BJV
BIQBIO
BIA
BHX
DNDBHD
BGY
BGO
BFS
BES
BEG
BDU
BDSBCN
BCM
CUF BBU
AYT
AVN
ATH
ARW
ARN
UMEOSD
AOK
AOI
AOC
ANG
AMS
ALF
ALC
AJAAHO
AGP
AER
ADB
ABZ
AARAAL
RKV
LCA
European LCC Routes, August 2008
AAR
STN
ABZ
LTN
AGP
AMSCGN DRSDUS
FAO
FMO
LEI
LPLMAN
NUE
PADRTM TXL
XRYAHO
ALC
BCN
CTA
DUB
GVA
HER
NAP
NCE
ORK
PMI
PSA
RHO
SVQ
AOI
ARNHEL
JYV
MHQ
OUL
PORTKUTMP
ATH AYT
BRU
BFSSNN
BGO
BGY
FCO
BHXIOM
BIOBIQ BLQ
BOHBRE
SXFBRS
CPH
LHR
LINBUD
SJJ
BVA
PIK
CCF
CDG
CFU
ERFLEJ
ZTH
IBZ
KGS
MAH SKGCIA
GOT
CRLCWL
JERDNR
EDI
FRA
GLAGWY
KIR LBA
LCYLGW
MAD
MME
MUC
MXP
NCL
ZRHEBUFNI
GIB
GOA
HAJHAM
OSL
HHN
INV
SOU
IST
KIDLBC
LDY
LIS
LYS
MMXNOC
SMI
NYO
RNS
VAA
PGF
SCNSTRPRG
RKV
RMIZAG
SUF
TRF
TRN TSFVBSVCE
LCA
European LCC Routes, August 2000
327 Routes
750,000 Weekly Departing seats
2,542 Routes
5,412,000 Weekly Departing seats
Source: OAG Schedules, SH&E Analysis

In Eastern/Southern Europe, LCCs are less well established, but
competition is increasing
These carriers typically serve significant migrant worker and VFR segments, particularly between the home market and the UK.
Country of origin
LCCs Fleet size
Poland Central Wings 11
Czech Republic
Smart Wings 2
Slovakia SkyEurope 15
Austria InterSky 4
Hungary WizzAir 16
Romania Blue Air 6
Bulgaria WizzAir Bulgaria 1
LCC Operators and Fleet size, August 2008
Bankrupt
Closed down
Source:

In Cyprus, non-scheduled services still account for 46% of passengers; this is an increase on
last year, when the proportion was 42%
Passengers at Cyprus airports, 2007
Paphos is the smaller of Cyprus’s
two commercial airports and in 2007 served around 1.7
million terminal passengers, of
whom around 75% were travelling on
non-scheduled services
Larnaca is Cyprus’s main airport, with around 5.3 million terminal passengers in 2007. Of these, around 35% were carried on non-scheduled services.
Source:
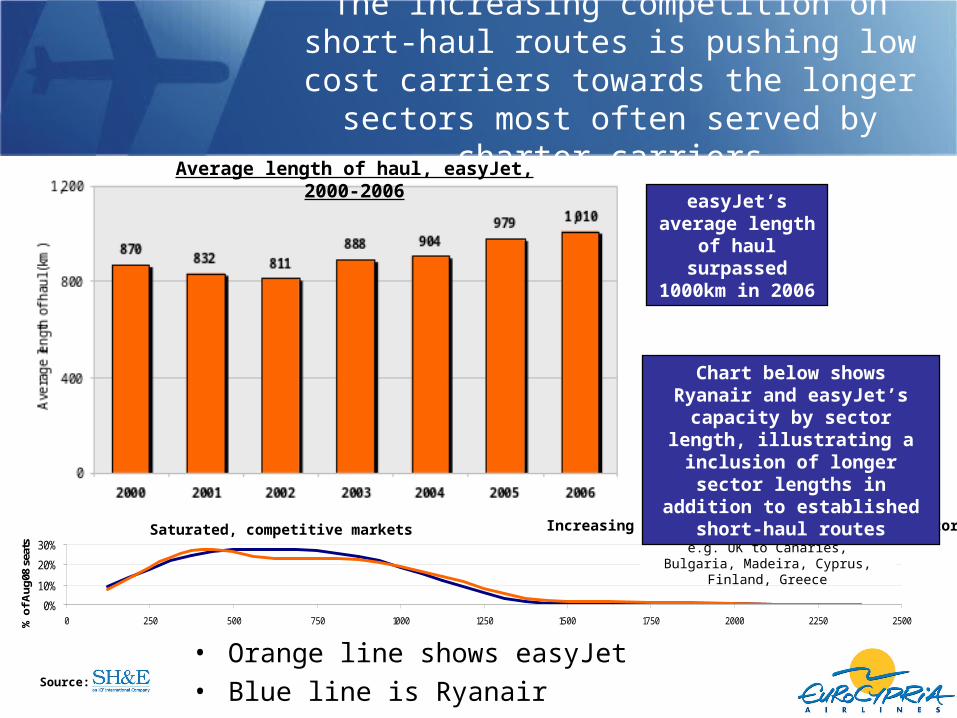
The increasing competition on short-haul routes is pushing low cost carriers towards the longer sectors most often served by charter carriers
0%
10%
20%
30%
0 250 500 750 1000 1250 1500 1750 2000 2250 2500% o
f Aug
08 s
eats
Saturated, competitive markets
Increasing network development on longer sectors
e.g. UK to Canaries, Bulgaria, Madeira, Cyprus, Finland, Greece
easyJet’s average length of haul
surpassed 1000km in 2006
Average length of haul, easyJet, 2000-2006
Chart below shows Ryanair and easyJet’s capacity by sector length, illustrating a inclusion of longer sector
lengths in addition to established short-haul routes
Saturated, competitive markets
• Orange line shows easyJet• Blue line is Ryanair Source:
0%
10%
20%
30%
40%
50%
60%
70%
80%
90%
100%
2005 2006 2007 2008 2009
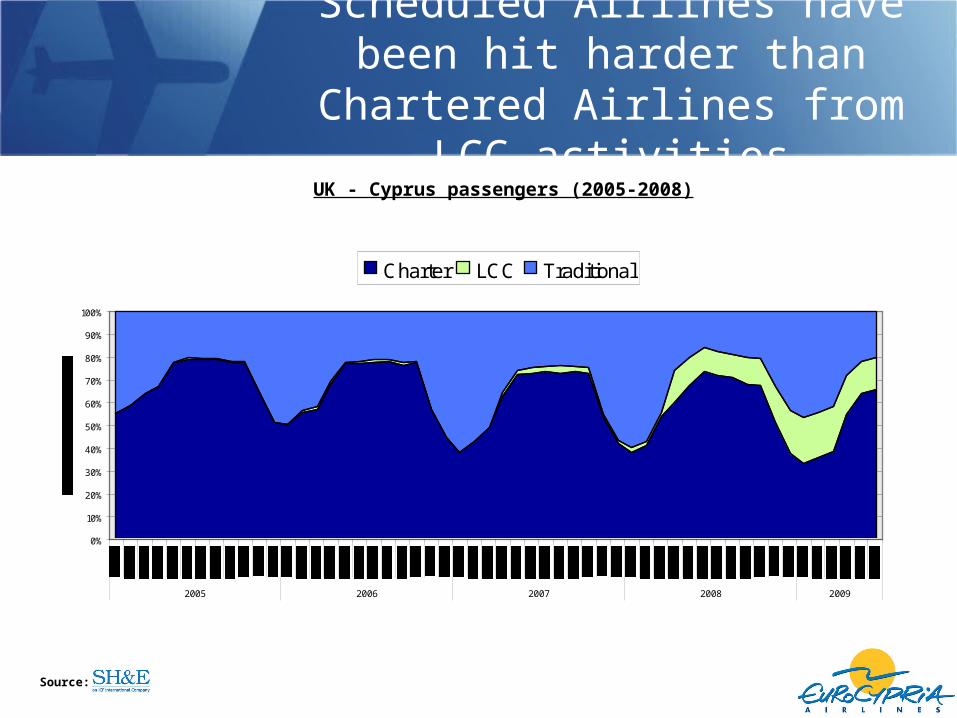
Charter LCC Traditional
UK - Cyprus passengers (2005-2008)
Scheduled Airlines have been hit harder than Chartered Airlines from
LCC activities
Source:

While Cyprus is currently beyond the reach of most Western European LCCs, some from the
UK and from Eastern Europe have already started service
• Blue Air flies twice a week between Bucharest and Larnaca
• Flyglobespan operates scheduled services once a week between Aberdeen and Paphos, once a week between Edinburgh and Paphos, and twice a week between Glasgow and Paphos
• easyJet, having taken over GB airways and its existing routes, operates twice a day between London Gatwick and Paphos, and once a day between Manchester and Paphos
• Jet2.com flies twice a week between Leeds Bradford and Paphos
• Before their demise, SkyEurope used to fly five times a week between Vienna and Larnaca
LCA
LGW
MANDUB
NUEFRA
MUC
WAWPOZ
PRG
BUDVIE
ZRH
KBP
SVO
OTP
SOF
OSL ARN
ATH
FCO
LED
Overview of LCC services to Cyprus
1000km3000km 2000km4000km
Recently easyJet and Jet2 have announced scheduled services from the UKSource:

Eurocypria with 6 aircraft flies to 74 destinations and carries 850.000 passengers covering 25.040 Flight Hours

In this very competitive air transport world, the challenge for Eurocypria is to:
• Keep costs low, as low as LCC• Find partners, niche routes, products and services
that will add value to tourists to Cyprus.
Challenge