eurobank ergasias s.a. ergasias s.a. for the year ended 31 december 2015 8 othonos street, athens...
TRANSCRIPT
EUROBANK ERGASIAS S.A.
FOR THE YEAR ENDED
31 DECEMBER 2015
8 Othonos Street, Athens 105 57, Greece
www.eurobank.gr, Tel.: (+30) 210 333 7000
Company Registration No: 6068/06/B/86/07
8 Othonos Street, Athens 105 57, Greece
www.eurobank.gr, Tel.: (+30) 210 333 7000
Company Registration No: 000223001000

EUROBANK ERGASIAS S.A. Consolidated Pillar 3 Report
2 | Page 31 December 2015 Consol idated Pi l lar 3 Report
1. Introduction – General Information.......................................................................................... 4
1.1 Regulatory framework .................................................................................................................... 5
1.2 Implementation of Capital Adequacy framework at Eurobank Group .......................................... 7
1.3 Scope of Pillar 3 .............................................................................................................................. 8
1.4 Regulatory versus accounting consolidation .................................................................................. 8
1.5 Impediments to the prompt transfer of capital ........................................................................... 11
1.6 Compliance with Basel III Pillar 3 disclosures ............................................................................... 11
2. Capital Management ............................................................................................................... 12
2.1 Regulatory capital - definition ...................................................................................................... 12
2.2 Preferred securities ...................................................................................................................... 13
2.3 Greek sovereign exposure ............................................................................................................ 13
2.4 European Central Bank’s 2015 Comprehensive Assessment ....................................................... 13
2.5 Eurobank’s capital enhancement actions .................................................................................... 15
2.6. Restructuring plan ....................................................................................................................... 15
2.7 Reconciliation of Balance Sheets - financial accounting to regulatory scope of consolidation ... 16
2.8 Regulatory capital ......................................................................................................................... 17
2.9 Capital requirement under Pillar 1 ............................................................................................... 19
2.10 Internal Capital Adequacy Assessment Process ......................................................................... 20
2.11 Internal Liquidity Adequacy Assessment Process ...................................................................... 21
3. Risk management overview ..................................................................................................... 22
3.1 Risk management objectives and policies .................................................................................... 22
3.2 Risk appetite framework .............................................................................................................. 22
3.3 Types of risk .................................................................................................................................. 23
3.4 Organization ................................................................................................................................. 23
4. Credit Risk ............................................................................................................................... 25
4.1 Definition of credit risk ................................................................................................................. 25
4.2 Credit risk organization and processes ......................................................................................... 25
4.3 Credit risk reporting ..................................................................................................................... 30
4.4 Credit exposures ........................................................................................................................... 31
4.5 Past due and impaired loans ........................................................................................................ 36
4.6 Impairment losses on loans and advances ................................................................................... 38
EUROBANK ERGASIAS S.A. Consolidated Pillar 3 Report
3 | Page 31 December 2015 Consol idated Pi l lar 3 Report
4.7 Standardised approach ................................................................................................................. 41
4.8 Internal Ratings Based (IRB) approach ......................................................................................... 43
4.9 Credit risk mitigation .................................................................................................................... 52
4.10 Asset Backed Securities .............................................................................................................. 56
5. Market Risk .............................................................................................................................. 58
5.1 Definition and policies .................................................................................................................. 58
5.2 Internal model - Value at Risk (VaR) model & Credit Risk (IRC) ................................................... 58
5.3 Standardised approach for market risk ........................................................................................ 60
5.4 Equity exposures not included in the trading book ..................................................................... 60
5.5 Interest rate risk not included in the trading book ...................................................................... 62
5.6 Counterparty risk .......................................................................................................................... 63
6. Operational Risk ...................................................................................................................... 66
6.1 Governance .................................................................................................................................. 66
6.2 Operational risk management framework ................................................................................... 66
6.3 Operational risk measurement..................................................................................................... 68
7. Asset Encumbrance ................................................................................................................. 69
7.1 Information on importance of encumbrance ............................................................................... 69
7.2 Assets ............................................................................................................................................ 70
7.3 Collateral received ........................................................................................................................ 70
7.4 Encumbered assets/collateral received and associated liabilities ............................................... 70
8. Leverage Ratio......................................................................................................................... 71
9. Liquidity Risk ........................................................................................................................... 74
Appendix 1: Transitional own funds disclosure ............................................................................. 76
Appendix 2: Capital instruments’ main features disclosure ............................................................ 78
EUROBANK ERGASIAS S.A.
Consolidated Pillar 3 Report
Introduction – General Information
4 | Page 31 December 2015 Consol idated Pi l lar 3 Report
1. Introduction – General Information
Eurobank Ergasias S.A. (the "Bank" or the "Group") is a credit institution based in Greece and is supervised on a stand alone and consolidated basis by the European Central Bank and the Bank of Greece. The Group is one of the four systemic banks in Greece, operating in key banking product and service markets. The Group offers a wide range of financial services to the retail and corporate clients. It has a strategic focus in Greece in fee-generating activities, such as asset management, private banking, equity brokerage, treasury sales, investment banking, leasing, factoring, life insurance, real estate and trade finance. The Group is also among the leading providers of banking services and credit to SMEs, small businesses and professionals, large corporates and households. Eurobank has an international presence in six countries outside of Greece, with operations in Romania, Bulgaria, Serbia, Cyprus, Luxembourg and the United Kingdom. In 2013, the Group expanded its operations through the acquisitions of New TT Hellenic Postbank S.A. (New TT HPB) and New Proton Bank S.A. (New Proton Bank) (the Acquisitions), which occurred in the context of the consolidation of the Greek banking sector. The Group acquired full ownership of New TT HPB and New Proton Bank on 30 August 2013. These Acquisitions improved the Group’s size and profile and had a positive impact on the Group’s liquidity and capital base. Following the Comprehensive Assessment (CA) results by ECB and in line with the new recapitalization framework, the
Bank submitted a capital plan to ECB for approval, describing in detail the measures it intends to implement in order to
cover the shortfall identified in the CA, for under both the baseline and the adverse scenario. On 16 November 2015,
the Bank announced that the SSM recognized € 83 million of capital generation that can be taken into account to reduce
its total capital shortfall as part of the CA, due to the positive difference between the realized pre provision income for
the third quarter of 2015 and the respective figure projected in the stress test (baseline scenario). On the same date,
the Bank’s Extraordinary General Meeting of the shareholders approved the increase of the Bank’s share capital of up to
€ 2,039 million. The said capital increase has been affected by means of a private placement to institutional and other
eligible investors in Greece and internationally through a book building process (Institutional Offering), with waiving of
the pre-emption rights of the Bank’s existing ordinary shareholders and preference shareholder.
In combination with the aforementioned share capital increase, a Liability Management Exercise (LME) was launched by
Eurobank on 29 October 2015 referring to the tender offer on € 877 million (face value) of outstanding eligible senior
unsecured, Tier 1 and Tier 2securities. The purchase proceeds from LME are to be used for the sole purpose of covering
part of the Bank’s share capital increase.
On 18 November 2015, the Bank announced that it has completed the aforementioned book building process. In
particular, indicative demand from investors in the Institutional Offering together with the preliminary results of Bank’s
LME were in excess of € 2,039 million and therefore were sufficient for Bank to raise such amount without seeking any
capital support from the HFSF.
The successful completion of Bank’s and other Greek systemic banks’ recapitalization process constitutes a key
milestone for rebuilding trust in the banking system and in the economy in general.

EUROBANK ERGASIAS S.A.
Consolidated Pillar 3 Report
Introduction – General Information
5 | Page 31 December 2015 Consol idated Pi l lar 3 Report
1.1 Regulatory framework
Basel II framework
In 1988, the Basel Committee on Banking Supervision developed a set of rules (the Basel Capital Accord, or Basel I) regarding the capital adequacy requirements for Banks. The main focus of Basel I was on credit risk with banks being required to hold capital of at least 8% of the risk weighted assets and off balance sheet commitments. Additional rules related to trading risk were added in 1996, in a European directive related to market risk. The need for a more risk sensitive approach to capital requirements, as well as the need to enhance the soundness and stability of the international banking system, led the Basel Committee on Banking Supervision to design a new worldwide framework known as Basel II. The new framework introduced a three pillar concept that seeks to align regulatory requirements with the economic principles of risk management. The Basel II framework is based on three mutually re-inforcing pillars: • Pillar 1 defines the minimum regulatory capital requirements, based on principles, rules and methods specifying
and measuring credit, market and operational risk. These requirements are covered by regulatory own funds, according to the rules and specifications of Pillar 1.
• Pillar 2 addresses the internal processes for assessing overall capital adequacy in relation to risks (Internal Capital Adequacy Assessment Process - ICAAP). Pillar 2 also introduces the Supervisory Review & Evaluation Process (SREP), which assesses the internal capital adequacy of credit institutions.
• Pillar 3 deals with market discipline by developing a set of disclosure requirements, which allow market participants to assess key pieces of information on the scope of application, capital, risk exposures, risk assessment processes and hence the capital adequacy of credit institutions.
CRD IV - Basel III framework
In June 2013 the European Parliament and the Council, published the Directive 2013/36/EU (known as CRD IV), effective from 1 January 2014, regarding the access to the activity of credit institutions and the prudential supervision of credit institutions and investment firms, amending Directive 2002/87/EC and repealing Directives 2006/48/EC and 2006/49/EC. It was subsequently transposed into Greek law by L.4261/2014 "Access to the activity of credit institutions and prudential supervision of credit institutions and investment firms", repealing Law 3601/2007, and other provisions. In addition, on the same date, the European Parliament and the Council, published the Regulation 2013/575/EU, which lays down uniform rules concerning general prudential requirements that institutions supervised under Directive 2013/36/EU shall comply with in relation to the following items: • Own funds requirements relating to quantifiable, uniform and standardised elements of credit risk, market risk,
operational risk and settlement risk • Requirements limiting large exposures • Liquidity requirements relating to quantifiable, uniform and standardised elements of liquidity risk • Reporting requirement related to above and to leverage; • Public disclosure requirements.
According to the new provisions (with gradual implementation until 2019): • Minimum Common Equity Tier 1 ratio will gradually increase to 4.5% from 1 January 2015; • Minimum Tier 1 ratio will gradually increase to 6% from 1 January 2015; • Banks will be required to gradually create a capital conservation buffer of 2.5% from 1 January 2019 (0.625% on 1
January 2016, 1.25% on 1 January 2017 and 1.875% on 1 January 2018) beyond the existing minimum capital. Conservation buffer is a capital buffer of 2.5% of total risk exposures of a bank that needs to be met with an additional amount of Common Equity Tier 1 capital.
EUROBANK ERGASIAS S.A.
Consolidated Pillar 3 Report
Introduction – General Information
6 | Page 31 December 2015 Consol idated Pi l lar 3 Report
As a result the minimum ratios which must be met, including the capital conservation buffer, and which shall apply from 1 January 2019 are: a) Minimum Common Equity Tier 1 capital ratio 7%; and b) Total capital adequacy ratio 10.5%. Additional capital buffers that CRD IV introduces are the following: a) Countercyclical buffer. The purpose of this buffer is to counteract the effects of the economic cycle on banks’
lending activity, thus making the supply of credit less volatile and possibly even reduce the probability of credit bubbles or crunches. On 18.12.2015 Bank of Greece issued the Executive Committee Act No. 55, where the countercyclical buffer is set as 0% for the first quarter of 2016.
b) Global systemic institution buffer. CRD IV includes a mandatory systemic risk buffer of Common Equity Tier 1 capital for banks that are identified by the relevant authority as globally systemically important.
c) Other systemically important institutions buffer. Furthermore, in June 2014, the European Commission published Regulation (EU) No 680/2014 of 16 April 2014, laying down implementing technical standards with regard to supervisory reporting of institutions according to Regulation (EU) No 575/2013 of the European Parliament and the Council. This Regulation lays down uniform requirements in relation to supervisory reporting to competent authorities for own funds requirements, losses stemming from lending collateralized by immovable property, large exposures, leverage ratio, Liquidity Coverage requirements and Net Stable Funding requirements.
Single Supervisory Mechanism
Pursuant to the proposal of the EU Commission dated 12 September 2012 as regards a Single Supervisory Mechanism (SSM), Council Regulation No 1024/2013 of 15 October 2013 was issued, which conferred specific tasks on the European Central Bank concerning policies relating to the prudential supervision of credit institutions. Furthermore, Regulation No 1022/2013 of the European Parliament and of the Council of 22 October 2013 was also issued, amending Regulation No 1093/2010 establishing the European Banking Authority (EBA) as regards the conferral of specific tasks on the European Central Bank pursuant to Council Regulation No 1024/2013. As of November 2014, the European Central Bank directly supervises the largest banks, while the national supervisors continue to monitor the remaining banks. The main task of the ECB and the national supervisors, working closely together within an integrated system, is to check that banks comply with the EU banking rules and tackle problems early on.
The SSM is one of the two pillars of the EU banking union, along with the Single Resolution Mechanism.
Single Rulebook
The Single Rulebook is the foundation of the banking union. It aims to provide a single set of harmonized prudential rules which institutions throughout the EU must comply with. These rules, among other things, lay down capital requirements for banks, ensure better protection for depositors, and regulate the prevention and management of bank failures.
Recovery and Resolution of Credit Institutions
On 15 May 2014 the European Parliament and the Council of the European Union adopted the BRRD which entered into force on 2 July 2014. The BRRD was transposed into Greek law by virtue of Law 4335/2015, which came into force on 23 July 2015, with the exception of its provisions on the bail-in tool which shall be applicable as at 1 January 2016.

EUROBANK ERGASIAS S.A.
Consolidated Pillar 3 Report
Introduction – General Information
7 | Page 31 December 2015 Consol idated Pi l lar 3 Report
The BRRD relies on a network of national authorities and resolution funds to resolve banks. Pursuant to Law 4335/2015, with respect to Greek credit institutions, the Bank of Greece has been designated as the national resolution authority and the Resolution Branch of the Hellenic Deposit and Investment Guarantee Fund (HDIGF) as the national resolution fund. The European Council has recognised that in the Banking Union, bank supervision and resolution need to be exercised uniformly, thus making obvious the need for the establishment of the single resolution mechanism (“SRM”), a single resolution board (“SRB”) and the SRF, and, in this context, the European Parliament and Council adopted Regulation No 806/2014 (the “SRM Regulation”).
Single Resolution Mechanism
The SRM Regulation builds on the rulebook on bank resolution set out in the BRRD and establishes the SRM, which complements the SSM and centralizes key competences and resources for managing the failure of any bank in the Euro zone and in other Member States participating in the Banking Union. The SRM Regulation also established the SRB, vested with centralized power for the application of the uniform resolution rules and procedures, and the SRF, supporting the SRM. The main objective of the SRM is to ensure that potential future bank failures in the banking union are managed efficiently, with minimal costs to taxpayers and the real economy. The SRB started its work as an independent EU agency on 1 January 2015 and will be fully operational from January 2016. Pursuant to the SRM Regulation, the authority to plan the resolution and resolve credit institutions which are subject to direct supervision by the ECB will be conferred from the current resolution authority, the Bank of Greece, to the SRB as at 1 January 2016.1.2 Implementation of Capital Adequacy framework at Eurobank Group.
1.2 Implementation of Capital Adequacy framework at Eurobank Group
1.2.1 Credit risk Eurobank Group (the "Bank" or the "Group") first applied the Basel II framework under the Standardised approach in January 2007 and included the respective risk asset ratio figures in its published financial statements. Until that date the Group had been applying the Basel I rules.
In June 2008, the Group received the approval of Bank of Greece to use the Internal Ratings Based (IRB) approach to calculate the capital requirement for credit risk. Therefore, with effect from 1 January 2008 the Group applies:
The Foundation IRB approach to calculate risk weighted assets for the corporate loans' portfolio of Eurobank Ergasias S.A. in Greece
The Advanced IRB for the majority of the retail loans' portfolio of the Bank, i.e. mortgages, small business lending, credit cards and revolving credits in consumer lending.
From September 2009 the Foundation IRB approach was applied for the corporate loans' portfolio of Eurobank Ergasias Leasing S.A. in Greece.
From March 2010 the Advanced IRB approach was applied for the Bank's portfolio of personal and car loans.
The implementation of IRB covers 73.8%of the Group's lending portfolio excluding portfolio segments which are immaterial in terms of size and risk profile. If we include the implementation of Basel II IRB methodology to NHPB Mortgage portfolio, which is subject to ECB approval, the ratio increases to 83.4%. There is a permanent exemption from the IRB approach, up to 10% of risk weighted assets, for which the Standardised
approach is applied. In addition to the exemption of up to 10% of risk weighted assets, permanent exemption has been
granted for the following exposure classes as prescribed in the CRD:
exposures to/or guaranteed by central governments and central banks;
exposures to/or guaranteed by credit and financial institutions; and
exposures to administrative bodies and non-commercial undertakings. The Standardised approach is applied for these exposures.

EUROBANK ERGASIAS S.A.
Consolidated Pillar 3 Report
Introduction – General Information
8 | Page 31 December 2015 Consol idated Pi l lar 3 Report
1.2.2 Market risk
The Bank uses its own internal Value at Risk (VaR) model to calculate capital requirements for market risk in its trading book, for the Bank's activities in Greece. The Bank received the official validation of its model for market risk by the Bank of Greece in July 2005. The model is subject to periodic review by the regulator. In 2011, the Bank updated its models and systems in order to fully comply with the new BoG Governor's Act 2646/2011 for the trading book capital. The Bank now calculates the capital for stressed VaR and IRC (incremental risk capital charge) beginning on 31.12.2011. For the measurement of market risk exposure and the calculation of capital requirements for the Bank's subsidiaries in Greece and in International operations, the Standardised approach is applied. Furthermore, the Bank calculates and monitors the market risk of the banking book for its operations in Greece on a daily basis using the internal VaR model. For its operations abroad, Eurobank applies sensitivity analysis, whereas the VaR methodology is applied on a monthly basis.
1.2.3 Operational risk Capitalizing on the provisions of Regulation (EU) No 575/2013, the Group uses the Standardised Approach (SA) to calculate the Pillar 1 regulatory capital charge for operational risk for its consolidated operations.
1.3 Scope of Pillar 3
The purpose of Pillar 3 report is to provide updated information on the Group's risk management practices, risk assessment processes and regulatory capital adequacy ratios.
Pillar 3 disclosures consist of both qualitative and quantitative information and are provided on a consolidated basis. They have been prepared in accordance with Regulation 2013/575/EU and according to the regulatory consolidation framework, which is described in the following paragraph.
1.4 Regulatory versus accounting consolidation
1.4.1 Accounting consolidation The accounting consolidation of the Group is based on the International Financial Reporting Standards (IFRS) and more specifically IFRS 10 Consolidated Financial Statements, IAS 28 Investments in Associates and Joint Ventures and IFRS 11 Joint Arrangements. Subsidiaries are all entities controlled by the Group. The Group controls an entity when it is exposed, or has rights to, variable returns from its involvement with the entity, and has the ability to affect those returns through its power over the entity. The Group consolidates an entity only when all the above three elements of control are present. Power is considered to exist when the Group’s existing rights give it the current ability to direct the relevant activities of the entity, i.e. the activities that significantly affect the entity’s returns and the Group has the practical ability to exercise those rights. Power over the entity may arise from voting rights granted by equity instruments such as shares or, in other cases, may result from contractual arrangements. Where voting rights are relevant, the Group is deemed to have control where it holds, directly or indirectly, more than half of the voting rights over an entity, unless there is evidence that another investor has the practical ability to unilaterally direct the relevant activities.

EUROBANK ERGASIAS S.A.
Consolidated Pillar 3 Report
Introduction – General Information
9 | Page 31 December 2015 Consol idated Pi l lar 3 Report
The Group may have power even when it holds less than a majority of the voting rights of the entity through a contractual arrangement with other vote holders, rights arising from other contractual arrangements, substantive potential voting rights, ownership of the largest block of voting rights in a situation where the remaining rights are widely dispersed (‘de facto power’), or a combination of the above. In assessing whether the Group has de facto power, it considers all relevant facts and circumstances including the relative size of the Group’s holding of voting rights and dispersions of holdings of other vote holders to determine whether the Group has the practical ability to direct the relevant activities. The Group is exposed or has rights to variable returns from its involvement with an entity when these returns have the potential to vary as a result of the entity’s performance. In assessing whether the Group has the ability to use its power to affect the amount of returns from its involvement with an entity, the Group determines whether in exercising its decision-making rights it is acting as an agent or as a principal. The Group acts as an agent when it is engaged to act on behalf and for the benefit of another party, and as a result does not control an entity. Therefore, in such cases, the Group does not consolidate the entity. In making the above assessment, the Group considers the scope of its decision-making authority over the entity, the rights held by other parties, the remuneration to which the Group is entitled from its involvement, and its exposure to variability of returns from other interests in that entity.
The Group has interests in certain entities which are structured so that voting rights are not the dominant factor in deciding who controls the entity, such as when any voting rights relate to administrative tasks only and the relevant activities are directed by means of contractual rights. In determining whether the Group has control over such structured entities, it considers the following factors:
The purpose and design of the entity;
Whether the Group has certain rights that give it the ability to direct the activities of the entity unilaterally;
The existence of any special relationships with the entity; and
The extent of the Group’s exposure to variability of returns from its involvement with the entity.
The Group reassesses whether or not it controls an entity if facts and circumstances indicate that there are changes to one or more elements of control. This includes circumstances in which the rights held by the Group and intended to be protective in nature become substantive upon a breach of a covenant or default on payments in a borrowing arrangement, and lead to the Group having power over the investee.
Subsidiaries are fully consolidated from the date on which control is transferred to the Group and are no longer consolidated from the date that control ceases. Investments in joint ventures (the contractually agreed sharing of control of an arrangement, which exists only when decisions about the relevant activities require the unanimous consent of the parties sharing control and, under which, the parties have rights to the net assets of the arrangement) and investments in associates (investments in which the Group has a significant influence, but which it does not control, generally holding between 20% and 50% of the voting rights) are also part of the accounting consolidation scope, but are accounted for using the equity method.
1.4.2 Regulatory consolidation The regulatory consolidation applied for reporting to the Bank of Greece follows the principles used for the accounting consolidation with certain differences, which are described below:
Participations in insurance companies are excluded from regulatory consolidation and are accounted for using the equity method and are deducted from regulatory capital subject to thresholds (refer to paragraph 2.1).
Participations in financial institutions with a holding percentage of more than 10% but less than 20%, subject to thresholds, are deducted from equity for the calculation of Basel III regulatory capital.
EUROBANK ERGASIAS S.A.
Consolidated Pillar 3 Report
Introduction – General Information
10 | Page 31 December 2015 Consolidated Pi l lar 3 Report
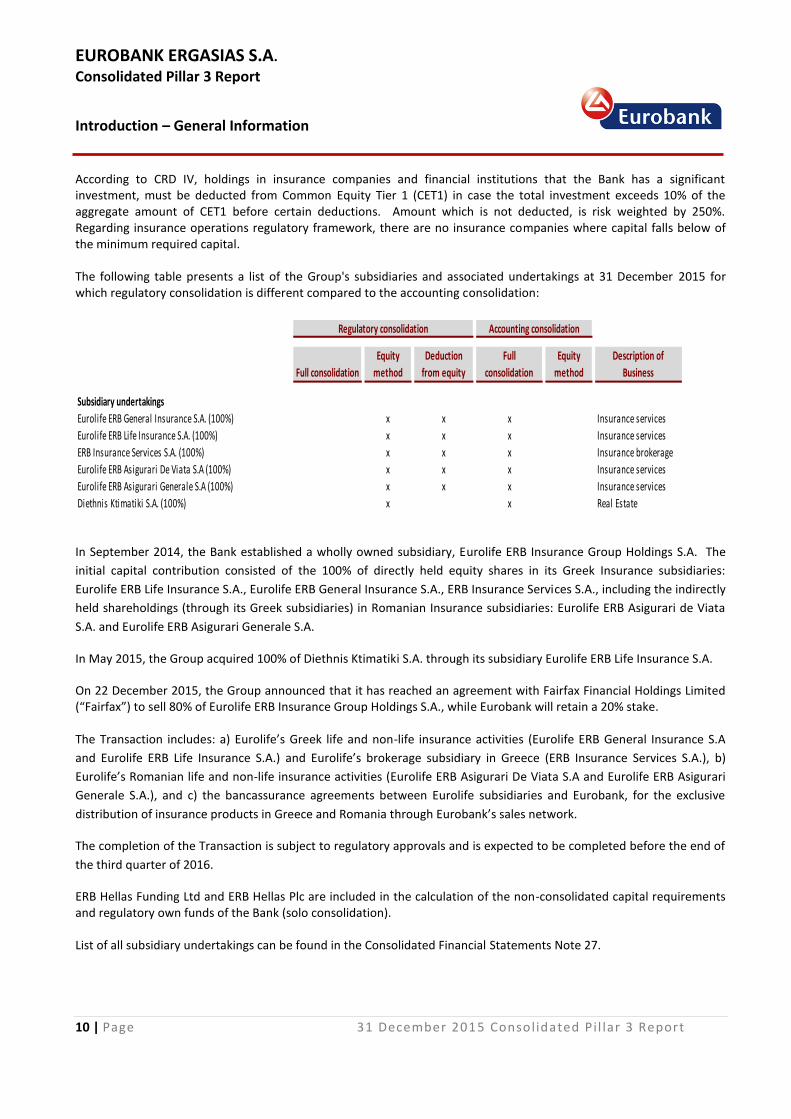
According to CRD IV, holdings in insurance companies and financial institutions that the Bank has a significant investment, must be deducted from Common Equity Tier 1 (CET1) in case the total investment exceeds 10% of the aggregate amount of CET1 before certain deductions. Amount which is not deducted, is risk weighted by 250%. Regarding insurance operations regulatory framework, there are no insurance companies where capital falls below of the minimum required capital. The following table presents a list of the Group's subsidiaries and associated undertakings at 31 December 2015 for which regulatory consolidation is different compared to the accounting consolidation:
Full consolidation
Equity
method
Deduction
from equity
Full
consolidation
Equity
method
Description of
Business
Subsidiary undertakings
Eurolife ERB General Insurance S.A. (100%) x x x Insurance services
Eurolife ERB Life Insurance S.A. (100%) x x x Insurance services
x x x Insurance brokerage
x x x Insurance services
x x x Insurance services
x x Real EstateDiethnis Ktimatiki S.A. (100%)
Regulatory consolidation Accounting consolidation
ERB Insurance Services S.A. (100%)
Eurolife ERB Asigurari De Viata S.A (100%)
Eurolife ERB Asigurari Generale S.A (100%)
In September 2014, the Bank established a wholly owned subsidiary, Eurolife ERB Insurance Group Holdings S.A. The
initial capital contribution consisted of the 100% of directly held equity shares in its Greek Insurance subsidiaries:
Eurolife ERB Life Insurance S.A., Eurolife ERB General Insurance S.A., ERB Insurance Services S.A., including the indirectly
held shareholdings (through its Greek subsidiaries) in Romanian Insurance subsidiaries: Eurolife ERB Asigurari de Viata
S.A. and Eurolife ERB Asigurari Generale S.A.
In May 2015, the Group acquired 100% of Diethnis Ktimatiki S.A. through its subsidiary Eurolife ERB Life Insurance S.A.
On 22 December 2015, the Group announced that it has reached an agreement with Fairfax Financial Holdings Limited (“Fairfax”) to sell 80% of Eurolife ERB Insurance Group Holdings S.A., while Eurobank will retain a 20% stake. The Transaction includes: a) Eurolife’s Greek life and non-life insurance activities (Eurolife ERB General Insurance S.A
and Eurolife ERB Life Insurance S.A.) and Eurolife’s brokerage subsidiary in Greece (ERB Insurance Services S.A.), b)
Eurolife’s Romanian life and non-life insurance activities (Eurolife ERB Asigurari De Viata S.A and Eurolife ERB Asigurari
Generale S.A.), and c) the bancassurance agreements between Eurolife subsidiaries and Eurobank, for the exclusive
distribution of insurance products in Greece and Romania through Eurobank’s sales network.
The completion of the Transaction is subject to regulatory approvals and is expected to be completed before the end of
the third quarter of 2016.
ERB Hellas Funding Ltd and ERB Hellas Plc are included in the calculation of the non-consolidated capital requirements and regulatory own funds of the Bank (solo consolidation). List of all subsidiary undertakings can be found in the Consolidated Financial Statements Note 27.
EUROBANK ERGASIAS S.A.
Consolidated Pillar 3 Report
Introduction – General Information
11 | Page 31 December 2015 Consolidated Pi l lar 3 Report
1.5 Impediments to the prompt transfer of capital
Subordinated loans given by the Bank to its subsidiaries, financial institutions operating outside Greece, are subject to local regulations and subsequently restrictions set by local laws and supervisory authorities. The most common of all restrictions is minimum duration (5 to 7 years in most cases) with no possibility of prepayment without prior permission by the respective supervisory authority.
1.6 Compliance with Basel III Pillar 3 disclosures
The Bank has issued an internal "Policy on compliance with Pillar 3 Disclosures" in order to ensure consistent and continuous compliance with the Pillar 3 disclosures requirements, as these have been specified in the existing regulatory framework. Within this framework the Bank operates as follows:
Pillar 3 disclosures are provided on a consolidated basis.
The Bank includes in its disclosures all information deemed necessary to provide users with a clear, complete and accurate view of the Group’s structure, capital management, risk management system, unencumbered assets and remuneration policy. During this procedure the Bank also identifies information that is material, confidential and proprietary.
Τhe Bank has opted to present the full set of Pillar 3 disclosures in a separate document “Consolidated Pillar 3 Report”, which is published annually on the Bank’s website, in conjunction with the date of publication of its financial statements. The Remuneration disclosures are published in a separate document.
The Bank re-examines the extent and type of information provided at each disclosure date and revises its policy as necessary.
The Bank assesses the need to publish some or all disclosures more frequently than annually, taking into consideration factors such as scale of operations, range of activities, presence in different countries, involvement in different financial sectors, participation in international financial markets and payment, settlement and clearing systems and paying particular attention to information on own funds, capital requirements, risk exposure and other items prone to rapid change.
The Audit Committee of the Bank is responsible for the procedures concerning the collection, processing and presentation of Pillar 3 disclosures, while the Board of Directors of the Bank is responsible for the accuracy of them.
The aforementioned responsibilities are equivalent to those in respect of the Bank's Consolidated Financial Statements.
EUROBANK ERGASIAS S.A.
Consolidated Pillar 3 Report
Capital management
12 | Page 31 December 2015 Consolidated Pi l lar 3 Report
2. Capital Management
The amount and quality of the capital held by the Group is subject to certain rules and guidelines. The composition of the Group's available regulatory capital under Pillar 1 is as follows:
2.1 Regulatory capital - definition
The Pillar 1 regulatory capital of the Group at consolidated level is calculated on the basis of IFRS figures and according to the rules set by the CRD IV. The available regulatory capital is classified under two main categories: Tier 1 and Tier 2capital. Tier 1 consists of Common Equity (CET1) and Additional Tier 1 capital. Common Equity Tier 1 (CET1) capital is composed of ordinary shareholders' equity, preference shares issued under Law 3723/2008 "Greek Economy Liquidity Support Program" and minority interest allowed in consolidated CET1, after deduction of: a) Fair value reserves related to gains or losses of cash flow hedges; b) gains and losses on market valuation of liabilities designated as fair-value-through-profit-or-loss attributable to
own credit risk; c) 40% phased-in deduction of goodwill and intangible assets; d) 40% phased-in deduction of deferred tax assets that rely on future profitability excluding those arising from
temporary differences; e) Participating interests and subordinated loans (and other capital instruments qualifying as own funds) of more
than 10% in not fully consolidated credit or other financial institutions, including insurance companies; f) 40% phase-in deduction of loan impairment allowances' shortage compared to IRB measurement of Expected
Loss; g) Deferred tax assets arising from temporary differences, which exceeds 10% threshold of CET1 capital before
certain deductions and h) The sum of e and g above that is less than 10% of CET 1 capital and exceeds 15% threshold of CET1 capital
before certain deductions. Expected Losses (EL) derived under Basel II rules represent losses that would be expected in a downturn scenario over a 12 month period. This definition differs from loan impairment allowances, which only address losses incurred within the lending portfolios at the balance sheet date and are not permitted to recognize the additional level of conservatism that the regulatory measure requires by the adoption of through-the-cycle, downturn conditions that may not exist at the balance sheet date. Additional Tier 1 capital consists of Preferred shareholders' equity that is subject to phase-out, 60% deductions of goodwill and intangible assets and 30% of loan impairment allowances' shortage, (that will be deducted from CET1 once Basel III is fully implemented. In case deductions of Tier 1 capital exceed positive amounts of Tier 1 capital, then the difference is deducted from CET1 capital. Tier 2capital is composed of the following items: • Long term subordinated liabilities that meet certain regulatory specified criteria, that is subject to phase-out and
the deduction of 30% of loan impairment allowances' shortage, that will be deducted from CET1 once Basel III is fully implemented;
• Fixed assets' revaluation reserve formed after 31 December 2003 (transition to IFRS), which is subject to phase out from Tier 2and phase-in to CET1;

EUROBANK ERGASIAS S.A.
Consolidated Pillar 3 Report
Capital management
13 | Page 31 December 2015 Consolidated Pi l lar 3 Report
• General credit risk adjustments up to 1.25% of risk weighted assets calculated under standardised approach; • Positive difference between the sum of impairment loss allowances for IRB exposures over the expected losses, up
to 0.6% of risk weighted assets calculated under IRB approach. In case deductions of Tier 2capital exceed positive amounts of Tier 2capital, then the difference is deducted from Tier 1 capital.
2.2 Preferred securities
As at 31 December 2015, the outstanding amount of preferred securities was € 43 million, 70% of which is classified as Additional Tier 1 capital. Under Basel III they qualify as grandfathered instruments and will gradually phase out until 2022. A list of the features of Bank's capital instruments in accordance with Annex III of the Commission Implementing Regulation (EU) No 1423/2013 is found in Appendix 2. On 29 October 2015, the Bank launched a Liability Management Exercise (LME), in combination with its share capital increase. On 23 November 2015, the Bank announced the aggregate purchase proceeds of the securities accepted as part of the LME amounted to € 418 million of which Tier 1 securities € 17 million, corresponding to face value of € 34 million (Series A: € 0.5 million, Series B: € 0.9 million, Series C: € 31.4 million, Series D: € 1.5 million). Detailed information regarding Preferred securities can be found in the Consolidated Financial Statements Note 41.
2.3 Greek sovereign exposure
As at 31 December 2015, the total carrying value of Greek sovereign major exposures is as follows:
2015 2014
€ million € million
2,157 2,410
1,677 1,584
992 1,102
208 204
176 198
86 103
17 20
- 107
5,313 5,728
Treasury bills
Reverse repo agreements with public organizations
Other receivables
Exposure relating with Greek sovereign risk financial guarantee
Derivatives with the Greek State
Greek government bonds
Loans guaranteed by the Greek State
Loans to Greek local authorities and public organizations
For more information please refer to Consolidated Financial Statements Note 5.
2.4 European Central Bank’s 2015 Comprehensive Assessment
The adverse economic conditions in Greece, especially since the second quarter of 2015, had a negative impact on the
liquidity of the Greek banks and raised concerns regarding their solvency position. In accordance with the preliminary
agreement of the 12 July 2015 Euro summit, the new ESM program would have to include the establishment of a buffer
of € 10 bn to € 25 bn for the banking sector in order to address potential bank recapitalization needs and resolution
costs and the ECB /SSM would conduct a Comprehensive Assessment (CA) of the supervised four Greek banks.
EUROBANK ERGASIAS S.A.
Consolidated Pillar 3 Report
Capital management
14 | Page 31 December 2015 Consolidated Pi l lar 3 Report
In this context, the CA was conducted taking into account the combined effect of:
An Asset Quality Review (AQR), by reviewing the quality of the banks’ Greek portfolios, including the adequacy of
asset and collateral valuation and related provisions; and
A forward looking Stress Test (ST) to examine the resilience of the banks’ balance sheet to a potential further
deterioration of market conditions.
Capital adequacy was assessed over a three-year time period (2015-2017) under two ST scenarios: baseline and
adverse. According to the ST process, the banks used as reference the preliminary data for the second quarter of 2015
and submitted their 3-year business plans built on base case assumptions: GDP growth as provided from ECB for 2015 -
2.3%, 2016 -1.3% and 2017 +2.7%, while the other assumptions, including credit and deposit growth, were based on the
four banks Economists’ consensus. These business plans were stress-tested by ECB under the baseline and adverse
scenarios to assess potential capital shortfalls.
On 31 October 2015, ECB announced the results of the CA on the four systemically important Greek banks, including the
Bank.
CA results for Eurobank
The CA results for Eurobank are summarized as follows:
AQR Results
The AQR constituted a thorough review of the carrying values of the Bank’s Greek portfolios as of 30 June 2015
encompassing 98% of the Greek portfolio. The AQR identified additional provisioning needs of € 1,906 million, primarily
driven by the deterioration in the macroeconomic environment in Greece, leading to a CET1 ratio of 8.6%, after taking
into account the entire amount of losses identified in the AQR. This implies a capital shortfall of € 339 million, relative to
the threshold of a CET1 ratio of 9.5%. The AQR-adjusted capital position provided the starting point for the Stress Test
(ST).
The 2015 AQR is a prudential exercise, which was performed under the same methodology as the 2014 AQR. The impact
of € 1,906 million relates mainly to provisions adjustments for loans and advances to customers of € 1,876 million, and
was determined according to the methodology that was developed by ECB for the purpose of the 2014 CA in order to
ensure consistency across banks without introducing greater prescription into the accounting rules outside of the
supervisory mechanisms.
Stress test Results
The ST under the baseline scenario has not triggered further negative impact on the Bank’s solvency position,
maintaining the post-AQR and baseline scenario CET1 at 8.6%, which corresponds to a capital shortfall of € 339 million,
relative to a CET1 ratio of 9.5%, which is the threshold in the baseline scenario of the ST.
The ST under the adverse scenario identified further negative impacts on the Bank’s solvency position, leading to a CET1
ratio of 1.3%, which implies a capital shortfall of € 2,122 million, relative to a CET1 ratio of 8%, which is the threshold in
the adverse scenario of the ST.
EUROBANK ERGASIAS S.A.
Consolidated Pillar 3 Report
Capital management
15 | Page 31 December 2015 Consolidated Pi l lar 3 Report
2.5 Eurobank’s capital enhancement actions
In early November, the Bank submitted a capital plan to the ECB for approval, describing in detail the measures it would
implement in order to cover the shortfall identified in the CA, for under both the base and the adverse scenario.
On 3 November 2015, the Bank’s Board of Directors (BoD), resolved to call an Extraordinary General Meeting on 16
November 2015 to approve a Share Capital Increase (SCI) of up to € 2,122 million. On 13 November 2015, the Single
Supervisory Mechanism of the ECB recognised €83 million of capital generation that could be taken into account to
reduce the Bank’s total capital shortfall identified as part of the CA. Following this recognition, the maximum amount of
capital to be raised through the SCI reduced to € 2,039 million.
The capital increase was affected by means of a private placement to institutional and other eligible investors in Greece
and internationally through a book building process (Institutional Offering), with waiving of the pre-emption rights of
the Bank’s existing ordinary shareholders and preference shareholder.
In combination with the aforementioned SCI a Liability Management Exercise (LME), was launched by Eurobank on 29
October 2015 referring to the tender offer on € 877 million (face value) of outstanding eligible senior unsecured, Tier 1
and Tier 2securities.
For further information refer to Consolidated Financial Statements Note 6.
2.6. Restructuring plan
On 29 April 2014, the European Commission approved the Bank’s restructuring plan, as it was submitted through the Greek Ministry of Finance on 16 April 2014. The Hellenic Republic committed that the Bank would implement specific measures and actions and achieve objectives which formed integral part of the said restructuring plan. In the context of the new recapitalization process, the restructuring plan was revisited and resubmitted for approval to
the European Commission. On 26 November 2015, the European Commission approved the Bank’s amended plan. The
macroeconomic assumptions for Greece used in the Bank’s plan were in line with those suggested by the European
Commission and the HFSF as of September 2015, which provided a positive real GDP growth rate and an improved
unemployment rate only from 2017 onwards.
The principal commitments of the revised restructuring plan will be implemented by 31 December 2018.
For further information refer to Consolidated Financial Statements Note 6.
Monitoring Trustee
The Memorandum of Economic and Financial Policies (MEFP) of the Second Adjustment Program for Greece between the Hellenic Republic, the European Commission, the International Monetary Fund (IMF) and the European Central Bank (ECB) provides for the appointment of a monitoring trustee in all banks under State Aid. On 22 February 2013, the Bank appointed Grant Thornton as its Monitoring Trustee (MT). The MT monitors compliance with commitments on corporate governance and commercial operational practices, and the implementation of the restructuring plan and report to the European Commission.

EUROBANK ERGASIAS S.A.
Consolidated Pillar 3 Report
Capital management
16 | Page 31 December 2015 Consolidated Pi l lar 3 Report
2.7 Reconciliation of Balance Sheets - financial accounting to regulatory scope of consolidation
Balance sheet per
published financial
statements
Deconsolidation of
insurance and
consolidation by
the equity method
Balance sheet per
regulatory scope of
consolidation
Balance sheet per
published financial
statements
Deconsolidation of
insurance and
consolidation by
the equity method
Balance sheet per
regulatory scope of
consolidation
Ref. € million € million € million € mill ion € mill ion € mill ion
Cash and Balances with central banks 1,798 - 1,798 1,948 - 1,948
Loans and advances to banks 2,808 - 2,808 3,059 (1) 3,058
Financial instruments at fair value through profit or loss 100 - 100 360 (275) 85
Derivative financial instruments 1,884 - 1,884 2,134 - 2,134
Loans and advances to customers 39,893 - 39,893 42,133 - 42,133
Investment securities 16,291 - 16,291 17,849 (1,510) 16,339
Investments in associated undertakings 10 384 394 6 333 339
Property, plant and equipment 666 - 666 702 (1) 701
Investment property 925 - 925 876 (2) 874
Intangible assets a 127 - 127 150 (2) 148
Deferred tax asset 4,859 - 4,859 3,894 (1) 3,893
b 319 - 319 353 - 353
c 4,540 - 4,540 3,541 (1) 3,540
Other assets 2,141 3 2,144 2,137 (74) 2,063
Assets of disposal group classified as held for sale 2,051 (1,921) 130 270 - 270
Total assets 73,553 (1,534) 72,019 75,518 (1,533) 73,985
Liabilities
Due to central banks 25,267 - 25,267 12,610 - 12,610
Due to other banks 4,516 - 4,516 10,256 - 10,256
Derivative financial instruments 2,359 - 2,359 2,475 - 2,475
Due to customers 31,446 178 31,624 40,878 (467) 40,411
Debt issued and other borrowed funds 150 101 251 811 259 1,070
Other l iabilities 742 3 745 2,020 (1,325) 695
Liabilities of disposal group classified as held for sale 1,941 (1,816) 125 164 - 164
Total liabilities 66,421 (1,534) 64,887 69,214 (1,533) 67,681
d 75 - 75 267 - 267
Equity - -
Ordinary share capital 656 - 656 4,412 - 4,412
Share premium e 8,055 - 8,055 6,682 - 6,682
Reserves and retained earnings (3,241) - (3,241) (6,485) - (6,485)
f (69) (69) (107) (107)
g - - 3 3
Preference shares h 950 - 950 950 - 950
Total equity attributable to shareholders of the Bank 6,420 - 6,420 5,559 - 5,559
Preferred securities i 43 - 43 77 - 77
Non controlling interests j 669 - 669 668 - 668
Total equity 7,132 - 7,132 6,304 - 6,304
Total equity and liabilities 73,553 (1,534) 72,019 75,518 (1,533) 73,985
31 December 2014
of which cash flow hedge reserves
of which own credit risk
31 December 2015
Assets
of which deferred tax assets that rely on future profitability
excluding those arising from temporary differences
of which deferred tax assets arising from temporary differences
of which tier 2 instruments subject to phase-out

EUROBANK ERGASIAS S.A.
Consolidated Pillar 3 Report
Capital management
17 | Page 31 December 2015 Consolidated Pi l lar 3 Report
2.8 Regulatory capital The table below shows the composition of the Group's regulatory capital at 31 December 2015 and 2014. Regulatory capital of 2015 and 2014 is calculated according to CRD IV transitional rules. In addition, in Appendix 1 a transitional own fund disclosure template can be found, which presents the components of regulatory capital on transitional and end-point basis as at 31 December 2015 and 2014. The disclosure has been prepared using the format set out in Annex VI of the "Commission Implementing Regulation (EU) No 1423/2013 of 20 December 2013 laying down implementing technical standards with regard to disclosure of own funds requirements for institutions according to Regulation (EU) No 575/2013 of European Parliament and of the Council".
31 December
2015
Pro-forma (1)
Ref. € million € mill ion € mill ion
Ordinary shareholders' equity e 5,470 4,609 4,609
Preference Shares h 950 950 950
Non controlling interests per balance sheet j 669 668 668
(268) (136) (136)
Regulatory adjustments
f 69 107 107
g - (3) (3)
(39) (52) (52)
a (51) (30) (30)
- (19) (19)
b (127) (71) (71)
c - - -
- - (35)
(50) (94) (94)
Common Equity Tier I capital 6,623 5,929 5,894
i 30 62 62
Regulatory adjustments
60% of intangible assets / 80 % for 2014 (76) (118) (118)
- (37) (37)
Other regulatory adjustments 46 93 93
6,623 5,929 5,894
Tier II capital - subordinated debt subject to phase out d 15 141 141
Fixed assets' revaluation reserve 39 52 52
- (37) (37)
IRB Excess of impairment allowances over expected losses eligible 94 - -
SA General credit risk adjustments 14 - -
Other regulatory adjustments - - -
6,785 6,085 6,050
38,888 39,062 36,430
17.0% 15.2% 16.2%
17.0% 15.2% 16.2%
17.4% 15.6% 16.6%
(1) pro-forma with the regulatory treatment of Deferred Tax Assets (DTAs) as Deferred Tax Credits (DTCs)
Total Capital Adequacy Ratio
Risk Weighted Assets
Ratios
Common Equity Tier I
Tier I
Cash flow hedge reserves
31 December 2014
Non controlling interests not allowed in consolidated CET1
Total Regulatory Capital
Own credit risk
Fixed assets' revaluation reserve
40% of intangible assets / 20% for 2014
40% of IRB shortfall of credit risk adjustments to expected
losses / 20% for 2014
40% of deferred tax assets that rely on future
profitability (excluding temporary differences) / 20% for 2014
Deferred tax assets arising from temporary differences (amount
above 10% threshold)
Amount exceeding the 15% threshold
Other regulatory adjustments
Preferred Securities subject to phase-out
Total Tier I capital
30% of impairment
allowances shortage over expected losses / 40% for 2014
30% of impairment allowances
shortage over expected losses/ 40% for 2014

EUROBANK ERGASIAS S.A.
Consolidated Pillar 3 Report
Capital management
18 | Page 31 December 2015 Consolidated Pi l lar 3 Report
The Common Equity Tier 1 ratio is defined as Common Equity Tier 1 capital divided by RWAs, the Tier 1 ratio is defined as Tier 1 capital divided by RWAs and Total Capital Adequacy ratio is defined as Total Regulatory Capital divided by RWAs. According to article 27A of the Law 4172/2013 as in force, which is applicable to Greek financial institutions, including
leasing and factoring companies, deferred tax assets that have been or will be recognized by the Bank due to (a) losses
from the Private Sector Involvement (‘PSI’) and the Greek State Debt Buyback Program, and (b) accumulated provisions
and other losses in general due to credit risk as such (provisions and credit losses) accounted as at 30 June 2015, will be
converted into directly enforceable claims (tax credit) against the Greek State, provided that the Bank’s after tax
accounting result for the period, is a loss (starting from fiscal year 2016 onwards).
On 7 November 2014, the Extraordinary General Meeting of the Shareholders of the Bank approved the Bank’s participation in the above described mechanism which is currently effective from fiscal year 2016 onwards. According to Regulation (EU) No. 575/2013, article 39, deferred tax assets that can be replaced with a tax credit, shall not be deducted from CET1, but instead be risk weighted by 100%. As at 31 December 2015, deferred tax assets that are eligible for tax credit amounted to € 4,065 (2014: €3,204 million). Loan impairment allowances surplus and general credit risk provisions amount to € 107 million (2014: loan impairment allowances’ shortage € 94 million), which are recognised as Tier 2capital. The Group has sought to maintain an actively managed capital base to cover risks inherent in the business. The adequacy of the Group's capital is monitored using, among other measures, the rules and ratios established by the Basel Committee on Banking Supervision ("BIS rules/ratios") and adopted by the European Union and the Bank of Greece in supervising the Bank. To this direction the Group, apart from the share capital increases which were completed in April 2014 and November 2015 (see Consolidated Financial Statements Notes 6 and 39), is focused on the organic strengthening of its capital position by active derisking of lending portfolios through tighter credit policies and change in the portfolio mix in favor of more secured loans as well as by proceeding to several strategic initiatives to internally generate capital. Finally, the Group is examining a number of additional initiatives for enhancing its capital base, associated with the management of non performing loans as well as with restructuring, transformation or optimization of operations, in Greece and abroad, that will generate or release further capital and/or reduce Risk Weighted Assets.

EUROBANK ERGASIAS S.A.
Consolidated Pillar 3 Report
Capital management
19 | Page 31 December 2015 Consolidated Pi l lar 3 Report
2.9 Capital requirement under Pillar 1
The table below shows the Group's risk weighted assets and capital requirements at 31 December 2015 and 2014. The capital requirement under Pillar 1 is calculated as 8% of risk weighted assets.
2015 2014 2015 2014
€ million € mill ion € million € mill ion
Credit risk (pursuant Standardised approach)
Central governments or central banks 5,550 1,901 444 152
Regional governments or local authorities 41 - 3 -
Public sector entities 5 44 0 4
Institutions 509 642 41 51
2,026 2,093 162 167
2,255 3,025 180 242
Secured by mortgages on immovable property (excluding past due) 1,639 1,583 131 127
Exposures in default 1,612 1,687 129 135
Items associated with particularly high risk 1,357 1,265 109 101
Covered bonds 48 46 4 4
55 45 4 4
Equity exposures 973 857 78 69
Other items (*) 2,973 3,060 238 245
Credit risk total, Standardised approach 19,043 16,248 1,523 1,301
Credit risk (pursuant IRB approach)
Corporates 8,513 9,447 681 756
Retail
- Secured by immovable property - non SME 4,749 3,895 380 312
- Qualifying revolving retail exposures 700 685 56 55
- SME exposures 907 982 73 78
- Other retail exposures 538 443 43 35
Equities (**) 127 97 10 8
Asset backed securities 38 63 3 5
Other non-credit-related assets
Credit risk total, IRB approach 15,572 15,612 1,246 1,249
Credit risk total 34,615 31,860 2,769 2,550
Counterparty risk 219 593 18 46
Market risk (pursuant Standardised approach)
- Traded debt instruments and CVA 169 63 13 5
- Equity instruments in the trading book 2 25 - 2
- Currencies and gold 436 388 35 31
Internal model approach (Value at Risk) 684 700 55 56
Market risk total 1,291 1,175 103 94
Operational risk 2,763 2,800 221 224
Total 31 December 38,888 36,428 3,111 2,914
Regulatory Capital 31 December 6,785 6,050
6,085
8%
of Risk Weighted Assets
(*) Other items include mainly fixed assets, equity and participations, weighted according to Standardised approach, and other assets.
(**) Equity exposures are calculated according to Simple risk weight method (Regulation EU 575 article 155 §2 ).
Risk Weighted Assets
Corporates (excluding past due and secured by real estate property)
Retail (excluding past due and secured by real estate property)
Claims in the form of collective investment undertakings (CIUs)
Pro-forma Regulatory Capital 31 December

EUROBANK ERGASIAS S.A.
Consolidated Pillar 3 Report
Capital management
20 | Page 31 December 2015 Consolidated Pi l lar 3 Report
2.10 Internal Capital Adequacy Assessment Process
The Internal Capital Adequacy Assessment Process (ICAAP) aims to identify and assess risks that are inherent in the Group’s business model, determine their materiality and allocation on an entity and Group level, evaluate risk monitoring and mitigation processes and quantify the relevant internal capital charge where appropriate so as to ensure the ongoing capital adequacy of the Group versus its risk profile. To accomplish these objectives, the ICAAP leverages upon and integrates the Group’s well-established activities on risk, capital and performance management, including in particular planning and monitoring, while also continuously refining its approach to ensure high standards of capital assessment and management. Oversight and ultimate responsibility for the ICAAP is held with the Board of Directors, which has assumed a leading role in developing a risk conscious organization and maintaining the Group’s risk management at high levels of sophistication. Its vision and guidance are distilled in the Group’s risk appetite, which describes the risk boundaries within which the Group is willing to operate. The risk appetite is: • Structured as a series of qualitative and quantitative statements, both on an overall level and per risk type, the
objective of which is to ensure adherence to regulatory requirements, guide the organization’s business growth and balance the advantages of a strong capital position with those of higher returns on equity through greater leverage;
• Revisited formally once a year or more frequently if the Board of Directors deems it necessary; • A means of communication across units and functions in the institution. Moreover, acting as an evaluation mechanism of the Group’s entire risk management framework, an integral component of ICAAP is the identification and assessment of current and emerging risks in terms of their materiality at Group level, thus allowing the organization to focus its resources and management attention to those risks that could potentially threaten its business or capital standing and ensuring that all material risks are properly managed and monitored. Material risks are evaluated qualitatively and quantitatively, as appropriate. The aggregation of the individual capital charges comprises the Group’s total internal capital requirement, meaning the amount of capital the Group needs to hold for the purpose of absorbing unexpected losses deriving from its risk profile. All categories of material risk are continuously managed and the relevant frameworks are constantly evaluated in order to identify ways of strengthening the risk management structure, enhance existing policies, establish new mitigation techniques or improve the internal capital charge calculation. Risk and capital management responsibility, including compliance with regulatory requirements and corporate policies, lies with the Group’s management. The Group uses the regulatory calculation of its required capital (“Pillar I required capital”) as a starting point for setting its internal capital, adjusting for additional capital where appropriate. Internal capital better represents the Group’s risk profile, compared to regulatory capital, since it takes into account a wider range of risks. This approach allows the Group to leverage its advanced infrastructure and also cover a wider range of risks. Regular scenario-based simulations and stress tests are also being used to assess specific risks as well as the overall risk profile. Stress tests can be classified as follows: • Risk specific stress tests, where model parameters are based on the severity and frequency of historic market
downturns as well as ad hoc scenarios selected by management; • Integrated stress tests across risks, which evaluate the resilience of the Group’s capital position in case of a
systemic deterioration of the business environment in a macroeconomic downturn.

EUROBANK ERGASIAS S.A.
Consolidated Pillar 3 Report
Capital management
21 | Page 31 December 2015 Consolidated Pi l lar 3 Report
The Group also develops forecasts on capital consumption and availability and integrates them to the strategic planning process so as to optimize capital return and allocation, whilst maintaining adequate capital levels. The results of the stress tests are utilized during the capital planning process to ensure that the contingency plans in place are adequate if stressed conditions materialize and to produce a set of plausible action plans to mitigate the impact of the stress scenario. The Group maintains adequate pre-provision earnings in the medium term and robust risk management practices while the capital actions already executed or underway allow the Group to meet both regulatory and internal capital requirements. As a result, the Group will be in a position to support the risk profile of its balance sheet and its business operations going forward, even under further extreme adverse conditions, should they materialize.
2.11 Internal Liquidity Adequacy Assessment Process
ILAAP is the internal process for the identification, measurement, management and monitoring of liquidity and it is being implemented by the institution according to Article 86 of Directive 2013/36/EU.
The Group’s ILAAP covers the following areas:
Liquidity and funding risk management framework: identification of the functions/units and management committees responsible for the policy making, management, control, monitoring and reporting of liquidity and funding;
Description of the liquidity and funding risks: comprehensive description of the liquidity and funding risks that the Group faces taking into account the current macro-economic environment and country-specific and idiosyncratic factors;
Liquidity risk monitoring process and stress testing: detailed description of the processes, tools and reports that the Group uses for the monitoring and the control of liquidity, with particular emphasis on the following: stress test analysis, liquidity buffer analysis, liquidity & funding indicators;
Contingency funding plan and liquidity & funding strategy: description of the contingency funding plan and the liquidity and funding strategy;;;
Information on strategy regarding liquidity buffers and collateral management;
Information of cost benefit allocation mechanism;
Information on intraday liquidity risk management.

EUROBANK ERGASIAS S.A.
Consolidated Pillar 3 Report
Risk management overview
22 | Page 31 December 2015 Consolidated Pi l lar 3 Report
3. Risk management overview
3.1 Risk management objectives and policies
The Group acknowledges that taking risks is an integral part of its business. Therefore, the Group’s management sets adequate mechanisms to identify those risks at an early stage and assesses their potential impact on the achievement of these objectives. Due to the fact that economic, industry, regulatory and operating conditions will continue to change, risk management mechanisms are set (and evolve) in a manner that enables the Group to identify and deal with the risks associated with those changes. Group's management body considers effective risk management as a top priority, as well as a major competitive advantage, for the organization. As such, the Group has allocated ample resources for upgrading its policies, methods and infrastructure, in order to ensure compliance the requirements of the ECB, the guidelines of EBA the guidelines of the Basel Committee for Banking Supervision and the best international practices. The Group implements a well defined credit approval process, independent credit reviews and overall effective risk management policies for credit, market, liquidity and operational risk, both in Greece and in each country of its international operations. The risk management policies implemented by the Bank and its subsidiaries are reviewed annually. The Group’s Risk Management System in place is documented and described in the internal document “Risk and Capital Strategy”, which covers the overall risk and capital strategy of the Group, including purpose and scope of risk strategy, risk management mission and objectives, definition of risks, risk management principles, risk appetite framework, risk governance framework, risk management capability objectives and key risk initiatives and performance measures of the risk & capital strategy. The Board Risk Committee (BRC) and the Group Chief Risk Officer (GCRO) formulate risk management strategy. The structure, internal procedures and control mechanisms ensure independence and sufficient supervision. The main risk management competences that have been delegated to the BRC relate to the design and the formulation of risk management strategy, the determination of the risk appetite framework, the assets-liabilities management and the creation of effective mechanisms of identifying, assessing and managing the risks that derive from the overall activities of the Group. The BRC consists of five non executive directors. The Risk Committee meets on a monthly basis and reports to the Board on a quarterly basis and on ad hoc instances. The BRC during 2015 has met ten (10) times. The Group’s Risk Management Division, which is headed by the GCRO, is independent from the business units and has full responsibility for monitoring operational, credit, market and liquidity risks of the Group. It comprises the Credit Sector, the Group Credit Control Sector, the Capital Adequacy Control & Regulatory Framework Sector, the International Credit Sector, the Group Market & Counterparty Risk Sector (GMCRS) and the Operational Risk Sector. Also, the GCRO has under his responsibility the subsidiary company Eurobank Property Services S.A. (EPS).
3.2 Risk appetite framework
The maximum amount of risk which the Group is willing to assume in the pursuit of its strategic objectives is articulated via a set of quantitative and qualitative statements for specific risk types, including specific tolerance levels as described in the Group’s Risk Appetite Framework. The objective is to guide the Group’s business growth, balance the advantages of a strong capital position with those of higher returns on equity through greater leverage, and to ensure the Group’s adherence to regulatory requirements. Risk appetite is clearly communicated throughout the Group, as it determines risk culture and forms the basis on which risk policies and risk limits are established at Group, business and regional level.

EUROBANK ERGASIAS S.A.
Consolidated Pillar 3 Report
Risk management overview
23 | Page 31 December 2015 Consolidated Pi l lar 3 Report
The Group’s Risk Appetite Framework comprises the following components: • Risk Bearing Capacity – this reflects the maximum level of risk at which the Group can operate within capital
constraints, funding needs and stakeholder obligations; • Risk Appetite – this reflects the maximum level of risk that the Group is willing to take in pursuit of its strategic and
business objectives. Risk Tolerance reflects the degree of management’s acceptance of current risk exposure levels, applicable to certain non-financial risks (e.g. operational risk) which are not actively taken but are tolerated;
• Risk Limits – these reflect specific exposure limiting values placed on specific measures designed to prevent risk exposures from exceeding predefined risk appetite thresholds. Limits are monitored on an ongoing basis.
The Group’s Risk Appetite Statements cover the following broad risk categories:
Capital adequacy and leverage
Credit risk
Market risk
Operational risk
Liquidity risk
Country risk
Business risk
Earnings risk
Strategic risk
Reputational risk
Model risk The Risk appetite framework is appropriately documented. The BRC and the BoD review and approve the risk appetite statements and thresholds on an annual basis to ensure that it is consistent with the Group’s strategy, business environment and stakeholder requirements. Setting risk appetite aims to ensure that risk is proactively managed to the level desired and approved by the BRC. Risk appetite tolerance limits are set at different trigger levels, with clearly defined escalation requirements which enable appropriate actions to be defined and implemented in a timely manner. In cases where the tolerance levels are breached, it is the responsibility of relevant units to bring it to the attention of the BRC. Management, at all levels, has the responsibility to monitor and manage risk exposures to remain within risk appetite levels and to ensure an appropriate level of risk is assumed to achieve business objectives.
3.3 Types of risk
The Group is exposed to various types of risk that are managed at various levels of the organization. The most important types of risk are: • credit risk; • market risk and liquidity risk; • operational risk. The individual risk types are defined in the subsequent sections.
3.4 Organization The risk management functions of the BRC are performed by the GCRO and risk management sectors, which cover the following areas: • Credit risk; • Market, Counterparty and Liquidity risk; • Operational risk.

EUROBANK ERGASIAS S.A.
Consolidated Pillar 3 Report
Risk management overview
24 | Page 31 December 2015 Consolidated Pi l lar 3 Report
• Basel III IRB approach compliance for significant part of Group loan for Eurobank's consolidated operations; portfolios;• Advanced IRB for all retail portfolios risk framework & risk management (consumer, mortgage, small business) system implemented Group-wide; and Foundation IRB for Corporate;• Independent and centralised approval for Trading book (stressed VaR and IRC); (RCSA) system; • Operational risk events collection system;
• Systematic follow up of credits; against approved VaR limits; • Key Risk Indicator (KRI) set-up • Differentiated credit scoring system • VaR methodology used for business & monitoring; for consumer and small business decisions; • Operational risk scenario analysis banking, full financial and sectoral • Considerable stress testing analysis for corporates; development for non normal market • Operational risk reporting based on independent credit rating conditions;• Disciplined provisioning policy results monitored on a continuous basis; programs under way throughout (wholesale) and statistical portfolio • Liquidity ratios and liquidity stress test • A number of operational risk mitigation behaviour (retail); LCR is calculated and monitored on programs under way throughout • Regular and ad hoc reporting to a monthly basis; the Group; Senior Management (Executive • Daily monitoring of credit risk of • Center of competence for counter - fraud Board Committee, Board of Directors, derivatives' positions using PFE activity, coordinating & monitoring Board Risk Committee) methodology; respective initiatives. regarding progress of portfolios • The operation and the monitoring and evolution of provisions. of credit risk mitigation contracts
(ISDA/CSA, GMRA) is done on a daily basis through an appropriate tool;• Country risk, Counterparty and Issuer Risk monitored daily on a Group level through a centralized counterparty risk monitoring tool;• CVA modelling;• International operations: market risk for all International subsidiaries managed centrally in Greece.
Group Chief Risk Officer (GCRO)
Credit Risk Market, Counterparty & Liquidity Risk Operational Risk
• First Greek bank with complete and • Basel III Standardised Approach (SA)
• All market risks monitored daily
(stress testing);
(internal & external);
validated market risk management system by local regulator (Bank • Documented and functioning operational of Greece), which covers both trading and banking books;• Compliance with new CRD IV rules • Risk & Control Self Assessment program

EUROBANK ERGASIAS S.A.
Consolidated Pillar 3 Report
Credit Risk
25 | Page 31 December 2015 Consolidated Pi l lar 3 Report
4. Credit Risk
4.1 Definition of credit risk
Credit risk is the risk that a counterparty will be unable to fulfill its payment obligations in full when due. Credit risk also includes country, dilution and settlement risk. Country risk is the risk of losses arising from economic difficulties or political unrest in a country, including the risk of losses following nationalization, expropriation and debt restructuring. Settlement risk is the risk arising when payments are settled, for example for trades in financial instruments, including derivatives and currency transactions. The risk arises when the Group remits payments before it can ascertain that the counterparties’ payments have been received. Credit risk arises principally from the corporate and retail lending activities of the Group, including from credit enhancement provided, such as financial guarantees and letters of credit. The Group is also exposed to credit risk arising from other activities such as investments in debt securities, trading activities, capital markets and settlement activities. Credit risk is the single largest risk the Group faces. It is rigorously managed and is monitored by centralized dedicated risk units, reporting to the GCRO.
4.2 Credit risk organization and processes
4.2.1 Credit risk organization
The diagram above depicts the organizational structure of credit risk of the Bank. The functions of each sector are described below. The organization of the credit risk divisions of the Group’s subsidiary banks in International operations (Bulgaria, Romania, Serbia, Cyprus, Luxembourg and Ukraine) also follows the model of the Bank depicted above. The Risk Executive of each subsidiary bank reports directly to GCRO.
Approval Monitoring
Credit
Sector
Credit
Control
Sector
International Credit
Sector
Group Chief Risk Officer
Capital Adequacy Control
& Regulatory Framework
Sector (Credit Risk)

EUROBANK ERGASIAS S.A.
Consolidated Pillar 3 Report
Credit Risk
26 | Page 31 December 2015 Consolidated Pi l lar 3 Report
4.2.2 Credit approval process
The credit approval and credit review processes are centralized both in Greece and in International operations. The segregation of duties ensures independence among those responsible for the customer relationship, the approval process and the loan disbursement, as well as monitoring of the loan during its lifecycle. The Credit approval process in Corporate Banking is centralized through credit committees with escalating Credit Approval Levels, in order to manage the corporate banking credit risk. Indicatively such committees are: • Credit Committees which are authorized to approve new limits, renewals or amendments to existing limits, in
accordance with their approval authority level, depending on total customer exposure and customer risk category (i.e. high, medium or low), as well as the value and type of security;
• Regional Credit Committee, being Head Office committees which approve limits for International Operations in excess of each country’s approval authority, depending also on customer risk category;
• Special Handling Credit Committees which decide on credit issues and actions to be taken for specific cases of problematic loans.
The Credit Committees meet on a weekly basis or more frequently, if needed. The Credit Sector of the Risk Management General Division independently reviews credit proposals. More specifically the main responsibilities of the Group Credit Sector are:
The review and evaluation of credit requests and proposals by: - All (domestic) large and medium scale corporate entities of every risk category; - Specialised units as Shipping, Commercial Real Estate, Hotel & Leisure, Structured Finance and Global
Corporate Clients; - Retail sector customers (small business and household lending) above a predetermined threshold;
The issuance of an independent risk opinion for each credit request, which includes: - Assessment of the customer credit profile based on the risk factors identified (market, operations, structural
and financial); - A focused sector analysis; - Recommendations to structure a bankable, well-secured and well-controlled transaction;
Confirmation of the ratings of each separate borrower, to reflect the risks acknowledged; and
Participation with voting rights in all credit committees, as per credit approval procedures. The Group Credit Sector is also responsible for the maintenance of the credit approval archives of the Bank, and with respect to the meetings of all of the Credit Committees, the preparation of meeting agendas, distribution of materials and preparation of minutes. The Group Credit Sector provides specialised knowledge and expertise and supports other departments in relation to operational and credit procedures, as well as collateral and securities’ policies. The approval process for loans to small businesses (turnover up to € 2.5 million) is centralized following specific guidelines for eligible collaterals as well as the ‘four-eyes’ principle. The assessment is based on an analysis of the borrower's financial position and statistical scorecards. The credit approval process for Household Lending (consumer and mortgage loans) is centralized. It is supported by specialized credit scoring models and the application of credit criteria based on the payment behavior of borrowers, the type and quality of collateral, the existence of real estate property, and other factors. The ongoing monitoring of portfolio quality and performance of any deviations, leads to an immediate adjustment of the credit policy and procedures, when deemed necessary.
Lending approval processes in all bank subsidiaries throughout International operations comply in full with the standards applicable to the parent Bank in Greece. In order to ensure full harmonization with Group standards and in

EUROBANK ERGASIAS S.A.
Consolidated Pillar 3 Report
Credit Risk
27 | Page 31 December 2015 Consolidated Pi l lar 3 Report
the light of increased credit risk management demands for the corporate business in New Europe countries, International Credit Sector was established in April 2008. The primary activities of the Sector are: • Participation and administrative support to the delegated International Credit Committees and Special Handling
Committees of wholesale obligors; • Continuous support to the Credit Risk Units by means of providing training and advisory; • Origination and follow-up of the International Credit Policy Manual (Wholesale Banking); • Coordination and overall responsibility of the Country Risk Committees: • Implementation of special Credit related projects and • To monitor wholesale lending portfolio (in co-operation with Group Credit Control).
4.2.3 Credit risk monitoring
The quality of the Group’s loans portfolios (business, consumer and mortgage in Greece and abroad) is monitored and assessed by the Group Credit Control Sector (GCCS). The Sector operates independently from all the business units of the Bank and reports directly to the GCRO. The Credit Control Sector's key activities include: • monitoring and reviewing the performance of all loan portfolios of the parent bank and its subsidiaries in Greece
and South Eastern Europe; • conducting field reviews and preparing written reports to management on the quality of loans for all of the
Group's lending units; • supervising and controlling the credit control functions in the subsidiary Banks and financial institutions in South
Eastern Europe; • Reviewing credit policies in order to be submitted to the GCRO for final approval; • supervising, supporting and validating the Moody’s Risk Advisor (MRA), used to assign borrower ratings to
corporate lending customers; • creating, overseeing and supporting the Transactional Rating (TR) application, used for the Wholesale lending
portfolio, to measure the overall risk of the credit relationship taking into account both the creditworthiness of the borrower and required collaterals;
• regular monitoring and monthly/quarterly reporting to Eurobank's BRC and quarterly reporting to Eurobank’s BoD asset quality issues;
• Preparing the proposals of the provisioning policy and regularly reviewing the adequacy of provisions for all portfolios in Greece and in International;
• Giving opinion for new lending products and restructuring/rescheduling schemes; • attending meetings of Credit Committees, Special Handling Committees and Non-Performing Loans Committee
without voting right; and • Participating in the Troubled Assets Committee and in the Loans and Products Committee. The main responsibilities of the Capital Adequacy Control & Regulatory Framework Sector are to develop and maintain the Internal Ratings Based (IRB) approach in accordance with the Basel framework and the Capital Adequacy Directive (CRD) for the loans portfolio of the Group; to measure and monitor loan portfolios capital requirements and to manage credit risk regulatory related issues, such as Asset Quality Reviews (AQR) and stress tests. The Sector reports to the GCRO. The main activities of Capital Adequacy Control & Regulatory Framework Sector are: • Management of external Asset Quality Reviews (Bank of Greece, ECB); • Development, implementation and validation of IRB models of Probability of Default (PD), Loss Given Default (LGD)
and Exposure at Default (EAD) for evaluating credit risk; • Measurement and monitoring of risk parameters and capital adequacy calculations (Pillar I) and preparation of
relevant management, as well as, regulatory reports (COREPs, SREP);

EUROBANK ERGASIAS S.A.
Consolidated Pillar 3 Report
Credit Risk
28 | Page 31 December 2015 Consolidated Pi l lar 3 Report
• Performing stress tests; • Development and maintenance of macro-economic models for the loan portfolios of the Group; • Preparation of credit risk analyses for Internal Capital Adequacy Assessment (ICAAP) / Pillar II purposes; • Preparation of Basel Pillar III disclosures; • Participation in the preparation of the capital and the restructuring plan of the Group in relation to asset quality
and capital requirements for the loan book; • Support the business units in the use of IRB models in business decisions and the development and usage of risk
related metrics such as Risk Adjusted Return on Capital (RAROC) etc.; • Monitoring of the regulatory framework in relation to the above; performing impact assessment; initiating and
managing relevant projects. All International bank subsidiaries apply the same credit risk management structure and control procedures as the parent Bank, reporting directly to the Group Chief Risk Officer. Risk management policies and processes are approved and monitored by the credit risk Sectors of the parent bank ensuring that group guidelines are in place and credit risk strategy is uniformly applied across the Group. The Group structures the levels of credit risk it undertakes by placing limits on the amount of risk accepted in relation to one borrower, or groups of borrowers, and to industry segments. The exposure to any one borrower including banks and brokers is further restricted by sub limits covering on and off-balance sheet exposures, and daily delivery risk limits in relation to trading items such as forward foreign exchange contracts. Such risks are monitored on a revolving basis and are subject to an annual or more frequent review. Risk concentrations are monitored regularly and reported to the BRC.
4.2.4 Troubled Assets Management
The Bank utilizes a robust and interactive governance model for the management of troubled assets, which strengthens
the Bank’s borrower centric approach, through remedial management demarcation of the Business Units. The target is
to reinstate customers' solvency, reduce overall handling costs for delinquent accounts and improve the portfolio
profitability by maintaining low portfolio delinquency rates and facilitating negotiations with delinquent customers.
This approach is supported by a combination of experienced personnel and statistical analysis, which highlights the
trends and the high risk areas.
Following the publication of the Bank of Greece Executive Committee’s Act No.47/9.2.2015 that details the supervisory
directives for the administration of exposures in arrears and non-performing loans, the Bank has responsibly proceeded
with a number of initiatives to adopt the regulatory requirements and empower the management of troubled assets. In
particular, the Bank transformed its troubled assets operating model into a vertical organizational structure through the
establishment of the Troubled Assets Committee (TAC) and Troubled Assets Group General Division (TAG).
Following the report of BlackRock (for Troubled Assets Review) and the instructions of Bank of Greece, a Troubled Assets Committee has been established at top management level, chaired by GM of Troubled Assets Group and reporting to the BRC.
The main responsibilities of the Troubled Assets Committee are the following:
Sets the Arrears and Non-Performing Loans Strategy consistent with the Bank’s Business Objectives, subject to the guidelines specified by BoG, ensuring the availability of necessary technical resources and personnel for the management of the Arrears and Non-Performing Loans;
Ensures the implementation of the Code of Conduct according to the legislation;
Receives, reviews and evaluates all the internal reports regarding the management of the Arrears and Non-Performing Loans according to BoG requirements;
EUROBANK ERGASIAS S.A.
Consolidated Pillar 3 Report
Credit Risk
29 | Page 31 December 2015 Consolidated Pi l lar 3 Report
Sets the Policies of Management and Monitoring of Arrears and Non-Performing Loans, the available types of restructuring and settlements, as well as the monitoring of their effectiveness via appropriate performance indicators;
Sets and validates the criteria to assess the sustainability of every restructuring and final solution offered;
Determines the parameters and the responsibilities of the units and persons involved in the evaluation of the sustainability and suitability of the proposed restructuring type, as well as the monitoring of its implementation;
Designs, monitors and evaluates (potentially in collaboration with the Business Units) the new restructuring solutions’ pilot tests;
Monitors on a monthly basis the effectiveness and the progress of the management of Arrears and Non-Performing Loans;
Reviews and re-evaluates in frequent basis the strategic guidelines of the management of Arrears and Non-Performing Loans;
Coordinates and evaluates proposals for the sale of Troubled ANPLs and other assets (i.e. Real Estate and Other), owned by the Bank, as well as for potential outsourcing of ANPLs management to third parties.
The TAG, with a direct reporting line to the Chief Executive Officer, is the overall responsible body for the management
of Group’s troubled assets portfolio for the whole process, from the pre-delinquency status in case of high risk
exposures up to legal workout. It comprises the Retail Remedial General Division, the Corporate Special Handling Sector,
the Non-Performing Clients Sector, the Retail Credit Remedial Sector and the TAG Risk Management & Business Policies
Sector.
Since the advent of the financial crisis, the Bank has initiated a number of strategic initiatives with respect to collections
and remedial management which include the following:
• Clear demarcation line between performing business and troubled assets management to allow focused & efficient
Troubled Assets Management;
• Ensured direct top management involvement in troubled assets management and close monitoring of the respective portfolio;
• Reinforcement of FPS and use of risk based collections at customer level for Retail portfolio;
• Early intervention to prevent NPL formation and development of early warning models to predict the probability of
an account to roll into delinquency;
• Rigorous real estate property search and mechanisms for converting unsecured lending to secured;
Deployed a sound credit workout strategy through innovative propositions that lead to viable solutions, ensuring a consistent approach for managing troubled assets across portfolios;
Ensured a consistent approach for managing troubled assets across portfolios;
Targeted risk mitigating actions to ensure portfolio risk reduction;
Defined criteria to assess the sustainability of proposed forbearance or resolution and closure measures and design decision trees.
The Financial Planning Services (FPS) Subsidiary
Financial Planning Services (FPS) is the Bank’s subsidiary fully dedicated to the remedial management of Individual Banking products. It is involved in all stages of the loan remedial cycle, including collections and pre-legal stages for both consumer and mortgage loans and legal stages for unsecured consumer loans only. FPS ensures that internal and external collection resources are focused and allocated appropriately and efficiently. The installation of a customized collections management system and an automated dialer has enhanced the operational efficiency of collections.

EUROBANK ERGASIAS S.A.
Consolidated Pillar 3 Report
Credit Risk
30 | Page 31 December 2015 Consolidated Pi l lar 3 Report
Moreover, FPS is responsible for:
Delinquent borrowers communication (through “Eurobank Remedial Services” (ERS) and the Bank’s call center) in order to collect or propose loan modifications;
Remedial channels’ coordination;
Delinquent borrowers’ performance monitoring;
Pre-legal and legal actions.
Non Performing Clients Sector
Non Performing Clients Sector (NPCS) is an independent unit with direct report to the Troubled Assets Group Head,
responsible for the Collateral Workouts and legal actions enforcement and liquidations acceleration. NPCS is engaged in
the management of the non-performing borrowers via close cooperation with the Remedial units and Litigation
Counsel’s Office in order to gain from the synergies that may arise.
4.2.5 Recent developments
The financial crisis in the Greek economy and the high rates of unemployment has resulted to the significant reduction of consumers' disposable income. Also the profitability of all types of companies (small, medium and large) has deteriorated during this period thus creating problems to the regular service of their financial obligations. NPLs in the Greek banking sector increased from 4.6% in 2007 to 34.3% in 2014. In 2014, real GDP growth turned positive at 0.8%, for the first time after six years in recession, mainly due to significant improvement in revenues from the tourism sector. In 2015, however, the increased political uncertainty, the imposition of capital controls and the need for a new bank recapitalization process led to a deterioration of the real GDP. In 2015 the real GDP is expected to decrease by -0.2%. The economic activity was mainly supported by the strong tourism revenue (2015 was a record year both in terms of the number of tourists arrivals and of the total revenues), while on the other hand there was a recession in the retail trade activity (all relative indices were negative in 2015).
4.3 Credit risk reporting
Group Credit Control and Capital Adequacy Control Sectors regularly prepare a detailed analysis of information to quantify, monitor and evaluate risks, as well as provide support to implement the BRC risk management decisions. It has a fixed reporting cycle to ensure that the relevant management bodies, including the Board of Directors Risk Committee, are updated on an ongoing basis on the developments in the credit portfolio. The principal risk reports submitted to the relevant management bodies, on a quarterly basis, deal with the following topics:
The quality of the Group’s portfolio: Analysis of provisions for impairment and losses by business unit. Portfolio breakdowns and evolution by rating category, size, delinquency, industry, tenor, vintage and collateralisation (e.g. LTV bands) etc.
Large exposures: - An overview of the twenty largest exposures (for Greece and International subsidiaries), as well as the credit limits above € 60 million. -The largest problematic and non performing exposures (o/s balances, collaterals, provisions).
Forborne loans evolution Analysis by portfolio, delinquency status; impairment levels and evolution over time.
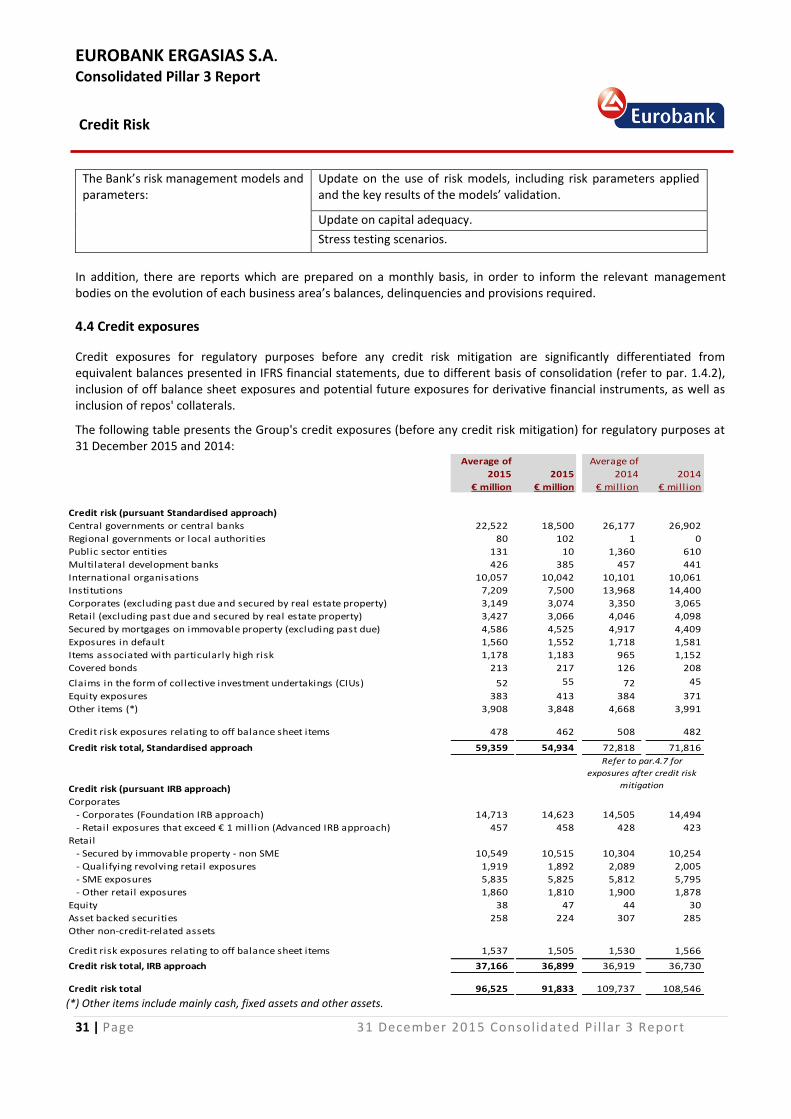
EUROBANK ERGASIAS S.A.
Consolidated Pillar 3 Report
Credit Risk
31 | Page 31 December 2015 Consolidated Pi l lar 3 Report
The Bank’s risk management models and parameters:
Update on the use of risk models, including risk parameters applied and the key results of the models’ validation.
Update on capital adequacy.
Stress testing scenarios.
In addition, there are reports which are prepared on a monthly basis, in order to inform the relevant management bodies on the evolution of each business area’s balances, delinquencies and provisions required.
4.4 Credit exposures
Credit exposures for regulatory purposes before any credit risk mitigation are significantly differentiated from equivalent balances presented in IFRS financial statements, due to different basis of consolidation (refer to par. 1.4.2), inclusion of off balance sheet exposures and potential future exposures for derivative financial instruments, as well as inclusion of repos' collaterals. The following table presents the Group's credit exposures (before any credit risk mitigation) for regulatory purposes at 31 December 2015 and 2014:
Average of
2015 2015
Average of
2014 2014
€ million € million € mill ion € mill ion
Credit risk (pursuant Standardised approach)
Central governments or central banks 22,522 18,500 26,177 26,902
Regional governments or local authorities 80 102 1 0
Public sector entities 131 10 1,360 610
Multilateral development banks 426 385 457 441
International organisations 10,057 10,042 10,101 10,061
Institutions 7,209 7,500 13,968 14,400
Corporates (excluding past due and secured by real estate property) 3,149 3,074 3,350 3,065
Retail (excluding past due and secured by real estate property) 3,427 3,066 4,046 4,098
Secured by mortgages on immovable property (excluding past due) 4,586 4,525 4,917 4,409
Exposures in default 1,560 1,552 1,718 1,581
Items associated with particularly high risk 1,178 1,183 965 1,152
Covered bonds 213 217 126 208
Claims in the form of collective investment undertakings (CIUs) 52 55 72 45
Equity exposures 383 413 384 371
Other items (*) 3,908 3,848 4,668 3,991
Credit risk exposures relating to off balance sheet items 478 462 508 482
Credit risk total, Standardised approach 59,359 54,934 72,818 71,816
Credit risk (pursuant IRB approach)
Corporates
- Corporates (Foundation IRB approach) 14,713 14,623 14,505 14,494
- Retail exposures that exceed € 1 mill ion (Advanced IRB approach) 457 458 428 423
Retail
- Secured by immovable property - non SME 10,549 10,515 10,304 10,254
- Qualifying revolving retail exposures 1,919 1,892 2,089 2,005
- SME exposures 5,835 5,825 5,812 5,795
- Other retail exposures 1,860 1,810 1,900 1,878
Equity 38 47 44 30
Asset backed securities 258 224 307 285
Other non-credit-related assets
Credit risk exposures relating to off balance sheet items 1,537 1,505 1,530 1,566
Credit risk total, IRB approach 37,166 36,899 36,919 36,730
Credit risk total 96,525 91,833 109,737 108,546
Refer to par.4.7 for
exposures after credit risk
mitigation
(*) Other items include mainly cash, fixed assets and other assets.
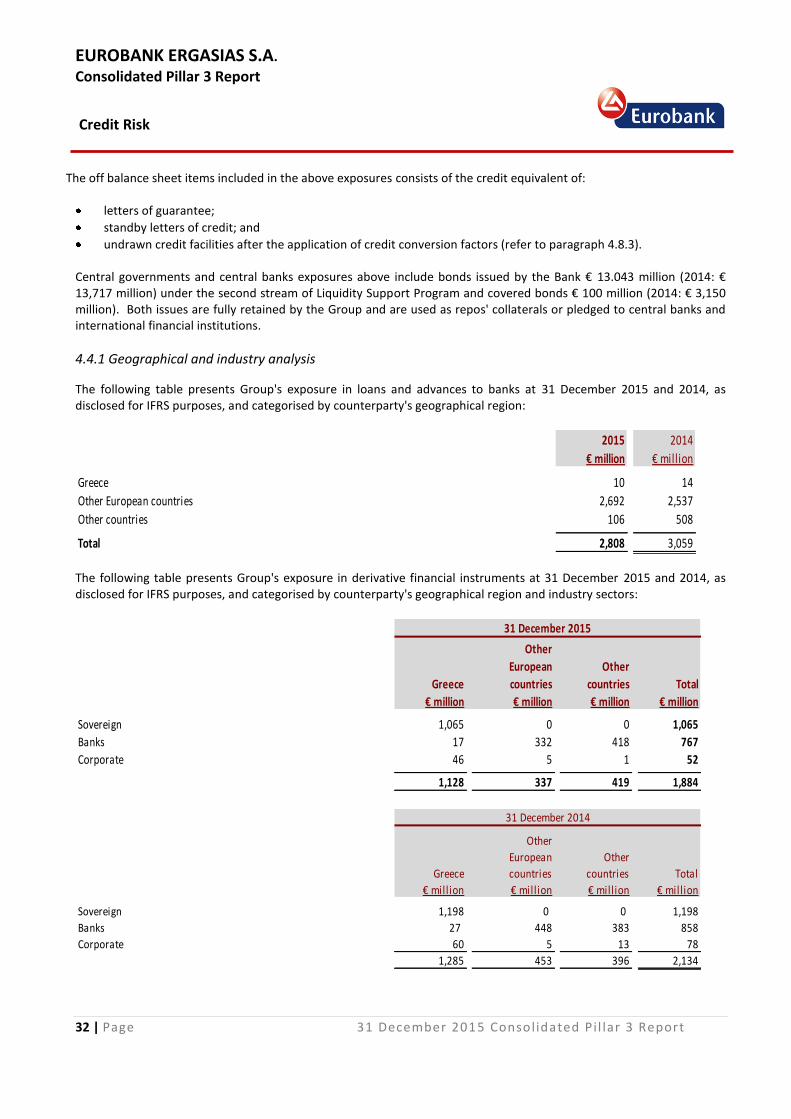
EUROBANK ERGASIAS S.A.
Consolidated Pillar 3 Report
Credit Risk
32 | Page 31 December 2015 Consolidated Pi l lar 3 Report
The off balance sheet items included in the above exposures consists of the credit equivalent of:
letters of guarantee;
standby letters of credit; and
undrawn credit facilities after the application of credit conversion factors (refer to paragraph 4.8.3).
Central governments and central banks exposures above include bonds issued by the Bank € 13.043 million (2014: € 13,717 million) under the second stream of Liquidity Support Program and covered bonds € 100 million (2014: € 3,150 million). Both issues are fully retained by the Group and are used as repos' collaterals or pledged to central banks and international financial institutions.
4.4.1 Geographical and industry analysis
The following table presents Group's exposure in loans and advances to banks at 31 December 2015 and 2014, as disclosed for IFRS purposes, and categorised by counterparty's geographical region:
2015 2014
€ million € million
Greece 10 14
Other European countries 2,692 2,537
Other countries 106 508
Total 2,808 3,059 The following table presents Group's exposure in derivative financial instruments at 31 December 2015 and 2014, as disclosed for IFRS purposes, and categorised by counterparty's geographical region and industry sectors:
Greece
Other
European
countries
Other
countries Total
€ million € million € million € million
Sovereign 1,065 0 0 1,065
Banks 17 332 418 767
Corporate 46 5 1 52
1,128 337 419 1,884
31 December 2015
Greece
Other
European
countries
Other
countries Total
€ million € million € million € million
Sovereign 1,198 0 0 1,198
Banks 27 448 383 858
Corporate 60 5 13 78
1,285 453 396 2,134
31 December 2014

EUROBANK ERGASIAS S.A.
Consolidated Pillar 3 Report
Credit Risk
33 | Page 31 December 2015 Consolidated Pi l lar 3 Report
The following table presents the geographical and industry break down of the Group's loans and advances to customers at 31 December 2015 and 2014, as disclosed for IFRS purposes, according to the geographical location or the activity of groups of borrowers that could be similarly affected by changes in economic or other conditions, in order to mitigate risk. For the geographical breakdown the exposures are allocated to regions based on the country of domicile of its counterparty.
Gross
amount
Out of which:
impaired
amount
Impairment
allowance
Gross
amount
Out of which:
impaired
amount
Impairment
allowance
Gross
amount
Out of which:
impaired
amount
Impairment
allowance
€ million € million € million € million € million € million € million € million € million
28,417 13,078 (6,600) 3,637 994 (497) 23 - -
16,449 5,470 (2,060) 1,790 346 (112) 22 - -
3,965 2,576 (1,980) 844 201 (152) 1 - -
1,475 753 (581) 285 75 (52) - - -
6,528 4,279 (1,979) 718 372 (181) - - -
13,392 6,805 (3,720) 3,618 1,367 (836) 1,768 170 (129)
6,182 3,411 (2,087) 1,696 627 (461) 673 139 (120)
3,209 1,318 (725) 518 162 (92) 16 - -
118 51 (24) 37 12 (1) 619 28 (8)
2,076 1,279 (664) 1,086 520 (262) 163 3 (1)
1,291 678 (165) 100 17 (6) - - -
267 12 (13) 34 - - - - -
249 56 (42) 147 29 (14) 297 - -
802 1 (8) 26 - - - - -
42,611 19,884 (10,328) 7,281 2,361 (1,333) 1,791 170 (129)
-Energy
-Other
Public Sector
Total
31 December 2015
Greece Rest of Europe Other Countries
Retail Lending
-Mortgage
-Consumer
-Credit card
-Small business
-Commerce and services
-Manufacturing
-Shipping
Wholesale Lending
-Construction
-Tourism

EUROBANK ERGASIAS S.A.
Consolidated Pillar 3 Report
Credit Risk
34 | Page 31 December 2015 Consolidated Pi l lar 3 Report
Gross
amount
Out of which:
impaired
amount
Impairment
allowance
Gross
amount
Out of which:
impaired
amount
Impairment
allowance
Gross
amount
Out of which:
impaired
amount
Impairment
allowance
€ mill ion € mill ion € mill ion € mill ion € mill ion € mill ion € mill ion € mill ion € mill ion
28,667 11,026 (5,177) 3,733 1,008 (508) 6 - -
16,592 4,184 (1,363) 1,758 318 (114) 5 - -
4,055 2,289 (1,761) 871 204 (148) 1 - -
1,529 707 (493) 312 79 (63) - - -
6,491 3,846 (1,560) 792 407 (183) - - -
13,284 6,347 (3,088) 4,134 1,480 (849) 1,122 159 (117)
5,836 2,759 (1,424) 1,616 374 (220) 392 60 (53)
2,915 1,129 (499) 517 201 (118) 18 - -
71 19 (3) 101 46 (30) 571 37 (18)
2,153 1,180 (484) 775 485 (222) 11 4 (0)
1,159 503 (122) 59 16 (11) - - -
297 14 (13) 63 6 (0) - - -
853 743 (543) 1,003 352 (248) 130 58 (46)
934 0 (9) 1 - - - - -
42,885 17,373 (8,274) 7,868 2,488 (1,357) 1,128 159 (117)
-Energy
Retail Lending
-Mortgage
-Consumer
-Credit card
-Small business
Wholesale Lending
-Commerce and services
-Manufacturing
-Shipping
-Construction
-Tourism
-Other
Public Sector
Total
31 December 2014
Greece Rest of Europe Other Countries
The following table presents Group's exposure in debt securities at 31 December 2015 and 2014, as disclosed for IFRS
purposes, and categorized by counterparty's geographical region and industry sectors:
Greece
Other
European
countries
Other
countries Total
€ million € million € million € million
3,834 11,801 - 15,635
29 127 - 156
190 237 23 450
4,053 12,165 23 16,241
31 December 2015
Sovereign
Total
Banks
Corporate
Greece
Other
European
countries
Other
countries Total
€ million € million € million € million
3,994 12,747 165 16,906
32 187 0 219
210 296 22 528
4,236 13,230 187 17,653
31 December 2014
Sovereign
Banks
Corporate
Total

EUROBANK ERGASIAS S.A.
Consolidated Pillar 3 Report
Credit Risk
35 | Page 31 December 2015 Consolidated Pi l lar 3 Report
4.4.2 Maturity analysis
The following table presents the maturity break down of the Group's credit exposures (before any provisions for impairment losses on loans or OTC derivative transactions) for regulatory purposes, at 31 December 2015 and 2014. Items without contractual maturities (i.e. overdraft loans) are presented in the "less than 1 month" time bucket.
Up to 1
month
1 to 3
months
3 months to 1
year > 1 year Total
€ million € million € million € million € million
1,815 - - - 1,815
867 26 - 130 1,023
7,640 845 3,087 40,512 52,084
426 1,333 718 13,767 16,244
19 2 8 1,318 1,347
10,767 2,206 3,813 55,727 72,513
Contracts under ISDA and CSA (Derivatives) and contracts
under GMRA (repos and reverse repos) 279 1 26 281 587
36 4 5 62 107
315 5 31 343 694
Total exposures 11,082 2,211 3,844 56,070 73,207
31 December 2015
Other Contracts (derivatives and repos outside ISDA, CSA,GMRA)
Credit risk exposures relating to off balance sheet items
Credit risk exposures relating to on balance sheet assets:
Cash and balances with central banks
Loans and advances to banks
Loans and advances to customers
Securities
Other assets
Up to 1
month
1 to 3
months
3 months to 1
year > 1 year Total€ million € million € million € million € million
1,977 - - - 1,977
612 97 5 337 1,051
10,745 624 1,999 38,968 52,336
849 837 952 13,697 16,335
25 23 103 1,083 1,23414,208 1,581 3,059 54,085 72,933
Contracts under ISDA and CSA (Derivatives) and contractsunder GMRA (repos and reverse repos) 629 883 2 289 1,803
111 4 16 72 203740 887 18 361 2,006
Total exposures 14,948 2,468 3,077 54,446 74,939
Cash and balances with Central banks
31 December 2014
Credit risk exposures relating to off balance sheet items
Loans and advances to banksLoans and advances to customersSecuritiesOther assetsCredit risk exposures relating to on balance sheet assets:
Other Contracts (derivatives and repos outside ISDA, CSA,GMRA)
Credit exposures shown above include the excess collateral posted by the Bank under credit mitigation contracts (initial margins, independent amounts, extra collateral due to haircut imposed by counterparties under the CSAs, GMRAs, GMSLAs) and uncollateralized exposure from derivatives and repurchase transactions. The above exposures do not include deferred tax, fixed assets, intangible assets and goodwill and other assets that do not carry credit risk. Equities in Available-for-sale portfolios are also excluded since they are presented in par. 5.4.

EUROBANK ERGASIAS S.A.
Consolidated Pillar 3 Report
Credit Risk
36 | Page 31 December 2015 Consolidated Pi l lar 3 Report
4.5 Past due and impaired loans
4.5.1 Past due exposures
A financial asset is past due if a counterparty has failed to make a payment when contractually due. Exposures more than 90 days past due presented in the table below (refer to paragraph 4.5.2) include the assets for which counterparties have failed to make a contractual payment for more than 90 days, irrespective of whether the asset is considered as impaired or not. 4.5.2 Impairment of financial assets
The Group assesses at each reporting date whether there is objective evidence that a financial asset or group of financial assets, not carried at fair value through profit or loss, is impaired. A financial asset or a group of financial assets is impaired and an impairment loss is incurred if there is objective evidence of impairment as a result of one or more events that occurred after the initial recognition of the financial asset (a ‘loss event’) and that loss event (or events) has an impact on the estimated future cash flows of the financial asset or group of financial assets that can be reliably estimated.
Impairment indicators
For the Group’s retail loan exposures, objective evidence that a loan or group of loans is impaired refers to observable data that comes to the attention of the Group about the following loss events: (a) significant financial difficulty of the borrower, significant reduction of personal and/or family income or loss of job; (b) a default or breach of contract; (c) significant changes in the financial performance and behavior of the borrower (for example, a number of delayed
contractual payments); (d) measurable decrease in the estimated future cash flows of a group of loans through a negative payment pattern
such as missed payments or a decrease in property prices; (e) the Group granting to the borrower, for economic or legal reasons relating to the borrower’s financial difficulty, a
concession that the lender would not otherwise consider, such as a reduction of the borrower's monthly installment for a specific period of time, or a temporary or permanent reduction of interest rate;
(f) it is becoming probable that the borrower will enter into bankruptcy status or other financial reorganization; and (g) loss events that could affect the ability of the borrower to repay contractual obligations within the agreed time,
such as: - serious illness or disability of the obligor or a family member; - death of the borrower;
For all other financial assets including wholesale loan exposures, the Group assesses on a case-by-case basis whether there is any objective evidence of impairment using the following criteria: (a) significant financial difficulty of the issuer or borrower; (b) a default of breach of contract; (c) significant changes in the financial performance of the borrower that affect the borrower’s ability to meet its debt
obligations, such as: - operating losses; - working capital deficiencies; - the borrower having a negative equity;
(d) other facts indicating a deterioration of the financial performance of the borrower, such as a breach of loan covenants or other terms, or a partial write-off of the borrower’s obligations due to economic or legal reasons relating to his financial status;

EUROBANK ERGASIAS S.A.
Consolidated Pillar 3 Report
Credit Risk
37 | Page 31 December 2015 Consolidated Pi l lar 3 Report
(e) significant changes in the value of the collateral supporting the obligation; (f) the Group granting to the borrower, for economic or legal reasons relating to the borrower’s financial difficulty, a
concession that the lender would not otherwise consider, such as a reduction of the obligors monthly installment for a specific period of time, or a temporary or permanent reduction of interest rate;
(g) becoming probable that the borrower will enter into bankruptcy or other financial reorginazation; (h) significant adverse changes in the borrower’s industry or geographical area that could affect his ability to meet its
debt obligations; (i) market related information including the status of the borrower’s other debt obligations; and (j) a significant downgrade in the internal or external credit rating of the borrower’s financial instruments when
considered with other information.
Impairment assessment
The Group first assesses whether objective evidence of impairment exists individually for financial assets that are individually significant, and collectively for financial assets that are not individually significant. If there is no objective evidence of impairment for a financial asset, the Group includes it in a group of financial assets with similar credit risk characteristics and collectively assesses them for impairment. Impairment losses recognized for financial assets for which no objective evidence of impairment exists (incurred but not reported loss – IBNR), represent an interim step pending to the identification of impairment losses of individual assets in the group. As soon as information is available that specifically identifies losses on individually impaired assets in the group, those assets are removed from it. Financial assets that are individually assessed for impairment and for which an impairment loss is or continues to be recognized are not included in a collective assessment of impairment. In determining whether a loan is individually significant for the purposes of assessing impairment, the Group considers a number of factors, including the importance of the individual loan relationship and how it is managed, the size of the loan, and the product line. Consequently, loans to wholesale customers and financial institutions, as well as investment securities are generally considered as individually significant. Retail lending portfolios are generally assessed for impairment on a collective basis as they consist of large homogenous portfolios; exposures that are managed on an individual basis are assessed individually for impairment. The Group assesses at each reporting date whether there is objective evidence of impairment. The following table presents as at 31 December 2015 and 2014, analysis of credit exposures, broken down by major asset class, as disclosed for IFRS purposes:
Total loans and
advances to
customers
Past due more
than 90 days
Impaired
exposures
Total loans and
advances to
customers
Past due more
than 90 days
Impaired
exposures€ million € million € million € million € million € million
Wholesale 19,606 6,207 8,343 19,475 6,397 7,986Mortgage 18,261 4,735 5,816 18,355 4,099 4,502Consumer 6,570 3,297 3,605 6,768 3,108 3,279Small business 7,246 3,951 4,651 7,283 3,698 4,253
Total 51,683 18,190 22,415 51,881 17,302 20,020
31 December 2015 31 December 2014
Credit exposure Credit exposure

EUROBANK ERGASIAS S.A.
Consolidated Pillar 3 Report
Credit Risk
38 | Page 31 December 2015 Consolidated Pi l lar 3 Report
The following table presents the geographical break down of total, past due and impaired advances to customers at 31 December 2015 and 2014 based on the country of the subsidiary granting the loan:
Total loans and
advances to
customers
Past due more
than 90 days
Impaired
exposures
Total loans and
advances to
customers
Past due more
than 90 days
Impaired
exposures
€ million € million € million € million € million € million
Greece 44,088 16,601 20,428 44,326 15,680 17,905
7,595 1,589 1,987 7,555 1,622 2,115
Total 51,683 18,190 22,415 51,881 17,302 20,020
International Operations
31 December 2015 31 December 2014
4.5.3 Past due but not impaired exposures
“Past due but not impaired” category includes loans with contractual payments overdue by at least one day, but which are not impaired unless specific information indicates to the contrary. This is typically when loans are in arrears less than 90 days past due for consumer and small business exposures, less than 180 days past due for mortgage, while for wholesale exposures both the delinquency status and the internal rating, which reflects the borrower's overall financial condition and outlook, are assessed. For loans in the above categories, although not considered impaired, the Group recognize a collective impairment provision.
4.6 Impairment losses on loans and advances The Group reviews its loan portfolios to assess whether there is objective evidence of impairment on an ongoing basis. This assessment is performed individually for loans and advances that are individually significant, and collectively for loans and advances that are not individually significant. Management is required to exercise judgment in making assumptions and estimates when calculating the present value of the cash flows expected to be received on both, individually and collectively assessed loans and advances.
Individual impairment assessment
For loans assessed on an individual basis, mainly the Group’s wholesale lending portfolio, management uses its best estimate to determine the present value of the cash flows that are expected to be received. In estimating these cash flows, management makes judgments about the borrower's financial position and the net realizable value of any underlying collaterals. Expected recoveries from real estate collaterals may be affected from the downward trend in the properties’ market value. A 5% decline in the estimated recovery values of all types of real estates’ collaterals used for the measurement of the impairment allowance of the Group’s wholesale lending portfolio, would give rise to an additional impairment loss in 2015 of approximately € 118 million. Each individually assessed loan for impairment is assessed on a case-by-case basis (by cooperation between Credit Risk Management function and the business units) and subsequently it is independently approved by the Credit Risk Management function.
Collective impairment assessment
Collective impairment allowance is established for (a) groups of non-impaired or impaired retail homogenous loans that are not considered individually significant and (b) groups of corporate or retail loans that are individually significant but that were not found to be individually impaired.

EUROBANK ERGASIAS S.A.
Consolidated Pillar 3 Report
Credit Risk
39 | Page 31 December 2015 Consolidated Pi l lar 3 Report
In determining whether an impairment loss should be recorded in the income statement, management makes judgments as to whether there is any observable data indicating that there is a measurable decrease in the estimated future cash flows of a loan portfolio before the decrease can be identified on an individual loan basis in that portfolio. This evidence may include observable data indicating that there has been an adverse change in the payment status of borrowers in a group, or national or local economic conditions that correlate with defaults on assets in the group. In assessing the need for collective impairment, management considers factors such as credit quality, portfolio size, concentrations and economic factors. Management’s estimates are based on historical loss experience for assets with similar credit risk characteristics to those in the loan portfolio under assessment when scheduling its future cash flows. Management also applies significant judgment to assess whether current economic and credit conditions are such that the actual level of impairment loss is likely to be greater or lower than that suggested by historical experience. In normal circumstances, historical loss experience provides objective and relevant information in order to assess the loss within each loan portfolio. In other circumstances, historical loss experience provides less relevant information, for example when recent trends in risk factors are not fully reflected in the historical information. Where changes in economic, regulatory and behavioral conditions result in most recent trends in portfolio risk factors not being fully reflected in the impairment calculation model used, the Group adjusts the impairment allowance derived from historical loss experience accordingly. The uncertainty inherent in the estimation of impairment loss is increased in the current macroeconomic environment, and is sensitive to factors such as the political uncertainty level of economic activity, bankruptcy rates, geographical concentrations, changes in laws and regulations, property prices and level of interest rates. For the Group’s mortgage portfolios, the recovery rates which are calculated based on statistical models, reflect the management's best estimate regarding the net realizable value of residential properties held as collateral as well as the timing foreclosure is expected to occur, which in turn is impacted by the local legal framework. Both the amount and timing of expected cash flows have been affected by the reduction in the level of activity in the real estate market and the changes in the local tax and legal environment in Greece. A 3% decline in the estimated recovery rates used for the measurement of the impairment allowance of the Group’s mortgage portfolio, would give rise to an additional impairment loss in 2015 of approximately €122 million (2014: € 108million). For the rest of retail portfolios, statistical analysis of historical loss experience is the primary tool used in order to determine future customer behavior and payment patterns. Due to the stressed macroeconomic environment during the last years, depending on the portfolio under examination, there is a level of uncertainty in terms of the level of future cash flows as well as the time that these cash flows will come. With regards to unsecured consumer and small business exposures, management exercises judgment to determine the assumptions underlying to the applicable recovery rates which are calculated based on statistical models and affected by the existing economic conditions. A 5% decrease in the estimated recovery rates used for the measurement of the impairment allowance of the Group's unsecured consumer portfolio would give rise to an additional impairment loss in 2015 of approximately €45 million. (2014: €42 million). The same decrease in the small business lending portfolio's recovery rates would give rise to an additional impairment loss of approximately €40 million (2014:€42 million).
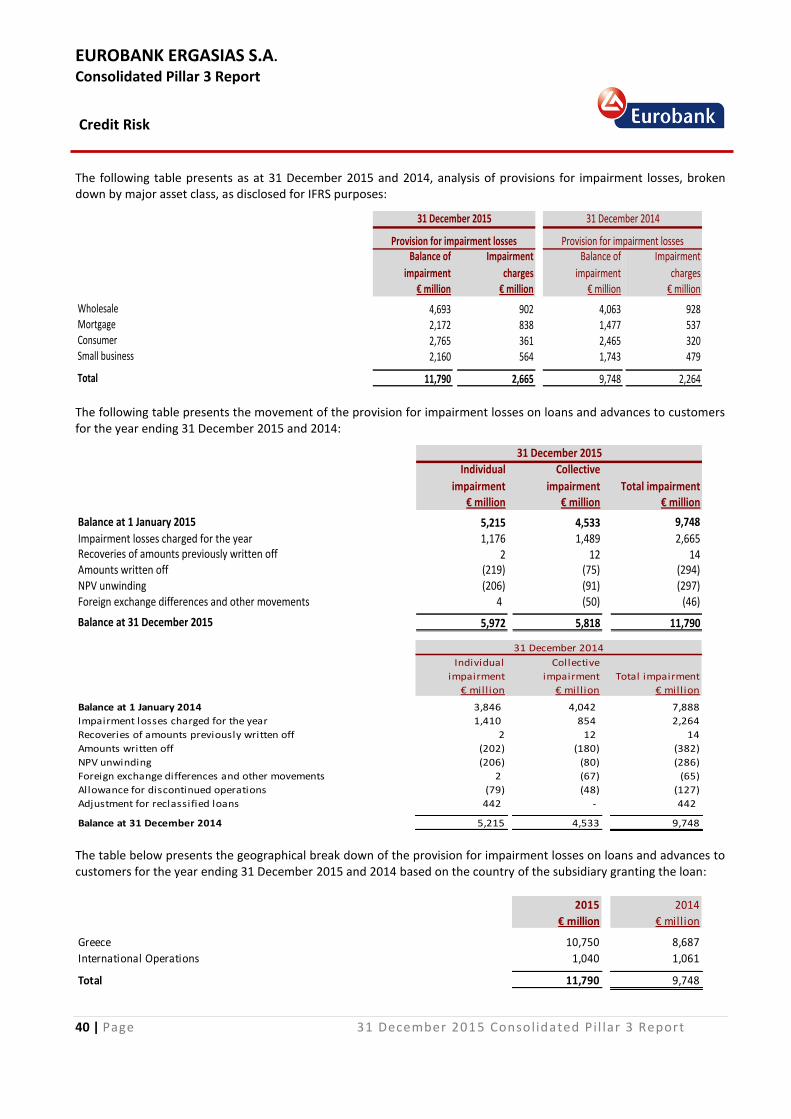
EUROBANK ERGASIAS S.A.
Consolidated Pillar 3 Report
Credit Risk
40 | Page 31 December 2015 Consolidated Pi l lar 3 Report
The following table presents as at 31 December 2015 and 2014, analysis of provisions for impairment losses, broken down by major asset class, as disclosed for IFRS purposes:
Balance of
impairment
Impairment
charges
Balance of
impairment
Impairment
charges€ million € million € million € million
Wholesale 4,693 902 4,063 928Mortgage 2,172 838 1,477 537Consumer 2,765 361 2,465 320Small business 2,160 564 1,743 479
Total 11,790 2,665 9,748 2,264
31 December 2015 31 December 2014
Provision for impairment losses Provision for impairment losses
The following table presents the movement of the provision for impairment losses on loans and advances to customers for the year ending 31 December 2015 and 2014:
Individual
impairment
Collective
impairment Total impairment€ million € million € million
Balance at 1 January 2015 5,215 4,533 9,748
Impairment losses charged for the year 1,176 1,489 2,665Recoveries of amounts previously written off 2 12 14Amounts written off (219) (75) (294) NPV unwinding (206) (91) (297) Foreign exchange differences and other movements 4 (50) (46)
Balance at 31 December 2015 5,972 5,818 11,790
31 December 2015
Individual
impairment
Collective
impairment Total impairment
€ million € million € million
Balance at 1 January 2014 3,846 4,042 7,888
Impairment losses charged for the year 1,410 854 2,264
Recoveries of amounts previously written off 2 12 14
Amounts written off (202) (180) (382)
NPV unwinding (206) (80) (286)
Foreign exchange differences and other movements 2 (67) (65)
Allowance for discontinued operations (79) (48) (127)
Adjustment for reclassified loans 442 - 442
Balance at 31 December 2014 5,215 4,533 9,748
31 December 2014
The table below presents the geographical break down of the provision for impairment losses on loans and advances to customers for the year ending 31 December 2015 and 2014 based on the country of the subsidiary granting the loan:
2015 2014
€ million € million
Greece 10,750 8,687
1,040 1,061
Total 11,790 9,748
International Operations

EUROBANK ERGASIAS S.A.
Consolidated Pillar 3 Report
Credit Risk
41 | Page 31 December 2015 Consolidated Pi l lar 3 Report
4.7 Standardised approach
The Group applies the Standardised approach for all subsidiaries exposures and for a part of the Bank's retail loans. Moreover, the Standardised approach is applied for credit exposures with sovereign and institutional counterparties, as well as with corporate bond issuers, for which a permanent exemption has been granted by the Bank of Greece. Credit ratings are retrieved from External Credit Assessment Institutions (ECAIs), such as Moody’s or Standard & Poor’s or Fitch. In the cases where more than one rating is available, the second better rating is used. ECAIs are not used for loans' portfolios directly, but only in cases when they are guaranteed by central governments or institutions (risk substitution). In such a case the ECAIs used are the same as the ones described above. In the case of corporate bond issues, the corresponding issue rating by these agencies is used. In case that an issue rating is not available, rating for other issues by the same issuer can be used, if: (a) the corporate bond under review has equal or better seniority with these rated bonds or (b) the resulting risk weight is lower than the applicable risk weight of unrated bonds. The table below presents the credit exposures (before credit risk mitigation, i.e. collaterals, and after the application of credit conversion factors) for which the standardised approach is applied, at 31 December 2015 and 2014, broken down by supervisory risk weights:
0% 10% - 20% 35% 50% 75% 100% 150%-250% Total€ million € million € million € million € million € million € million € million
Credit risk (pursuant Standardised approach)
Central governments or central banks 13,676 - - 40 - 4,272 512 18,500Regional governments or local authorities - 75 - - - 27 - 102Public sector entities - - - - - - 14 14Multilateral development banks 385 - - - - - - 385International organisations 10,042 - - - - - - 10,042Institutions 1,615 5,557 - 339 - 8 28 7,547Corporates 1,147 - - 20 - 2,011 116 3,294Retail 52 - - 34 3,154 - - 3,240Secured by mortgages on immovable property - - 4,037 503 - - - 4,540Exposures in default 1 - - 1 - 1,427 123 1,552Items associated with particularly high riskCovered bonds - 188 - - - 29 - 217Claims in the form of collective investment undertakings (CIUs) Equity exposures - - - - - 40 373 413Other items 861 16 - - - 2,971 - 3,848
Total 27,780 5,836 4,037 950 3,154 11,644 1,531 54,932
- 55- - - - - 55
Supervisory risk weightings - 31 December 2015
1 - - 13 - 804 365 1,183
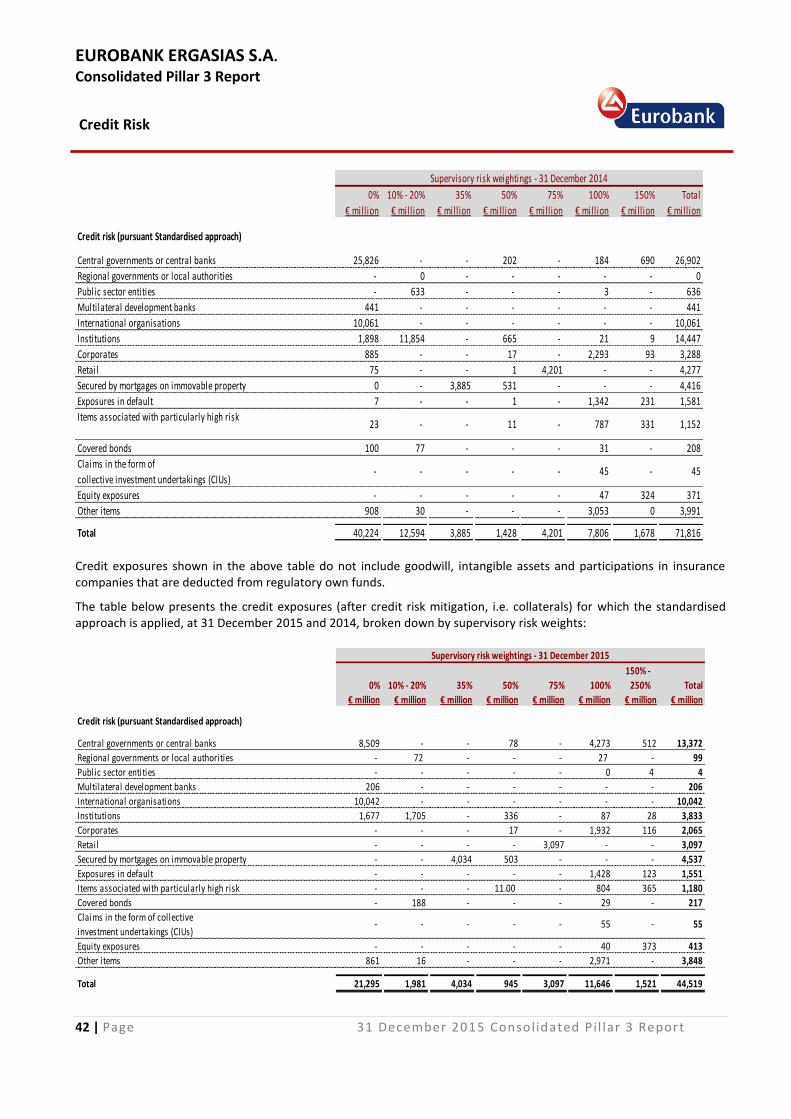
EUROBANK ERGASIAS S.A.
Consolidated Pillar 3 Report
Credit Risk
42 | Page 31 December 2015 Consolidated Pi l lar 3 Report
0% 10% - 20% 35% 50% 75% 100% 150% Total
€ mill ion € mill ion € mill ion € mill ion € mill ion € mill ion € mill ion € mill ion
Credit risk (pursuant Standardised approach)
Central governments or central banks 25,826 - - 202 - 184 690 26,902
Regional governments or local authorities - 0 - - - - - 0
Public sector entities - 633 - - - 3 - 636
Multilateral development banks 441 - - - - - - 441
International organisations 10,061 - - - - - - 10,061
Institutions 1,898 11,854 - 665 - 21 9 14,447
Corporates 885 - - 17 - 2,293 93 3,288
Retail 75 - - 1 4,201 - - 4,277
Secured by mortgages on immovable property 0 - 3,885 531 - - - 4,416
Exposures in default 7 - - 1 - 1,342 231 1,581
Items associated with particularly high risk
Covered bonds 100 77 - - - 31 - 208
Claims in the form of
collective investment undertakings (CIUs)
Equity exposures - - - - - 47 324 371
Other items 908 30 - - - 3,053 0 3,991
Total 40,224 12,594 3,885 1,428 4,201 7,806 1,678 71,816
- - - - - 45 - 45
23 - - 11 - 787 331 1,152
Supervisory risk weightings - 31 December 2014
Credit exposures shown in the above table do not include goodwill, intangible assets and participations in insurance companies that are deducted from regulatory own funds. The table below presents the credit exposures (after credit risk mitigation, i.e. collaterals) for which the standardised approach is applied, at 31 December 2015 and 2014, broken down by supervisory risk weights:
0% 10% - 20% 35% 50% 75% 100%
150% -
250% Total
€ million € million € million € million € million € million € million € million
Credit risk (pursuant Standardised approach)
Central governments or central banks 8,509 - - 78 - 4,273 512 13,372
Regional governments or local authorities - 72 - - - 27 - 99
Public sector entities - - - - - 0 4 4
Multilateral development banks 206 - - - - - - 206
International organisations 10,042 - - - - - - 10,042
Institutions 1,677 1,705 - 336 - 87 28 3,833
Corporates - - - 17 - 1,932 116 2,065
Retail - - - - 3,097 - - 3,097
Secured by mortgages on immovable property - - 4,034 503 - - - 4,537
Exposures in default - - - - - 1,428 123 1,551
Items associated with particularly high risk - - - 11.00 - 804 365 1,180
Covered bonds - 188 - - - 29 - 217
Claims in the form of collective
investment undertakings (CIUs)
Equity exposures - - - - - 40 373 413
Other items 861 16 - - - 2,971 - 3,848
Total 21,295 1,981 4,034 945 3,097 11,646 1,521 44,519
- 55- - - - - 55
Supervisory risk weightings - 31 December 2015

EUROBANK ERGASIAS S.A.
Consolidated Pillar 3 Report
Credit Risk
43 | Page 31 December 2015 Consolidated Pi l lar 3 Report
0% 10% - 20% 35% 50% 75% 100% 150% Total€ million € million € million € million € million € million € million € million
Credit risk (pursuant Standardised approach)
Central governments or central banks 13,394 0 0 202 0 184 690 14,470Regional governments or local authorities - - - - - - - 0Public sector entities - 210 - - - 3 - 213Multilateral development banks 248 - - - - - - 248International organisations 10,061 - - - - - - 10,061Institutions 1,948 3,101 - 631 - 143 37 5,860Corporates - - - 17 - 2,081 93 2,191Retail - - - - 4,136 - - 4,136Secured by mortgages on immovable property - - 3,882 531 - - - 4,413Exposures in default - - - - - 1,341 231 1,572Items associated with particularly high risk 15 - - 11 - 787 330 1,143Covered bonds 100 77 - - - 31 - 208
Claims in the form of collectiveinvestment undertakings (CIUs) Equity exposures - - - - - 47 324 371Other items 908 30 - - - 3,053 - 3,991.00
Total 26,674 3,418 3,882 1,392 4,136 7,715 1,705 48,922
- 45 - - - - - 45
Supervisory risk weightings - 31 December 2014
Credit exposures shown in the above table do not include goodwill, intangible assets and participations in insurance companies that are deducted from regulatory own funds.
4.8 Internal Ratings Based (IRB) approach
4.8.1 Risk classifications
The Bank's risk classifications can be divided into the following main categories: • rating of large corporate and medium size customers; and • credit scores assigned to retail customers. (a) Rating of large corporate and medium size customers The Bank has decided upon the differentiation of rating models for corporate banking, in order to better reflect the risk for customers with different characteristics. Hence, rating models are employed for a number of general, as well as specific customer segments: • Traditional corporate lending:
- Moody’s Risk Advisor (MRA). - Internal credit rating for those customers that cannot be rated by MRA.
MRA is a rating system that aggregates quantitative and qualitative information on individual obligors to perform the assessment of their creditworthiness and determine the credit rating for the obligor. It takes into account the company's financial performance, its cash flows, industry sector trends, peers' performance, as well as qualitative assessment of management, the company's status, market and industry structural factors. MRA is used for the assessment of all legal entities with full accountancy tax books irrespective of their legal form, and is calibrated on the Greek corporate environment.

EUROBANK ERGASIAS S.A.
Consolidated Pillar 3 Report
Credit Risk
44 | Page 31 December 2015 Consolidated Pi l lar 3 Report
The table below shows the mapping of MRA internal rating to ICAP (ECAI) ratings:
ICAP ratings MRA ratings
AA, A 1,0 - 2,0
BB, B 2,1 - 3,3
C, D 3,4 - 4,3
E 4,4 -5,5
F 5,6 - 7,4
G, H 7,5 - 9,9
Mapping of internal (MRA) ratings
to ECAIs
Mappings are primarily based on medium size corporate customers. Certain types of companies cannot be analyzed with MRA due to the special characteristics of their financial statements such as insurance companies, state-owned organizations, brokerage firms and start ups. In such cases an internal credit rating system is applied. It is an expert judgment borrower rating system and, similarly to MRA, it combines quantitative and qualitative assessment criteria (such as size, years in business, credit history, industry sector etc.). Customers are classified with respect to their credit worthiness to 11 Borrower rating categories. Categories 1 to 3 correspond to low risk customers, whereas categories 4 to 6 to customers with medium credit risk. Categories 7 to 9 apply to customers with higher risk who are monitored more closely. Categories 10 and 11 apply to non-performing exposures and write offs respectively. In addition, the Bank performs an overall assessment of corporate customers, based both on the borrower rating of the obligors (MRA or ICR), and the collaterals and guarantees referred to in its approved credit limit, using a 14 grade rating scale. Credit exposure is subject to detailed reviews by the appropriate approval level of the Bank based on the respective transactional rating (TR). Low risk corporate customers are reviewed at least once a year, whereas higher risk customers are reviewed either on a semi-annual (watchlist) or quarterly basis (substandard and distressed). All high risk corporate customers are reviewed by the Special Handling Committees (there are three SCHs) on a weekly basis. • Specialized lending (shipping, real estate and project finance): slotting methodology. For the specialized lending portfolios i.e. the primary source of repayment of the obligation is the income generated by the asset(s), rather than the independent capacity of the commercial enterprise, the Bank utilizes the Slotting Method by adapting and refining the Capital Requirements Directive (CRD) criteria to the Bank's risk practices. Customers falling in the specialized lending category (shipping, real estate and project finance) are classified in 5 categories: strong, good, satisfactory, weak and default. Each of the 5 categories is associated with a specific risk weight and EL percentage. The fundamental standards underlying the Group's centralized loan approval and rating processes are to review the global exposure of the customer and to use the 'four-eyes' principle, which requires each credit limit/rating to be evaluated by more than one individual. Ratings are approved by Credit Committees according to the level of exposure involved and each committee has its own specific approval limit. Ratings of customers whose exposure exceed Credit Committees' thresholds are reviewed by the Group's Central Committee. The Credit Committees are composed of senior managers from different business units, as well as from risk management and each committee has its own independent chairman. As a general rule, each corporate customer is rated separately. For major corporate customers – where it is customary to assign a rating based on the customer’s affiliation to a group or parent company – the rating of the parent company

EUROBANK ERGASIAS S.A.
Consolidated Pillar 3 Report
Credit Risk
45 | Page 31 December 2015 Consolidated Pi l lar 3 Report
is transferred to the subsidiaries, if the Group believes that the parent company can and will guarantee the fulfilment of the obligations of its subsidiaries. The rating systems described above are an integral part of the Corporate Banking decision making and risk management processes: • the credit approval process, both at the origination and review process; • the calculation of Economic Value Added (EVA) and risk-adjusted pricing; and • the quality assessment of issuers of cheques prior to their pledge as collateral. (b) Credit scores assigned to retail customers The Bank assigns credit scores to its retail customers using a number of statistically based models both at origination and an ongoing basis through behavioral scorecards. Those models have been developed to predict, on the basis of available information, the probability of default, loss given default and exposure at default. They cover the entire spectrum of retail products (Credit Cards, Consumer Lending unsecured revolving credits, Car loans, Personal loans, Mortgages and Small Business Loans). The models were developed based on the Bank’s historical data and credit bureau data. Behavioral scores are calculated automatically on a monthly basis, thus ensuring that credit risk assessments are up to date. The models are used in the credit approval process, in credit limit management, as well as in the collections' process for the prioritization of the accounts in terms of handling. Furthermore, the models have been often used for the risk segmentation of the customers. They are also utilized for risk based pricing in particular segments or new products introduced. All of the above processes are centralized and based on the 'four-eyes' principle. Retail exposures are grouped into homogeneous pools (refer to credit risk measurement in paragraph 4.8.3(e)).
4.8.2 Rating process and models' monitoring
The Bank considers the process and periodic review of credit policy implementation to be of critical importance, as they enable both the integration of the latest market information and analysis into the decision process and ensure the necessary uniformity in the face of the customer. Accordingly, a comprehensive credit policy manual is utilized on the extension and monitoring of credit, detailing the guiding principles, as well as specific rules relating to lending policies. The credit rating process is also monitored independently by the Credit Control Sector in the following ways: with a member's voting right, in cases of downgrading or upgrading the customer's rating (thus ensuring its accuracy) while attending Credit Committees and with post approval control and evaluation of all credit portfolios. Credit Control Sector evaluates the quality of the portfolios through field reviews (case by case) for corporate lending and statistical analysis and field reviews for retail lending. Capital Adequacy Control Sector independently monitors the capacity of rating models and scoring systems to classify customers according to risk, as well as to predict the probability of default, loss given default and exposure at default. The Bank's validation policy follows a procedure that complies with international best practices and regulatory requirements. The Bank verifies the validity of the rating models and scoring systems on an annual basis and the validation includes both quantitative and qualitative aspects. The quantitative validation includes statistical tests relating to the following: • Model stability reports such as population stability, comparison of actual and expected score distributions and
characteristic analysis. • Discriminatory power of rating models i.e. the ability to distinguish default risk on a relative basis.

EUROBANK ERGASIAS S.A.
Consolidated Pillar 3 Report
Credit Risk
46 | Page 31 December 2015 Consolidated Pi l lar 3 Report
• Accuracy/backtesting, i.e. comparison of ex ante probabilities of default and other risk parameters and ex post observed default/loss/credit exposure as defined for regulatory purposes level.
The validation of risk parameters is based on historical in house data utilising confidence intervals or market data/benchmarks, where such benchmarks exist. The qualitative assessment includes the use of the models, data, model design, structures and processes underlying the rating systems. In addition to the annual validation of the models, the Bank has established a quarterly monitoring procedure to assess the significance of any changes. Validation procedures are documented and regularly reviewed and reported to the Board Risk Committee. Group Internal Audit also independently reviews the validation process annually.
4.8.3 Credit risk measurement
The credit risk framework is articulated around two measures: expected loss (EL) and unexpected loss (UL) for credit risk. • EL is the expected annual credit loss over an economic cycle. • UL is defined as the volatility (or one standard deviation) of annual losses. If losses always equaled their expected
levels then there would be no uncertainty. UL outlines the risk arising from volatility in loss levels and thus in earnings.
The core credit risk parameters included in the estimation of expected loss, unexpected loss and credit risk weighted assets are: Probability of Default (PD), Loss Given Default (LGD), credit exposure as defined for regulatory purposes (EAD) and Effective Maturity (M).
(a) Probability of Default (PD)
The PD represents the probability that a customer will default on his credit obligation within the next 12 months. The definition of default used by the Bank is consistent with the requirements of the CRD and Bank of Greece. The Bank’s historical default data have been used in developing PD estimates. For each grade or pool, the long term average default rate expanding over a 6 to 7 years period is used as reference when assessing the PD values. Under the Bank’s validation framework, models are validated at least annually. This back testing is performed in order to timely identify possible misalignments of the model or possible reverse trends of the PDs. In this way, the Bank reassures that the PDs used are representative of the portfolios’ quality and no underestimation underlies the information disclosed.
(b) Loss Given Default (LGD)
LGD represents the loss on an exposure after a customer defaults. It is expressed as a percentage of the exposure that the Bank expects to lose at the point of default. The first step in the development process of behavioral LGD models or segments for the Retail portfolios of the Bank was to calculate realized (historical) LGD for a significant number of years starting before 2000. Data was collected and realized losses were calculated taking into account the concept of economic loss. To calculate historical LGD values for retail exposures, the workout LGD method was employed. The statistical modeling technique employed for the development of behavioral LGD models for consumer lending was Stepwise Linear Regression. This technique is used to first select the most predictive characteristics, and then to determine the weights for each variable. For the remaining portfolios the segmentation approach was used for estimating the LGD, based on material loss drivers.
EUROBANK ERGASIAS S.A.
Consolidated Pillar 3 Report
Credit Risk
47 | Page 31 December 2015 Consolidated Pi l lar 3 Report
When determining the final parameter, the Bank allows for uncertainty in the data and also applies an additional margin for economic downturn, by reference to external data. For corporate lending which is under Foundation IRB, the supervisory LGD parameters are applied.
(c) Credit exposure as defined for regulatory purposes (EAD)
For estimating credit exposures for regulatory purposes, future draw downs are taken into account through the use of Credit Conversion Factors (CCFs). This is meaningful only for products with a risk of drawings that is loan commitments, credit cards and the like, as ordinary loans do not involve a risk of future drawings. Conversion factors are influenced by the Bank's ability to identify slow paying borrowers at an early stage and reduce their access to additional drawings. CCF estimates for the retail portfolios of the Bank are based on the Bank's historical data. As in the LGD estimation, the Bank employed statistical modeling techniques for consumer lending products (credit cards and open line) and for small business revolving and overdraft facilities, based on key drivers. It is noted that in some cases credit exposure as defined for regulatory purposes is observed to be lower than the current balance outstanding. In these cases a capping has been applied at the pool design stage and credit exposure as defined for regulatory purposes has been set to equal current balance outstanding, as stipulated by CRD, thus allowing for an additional margin of conservatism. For corporate lending which is under Foundation IRB, the supervisory CCF parameters are applied.
(d) Effective Maturity (M)
For corporate lending which is under Foundation IRB, the supervisory parameter is applied (i.e. 2.5 years).
(e) Pools (retail asset classes)
For retail lending portfolios, after building the models, ratings have been defined for the risk parameters (PD, LGD and CCF) with the purpose of smoothing out fluctuations by score in the development sample and help the derivation of statistically reliable estimates of the relationship between the score and PD, LGD and CCF, respectively. The functional relationship between the score and the risk parameter was used to create a harmonized rating scale of PD, LGD and CCF across all retail portfolios. For example, the harmonized PD Rating 1 corresponds to the same PD range regardless of unit, product or scorecard in use. Rated exposures have been assigned into particular pools, each containing groups of sufficiently homogenous exposures to allow for accurate and consistent estimation of loss characteristics at pool level. Pools' setting for the retail lending portfolios was driven by a number of segmentation variables (product, financial status, time on books, current delinquency status, etc.), as well as the score. All these provide for a meaningful differentiation of risk as the score is based on the assessment of numerous variables (borrower and transaction characteristics). Back testing and comparison analysis with external data, where available, are conducted at least annually to validate the risk parameters' estimations and pools, as described in rating process and models' monitoring in paragraph 4.8.2. The Group has received approval for using the internal rating models and all detailed validations of the parameters were submitted to and reviewed by the regulator, as part of the IRB approval process and also as part of the ongoing
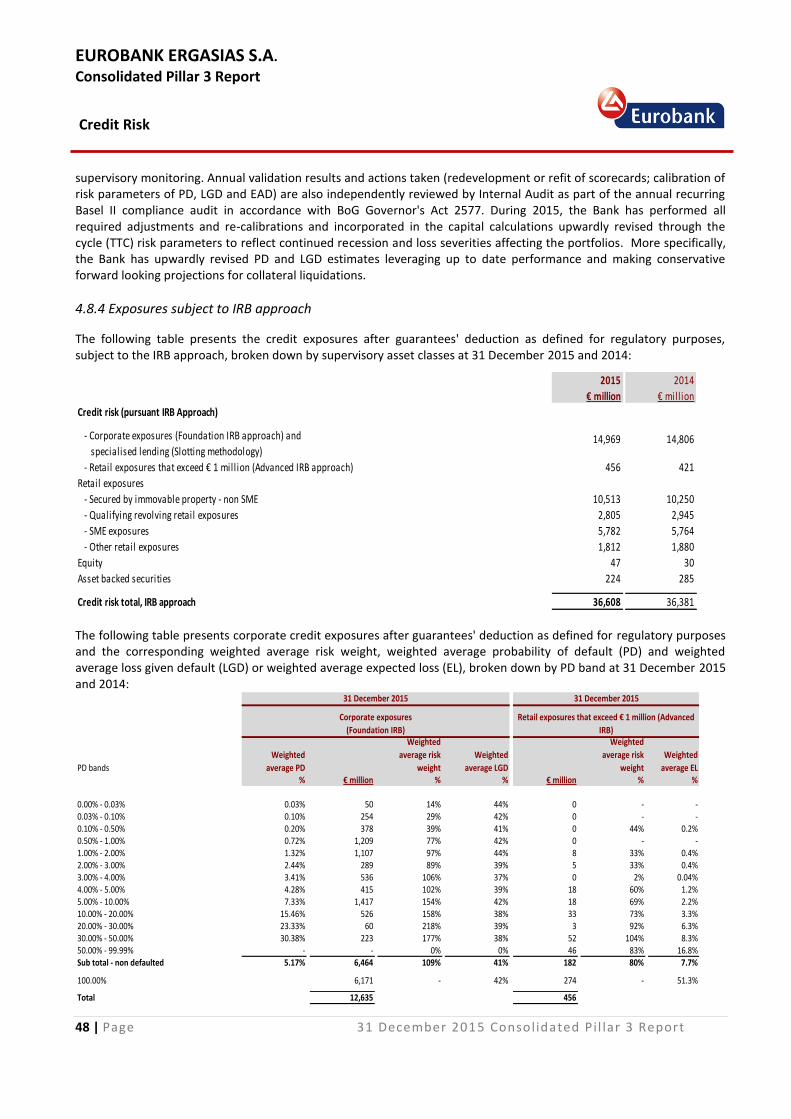
EUROBANK ERGASIAS S.A.
Consolidated Pillar 3 Report
Credit Risk
48 | Page 31 December 2015 Consolidated Pi l lar 3 Report
supervisory monitoring. Annual validation results and actions taken (redevelopment or refit of scorecards; calibration of risk parameters of PD, LGD and EAD) are also independently reviewed by Internal Audit as part of the annual recurring Basel II compliance audit in accordance with BoG Governor's Act 2577. During 2015, the Bank has performed all required adjustments and re-calibrations and incorporated in the capital calculations upwardly revised through the cycle (TTC) risk parameters to reflect continued recession and loss severities affecting the portfolios. More specifically, the Bank has upwardly revised PD and LGD estimates leveraging up to date performance and making conservative forward looking projections for collateral liquidations.
4.8.4 Exposures subject to IRB approach
The following table presents the credit exposures after guarantees' deduction as defined for regulatory purposes, subject to the IRB approach, broken down by supervisory asset classes at 31 December 2015 and 2014:
2015 2014
€ million € million
Credit risk (pursuant IRB Approach)
14,969 14,806
- Retail exposures that exceed € 1 million (Advanced IRB approach) 456 421
Retail exposures
- Secured by immovable property - non SME 10,513 10,250
- Qualifying revolving retail exposures 2,805 2,945
- SME exposures 5,782 5,764
- Other retail exposures 1,812 1,880
Equity 47 30
Asset backed securities 224 285
Credit risk total, IRB approach 36,608 36,381
- Corporate exposures (Foundation IRB approach) and
specialised lending (Slotting methodology)
The following table presents corporate credit exposures after guarantees' deduction as defined for regulatory purposes and the corresponding weighted average risk weight, weighted average probability of default (PD) and weighted average loss given default (LGD) or weighted average expected loss (EL), broken down by PD band at 31 December 2015 and 2014:
PD bands
Weighted
average PD
Weighted
average risk
weight
Weighted
average LGD
Weighted
average risk
weight
Weighted
average EL % € million % % € million % %
0.00% - 0.03% 0.03% 50 14% 44% 0 - -0.03% - 0.10% 0.10% 254 29% 42% 0 - -0.10% - 0.50% 0.20% 378 39% 41% 0 44% 0.2%0.50% - 1.00% 0.72% 1,209 77% 42% 0 - -1.00% - 2.00% 1.32% 1,107 97% 44% 8 33% 0.4%2.00% - 3.00% 2.44% 289 89% 39% 5 33% 0.4%3.00% - 4.00% 3.41% 536 106% 37% 0 2% 0.04%4.00% - 5.00% 4.28% 415 102% 39% 18 60% 1.2%5.00% - 10.00% 7.33% 1,417 154% 42% 18 69% 2.2%10.00% - 20.00% 15.46% 526 158% 38% 33 73% 3.3%20.00% - 30.00% 23.33% 60 218% 39% 3 92% 6.3%30.00% - 50.00% 30.38% 223 177% 38% 52 104% 8.3%50.00% - 99.99% - - 0% 0% 46 83% 16.8%Sub total - non defaulted 5.17% 6,464 109% 41% 182 80% 7.7%
100.00% 6,171 - 42% 274 - 51.3%
Total 12,635 456
Retail exposures that exceed € 1 million (Advanced
IRB)
31 December 2015 31 December 2015
Corporate exposures
(Foundation IRB)

EUROBANK ERGASIAS S.A.
Consolidated Pillar 3 Report
Credit Risk
49 | Page 31 December 2015 Consolidated Pi l lar 3 Report
PD bands
Weighted
average PD
Weighted
average risk
weight
Weighted
average LGD
Weighted
average risk
weight
Weighted
average EL % € million % % € million % %
0.00% - 0.03% 0.03% 27 14% 45% - - -0.03% - 0.10% 0.04% 245 17% 43% - - -0.10% - 0.50% 0.21% 347 41% 41% 0 21% 0.1%0.50% - 1.00% 0.73% 643 68% 40% 3 32% 0.2%1.00% - 2.00% 1.17% 1,580 98% 44% 0 24% 0.3%2.00% - 3.00% 2.32% 552 77% 34% 16 44% 0.5%3.00% - 4.00% 3.41% 776 110% 40% 7 56% 0.8%4.00% - 5.00% 4.40% 105 112% 41% 17 52% 1.1%5.00% - 10.00% 6.71% 1,211 138% 41% 25 62% 1.7%10.00% - 20.00% 15.24% 1,132 170% 40% 33 83% 3.4%20.00% - 30.00% 26.76% 412 185% 40% 67 100% 5.7%30.00% - 50.00% - - 0 0% 4 65% 6.5%50.00% - 99.99% - - 0 0% 32 84% 14.2%Sub total - non defaulted 6.15% 7,030 113% 41% 205 78% 5.1%
100.00% 5,556 - 42% 216 - 41.0%
Total 12,586 421
31 December 2014 31 December 2014
Corporate exposures
(Foundation IRB)
Retail exposures that exceed € 1 million (Advanced
IRB)
The table below presents the specialized lending credit exposures (shipping, real estate and project finance) broken down by supervisory risk weights:
2015 2014
Weights € million € million
0% 803 715
50% 53 85
70% 372 354
90% 617 523
115% 485 529
250% 4 14
Total 2,334 2,220
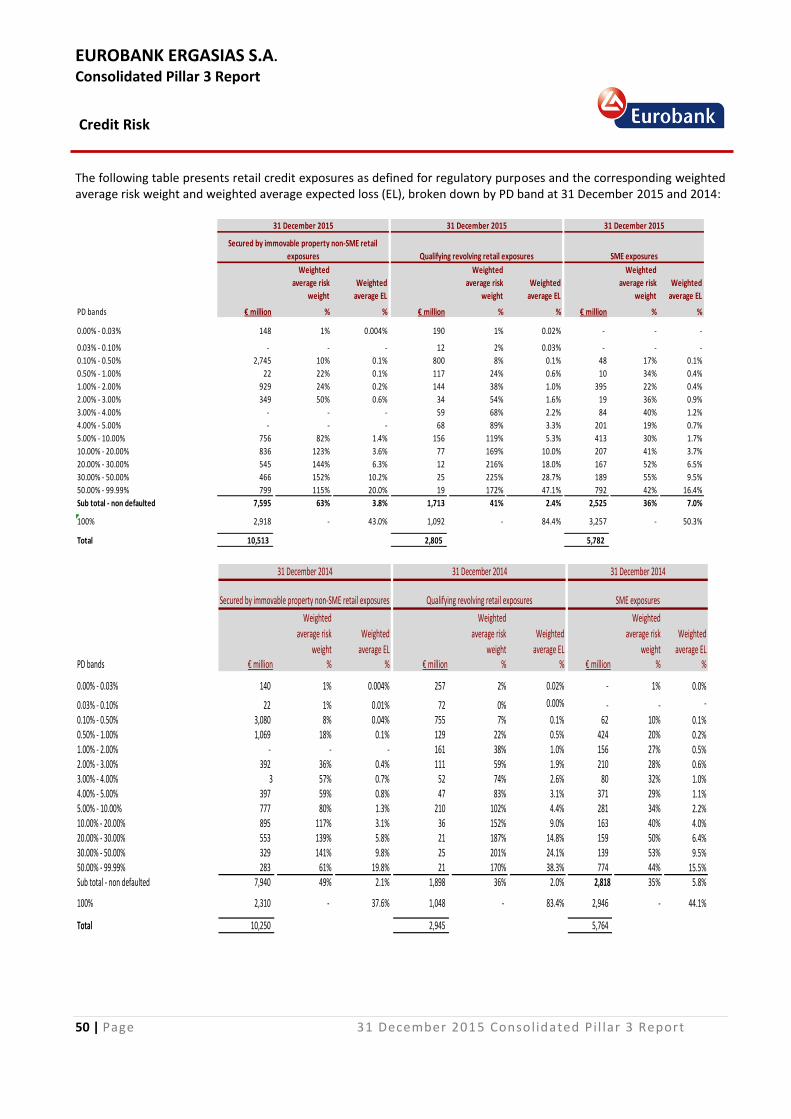
EUROBANK ERGASIAS S.A.
Consolidated Pillar 3 Report
Credit Risk
50 | Page 31 December 2015 Consolidated Pi l lar 3 Report
The following table presents retail credit exposures as defined for regulatory purposes and the corresponding weighted average risk weight and weighted average expected loss (EL), broken down by PD band at 31 December 2015 and 2014:
Weighted
average risk
weight
Weighted
average EL
Weighted
average risk
weight
Weighted
average EL
Weighted
average risk
weight
Weighted
average EL
PD bands € million % % € million % % € million % %
0.00% - 0.03% 148 1% 0.004% 190 1% 0.02% - - -
0.03% - 0.10% - - - 12 2% 0.03% - - -
0.10% - 0.50% 2,745 10% 0.1% 800 8% 0.1% 48 17% 0.1%
0.50% - 1.00% 22 22% 0.1% 117 24% 0.6% 10 34% 0.4%
1.00% - 2.00% 929 24% 0.2% 144 38% 1.0% 395 22% 0.4%
2.00% - 3.00% 349 50% 0.6% 34 54% 1.6% 19 36% 0.9%
3.00% - 4.00% - - - 59 68% 2.2% 84 40% 1.2%
4.00% - 5.00% - - - 68 89% 3.3% 201 19% 0.7%
5.00% - 10.00% 756 82% 1.4% 156 119% 5.3% 413 30% 1.7%
10.00% - 20.00% 836 123% 3.6% 77 169% 10.0% 207 41% 3.7%
20.00% - 30.00% 545 144% 6.3% 12 216% 18.0% 167 52% 6.5%
30.00% - 50.00% 466 152% 10.2% 25 225% 28.7% 189 55% 9.5%
50.00% - 99.99% 799 115% 20.0% 19 172% 47.1% 792 42% 16.4%
Sub total - non defaulted 7,595 63% 3.8% 1,713 41% 2.4% 2,525 36% 7.0%
100% 2,918 - 43.0% 1,092 - 84.4% 3,257 - 50.3%
Total 10,513 2,805 5,782
31 December 2015 31 December 2015 31 December 2015
Secured by immovable property non-SME retail
exposures Qualifying revolving retail exposures SME exposures
Weighted
average risk
weight
Weighted
average EL
Weighted
average risk
weight
Weighted
average EL
Weighted
average risk
weight
Weighted
average EL PD bands € million % % € million % % € million % %
0.00% - 0.03% 140 1% 0.004% 257 2% 0.02% - 1% 0.0%
0.03% - 0.10% 22 1% 0.01% 72 0% 0.00% - - -
0.10% - 0.50% 3,080 8% 0.04% 755 7% 0.1% 62 10% 0.1%0.50% - 1.00% 1,069 18% 0.1% 129 22% 0.5% 424 20% 0.2%1.00% - 2.00% - - - 161 38% 1.0% 156 27% 0.5%2.00% - 3.00% 392 36% 0.4% 111 59% 1.9% 210 28% 0.6%3.00% - 4.00% 3 57% 0.7% 52 74% 2.6% 80 32% 1.0%4.00% - 5.00% 397 59% 0.8% 47 83% 3.1% 371 29% 1.1%5.00% - 10.00% 777 80% 1.3% 210 102% 4.4% 281 34% 2.2%10.00% - 20.00% 895 117% 3.1% 36 152% 9.0% 163 40% 4.0%20.00% - 30.00% 553 139% 5.8% 21 187% 14.8% 159 50% 6.4%30.00% - 50.00% 329 141% 9.8% 25 201% 24.1% 139 53% 9.5%50.00% - 99.99% 283 61% 19.8% 21 170% 38.3% 774 44% 15.5%Sub total - non defaulted 7,940 49% 2.1% 1,898 36% 2.0% 2,818 35% 5.8%
100% 2,310 - 37.6% 1,048 - 83.4% 2,946 - 44.1%
Total 10,250 2,945 5,764
31 December 2014 31 December 2014 31 December 2014
Secured by immovable property non-SME retail exposures Qualifying revolving retail exposures SME exposures
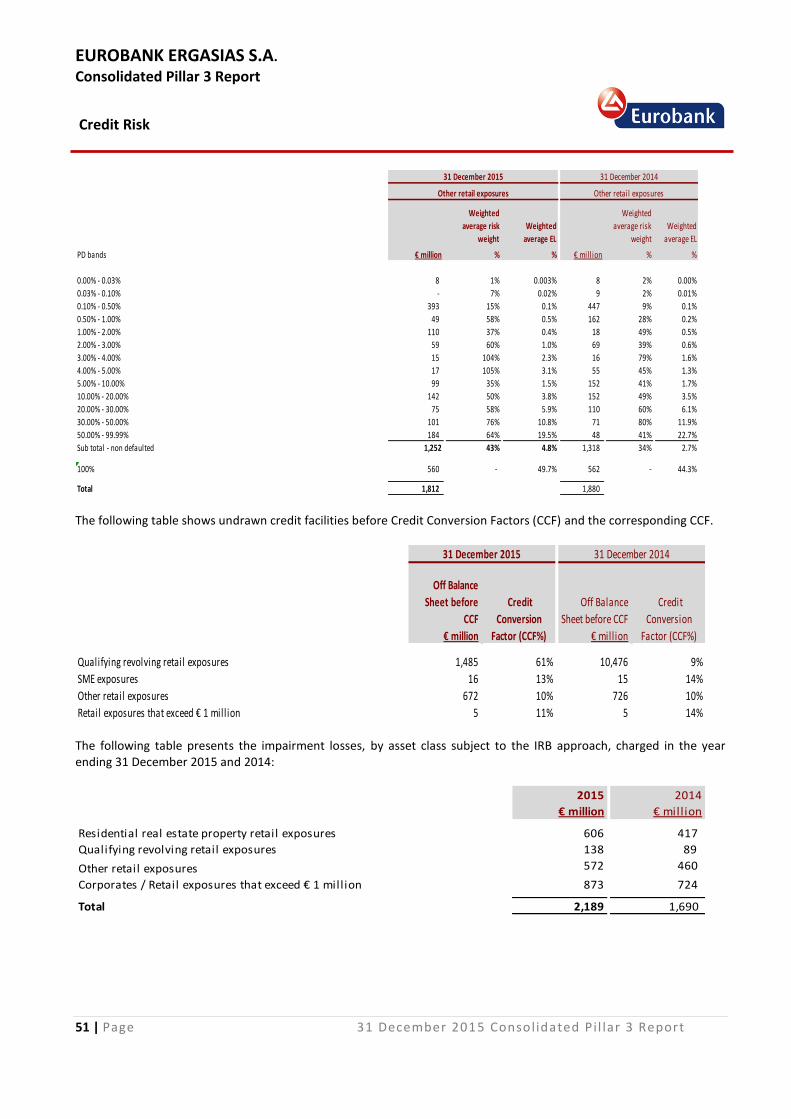
EUROBANK ERGASIAS S.A.
Consolidated Pillar 3 Report
Credit Risk
51 | Page 31 December 2015 Consolidated Pi l lar 3 Report
Weighted
average risk
weight
Weighted
average EL
Weighted
average risk
weight
Weighted
average EL
PD bands € million % % € mill ion % %
0.00% - 0.03% 8 1% 0.003% 8 2% 0.00%
0.03% - 0.10% - 7% 0.02% 9 2% 0.01%
0.10% - 0.50% 393 15% 0.1% 447 9% 0.1%
0.50% - 1.00% 49 58% 0.5% 162 28% 0.2%
1.00% - 2.00% 110 37% 0.4% 18 49% 0.5%
2.00% - 3.00% 59 60% 1.0% 69 39% 0.6%
3.00% - 4.00% 15 104% 2.3% 16 79% 1.6%
4.00% - 5.00% 17 105% 3.1% 55 45% 1.3%
5.00% - 10.00% 99 35% 1.5% 152 41% 1.7%
10.00% - 20.00% 142 50% 3.8% 152 49% 3.5%
20.00% - 30.00% 75 58% 5.9% 110 60% 6.1%
30.00% - 50.00% 101 76% 10.8% 71 80% 11.9%
50.00% - 99.99% 184 64% 19.5% 48 41% 22.7%
Sub total - non defaulted 1,252 43% 4.8% 1,318 34% 2.7%
100% 560 - 49.7% 562 - 44.3%
Total 1,812 1,880
31 December 2015
Other retail exposures
31 December 2014
Other retail exposures
The following table shows undrawn credit facilities before Credit Conversion Factors (CCF) and the corresponding CCF.
Off Balance
Sheet before
CCF
Off Balance
Sheet before CCF
€ million € million
1,485 61% 10,476 9%
SME exposures 16 13% 15 14%
Other retail exposures 672 10% 726 10%
5 11% 5 14%
Credit
Conversion
Factor (CCF%)
Credit
Conversion
Factor (CCF%)
Qualifying revolving retail exposures
Retail exposures that exceed € 1 million
31 December 2015 31 December 2014
The following table presents the impairment losses, by asset class subject to the IRB approach, charged in the year ending 31 December 2015 and 2014:
2015 2014
€ million € million
606 417
138 89
572 460
873 724
2,189 1,690 Total
Residential real estate property retail exposures
Qualifying revolving retail exposures
Other retail exposures
Corporates / Retail exposures that exceed € 1 million
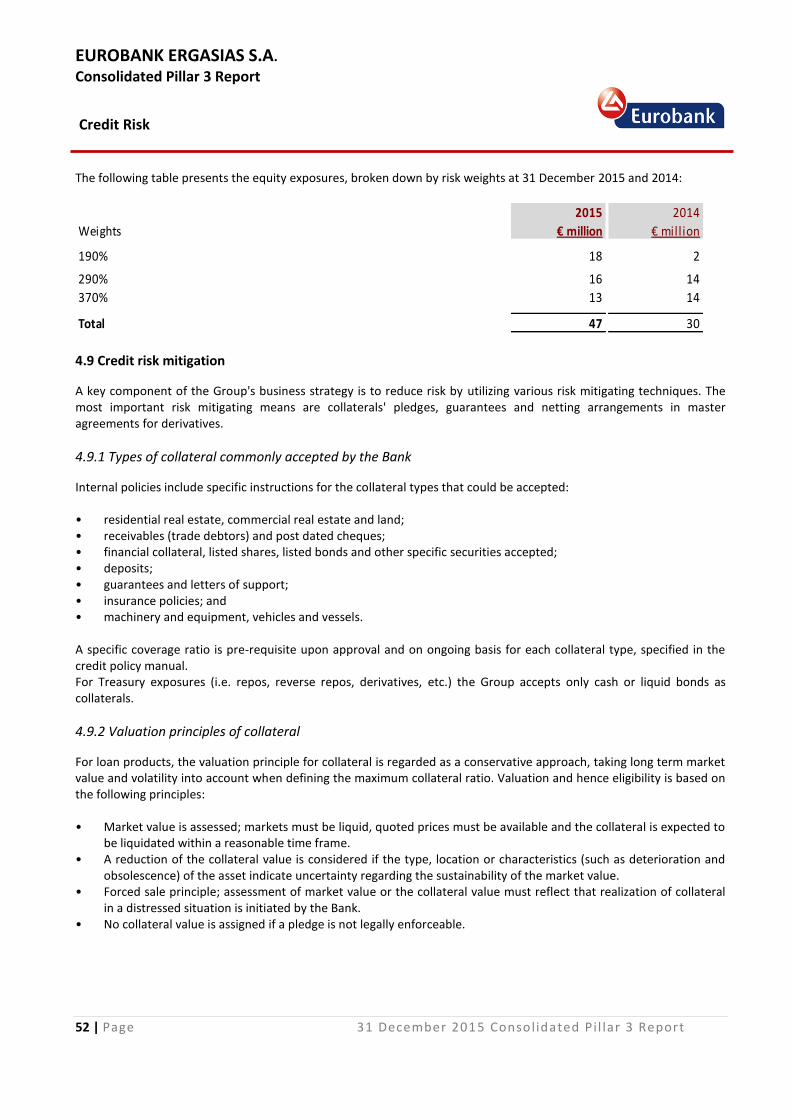
EUROBANK ERGASIAS S.A.
Consolidated Pillar 3 Report
Credit Risk
52 | Page 31 December 2015 Consolidated Pi l lar 3 Report
The following table presents the equity exposures, broken down by risk weights at 31 December 2015 and 2014:
2015 2014
Weights € million € million
190% 18 2
290% 16 14
370% 13 14
Total 47 30 4.9 Credit risk mitigation
A key component of the Group's business strategy is to reduce risk by utilizing various risk mitigating techniques. The most important risk mitigating means are collaterals' pledges, guarantees and netting arrangements in master agreements for derivatives.
4.9.1 Types of collateral commonly accepted by the Bank
Internal policies include specific instructions for the collateral types that could be accepted: • residential real estate, commercial real estate and land; • receivables (trade debtors) and post dated cheques; • financial collateral, listed shares, listed bonds and other specific securities accepted; • deposits; • guarantees and letters of support; • insurance policies; and • machinery and equipment, vehicles and vessels. A specific coverage ratio is pre-requisite upon approval and on ongoing basis for each collateral type, specified in the credit policy manual. For Treasury exposures (i.e. repos, reverse repos, derivatives, etc.) the Group accepts only cash or liquid bonds as collaterals.
4.9.2 Valuation principles of collateral
For loan products, the valuation principle for collateral is regarded as a conservative approach, taking long term market value and volatility into account when defining the maximum collateral ratio. Valuation and hence eligibility is based on the following principles: • Market value is assessed; markets must be liquid, quoted prices must be available and the collateral is expected to
be liquidated within a reasonable time frame. • A reduction of the collateral value is considered if the type, location or characteristics (such as deterioration and
obsolescence) of the asset indicate uncertainty regarding the sustainability of the market value. • Forced sale principle; assessment of market value or the collateral value must reflect that realization of collateral
in a distressed situation is initiated by the Bank. • No collateral value is assigned if a pledge is not legally enforceable.

EUROBANK ERGASIAS S.A.
Consolidated Pillar 3 Report
Credit Risk
53 | Page 31 December 2015 Consolidated Pi l lar 3 Report
Real estate collaterals for all units are valued by Eurobank Property Services S.A., a subsidiary of the Bank, which reports to the Group Chief Risk Officer. Eurobank Property Services S.A is regulated by the Royal Institute of Chartered Surveyors (RICS) and employs internal or external qualified appraisers based on predefined criteria (qualifications and expertise). All appraisals take into account, among other things, the region, age and marketability of the property, and are further reviewed and countersigned by experienced staff of the subsidiary. The valuation methodology employed is based on IVS and quality controls are in place such as reviewing mechanisms, independent sample reviews by independent well established valuation companies. In 2006, the Bank initiated a project in collaboration with other banks in Greece to develop a real estate property index (Prop. Index) for residential properties. The methodology, which was developed by an independent specialized statistical company, has been approved by the Bank of Greece and its use enables a dynamic monitoring of residential property values and market trends, on an annual basis. For commercial real estate, re-valuations are performed by qualified property valuers within a time horizon of two to three years. More frequent re-valuations either on site or desktop are performed for material exposures, borrowers downgraded to watchlist / high risk areas and for borrowers active in the Real Estate sector. To ensure the quality of post-dated cheques accepted as collateral, the Bank has developed a pre-screening system, which takes into account a number of criteria and risk parameters, so as to evaluate their eligibility. Furthermore, the post-dated cheques’ valuation is monitored weekly through the use of advanced statistical reports and monthly through detailed information regarding recoverability of cheques, referrals and bounced cheques, per issuer broken down by business unit (corporate and small business banking). In case of reverse repos, the bonds received as collateral are evaluated on a daily basis by the official valuation system. All these are monitored via credit exposure measurement system that takes into account the specific characteristics of every contract.
4.9.3 Collateral policy and documentation
For loan products, Group instructions emphasize that practices and routines followed are timely and prudent in order to ensure that collateral items are controlled by the Group’s entities and that the loan and pledge agreement, as well as the collateral is legally enforceable. Therefore, the Group’s entities hold the right to liquidate collateral in the event of the obligor’s financial distress and can claim and control cash proceeds from a liquidation process. The Group uses to a large extent standard loan and pledge agreements, ensuring legal enforceability. The application of CSA (Credit Support Annex) and GMRA (Global Master Repurchase Agreements) contracts determines the cash that should be paid or received in case of derivatives and repos contracts.
4.9.4 Guarantees and credit derivatives
The guarantees used as credit risk mitigation by the Group are largely issued by central and regional governments in the countries in which it operates. The Public Fund for very small businesses (ETEAN) and similar funds, banks and insurance companies are also important guarantors of credit risk. The Bank enters into credit derivative transactions with both retail and investment banks. The lowest counterparty rating is A, whereas the average counterparty rating is AA (Standard & Poor’s rating scale). Only eligible providers of guarantees and credit derivatives can be recognized in the Standardised and Foundation IRB approach for credit risk. All central governments, regional governments and institutions are eligible. Guarantees issued by corporate entities can only be taken into account if their rating corresponds to A- (Standard & Poor’s rating scale) or better.

EUROBANK ERGASIAS S.A.
Consolidated Pillar 3 Report
Credit Risk
54 | Page 31 December 2015 Consolidated Pi l lar 3 Report
The table below shows guarantees received broken down by primary type of guarantee as at 31 December 2015 and 2014:
2015 2014
€ million € million
Guarantees issued by Central Banks or Central Governments 195 217
157 215
352 432
Guarantees issued by Banks
4.9.5 Netting agreements
The Group further restricts its exposure to credit losses by entering into master netting arrangements with counterparties with which it undertakes a significant volume of transactions. Master netting arrangements do not generally result in an offset of balance sheet assets and liabilities, as transactions are usually settled on a gross basis. However, the credit risk is reduced by a master netting agreement to the extent that if an event of default occurs, all amounts with the counterparty are terminated and settled on a net basis. The Group's overall exposure to credit risk on derivative instruments subject to master netting arrangements can change substantially within a short period, as it is affected by each transaction subject to the arrangement. For treasury exposures the Group uses standardised ISDA (International Swaps and Derivatives Association) contracts and GMRA contracts for the application of netting agreements on derivatives and repos, respectively. An exposure measurement system is used for the daily monitoring of the net exposure after netting application and collateral exchange.
4.9.6 Concentration risk on collaterals
For loan products, the most commonly accepted collaterals for credit risk mitigation purposes are real estate and post dated cheques. Consumer loans are not collateralized, except for car loans where the Bank retains ownership until full loan repayment. Mortgage loans are fully collateralized. Τhe Bank does not undertake significant market or credit risk on collaterals of Treasury transactions. In case of cash collateral in foreign currency transactions, the Bank manages the respective foreign exchange exposure accordingly. Furthermore since the Bank uses GMRAs for the risk mitigation of repos and reverse repos, the market risk exposure is minimal. In case of reverse repo transactions the Bank generally accepts high quality government issues as collaterals. The collateral amount on corporate bonds is immaterial.

EUROBANK ERGASIAS S.A.
Consolidated Pillar 3 Report
Credit Risk
55 | Page 31 December 2015 Consolidated Pi l lar 3 Report
4.9.7 Analysis of collaterals
The table below show collateral received broken down by primary type of collateral at 31 December 2015 and 2014:
Recognized
financial Real estate Other Credit
collateral property Guarantees collaterals Derivatives Total
€ million € million € million € million € million € million
Credit risk (pursuant Standardised approach)
Central governments or central banks 5,324 - - - - 5,324
Regional governments or local authorities 3 - - - - 3
Public sector entities 1 - 10 - - 11
Multilateral development banks 180 - - - - 180
Institutions 3,968 - - - - 3,968
Corporates (excluding past due and secured by real estate property) 1,146 - 82 - - 1,228
Retail (excluding past due and secured by real estate property) 109 - 34 - - 143
Secured by mortgages on immovable property (excluding past due) - 6,068 3 - - 6,071
Exposures in default 1 1,103 1 - - 1,105
Items associated with particularly high risk 1 588 2 - - 591
Credit risk total, Standardised approach 10,733 7,759 132 - - 18,624
Credit risk (pursuant IRB approach)
Corporate exposures
- Corporate exposures 379 4,267 105 1,592 - 6,343
- Retail exposures that exceed € 1 mill ion 6 331 2 1 - 340
Retail exposures
- Secured by immovable property non-SME 18 10,495 2 - - 10,515
- Qualifying revolving retail exposures - - - - - -
- SME exposures 114 3,870 111 48 - 4,143
- Other retail exposures 75 1,190 - - - 1,265
Credit risk total, IRB approach 592 20,153 220 1,641 - 22,606
Credit risk total 11,325 27,912 352 1,641 - 41,230
31 December 2015

EUROBANK ERGASIAS S.A.
Consolidated Pillar 3 Report
Credit Risk
56 | Page 31 December 2015 Consolidated Pi l lar 3 Report
Recognized financial Real estate Other Credit
collateral property collaterals Derivatives Total€ million € million € million € million € million € million
Credit risk (pursuant Standardised approach)Central governments or central banks 12,650 - - - - 12,650Public sector entities 408 - 16 - - 424Multilateral development banks 196 - - - - 196Institutions 9,592 - - - - 9,592Corporates (excluding past due and secured by real estate property) 984 - 126 - - 1,110Retail (excluding past due and secured by real estate property) 108 - 33 - - 141Secured by mortgages on immovable property (excluding past due) - 5,928 3 - - 5,931Exposures in default 5 1,121 3 - - 1,129Items associated with particularly high risk 9 548 - - - 557
Credit risk total, Standardised approach 23,952 7,597 181 - - 31,730
Credit risk (pursuant IRB approach)Corporate exposures - Corporate exposures 407 4,482 140 1,594 - 6,623 - Retail exposures that exceed € 1 million 8 327 2 3 - 340Retail exposures - Secured by immovable property non-SME 22 10,228 3 - - 10,253 - Qualifying revolving retail exposures - - - - - - - SME exposures 121 3,837 106 85 - 4,149 - Other retail exposures 108 1,172 - 1 - 1,281
666 20,046 251 1,683 - 22,646
Credit risk total 24,618 27,643 432 1683 - 54,376
Note:1. The value of collaterals shown above is the allocated value of securities.2. Financial collaterals are presented after regulatory haircuts.3. For real estate property the lower between market value and the pledged amount is considered.4. The "Other collaterals" category includes vessels of € 755 million (2014: € 701 million) securing shipping exposures under the slotting-specialised lending category.
31 December 2014
Guarantees
4.10 Asset Backed Securities
4.10.1 Bank's objectives and role
The Bank has securitized various financial assets. Up to August 2007 the objective of the Bank in each of its securitization transactions was to convert illiquid receivables to “tradeable” securities, to be placed with investors for long-term funding. Since then the objective of the Bank in each securitization transaction is to convert illiquid receivables to 'tradeable' securities that are eligible for financing. In all the securitization transactions the Bank acts, among other, as the Originator, the Servicer, the Sponsor, the Cash Manager and the Account Bank. The Bank also provides the issuer with the subordinated reserve loan in order to fund the reserve account up to the initial required amount. The Bank has not proceeded with any synthetic securitization and re-securitization.

EUROBANK ERGASIAS S.A.
Consolidated Pillar 3 Report
Credit Risk
57 | Page 31 December 2015 Consolidated Pi l lar 3 Report
4.10.2 Methodology for risk weightings
For the purchased securities exposures the Bank applies the Ratings Based Approach (RBA) for the risk weighting of asset backed securities. According to this approach the risk weight factor that applies is a function of the rating and seniority of the security.
4.10.3 Accounting policies
The Group sponsors the formation of special purpose entities, which may or may not be directly owned subsidiaries for the purpose of asset securitization. The entities may acquire assets directly from the Bank. These companies are bankruptcy-remote entities and are consolidated in the Group's Financial Statements when the substance of the relationship between the Group and the entity indicates that the entity is controlled by the Group. The Group securitizes various financial assets, which generally results in the sale of the assets to special purpose entities, which, in turn issue debt securities to investors. Interests in the securitized financial assets may be retained in the form of subordinated tranches or other residual interests. The Bank under the current securitization framework retains substantially all risks and rewards. The securitized loan portfolios are accounted for, according to the same methodology as non-securitized portfolios. For more information about asset backed securities refer to Consolidated Financial Statements Note 36.
4.10.4 Securitized exposures
The following table presents the risk weights of the purchased securitized exposures of the Group, based on the IRB approach, at 31 December 2015 and 2014:
2015 2014
€ million € million
Risk weight: to 10% 137 154
Risk weight: over 12% to 18% 13 31
Risk weight: over 20% to 35% 69 89
Risk weight: over 40% to 75% 5 -
Risk weight: over 75% under 250% - 6
Risk weight: 250% to 625% - 5
Total 224 285 For securitization exposures the Group uses one or more of the following external rating agencies: Moody’s, Standard & Poor’s and Fitch (refer to par. 4.7).

EUROBANK ERGASIAS S.A.
Consolidated Pillar 3 Report
Market Risk
58 | Page 31 December 2015 Consolidated Pi l lar 3 Report
5. Market Risk
5.1 Definition and policies
Market risk is the potential loss occurring from changes in interest and foreign exchange rates, equities and commodity prices, as well as market volatilities. In order to ensure the efficient monitoring of market risks that emanate from its overall activities, the Group adheres to certain principles and policies. The objectives of the market risk policies applied by the Group are to: • establish an effective market risk monitoring and management framework at Group level; • ensure regulatory compliance; and • create a competitive advantage over competition through more accurate assessment of the risks assumed.
5.2 Internal model - Value at Risk (VaR) model & Credit Risk (IRC)
The Bank uses its own, validated by the Bank of Greece since 2005, internal VaR model in order to calculate capital requirements for market risk in its trading book, for the Bank's activities in Greece. VaR is a statistical risk measure of the maximum loss that the Bank may, under normal market conditions, incur over a certain period of time with a certain confidence level. For example, a 99% 1 day VaR of € 1 million means that there is a 99% probability that the Bank will not lose more than € 1 million within the next day. The internal model described above covers the following risks: • Interest rate risk: the risk of losses because of changes in interest rates. • Foreign exchange risk: the risk of losses on foreign currency positions because of changes in exchange rates. • Equity risk: the risk of losses because of changes in equity prices, equity indices and mutual funds. • Commodity risk: the risk of losses because of changes in commodity prices. • Volatility risk: the risk of losses on option positions because of changes in implied volatility levels. Market risk of the Group, with the exclusion of International operations, is managed and monitored using Value at Risk (VaR) methodology. Market risk in International operations is managed and monitored using mainly sensitivity analyses. Information from International operations is presented separately as it originates from significantly different economic environments with different risk characteristics. The internal VaR model is based on the Monte Carlo simulation. The VaR is calculated on 99% confidence level and for a 1 day holding period. Full repricing is applied on every position of the portfolio. This means that the model covers all types of non linear instruments (i.e. options). VaR models are designed to measure market risk under normal market environment. It is assumed that any changes in the risk factors follow a normal distribution. Since VaR constitutes an integral part of the Group's market risk control regime, VaR limits have been established for all (trading and non trading portfolio) operations and actual exposure is reviewed daily by management. From 31.12.2011 the Bank implemented the Stressed VaR and Incremental Risk Charge (IRC) using the internal model as requested by Basel 2.5 framework. IRC is computed on all fixed income positions in Bank’s trading activities in Greece. It estimates the incremental risk arising from rating migrations and defaults, using Monte Carlo simulation, to a 99.9% confidence level over a one year holding period. The model was approved by Bank of Greece on 31.12.2011. The Bank’s exposure to commodities and volatilities is immaterial. The following table presents the VaR figures, performed on 99% confidence interval for 1 day holding period, by risk type, for trading and banking book in Greece, Cyprus and Luxembourg for 2015 and 2014:
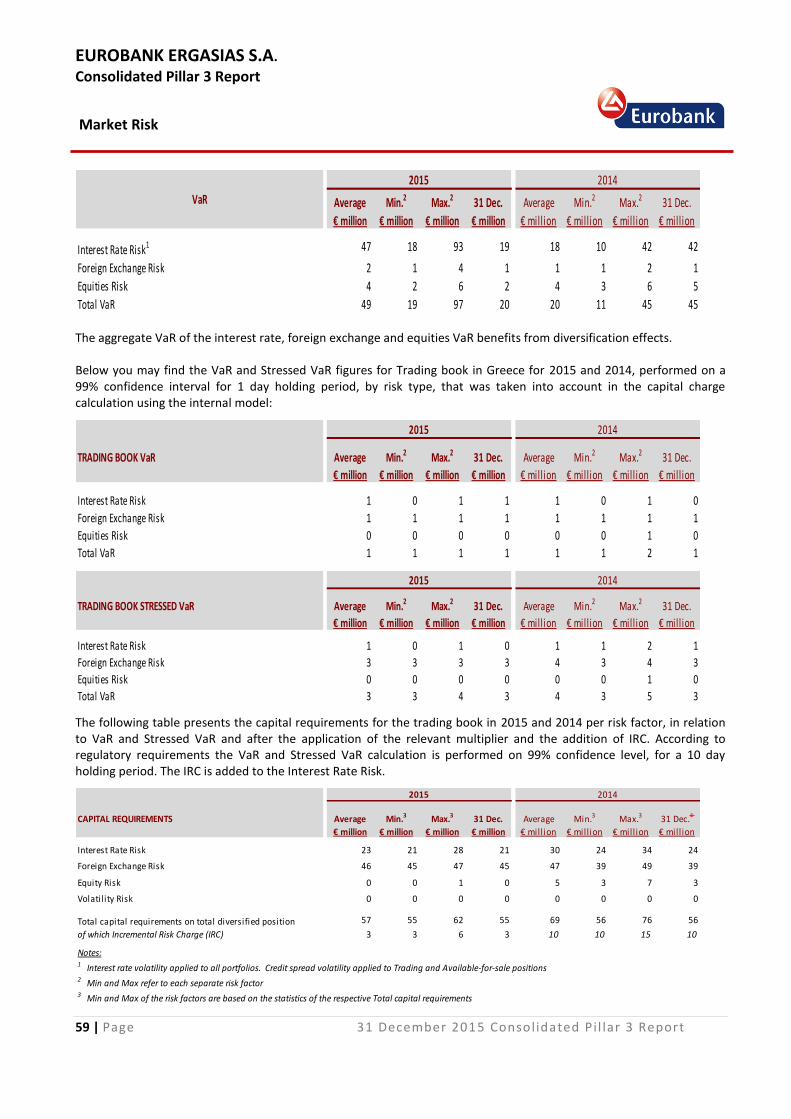
EUROBANK ERGASIAS S.A.
Consolidated Pillar 3 Report
Market Risk
59 | Page 31 December 2015 Consolidated Pi l lar 3 Report
Average Min.2 Max.2 31 Dec. Average Min.2 Max.2 31 Dec.
€ million € million € million € million € million € million € million € million
Interest Rate Risk1 47 18 93 19 18 10 42 42
Foreign Exchange Risk 2 1 4 1 1 1 2 1
Equities Risk 4 2 6 2 4 3 6 5
Total VaR 49 19 97 20 20 11 45 45
2015 2014
VaR
The aggregate VaR of the interest rate, foreign exchange and equities VaR benefits from diversification effects. Below you may find the VaR and Stressed VaR figures for Trading book in Greece for 2015 and 2014, performed on a 99% confidence interval for 1 day holding period, by risk type, that was taken into account in the capital charge calculation using the internal model:
Average Min.2 Max.2 31 Dec. Average Min.2 Max.2 31 Dec.
€ million € million € million € million € million € million € million € million
Interest Rate Risk 1 0 1 1 1 0 1 0
Foreign Exchange Risk 1 1 1 1 1 1 1 1
Equities Risk 0 0 0 0 0 0 1 0
Total VaR 1 1 1 1 1 1 2 1
TRADING BOOK VaR
2015 2014
Average Min.2 Max.2 31 Dec. Average Min.2 Max.2 31 Dec.
€ million € million € million € million € million € million € million € million
Interest Rate Risk 1 0 1 0 1 1 2 1
Foreign Exchange Risk 3 3 3 3 4 3 4 3
Equities Risk 0 0 0 0 0 0 1 0
Total VaR 3 3 4 3 4 3 5 3
2015 2014
TRADING BOOK STRESSED VaR
The following table presents the capital requirements for the trading book in 2015 and 2014 per risk factor, in relation to VaR and Stressed VaR and after the application of the relevant multiplier and the addition of IRC. According to regulatory requirements the VaR and Stressed VaR calculation is performed on 99% confidence level, for a 10 day holding period. The IRC is added to the Interest Rate Risk.
CAPITAL REQUIREMENTS Average Min.3 Max.3 31 Dec. Average Min.3 Max.3 31 Dec.4
€ million € million € million € million € mill ion € mill ion € mill ion € mill ion
23 21 28 21 30 24 34 24
Foreign Exchange Risk 46 45 47 45 47 39 49 39
0 0 1 0 5 3 7 3
0 0 0 0 0 0 0 0
57 55 62 55 69 56 76 56
of which Incremental Risk Charge (IRC) 3 3 6 3 10 10 15 10
Notes:1 Interest rate volatility applied to all portfolios. Credit spread volatility applied to Trading and Available-for-sale positions2 Min and Max refer to each separate risk factor 3 Min and Max of the risk factors are based on the statistics of the respective Total capital requirements
Total capital requirements on total diversified position
2015 2014
Interest Rate Risk
Equity Risk
Volatil ity Risk

EUROBANK ERGASIAS S.A.
Consolidated Pillar 3 Report
Market Risk
60 | Page 31 December 2015 Consolidated Pi l lar 3 Report
Total Capital requirements figure is less than the sum of the individual figures for Foreign Exchange, Interest Rate, Equities and Volatility, due to diversification.
5.2.1 Stress testing
Given that the VaR approach does not cover extreme market conditions, the Group has been applying stress tests, to simulate the effect of many standard deviation movements of risk factors and the breakdown of historical correlations. The main types of stress tests performed are subjective stress tests, where the portfolios are exposed to scenarios for risk factors that are deemed particularly relevant (depreciation of foreign currencies, yield curves parallel shifts, long term steepening, long term flattening, 10σ upward shift, credit spread increase, equities prices reduction and implied volatilities adverse moves).
5.2.2 Back testing
The Bank employs back testing controls in order to test the calibration and predictive capabilities of its internal risk assessment model. Back testing is applied through comparison of daily VaR readings to portfolio value changes. Back testing for 2015 revealed seven (7) exceptions out of total of 250 working days, six of which were attributed to FX volatility and one was attributed both to FX, interest rate and spread adverse moves. According to the regulatory framework this number of exceptions results to a multiplier equal to 3.65 for capital adequacy calculations for market risk. Backtesting for 2014 revealed two (2) exceptions, the one statistical, the other attributed to FX volatility, which according to the regulatory framework resulted, for 2014, to a multiplier equal to 3 for capital adequacy calculations for market risk.
5.3 Standardised approach for market risk
The Bank uses the Standardised approach for the measurement of market risk exposure and capital requirements of its subsidiaries in Greece and in International operations. The following table summarizes the capital requirements for market risk per risk factor, based on the Standardised approach, at 31 December 2015 and 2014:
2015 2014
€ million € million
General risk of traded debt instruments 2 3
Specific risk of traded debt instruments - 2
General and specific risks of equities - 2
Credit valuation adjustment risk (CVA) 11 -
Foreign exchange risk 35 31
Total 48 38 5.4 Equity exposures not included in the trading book
Available-for-sale equity investments are those intended to be held for an indefinite period of time, which may be sold in response to needs for liquidity or changes in equity prices. Purchase and sales of equity available-for-sale investments are recognized on trade date, the date on which the Group commits to purchase or sell the equity investment. Initial recognition is at fair value plus transaction costs. Derecognition occurs when the rights to receive cash flows from those investments have expired or where the Group has transferred substantially all risks and rewards of ownership. Available-for-sale equity investments are subsequently carried at fair value. Gains and losses arising from changes in fair value are recognized directly in equity until the financial asset is derecognized or impaired at which time the cumulative gain or loss previously recognized in equity is recognized in profit or loss.

EUROBANK ERGASIAS S.A.
Consolidated Pillar 3 Report
Market Risk
61 | Page 31 December 2015 Consolidated Pi l lar 3 Report
The fair values of quoted investments in active markets are based on current bid prices. If the market for an equity is not active (and for non-listed securities), the Group establishes fair value by using valuation techniques. These include the use of recent arm's length transactions, reference to the current fair value of another instrument that is substantially the same, a discounted cash flow analysis, option pricing models and other valuation techniques commonly used by market participants. In case of equities classified as available-for-sale, a significant or prolonged decline in the fair value of the security below its cost is considered in determining whether the assets are impaired. If any such evidence exists for available-for-sale equities, the cumulative loss – measured as the difference between the acquisition cost and the current fair value, less any impairment loss on that equity investment previously recognized in profit or loss – is removed from equity and recognized in the income statement. Impairment losses recognized in the income statement on equity investments are not reversed through the income statement. As at 31 December 2015, the Group has recognized impairment losses amounting to € 6 million on equity securities (including mutual funds, listed and non-listed equities), for which the decline in fair value below cost is considered to be significant and/or prolonged, as a result of the continuing deterioration in the equity markets. As at 31 December 2014, the Group recognized impairment losses amounting to € 23 million on equity securities. The following table presents equity holdings belonging to the available-for-sale portfolio and included in regulatory exposures at 31 December 2015 and 2014:
2015 2014€ million € million
Held for:Strategic investments 21 28
Equity investments for capital appreciation 129 107 Total 150 135
Listed 29 31 Non-listed 38 27 Other (MF & other type of funds) 83 77
Total 150 135
The table below presents the realized gains/(losses) after tax from disposal of available-for-sale equity investments, as well as the unrealized gains/(losses) from revaluations, at 31 December 2015 and 2014:
2015 2014
€ million € million
Realised gains/(losses) 6 63
Unrealised gains/(losses) 22 14
The amount of unrealized gains of available-for-sale equity investments, recognized in reserves as at 31 December 2015 is included in Common Equity Tier 1 capital.
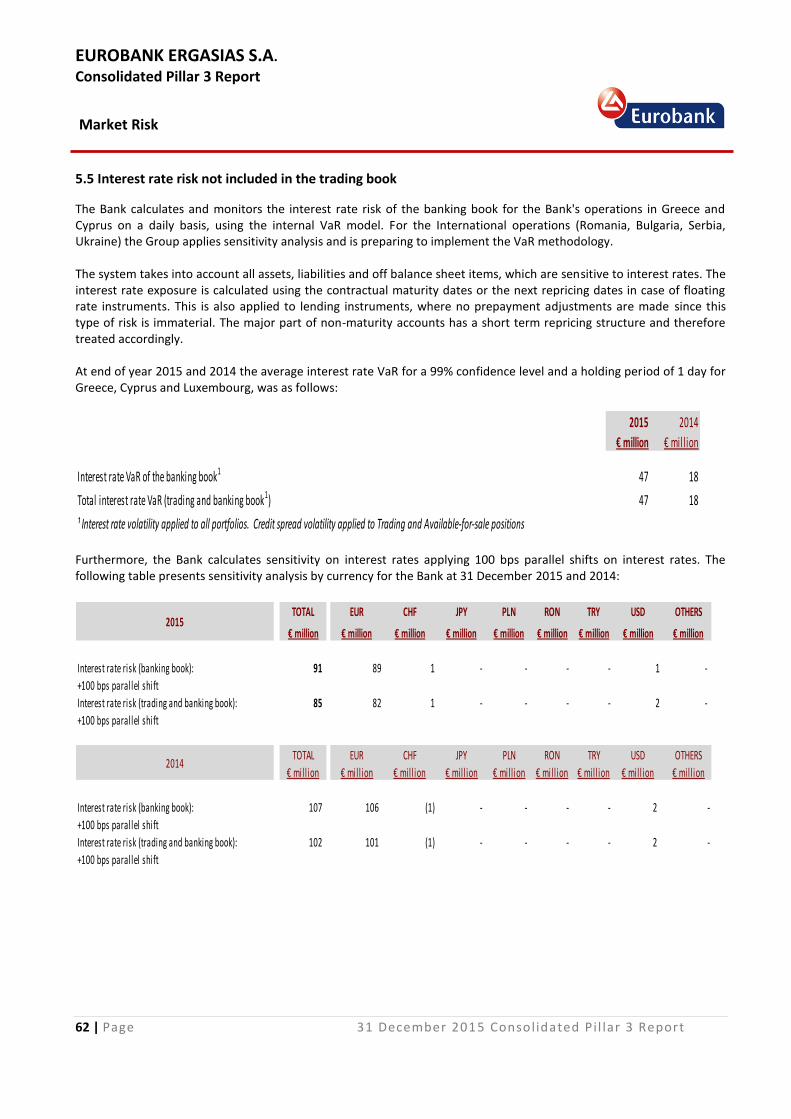
EUROBANK ERGASIAS S.A.
Consolidated Pillar 3 Report
Market Risk
62 | Page 31 December 2015 Consolidated Pi l lar 3 Report
5.5 Interest rate risk not included in the trading book
The Bank calculates and monitors the interest rate risk of the banking book for the Bank's operations in Greece and Cyprus on a daily basis, using the internal VaR model. For the International operations (Romania, Bulgaria, Serbia, Ukraine) the Group applies sensitivity analysis and is preparing to implement the VaR methodology. The system takes into account all assets, liabilities and off balance sheet items, which are sensitive to interest rates. The interest rate exposure is calculated using the contractual maturity dates or the next repricing dates in case of floating rate instruments. This is also applied to lending instruments, where no prepayment adjustments are made since this type of risk is immaterial. The major part of non-maturity accounts has a short term repricing structure and therefore treated accordingly. At end of year 2015 and 2014 the average interest rate VaR for a 99% confidence level and a holding period of 1 day for Greece, Cyprus and Luxembourg, was as follows:
2015 2014
€ million € million
Interest rate VaR of the banking book1 47 18
Total interest rate VaR (trading and banking book1) 47 18
¹ Interest rate volatility applied to all portfolios. Credit spread volatility applied to Trading and Available-for-sale positions Furthermore, the Bank calculates sensitivity on interest rates applying 100 bps parallel shifts on interest rates. The following table presents sensitivity analysis by currency for the Bank at 31 December 2015 and 2014:
TOTAL EUR CHF JPY PLN RON TRY USD OTHERS
€ million € million € million € million € million € million € million € million € million
91 89 1 - - - - 1 -
+100 bps parallel shift
85 82 1 - - - - 2 -
+100 bps parallel shift
TOTAL EUR CHF JPY PLN RON TRY USD OTHERS
€ million € million € million € million € million € million € million € million € million
107 106 (1) - - - - 2 -
+100 bps parallel shift
102 101 (1) - - - - 2 -
+100 bps parallel shift
Interest rate risk (banking book):
Interest rate risk (trading and banking book):
2014
2015
Interest rate risk (banking book):
Interest rate risk (trading and banking book):
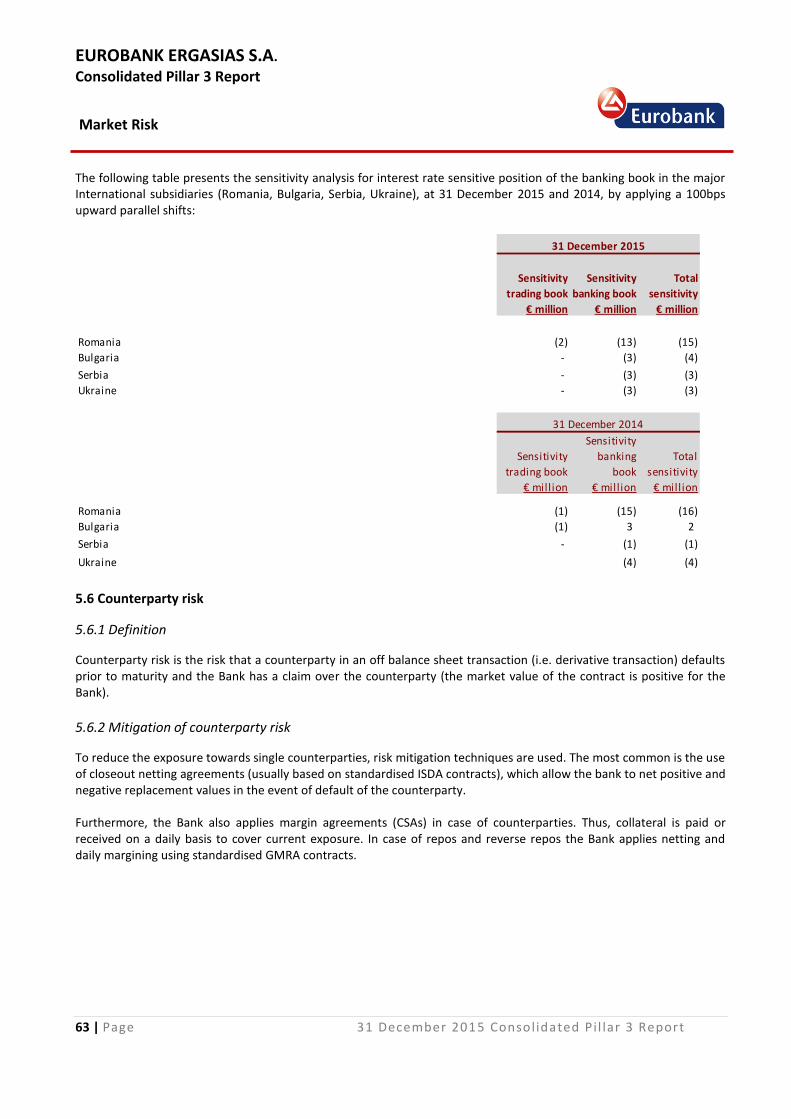
EUROBANK ERGASIAS S.A.
Consolidated Pillar 3 Report
Market Risk
63 | Page 31 December 2015 Consolidated Pi l lar 3 Report
The following table presents the sensitivity analysis for interest rate sensitive position of the banking book in the major International subsidiaries (Romania, Bulgaria, Serbia, Ukraine), at 31 December 2015 and 2014, by applying a 100bps upward parallel shifts:
Sensitivity
trading book
Sensitivity
banking book
Total
sensitivity
€ million € million € million
Romania (2) (13) (15)
Bulgaria - (3) (4)
Serbia - (3) (3)
Ukraine - (3) (3)
Sensitivity
trading book
Sensitivity
banking
book
Total
sensitivity
€ mill ion € mill ion € mill ion
Romania (1) (15) (16)
Bulgaria (1) 3 2
Serbia - (1) (1)
Ukraine (4) (4)
31 December 2015
31 December 2014
5.6 Counterparty risk
5.6.1 Definition
Counterparty risk is the risk that a counterparty in an off balance sheet transaction (i.e. derivative transaction) defaults prior to maturity and the Bank has a claim over the counterparty (the market value of the contract is positive for the Bank).
5.6.2 Mitigation of counterparty risk
To reduce the exposure towards single counterparties, risk mitigation techniques are used. The most common is the use of closeout netting agreements (usually based on standardised ISDA contracts), which allow the bank to net positive and negative replacement values in the event of default of the counterparty. Furthermore, the Bank also applies margin agreements (CSAs) in case of counterparties. Thus, collateral is paid or received on a daily basis to cover current exposure. In case of repos and reverse repos the Bank applies netting and daily margining using standardised GMRA contracts.

EUROBANK ERGASIAS S.A.
Consolidated Pillar 3 Report
Market Risk
64 | Page 31 December 2015 Consolidated Pi l lar 3 Report
5.6.3 Counterparty risk monitoring
The current exposure for counterparty risk at 31 December 2015 and 2014 is presented in the table below:
Current
exposure
before
netting
Current
exposure
after
netting
Netting
effect
Collateral
received /
(paid)
Total exposure
after netting
and margin
collateral
€ million € million € million € million € million
Contracts under ISDA and CSA (derivatives) 1,923 1,129 794 (651) 296
Contracts under GMRA (repos and reverse repos) 245 244 1 (51) 292
Other contracts (derivatives and repos outside ISDA and CSA, GMRA) 77 77 - - 77
Total 2,245 1,450 795 (702) 665
Current
exposure
before
netting
Current
exposure
after netting
Netting
effect
Collateral
received /
(paid)
Total exposure
after netting
and margin
collateral
€ mill ion € mill ion € mill ion € mill ion € mill ion
Contracts under ISDA and CSA (derivatives) 2,158 1,281 877 (585) 318
Contracts under GMRA (repos and reverse repos) 1,303 1,296 7 (206) 1,486
Other contracts (derivatives and repos outside ISDA and CSA, GMRA) 203 203 - - 203
Total 3,664 2,780 884 (791) 2,007
Notes:
1. Netting and collateral posting is applied per counterparty only for contracts under ISDA, CSA or GMRA.
2. Repo and reverse repos with central banks (Bank of Greece, European Central Bank, etc) are excluded.
3. In case of exposure calculation on transactions under GMRA, haircuts are taken into account and increase the exposure.
31 December 2015
31 December 2014
5. In the "Collateral received / (paid)" column we include Greek Treasury bills received as collateral through the CSA signed with Public
Debt Management Agency (PDMA).
4. In case of exposure calculation on transactions under CSA threshold & independent amounts are taken into account and increase the exposure.
EUROBANK ERGASIAS S.A.
Consolidated Pillar 3 Report
Market Risk
65 | Page 31 December 2015 Consolidated Pi l lar 3 Report
5.6.4 Wrong way risk
The Bank prevents the initiation of derivative transactions in cases that the value of the underlying instrument is highly correlated with the credit quality of the counterparty.
5.6.5 Implications under rating downgrade
The Bank's financial collateral agreements (CSAs covering derivative transactions) with other banks contain in some cases rating triggers. For these agreements, the minimum exposure level (threshold amount) for further posting of collateral will be lowered in case of a downgrading. Given the Bank's current rating, the additional effect is immaterial.
5.6.6 Credit derivatives
As of 31 December 2015 the Group held no Credit Default Swap positions. The Bank does not have any brokerage activity in this market. Furthermore, the Bank does not hedge its loan portfolio with CDSs as this market in Greece is not developed.
EUROBANK ERGASIAS S.A.
Consolidated Pillar 3 Report
Operational Risk
66 | Page 31 December 2015 Consolidated Pi l lar 3 Report
6. Operational Risk
6.1 Governance
Acknowledging the fact that operational risk is embedded in every business activity undertaken, the organizational governance stems from the Board of Directors through the Executive Board and Senior Management to the Heads and staff of every business unit. The organizational governance is applicable to all jurisdictions accordingly. An Operational Risk Unit operates in every subsidiary of the Bank, being responsible for applying the Group's operational risk strategy and framework in the jurisdiction the Bank operates. The Board of Directors monitors, through the Board Risk Committee, the operational risk level and profile including the level of operational losses, their frequency and severity, and through the Audit Committee, the status of operational risk-related control issues. The Operational Risk Committee assesses the operational risks arising from the activities of the Group, ensures that each business entity has appropriate policies and procedures for the control of its operational risk and that prompt corrective action is taken whenever a high risk area is identified. The Group Chief Risk Officer is the sponsor of any operational risk related initiative and ensures implementation of the operational risk policy. The Group Chief Risk Officer has the overall responsibility and oversight of the Operational Risk Units in the countries that the Bank operates. The prime responsibility for operational risk management lies with the respective Heads of each business unit. To this end, every business unit: • Identifies, evaluates and monitors its operational risks and implements risk mitigation techniques; • Assesses control efficiency; • Reports all relevant issues; and • Has access to and uses the common methods and tools introduced by the Operational Risk Sector, in order to
facilitate identification, evaluation and monitoring of operational risk. An OpRisk Partner is assigned in each business unit, being responsible for acting as the internal operational risk manager and coordinator and as a liaison to the Operational Risk Unit. Certain business units have established a dedicated Anti-Fraud Unit/Function, according to the fraud risk to which their operations are exposed. Their main objective is to continuously identify fraud risks and timely undertake all appropriate actions in addressing and mitigating those risks. The Operational Risk Sector is responsible for defining and rolling out the methodology for the identification, assessment, reporting of operational risk in accordance with Board Risk Committee decisions, implementing regulatory requirements and Group guidelines, monitoring the operational risk level and profile and reporting thereon to the Board Risk Committee, and defining and rolling out the methodology for the calculation of the regulatory capital charge for operational risk.
6.2 Operational risk management framework
The Group Operational Risk Framework is built on four elements: • Principles • Governance & Organization • Processes • Infrastructure
EUROBANK ERGASIAS S.A.
Consolidated Pillar 3 Report
Operational Risk
67 | Page 31 December 2015 Consolidated Pi l lar 3 Report
The operational risk management framework and related policies are designed to: • Establish the operational risk framework and governance, aligning Bank’s structure and processes with best
international banking practices; • Introduce risk identification quantification and monitoring processes such as risk and control self-assessment, key
risk indicators, historic risk events collection and scenario analysis; • Establish a common definition and consistent approach for operational risk to enable common identification and
aggregation of operational risk across the Bank; • Establish a proactive operational risk management culture across our business, linking business operations with
the objectives of risk control; • Establish comprehensive and integrated operational risk reporting; • Adhere to the Group guidelines and meet local regulatory requirements and practices relating to operational risk
of the jurisdictions in which Eurobank operates; • Achieve a competitive advantage in terms of operational risk management through risk-based decision making;
and • Leverage international knowledge and good practices on operational risk management. Operational risk processes consist of risk identification, assessment (including measurement and valuation), control management, risk mitigation, risk reporting and performance improvement. These processes are supported by and implemented with the operational risk tools/methods, which are the following: • Risk & Control Self-Assessment (RCSA) is a technique aiming to identify, assess and ultimately mitigate operational
risk. Risks are assessed using documented methodology and then processed in order to rank identified operational risks, reveal high operational risk activities/processes and create operational risk profiles. The approach adopted by the Bank is risk oriented – controls are evaluated as supplementary elements of specific operational risks. The RCSA exercise is carried out on a 12-18 month basis or more often if a material change to the business takes place.
• Key Risk Indicators (KRIs) are metrics based on historical data and are relevant to specific and measurable activities
indicating operational risk exposures. KRIs are quantifiable and expressed as an amount, a percentage or a ratio, assigned to specific operational risks and linked with tolerance.
• Operational Risk Events are identified and reported with the purpose of populating the internal operational risk
events database. Operational risk events are classified according to their owner, cause, risk category, impact, business function and business line.
• Operational Risk Scenario analysis assesses the exposure to a range of significant operational risks through the
examination of extreme or catastrophic yet plausible future events. Scenarios take into account the current and projected business, economic, social and geo-political environment.
• Operational risk reporting, whereby reports are produced for internal and regulatory purposes. • Operational risk capital charge calculation using the appropriate methodology and assumptions. • Fraud risk management which constitutes a major commitment of the Group to mitigate fraud risk and reduce
fraud losses. The Group strategy for combating fraud is based on three main directions: 1) Organizational Initiatives to strategically focus in the fight against fraud and improve coordination, 2) Staff Related Initiatives to raise awareness and to create an anti-fraud culture, and 3) Fraud Prevention and Detection Environment Initiatives to strategically enhance the Group's control
environment against fraud.
Operational risk mitigation, whereby the Bank is covered by the Crime & Professional Liability insurance it buys through the London Market, covering the entirety of its operations Group-wide.
EUROBANK ERGASIAS S.A.
Consolidated Pillar 3 Report
Operational Risk
68 | Page 31 December 2015 Consolidated Pi l lar 3 Report
6.3 Operational risk measurement
As required by Basel III for the use of the Standardised Approach, the Group's business activities have been divided into eight business lines and the annualized gross operating income for 2013, 2014 and 2015 is calculated for each business line. The required business line beta factors are then applied to the relevant business line gross operating income, to establish the required regulatory capital per business line, with these numbers summed together to establish the overall Pillar 1 regulatory capital requirements for operational risk. This calculation represents a revenue based proxy of the Group's operational risk.
EUROBANK ERGASIAS S.A.
Consolidated Pillar 3 Report
Asset encumbrance
69 | Page 31 December 2015 Consolidated Pi l lar 3 Report
7. Asset Encumbrance
7.1 Information on importance of encumbrance
The Bank uses the following main types of encumbrance: i) secured funding through Eurosystem (ECB’s MRO/TLTRO), for this funding the Bank mainly uses as collateral:
retained Law 3723/2008 Pillar 2 bonds, GGBs and GTBs, eligible loans and other eligible debt securities; ii) secured funding (repos) with interbank counterparties backed with high quality securities (mainly EFSF bonds); iii) secured funding with interbank counterparties backed with retained own covered bonds, own ABSs and retained
Law 3723/2008 Pillar 2 issues; iv) covered bonds issuance and securitisations backed with loans, the majority of these issues are retained and part of
them (the senior tranches in case of ABSs) are used for interbank repos as per point (iii) above. During 2015 the Group's secured funding from Eurosystem sources (ECB’s MRO/TLTRO & ELA) from € 12.5 bn in December 2014, reached the level of € 33.3 bn (in the peak of Greek crisis in the summer) and finally decreased to € 25.3 bn in December 2015. During 2015 the Group's secured funding from ECB’s MRO/TLTRO from € 12.5 bn in December 2014 decreased by approximately € 7.2 bn as a result of the increase of secured funding. In July 2015, the interbank/client secured funding was almost eliminated (period of referendum and capital controls) but finally closed at € 4.3 bn, an increase which took place during the two last months of the year following the completion of the Bank’s recapitalization. Within 2015, the Bank increased its secured funding from BOG (emergency liquidity assistance - ELA). The peak funding amount was € 23.1 bn and at the year end the funding decreased to € 20 bn as a result of the completion of the Bank’s share capital increase, deleveraging of assets and increase of deposits. The encumbrance of assets and the encumbrance of assets received by the group as collateral is a centralized function and it is implemented by Eurobank, Greece. The level of secured funding (repos with foreign counterparties) in subsidiaries is immaterial. As of end of year 2015 the over-collateralization in case of secured funding through repos, ECB and ELA was 6%, 5% and 37% accordingly. For the interbank secured funding (repos), the Bank uses the standard terms of the GMRA (Global Master Repurchase Agreement). According to this contract, the exposure between the Bank and its counterparty is calculated on a daily basis and collateral is posted to or received by the counterparty so that the exposure remains almost zero.

EUROBANK ERGASIAS S.A.
Consolidated Pillar 3 Report
Asset encumbrance
70 | Page 31 December 2015 Consolidated Pi l lar 3 Report
7.2 Assets
€ million € million € million € million
- - 150 150
11,481 11,223 4,760 4,722
21,555 34,073
Equity instruments
Debt securities
Other assets
31 December 2015
Carrying
amount of
encumbered
Fair value of
encumbered
assets
Carrying amount
of unencumbered
assets
Fair value of
unencumbered
assets
€ million € million € million € million
- - 146 146
11,637 10,882 4,531 4,271
13,653 43,907
31 December 2014
Carrying amount
of unencumbered
assets
Fair value of
unencumbered
assets
Equity instruments
Debt securities
Other assets
Carrying
amount of
encumbered
assets
Fair value of
encumbered
assets
7.3 Collateral received
€ million € million € million € million
- - 4,833 1,718
11,060 1,837 11,322 2,377 Own debt securities issued other than own covered bonds or ABSs
31 December 2015
Fair value of
encumbered
collateral
received or own
debt securities
issued
Fair value of
collateral
received or own
debt securities
issued available
for encumbrance
31 December 2014
Fair value of
encumbered
collateral
received or own
debt securities
issued
Fair value of
collateral
received or own
debt securities
issued available
for encumbrance
Debt securities
7.4 Encumbered assets/collateral received and associated liabilities
Matching
liabilities,
contingent
liabilities or
securities lent
Assets, collateral
received and own
debt securities
issued other than
covered bonds
and ABSs
encumbered
Matching
liabilities,
contingent
liabilities or
securities lent
Assets, collateral
received and own
debt securities
issued other than
covered bonds and
ABSs encumbered
€ million € million € million € million
31,029 43,687 23,236 38,463 Carrying amount of selected financial liabilities
31 December 201431 December 2015
EUROBANK ERGASIAS S.A.
Consolidated Pillar 3 Report
Leverage Ratio
71 | Page 31 December 2015 Consolidated Pi l lar 3 Report
8. Leverage Ratio
The new regulatory framework has introduced the leverage ratio as a non-risk based measure which is intended to restrict the build-up of excessive leverage from on and off balance sheet items in the banking sector. The leverage ratio is defined as Tier 1 capital divided by the total exposure measure and will be a binding requirement at the beginning of 2018. The bank submits to the regulatory authorities the leverage ratio on quarterly basis and monitors the level and the factors that affect the ratio. The level of the leverage ratio with reference date 31.12.2015 on consolidated basis was at 9.07%, according to the transitional definition of Tier 1 capital, significantly over the 3% minimum threshold applied by the competent authorities. The high level of leverage ratio is a result of the bank’s recent recapitalisation.
In table below, there are detailed disclosures on the Group's leverage ratio with reference date 31.12.2015:
31 December 2015€ million
73,553
(1,534)
- (406)
516
1,372
-
-
(490)
73,011
Adjustment for fiduciary assets recognised on the balance sheet pursuant to the applicable
accounting frameworkbut excluded from the leverage ratio exposure measure to article 429(11)of
Regulation (EU)NO 575/2013
Other adjustments
Total leverage ratio exposure
CRR Leverage Ratio - Disclosure Template
Table LRSum: Summary reconciliation of accountng assets and leverage ratio exposures
Total assets as per published financial statementsAdjustment for entities which are consolidated for accountng puroses but are outside the scope of
regulatory consolidation
Adjustments for derivative financial instrumentsAdjustments for securities financing transactions
Adjustment for off-balance sheet items (ie conversion to credit equivalent amounts of off- balance
sheet exposures) (Adjustment for intragroup exposures excluded from the leverage ratio exposure measure in
accordance with Article 429 (7) of Regulation (EU) No 575/2013)
(Adjustment for exposures excluded from the leverage ratio exposure measure in accordance with
Article 429 (14) of Regulation (EU) No 575/2013)
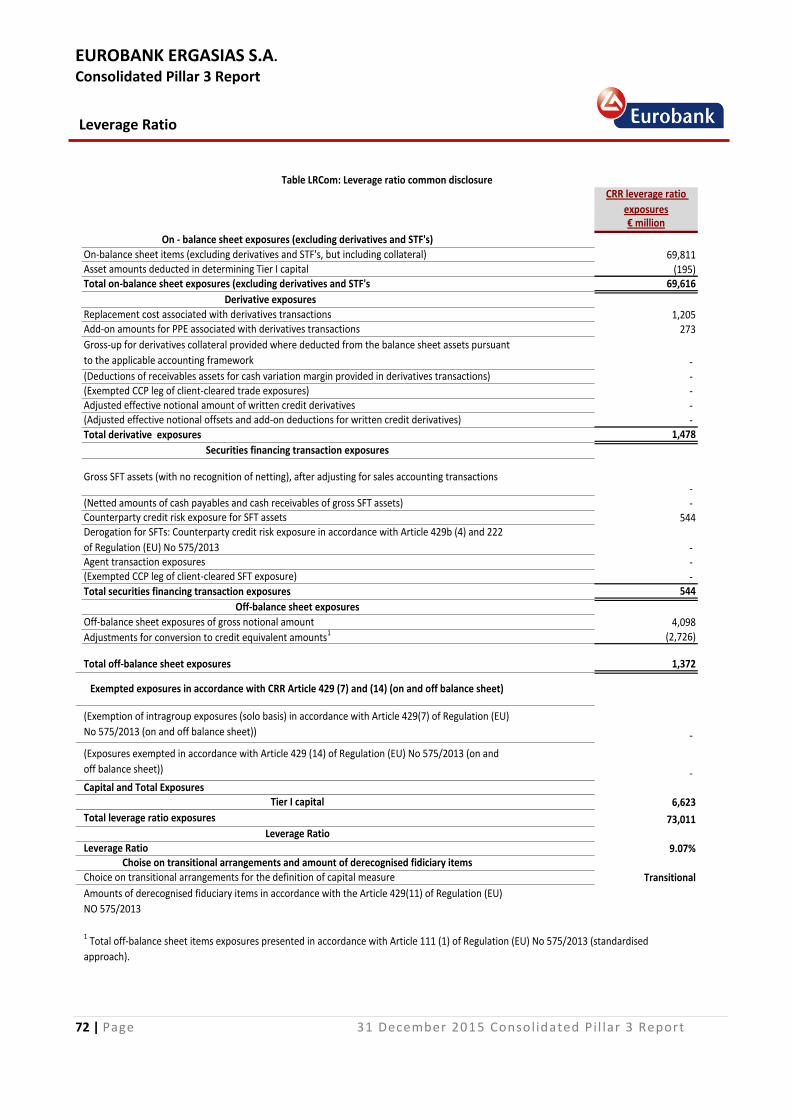
EUROBANK ERGASIAS S.A.
Consolidated Pillar 3 Report
Leverage Ratio
72 | Page 31 December 2015 Consolidated Pi l lar 3 Report
CRR leverage ratio
exposures€ million
69,811(195)
69,616
1,205273
- - - - -
1,478
- -
544
- - -
544
4,098(2,726)
1,372
-
-
6,623
73,011
9.07%
Transitional
Derogation for SFTs: Counterparty credit risk exposure in accordance with Article 429b (4) and 222
of Regulation (EU) No 575/2013Agent transaction exposures
Capital and Total ExposuresTier I capital
Total leverage ratio exposures
Leverage RatioLeverage Ratio
Adjusted effective notional amount of written credit derivatives(Adjusted effective notional offsets and add-on deductions for written credit derivatives)
Total derivative exposures
Replacement cost associated with derivatives transactionsAdd-on amounts for PPE associated with derivatives transactions
Gross-up for derivatives collateral provided where deducted from the balance sheet assets pursuant
to the applicable accounting framework
(Deductions of receivables assets for cash variation margin provided in derivatives transactions)(Exempted CCP leg of client-cleared trade exposures)
On - balance sheet exposures (excluding derivatives and STF's)
On-balance sheet items (excluding derivatives and STF's, but including collateral)Asset amounts deducted in determining Tier I capital
Derivative exposures
Total on-balance sheet exposures (excluding derivatives and STF's
Choise on transitional arrangements and amount of derecognised fidiciary itemsChoice on transitional arrangements for the definition of capital measure
Amounts of derecognised fiduciary items in accordance with the Article 429(11) of Regulation (EU)
NO 575/2013
Exempted exposures in accordance with CRR Article 429 (7) and (14) (on and off balance sheet)
(Exemption of intragroup exposures (solo basis) in accordance with Article 429(7) of Regulation (EU)
No 575/2013 (on and off balance sheet))
(Exposures exempted in accordance with Article 429 (14) of Regulation (EU) No 575/2013 (on and
off balance sheet))
1 Total off-balance sheet items exposures presented in accordance with Article 111 (1) of Regulation (EU) No 575/2013 (standardised
approach).
Adjustments for conversion to credit equivalent amounts1
Table LRCom: Leverage ratio common disclosure
Total off-balance sheet exposures
(Exempted CCP leg of client-cleared SFT exposure)
Total securities financing transaction exposures
Off-balance sheet exposures
Off-balance sheet exposures of gross notional amount
Securities financing transaction exposures
Gross SFT assets (with no recognition of netting), after adjusting for sales accounting transactions
(Netted amounts of cash payables and cash receivables of gross SFT assets)Counterparty credit risk exposure for SFT assets

EUROBANK ERGASIAS S.A.
Consolidated Pillar 3 Report
Leverage Ratio
73 | Page 31 December 2015 Consolidated Pi l lar 3 Report
CRR leverage ratio
exposures€ million
69,811
-
69,811
217
22,031
-
3,200
13,321
Retail exposures 5,714
10,598
8,962
5,768
Institutions
Secured by mortgages of immovable properties
Corporate
Exposure in default
Other exposures (eg equity, securitisations and other non-credit obligation assets)
Total on-balance sheet exposures (excluding derivatives and SFT'S) of which:
Trading book exposures
Banking book exposures of which:
Covered bonds
Exposures treated as sovereigns
Exposures to regional goverments,MOB, international organisations and PSE NOT treates as
sovereigns
Table LRSpl: Split-up on balance sheet exposures (excluding derivatives and SFT's)
EUROBANK ERGASIAS S.A.
Consolidated Pillar 3 Report
Liquidity Risk
74 | Page 31 December 2015 Consolidated Pi l lar 3 Report
9. LIQUIDITY RISK
The Group is exposed to events on a daily basis which affect the level of its available cash resources due to deposits withdrawals, maturity of medium or long term notes, and maturity of secured or unsecured funding (interbank repos and money market takings), loan draw-downs and forfeiture of guarantees. Furthermore, margin calls on secured funding transactions (with ECB and the market) and on risk mitigation contracts (CSAs, GMRAs) result in liquidity exposure. The Group maintains cash resources to meet all of these needs. The Board Risk Committee sets liquidity limits to ensure that sufficient funds are available to meet such contingencies. Past experience shows that liquidity requirements to support calls under guarantees and standby letters of credit are considerably less than the amount of the commitment. This is also the case with credit commitments where the outstanding contractual amount to extend credit does not necessarily represent future cash requirements, as many of these commitments will expire or terminate without being funded. The matching and controlled mismatching of the maturities and interest rates of assets and liabilities is fundamental to the management of the Group. It is unusual for banks to be completely matched, as transacted business is often of uncertain term and of different types. An unmatched position potentially enhances profitability, but also increases the risk of losses. The maturities of assets and liabilities and the ability to replace, at an acceptable cost, interest bearing liabilities as they mature, are important factors in assessing the liquidity of the Group.
Liquidity Risk Management Framework The Group’s Liquidity Risk Management Policy defines the following supervisory and control structure:
Board Risk Committee's role is to approve all strategic liquidity risk management decisions and monitor the quantitative and qualitative aspects of liquidity risk;
Group Assets and Liabilities Committee has the mandate to form and implement the liquidity policies and guidelines in conformity with Group's risk appetite, and to review at least monthly the overall liquidity position of the Group;
Group Treasury is responsible for the implementation of the Group's liquidity strategy, the daily management of the Group’s liquidity and for the preparation and monitoring of the Group’s liquidity budget;
Global Market and Counterparty Risk Sector is responsible for measuring, monitoring and reporting the liquidity of the Group.
The Bank as per ECB, EBA & BoG directives applies risk management policies, processes and controls regarding, Asset Encumbrance/ Liquidity Buffers and Collateral Management, Contingency Funding Plan (CFP), Intraday Liquidity Risk Management and Liquidity Stress Tests. These policies, processes and controls along with the liquidity governance are described in the ILAAP (internal liquidity adequacy assessment process). These policies, processes and controls are applicable in the specific Greek macro-economic environment, Banks’ business model and market conditions on wholesale funding.
Liquidity Buffer The Group holds a diversified portfolio of cash and high liquid assets to support payment obligations and contingent deposit withdrawals in a stressed market environment. The Group's assets held for managing liquidity risk comprise: (a) Cash and balances with central banks; (b) Eligible bonds and other financial assets for collateral purposes; (c) Interbank placings maturing within one month.
EUROBANK ERGASIAS S.A.
Consolidated Pillar 3 Report
Liquidity Risk
75 | Page 31 December 2015 Consolidated Pi l lar 3 Report
The unutilized assets, containing highly liquid and central banks eligible assets, provide a contingent liquidity reserve of € 6 bn as at 31 December 2015 (2014: € 14.5 bn). In addition the Group holds other types of highly liquid assets, as defined by the regulator, amounting to € 2.2 bn (cash value) (2014: € 2.1 bn). It should be noted that the major part of ECB’s available collateral of € 2.2 bn (cash value) is held by Group’s subsidiaries for which temporary local regulatory restrictions are applied and currently limit the level of its transferability between group entities.
Wholesale and Eurosystem’s Funding
Due to the Greek sovereign debt crisis, Greek banks obtained part of their funding through the European Central Bank (ECB) and the Bank of Greece (BoG). The Group’s dependence from the Eurosystem reached its peak for 2015 during the first days of July (9 July 2015: € 33.3 bn, of which € 23.1 bn funding from ELA), as an outcome of the increased uncertainty in Greece, which resulted in significant deposit outflows and led to the imposition of capital controls together with a temporary bank holiday on 28 June 2015. The credibility of the Greek banking system was significantly restored following the final agreement on the three year ESM–program in mid-August 2015 and the reduction of the political uncertainty in Greece after the September elections. Additionally, in November 2015, following the announcement of the results of the CA which was conducted by ECB/ SSM during the second half of 2015, the Bank completed the share capital increase of € 2,039 million, with a gross cash effect of €1.6 bn. The abovementioned positive developments resulted in a significant increase of the Bank’s access to secured funding sources by €4.6 bn at the end of 2015 compared to the peak of crisis, with repos on EFSF bonds that were transferred out of ECB collateral pool and in a significant increase of customer deposits in Greece equivalent to € 1 bn. As at 31 December 2015, the Bank's net funding from ECB and ELA stood at € 5.3 bn and € 20 bn respectively (2014: ECB € 12.5 bn).
LCR calculations LCR is not an appropriate metric for liquidity risk for banks that are experiencing a system wide crisis for an extended period as is the case for Greek Banks.

EUROBANK ERGASIAS S.A.
Consolidated Pillar 3 Report
Appendix 1: Transitional own funds disclosure
76 | Page 31 December 2015 Consolidated Pi l lar 3 Report
Appendix 1: Transitional own funds disclosure
2015 2015 2014 2014
Current
periodFull impact
Current
periodFull impact
€ million € million € mill ion € mill ion
1 Capital instruments and the related share premium accounts 8,712 8,712 11,094 11,094
2 Retained earnings (5,466) (5,466) (8,682) (8,682)
3 Accumulated other comprehensive income (and other reserves, to include unrealised gains and
losses under the applicable accounting standards)3,405 3,406 3,416 3,416
Public sector capital injections grandfathered until 1 January 2018 950 - 950 -
5 Minority interests (amount allowed in consolidated CET1) 401 1 532 -
5a Independently reviewed interim profits net of any foreseeable charge or dividend - - - -
6 Common Equity Tier 1 (CET1) capital before regulatory adjustments 8,002 6,653 7,310 5,828
8 Intangible assets (net of related tax l iability) (negative amount) (51) (127) (30) (148)
10 Deferred tax assets that rely on future profitability excluding those arising from temporary
differences (net of related tax liability where the conditions in Article 38 (3) are met) (negative
amount)
(127) (319) (71) (353)
11 Fair value reserves related to gains or losses on cash flow hedges 69 69 107 107
12 Negative amounts resulting from the calculation of expected loss amounts - - (19) (94)
14 Gains or losses on liabilities valued at fair value resulting from changes in own credit standing - - (3) (3)
16 Direct and indirect holdings by an institution of own CET1 instruments (negative amount) (4) (4) (1) (1)
22 Amount exceeding the 15% threshold (negative amount) - - (35) -
23 of which: direct and indirect holdings by the institution of the CET1 instruments of financial sector
entities where the institution has a significant investment in those entities- - (13) -
24 Empty Set in EU - -
25 of which: deferred tax assets arising from temporary differences - - (22) -
25a Losses for the current financial year (negative amount) (1,181) (1,181) (1,219) (1,219)
26bAmount to be deducted from or added to Common Equity Tier 1 capital with regard to additional
fi lters and deductions required pre CRR(39) - (52) -
Of which: difference from revaluation reserves of fixed assets (39) - (52) -
27 Qualifying AT1 deductions that exceed the AT1 capital of the institution (negative amount) (46) - (93) -
28 Total regulatory adjustments to Common equity Tier 1 (CET1) (1,340) (1,562) (1,329) (1,709)
29 Common Equity Tier 1 (CET1) capital 6,623 5,091 5,894 4,119
33Amount of qualifying items referred to in Article 484 (4) and the related share premium accounts
subject to phase out from AT130 - 62 -
36 Additional Tier 1 (AT1) capital instruments before regulatory adjustments 30 - 62 -
41a
Residual amounts deducted from Additional Tier 1 capital with regard to deduction from Common
Equity Tier 1 capital during the transitional period pursuant to article 472 of Regulation (EU) No
575/2013
(76) - (155) -
Of which: goodwill and intangible assets (net of related tax l iability) (76) - (118) -
Of which: shortfall of provision to expected losses - - (37) -
43 Total regulatory adjustments to Additional Tier 1 (AT1) capital (76) - (155) -
44 Additional Tier 1 (AT1) capital - - - -
45 Tier 1 capital (T1 = CET1 + AT1) 6,623 5,091 5,894 4,119
Additional Tier 1 (AT1) capital : regulatory adjustments
Common Equity Tier 1 (CET1) Capital: instruments and reserves
Common Equity Tier 1 (CET1) capital : regulatory adjustments
Additional Tier 1 (AT1) capital : instruments

EUROBANK ERGASIAS S.A.
Consolidated Pillar 3 Report
Appendix 1: Transitional own funds disclosure
77 | Page 31 December 2015 Consolidated Pi l lar 3 Report
2015 2015 2014 2014
Current
periodFull impact
Current
periodFull impact
€ million € million € mill ion € mill ion
47Amount of qualifying items referred to in Article 484 (5) and the related share premium accounts
subject to phase out from T215 - 141 -
50 Credit risk adjustments 108 108 - -
51 Tier 2 (T2) capital before regulatory adjustments 123 108 141 -
56a Residual amounts deducted from Tier 2 capital with regard to deduction from Common Equity Tier 1
capital during the transitional period pursuant to article 472 of Regulation (EU) No 575/2013
- - (37) -
Of which shortfall of provision to expected losses - - (37) -
56c Amount to be deducted from or added to Tier 2 capital with regard to additional fi lters and
deductions required pre-CRR39 - 52 -
Of which: difference from revaluation reserves of fixed assets 39 - 52 -
57 Total regulatory adjustments to Tier 2 (T2) capital 39 - 15 -
58 Tier 2 (T2) capital 162 108 156 -
59 Total Capital (TC = T1 + T2) 6,785 5,199 6,050 4,119
60 Total risk weighted assets 38,888 38,888 36,430 39,062
61 Common Equity Tier 1 17.0% 13.1% 16.2% 10.5%
62 Tier 1 17.0% 13.1% 16.2% 10.5%
63 Total capital 17.4% 13.4% 16.6% 10.5%
68 Common Equity Tier 1 available to meet buffers (as a percentage of risk exposure amount) 17.0% 13.1% 16.2% 10.5%
72
Direct and indirect holdings of the capital of financial sector entities where the institution does not
have a significant investment in those entities (amount below 10% threshold and net of eligible
short positions
42 42 50 50
73Direct and indirect holdings by the institution of CET1 instruments of financial sector entities
where the institution has a significant investment in those entities (amount below 10% threshold
and net of eligible short positions)
373 373 324 336
75 Deferred tax assets arising from temporary differences (amount below 10% threshold, net of related
tax l iability where the conditions in 38 (3) are met) 470 470 580 334
76Credit risk adjustments included in T2 in respect of exposures subject to standardized approach
(prior to the application of the cap)14 14 - -
77 Cap on inclusion of credit risk adjustments in T2 under standardised approach 19,180 19,180 - -
78Credit risk adjustments included in T2 in respect of exposures subject to internal ratings-based
approach (prior to the application of the cap)94 94 - -
79 Cap for inclusion of credit risk adjustments in T2 under internal ratings-based approach 15,615 15,615 - -
80 Current cap on CET1 instruments subject to phase out arrangements - - - -
81 Amount excluded from CET1 due to cap (excess over cap after redemptions and maturities) - - - -
82 Current cap on AT1 instruments subject to phase out arrangements 70% - 80% -
83 Amount excluded from AT1 due to cap (excess over cap after redemptions and maturities) 13 - 15 -
84 Current cap on T2 instruments subject to phase out arrangements 70% - 80% -
85 Amount excluded from T2 due to cap (excess over cap after redemptions and maturities) 6 - 35 -
Tier 2 (T2) capital : instruments and provisions
Tier 2 (T2) capital : regulatory adjustments
Capital ratios and buffers
Amounts below the thresholds for deduction (before risk weighting)
Applicable caps on the inclusion of provisions on Tier 2
Capital instruments subject to phase-out arrangements (only applicable between 1 Jan 2013 and 1 Jan 2022)

EUROBANK ERGASIAS S.A.
Consolidated Pillar 3 Report
Appendix 2: Capital instruments' main features disclosure
78 | Page 31 December 2015 Consolidated Pi l lar 3 Report
Appendix 2: Capital instruments’ main features disclosure
SERIES A
1 Issuer Eurobank Ergasias S.A. ERB Hellas Funding LTD
2 Unique identifier GRS323003012 DE000A0DZVJ6
3 Governing law(s) of the instrument Greek
The Preferred Securities will be governed by, and
construed in accordance with Jersey law. The
Guarantee will be governed by, and construed in
accordance with, English law, save that the
provisions concerning the ranking of the Guarantee
and the rights upon liquidation, each as described
above, will be governed by, and construed in
accordance with, Greek law.
Regulatory treatment
4 Transitional CRR rules Common Equity Tier 1 Additional Tier 1
5 Post- transitional CRR rules Common Equity Tier 1 Ineligible
6 Eligible at solo/(sub-) consolidated/solo & (sub-) consolidated Solo & Consolidated Solo & Consolidated
7 Instrument type (types to be specified by each jurisdiction) Ordinary shares Additional Tier 1
8 Amount recognised in regulatory capital as at 31 December 2014 € 655.8 mill ion € 2 mill ion
9 Nominal amount of instrument€ 0.30 per ordinary share (at date) /
€ 655.8 mill ion€ 2,131,000
9a Issue price - 100%
9b Redemption price - 100%
10 Accounting classification Shareholders Equity Equity
11 Original date of issuance Various 18 March 2005
12 Perpetual or dated Perpetual Perpetual
13 Original maturity date - No maturity
14 Issuer call subject to prior supervisory approval NA Yes
15 Optional call date, contingent call dates and redemption amount NA First call date 18 March 2010 at 100%
16 Subsequent call dates, if applicable NA Annually
Coupon / dividends NA
17 Fixed or floating dividend/coupon NA Fixed to floating
18 Coupon rate and any related index NA6,75% to 03/07 ; thereafter 10yr €csm +12,5bp. Max
coupon = 8%
19 Existence of a dividend stopper NA No
20aFully discretionary, partially discretionary or mandatory (in terms
of timing)Partially discretionary
Partially discretionary . Dividend Pusher
(Compulsory Payments for each Series )
20bFully discretionary, partially discretionary or mandatory (in terms
of amount)Partially discretionary Mandatory
21 Existence of step up or other incentive to redeem No No
22 Noncumulative or cumulative Non cumulative Non cumulative
23 Convertible or non-convertible Non convertible Non convertible
24 If convertible, conversion trigger(s) NA N/A
25 If convertible, fully or partially NA N/A
26 If convertible, conversion rate NA N/A
27 If convertible, mandatory or optional conversion NA N/A
28 If convertible, specify instrument type convertible into NA N/A
29 If convertible, specify issuer of instrument it converts into NA N/A
30 Write-down features No No
31 If write-down, write-down trigger(s) NA N/A
32 If write-down, full or partial NA N/A
33 If write-down, permanent or temporary NA N/A
34 If temporary write-down, description of write-up mechanism NA N/A
35Position in subordination hierarchy in l iquidation (specify
instrument type immediately senior to instrument)Additional Tier I Lower Tier II
36 Non-compliant transitioned features No Yes
37 If yes, specify non-compliant features N/AUpon the occurance of a trigger event, the principal
amount can not be written down
Terms and Conditionshttp://www.eurobank.gr/Uploads/pdf/katast
atiko_en_12.04.2014.%20eng.pdf
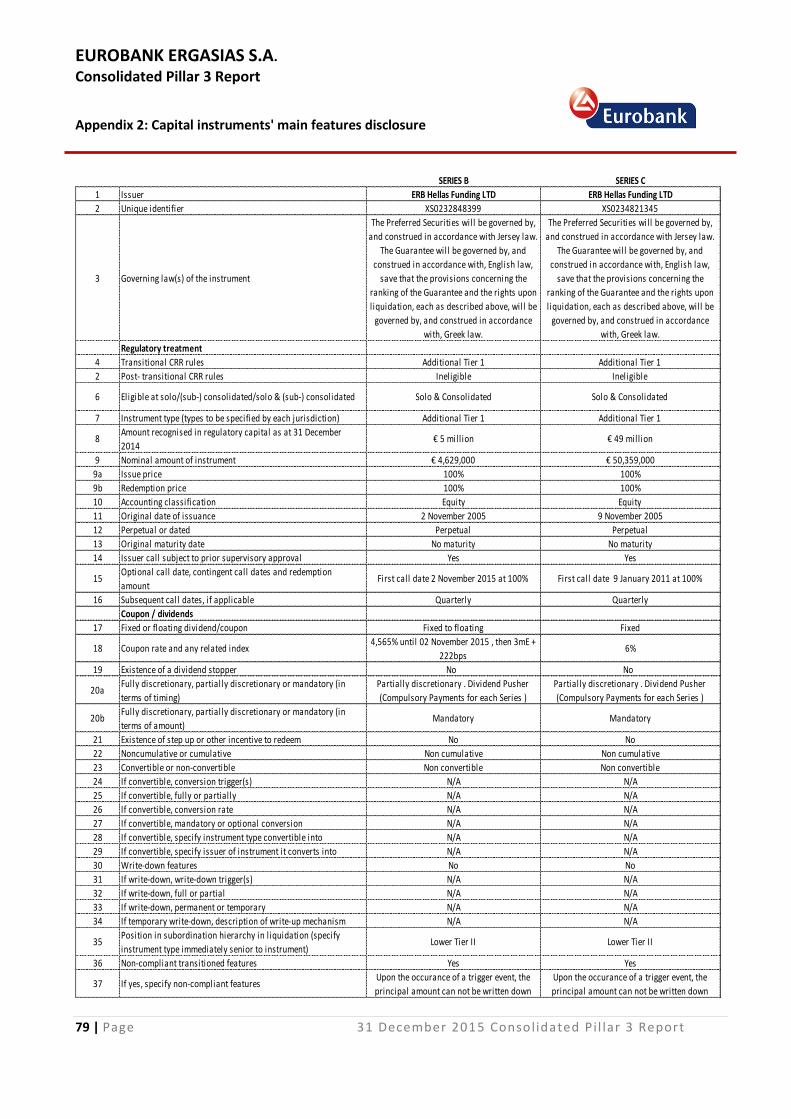
EUROBANK ERGASIAS S.A.
Consolidated Pillar 3 Report
Appendix 2: Capital instruments' main features disclosure
79 | Page 31 December 2015 Consolidated Pi l lar 3 Report
SERIES B SERIES C
1 Issuer ERB Hellas Funding LTD ERB Hellas Funding LTD
2 Unique identifier XS0232848399 XS0234821345
3 Governing law(s) of the instrument
The Preferred Securities will be governed by,
and construed in accordance with Jersey law.
The Guarantee will be governed by, and
construed in accordance with, English law,
save that the provisions concerning the
ranking of the Guarantee and the rights upon
liquidation, each as described above, will be
governed by, and construed in accordance
with, Greek law.
Regulatory treatment
4 Transitional CRR rules Additional Tier 1 Additional Tier 1
2 Post- transitional CRR rules Ineligible Ineligible
6 Eligible at solo/(sub-) consolidated/solo & (sub-) consolidated Solo & Consolidated Solo & Consolidated
7 Instrument type (types to be specified by each jurisdiction) Additional Tier 1 Additional Tier 1
8Amount recognised in regulatory capital as at 31 December
2014€ 5 mill ion € 49 mill ion
9 Nominal amount of instrument € 4,629,000 € 50,359,000
9a Issue price 100% 100%
9b Redemption price 100% 100%
10 Accounting classification Equity Equity
11 Original date of issuance 2 November 2005 9 November 2005
12 Perpetual or dated Perpetual Perpetual
13 Original maturity date No maturity No maturity
14 Issuer call subject to prior supervisory approval Yes Yes
15Optional call date, contingent call dates and redemption
amountFirst call date 2 November 2015 at 100% First call date 9 January 2011 at 100%
16 Subsequent call dates, if applicable Quarterly Quarterly
Coupon / dividends
17 Fixed or floating dividend/coupon Fixed to floating Fixed
18 Coupon rate and any related index4,565% until 02 November 2015 , then 3mE +
222bps6%
19 Existence of a dividend stopper No No
20aFully discretionary, partially discretionary or mandatory (in
terms of timing)
Partially discretionary . Dividend Pusher
(Compulsory Payments for each Series )
Partially discretionary . Dividend Pusher
(Compulsory Payments for each Series )
20bFully discretionary, partially discretionary or mandatory (in
terms of amount)Mandatory Mandatory
21 Existence of step up or other incentive to redeem No No
22 Noncumulative or cumulative Non cumulative Non cumulative
23 Convertible or non-convertible Non convertible Non convertible
24 If convertible, conversion trigger(s) N/A N/A
25 If convertible, fully or partially N/A N/A
26 If convertible, conversion rate N/A N/A
27 If convertible, mandatory or optional conversion N/A N/A
28 If convertible, specify instrument type convertible into N/A N/A
29 If convertible, specify issuer of instrument it converts into N/A N/A
30 Write-down features No No
31 If write-down, write-down trigger(s) N/A N/A
32 If write-down, full or partial N/A N/A
33 If write-down, permanent or temporary N/A N/A
34 If temporary write-down, description of write-up mechanism N/A N/A
35Position in subordination hierarchy in l iquidation (specify
instrument type immediately senior to instrument)Lower Tier II Lower Tier II
36 Non-compliant transitioned features Yes Yes
37 If yes, specify non-compliant featuresUpon the occurance of a trigger event, the
principal amount can not be written down
Upon the occurance of a trigger event, the
principal amount can not be written down
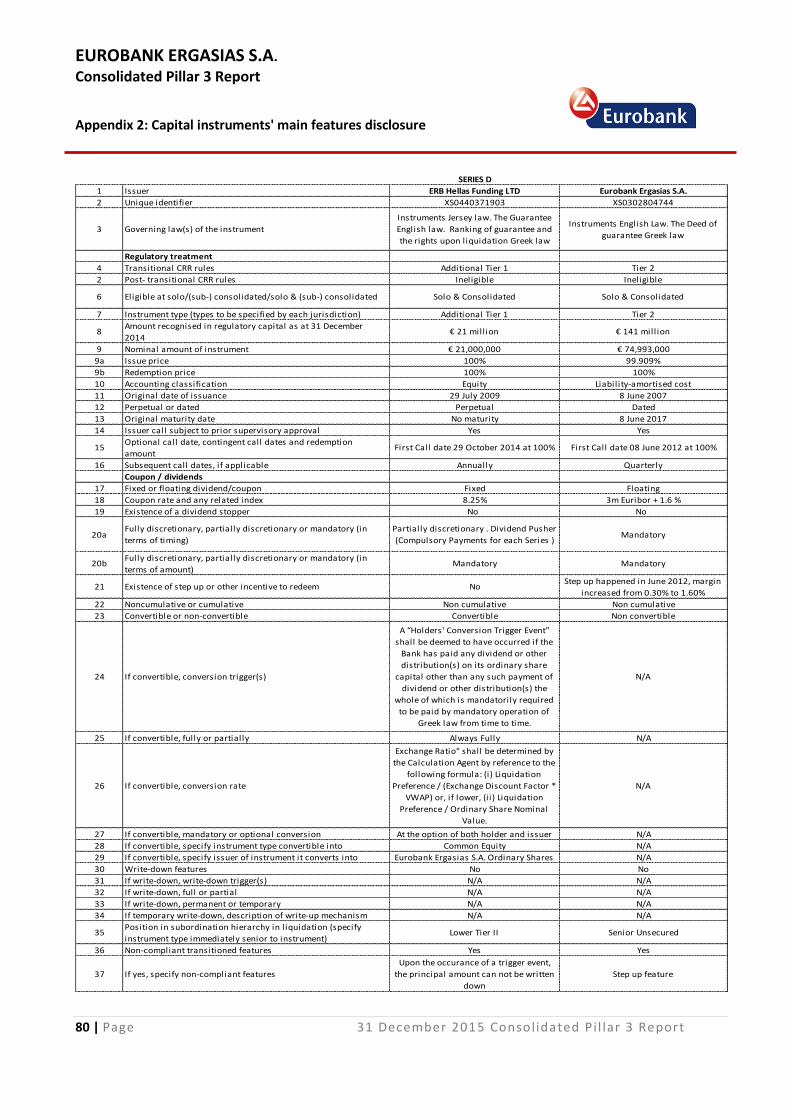
EUROBANK ERGASIAS S.A.
Consolidated Pillar 3 Report
Appendix 2: Capital instruments' main features disclosure
80 | Page 31 December 2015 Consolidated Pi l lar 3 Report
SERIES D
1 Issuer ERB Hellas Funding LTD Eurobank Ergasias S.A.
2 Unique identifier XS0440371903 XS0302804744
3 Governing law(s) of the instrument
Instruments Jersey law. The Guarantee
English law. Ranking of guarantee and
the rights upon liquidation Greek law
Instruments English Law. The Deed of
guarantee Greek law
Regulatory treatment
4 Transitional CRR rules Additional Tier 1 Tier 2
2 Post- transitional CRR rules Ineligible Ineligible
6 Eligible at solo/(sub-) consolidated/solo & (sub-) consolidated Solo & Consolidated Solo & Consolidated
7 Instrument type (types to be specified by each jurisdiction) Additional Tier 1 Tier 2
8Amount recognised in regulatory capital as at 31 December
2014€ 21 mill ion € 141 mill ion
9 Nominal amount of instrument € 21,000,000 € 74,993,000
9a Issue price 100% 99.909%
9b Redemption price 100% 100%
10 Accounting classification Equity Liability-amortised cost
11 Original date of issuance 29 July 2009 8 June 2007
12 Perpetual or dated Perpetual Dated
13 Original maturity date No maturity 8 June 2017
14 Issuer call subject to prior supervisory approval Yes Yes
15Optional call date, contingent call dates and redemption
amountFirst Call date 29 October 2014 at 100% First Call date 08 June 2012 at 100%
16 Subsequent call dates, if applicable Annually Quarterly
Coupon / dividends
17 Fixed or floating dividend/coupon Fixed Floating
18 Coupon rate and any related index 8.25% 3m Euribor + 1.6 %
19 Existence of a dividend stopper No No
20aFully discretionary, partially discretionary or mandatory (in
terms of timing)
Partially discretionary . Dividend Pusher
(Compulsory Payments for each Series )Mandatory
20bFully discretionary, partially discretionary or mandatory (in
terms of amount)Mandatory Mandatory
21 Existence of step up or other incentive to redeem NoStep up happened in June 2012, margin
increased from 0.30% to 1.60%
22 Noncumulative or cumulative Non cumulative Non cumulative
23 Convertible or non-convertible Convertible Non convertible
24 If convertible, conversion trigger(s)
A “Holders' Conversion Trigger Event”
shall be deemed to have occurred if the
Bank has paid any dividend or other
distribution(s) on its ordinary share
capital other than any such payment of
dividend or other distribution(s) the
whole of which is mandatorily required
to be paid by mandatory operation of
Greek law from time to time.
N/A
25 If convertible, fully or partially Always Fully N/A
26 If convertible, conversion rate
Exchange Ratio" shall be determined by
the Calculation Agent by reference to the
following formula: (i) Liquidation
Preference / (Exchange Discount Factor *
VWAP) or, if lower, (i i) Liquidation
Preference / Ordinary Share Nominal
Value.
N/A
27 If convertible, mandatory or optional conversion At the option of both holder and issuer N/A
28 If convertible, specify instrument type convertible into Common Equity N/A
29 If convertible, specify issuer of instrument it converts into Eurobank Ergasias S.A. Ordinary Shares N/A
30 Write-down features No No
31 If write-down, write-down trigger(s) N/A N/A
32 If write-down, full or partial N/A N/A
33 If write-down, permanent or temporary N/A N/A
34 If temporary write-down, description of write-up mechanism N/A N/A
35Position in subordination hierarchy in l iquidation (specify
instrument type immediately senior to instrument)Lower Tier II Senior Unsecured
36 Non-compliant transitioned features Yes Yes
37 If yes, specify non-compliant features
Upon the occurance of a trigger event,
the principal amount can not be written
down
Step up feature