eu-lupa european land use patterns · eu-lupa european land use patterns . volume iv . the urban...
TRANSCRIPT

1
EU-LUPA European Land Use Patterns
VOLUME IV
The Urban Dimension in the EU-LUPA project
Applied Research 2013/1/8
Part C Scientific report |
Version 30/November/2012
2
This report presents the final results of an Applied Research Project conducted within the framework of the ESPON 2013 Programme, partly financed by the European Regional Development Fund. The partnership behind the ESPON Programme consists of the EU Commission and the Member States of the EU27, plus Iceland, Liechtenstein, Norway and Switzerland. Each partner is represented in the ESPON Monitoring Committee. This report does not necessarily reflect the opinion of the members of the Monitoring Committee. Information on the ESPON Programme and projects can be found on www.espon.eu The web site provides the possibility to download and examine the most recent documents produced by finalised and ongoing ESPON projects. This basic report exists only in an electronic version. © ESPON & TECNALIA Research & Innovation, 2012. Printing, reproduction or quotation is authorised provided the source is acknowledged and a copy is forwarded to the ESPON Coordination Unit in Luxembourg.

3
List of authors
Autonomous University of Barcelona, Spain
Jaume Fons
4
Contents 1. Urban sprawl in perspective ............................................................................................................ 6
1.1. Urban sprawl in the past 50 years ............................................................................................... 7
2. Results and analysis ....................................................................................................................... 10
2.1. How to measure urban sprawl .................................................................................................. 10
2.2. Typologies of urban development ............................................................................................ 11
2.3. Typologies of city development in regional context ................................................................. 15
2.4. How have cities evolved in the period 2000 – 2006? ............................................................... 16
2.5. Changes in Central and Eastern countries ................................................................................ 18
2.6. What are the drivers of urban sprawl? ..................................................................................... 20
3. Impact of urban sprawl and land use patterns ............................................................................. 23
3.1. Future perspectives ................................................................................................................... 24
References ............................................................................................................................................. 26
5
Tables
Table 1. Major trends in population and built-up areas in Western Europe (1950-2005).
Table 2. Major trends of urban dynamics in regions of Europe for the period 1950-2005. After Couch et al. (2007) and Turok and Mykhnenko (2007).
Table 3. Variables used in the definition of typologies of urban development.
Table 4. Typologies of cities according to urban development (1990-2006). Changes in urban development of European cities are synthesized in five typologies representing different pace and patterns of growth.
Table 5. Change in urban development by typologies (2000-2006). The table shows the evolution of the typologies defined for the period 1990-2000.
Figures
Figure 1. Distribution of typology of cities in three regional land use types.
Figure 2. Urban development in cities and LUZ (1990-2000, 2000-2006). Urban
Figure 3. Natural and agricultural land lost due to urban development in the cities (2000-2006).
Figure 4. Natural and agricultural land lost due to urban development in large urban zone (2000-2006).
Maps
Map 1. Typologies of urban development (1990-2006). Sources: CORINE Land Cover 1990, 2000, 2006. 1990-2006 changes.
6
1. Urban sprawl in perspective
In Europe, already three quarters of the population live in cities, covering 4% of its surface. As the European population is predicted increase slightly over the next 20 years and also urbanisation is further increasing to a share of 80% by 2020, the cities’ current share of 69% energy consumption (IEA, 2008) might further increase. Furthermore, urban areas are highly dynamic. Not only are they still increasing, the way resources and energy is used is also changing: with improving accessibility and stronger connectivity, urban development moves from single cities to a more disperse urban pattern across Europe and the formation of metropolitan areas. Urban areas increasingly use resources from abroad, impacting on areas far away and thus become more and more dependent on remote areas influencing also their resilience.
However, cities can also be more efficient in the use of certain resources given the higher density compared in rural areas. Hence, there is a long path to take advantage of this situation (optimisation of densification).
It has been suggested that agglomeration effects have limits and that the negative externalities that can result from agglomeration - such as traffic congestion, price increases and a lack of affordable housing, pollution, urban sprawl, rising costs of urban infrastructure, social tensions and higher crime rates - may outweigh the benefits. Apart from the direct economic costs of a decrease in the efficiency of the economy, there is also the additional cost of a degraded environment, health problems and a reduced quality of life which are not included in the price.
Urban areas are gaining more and more attention at European level. The majority of Europeans live there; as the motor of job creation and growth, cities play an important role in implementing the Lisbon Strategy and territorial cohesion; also, the EU Territorial Agenda, Leipzig Charter and Toledo Declaration highlight the important link to urban development. To cope with the social, economic, environmental and territorial perspectives of urban development, its multiple, dynamic interlinkages, and the European dimension of the development, policy-makers need an appropriate information base and management tools.
Even though the European Commission is not responsible for urban development and urban policy, the urban dimension plays an important role in the tasks of the Commission, like DG REGIO’s mission to strengthen economic, social and territorial cohesion. The Community Strategic Guidelines on cohesion specifies several possible actions with a focus on urban areas. Moreover, several strategies and documents have been released recently explicitly focussing on urban areas: the Thematic Strategy on the Urban Environment, the Communication on Cohesion Policy and Cities, the Green Paper on Urban Mobility.
While on the one hand the European Commission promotes and financially supports sustainable urban development (with projects like URBAN II, Interreg III, ESPON 2013 and INTERACT), the EC lacks a system to monitor the social, economic, environmental and territorial impacts and perspectives of urban development and their multiple and dynamic linkages in an integrated manner.
7
Urban sprawl is identified with some of the most critical and negative impacts of current model of territorial development including increasing greenhouse gas emissions, social exclusion and biodiversity loss. Key political concerns with climate change and uncontrolled urban sprawl are all fundamentally related in the interconnected land-use - transport - environment nexus of urban development.
Urban sprawl first appeared as an American phenomenon, but recent works well described the specificities of this problem in Europe (EEA, 2006).
1.1. Urban sprawl in the past 50 years
One of the problems to understand urban sprawl in Europe is the lack of long time series of data. Availability of satellite images and computing capacities were big constrains until the end of 1980s. Consequently, most of the existing information for the period 1950 – 1990 relies on population data. In that sense the work developed under the MOLAND project is the best land cover data for the period 1950 – 2000 since it covers 28 cities.
The following tables summarise the main trends in Europe for the 1950-2000 period compiled from existing literature (Antrop 2004, Kasanko et al. 2006, Turok and Mykhnenko 2007, and Couch et al. 2007).
From the long term data it can be concluded:
• The largest urban land expansion in Europe started in the 1950s.
• The past history was reflected in high diversity of city attributes at the beginning of this period.
• Rapid changes during the last 50 years resulted from combined effects of increasing affluence, mass motorisation for the transport of persons and goods, the introduction of air transportation and the shift from manufacturing to services in urban economies caused a much more dispersed, fragmented and low density urban development. This development did affect existing functions and structures of many cities, in particular less attractive neighbourhoods and obsolete industrial and port areas suffered. Many cities experienced population loss.
• The process did not take place at the same time in all regions. Process in Mediterranean cities started later than Northern and Western Central Europe. Also Mediterranean cities were more compact and kept some of this attribute during the 1990s.
• By the end of the 1960s and 1970s a process of revitalisation started with new town and urban renewal efforts. Gradually, more investments were made in housing, businesses, infrastructure and public services. The revival is related to the emergence of a society and economy based on knowledge, information and creativity and an accompanied growing interest in urban life styles. But physical and socio-economic polarisation also increased and became a large scale urban problem.
8
• Central planning, dominance of public transport and no land market determined a specific form or compact city in former socialist countries. Changes since the 1990s are explored in next section.
• Urban change is incremental: most of the physical fabric of cities survives for many decades if not for centuries. The social fabric is much more prone to change, but nevertheless, in general, changes only by a few percentages of change per year.
• There has been a process of convergence in most of the cities accelerated by the end of 1990s.
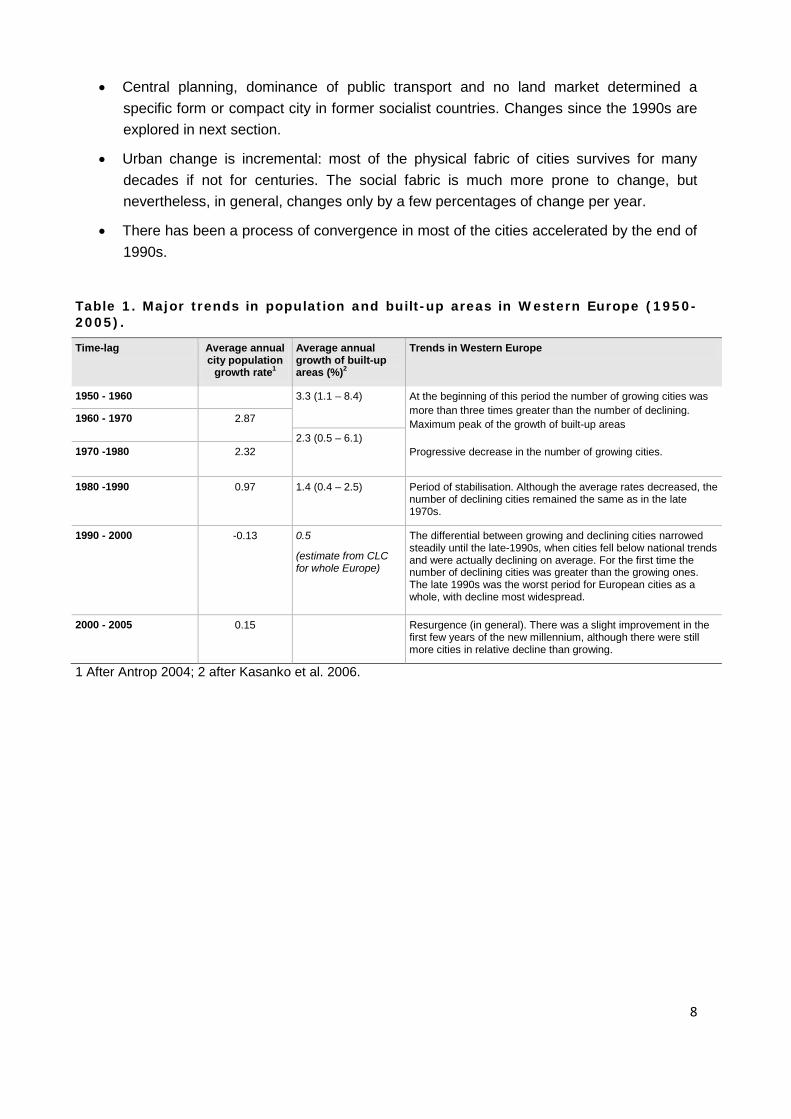
Table 1. Major trends in population and built-up areas in Western Europe (1950-2005).
Time-lag Average annual city population
growth rate1
Average annual growth of built-up areas (%)2
Trends in Western Europe
1950 - 1960 3.3 (1.1 – 8.4) At the beginning of this period the number of growing cities was more than three times greater than the number of declining. Maximum peak of the growth of built-up areas
Progressive decrease in the number of growing cities.
1960 - 1970 2.87
2.3 (0.5 – 6.1) 1970 -1980 2.32
1980 -1990 0.97 1.4 (0.4 – 2.5) Period of stabilisation. Although the average rates decreased, the number of declining cities remained the same as in the late 1970s.
1990 - 2000 -0.13 0.5
(estimate from CLC for whole Europe)
The differential between growing and declining cities narrowed steadily until the late-1990s, when cities fell below national trends and were actually declining on average. For the first time the number of declining cities was greater than the growing ones. The late 1990s was the worst period for European cities as a whole, with decline most widespread.
2000 - 2005 0.15 Resurgence (in general). There was a slight improvement in the first few years of the new millennium, although there were still more cities in relative decline than growing.
1 After Antrop 2004; 2 after Kasanko et al. 2006.
9
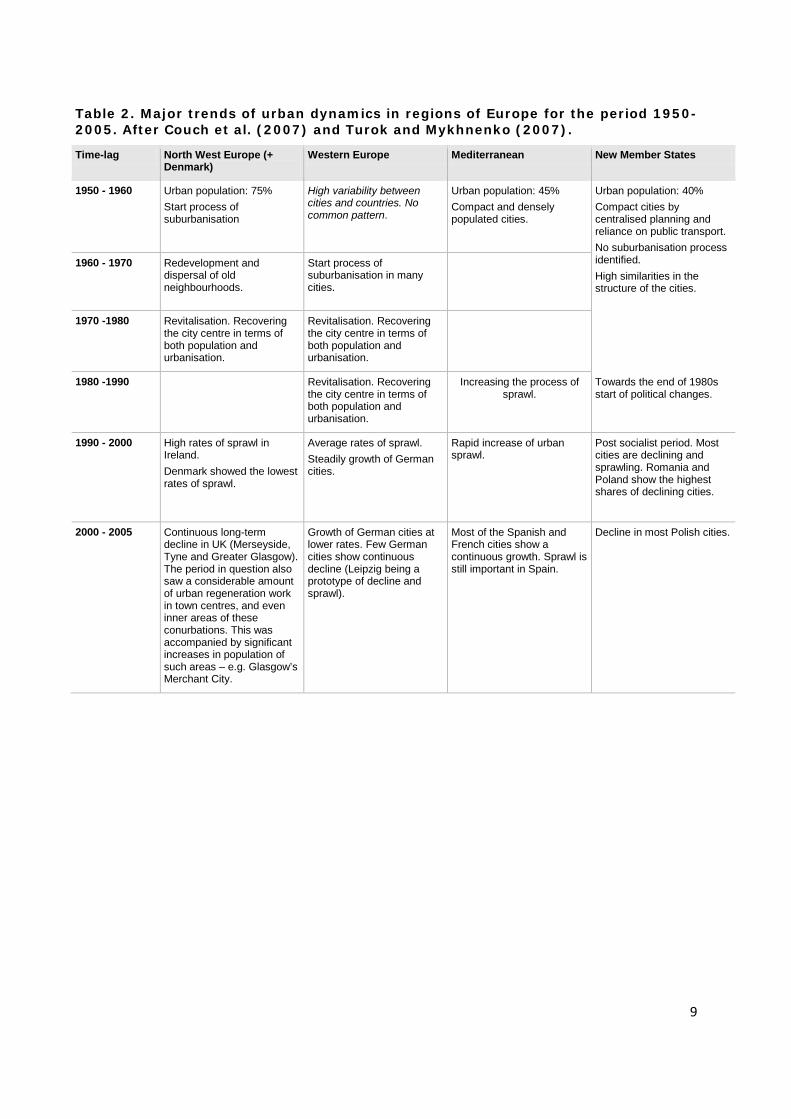
Table 2. Major trends of urban dynamics in regions of Europe for the period 1950-2005. After Couch et al. (2007) and Turok and Mykhnenko (2007).
Time-lag North West Europe (+ Denmark)
Western Europe Mediterranean New Member States
1950 - 1960 Urban population: 75% Start process of suburbanisation
High variability between cities and countries. No common pattern.
Urban population: 45% Compact and densely populated cities.
Urban population: 40% Compact cities by centralised planning and reliance on public transport. No suburbanisation process identified. High similarities in the structure of the cities.
1960 - 1970 Redevelopment and dispersal of old neighbourhoods.
Start process of suburbanisation in many cities.
1970 -1980 Revitalisation. Recovering the city centre in terms of both population and urbanisation.
Revitalisation. Recovering the city centre in terms of both population and urbanisation.
1980 -1990 Revitalisation. Recovering the city centre in terms of both population and urbanisation.
Increasing the process of sprawl.
Towards the end of 1980s start of political changes.
1990 - 2000 High rates of sprawl in Ireland. Denmark showed the lowest rates of sprawl.
Average rates of sprawl. Steadily growth of German cities.
Rapid increase of urban sprawl.
Post socialist period. Most cities are declining and sprawling. Romania and Poland show the highest shares of declining cities.
2000 - 2005 Continuous long-term decline in UK (Merseyside, Tyne and Greater Glasgow). The period in question also saw a considerable amount of urban regeneration work in town centres, and even inner areas of these conurbations. This was accompanied by significant increases in population of such areas – e.g. Glasgow’s Merchant City.
Growth of German cities at lower rates. Few German cities show continuous decline (Leipzig being a prototype of decline and sprawl).
Most of the Spanish and French cities show a continuous growth. Sprawl is still important in Spain.
Decline in most Polish cities.
ESPON 2013 10
2. Results and analysis
2.1. How to measure urban sprawl
A variety of urban forms have been covered by the term “urban sprawl” ranging from contiguous suburban growth, linear patterns of strip development, leapfrog and scattered development. In terms of urban form, sprawl is positioned against the ideal of the compact city, with high density, centralised development and a spatial mixture of functions, but what is considered to be sprawl ranges along a continuum of more compact to completely dispersed development. In any way it is important to recognise that urban sprawl is not merely an attribute, or pattern, of a city. Moreover, it should be considered as a process of urban change (Couch et al. 2005). Finally, urban sprawl cannot be defined by a single parameter (Kasanko et al. 2006). Galster et al (2001) defines sprawl as a pattern of land use in an urbanised area that exhibits low levels of some combination of eight distinct dimensions: density, continuity, concentration, clustering, centrality, nuclearity, mixed uses and proximity. These eight attributes also combine two dimensions of the compacity/sprawl characterisation: physical and functional. The physical compactness refers to the spatial configuration of land use development within the city, the functional compactness to the density and the mix of daily activity.
In order to characterise the urban development in Europe a first set of variables were selected representing the status and changes. After removing higher correlated variables and those that explained less variability in the factorial analysis, the following ones were selected.
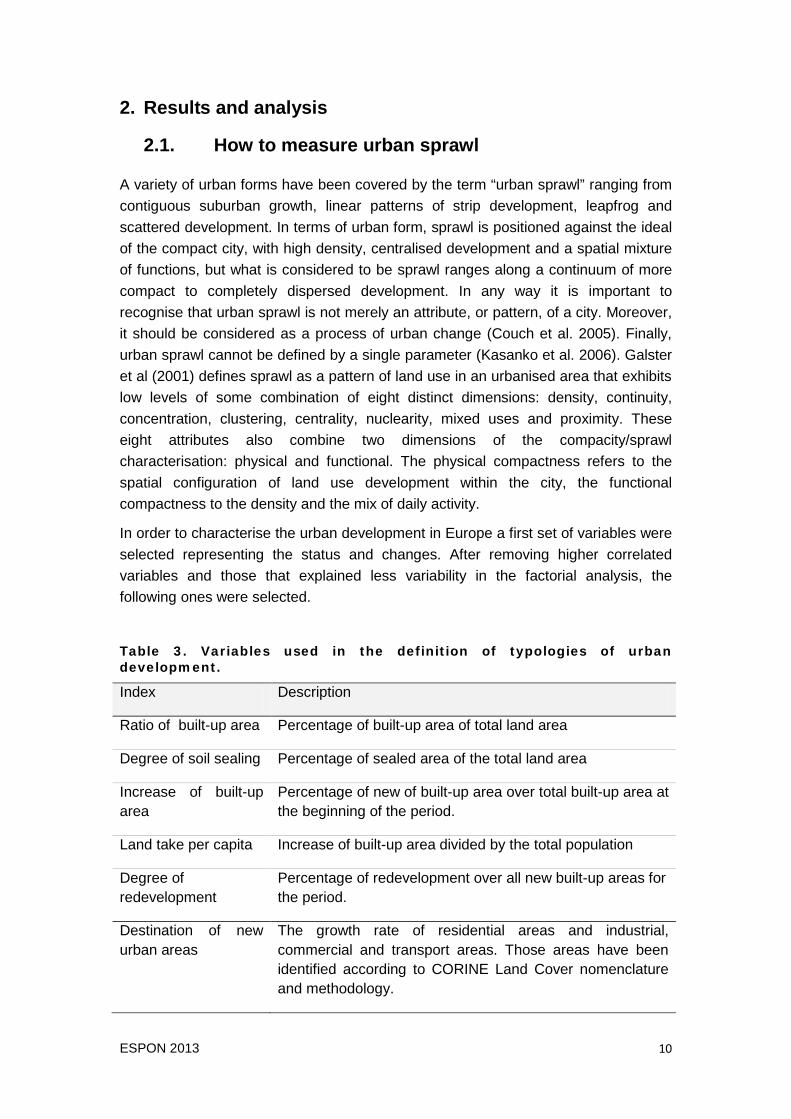
Table 3. Variables used in the definition of typologies of urban development.
Index Description
Ratio of built-up area Percentage of built-up area of total land area
Degree of soil sealing Percentage of sealed area of the total land area
Increase of built-up area
Percentage of new of built-up area over total built-up area at the beginning of the period.
Land take per capita Increase of built-up area divided by the total population
Degree of redevelopment
Percentage of redevelopment over all new built-up areas for the period.
Destination of new urban areas
The growth rate of residential areas and industrial, commercial and transport areas. Those areas have been identified according to CORINE Land Cover nomenclature and methodology.
ESPON 2013 11
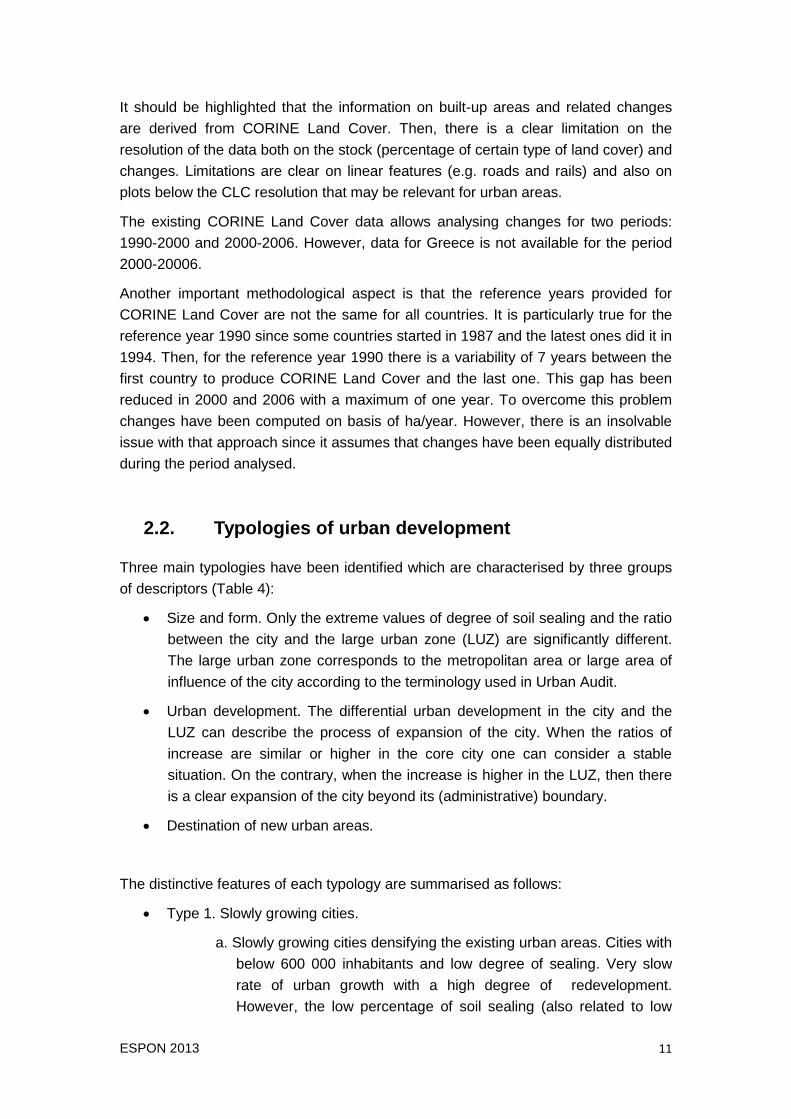
It should be highlighted that the information on built-up areas and related changes are derived from CORINE Land Cover. Then, there is a clear limitation on the resolution of the data both on the stock (percentage of certain type of land cover) and changes. Limitations are clear on linear features (e.g. roads and rails) and also on plots below the CLC resolution that may be relevant for urban areas.
The existing CORINE Land Cover data allows analysing changes for two periods: 1990-2000 and 2000-2006. However, data for Greece is not available for the period 2000-20006.
Another important methodological aspect is that the reference years provided for CORINE Land Cover are not the same for all countries. It is particularly true for the reference year 1990 since some countries started in 1987 and the latest ones did it in 1994. Then, for the reference year 1990 there is a variability of 7 years between the first country to produce CORINE Land Cover and the last one. This gap has been reduced in 2000 and 2006 with a maximum of one year. To overcome this problem changes have been computed on basis of ha/year. However, there is an insolvable issue with that approach since it assumes that changes have been equally distributed during the period analysed.
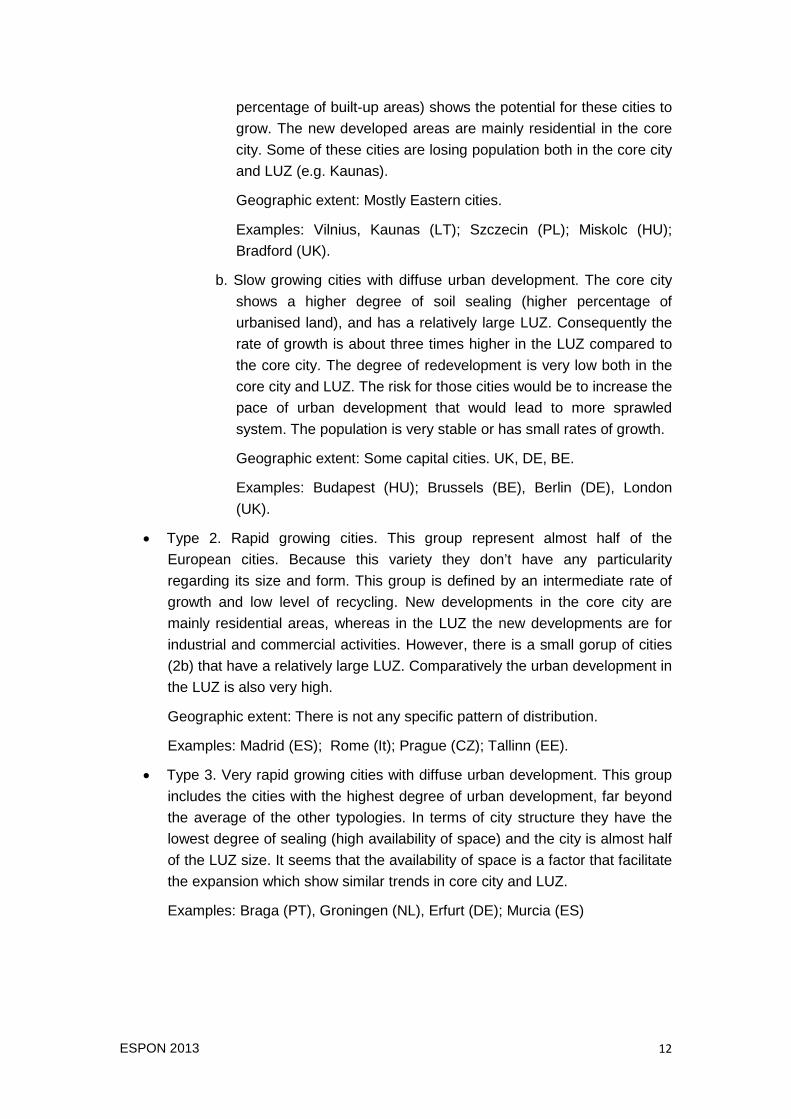
2.2. Typologies of urban development
Three main typologies have been identified which are characterised by three groups of descriptors (Table 4):
• Size and form. Only the extreme values of degree of soil sealing and the ratio between the city and the large urban zone (LUZ) are significantly different. The large urban zone corresponds to the metropolitan area or large area of influence of the city according to the terminology used in Urban Audit.
• Urban development. The differential urban development in the city and the LUZ can describe the process of expansion of the city. When the ratios of increase are similar or higher in the core city one can consider a stable situation. On the contrary, when the increase is higher in the LUZ, then there is a clear expansion of the city beyond its (administrative) boundary.
• Destination of new urban areas.
The distinctive features of each typology are summarised as follows:
• Type 1. Slowly growing cities.
a. Slowly growing cities densifying the existing urban areas. Cities with below 600 000 inhabitants and low degree of sealing. Very slow rate of urban growth with a high degree of redevelopment. However, the low percentage of soil sealing (also related to low
ESPON 2013 12
percentage of built-up areas) shows the potential for these cities to grow. The new developed areas are mainly residential in the core city. Some of these cities are losing population both in the core city and LUZ (e.g. Kaunas).
Geographic extent: Mostly Eastern cities.
Examples: Vilnius, Kaunas (LT); Szczecin (PL); Miskolc (HU); Bradford (UK).
b. Slow growing cities with diffuse urban development. The core city shows a higher degree of soil sealing (higher percentage of urbanised land), and has a relatively large LUZ. Consequently the rate of growth is about three times higher in the LUZ compared to the core city. The degree of redevelopment is very low both in the core city and LUZ. The risk for those cities would be to increase the pace of urban development that would lead to more sprawled system. The population is very stable or has small rates of growth.
Geographic extent: Some capital cities. UK, DE, BE.
Examples: Budapest (HU); Brussels (BE), Berlin (DE), London (UK).
• Type 2. Rapid growing cities. This group represent almost half of the European cities. Because this variety they don’t have any particularity regarding its size and form. This group is defined by an intermediate rate of growth and low level of recycling. New developments in the core city are mainly residential areas, whereas in the LUZ the new developments are for industrial and commercial activities. However, there is a small gorup of cities (2b) that have a relatively large LUZ. Comparatively the urban development in the LUZ is also very high.
Geographic extent: There is not any specific pattern of distribution.
Examples: Madrid (ES); Rome (It); Prague (CZ); Tallinn (EE).
• Type 3. Very rapid growing cities with diffuse urban development. This group includes the cities with the highest degree of urban development, far beyond the average of the other typologies. In terms of city structure they have the lowest degree of sealing (high availability of space) and the city is almost half of the LUZ size. It seems that the availability of space is a factor that facilitate the expansion which show similar trends in core city and LUZ.
Examples: Braga (PT), Groningen (NL), Erfurt (DE); Murcia (ES)
ESPON 2013 13
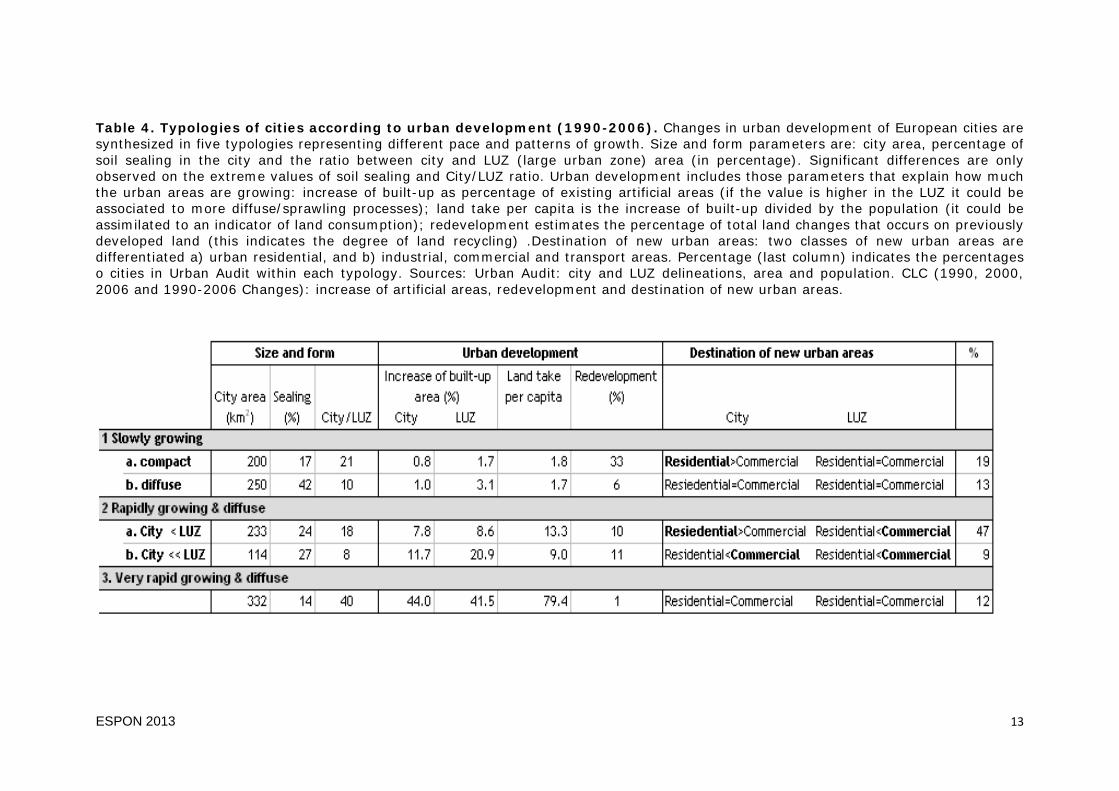
Table 4. Typologies of cities according to urban development (1990-2006). Changes in urban development of European cities are synthesized in five typologies representing different pace and patterns of growth. Size and form parameters are: city area, percentage of soil sealing in the city and the ratio between city and LUZ (large urban zone) area (in percentage). Significant differences are only observed on the extreme values of soil sealing and City/LUZ ratio. Urban development includes those parameters that explain how much the urban areas are growing: increase of built-up as percentage of existing artificial areas (if the value is higher in the LUZ it could be associated to more diffuse/sprawling processes); land take per capita is the increase of built-up divided by the population (it could be assimilated to an indicator of land consumption); redevelopment estimates the percentage of total land changes that occurs on previously developed land (this indicates the degree of land recycling) .Destination of new urban areas: two classes of new urban areas are differentiated a) urban residential, and b) industrial, commercial and transport areas. Percentage (last column) indicates the percentages o cities in Urban Audit within each typology. Sources: Urban Audit: city and LUZ delineations, area and population. CLC (1990, 2000, 2006 and 1990-2006 Changes): increase of artificial areas, redevelopment and destination of new urban areas.
ESPON 2013 14
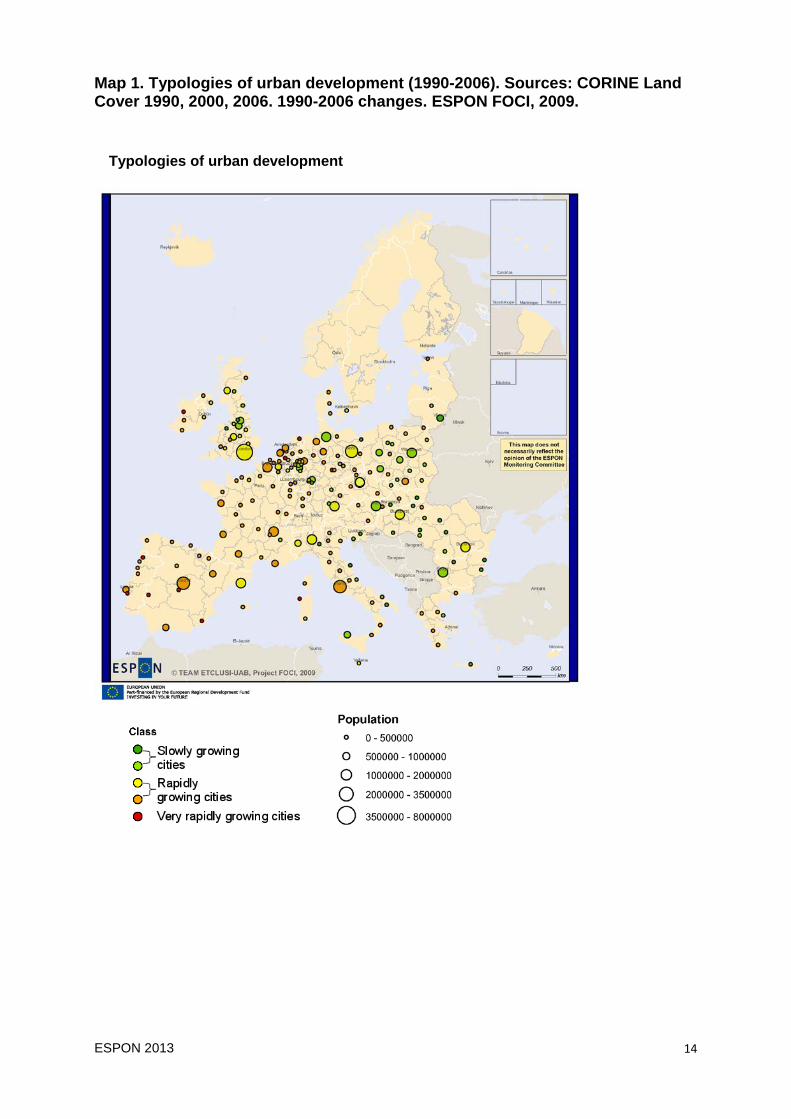
Map 1. Typologies of urban development (1990-2006). Sources: CORINE Land Cover 1990, 2000, 2006. 1990-2006 changes. ESPON FOCI, 2009.
Typologies of urban development
ESPON 2013 15
2.3. Typologies of city development in regional context
Since cities are not isolated entities and process are scaled up from neighbourhood level to city, metropolitan and regional level (at least) it is interesting to analyse these city typologies regarding the Regional Land Use Types defined at NUTS level (see Volume I on Land Use Characterisation in Europe). One can assume that the regional/administrative level integrates socio-economic factors, connected to certain policies at that administrative level, which may influence the evolution of the cities. Therefore, it is interesting to explore to what extent typologies developed at different scales for different entities, but connected by the geographical and socio-economic context, are complementary to understand the land use patterns.
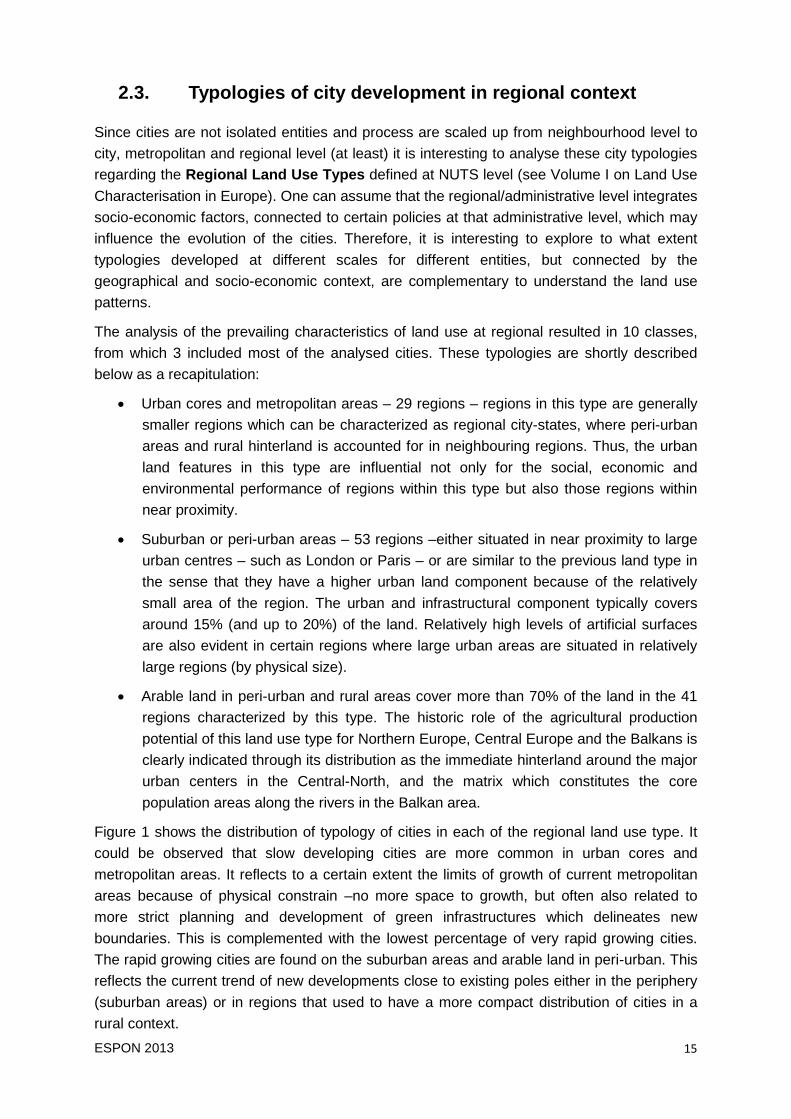
The analysis of the prevailing characteristics of land use at regional resulted in 10 classes, from which 3 included most of the analysed cities. These typologies are shortly described below as a recapitulation:
• Urban cores and metropolitan areas – 29 regions – regions in this type are generally smaller regions which can be characterized as regional city-states, where peri-urban areas and rural hinterland is accounted for in neighbouring regions. Thus, the urban land features in this type are influential not only for the social, economic and environmental performance of regions within this type but also those regions within near proximity.
• Suburban or peri-urban areas – 53 regions –either situated in near proximity to large urban centres – such as London or Paris – or are similar to the previous land type in the sense that they have a higher urban land component because of the relatively small area of the region. The urban and infrastructural component typically covers around 15% (and up to 20%) of the land. Relatively high levels of artificial surfaces are also evident in certain regions where large urban areas are situated in relatively large regions (by physical size).
• Arable land in peri-urban and rural areas cover more than 70% of the land in the 41 regions characterized by this type. The historic role of the agricultural production potential of this land use type for Northern Europe, Central Europe and the Balkans is clearly indicated through its distribution as the immediate hinterland around the major urban centers in the Central-North, and the matrix which constitutes the core population areas along the rivers in the Balkan area.
Figure 1 shows the distribution of typology of cities in each of the regional land use type. It could be observed that slow developing cities are more common in urban cores and metropolitan areas. It reflects to a certain extent the limits of growth of current metropolitan areas because of physical constrain –no more space to growth, but often also related to more strict planning and development of green infrastructures which delineates new boundaries. This is complemented with the lowest percentage of very rapid growing cities. The rapid growing cities are found on the suburban areas and arable land in peri-urban. This reflects the current trend of new developments close to existing poles either in the periphery (suburban areas) or in regions that used to have a more compact distribution of cities in a rural context.
ESPON 2013 16
In general rapid growing cities are very common in all regional types and are not disctintive.
Figure 1. Distribution of typology of cities in three regional land use types.
2.4. How have cities evolved in the period 2000 – 2006?
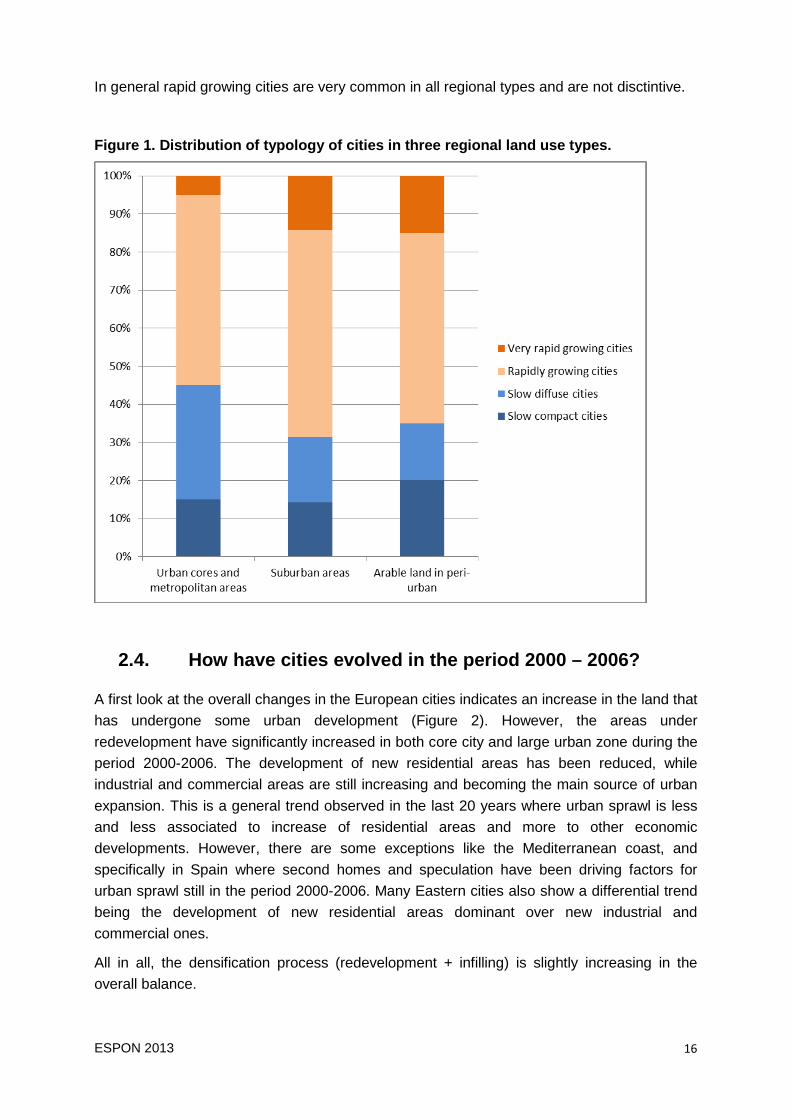
A first look at the overall changes in the European cities indicates an increase in the land that has undergone some urban development (Figure 2). However, the areas under redevelopment have significantly increased in both core city and large urban zone during the period 2000-2006. The development of new residential areas has been reduced, while industrial and commercial areas are still increasing and becoming the main source of urban expansion. This is a general trend observed in the last 20 years where urban sprawl is less and less associated to increase of residential areas and more to other economic developments. However, there are some exceptions like the Mediterranean coast, and specifically in Spain where second homes and speculation have been driving factors for urban sprawl still in the period 2000-2006. Many Eastern cities also show a differential trend being the development of new residential areas dominant over new industrial and commercial ones.
All in all, the densification process (redevelopment + infilling) is slightly increasing in the overall balance.

ESPON 2013 17
Figure 2. Urban development in cities and LUZ (1990-2000, 2000-2006). Urban development refers to the total urban changes for the given period and aggregated for all European cities. The trends are similar in the city and the LUZ as well. The hectares per year reused or redeveloped in 2000-2006 have significantly increased compared with the previous period. Development of new residential areas have decreased while development of new industrial and commercial areas are still increasing. Infilling: Development of new areas within the denser city. Sources: CLC 1990, 2000 and 2006. UK and Greece are not included because data not available for 2006.
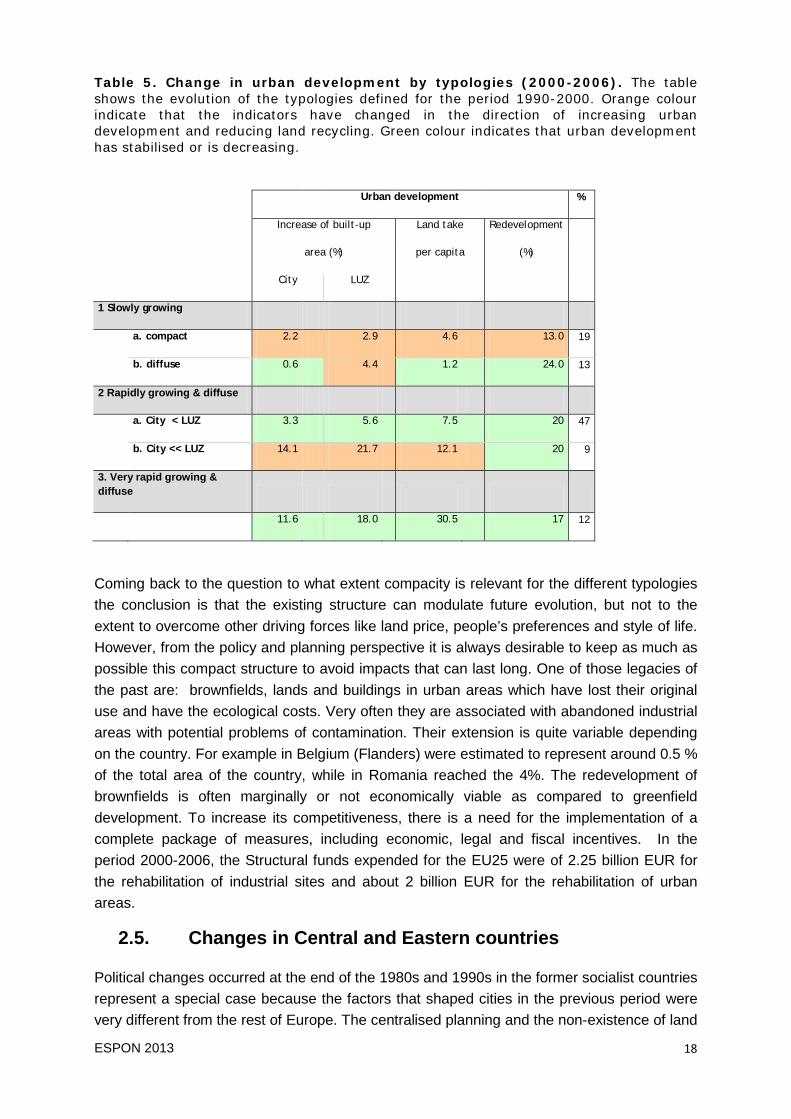
Moving from the overall picture to the pathways taken by the different typologies (table 5) it is observed that the slow growing and compact cities (type 1a) have experienced an increased rate of development and land take (type 3). The availability of space and the low rates in the 90’s may have facilitated these new developments. The new developed areas are mainly for industrial and commercial use in the bigger cities, whereas in some smaller ones residential development is still prevailing.
The slow growing and diffuse cities (type 1b) show decreased land take during the period except on the LUZ. Those cities had a relatively small city compared to LUZ so it could partly explain this evolution.
The rapid growing and diffuse cities (type 2) includes half of the European cities. Then, their evolution fits very well with the overall picture: reduction of the land take in both the city and LUZ. However, the growth in the LUZ is still relatively higher than in the core city. The second group within this class (2b) has increased.
Finally, the very rapid growing cities in the 90’s have slowed down. This process has been more marked in the core city than in the LUZ.
There is a process of convergence between the different typologies, with few exceptions (type 2b), characterised by decreasing differences in the rate of land take, a general increase of redevelopment and an higher pace of change in the LUZ.
ESPON 2013 18
Table 5. Change in urban development by typologies (2000-2006). The table shows the evolution of the typologies defined for the period 1990-2000. Orange colour indicate that the indicators have changed in the direction of increasing urban development and reducing land recycling. Green colour indicates that urban development has stabilised or is decreasing.
Urban development %
Increase of built-up Land take Redevelopment
area (%) per capita (%)
City LUZ
1 Slowly growing
a. compact 2.2 2.9 4.6 13.0 19
b. diffuse 0.6 4.4 1.2 24.0 13
2 Rapidly growing & diffuse
a. City < LUZ 3.3 5.6 7.5 20 47
b. City << LUZ 14.1 21.7 12.1 20 9
3. Very rapid growing & diffuse
11.6 18.0 30.5 17 12
Coming back to the question to what extent compacity is relevant for the different typologies the conclusion is that the existing structure can modulate future evolution, but not to the extent to overcome other driving forces like land price, people’s preferences and style of life. However, from the policy and planning perspective it is always desirable to keep as much as possible this compact structure to avoid impacts that can last long. One of those legacies of the past are: brownfields, lands and buildings in urban areas which have lost their original use and have the ecological costs. Very often they are associated with abandoned industrial areas with potential problems of contamination. Their extension is quite variable depending on the country. For example in Belgium (Flanders) were estimated to represent around 0.5 % of the total area of the country, while in Romania reached the 4%. The redevelopment of brownfields is often marginally or not economically viable as compared to greenfield development. To increase its competitiveness, there is a need for the implementation of a complete package of measures, including economic, legal and fiscal incentives. In the period 2000-2006, the Structural funds expended for the EU25 were of 2.25 billion EUR for the rehabilitation of industrial sites and about 2 billion EUR for the rehabilitation of urban areas.
2.5. Changes in Central and Eastern countries
Political changes occurred at the end of the 1980s and 1990s in the former socialist countries represent a special case because the factors that shaped cities in the previous period were very different from the rest of Europe. The centralised planning and the non-existence of land
ESPON 2013 19
markets resulted in more compact cities compared to the western counterpart. By 2000 most of the cities were still below 100 000 inhabitants (25% between 100 000 and half a million, 6 between half a million an one million; and only 3 with more than one million -Budapest, Warsaw, Prague).
Although regional differences exist and the process has taken different pace depending on the cities, some commonalities have been found:
• General decline in population in the last decade except in Poland, Slovakia and Slovenia.
• Privatisation of the housing stock. After the transformation, a large number of the dwellings were sold to the inhabitants at low prices. As a consequence the new member states show the highest number of owner-occupied dwellings in Europe (96.7% in Lithuania in 2001). The exception is the Czech Republic (47% in 2001) that has never introduced such privatisation plans (vanKempen et al., 2005).
• Gradual deterioration of housing blocs as consequence of low income of many new owners, unable to repair and maintain the dwellings (Murie et al., 2005).
• Progressive deterioration of city centres. Increase of pollution because inadequate transport policies.
• Changes in the economic basis in the cities, increasing the opportunities in the service sector. However, the workers required for the service sector are not always those who have lost their job in another sector.
• Commercial development constitutes and important force that has substantially contributed to a massive reorganisation of land use patterns. Such development has been recognised as a tool of local economic regeneration and growth, often supported by government policies.
• Revitalisation of city centre has raised the prices in the inner city, becoming too expensive (e.g. Lithuania).
Disparity in prices between capitals, more expensive, and regional cities.
All these elements have led to the current situation:
• Increased suburbanisation and sprawl, although most of the cities are still more compact than in the Western Europe. The acceleration of city sprawl is evident in Hungary, as well as in Poland and the Czech Republic.
• The situation is more dramatic in cities where sprawl has been combined with decline implying a strong environmental impact (e.g. Budapest).
• Social, and sometimes ethnic, polarisation.
The major constrains to further improve the situation in these countries are:
• Brownfields. Former industrial sites that have been abandoned and in most cases have serious problems of contamination. The cost of remediation of these sites is very high. It has been estimated that 40% of the Budapest area can be characterised as brownfield land (Baross 2007). The EC’s Thematic Strategy on the Urban
ESPON 2013 20
Environment1 recognises brownfield regeneration as a major means to achieve a sustainable urban environment
• Existing “frozen land” (Bertaud 2004): It consists of either a) areas with “fuzzy” tenure, or b) areas owned by government but not occupied by a legitimate government function. This prevents their timely renovation or recycling.
• Residential estates of high density panel housing located in the suburbs.
• Weak and poorly maintained infrastructure which is inadequate to support the high residential densities found in the centre.
2.6. What are the drivers of urban sprawl?
As has been seen in the previous sections population growth is not the only determinant the outward expansion of built-up areas. There are other elements related to cultural aspects and individual decisions modulated by the supply side and other external conditions (price, transport, and cost).
The feedback between drivers and urban process can be seen in the case of population dynamics:
• Population change is an important consequence of urban conditions, especially the availability of economic opportunities (Green and Owen, 1995; Champion and Fisher, 2004; Storper and Manville, 2006). Migration is a response to differences in employment or the quality of life between places, even if the process of adjustment is inefficient. The bigger the differences, the more worthwhile it may be to move, subject to barriers such as distance, legal restrictions, housing constraints and information on the opportunities available. The propensity of people to move is affected by their age, qualifications, financial resources and sense of attachment.
• Population change is also an important influence on urban economic conditions (Glaeser et al., 2001; Glaeser, 2005; Florida, 2004; Krugman, 2005). There is evidence that sheer population size and deep labour pools increase agglomeration economies and productivity (Rosenthal and Strange, 2004; Rice et al., 2006). Loss of population has certainly caused wider economic and environmental problems for cities (Cheshire and Hay, 1989; Begg et al., 1986). Shifts in the level of population affect local jobs through demand for consumer goods and services, housing, schools, etc. Changes in working age residents also affect the supply of skills, which may influence mobile investment decisions. The composition of the new population is bound to have an important bearing on the scale and nature of the economic impact.
Globalisation is recognised as one of the main drivers of urban sprawl interrelated with the development of information and communication technologies together with the increased accessibility to almost any place in the world (JRC). The traditional geographic range (space of influence) is overcome, and place is disconnected of economy (Castells, 2001). This has direct consequences for governance creating a conflict between local/regional policies and global market.
ESPON 2013 21
EU integration may have an undesired side effect through the investments on major transport infrastructures and opening the doors of sprawl to new areas. Since transport is one driver of urban sprawl special attention should be paid in these cases implementing additional policies of containment (EEA, 2006).
Real estate market is an important player from the supply side. According to Bertaud land price profile follows approximately the population density profile in market economies. This promotes the urbanisation of the less dense areas within a certain time distance of the main centre.
The differential price between agricultural land and already urbanised land discourages the revitalisation or recycling of built space generating derelict land. It also has a strong impact in fertile flat areas where accessibility generates a conflict of uses leading to a marginalisation of agriculture.
One of the main failures to effectively control urban sprawl is the lack of horizontal (space) and vertical (institutional) integration of policies (EEA, 2006). City boundaries are becoming diffuse increasing the complexity of levels of governance (e.g. intermediate metropolitan administrations).
Nearly all environmental management is carried out at a local level, and measures adopted at this level influence the impacts at broader scales (Bellot et al. 2007). Municipalities have limited number of tools to influence the urban spatial structure although some typical municipal objectives have a spatial implication:
• Protecting the natural environment requires more compact cities;
• Maintaining a high ratio of public transport trips requires high densities;
• Low housing prices requires an increase in land supply at densities set by demand generating a large suburban expansion.
• Fragmented decision-making. Typical situation for actor groups involved in the development of land (UBA, 2008):
• Municipalities maintain the hope that new inhabitants will lead to a tax surplus, when in fact studies have shown that this is only seldom the case. Therefore they generally favour the development of land. Costs are transferred as far as possible to the investor and as the municipality bears “no” costs the project is regarded as “good”.
• For landowners a plot represents an economic asset in whose increasing value they hope to profit. Thus, owners of agricultural land which is facing development become highly active.
• For project developers high unit costs to connect new dwellings or commercial premises to supply networks are often more than offset by the much cheaper land prices in peripheral areas at the edge of existing settlements. The extra transport costs are countered by other sales arguments (e.g. property prices, “living in the countryside”).
• Utility companies have little motivation to influence the location and density of use of newly constructed or newly connected areas, as the associated costs are reimbursed

ESPON 2013 22
by users in the form of construction subsidies or by a general rising of charges for all users.
• Householders seeking a new location are often ignorant of the high costs for technical infrastructures associated with low density peripheral areas. The low price of suburban land hides the rising infrastructure costs per housing unit which low settlement density causes.
• As a result fragmented decision taking supports therefore unsustainable land use developments: The single decisions are comprehensible; but either actors ignore the high follow up cost for transport, infrastructure, loss of land, biodiversity and ecosystem services or transfer these costs to others, finally every resident.
• The complex interrelations and possible side effects are often missed –or difficult to assess at the time of issuing the policies. For example rising prices as consequence of policy for urban concentration (Cheshire, 2006; Richardson and Bae, 2004).
• In market economies actors play an important role. It seems that that the preferences of people are lower densities and car ownership in many parts of Europe (see France for example Richardson and Bae, 2004 pàgina 93 posar referència). It has also been reflected in the rise of second homes that has been facilitated by the supply side (construction and related economies have been one of the most successful sectors in Spain in the last 10 years).
• Land use and transport are inter-dependent in complex ways as development influences mobility patterns. New suburban development without adequate public transport typically increases the demand for private car use. In contrast the construction of new light rail systems has a tendency to increase housing densities around access points (Handy, 2005). Households make choices between residential areas taking into account the price of housing and the price of commuting between the work and home. When travel costs fall below a certain threshold and income reaches a certain level the rate of sprawl quickens, and sprawl is more common in regions where incomes are high and commuting costs are low (Wu, 2006).
• Past history and geographical surroundings of the cities are underlying factors that modulate the morphology and trajectories of the cities. Coastal or mountainous location creates very different development options than location on a plain or along a river (Kasanko et al. 2006).
ESPON 2013 23
3. Impact of urban sprawl and land use patterns
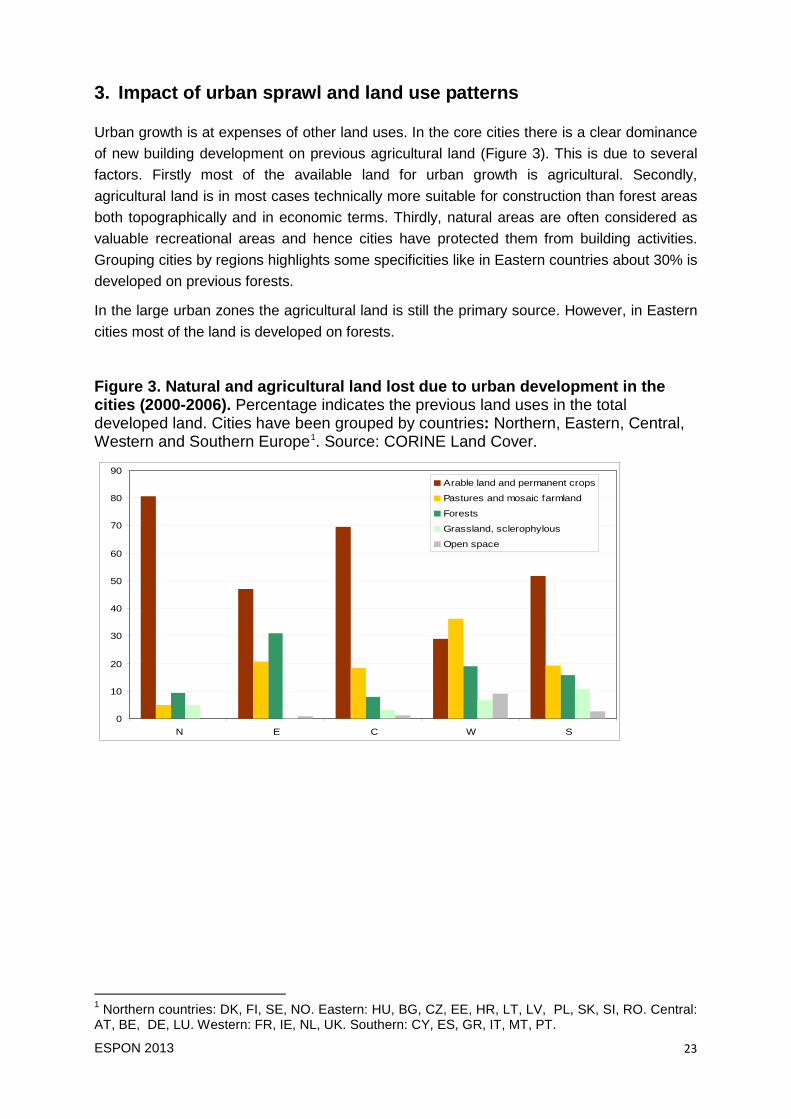
Urban growth is at expenses of other land uses. In the core cities there is a clear dominance of new building development on previous agricultural land (Figure 3). This is due to several factors. Firstly most of the available land for urban growth is agricultural. Secondly, agricultural land is in most cases technically more suitable for construction than forest areas both topographically and in economic terms. Thirdly, natural areas are often considered as valuable recreational areas and hence cities have protected them from building activities. Grouping cities by regions highlights some specificities like in Eastern countries about 30% is developed on previous forests.
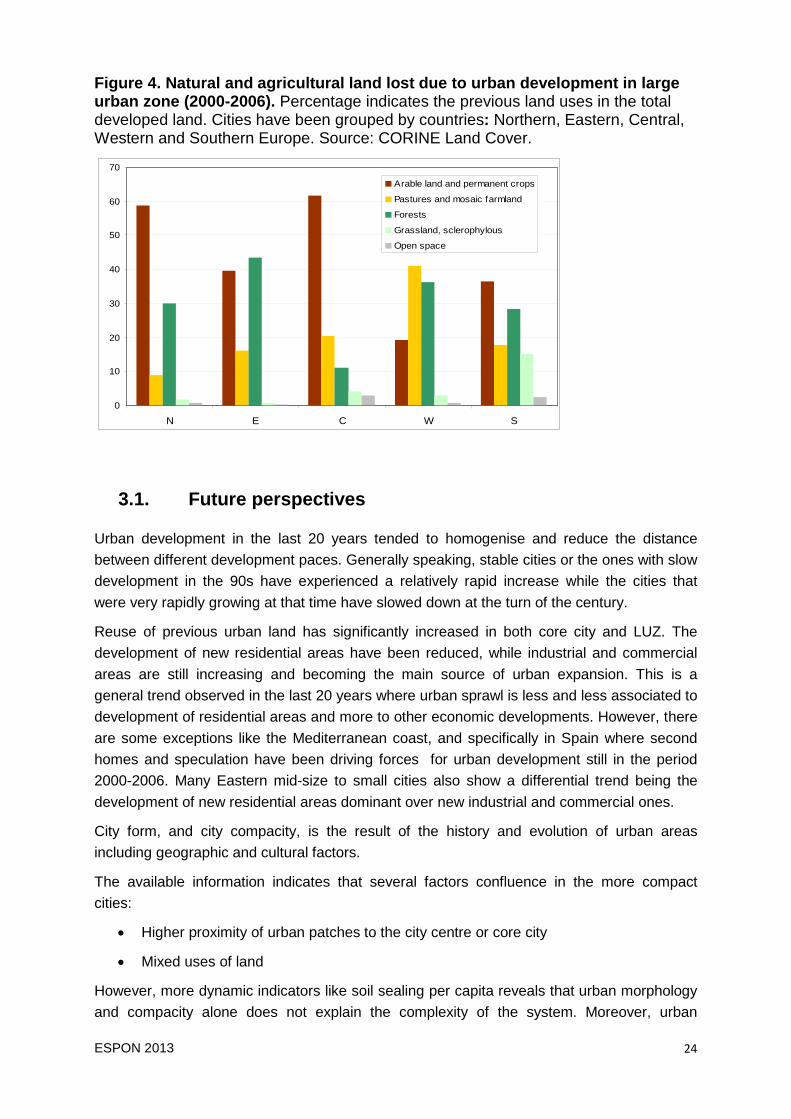
In the large urban zones the agricultural land is still the primary source. However, in Eastern cities most of the land is developed on forests.
Figure 3. Natural and agricultural land lost due to urban development in the cities (2000-2006). Percentage indicates the previous land uses in the total developed land. Cities have been grouped by countries: Northern, Eastern, Central, Western and Southern Europe1. Source: CORINE Land Cover.
0
10
20
30
40
50
60
70
80
90
N E C W S
Arable land and permanent crops
Pastures and mosaic farmland
Forests
Grassland, sclerophylous
Open space
1 Northern countries: DK, FI, SE, NO. Eastern: HU, BG, CZ, EE, HR, LT, LV, PL, SK, SI, RO. Central: AT, BE, DE, LU. Western: FR, IE, NL, UK. Southern: CY, ES, GR, IT, MT, PT.
ESPON 2013 24
Figure 4. Natural and agricultural land lost due to urban development in large urban zone (2000-2006). Percentage indicates the previous land uses in the total developed land. Cities have been grouped by countries: Northern, Eastern, Central, Western and Southern Europe. Source: CORINE Land Cover.
0
10
20
30
40
50
60
70
N E C W S
Arable land and permanent crops
Pastures and mosaic farmland
Forests
Grassland, sclerophylous
Open space
3.1. Future perspectives
Urban development in the last 20 years tended to homogenise and reduce the distance between different development paces. Generally speaking, stable cities or the ones with slow development in the 90s have experienced a relatively rapid increase while the cities that were very rapidly growing at that time have slowed down at the turn of the century.
Reuse of previous urban land has significantly increased in both core city and LUZ. The development of new residential areas have been reduced, while industrial and commercial areas are still increasing and becoming the main source of urban expansion. This is a general trend observed in the last 20 years where urban sprawl is less and less associated to development of residential areas and more to other economic developments. However, there are some exceptions like the Mediterranean coast, and specifically in Spain where second homes and speculation have been driving forces for urban development still in the period 2000-2006. Many Eastern mid-size to small cities also show a differential trend being the development of new residential areas dominant over new industrial and commercial ones.
City form, and city compacity, is the result of the history and evolution of urban areas including geographic and cultural factors.
The available information indicates that several factors confluence in the more compact cities:
• Higher proximity of urban patches to the city centre or core city
• Mixed uses of land
However, more dynamic indicators like soil sealing per capita reveals that urban morphology and compacity alone does not explain the complexity of the system. Moreover, urban
ESPON 2013 25
development in the last decade shows that intermediate cities are the most dynamic ones at the risk of being less efficient on use of land resources (soil sealing per capita).
From the transport perspective, compacity relates to increased use of public transport to work. However, more data is required to have a complete overview on all traffic in European cities. Current efforts done by the EC in this sense are very relevant.
All these factors are reflected in air quality, which indicates better conditions in more compact cities.
Cities are concentrators of population, knowledge and economy, but also of waste (Bugliarello, 2006). In order to overcome the negative aspects there is a need for local energy generation, more efficient management of energy use and readjustment of living patterns.

ESPON 2013 26
References
Ambiente Italia, 2003. European Common Indicators Towards a Local Sustainability Profile. Ambiente Italia, Milano.
Antrop, M., 2004. Landscape change and urbanization process in Europe. Landscape and urban planning 67(1-4):9-26.
Antrop, Marc. 2004. Landscape change and the urbanization process in Europe. Landscape and Urban Planning 67, no. 1-4 (March 15): 9-26. doi:10.1016/S0169-2046(03)00026-4.
Babisch, W., 2006. Transportation noise and cardiovascular risk, Review and synthesis of epidemiological studies, Dose-effect curve and risk estimation. Dessau, Umweltbundesamt, WaBoLu-Hefte 01/06
Baross, P. 2007. Urban Sprawl in Eastern Europe, the Budapest example. In Urban Sprawl in Europe. Brussels. http://www.rics.org/Newsroom/Keyissues/Urban/urban_sprawl_seminar_31Aug07.html.
Barredo, J.I., Kasanko, M., McCormick, N., and Lavalle, C., 2003. Modelling dynamic spatial processes: simulation of urban future scenarios through cellular automata. Landscape and Urban Planning, 64(3):145-160.
Barredo, J.I., Lavalle, C., Demicheli, L., Kasanko, M. and McCormick, N., 2003. Sustainable urban and regional planning. The MOLAND activities on urban scenario modelling and forecast. Joint Research Centre of the European Commission 2004 EUR 206 200 73 EN.
Barredo, J.I., Lavalle, C., Kasanko, M., Sagris, V., Brezger, A.S. and McCormick, N., 2004. Climate change impacts on floods in Europe.Towards a set of risk indicators for adaptation. Joint Research Centre of the European Commission 2004 EUR 21472 EN.
Barredo, J.I., Petrov, L., Sagris, V., Lavalle, C. and Genovese, E., 2005. Towards an integrated scenario approach for spatial planning and natural hazards mitigation. Joint Research Centre of the European Commission EUR 21900 EN.
Bellot, Bonet, Peña, and Sánchez. 2007. Human Impacts on Land Cover and Water Balances in a Coastal Mediterranean County. Environmental Management 39, no. 3 (March 17): 412-422. doi:10.1007/s00267-005-0317-9.
Bertaud, A. 2004. The Spatial Structures of Central and Eastern European cities: more European than socialist? In International symposium on post-communist cities the Russian and East European Center (REEC) "Winds of Societal Change: Remaking Post-communist Cities", 21.
Blue Plan, 2005. A Sustainable Future for the Mediterranean. The Blue Plan’s Environment & Development Outlook. Edited by Guillaume Benoit & Aline Comeau. Earthscan, London. 450 p.
Bond, T.C., Wehner, B., Plewka, A., Wiedensohler, A., Heintzenberg J., Charlson R., (2006). Climate-relevant properties of primary particulate emissions from oil and natural gas. Atmospheric Environment. 40 (19), 3574-3587

ESPON 2013 27
Borrego, C., Martins, H., Tchepel, O., Salmim, L., Monteiro, A. and Miranda, A.I., 2006. How urban structure can affect city sustainability from an air quality perspective. Environmental Modelling & Software, 21(4):461-467.
Brueckner, J.K., (2000). Urban sprawl: diagnosis and remedies. International Regional Science Review, 23 (2), 160-171
Bulkeley, H., Betsill M., (2005). Cities and Climate Change: Urban Sustainability and Global Environmental Governance. London and New York: Routledge.
Burton, E. 2000. The Compact city: Just of just compact? A preliminary analysis. Urban Studies 37(11): 1969-2001.
Camagni, R., Gibelli, M.C., and Rigamonti, P., 2002. Urban mobility and urban form: the social and environmental costs of different patterns of urban expansion. Ecological economies, 40(2): 199-216.
Cameron, I., Lyons T.J. and Kenworthy, J.R., 2004. Trends in vehicle kilometers of travel in world cities, 1960-1990: underlying drivers and policy responses. Transport Policy, 11(3):287-298.
Couch, C. and Karecha, J., 2006. Controlling urban sprawl: Some experiences from Liverpool. Cities 23(5):242-363.
Couch, C. Karecha, J. Nuissl, H. Rink, D., 2005. Decline and Sprawl: An evolving type of urban development – observered in Liverpool and Leipzig. European Planning Studies (13)1:117-136.
Couch, C., G. Petschel-Held, and L. Leontidou. 2007. Urban Sprawl in Europe - Book Information. http://www.blackwellpublishing.com/book.asp?ref=9781405139175&site=1#about.
Couch, C., Petschel-Held , G. and Leontidou, L., 2008 Urban Sprawl in Europe. Landscape, Land-Use Change & Policy. Blackwell Publishing, RICS.
Couch, Chris, Jay Karecha, Henning Nuissl, and Dieter Rink. 2005. Decline and sprawl: an evolving type of urban development – observed in Liverpool and Leipzig. European Planning Studies 13, no. 1: 117. doi:10.1080/0965431042000312433.
De Roo, G., Miller, D., (2000). Compact Cities and Sustainable Urban Development: A Critical assessment of Policies and Plans from an International Perspective. Ashgate, Hampshire, England.
Dieleman, F.,Wegener,M., (2004). Compact city and urban sprawl. Built Environ, 30 (4), 308-323
Dosch, F. 2008. Driving forces of land consumption in Germany. http://www.bbr.bund.de/cln_005/nn_62854/EN/ResearchProgrammes/GeneralDepartmentalResearch/SpatialPlaning/LandConsumption/01__Start.html
Dosch, F., 2001. Land consumption and soil sealing in Germany - monitoring, measures, indicators. Technical Workshop on Indicators for Soil Sealing. Copenhagen, 26 - 27 March, 2001.
ESPON 2013 28
EEA & JRC, 2002. Towards an Urban Atlas. Assessment of spatial data on 25 European cities and Urban areas. European Environment Centre and Joint Research Centre of the European Commission. Environmental Issue Report No. 30. Luxembourg, Office for Official Publications of the European Communities.
EEA and JRC, 2006. Urban sprawl in Europe. The ignored challenge. EEA Report 10/2006. Office for Official ublications of the European Communities, Luxembourg.
EEA European Environment Agency, 2007. http://ims.eionet.eu.int, EEA CSI 004
EEA, 2009. Ensuring Quality of Life in European Cites and Towns. In press.
European Commission, 2007. EU Research on Environment and Health - Results from projects funded by the Fifth Framework Report, Luxembourg: Office for Official Publications of the European Communities.
European Commossion, 1990. Green Paper on the urban environment. Communication from the Commission to the Council and the European Parliament. COM(1990) 218 FINAL.
Ewing, R., Pendall, R., Chen, D., (2002). Measuring Sprawl and its Impact. Smart Growth America, Washington, DC.
Fisher, J.B., Kelly, M., Romm, J., (2006). Scales of environmental justice. Combining GIS and spatial analysis for air toxics in California. Health & Place 12 (4), 701-714
Frank, N., S White, Z.-R. Peng, K. Harris, and W. Sanders. 2000. Exploring Sprawl: Findings of a Comprehensive Review of the Literature Related to "Sprawl" or What Do We Really Know? Department of Urban Planning, University of Wisconsin-Milwaukee.
Gillham, O., Maclean, A., (2001). The Limitless City. Island Press, Washington, DC.
Gjestland, T; 2007. The socio-economic impact of noise: A method for assessing noise annoyance. Noise Health, 9:42-4
Gusdorf, François, Stéphane Hallegatte, and Alain Lahellec. Time and space matter: How urban transitions create inequality. Global Environmental Change In Press, Corrected Proof. doi:10.1016/j.gloenvcha.2008.06.005. http://www.sciencedirect.com/science/article/B6VFV-4T9TC2J-1/2/eb3974b73eb4f0e1b75a7792d393347a.
Haase, D., Nuissl, H., (2007). Does urban sprawl drive changes in the water balance and policy? The case of Leipzig (Germany) 1870-2003. Landscape and Urban Planning, 80 (1-2), 1-13
Handy, S., 2005. Smart growth and the transportation-lad use connection: What does the research tell us? International Regional Science Review 28(2):146-167.
Hasse, J., Lathrop, R., (2003). Land resource impact indicators of urban sprawl. Applied Geography, 23 (2-3) 159-173
Highwood E.J., Kinnersley R.P., (2006). When smoke gets in our eyes The multiple impacts of atmospheric black carbon on climate, air quality and health. Environment International 32 (4), 560-566
Hitzenberger, R., Tohno, S., (2000). Comparison of black carbon (BC) aerosols in two urban areas - concentrations and size distributions. Atmospheric Environment, 35 (12), 2153-2167
ESPON 2013 29
Hoek, G.et al, 2002. Association between mortality and indicators of traffic-related air pollution in the Netherlands: a cohort study, The Lancet 360 (2002) 9341-47
Holden, E. and Norland, I., 2005. Three challenges for the compact city as a sustainable urban form: Household consumption of energy and transport in eight residential areas in the greater Oslo Region. Urban Cities, 42 (12):2145-2166.
Holmes, N.S., Morawska, L.,(2006). A review of dispersion modelling and its application to the dispersion of particles. An overview of different dispersion models available. Atmospheric Environment, 40 (30), 5902-5928
Jarup L., et.al., 2008. Hypertension and exposure to noise near airports: the HYENA study. Environmental Health Perspectives Volume 116, Number 3, March 2008:329-333
Jenks, M., Burgess, R., (2000). Compact Cities: Sustainable Urban Forms for Developing Countries. Spon Press, London.
Johnson, M.P., (2001). Environmental impacts of urban sprawl: a survey of the literature and proposed research agenda. Environonmental Plannning A, 33, 717-735
Kalnay, E., Cai, M., (2003). Impact of urbanization and land-use change on climate. Nature, 423, 528-531
Kasanko, Marjo, Jose I. Barredo, Carlo Lavalle, Niall McCormick, Luca Demicheli, Valentina Sagris, and Arne Brezger. 2006. Are European cities becoming dispersed?: A comparative analysis of 15 European urban areas. Landscape and Urban Planning 77, no. 1-2 (June 15): 111-130.
Kasanko, Marjo, Jose I. Barredo, Carlo Lavalle. 2006. Are European cities becoming dispersed?: A comparative analysis of 15 European urban areas. Landscape and Urban Planning 77, no. 1-2 (June 15): 111-130.
Keilman, N., 2003. Biodiversity: The threat of small households. Nature, 421 (6922):489-490.
Koelmans, A.A., Jonker, M., Cornelissen, G., Bucheli, T., Van Noort P., Gustafsson O., (2006). Black carbon. The reverse of its dark side. Chemosphere. 63 (3), 365-377
Kousky, C., Schneider S.H., (2003). Global climate policy. Will cities lead the way. Climate policy. 3 (4), 359-372
Longley, P.A., Mesev. V.,(2000). On the measurement and generalization of urban form. Environonmental Planning A, 32, 473-488
Marshall, J.D., McKone, T.E., Deakin, E., Nazaroff, W.W.,(2005). Inhalation of motor vehicle emissions: effects of urban population and land area. Atmospheric Environment. 39 (2), 283-295
Mattew K., (2006). Green Cities.Urban Growth and the Environment. Brookings Institution.
Mitchell, C.J.A., 2004. Making sense of counterurbanization. Journal of Rural Studies, 20:15-34.
Muñoz, F., 2003. Lock-living: urban sprawl in Mediterranean cities. Cities 20(6): 381-385.
Naess, P., and O. Jensen. 2004. Urban structure matters, even in a small town. Journal of Environmental Planning and Management 47, no. 1: 35-57.

ESPON 2013 30
Nuissl, H. and Rink, D., 2005. The ‘production’ of urban sprawl in eastern Germany as a phenomenon of post-socialist transformation. Cities, 22(2):123 – 134.
Ode, Å. and Fry, G., 2006. A model for quantifying and predicting urban pressure on woodland. Landscape and Urban Planning, 77(1-2):17-27.
Ott, T., 2001. From concentration to deconcentration – migration patterns in the post-socialist city. Cities, 18(6):403 – 412.
Owen, S.M., MacKenzie, A.S., Bunce R.G.H., Stewart H.E., Donovan, R.G., Stark, G., Hewitt C.N., (2006). Urban land classification and its uncertainties using principal component and cluster analyses. A case study for the UK West Midlands. Landscape and Urban Planning, 78, 311-321
PBL, 2008. Urbanisation dynamics and Quality of Place in Europe, EURBANIS report 1. Planbureau voor de Leefomgeving (NEAA), Bilthoven, the Netherlands.
Per Ronald van Kempen, Marcel Vermeulen, Ad Baan, European Institute for Comparative Urban Research, 2006. Urban Issues And Urban Policies In The New EU Countries. Ashgate Publishing, Ltd.
Pijanowski, Bryan C., Daniel G. Brown, Bradley A. Shellito, and Gaurav A. Manik. 2002. Using neural networks and GIS to forecast land use changes: a Land Transformation Model. Computers, Environment and Urban Systems 26(6): 553-575.
Scipioni, Antonio, Anna Mazzi, Marco Mason, and Alessandro Manzardo. 2008. The Dashboard of Sustainability to measure the local urban sustainable development: The case study of Padua Municipality. Ecological Indicators In Press, Corrected Proof.
Stansfeld et al., 2005. Aircraft and road traffic noise and children's cognition and health: a cross-national study. The Lancet, Volume 365, Issue 9475, Pages 1942
Sutton, P.C., (2006). A scale-adjusted measure of Urban sprawl using night-time satellite imagery. Remote Sensing of Environment. 86 (3), 353 - 369
Svensson, M.K. and Eliasson, I., 2003. Diurnal air temperatures in built-up areas in relation to urban planning. Landscape and Urban Planning, 61:37-54.
Tapioa, P., Banisterb, D., Luukkanena, J., Vehmasa, J., Willamo R., (2007). Energy and transport in comparison: Immaterialisation, dematerialisation and decarbonisation in the EU15 between 1970 and 2000. Energy Policy, 35 (1), 4333-451
Thunis, P., Rouil L., Cuvelier, C., Stern R., Kerschbaumer, A., Bessagnet, B., Schaap, M., Builtjes, P. Tarrason, L., Douros, J., Moussiopoulos, N., Pirovano, G., Bedogni, M., (2006). Analysis of model responses to emission-reduction scenarios within the citydelta project. Atmospheric Environment, 41 (1), 2007, 208-220
Torrens, P.M., Marina, A., (2000). Measuring Sprawl. Centre for Advanced Spatial, London.
Tsai, Y., (2005). Quantifying Urban Form. Compactness versus 'Sprawl'. Urban Studies, 42 (1) 141-161
Turok, Ivan, and Vlad Mykhnenko. 2007. The trajectories of European cities, 1960-2005. Cities 24, no. 3 (June): 165-182.
ESPON 2013 31
van Kempen, R, Vermeulen, M. Baan, A. 2005. Urban Issues And Urban Policies In The New EU Countries. Ashgate Publishing.
Voogt J.A., Oke T.R., (2003).Thermal remote sensing of urban climates. Remote Sensing of Environment. 86 (3), 370-384
York, R., (2007). Demographic trends and energy consumption in European Union Nations 1960 - 2000. Social Science Research. 36 (3), 855-872
Zellner, Moira L., Thomas L. Theis, Arunprakash T. Karunanithi, Ahjond S. Garmestani, and Heriberto Cabezas. 2008. A new framework for urban sustainability assessments: Linking complexity, information and policy. Computers, Environment and Urban Systems In Press. Corrected Proof.

ESPON 2013 32
The ESPON 2013 Programme is part-financed by the European Regional Development Fund, the EU Member States and the Partner States Iceland, Liechtenstein, Norway and Switzerland. It shall support policy development in relation to the aim of territorial cohesion and a harmonious development of the European territory.
ISBN 978-2-919777-19-8