eu islands: towards a sustainable energy future
TRANSCRIPT
A EurElEctric report, june 2012
Eu islAnds: towArds A sustAinAblE EnErgy FuturE
The Union of the Electricity Industry–EURELECTRIC is the sector association representing the common interests of the
electricity industry at pan-European level, plus its affiliates and associates on several other continents.
In line with its mission, EURELECTRIC seeks to contribute to the competitiveness of the electricity industry, to provide
effective representation for the industry in public affairs, and to promote the role of electricity both in the
advancement of society and in helping provide solutions to the challenges of sustainable development.
EURELECTRIC’s formal opinions, policy positions and reports are formulated in Working Groups, composed of experts
from the electricity industry, supervised by five Committees. This “structure of expertise” ensures that EURELECTRIC’s
published documents are based on high-quality input with up-to-date information.
For further information on EURELECTRIC activities, visit our website, which provides general information on the
association and on policy issues relevant to the electricity industry; latest news of our activities; EURELECTRIC positions
and statements; a publications catalogue listing EURELECTRIC reports; and information on our events and conferences.
Dépôt légal: D/2012/12.105/24
EURELECTRIC pursues in all its activities the application ofthe following sustainable development values:
Economic Development
Growth, added-value, efficiency
Environmental Leadership
Commitment, innovation, pro-activeness
Social Responsibility
Transparency, ethics, accountability

EU islands: Towards a sustainable energy future--------------------------------------------------------------------------------------------------
EURELECTRIC NE Island System Managers
ChairTom Woodford (GB)
Members of the groupAntonio Alvarado Rodriguez (ES); Chris Ambler (GB); Yves Barlier (FR); Eric Bassac (FR); Andreas Poullikkas (CY);John P. Danielsen (FO); Jean-Michel Deveza (FR); Hakun Djurhuus (FO); John Duquemin (GB); Fernando Ferreira(PT); Nuno Gomes (PT); Peter Grima (MT); Philip E. King (GB); Jay Luximon (MU); Jean-Michel Deveza (FR);Joseph Maire (FR); Nuno Mendes (PT); Filipe Mendonça (PT); David Padfield (GB); Ramon Rodriguez Tomas(ES); Bilal Simsek (TR); Paul Sohier (GB);
Contact
Henning Haeder (EURELECTRIC) – [email protected]


Table of contents
EXECUTIVE SUMMARY .....................................................................................................................................7
INTRODUCTION ...............................................................................................................................................8
286 EU ISLANDS….................................................................................................................................................. 8…FACING SIGNIFICANT CHALLENGES .......................................................................................................................... 10REPORT OUTLINE.................................................................................................................................................. 10
I. THE CURRENT ENERGY SITUATION ON EU ISLANDS ..............................................................................12
METHODOLOGY.................................................................................................................................................... 12ANALYSIS OF QUESTIONNAIRE RESPONSES .................................................................................................................. 12
II. ENERGY CHALLENGES FOR ISLANDS......................................................................................................16
EMISSIONS .......................................................................................................................................................... 16REGULATION & MARKET DESIGN .............................................................................................................................. 18SECURITY OF SUPPLY AND SYSTEM STABILITY ............................................................................................................... 19OIL IMPORTS AND PRICE VOLATILITY.......................................................................................................................... 22COST MATTERS MORE ON ISLANDS............................................................................................................................ 24
III. BEST PRACTICES AND OPTIONS AHEAD ................................................................................................26
A. KEY PRINCIPLES & TRENDS............................................................................................................................. 26Islands moving towards low-carbon generation led by RES........................................................................ 26Smart grids, demand side participation and energy efficiency ................................................................... 30Interconnectors grow - slowly ..................................................................................................................... 31Storage........................................................................................................................................................ 33
B. BENCHMARKS: BEST PRACTICE ....................................................................................................................... 36Renewable energy projects ......................................................................................................................... 36Flexible conventional generation ................................................................................................................ 40Interconnectors ........................................................................................................................................... 43Demand side management & energy efficiency ......................................................................................... 43Storage........................................................................................................................................................ 46
TOWARDS AN EU ISLAND ACTION PLAN 2020................................................................................................49
ANNEX ...........................................................................................................................................................50

7
Executive SummarySome 2% of the European population lives on islands. The situation of these ten million Europeans interms of energy supply is quite different from the rest of the EU population. As such, it deservesspecific attention.
EURELECTRIC seeks to promote islands in EU energy policy and to initiate an EU Island SustainableEnergy Action Plan. This report closely analyses power generation in EU islands. It provides insightsinto the status quo of power supply and demand, looks into the regulatory framework, highlightsbest practice and presents solutions towards sustainable energy systems for islands.
Europe’s islands are facing considerable challenges in meeting their energy needs in a sustainable,affordable and reliable way. Island energy systems, despite their diversity, share commoncharacteristics and are subject to common challenges. Their sustainable energy future depends onan improved investment climate and policy framework. Five main challenges can be identified:
- Market failure: Due to their small size, islands lack economies of scale in financing and powerproduction. They also face operational constraints originating from the isolated nature of theirpower systems. As a result, most islands do not enjoy many options for diversifying their energysupply and usually rely on oil-fired diesel engine generation for their power generation.
- Inconsistent regulation: The regulatory treatment of islands is not straightforward. Islands toooften suffer from ‘copy-paste’ reasoning, whereby solutions from the mainland are applied to adifferent reality. Island markets are different and therefore require a different approach that isboth reasonable and proportionate.
- Security of supply: Due to their isolation, islands have to take extra measures to ensure systemstability and security of supply. Such measures demand more attention on islands than on themainland with the growing penetration of variable renewable energy sources (wind and solar).
- Emissions: Islands’ dependency on diesel engine generation will make it difficult and costly tocomply with the forthcoming emission requirements of EU regulation.
- Import dependency: The reliance on oil imports for power generation renders islands veryvulnerable to oil price volatility. The increasingly more stringent fuel quality requirementsneeded to meet environmental targets additionally impinge on the availability of such fuel.
Despite these challenges, power companies operating on islands are committed to change andforward-looking solutions. Acting through EURELECTRIC’s Network of Experts for Island EnergySystems (NEIS), European island operators insist that policy changes are needed and presentpossible solutions for the move toward sustainability, as documented in this report’s benchmarkingsection. The report makes the following recommendations to national and European policymakers toincentivise the transition towards a sustainable energy future:
1. Set up an EU Island Sustainable Energy Action Plan 20202. Improve security of supply through diversification of power generation technologies, as
well as interconnection where possible3. Use islands as a priority test-bed for innovative technologies such as storage, smart grids
and RES. Foster RD&D on islands4. Use exemptions appropriately and address the market failures that often occur as a result
of limited size and isolation
8
Introduction
286 EU islands…
286 islands are located within EU territory. Their power systems are often isolated, with nointerconnection to the EU mainland or to other islands. Their markets are limited, which makesinvestments difficult to justify. Their environmental situation is fragile and further weakened by non-sustainable tourism, especially on some Mediterranean islands. Their regulation is different fromone island to the other, depending on the specific relationship between the relevant member stateand the EU. In the best cases, a favourable interaction between the EU and the member statesupports the island in facing its specific challenge.
There is a clear need for support and a step change. Depending on their size, economic structure,population and location, the power demand among islands varies. Although their location usuallydoes not make diesel an obvious fuel for power generation, many nevertheless opt for this solution.While this is typical for isolated systems, it is neither sustainable, nor does it add to security ofsupply if used as the only fuel. In this, EU islands are not an exception but confirm the difficultsituation faced by islands and small isolated communities worldwide. Awareness is fortunatelyrising, not only in Europe through EURELECTRIC, but also through the International RenewablesEnergy Agency IRENA for example, which has made the topic a priority on the global scale for 2012.
Despite the numerous challenges, power companies try to demonstrate alternatives and forward-looking solutions. But in order to do so efficiently and on the right scale, they need political support,reasonable and proportionate regulation and should be able to rely on a favourable investmentclimate.
This report examines power generation in EU islands. It provides insights into the status quo ofpower supply and demand, looks into the regulatory framework, highlights best practice andpresents solutions towards sustainable energy systems for islands. The report is based on theexpertise, experience and contributions of EURELECTRIC’s Network of Island System Managers(NEIS).

9
The EU’s Islands
According to EUROSTAT, an island is defined as an area of at least 1 km2, located at a distance of atleast one kilometre from the continent, that has a permanent resident population of at least 50people, has no permanent link with the continent and does not host an EU capital. On the basis ofthis definition the European Commission’s DG REGIO has identified 286 EU islands.
Together, they are home to almost 10 million people occupying an area of 100,000 km2.
Their population varies from 50 people to five million in Sicily. The population of the latterexceeds that of EU member states like Luxembourg and equals that of Finland.
EU islands are located in three major geographical areas: the Atlantic, the North and –accounting for 85% of the population – the Mediterranean.
The 286 islands belong to eleven EU countries, with five member states accounting for over75% of the islands.
With few exceptions islands’ economic and social situation is less favourable than that of the countryto which they belong. Their GDP per capita is thus usually lower. According to Bradley Dunbar1 theaverage living standard is 72% of the EU average, with considerable differences among the group.Political autonomy also varies widely, with places such as the Åland islands being very autonomouswhile others having no administrative powers of their own.
The EU’s islands are diverse: a few islands are very densely populated, while a very large number ofsmall islands are sparsely populated. This evidently leads to varying market and investmentconditions: the smaller the population, the smaller the market, and thus the greater the challenge ofestablishing a sustainable energy system.
It is worth mentioning that the EU definition for islands is not always straightforward. While islandswithin the territory of EU member states are included in the definition, island member states such asMalta and Cyprus are not. Nevertheless, they are also very much affected by the challenges islandsface in terms of power systems.
1 Quoted from Planistat Europe, Bradley Dunbar Associates Ltd., Analysis of the Island regions and the outermost regionsof the EU. Final report March 2003, consulted web 28.3.2012.

10
…facing significant challenges
Dependence on oil
Although many islands have abundant natural resources, most of them depend on external energysources, mainly oil. Oil products account not only for the lion’s share in transport, but also in powergeneration. The reason is simple: bulk gas shipping or gas/power interconnection with the nearestmainland are more expensive than oil imports, and the power system is too small to justify otherinvestments at market conditions.
Missing interconnections
While islands close to the European mainland – like the British Channel Islands – are often alreadyinterconnected, remoter places cannot afford it. Larger Mediterranean islands are increasinglyinterested in interconnection with the mainland. Here the development of high voltage AC or DCsubsea power cables falls within the scope of network development planners. Prominent projectsinclude the planned EuroAsia power link connecting Israel to Cyprus and its extension to Crete andthen the Greek mainland, and the interconnector from Malta to Sicily, which is under construction.2
The EuroAsia power link however faces significant costs and would be nearly 1,000 km long, for acost of approximately €1.5bn. High costs will restrict the number of islands going forinterconnections to include only larger ones above a certain threshold and those relatively close tothe mainland.
Islands as an opportunity for demonstrating energy solutions
But islands are not only an issue for concern – they also represent a unique opportunity. Thanks totheir isolated and small integrated power systems they have the potential to become places ofdemonstration, as a test-bed for energy solutions. They represent microcosms of the largerEuropean energy system in which new projects such as smart grids or electric transport can betested quickly and effectively. Their smaller public authorities also mean that regulatory andplanning decisions can be taken faster, speeding up decision-making and project implementation.Islands can therefore play an important demonstration role in the transition towards a carbon-neutral and sustainable energy system.
Report Outline
Despite making the case for islands at large, this report cannot take the entire range of the EU’s 286islands into account. It is therefore based on selected examples from within the EU territory, withsome additional examples from islands located outside of the EU but affiliated to EU member states,where useful for demonstration and best practice.
Chapter I presents the status quo of a number of selected European islands with respect tosocial, environmental and energy key performance indicators. These data have beengathered through a questionnaire circulated by EURELECTRIC among its memberassociations on island systems.
2 The example of the Malta - Sicily interconnector will be addressed in more detail later in the report.

11
Chapter II outlines the main challenges faced by power generators on European islands.
Showcasing different projects and best practices, Chapter III highlights solutions for islandsystems that deliver increased security of supply via a diversified fuel mix, but also throughinterconnection, more sustainability via reduced emissions both in transport and powergeneration, demand side measures and smart grids. Although many islands face similarchallenges, tailor-made solutions are needed that take into account the specificities anduniqueness of each island in terms of location, size and legacy.
12
I. The Current Energy Situation on EU Islands
Small island power systems differ significantly from larger European ones in a number of key issues,which determine their current situation and their options for developing sustainable solutions.Firstly, most island power companies are vertically integrated. Furthermore, island electricitysystems are characterised by a significantly higher generation margin. As their systems are notinterconnected to neighbouring networks to import electricity in case of demand surges andgenerator faults, operators have to ensure security of the system at any given moment by creatinghigh generation margins.
Another size-related challenge for small system operators is the lack of economies of scale. Thisoften makes the usual way of unbundling and privatisation to open the energy market unfeasible, asthe threshold for potential customers necessary to stabilise the market is often not given. Just as forlarger energy systems, islands will need a stable and incentivising regulatory framework to tackle thechallenges inherent to their systems.
Methodology
For the purpose of this report, a questionnaire was sent to the EURELECTRIC Network of Experts forIsland Systems. It addressed the current state of isolated systems, their performance and thechallenges they face.
Analysis of questionnaire responses
As a general rule island economies are more fragile than those of the mainland due to their smallsize, small market, and the related lack of strong industry. These factors, often coupled with anoverdependence on tourism and the related vulnerability to the recession, have had a negativeimpact on almost all islands in recent years. One indicator for this is the high unemployment figuresfor many island societies, which are often reinforced by seasonal unemployment. In many cases,islands represent the regions with the highest unemployment figures in their EU member state. Thisis especially the case for islands depending on tourism, which are directly affected by economicdownturn at home and abroad. The Spanish Canary Islands for instance had an unemployment rateof more than 32% in spring 2012, almost three times higher than the euro area’s seasonally-adjustedunemployment rate of 10.9% and remarkably higher than the national rate.3 Detailedunemployment figures for each island can be found in the annex.
Power demand
Like the mainland, islands experienced a decline in electricity demand throughout the recenteconomic slump, correlated with a decrease in GDP. However, according to our internal enquiry,most European islands are expecting increases in electricity demand. Islands expect an averageincrease of 24% from 2009 to 2020. This is a significantly larger increase than the 14% expected forthe EU-27.4 Figure 1 shows the total expected increase in power demand – an importantdevelopment to keep in mind when analysing the challenges for islands in the next chapter.
3 Source: Eurostat, numbers for March/April 2012. Unemployment rate for Spain: 24.1% (March 2012)4 Source: EURELECTRIC Power Statistics 2011

13
Figure 1: Island power demand outlook 2020 (Input dates 2007-2011, 2020)
Installed power generation technologies
The current electricity mix of most small islands is dominated by diesel or heavy fuel oil. The mainreasons behind this choice are threefold: the relative ease with which fuel can be purchased andsupplied (compared to e.g. supplying gas through a pipeline or by tanker as either liquefied naturalgas (LNG) or compressed natural gas (CNG)), the flexibility of the installed engines in meeting dailyand seasonal variations in energy demand, and the lack of storage. In order to maintain anappropriate security of supply, adequate levels of redundancy in case of a failure at a producing unithas led to the preference for several smaller units instead of one large generator. In addition, dieselengines’ efficient operation across the volatile demand scenarios, along with their relatively lowinstallation and maintenance costs, has made this technology the backbone of most island powergeneration systems.
However, significant economic and ecological drawbacks have led system managers to reconsiderthe status quo. High fuel costs, especially when fuel is bought in small quantities, combined withvolatile fuel prices and increasing demands for better quality fuels to minimise environmentalimpacts all call into question the overreliance on diesel generation. The desire to remain flexiblewhile reducing the dependency on expensive oil imports has created a strong economic incentive tochange the system. Ecological incentives are equally relevant. CO2, NOx and SOx emissions fromdiesel generation are high: 890g CO2 equivalent per kWh calculated for the life cycle of a diesel-firedpower plant.5 Emission abatement technologies have been installed for NOx reductions at mostconventional power plants on islands, which together with technological advancement have led tolower NOx emission levels in recent years. While more abatement technologies are technicallyavailable, and in fact have been installed at the new 144MW plant in Malta (described in more detailin Chapter III), technologies such as selective catalytic reduction and flue gas desulphurisation maynot be suitable for most island systems due to variable power demand and frequent starting andstopping of generators.
5 See VGB Facts & Figures – Electricity Generation 2011/2012

14
The energy legislative framework on EU islands
Which policymakers should one approach to improve the regulatory framework for energy onislands – national governments or the EU? The answer is: both. Islands have different and oftenspecial relationships with the EU and with the countries they belong to. The difference stems fromthe accession treaty and a special protocol between the mainland and the European Union. Thisnegotiated special relationship is based on previous agreement between the member state and theautonomous or semi-autonomous territory in question – in this case an island.
Figure 2: Punta Grande diesel power station, Canary Islands6
This bilateral approach between the EU and its member states has created a complex reality: someterritories are formally part of the EU while others are not. All have particular arrangements orderogations under EU law. Moreover in some cases these initial arrangements have changed or arein the process of changing. Territories which are constitutionally linked to a member state andwhose relationships with the EU are governed by primary Community law include: the so-called“ultraperipheral regions”, the Overseas Countries and Territories (OCTs), the Åland Islands, the FaroeIslands, the Channel Islands, the Isle of Man, Gibraltar, Ceuta and Melilla. Of these, only theultraperipheral regions, the Åland Islands, Gibraltar, Ceuta and Melilla are formally part of the EU.With the exception of Gibraltar, French Guiana, Ceuta and Melilla, all of these territories are islands.
The EU has always implicitly recognised the special nature and needs of islands, as shown by itsdiverse relationships with member state island territories and by the special derogations andarrangements negotiated with these territories. The EU has also recognised the particular situationof islands more explicitly in the Treaty of Amsterdam, which introduced several references toislands, in particular through Article 158 (Article 174 of the Lisbon Treaty).
6 All images in this report are provided by EURELECTRIC NEIS members and their partners

15
In developing a sustainable energy policy, islands could possibly benefit from several EUpolicies/instruments. The legal bases for support are Articles 170 (ex 154) of the Treaty of theEuropean Union, (trans-European networks), Article 174 (economic and social cohesion), Article 349(for particular islands) and Declaration 33 of the Lisbon Treaty.7
Support for islands’ sustainable energy policy is notably put under the premises of broader regionalpolicies. In addition, the European Investment Bank or the Marguerite Fund can provide support toislands for Greenfield infrastructure in transport, energy and renewables.8 The EuropeanCommission’s DG Energy also since 2010 supports the ISLE PACT9 project, which aims to producebankable sustainable energy projects on islands. EURELECTRIC NEIS and ISLE PACT are cooperating.
To conclude on our initial question whether to address national or European policymakers, it can besaid that precisely because of the complex design of islands’ governance, which is caught betweennational and European authorities, both are of equal importance.
7 Article 174: “In order to promote its overall harmonious development, the Union shall develop and pursue its actionsleading to the strengthening of its economic, social and territorial cohesion. In particular, the Union shall aim atreducing disparities between the levels of development of the various regions and the backwardness of the leastfavoured regions. Among the regions concerned, particular attention shall be paid to rural areas, areas affected byindustrial transition, and regions which suffer from severe and permanent natural or demographic handicaps such asthe northernmost regions with very low population density and island, cross-border and mountain regions.”
8 www.margueritefund.eu9 www.islepact.eu
16
II. Energy challenges for islands
Emissions
Emissions are clearly a challenge for islands, which generate the lion’s share of their electricity withliquid fossil fuels.
Islands are heavily dependent on diesel generation. They have been largely exempted from theLarge Combustion Plant Directive (LCPD), but this has kept them on an unsustainable path. Withoutsupport schemes and incentives, their transition to comply with the forthcoming requirements ofthe Industrial Emissions Directive (IED) will be very difficult and costly and introduce increasedconstraints on local generation.
Small isolated systems which obtained less than 5% of their energy through the European grid by theyear 2010 benefit from a four-year derogation from the IED. They can continue to operate with thecurrent emission limit values of the LCPD until 31 December 2019 (instead of 1 January 2016). This isjustified with the huge economic consequences of applying the emission limit values (specified inAnnex V) on island power sectors with a small or isolated network or insufficient interconnection. Inthe new IED certain emission limit values for SO2, NOx, CO and dust have been lowered.
The EU’s Industrial Emissions Directive (IED)
The IED revises and recasts seven directives (including the Large Combustion Plant Directive and theIntegrated Pollution and Prevention Control Directive) into a single legal act. In line with the ‘polluterpays’ principle and the principle of pollution prevention, the directive sets out the framework tocontrol the main industrial activities, giving priority to intervention at source, ensuring prudentmanagement of natural resources, and taking into account, when necessary, the economic situationand specific characteristics of the place where the industrial activity occurs.
Prevention and control of pollution is ensured by only allowing the operation of installations holdinga permit. The permit includes all the measures necessary to achieve a high level of environmentalprotection. The permit also includes emission limit values for polluting substances, or equivalentparameters or technical measures, appropriate requirements to protect the soil and groundwater,and monitoring requirements. Permit conditions are set on the basis of best available techniques(BAT). Emission limit values deviating from BAT levels are only possible where they would lead todisproportionately high costs compared to the environmental benefits. In any case however, theemission limit values set out in the directive should not be exceeded.
Within four years after publishing decisions on BAT conclusions, the permit conditions forinstallations must be reconsidered to take into account all new or updated BAT conclusions. It isimportant to highlight that combustion plants need sufficient time to install the necessaryabatement measures to meet the emission limit values. In the case of installations which areconsidered to have a high environmental risk, the period between two site visits must not exceedone year. In the case of installations posing the lowest risks the period must not exceed three years.
While the IED does not exclude diesel engines, it does not specify any emission limit values for thistype of generation. Emission limit values for diesel engines are expected to be established followingthe review of the best available techniques reference document (BREF).

17
Islands’ limited generation capacity and isolated system requires them to upgrade plant emissionstandards by modifying and upgrading parts of the installation on a rotating basis. This rotation is alengthy process but essential to guarantee continuity of service. Undue acceleration of this processraises the distinct possibility of power outages, with the consequent socio-economic disruption.
To comply with the IED, small isolated energy system operators could consider a number of optionsand decide based on a detailed cost-benefit analysis:
Option 1: Upgrading the existing generating plant to meet the emission limit values
Upgrading the existing generating plant (including the procurement of low sulphur fuel) in order tomeet the IED emission limit values (ELVs). The attractiveness of this option would depend on theplant’s remaining economic lifetime.
Option 2: Placing the plant as reserve plant
Placing the plant as reserve plant (i.e. operating no more than 1,500 hours per year on a rolling five-year average) and upgrading the plant to meet the associated less stringent ELVs.
Option 3: Opting for the limited life-time derogation
Opting for the limited life-time derogation of 18,000hrs starting from 1 January 2020 and ending notlater than 31 December 2023, as specified in Article 33.
Option 4: Retaining some of the existing plant for emergency use
Making use of the possibility to retain some of the existing plant for emergency use, i.e. operatingless than 500 hours per year. In this case they would not be covered by the IED emission limits.
In parallel to the IED, the UNECE (United Nations Economic Commission for Europe) GothenburgProtocol already specifies emission limit values for NOx from diesel engines. However it does notdefine any emission limits for SOx and dust. The protocol has recently been amended to includeupdated national emission reduction commitments for main air pollutants to be achieved in 2020and beyond.10 Nonetheless, the previously specified emission limit values (ELV) have hindered theprotocol’s ratification by several countries who consider them to go beyond what can be achievedthrough the use of ‘Best Available Technology’ (BAT).11
It is important to ensure the emission levels in the proposed revision of the Gothenburg Protocoland subsequently the development of the BREF are reasonably feasible to implement and notdisproportionately expensive. Small island electricity generators depend on the operational flexibilityand efficiency of diesel engines to meet varying load demands. However the operation of emissionabatement technologies is more problematic; especially with regard to damaged or poisonedcatalysts and reagent supply issues for selective catalytic reduction (SCR). A diesel engine equippedwith a SCR but with frequent load variation would not achieve the required emission limits. The safedisposal of poisoned catalysts and reagents is also extremely difficult for smaller islands.
10 At time of printing, the updated information relating to stationary diesel engines had not been published. For moreinformation see Eurelectric’s Recommendations for the revision of the Gothenburg protocol (2011)
11 http://www.euromot.org/download/c1678d6b-c77f-49d9-bd52-d190479342e8/UNECE%20CLRTAP%202005%2005.pdf
18
Options foreseen in the review of the Gothenburg Protocol
The EGTEI (Expert Group on Techno-Economic Issues) have prepared technical annexes as suggestedtext to the revised Gothenburg Protocol. These annexes specify emission limit values for SOx, NOx
and dust for various technologies. In the case of diesel engines only NOx emission limits have beenproposed. The suggested draft proposes several options (ELV1, ELV2 and ELV3):
ELV 1 - A demanding, but technically feasible option that only focuses on the reduction of onepollutant, NOx. The plant will need to meet the lowest achievable emission rate or highest level ofNOx reduction. ELV 1 places high demands on the existing infrastructure and does not take intoaccount the cost of implementing the BAT. It requires high-quality fuels, the use of an SCR with highefficiency and is designed for use in areas with poor air quality.
ELV 2 - Also technically demanding but pays attention to the costs of measures needed to achievereductions. It is applied in polluted industrialised and urban areas with a good existinginfrastructure. This would also require the use of an SCR with moderate efficiency.
ELV 3 (upper level) - The preferred option for areas with poor or restricted infrastructures such ascountries in economic transition, islands and isolated regions. It is designed to be applied in areaswith good air quality. Represents good practices based on the legislation of a number of parties,more details of which can be found in a Euromot report published in 2009.12
Regulation & market design
Market design is at the heart of the transition to the low-carbon energy system. Each market has itsown unique characteristics – there is no universal model which is suitable for all circumstances. Suchmarket models must factor in important physical and technical elements such as market size andnetwork density. Yet the model applied to large markets may not fit isolated or small systems,justifying derogations on a case by case basis. The EU’s 3rd Electricity Directive13 has alreadyrecognised this: it provides derogations for market opening, third party access to the network andsystem operator unbundling to small and isolated systems/states, generally on the basis of (a) smallsystem size, (b) isolation and (c) that achieving effective competition would be impossible orimpractical.
Typically, islands are already burdened with additional costs stemming from their insularity. Thesenegatively affect the cost of electricity by burdening the tariff with increased fuel and operatingcosts. Indeed, the challenge is very different from one part of the electricity system to the other. Forexample smart grid deployment could actually be easier in smaller systems than in bigger ones whilethe development of less mature power generation technologies like wind and photovoltaic might bemore difficult. Island energy systems are generally characterised by very few independent powerproducers and are dominated by small generation units. They usually adopt a large generation
12 Euromot is the European association of internal combustion engine manufacturers.http://www.euromot.org/download/afa82be6-f3f0-44bd-974b-1e8f0d424f6f/UNECE%20Gothenburg%20euromot%20position%202010-02-17%20revised%20incl.%20executive%20summary.pdf
13 2009/72/EC

19
margin to support system reliability, have few economies of scale and experience a wide variation inload throughout the day and seasonally.
EURELECTRIC, which favours market-based mechanisms and is committed to a carbon-neutral powersupply by 2050, acknowledges the limited markets or even market failures on islands and the needfor complementary measures and remedies. We recommend a proportionate use of exemptions toaddress the obvious market failures (size, isolation). Islands are often subject to exemptions, whichcertainly represents the easiest way to turn a blind eye to the ‘too small a market failure issue’.EURELECTRIC believes that exemptions should be granted as part of the move towards a sustainableenergy system, not instead of this move. They should be approved on a case-by-case basis.
Security of supply and system stability
Electricity companies in Europe are striving to ensure a cost-efficient, secure and reliable delivery ofenvironmentally friendly electricity to customers. This is also the case for islands, despite the moredifficult operational constraints and the lack of interconnection. A faulty network cable can causeextensive outages in a small network which would not be seen on a larger interconnected gridsystem, as high fault currents trip adjacent circuits. Security of electricity supplies is a very importantissue for island communities to protect their fragile economies and encourage investment in newand existing businesses. The relevance of this topic is also reflected in its recurrence during politicalelections in island communities.
In order to counteract systemic risks most islands operate with generation margins of around 30-40% compared to 15-20% in mainland highly interconnected grid systems. This high level ofgeneration reserve causes extra costs but improves the reliability of electricity supplies.
For island energy operators, one of the main challenges is to achieve the switch to anenvironmentally sustainable energy production while ensuring a reliable, safe and economicallyviable production of electricity. Much like big, interconnected European power systems, islands arestruggling to find ways to integrate variable renewables (RES) into their power systems and areincreasingly looking into the feasibility of interconnectors or power storage systems to make thetransition happen. RES, a set of at least ten technologies, have different technology-specificchallenges. While they will constitute a key element of islands’ energy transition, the variability ofsome RES technologies – above all wind and solar power – lead to new system stability threats andthe need for balancing. Islands experience even more challenges in their move towards a higherintegration of RES than the European continent since they cannot depend on the ‘smoothing out’effect of a large balancing area.
20
Snapshot: Renewables in the EU
The European electricity sector is and will remain a major investor in RES in the coming decade.
RES covers a variety of more than ten different technologies with different characteristics – somevariable, others not – and all on different tracks to grid parity. The take-off of technologies such aswind and solar will transform Europe's energy system, networks and markets. It represents a keyinvestment opportunity for the power sector but will also pose unique challenges to the energysystem.
EU electricity markets and utilities are experiencing fundamental change as a result of the EU’spolicy goals, especially the targets for 20% greenhouse gas reduction and 20% renewable energy by2020. Fostered by national government support programmes and by EU legislation, new REStechnologies have increasingly been deployed since the early Nineties. In the same period, electricitygenerated from renewables has continued to grow, reaching about 597.6 TWh in 2009.14
Society places a high value on reliable and affordable supplies of electricity. It is important that theincrease in RES production, particularly from variable and non-dispatchable sources, is achievedwithout adverse effects on security of supply and at reasonable cost. The power system as a wholemust therefore adapt to these changing conditions.15
Renewables will represent a significantly increasing share of generation technologies in theelectricity mix, more than doubling over the next ten years. The 2009 Renewables Directive sets a20% target for RES in total energy consumption by 2020, rising from a 2005 level of around 8%. Thetarget is calculated as a percentage of total final energy consumption, including all energy use –electricity, heating & cooling and transport. Depending on the scenario, the overall 20% target willrequire RES to deliver almost 35% in electricity.
The increasing capital, competence and market knowledge required to succeed in technologiesgenerating electricity from renewables have also strengthened the role of the electricity industry,which has become the key industrial driver in this development. EURELECTRIC members have beeninvesting significantly in such technology and integration over the last ten years: according to theEURELECTRIC Power Statistics 2011 renewable energy is the largest area for investment in terms ofcapacity. In 2010 alone, EURELECTRIC members invested in an additional 10.2 GW of wind and 5.8GW of photovoltaic.16 The electricity industry represented by EURELECTRIC is not only investing inthe most mature RES technologies, such as onshore wind. They are also the leading industrialinvestors in offshore wind projects, which are very capital-intensive and technically challenging.Today’s major projects of offshore wind development include Greater Gabbard, London Array andDogger Bank.
14 Source: EURELECTRIC Power Statistics 201015 See EURELECTRIC’s Renewables Action Plan, October 201116 Source: EURELECTRIC Power Statistics 2010

21
There are seven points which suggest that the variability related to some RES technologies poses amore significant challenge to an isolated island system than to a larger grid:
Relative plant capacity: commercial scale RES installations will represent a considerably largerproportion of total installed capacity or customer demand on an island system. For example, theThanet offshore wind farm in the UK (heralded at inception as the world’s largest offshore windproject) at 300MW capacity represents just 0.3% of UK installed generating capacity and comprises100 turbines. By contrast, a single 3MW wind turbine connected to a 100MW island power systemalready represents 3% of capacity.
Diversity considerations: weather diversity over a large area can help to balance variability, ifinterconnection capacity is sufficient. On islands this is not possible.
System capacity margins: the combination of variability, relative plant capacity and lack ofgeographical diversity means that an island power system will need sufficient back-up plant to covervariations in output from any of the variable renewable sources. Current capacity factors for variableRES range from ca. 19% for onshore wind inland (1,700h/a) to 24% for onshore wind at the coast(2,100h/a). Depending on location solar PV capacity factors range from ca. 11% (950h/a) in centralEurope to 20% (1,750h/a) in southern countries like Spain.17
Conventional and back-up plants: back-up plant will need to be sufficiently responsive to meetvariable demand cycles and will need to operate at a relatively low load factor with more RES in themix. This presents technical challenges for the selection of back-up plant and also affects thepurchase, operation and maintenance costs of suitable plant operating at low load factor only.
Storage: next to sufficient back-up capacity, centralised and decentralised storage solutions andpotential interconnections are key enabling technologies for island systems aiming for high REStargets. This will be addressed in more detail in Chapter III.
Frequency and voltage regulation: variable RES sources may be easily absorbed into large-scalepower systems, especially at modest penetration rates. However, integration issues will be morepredominant in a small-scale system; therefore frequency will be of greater concern.
Emissions: operating conventional thermal plant at low load factor or frequent start/stop operatingconditions will inevitably reduce the efficiency of that plant and increase the ‘per MWh emissions’.While the net contribution from RES to emissions reduction will still be positive, it may not beimmediately as great as expected.
Of course, this does not mean that RES has no part to play in an island system. To the contrary,island systems actually offer an excellent opportunity to examine all of these factors in a detailedand controlled manner. Such investigations may subsequently provide valuable guidance towardsdeeper penetration of RES in island systems and on the mainland. However, it should be recognisedthat the island utility might incur greater costs and technical difficulties.
The variability of wind and solar introduces extra costs within the supply network. The experience ofisland communities operating such sophisticated system stability and network management systemsis of direct relevance to mainland communities who operate power zones with high levels ofembedded generation. Island communities also need to invest in very quick protection andclearance of faults on the network, to prevent cascade tripping of large areas of the network. Such
17 Source: Siemens, 2012
22
devices require reasonable investment in order to achieve security of the network under faultconditions.
Oil imports and price volatility
Heavy fuel oil is the dominant source of oil used by island communities for diesel generation. Gas oilis often of secondary importance, to either assist with the start-up and closing down of diesel enginegenerators or for use in fast-start simple cycle gas turbines for emergency supplies.18 The highvolatility of the oil price has thus become a major cause of concern, causing operators to oftenimplement protective measures such as oil and currency hedging. Due to a lack of space, islandsoften cannot store large quantities of fuel, denying them options to buy more selectively.
Island communities are dependent on the lengthy and often costly supply chain associated with oilimport on a small scale. The lack of good port facilities in many of the smaller islands is equallychallenging, requiring the use of small bespoke ships which are expensive to use and service.
The choice to use heavy fuel oil (HFO) instead of gas oil has been driven by its lower cost. However,improved cracking of crude oil into lighter more valuable products has decreased the availability ofHFO, leading to higher HFO prices. The HFO price has also increased because of EU requirements toconsiderably reduce its sulphur content. As a result, the cost of producing electricity in islands andisolated communities has increased. The EU requirement to use ultra-low sulphur HFO has made itmore difficult to source such fuel for most islands, which have traditionally used the same source asthe marine industry – which has yet to adopt this ultra-low sulphur specification for HFO. Withavailability of the desired resources remaining limited, island operators are increasingly forced toimport fuel from more distant locations, a situation which undermines the ecological purpose ofusing cleaner fuel.
The problems of the supply chain also extend to the shipping, which now has to comply with stricterregulations to prevent pollution. These tighter regulations have seen many older vessels withdrawnfrom service, producing a higher demand on the remaining ships, thereby further increasing costs.All of these issues place more difficulties on managing the generation business in islandcommunities, but they also encourage innovative solutions to producing energy from sources otherthan oil and improving the efficiency of any oil that is used.
In sum, island communities have to pay a premium price for heavy fuel oil (and gas oil) and arestruggling to find suitable ultra-low sulphur sources from nearby refineries and suppliers.
Heavy fuel oil shortages
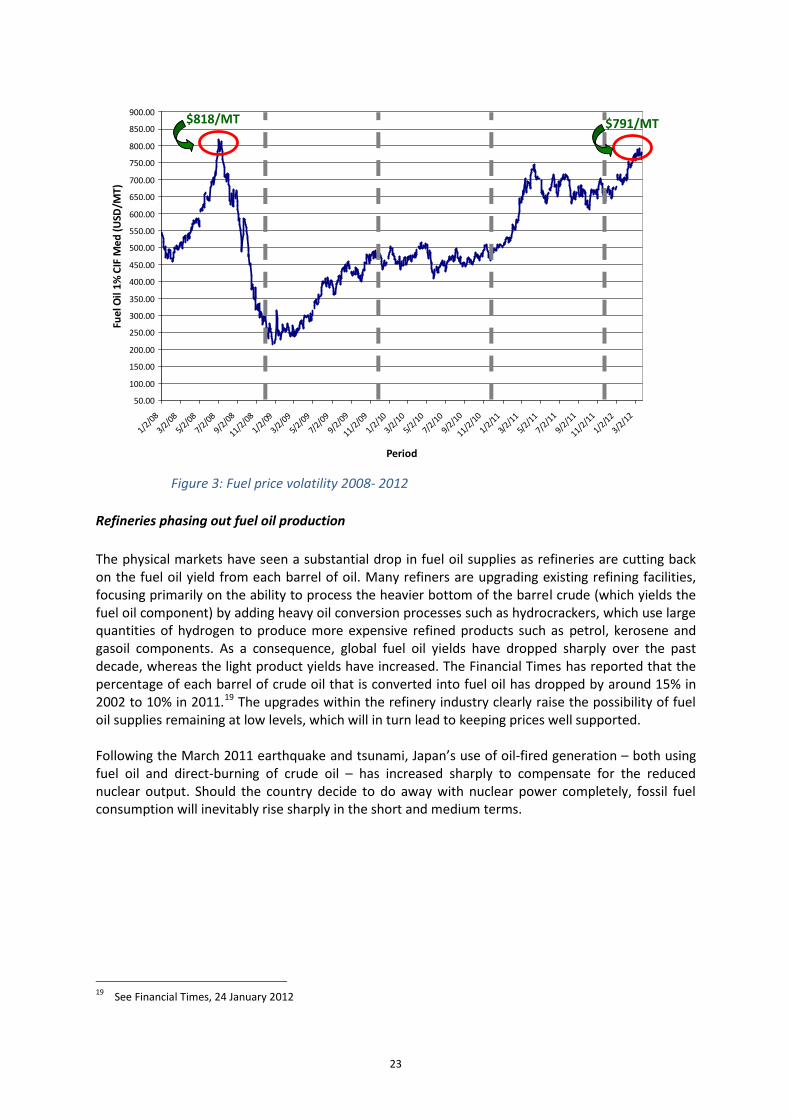
The price of heavy fuel oil is rising steadily, with huge volatility (see Figure 3). The increased pressurein fuel oil prices is explained by a combination of low supplies (as refineries are shifting outputtowards petrol and diesel) and increased demand for low-sulphur fuel oil for electricity generation inJapan. The price rise and volatility are expected to continue, thus exposing islands with a majorshare of diesel power generation to high fuel costs.
18 Note that in very small islands the more expensive gas oil is often the only fuel available for generation.
23
Figure 3: Fuel price volatility 2008- 2012
Refineries phasing out fuel oil production
The physical markets have seen a substantial drop in fuel oil supplies as refineries are cutting backon the fuel oil yield from each barrel of oil. Many refiners are upgrading existing refining facilities,focusing primarily on the ability to process the heavier bottom of the barrel crude (which yields thefuel oil component) by adding heavy oil conversion processes such as hydrocrackers, which use largequantities of hydrogen to produce more expensive refined products such as petrol, kerosene andgasoil components. As a consequence, global fuel oil yields have dropped sharply over the pastdecade, whereas the light product yields have increased. The Financial Times has reported that thepercentage of each barrel of crude oil that is converted into fuel oil has dropped by around 15% in2002 to 10% in 2011.19 The upgrades within the refinery industry clearly raise the possibility of fueloil supplies remaining at low levels, which will in turn lead to keeping prices well supported.
Following the March 2011 earthquake and tsunami, Japan’s use of oil-fired generation – both usingfuel oil and direct-burning of crude oil – has increased sharply to compensate for the reducednuclear output. Should the country decide to do away with nuclear power completely, fossil fuelconsumption will inevitably rise sharply in the short and medium terms.
19 See Financial Times, 24 January 2012
50.00
100.00
150.00
200.00
250.00
300.00
350.00
400.00
450.00
500.00
550.00
600.00
650.00
700.00
750.00
800.00
850.00
900.00
1/2/08
3/2/085/2
/087/2
/089/2/08
11/2/081/2/09
3/2/095/2
/097/2
/099/2/09
11/2/091/2/10
3/2/105/2
/107/2
/109/2/10
11/2/101/2/11
3/2/11
5/2/11
7/2/11
9/2/11
11/2/111/2/12
3/2/12
Period
Fuel
Oil
1% C
IF M
ed (U
SD/M
T)$818/MT $791/MT

24
Countering price exposure: Enemalta Price Hedging
Oil HedgesRather than adopting zero-cost collar structures, from 2010 onwards Enemalta has hedged its fuelexposure using a swap structure, locking in its price.
Description of a Swap InstrumentA fixed price swap allows Enemalta to lock-in a fixed purchasing price over a certain period. The fixedprice of the swap protects Enemalta against the underlying price increases. On the other hand,Enemalta does not benefit from potential underlying price decreases.
Figure 4: Swap Structure
Why Swaps?This swap structure adopted for Brent hedges has provided an element of stability in devisingEnemalta’s tariff model. By locking-in prices through swaps, Enemalta also gains greater control overits variable fuel costs. As opposed to collars, Enemalta also achieves complete price protection fromany increase in crude oil prices.
FOREX HedgesEnemalta mitigates the risk related to its exposure on the dollar requirements by using flexibleforward contracts: a deal to exchange euros for dollars at an agreed date in the future, at anexchange rate agreed today (forward rate).
Cost matters more on islands...
While islands face the same challenges as the mainland, albeit on a smaller scale, they usually do nothave the option of energy imports and export. This places a significantly higher burden on the localisland systems. Solutions are more expensive, while island economies are more fragile. A commonconcern among island utilities is the financial burden stemming from high and sometimes peakingprices of oil, the main fuel for power generation on most islands. Price speculations are oftenunreliable, which decreases island operators’ financial flexibility in implementing more sustainablesolutions.

25
RES financing obstacles for EU islands
For EU islands, finding financial support can become quite complicated. Their support schemes forenergy installations are often aligned with the mainland system, without taking islands’ cost-specifics into account. This situation has led island operators to seek additional support and anaccumulation of grants from specific national financing schemes, which are often seen as “too stateaid intensive” – and therefore forbidden by the European Commission.
A possible solution would be to take the real power price on islands as a reference to calculate theintensity of state aid, an aspect which should be given consideration during the revision of theCommission’s state aid guidelines for environmental protection. Financial criteria (and risk/returnbalance) for innovative projects should therefore reflect the specific situation of islands and thehigher weighted average cost of capital island projects usually imply.

26
III. Best practices and options ahead
European islands are at the crossroads of modernising their power generation infrastructure to meetthe challenges and targets of the next decade and beyond. Meeting rising demand with moresustainable energy in the mix and better management of the system in an uncertain legislative andfinancial environment will be the crucial challenge for island system managers.
There are some common features to the energy transition that islands are experiencing, with allislands tapping into a basket of diversified energy solutions (Section A). Almost all islands plan todecrease power generation from diesel engines and/or fuel oil. One trend is the plan to shift from oilto locally produced or imported gas, which is expected to become viable due to low LNG prices. Inthis scenario, gas-to-power will also take on the role of backing up renewable energy sources as aflexible generation technology. A common alternative is the trend to modernise and decrease oil-to-power generation and use its flexibility to back up intermittent RES in combination with energystorage. This strategy also includes the installation of enhanced abatement technologies so that thefossil fuel generation meets national or European emissions targets. A third strategy is the increasingreliance on interconnectors, which offers a solution to security of supply and intermittencychallenges, albeit with a high price tag. Many islands are also on their way to testing andimplementing demand side management systems such as smart meters to increase efficiency andprepare for future implementation of smart grids. However, every island will find its own way, asillustrated by the examples of benchmark projects in Section B.
A. Key principles & trends
Figure 5: The Energy transition on islands will be achieved through a basket of solutions
Islands moving towards low-carbon generation led by RES
Our analysis of islands shows a clear tendency towards the installation of renewable energy sourcesover the last years. RES capacities on the vast majority of islands are growing, with wind powerbeing the preferred choice. Onshore wind make up the lion’s share of installed and planned REScapacity, followed by hydro and, depending on the region, geothermal or solar energy. Larger islandshave set the scene for offshore wind farms. Overall, the total energy generated from renewablesources among questionnaire participants increased by 16% over the last five years.20
20 See Annex for tables with generation per technology
RES Oil to gas
InterconnectorsSmart Grids/DSM Energy Efficiency
Storage Flexible generation
27
Although diesel generation is set to remain the predominant technology for most participating islandutilities, its share in electricity generation is projected to fall significantly from currently about 76%to about 31% in 2020.21 The strategies for replacing diesel differ, depending on size and location.Beyond RES, two solutions predominate: the switch to gas and interconnection, where feasible.Diesel is considered by many as an important back-up fuel for balancing variable renewables, whichare still to be set up. While the overall role of oil is decreasing, several islands are in the process ofplanning or constructing new diesel-fuelled generation units to either increase overall generationcapacity or to replace ageing plants with more fuel-efficient and less polluting capacities.
As a result of this trend towards low-carbon technologies (more RES capacities, increasing efficiency,use of abatement technologies) emission levels have been decreasing: from 2007 to 2011, CO2
emissions fell by an average of 10%. Over the same period, NOx emissions decreased by an averageof 13%, mainly due to the installation of NOx abatement installations at many power plants.
Interconnections – an alternative to local power generation?
Another noteworthy observation is the trend for larger islands or islands close to the mainland toinstall connections to the mainland. Such a connection not only increases security of supply, but italso allows the import of low-carbon electricity which can be used for example to back up local,intermittent renewable capacities.
Interconnection between the isolated island system and the mainland through high voltage AC or DCsubsea cables entails manifold benefits for both sides: interconnections increase security of supply;the power mix can be decarbonised more easily and more cost-efficiently; flexibility for variablerenewable sources is available without the need to set up new power plants; it provides analternative to missing or costly storage; and islands can take advantage from trading in bothdirections. Depending on the price levels on both sides, islands might find import more attractivethan domestic generation. Or, as witnessed in winter 2011, island utilities might export electricity tobenefit from high electricity prices on the mainland.
The numerous advantages of interconnectors to larger mainland systems have led a number ofislands to either increase their connection capacities, such as the British Channel Islands, or todecide to build first connectors, even across larger distances. Prominent examples for thisdevelopment are Malta and Cyprus. The Maltese decided to construct a 120km (95 km of which aresubsea) 200MW HVAC submarine interconnector to Sicily, which is to be operational by end 2013 atan estimated cost of around €200 million. In early 2012, the Electricity Authority of Cyprus signed amemorandum of cooperation with a local utility to enable the construction of a subsea powerconnection with Israel and Greece via the island of Crete. After a feasibility study, the link could befinished in 2016, connecting the island to both European and Israeli mainland. The nearly 1,000kmlong connection is estimated to cost €1.5 billion. The investment costs for interconnector projectsrepresent a major obstacle for most islands to realistically consider their implementation. Dependingon the geography of the individual landscape, even interconnectors between islands in a group suchas the Azores may be too costly to be considered feasible (e.g. due to extreme depths betweenislands).
21 This sharp reduction is in particular due to plans from Cyprus and the Canary Islands to switch fuel for powergeneration almost completely from diesel to gas/LNG by 2020. See the Annex for further details

28
Oil to gas switching
Several larger islands or island groups, such as Cyprus or the Canary Islands are planning to almostcompletely switch the fuel used for their power production from oil to gas/LNG by 2020. Liquefiedgas in particular has been investigated as an alternative fuel for the future. LNG is natural gas thathas been cooled down until it becomes liquid. Natural gas liquefies at about -163°C, where it takesup only about 1/600 of the space of the gas itself. It is therefore a space-saving method oftransporting natural gas. When allowed to warm, the gas evaporates and returns to its normal stateof gaseous fuel, whereupon it can be used to generate power. It consists mainly of methane (CH4)which potentially is a very attractive fuel for power generation. Methane has the lowest carbon ratioof all fossil fuels – only 75% carbon by weight. By comparison, heavy fuel oil is about 87% carbon.
Natural gas can be used as a fuel for a range of plants, including both gas turbines (simple andcombined cycle) or reciprocating combustion engines. Both types of plant are already widely usedfor island power generation. The reciprocating engine in particular represents an interestingopportunity for gas generation for a range of reasons:
Similar engines have been widely used by island power utilities; the technology is largelywell-known and understood;
Reciprocating engines offer the flexibility, economy and efficiency that have made them themainstay of island systems;
They are highly efficient – even in ‘simple cycle’ configuration they can operate at thermalefficiencies rivalling CCGT plant, especially in load following or intermittent operating cycles.
Using natural gas as a fuel for power generation offers considerable emissions benefits over‘traditional’ liquid fuels such as diesel or heavy fuel oil. Typically CO2 emissions can be reduced by upto 25%, NOx by up to 85%, whilst SOx and particulate emissions are virtually zero for natural gas.22Natural gas represents a straightforward option to meet increasingly stringent emissions objectives,without the need for exhaust after-treatment such as scrubbers or selective catalytic reductiontechnologies. Figure 6 shows the emissions of different fuels used in the shipping industry for cargoships propelled by a reciprocating engine. These differences are indicative of the emissions benefitsoffered by LNG over distillate or low sulphur residual fuels.23
22 Source for engine emissions performance on natural gas: Wärtsilä Corporation23 Greener Shipping in the Baltic Sea, Det Norske Veritas, 2010

29
Figure 6: Emissions by fuel type
Natural gas is a ‘tried and tested’ fuel for both gas turbine and reciprocating engines. In some cases,existing plant could be converted to gas or dual-fuel operation. The main technical problems withuse of gas would be the requirement for new LNG storage tanks, unfamiliarity with the handling andusage of LNG, and issues associated with the very cold storage temperatures. At present there areno harmonised international standards for the operation of LNG bunkering or storage facilities.However these could be replaced by more extensive case-by-case risk analyses in the meantime.
LNG is widely available, with worldwide production increasing.24 LNG prices on international marketlong-term contracts are presently about half the price of crude oil when expressed in terms of priceper million BTU.25 For island utilities, this price advantage is currently eroded due to lowerconsumption, re-liquefaction and transportation issues. However LNG retains the potential toprovide an economic fuel for island utilities.
While LNG clearly represents an attractive fuel for island utilities, its major drawback is the lack ofsmaller scale liquefaction and transportation infrastructure that can deliver the required quantitiesto smaller island generators. A 100MW LNG-fuelled reciprocating engine plant would typically needabout 40,000m3 of LNG storage for a six week strategic stock.26 The majority of existing LNGtransportation comprises vessels of about 145,000m3 which would be too large to provide a routineservice to a smaller island utility operating a plant of this size. Until smaller LNG carriers becomemore widespread, the use of LNG among island utilities is likely to remain limited. Nonetheless,there does seem to be increasing interest is this area. If LNG becomes more widespread as a fuel forthe shipping industry, the emergence of a network of LNG terminals would be required to support it.This in turn may provide the basis of an LNG infrastructure to support island generators. At presenthowever, the very high costs of LNG re-liquefaction facilities as well as the difficulties in acquiringLNG in small quantities often bar the way for LNG as a real alternative to diesel generation,especially for smaller islands.
24 BP Statistical review of World Energy 2011, bp.com/statisticalreview25 Greener Shipping in the Baltic Sea, Det Norske Veritas, 201026 Source: Wärtsilä Corporation

30
Smart grids, demand side participation and energy efficiency
Smart grids and demand side participation
Smoothly integrating renewable energy sources (RES) into the electricity system will only be possibleif the system becomes much more flexible. This can be achieved by developing intelligent networks,so-called smart grids. Smart grids will also foster what we term demand-side-participation, whichwill in turn help make the electricity system fit for the future. Thanks to a smart infrastructure,customers will be increasingly able to manage and adjust their electricity consumption in responseto real-time information and changing price signals.
Each electricity network (including generation) is designed, built and operated to meet themaximum demand that the customers acting together request from the network. The system mustbe capable of meeting and exceeding this peak demand to allow for future growth. At the sametime, demand varies considerably during the day and seasonally. This variability leads to poorutilisation of the network: some networks operate at less than 30% of nominal capacity for most ofthe year. Nevertheless, the one day that demand peaks, the network must be able to service thatdemand or the network will fail, subjecting electricity customers to large-scale interruptions.
Any technique to reduce and shift demand to other times in the day is beneficial to asset utilisationand capital investment, which in turn can reduce tariffs. Managing the load curve and reducing thegrowth of system demand can therefore be useful for customers as well as utilities. In small islandcommunities with a good understanding of how individual customers contribute to overall demand,it is easier to manage this demand than to achieve large interconnected networks. The use of ‘timeof day’ tariffs with high prices during the network peak allows educated customers to manage thecost of their energy by reducing their peak energy consumption.
The principle of ‘time of day tariffs’ can be extended to dedicated circuits such as heating andcooling circuits. Such circuits can be managed by central control systems that turn off the circuits atsystem peak.27 Intelligent appliances such as fridges and freezers can also be turned off for briefperiods (or in the near future reduce or increase the power demand by directly managing thecontrols of the appliance) without affecting operation. If large electrical loads and the charging ofelectric vehicles are introduced into this type of intelligent system, a network operator cancontinually switch loads on and off to produce a flat load curve. This effectively removes systempeak, significantly increases asset utilisation and reduces capital expenditure.
This smart network monitoring and switching/controlling loads on a continuous basis is the futurevision of many electricity network designers. Demand side response is one of the answers inbalancing supply and demand. It is of vital importance for the electricity networks of the future andcan play an important role in optimising the energy use of all customers.
Energy efficiency options
The close interaction between island communities and government offers a society which can easilyadapt and adopt new technologies. Considerable opportunities exist in such communities toembrace technology and initiatives to improve energy efficiency and manage system demandgrowth. This may not necessarily mean a reduction in energy sales per capita, but customers switch
27 Sometimes also referred to as ‘off-peak’ tariffs

31
from lower efficiency energy systems to alternatives generated with higher efficiency. Additionally,customers are encouraged to use electricity at times which avoid system peak.
Since system peak drives capital investment in generation and the electricity supply network, energysales which avoid system peak can reduce capital investment. At the same time it also improvesasset utilisation and generation efficiency, since generators do not have to ‘cycle’ as hard to meet avolatile load curve. This often lowers emissions from power generation.
Several options can be used to improve energy efficiency and assist in system demand:
- Electrical appliancesThe improved design of electrical appliances can achieve significant savings in energy. Customerawareness campaigns and lobbying of retail business can be effective in island communities toensure only efficient electrical appliances are available for sale. The strict application of energyefficiency information on products can also assist customers in making the right choice.
- Heat pumpsHeat pump technology for heating and cooling now offers up to 5 to1 energy efficiency, giving rise toconsiderable savings compared to older cooling devices and traditional heating systems, while givingcustomers better value for money.
- Building regulationsIsland communities should embrace new building materials which make properties more energyefficient and ensure reduced energy needs per dwelling. Government agencies and the localfederation of building contractors should be consulted and encouraged to take such initiatives atevery opportunity. Many simple low-cost initiatives in this area could produce quick and easy resultswhile embracing traditional designs to provide shade in sunnier communities and retain heat innorthern communities.
- Solar thermal panelsEven in the northernmost community solar thermal panels can provide cheap and effective waterheating for many years. When coupled to a building energy management system, even more savingscan be achieved.
Interconnectors grow - slowly
The increasing difficulties and risk of shipping oil and the volatility in oil prices have led oil-dependent island communities to investigate the possibility of submarine cable interconnection withnearby mainland countries or other islands. Such interconnections are often the only alternative tothe high cost of renewable technology supported by energy storage or conventional dieselgeneration. LNG or compressed natural gas technology is not economically viable for small islandcommunities.
Benefits of submarine cable interconnection
Submarine cable interconnection allows island communities to access a competitive market forelectricity where scale and market forces have acted to reduce costs. Cable interconnection alsoimproves system stability and increases reliability. Interconnection between islands can poolgeneration assets and effectively provide a larger community within which to spread the fixed costsassociated with generation and supply.

32
The cost of cable interconnections can also be cheaper compared to that of conventional dieselgeneration. The capital cost per MW of a submarine cable can be less than the capital cost per MWof local power generation, although this obviously depends on the type of cable technology and therequired circuit length. Typically AC transmission becomes more difficult for a circuit length in excessof 50 kilometres from substation to substation. Beyond 100 kilometres, DC interconnection clearlybecomes the preferred technology. But with improvements and innovation in submarine cabletechnology, HVAC circuit lengths in excess of 100km can become economically viable, as exemplifiedby the interconnector between Malta and Sicily. These HVAC interconnectors have severaladvantages over HVDC cables, with perhaps the most important being the synchronous connectionand the overload capability which approaches 80% for one hour, thereby acting as a very economicalsource of shared spinning reserve.
Maintenance costs for submarine cable systems are very small compared to those of generation.However repair costs can be significant and insurance against such repairs is expensive.
Figure 7: Construction of power distribution networks, Jersey
The emission benefits from using cables which displace traditional diesel or oil-fired generation canbe significant. Any energy transported across an international boundary, under the Kyoto Protocol, israted at zero carbon emission. Even if this is not the case or applied to such energy exchanges,access to larger electricity markets does give the opportunity to buy low-carbon electricity on thatmarket at a significantly smaller premium to that of providing such facilities within the islandcommunity.
Disadvantages of interconnection
The environmental impact of cable interconnections is clearly considerably smaller than the impactof traditional diesel generation, but it is nevertheless important to complete a thoroughenvironmental impact assessment concentrating on marine life, sea bed effects and fishinginteraction. It is important to engage with interested parties early on in the project to ensure their
33
concerns and objections are properly dealt with and that actions are taken to minimise the effect ofsuch installations.
In order to provide reliability, at least two cables are required to give N-1 security – but the capitalcost of a second cable is often prohibitive. It is therefore common to install one cable only, the lossof which is supported by traditional generation stored in an operational ‘light condition’. Such lightstorage of the diesel generation incurs additional maintenance charges, but these are smallcompared to the investment required for an additional submarine cable.
In reviewing the advantages and disadvantages (provided the cost of a cable is less than that oftraditional diesel generation) across an investment period of 20 years or more, cableinterconnections clearly offer islands a method of participating in a larger energy market, which mayprovide access to cheaper electricity and improve reliability. However, some capital may be requiredto retain standby generation facilities in order to meet the security standard against a single cablecircuit. Expenses would also be incurred in monitoring the cable circuit against cable damage fromtrawlers or dragging anchors. Such issues would depend on the sea bed and the sea depth. In anycase care should be taken to ensure that the cable is properly installed and buried where possible.
A typical 100 MW AC installation across a distance of 50km would cost about €60 million. A 200MWAC installation with a circuit length of some 100km would be some €160 million. A DC alternativewould cost slightly more and require the installation of two AC/DC conversion stations. The Malta-Sicily connector (see Section B) gives some further indication of expected costs, althoughgeneralisations are difficult.
Storage
Storage as a key enabling technology for small & isolated systems
Finding an effective and economical way of storing power is one of the current major challenges forthe European power sector. A central concern for island operators is the fact that the power outputof many renewable energy sources is not as reliable and as easy to adjust to changing demand cyclesas the output from traditional power sources. This disadvantage could be overcome by storingexcess power produced when electricity generation is larger than the demand. Efficient storagecould also solve a number of other problems related to efficiency, balancing and security of supply.Especially for isolated systems like islands, storage therefore represents a key enabling technologythat addresses many of the challenges outlines in Chapter II.
Specifically, the right energy storage can fulfil several functions in an isolated power system:
Peak shaving (hours to weeks); Stabilising intermittent production (minutes to hours); Voltage and reactive energy control (minutes to hours); Frequency control (seconds); Quality of electricity (seconds); Continuity of service (seconds to hours).

34
Figure 8: Construction of the upper reservoir of the hydro storage plant, El Hierro(Canary Islands)
With the increasing penetration of RES in the island generation mix electricity storage will play twoimportant roles. First, it will be a source of efficiency, as it allows RES-electricity to be captured andstored for later use, thereby using resources which would otherwise be lost. Second, it can helpprovide the needed flexibility to counter intermittency issues and ensure system stability. Theinstallation of storage capacity will therefore allow operators to make full use of the RES potential intheir territory.
Research, development and deployment efforts are currently testing and enhancing a number ofdifferent storage technologies. In this case, islands’ small size works in their favour, as storagecapacities which might be too small to play a significant part in large power systems may take amore central role in an island system. Depending on the technology installed, some power storageoptions can help to rapidly respond to short peak power requirements while others offer thesolution to balancing annual fluctuations.
Next to power storage, operators are increasingly looking into storage for heating and cooling. Formany islands in warm climates, air conditioning systems are a major factor in power supply,especially during peak demand. A common method to minimise the impact of cooling devices onpeak power demand is ice storage, in which excess electricity during off-peak times is used togenerate large amounts of ice in special cooling facilities. This ice can then be used to chill thecoolant liquids of the air-conditioning system at peak times without the need for additional energy.

35
Storage options
Storage comes in different types and sizes. Pumped hydro and compressed air storage are dedicatedfor large energy amounts, while batteries are geared towards smaller projects of less than 100MW.The geological features of islands also influence their storage potential. While islands often lackspace for large installations such as pumped hydro storage, they can use their coastline to employtechnologies involving the storage of seawater. This centralised form of storage holds potential tostore large amounts of energy while saving space. Further, pumped sea water circumvents theproblem of limited fresh water supplies on islands which would be necessary for pumped hydrosystems. However, it requires large investments that are often not feasible for smaller islands.Additionally, this technology requires special adaption from conventional pumped storage as it usessalt water, which causes corrosion. Due to its direct connection to the ocean, special mechanisms forthe protection of marine life are essential as well.
The table below gives a short overview of storage technologies generally envisioned by islandoperators. This chapter’s Section B presents several different storage projects implemented by islandpower managers.
Electricity StorageTechnology Features28 Purpose
Batteries Batteries are best suited to reduce fluctuations through their fastresponse time, making them suitable for peak shaving and loadlevelling. They provide power at distribution substations for switchingcomponents and for substation communication and control equipmentwhen the grid is not energised. Lead acid batteries have the mainadvantage of low cost, relatively good efficiency and very highavailability in various application-specific products. However, they havequite low specific energy, a moderate lifetime, often include toxicmaterials, are temperature-sensitive and are globally outperformed bynewer technologies.
Newer technologies for batteries include the sodium sulphur battery(NaS). NaS batteries have a high energy density and are currently testedfor frequency regulation and spinning reserve. A NaS project ispresented in the case study chapter.
Decentralised
Short-term storage/ balancing
FlywheelFlywheel electric energy storage systems store mechanical energy in aspinning shaft, which is connected to a motor or generator. Duringtimes of low demand, excess power is used to revolve the flywheel. Inrevolving, the mass builds up inertial energy. This kinetic energy is thenreleased when the rotor is switched off, returning the kinetic energy tothe electrical motor, which is used as a generator.
Flywheels are able to deliver high power at a rather small capacity.Their main application lies in the time range of a few seconds up to aminute. A flywheel project is presented in the case study chapter.
Decentralised
Ultra-fast voltageregulation
28 See EURELECTRIC position paper: Decentralised Storage: Impact on future distribution grids (2012); as well asHadjipaschalis, Poullikkas & Efthimiou: Overview of current and future energy storage technologies for electric powerapplications (2011)

36
Electricity StorageTechnology Features28 Purpose
Pumped Hydro /Marine Hydro
Pumped storage hydropower stores electricity by pumping a largevolume of water from a lower reservoir to a higher one in times ofexcess supply. When needed, the water is then released to flow backdown through a hydro turbine, which generates power. Along withenergy management, pumped storage systems help control electricalnetwork frequency and provide reserve generation. Pumped storageplants, like other hydroelectric plants, can respond to load changeswithin seconds.
Islands with a favourable coastline may also use pumped seawaterstorage, where the ocean acts as the lower reservoir. This technologydemands special attention in dealing with salt water and the protectionof marine life.
Centralised
Fast response orlong-term storageof medium tolarge powerquantities
B. Benchmarks: Best practice
Following the general overview above, this section provides concrete examples of islands’ movestowards more sustainable energy systems. The projects have all been realised by EURELECTRIC NEISmembers or their partners and are presented including strategy and costs.29
Renewable energy projects
Close offshore & floating wind park on Malta
Offshore wind often offers strong and relatively constant wind speeds for power generation.Unfortunately, many remote islands face a challenge for offshore wind, in that water depth quicklyincreases relatively close to the coast. The Maltese have investigated solutions to overcome suchchallenges.
In 2009 the Maltese government initiated the development of a close-to-shore offshore 95MW windfarm, about 1.5 km off the coast. The project is set to contribute to achieving the national renewableenergy share of 10% in gross final energy consumption for Malta according to Directive 2009/28/EC.Based on wind speed calculations, the wind farm would generate around 200GWh in one year. It isplanned to be operational in 2016. Initial capital investment cost is estimated to be in the regionbetween €280 and €335 million, financed through IPP.
To overcome the problem of great water depths, another project envisions the creation of a floatingwind farm. In 2011 Hexicon Malta submitted a proposal for a floating offshore wind farm to thenorth-northeast of Malta. The water depth in this location is approximately 130m. Such a platform isinnovative both in its design and construction; supposedly no other floating platform is capable ofsupporting as many turbines. Furthermore the entire construction will be capable of rotating,exploiting the best possible angle for wind speeds and directions. The proposed platform is built in ahexagonal shape with a total capacity of 54 MW. It is estimated to cost €200-250 million. The projectwill be financed through IPP, and is planned to be operational in 2014. (See Figure 9)
29 For more information on each project please contact the EURELECTRIC Secretariat.
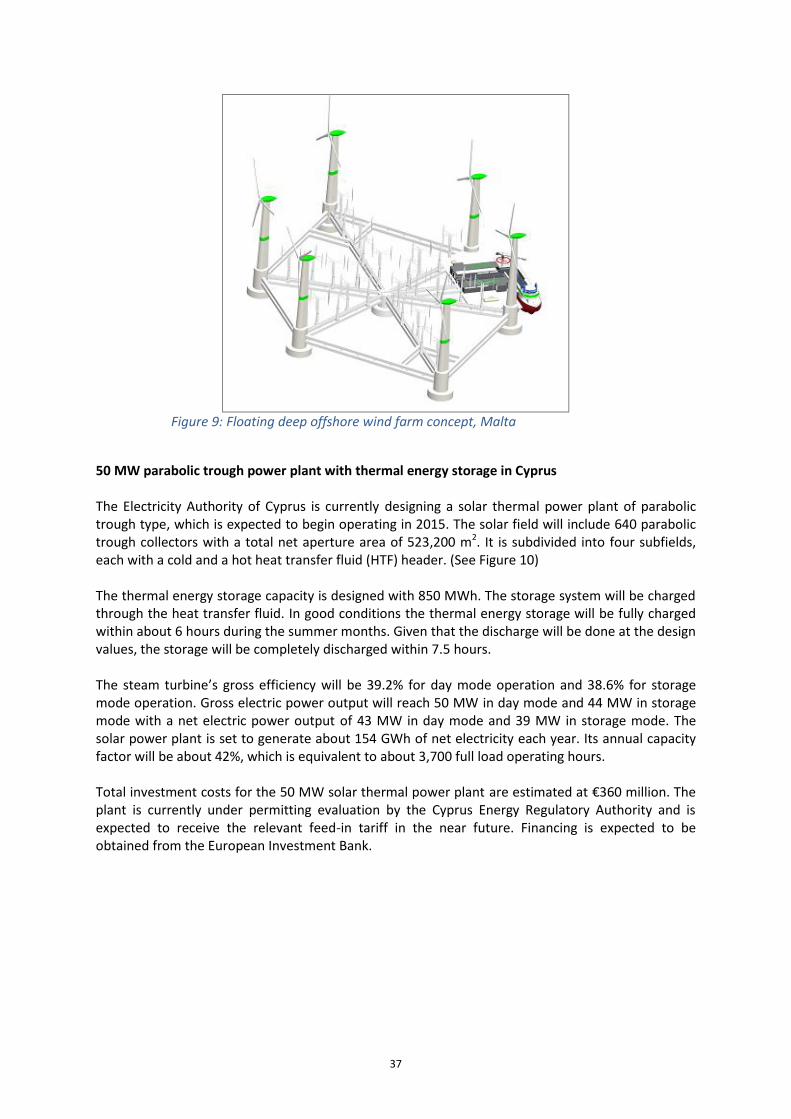
37
Figure 9: Floating deep offshore wind farm concept, Malta
50 MW parabolic trough power plant with thermal energy storage in Cyprus
The Electricity Authority of Cyprus is currently designing a solar thermal power plant of parabolictrough type, which is expected to begin operating in 2015. The solar field will include 640 parabolictrough collectors with a total net aperture area of 523,200 m2. It is subdivided into four subfields,each with a cold and a hot heat transfer fluid (HTF) header. (See Figure 10)
The thermal energy storage capacity is designed with 850 MWh. The storage system will be chargedthrough the heat transfer fluid. In good conditions the thermal energy storage will be fully chargedwithin about 6 hours during the summer months. Given that the discharge will be done at the designvalues, the storage will be completely discharged within 7.5 hours.
The steam turbine’s gross efficiency will be 39.2% for day mode operation and 38.6% for storagemode operation. Gross electric power output will reach 50 MW in day mode and 44 MW in storagemode with a net electric power output of 43 MW in day mode and 39 MW in storage mode. Thesolar power plant is set to generate about 154 GWh of net electricity each year. Its annual capacityfactor will be about 42%, which is equivalent to about 3,700 full load operating hours.
Total investment costs for the 50 MW solar thermal power plant are estimated at €360 million. Theplant is currently under permitting evaluation by the Cyprus Energy Regulatory Authority and isexpected to receive the relevant feed-in tariff in the near future. Financing is expected to beobtained from the European Investment Bank.

38
Figure 10: Parabolic mirrors of the solar thermal power plant, Cyprus
Geothermal energy in the Azores
Over a period of more than 35 years, geothermal power has become the most important renewableenergy source in the Azores, consistently representing about 20% of the nine islands’ electricalgeneration in recent years. Through the increased utilisation of geothermal power generation, theisland group has additionally managed to take a large step towards energy self-sufficiency. Theenergy source is known for its reliability, which has enabled power operators to use it for base loadgeneration, providing at times up to 56% of the power produced on the group’s largest and mostpopulous island São Miguel. In 2011, the production from the geothermal plants was 186 GWh,representing approximately 42% of the total energy produced on the island of São Miguel, and 22%of the total for the Azores Archipelago.
After the completion of first geothermal projects as early as the 1970s, geothermal powergeneration has continuously been expanded from small 500kW pilot projects to an installed capacityof 23MW from two plants in 2011. More potential capacity is being explored. Both power plants usethe binary cycle, in which heat from geothermal fluid is used to heat and vaporise a working fluidwhich powers a turbine and condenses, to be re-heated and re-vaporised.
Considering the capacity presently installed on São Miguel and the anticipated development of theproject on other islands of the group, geothermal energy is expected to account for close to 30% ofpower generation in the Azores in the near future. The role of geothermal power generation isexpected to become even more significant in the Azorean electricity market, supporting the islandgroup’s contribution towards the achievement of the European renewable energy objectives.
Wind farm on the Faroe Islands
Onshore wind on the north European Faroe Islands enjoys very good potential. The small islandgroup has a current installed wind capacity of 4MW, which produces up to 25% of the islands’ powerproduction at night. With 15 GWh of electricity production per year, the existing wind turbines makeup 5% of the Faroe’s total power production. Building on this, plans are being developed to expand
6504P02 - FINAL Detailed Feasibility Cyprus - Rev04
30 May 2011
Electricity Authority of Cyprus
Final Detailed Feasibility Study for the Installation of a
50 MW Parabolic Trough Power Plant with
Thermal Energy Storage at Akrotiri of Limassol

39
the wind capacity by an additional 12 MW and to install storage capacity of about 4MW, whichthrough latest control technologies could make up for intermittency issues. The new wind farm isscheduled to be connected by 2015 and is set to generate an additional 47GWh of green power perannum. Based on present oil prices the investment for the €19 million project has a payback time ofabout three to four years. (See Figure 11)
Figure 11: Wind farm, Faroe Islands
Sea water air conditioning for the north of Réunion Island
In 2010, the northern Saint Denis and Sainte Marie communities on Réunion Island set up anintercommunity to design, finance, develop and operate a cold production and district coolingnetwork using deep seawater and “SWAC” (sea water air conditioning) technology. This network isintended to provide buildings in both communities with air conditioning. The infrastructure, whichincludes offshore and distribution networks as well as a pumping station, has been designed todeliver 40 MW, to be generated from seawater pumped up from great depths.
In the process, cold water will be taken from depths of more than 1,000m below the ocean’s surface,6 km off the coast. Circulating pumps will transfer the cold water to each client site’s deliverysubstation, which is made up of one or several exchangers (seawater/freshwater). In addition toserving as a cooling installation, the infrastructure might be used by other sectors. The physical-chemical qualities of pure water extracted from great depths offer a wide field of new developmentopportunities for various applications mainly related to fish farming and aquaculture.
The cost of carrying out the studies and then building the SWAC is estimated at around €135 million.This will be covered by regional, national and European subsidies, in addition to the contributionfrom the successful bidder. The general economic structure of the public service delegation contractis based on income generated by sales of air conditioning to clients and on energy performancecompensation. By utilising the SWAC system, its users can reduce the amount of energy used bystand-alone cold production facilities by more than 80%.

40
100% RES island El Hierro, Canary Islands
The government of the island El Hierro, in cooperation with the local utility and the TechnicalInstitute of the Canary Islands, has embarked on a project that will allow it to meet El Hierro’selectricity demand entirely by RES. This target is set to be achieved through a variety of measures,including a mixed system of electricity production. Main features are a wind farm with ahydroelectric power station (also used for the production of desalinated water for irrigation), theproduction of biogas from waste, RES installation in the residential sector and the introduction of analternative transport system. In spring 2012 the project is in its last quarter of construction.
In addition, the plan seeks to implement corrective measures to preserve the landscape and tominimise the ecological impacts derived from the electric grid. A key issue for the project’s success isenergy storage. Project designers chose to rely on a hydroelectric pump-storage power station witha system of artificial lakes. The pump storage system consists of a 15 MW wind farm that harnesseswind energy to pump water to a reservoir. Once the reservoirs are full, the plant can supplyirrigation water for the island’s foothill farms, thus guaranteeing fruit and vegetable crops andproviding forage for livestock on the island. (Picture see p. 32)
Another feature of the island’s sustainable development strategy is the group of actions generatedunder the initiative “El Hierro – zero waste”, which consists of the production of biogas by exploitingstockbreeding effluents and sewage for methanogen fermentation. To complete the sustainableapproach, the Island Council has, in cooperation with the local transport cooperative, begun to takefirst steps to consolidate an alternative transport system, testing different hybrid and electric vehicletechnologies for El Hierro.
Flexible conventional generation
Conventional generation must adapt to its new role as back-up support for an increasing share ofintermittent electricity supplied by renewable sources. It needs to run more effectively on low loads,while employing abatement technologies to reduce emissions.
Flexible conventional generation plant with flue gas abatement in Malta
On Malta, a new modular and highly efficient combined cycle diesel engine plant has been installed.It is capable of operating both at base load and two shifting, while maintaining high conversionefficiency. Equipped with modern flue gas abatement technology, it can reduce emissions ofnitrogen oxides (NOx), sulphur dioxide (SO2) and particulate matter (PM). Through the application ofwaste heat recovery boilers, further capacity gains are achieved, while raising the plant’s efficiencyto 46.7% and reducing the fuel consumption per KWh generated.
The plant’s diesel engines are capable of burning both heavy fuel oil and gasoil. Each engine iscoupled to its own generator, while being enclosed in its own noise enclosure. Further noisereduction is achieved by applying noise cancelling material in the engine room and installingsilencers.
Each of the eight engines is complemented by selective catalytic reactors (SCR) for NOx reduction,waste heat boilers, flue gas desulphurisation unit (FGD) for SO2 reduction and a bag filter system forreduction of particulate matter emissions. A steam turbine utilises the steam generated in the wasteheat recovery boilers. This modular layout ensures that the plant’s efficiency remains close to itsmaximum value even at part load. To further lower the plant’s emissions, all exhaust gases are

41
passed through an emissions abatement plant. Through these processes, NOx reduction of 92% canbe achieved.
The plant is also equipped with two fresh water generators using the waste heat in the enginecooling water as the main source of energy. This increases the efficiency of the plant since waterproduced may be used as a substitute for the main evaporator which operates on auxiliary steamfrom the conventional boilers.
A key to the plant’s enhanced flexibility relates to maintaining fuel circulation. The engines and theirauxiliaries are kept hot during short shutdown periods. This process allows the fuel to continue tocirculate within the system without the need for gasoil to restart. Further, the majority of the motorsin the plant are equipped with a variable speed drive to minimise the losses incurred at reduced loadby reducing the speed of the motor during such periods.
Energy from waste in Jersey
In 2008 the government of Jersey approved the construction of a new energy from waste (EFW)power plant as the largest capital project undertaken on the island, with project costs close to €130million. It is scheduled to be fully operational by summer 2012.
The EFW is a critical infrastructure asset for the island to provide a safe, environmentally friendlymethod of dealing with the municipal waste and combustible solid waste generated on the island.The by-product of processing the waste is steam and this steam is used to power a conventionalsteam turbine and electrical generation unit with a 10MW generator.
The plant employs a two stream moving grate incinerator with heat recovery and gas cleaning.Emissions are controlled with a dry gas scrubbing system with activated carbon and lime injectionand urea-based NOx abetment. When the combustion gases exit the boiler powdered lime andactivated carbon are added to it in a venture reaction duct. The gas then passes through a bag filtersystem where the lime and carbon are recovered along with the particulates, acids and heavy metalsin the gas. (See Figure 12)
The new installation is not the only plant in Jersey that generates power from waste. As part of theisland sewage treatment process methane gas is produced as a by-product of the sludge digestionsystem. This gas can be used for electrical generation or as a heat source for other sewagetreatment processes.
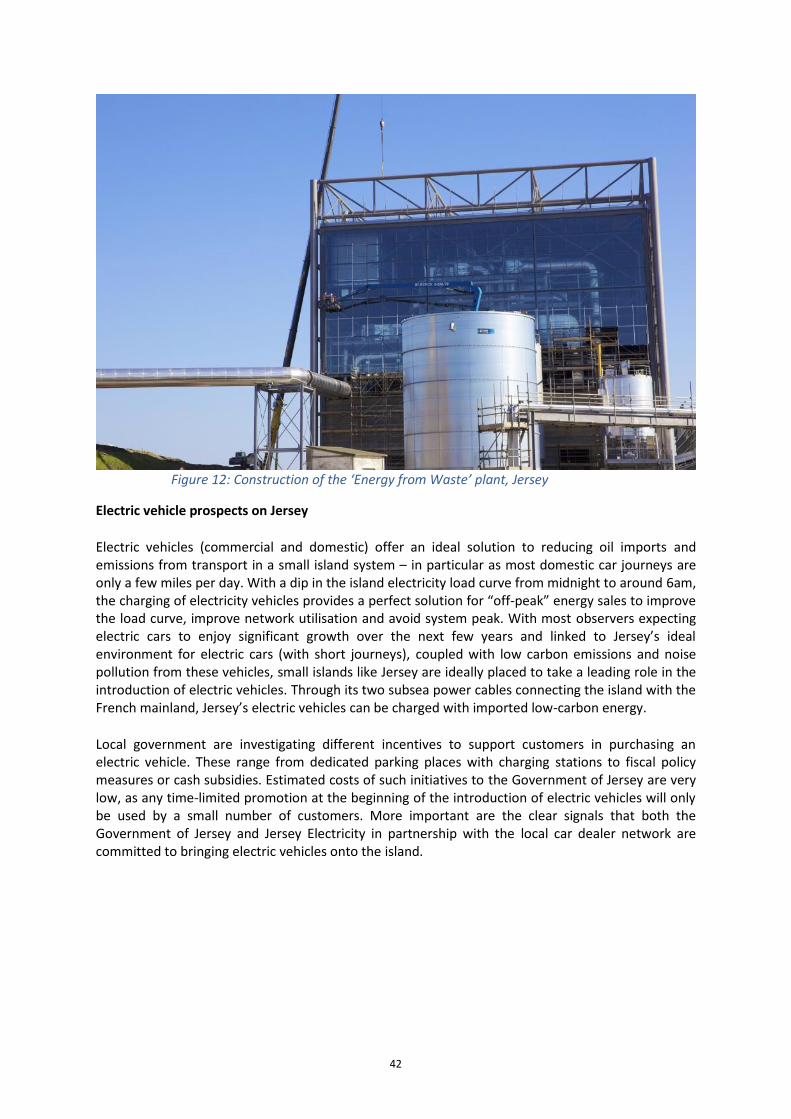
42
Figure 12: Construction of the ‘Energy from Waste’ plant, Jersey
Electric vehicle prospects on Jersey
Electric vehicles (commercial and domestic) offer an ideal solution to reducing oil imports andemissions from transport in a small island system – in particular as most domestic car journeys areonly a few miles per day. With a dip in the island electricity load curve from midnight to around 6am,the charging of electricity vehicles provides a perfect solution for “off-peak” energy sales to improvethe load curve, improve network utilisation and avoid system peak. With most observers expectingelectric cars to enjoy significant growth over the next few years and linked to Jersey’s idealenvironment for electric cars (with short journeys), coupled with low carbon emissions and noisepollution from these vehicles, small islands like Jersey are ideally placed to take a leading role in theintroduction of electric vehicles. Through its two subsea power cables connecting the island with theFrench mainland, Jersey’s electric vehicles can be charged with imported low-carbon energy.
Local government are investigating different incentives to support customers in purchasing anelectric vehicle. These range from dedicated parking places with charging stations to fiscal policymeasures or cash subsidies. Estimated costs of such initiatives to the Government of Jersey are verylow, as any time-limited promotion at the beginning of the introduction of electric vehicles will onlybe used by a small number of customers. More important are the clear signals that both theGovernment of Jersey and Jersey Electricity in partnership with the local car dealer network arecommitted to bringing electric vehicles onto the island.

43
Interconnectors
Malta–Sicily interconnector
Enemalta recently awarded a contract for the design and build of an HVAC interconnector betweenSicily and Malta capable of continuously delivering at least 200MW at the receiving end in anydirection at specified ambient conditions. The interconnector is planned to start operating beforethe end of 2013. The contract includes the construction of a 230kV substation at Maghtab in Maltatogether with all necessary switch gear, transformers and reactors to connect to the Maltese 132kVdistribution system. The contract value is €187 million. There were multiple main reasons for theinterconnector:
1. Security of supply The electrical interconnection to Sicily will be completed by 2013, providing an alternative
and geographically independent source of supply with:- Different typology of source- Different price drivers
The connection between Sicily and Italy is being strengthened by a 2 x 1000MW submarine380kV HVAC system that is expected to be completed by 2014-15.
2. Operational advantages Connection to a much larger system (UCTE) is expected to improve the voltage and
frequency stability of a small and otherwise isolated system. The connection will supply an appreciable overload capability that will improve stability of
the local power system in case of local generation plant failure. Local generating plant could be used more optimally to reduce emissions and improve local
air quality.
3. Integration of large-scale renewable energy For the planned 100MW offshore wind farm, there should be a sufficiently sized and flexible
source to cater for the intermittent supply. The interconnector is perfectly suited for such operation since it is connected to a much
larger source – Sicily alone is expected to have 7,700MW conventional plant and 1,400MWwind energy.
Demand side management & energy efficiency
Millener project on French islands
French utility EDF has implemented a project focused on residential customers on several Frenchislands. The project is set to collect information on customers’ behaviour and power demand andfacilitate the integration of renewable energy through storage in residential homes. The collectedinformation is used to develop ways for small systems to manage their power demand through e.g.peak shaving and to gain insight into customers’ responses to smart appliances for demand sideparticipation.
The insights provided by the Millener project will shed light on possible solutions for many of thechallenges small islands energy systems face. Next to ways of maintaining the balance betweensupply and demand in a small system, it is expected to offer solutions for dealing with intermittency

44
and lowering overall consumption – both fundamental to sustainable energy development onislands. Currently, the project is being implemented in several islands within and outside ofgeographical Europe. As an example, ‘Energy Management Boxes’ were distributed on Corsica toenable first insights into demand side participation options. (See Figure 13)
Through the development of a renewable monitoring system, the improvement of forecast tools,the merging of smart storage operation and a better knowledge of the behaviour of individualcustomers, the project managers are aiming to prepare a system in which PV production and smartdevices may become real contributors to insular system operation in the medium to long term.
Carried out by EDF in cooperation with a group of industrial partners, the Millener project is fundedby the European Union, the Regional Councils of Corsica, Guadeloupe and La Réunion and theFrench government.
PV Arrays
Batteries
Customers
Grid
DSM Control Center
Figure 13: Combined PV and battery storage system (Millener Project)
Advanced metering infrastructure in Cyprus
The Electricity Authority of Cyprus is implementing a first phase implementation project aiming forthe installation of 3,000 smart meters (Advanced Metering Infrastructure - AMI), including allrequired infrastructure. The initiative will provide the local stakeholders with an evaluation of thesmart meter functionality, which will then be rolled out to cover the needs of the whole country,based on the results obtained. The main objective will be to determine operator requirements aswell as the minimum functional requirements of an AMI system, including its architecture and itssuitability and compatibility with different telecommunication technologies. The project will alsogive insights on the protocol and data communications standards best suited for smart meters andprovide a basis for the development of a risk plan. To this end, three different smart meter types willbe installed.
The AMI first phase implementation project is regarded as the precursor of the development ofsmart grids in Cyprus. Financed by the Electricity Authority of Cyprus, the project will be undertakenin 2012-2013. It is expected to cost less than €1 million.
Smart metering project in Malta
Enemalta Corporation has recently concluded a pilot project of 5,000 smart meters to prove thetechnical viability of a smart meter solution using an encrypted power line communication systemfor Malta. Since then, a total of about 140,000 smart meters have been installed, and it is expectedthat all electricity meters on Malta (260,000) will be changed to smart meters by the beginning of

45
2013 at a cost of €20 million. The smart meter deployment has been accompanied by a new billingsystem, which will be shared by the Maltese water utility, which is installing smart water meters,communicating through a dedicated and encrypted radio frequency network. When this project iscompleted in 2013, Malta will be one of the first countries with a 100% smart meter deployment forboth water and electricity and one of the first where combined billing for both water and electricityis based on automatic readings from smart meters.
Since Malta relies for up to 50% of its water supply from sea water desalination, the consumption ofsuch water represents a significant energy cost. The use of smart water and electricity meters andsmart billing together will enable consumers to better manage their overall energy consumption.
The Malta smart meter project, together with the newly installed HV system SCADA, is considered tobe the core of the future Maltese smart network, with the ability to monitor and control loads on acontinuous basis. Already all distributed generation on the island (mainly small RES) is connectedand monitored through the smart meters.
Energy efficiency programme in the French Caribbean
To increase energy efficiency for residential consumers, EDF organises and funds sell-throughmarkets of efficient appliances such as energy saving lamps, automatic standby plugs and water-saving devices (to minimise the power needed to produce hot water). Residential consumers arealso induced to install solar water heating or insulate their houses.
Commercial and industrial consumers as well as administrations are encouraged to reduce their air-conditioning consumption by improving building insulation, solar protection (roof expansion, betterreflectivity) and installing efficient air-conditioning equipment. Further, industrial customers areoffered specific solutions (motor with electronic speed drive, cogeneration). If equipped with dieselgenerators, they can also contract with EDF to switch their consumption from the grid to theirgenerator on request. This process will be automated and centralised by the smart grid projectSIGMA, which is currently under deployment.
In addition, the utility is planning to roll out smart meters on French island territories ahead of theirintroduction in mainland France. The project features automated meter reading and supervision aswell as enhanced customer information through web portals and local displays.
EU-EcoGrid on Bornholm
Realised with about 50% EU funding through the EU’s 7th Framework Programme, the Danish islandof Bornholm embarked on the ‘EcoGrid’ project. With a total budget of €21 million, the idea of theproject is to introduce market-based mechanisms close to the operation of the power system thatwill release balancing capacity, particularly from flexible consumption over a period of four years.30
The system comprises about 28,000 electricity customers and has very high penetration of a varietyof low-carbon energy resources, including wind power, combined heat and power, active demand,photovoltaic and electric vehicles.
In total 2,000 households on Bornholm will show how Europe can manage a system with over 50%wind power and other fluctuating and less predictable renewable sources by means of more flexibleconsumption. (www.eu-ecogrid.net)
30 See www.eu-ecogrid.net

46
Storage
Pumped hydro storage in the Canary Islands
Due to their geographical position and geological features, the Canary Islands have developed astorage project which will allow for a much larger share of RES penetration on their market after2017. The relatively high terrain levels on Gran Canaria host enormous potential for pumped hydrostorage, which will be utilised with a closed-loop pumped storage power plant. The site is planned tofeature three power turbines with a combined capacity of 201MW (210MW in pumpingconfiguration), achieved through utilising a gross head of water of more than 370 metres, taking fulladvantage of the island’s geological features. The €290 million investment will be carried in full bythe Enel-Endesa holding.
Flywheel in the Azores
A different approach to small system storage solutions is being carried out on the Azores. In an effortto find solutions to maximise the energy production from renewable sources, but also to improvegrid stability and the efficiency of diesel engines, EDA developed a project to integrate flywheels intothe electrical system. The flywheels were set up in 2005-2006. At that time, the project was one ofthe first applications in the world of this technology on island power systems. (See Figure 14)
Flywheels are able to store kinetic energy and – using AC/DC power converters to connect to thegrid – to maintain control and power grid stability. The main advantages of the flywheel solutioncompared to other energy storage systems are the high charge and discharge cycles, with variabletime intervals between them. Flywheels can therefore attenuate the grid instabilities induced bywind energy production, thereby making an increased penetration of renewables possible whilemaintaining the quality of supply on the grid.
Figure 14: Flywheel storage unit outside a power station, Azores
Pegase: Small storage & RES generation forecasts on Réunion
Increasing the RES penetration was the main reason behind a project on Réunion which uses fast-response energy storage facilities. The so-called Pegase demonstration project was launched in 2011to tackle grid stability issues caused by a large-scale PV and wind power generation systemconnected to the grid. Carried out in cooperation with the French national meteorological agency
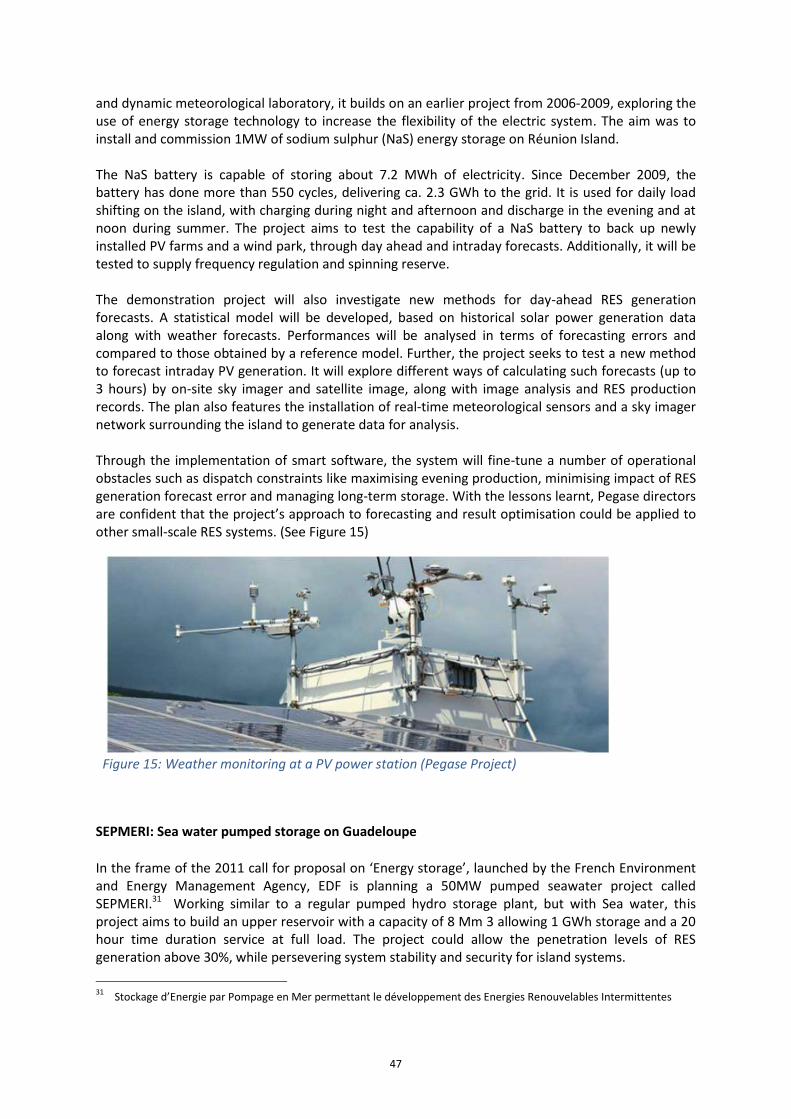
47
and dynamic meteorological laboratory, it builds on an earlier project from 2006-2009, exploring theuse of energy storage technology to increase the flexibility of the electric system. The aim was toinstall and commission 1MW of sodium sulphur (NaS) energy storage on Réunion Island.
The NaS battery is capable of storing about 7.2 MWh of electricity. Since December 2009, thebattery has done more than 550 cycles, delivering ca. 2.3 GWh to the grid. It is used for daily loadshifting on the island, with charging during night and afternoon and discharge in the evening and atnoon during summer. The project aims to test the capability of a NaS battery to back up newlyinstalled PV farms and a wind park, through day ahead and intraday forecasts. Additionally, it will betested to supply frequency regulation and spinning reserve.
The demonstration project will also investigate new methods for day-ahead RES generationforecasts. A statistical model will be developed, based on historical solar power generation dataalong with weather forecasts. Performances will be analysed in terms of forecasting errors andcompared to those obtained by a reference model. Further, the project seeks to test a new methodto forecast intraday PV generation. It will explore different ways of calculating such forecasts (up to3 hours) by on-site sky imager and satellite image, along with image analysis and RES productionrecords. The plan also features the installation of real-time meteorological sensors and a sky imagernetwork surrounding the island to generate data for analysis.
Through the implementation of smart software, the system will fine-tune a number of operationalobstacles such as dispatch constraints like maximising evening production, minimising impact of RESgeneration forecast error and managing long-term storage. With the lessons learnt, Pegase directorsare confident that the project’s approach to forecasting and result optimisation could be applied toother small-scale RES systems. (See Figure 15)
Figure 15: Weather monitoring at a PV power station (Pegase Project)
SEPMERI: Sea water pumped storage on Guadeloupe
In the frame of the 2011 call for proposal on ‘Energy storage’, launched by the French Environmentand Energy Management Agency, EDF is planning a 50MW pumped seawater project calledSEPMERI.31 Working similar to a regular pumped hydro storage plant, but with Sea water, thisproject aims to build an upper reservoir with a capacity of 8 Mm 3 allowing 1 GWh storage and a 20hour time duration service at full load. The project could allow the penetration levels of RESgeneration above 30%, while persevering system stability and security for island systems.
31 Stockage d’Energie par Pompage en Mer permettant le développement des Energies Renouvelables Intermittentes

48
Due to its geologic advantages, the Caribbean island of Guadeloupe is currently in the focus of theproject, offering a favourable coastal line for the installation of the pump storage facility. Due to thenovelty of the specific concept, the project is currently classified as a pilot RD&D effort. For theundertaking, EDF formed partnerships with equipment suppliers and universities with fundingsupport from local authorities. With further financial support from French and European sources,project managers aim to achieve a funding level of up to 30% of the project costs.
Figure 16: Simplified cross section of a sea water pumped storage plant
49
Towards an EU Island Action Plan 2020
Four Recommendations
This report has highlighted that island energy systems, despite their diversity, share commoncharacteristics and are thus subject to common challenges. Their sustainable energy future dependson an improved investment climate and policy framework. In many cases, the limited size of theirmarkets raises issues of market failure: complementary measures and remedies have to be found.
The following recommendations are made to both national and European policymakers, in order toincentivise the transition towards a sustainable energy future. The recommendations should be partof an EU Island Action Plan 2020, which would bring the islands’ trajectories in line with the overallEU 2020 project.
1. Set up an EU Island Sustainable Energy Action Plan 2020EURELECTRIC recommends establishing an island action plan, to be jointly set up by the EuropeanCommission’s DG Energy and DG Regional Policy. The plan should contain island-specific measuresup to 2020. Islands are part of the EU and should be part of the EU’s ambitious 2020 strategy. Acomprehensive 2020 framework has yet to be set up.
2. Improve security of supply through diversified power generation technologies andinterconnection
Systems that are over-dependent on one single technology (like oil-based power generation) arevulnerable, as last year’s incident at the Cyprus Vasilikos power plant incident has shown. The EIBsupport for switching that plant’s power generation from oil to gas is an appropriate answer. Thereis a need to encourage diversification towards low-carbon power generation. Interconnection,where feasible, is an important tool to limit exposure to such incidents.
3. Use islands as a priority test-bed for innovative technologies such as storage, smart grids andRES. Foster RD&D on islands.
Islands and isolated systems have the potential to demonstrate new energy systems andtechnologies. This potential should be used and incentivised through RD&D support, especially forrenewable and enabling technologies such as energy storage. This will improve the situation ofisland power systems, while the mainland could learn and benefit from the demonstration of newtechnologies.
4. Use exemptions appropriately and address the market failures that occur as a result of limitedsize and isolation.
EURELECTRIC, which favours market-based mechanisms, acknowledges the need for an appropriate,carefully chosen response to the markets failures that often occur as a result of islands’ small sizeand isolation. Such a response should opt for the least distortive measures, like RD&D support. Aspecific market design and investment incentives for low-carbon technologies are needed to useislands as test-beds for new technologies and put them on a sustainable, low-carbon track.

50
AnnexThis annex comprises main data tables from a questionnaire distributed among EURELECTRIC members inearly 2012. An interactive map with downloadable tables is available on the EURELECTRIC website.32
Azores:Population: 246.000
GDP 2010: € 3, 7 billion
Unemployment: 11.7% (2011)
Power Sector main indicators:
Demand2007 2008 2009 2010 2011 2020
Peak dem. (MW)Santa Maria 3 4 4 4 4 5Sao Miguel 72 74 74 74 73 72
Terceira 36 36 38 40 36 39Graciosa 2 2 2 2 2 2Sao Jorge 4 5 5 5 5 5
Pico 7 7 8 8 8 9Faial 9 9 9 9 9 9
Flores 2 2 2 2 2 2Corvo 0.2 0.3 0.2 0.2 0.2 0.4
Total dem. (GWh)Santa Maria 18 19 19 20 20 25Sao Miguel 394 407 407 418 414 425
Terceira 186 193 192 198 195 200Graciosa 12 13 13 13 13 12Sao Jorge 23 25 26 28 28 28
Pico 38 39 40 42 43 48Faial 45 47 47 48 47 46
Flores 11 11 11 12 11 12Corvo 1 1 1 1 1 2
Power generation mix (GWh)Fossil fuels 2007 2008 2009 2010 2011 2020
CoalOil 580 605 613 610 587 392
RenewablesHydro 31 25 22 31 33 50Solar 0.02 0.03 0.09
Wind onshore 16 22 31 34 33 83Wind offshore
Biomass 53Geothermal 178 170 162 174 186 289
Other 0.2 0.03 0.1 0.3 0.3 0.4
Total emissions from Power sector (tons)2007 2008 2009 2010 2011
Sulphur DioxideSO2 3.434 4.413 4.411 2.723 1.521
Nitrogen OxidesNOx 5.890 6.412 9.100 10.408 8.471
Carbon DioxideCO2 383.418 405.258 408.805 403.579 385.941
32 See http://www.eurelectric.org/Maps/InteractiveMapIslands/

51
Canary Islands:
Population: 2.127.000
GDP 2010: € 40, 34 billion
Unemployment: 32.2% (2012)
Power Sector main indicators:
Demand
2007 2008 2009 2010 2011 2020Peak demand
(MW)Gran Canaria 600 582 582 571 563 734
Tenerife 595 587 550 569 580 738Sistema LZ-FV 260 267 248 257 243 327
La Palma 45 45 45 48 46 59La Gomera 12 12 12 12 12 16El Hierro 7 7 7 7 7 10
Total demand(GWh) 9215 9341 9126 8886 8862 11597
Gran Canaria 3667 3712 3626 3527 3510 4617Tenerife 3644 3712 3626 3525 3506 4580
Sistema LZ-FV 1535 1538 1502 1451 1477 1916La Palma 262 269 262 268 255 334
La Gomera 67 70 69 72 71 94El Hierro 40 42 41 43 43 56
Power generation mix (GWh)
Fossil fuels 2007 2008 2009 2010 2011 2020CoalOil 8819 8869 8592 8345 8269 2325
Natural Gas 6855Renewables
Hydro (*) 1 2 0 0 2 -159Solar 19 76 168 194 237 334Wind
onshore 375 390 358 339 348 2042
WindoffshoreBiomass 31
Other 0 3 7 8 6 168Hydro (*): Energy balance including pumped storage.
Total emissions from Power sector (tons)
2007 2008 2009 2010 2011Sulphur Dioxide
SO2 16.103 15.368 15.500 14.742 11.307
Nitrogen OxidesNOx 42.463 41.209 44.606 30.681 37.834
Carbon DioxideCO2 6.607.603 6.528.886 6.219.732 6.149.202 6.084.878

52
Corsica:
Population: 311.000
GDP 2006: € 7 billion
Unemployment: 8.3% (2009)
Power Sector main indicators:
Demand
2007 2008 2009 2010 2011 2020Peak demand
(MW) 443 434 464 489 463 600
Total demand(GWh) 1898 2019 2087 2212 2130 2771
Power generation mix (GWh)
Fossil fuels 2007 2008 2009 2010 2011 2020CoalOil 1006 861 939 894 1074
Natural GasRenewables
Hydro 253 500 483 580 294Solar 0 0 0 2 25
Wind onshore 33 34 29 27 24Wind offshore
BiomassBiogas 6 9 8
Interconnections 606 624 630 701 705
Total emissions from Power sector (tons)
2007 2008 2009 2010 2011
Sulphur DioxideSO2
Nitrogen OxidesNOx
Carbon DioxideCO2

53
Cyprus:
Population: 804.435
GDP 2010: € 17, 8 billion
Unemployment: 8.5% (2011)
Power Sector main indicators:
Demand
2007 2008 2009 2010 2011 2020Peak demand
(MW) 1056 1010 1103 1105 862 1575
Total demand(GWh) 4786 5049 5178 5380 5305.8 7365
Power generation mix (GWh)
Fossil fuels 2007 2008 2009 2010 2011 2020CoalOil 4850 5049 5178 5211 5327 500
Natural Gas 5765Renewables
HydroSolar 1 3 3 5 10 528
Wind onshore 31 114 494Wind offshore
Biomass 1 20 25 40 150Other
Interconnections
Total emissions from Power sector (tons)
2007 2008 2009 2010 2011Sulphur Dioxide
SO2 33.423 33.108 33.634 34.170 34.715
Nitrogen OxidesNOx 7.481 7.560 7.790 7.953 8.119
Carbon DioxideCO2 3711.139 3856.337 402.5148 4193.042 4374.247

54
Faroe Islands:
Population: 48.372
GDP 2010: € 1, 7 billion
Unemployment: 1.3% (2008)
Power Sector main indicators:
Demand
2007 2008 2009 2010 2011 2020Peak demand
(MW) 48,3 52,2 52,1 51,2 48,0 55
Total demand(GWh) 269,4 275,8 275,5 280,3 273,8 330
Power generation mix (GWh)
Fossil fuels 2007 2008 2009 2010 2011 2020
CoalOil 149 167 168 199 167 100
Natural GasRenewables
Hydro 104 96 92 67 93 120Solar
Wind onshore 16 13 15 14 15 87Wind offshore
BiomassOther 23
Interconnections
Total emissions from Power sector (tons)
2007 2008 2009 2010 2011Sulphur Dioxide
SO2 580 677 693 798 681
Nitrogen OxidesNOx 2.203 2.494 2.505 2.982 2.518
Carbon DioxideCO2 100.761 112.583 116.941 131.545 111.057

55
Guadeloupe:
Population: 404.000
GDP 2006: €7.75 billion
Unemployment: 22.6% (2011)
Power Sector main indicators:
Demand
2007 2008 2009 2010 2011 2020Peak demand
(MW) 241 242 248 260 256 325
Total demand(GWh) 1609 1612 1653 1730 1692 2173
Power generation mix (GWh)
Fossil fuels 2007 2008 2009 2010 2011 2020Coal 328 344 220 281 514Oil 1045 1047 1242 1300 973
Natural GasRenewables
Hydro 20 22 21 16 15Solar 2 3 5 17 33
Wind onshore 44 49 51 41 45Wind offshore
Biomass 75 58 64 60 55Geothermal 95 89 50 15 56
Interconnections
Total emissions from Power sector (tons)
2007 2008 2009 2010 2011Sulphur Dioxide
SO2Nitrogen Oxides
NOxCarbon Dioxide
CO2

56
Guernsey, Channel Islands:
Population: 62.451
GDP 2010: £ 1, 93 billion (ca. €2, 35 billion)
Unemployment: 1.1% (2011)
Power Sector main indicators:
Demand
2007 2008 2009 2010 2011 2020Peak demand
(MW) 76.3 75.2 78.6 85.0 78.3 76.3
Total demand(GWh) 363.685 377.107 387.241 398.020 381.212 363.685
Power generation mix (GWh)
Fossil fuels 2007 2008 2009 2010 2011 2020CoalOil 127 113 195 101 75
Natural GasRenewables
HydroSolar
Wind onshoreWind offshore
BiomassOther
Interconnections 237 264 193 297 306
Total emissions from Power sector (tons)
2007 2008 2009 2010 2011Sulphur Dioxide
SO2Nitrogen Oxides
NOxCarbon Dioxide
CO2 75.300 116.800 102.200 56.800

57
Isle of Man:
Population: ca. 80.000
GDP 2010: £ 3.4 billion (ca. €4, 14 billion)
Unemployment: 2.3 % (2012)
Power Sector main indicators:
Demand
2007 2008 2009 2010 2011 2020Peak demand
(MW) 91 91 91 94 90 90
Total demand(GWh) 428 440 435 438 426 426
Power generation mix (GWh)
Fossil fuels 2007 2008 2009 2010 2011 2020CoalOil 10.5 15.1 8.5 10.3 10 10
Natural Gas 404 465 507 477 443 450Renewables
Hydro 2.3 3.5 3.1 2.8 3 3Solar
Wind onshoreWind offshore
BiomassOther 22.3 13.9 28.4 25.4 24 25
Interconnections(Imports) 43.1 32.5 12.6 29.6 53 40
Interconnections
(Exports)54.7 89.9 125.2 106.9 108 110
Total emissions from Power sector (tons)
2007 2008 2009 2010 2011Sulphur Dioxide
SO2Nitrogen Oxides
NOxCarbon Dioxide
CO2 174.000 200.000 207.000 201.000 187.000

58
Jersey, Channel Islands:
Population: ca. 91.000
GDP 2010: £ 3.5 billion (ca. €4, 26 billion)
Unemployment: 4.7% (2011)
Power Sector main indicators:
Demand
2007 2008 2009 2010 2011 2020Peak demand
(MW) 142 156 153 158 154 183
Total demand(GWh) 608 639 642 645 651 813
Power generation mix (GWh)
Fossil fuels 2007 2008 2009 2010 2011 2020CoalOil 66 20 42 38 12 8
Natural GasRenewables
HydroSolar
Wind onshoreWind offshore
BiomassOther 3 4 6 4 17 41
Interconnections(Imports) 539 615 594 603 622 764
Total emissions from Power sector (tons)
2007 2008 2009 2010 2011Sulphur Dioxide
SO2 276 141 349 270 233
Nitrogen OxidesNOx 477 343 490 401 446
Carbon DioxideCO2 83,940 49,594 60,591 65,591 36,955
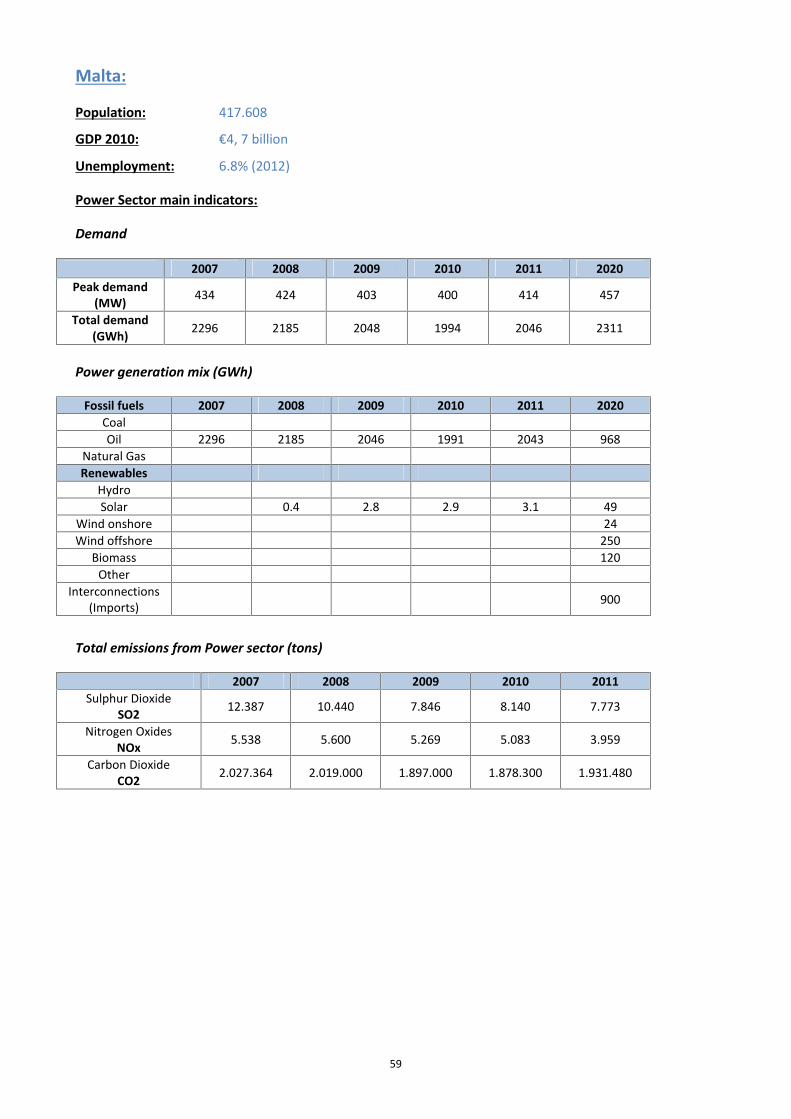
59
Malta:
Population: 417.608
GDP 2010: €4, 7 billion
Unemployment: 6.8% (2012)
Power Sector main indicators:
Demand
2007 2008 2009 2010 2011 2020Peak demand
(MW) 434 424 403 400 414 457
Total demand(GWh) 2296 2185 2048 1994 2046 2311
Power generation mix (GWh)
Fossil fuels 2007 2008 2009 2010 2011 2020CoalOil 2296 2185 2046 1991 2043 968
Natural GasRenewables
HydroSolar 0.4 2.8 2.9 3.1 49
Wind onshore 24Wind offshore 250
Biomass 120Other
Interconnections(Imports) 900
Total emissions from Power sector (tons)
2007 2008 2009 2010 2011Sulphur Dioxide
SO2 12.387 10.440 7.846 8.140 7.773
Nitrogen OxidesNOx 5.538 5.600 5.269 5.083 3.959
Carbon DioxideCO2 2.027.364 2.019.000 1.897.000 1.878.300 1.931.480

60
Martinique:
Population: 403.000
GDP 2010: €7, 9 billion
Unemployment: 21.9% (2011)
Power Sector main indicators:
Demand
2007 2008 2009 2010 2011 2020Peak demand
(MW) 235 237 239 242 241 328
Total demand(GWh) 1488 1530 1550 1617 1576 2095
Power generation mix (GWh)
Fossil fuels 2007 2008 2009 2010 2011 2020CoalOil 1452 1492 1506 1573 1521
Natural GasRenewables
HydroSolar 3 5 12 19 38
Wind onshore 1 1 2 1 1Wind offshore
BiomassWaste 32 31 31 24 15
Interconnections(Imports)
Total emissions from Power sector (tons)
2007 2008 2009 2010 2011Sulphur Dioxide
SO2Nitrogen Oxides
NOxCarbon Dioxide
CO2

61
La Reunion:
Population: 824.000
GDP 2008: €14, 7 billion
Unemployment: 29.5% (2011)
Power Sector main indicators:
Demand
2007 2008 2009 2010 2011 2020Peak demand
(MW) 404 408 423 429 442 574
Total demand(GWh) 2461 2546 2618 2699 2750 3617
Power generation mix (GWh)
Fossil fuels 2007 2008 2009 2010 2011 2020Coal 1253 1287 1247 1315 1305Oil 298 339 519 473 613
Natural GasRenewables
Hydro 658 633 531 542 402Solar 4 11 21 76 142
Wind onshore 10 14 15 17 12Wind offshore
Biomass 238 263 278 269 270Biogas 7 8 6
Interconnections
Total emissions from Power sector (tons)
2007 2008 2009 2010 2011Sulphur Dioxide
SO2Nitrogen Oxides
NOxCarbon Dioxide
CO2

62
Tahiti (outside EU regulation):
Population: 267.000
GDP 2010: €4.5 billion
Unemployment: NDA
Power Sector main indicators:
Demand
2007 2008 2009 2010 2011 2020Peak demand
(MW) 97.6 94.6 101 101.4 90.9 109
Total demand(GWh) 622 619 635 636 605 718
Power generation mix (GWh)
Fossil fuels 2007 2008 2009 2010 2011 2020CoalOil 516 534 553 487 484 576
Natural GasRenewables
Hydro 175 157 155 220 181 186Solar 0.04 0.05 0.05 0.3 4.5 16
Wind onshoreWind offshore
BiomassBiogas
Interconnections
Total emissions from Power sector (tons)
2007 2008 2009 2010 2011Sulphur Dioxide
SO2 3.500 3.640 3.140 2.010 2.040
Nitrogen OxidesNOx 7.230 7.480 7.750 6.330 6.280
Carbon DioxideCO2 375.000 388.000 401.000 354.000 352.000

Maz
y G
raph
ic D
esig
n
Union of the Electricity Industry - EURELECTRIC aisbl
Boulevard de l’Impératrice, 66 - bte 2B - 1000 Brussels • BelgiumTel: + 32 2 515 10 00 • Fax: + 32 2 515 10 10 www.eurelectric.org • twitter.com/eurelectric