eu ets monitoring and reporting...eu ets monitoring and reporting – training on uncertainty...
TRANSCRIPT

EUROPEAN COMMISSION DIRECTORATE-GENERAL CLIMATE ACTION Directorate C - Climate strategy, governance, and emissions from non-trading sectors CLIMA.C.2 - Governance & Effort Sharing
EU ETS Monitoring and Reporting – Training on Uncertainty Assessment
M&R Training Event of 31st May 2016
This document comprises training material for competent authorities and verifiers for the checking of uncertainty assessments according to Commission Regulation (EU) No. 601/2012 of 21 June 2012 on the monitoring and reporting of greenhouse gas (GHG) emissions pursuant to Directive 2003/87/EC of the European Parliament and of the Council (the MRR)1.
1 http://eur-lex.europa.eu/LexUriServ/LexUriServ.do?uri=OJ:L:2012:181:0030:0104:EN:PDF

Table of content
1. Legal background 3
2. Objective 3
3. Set-up of the training event 4
4. Programme of the training event 4
5. Conclusions 5
Annex I: Main plenary presentations 7 Uncertainty in the EU ETS 8
Legal metrology in Europe 34
How to demonstrate compliance 67
Annex II: Member State Presentations 106
Annex III: Case Studies and Model Answers (Suggested Approaches) 139
2
1. LEGAL BACKGROUND
Article 12(1) MRR requires the operator to submit to the CA uncertainty assessments as supporting documents concerning approval of the monitoring plan (MP). CA interest ex-tends to the following information:
Evidence for compliance with the uncertainty thresholds for activity data Evidence for compliance with the uncertainty required for calculation factors, if
applicable Evidence for compliance with the uncertainty requirements for measurement
based methodologies, if applicable If a fall-back methodology is applied, an uncertainty assessment for the total
emissions of the installation Article 19(1) AVR requires the verifier to confirm the validity of the information used to calculate the uncertainty levels.
2. OBJECTIVE
The M&R training event of 31st May 2016 aimed at:
providing technical support to the participants in performing their day-to-day tasks when assessing uncertainty involved in the approval of MPs;
enhancing the efficiency and effectiveness of participants attending the training. The training event was designed to provide representatives of EU ETS CAs with the opportunity to come together to exchange information with other experts on how they deal with uncertainty assessments. Furthermore, participants were enabled to discuss in an interactive way real-life cases of e.g. uncertainty assessments concerning weigh-bridges, or fuel oil delivered on trucks from many different suppliers, etc. The training was focused towards mainly new and medium-experienced staff members, but that did not preclude that also more advanced examples were used in the training.
Experience and feedback from discussions in the EU ETS MRVA Support Technical Working Group (TWG) and the EU ETS Compliance Forum M&R Task Force had shown that uncertainty assessment is an area where Member States (MS) and CAs would most welcome training. Information had shown shown major differences in how MS check uncertainty assessments. These differences between MS concern differ-ences in experience, in background of staff members, in the resources of the CAs and in practices by which checks are carried out, e.g. level of detail, spot checks.
An additional objective for the training provided on 31st May 2016 was that it should al-low for further cascade to other MS audiences based on the case studies and this doc-ument.
3

3. SET-UP OF THE TRAINING EVENT
The training was set up in the following two sessions:
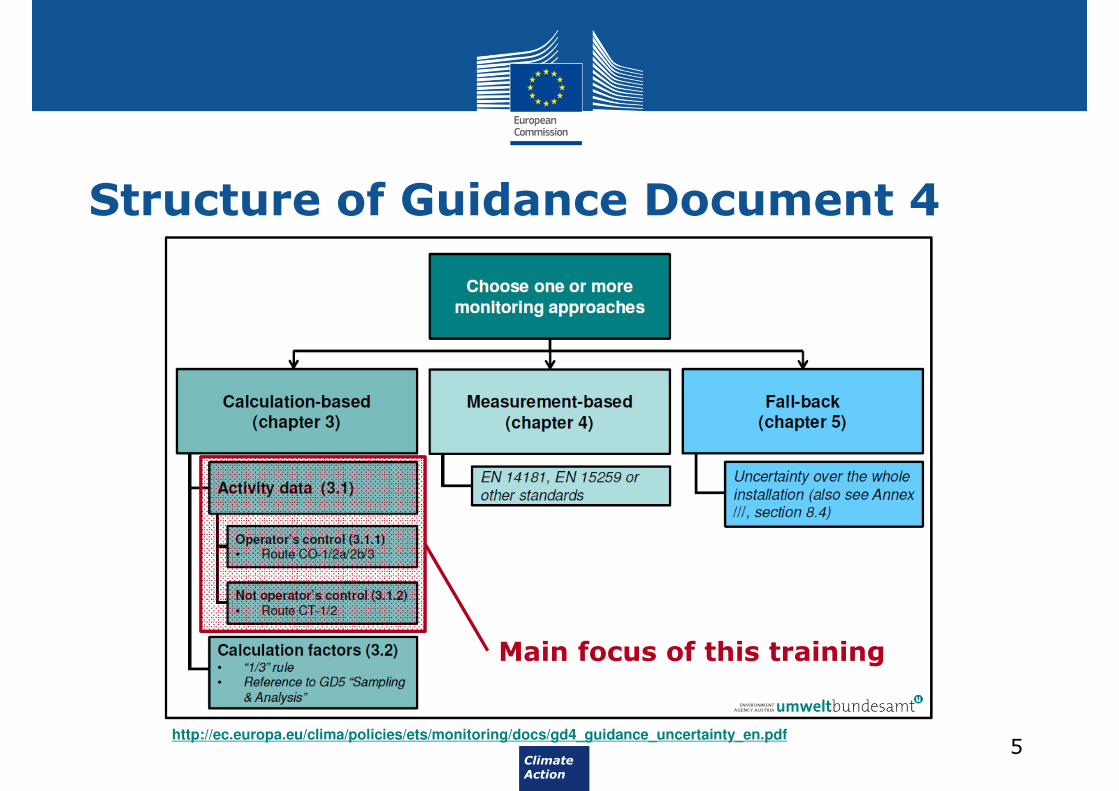
A theoretical part covering the principles of uncertainty assessment in EU ETS monitoring and reporting: This part included a short introduction and outline of uncertainty assessment in the EU ETS which followed the narrative of MRR Guidance Documents 4 and 4a. This was followed by a general outline on what national legal metrological control entails and to what extent it is harmonised across Europe.
A practical part with MS representatives sharing their experiences in uncertainty assessments followed by discussion of case studies in six discussion groups: In this more practice-focused part, MS representatives gave first a brief overview of their common practices and experiences concerning the checking of operator un-certainty assessments. This was followed by group discussions based on real-life case studies submitted by MS. Group trainers were assigned to each discussion group to lead and steer discussions.
4. PROGRAMME OF THE TRAINING ON 31ST MAY 2016
Uncertainty Assessment in EU ETS What is uncertainty and why is it needed? Role of uncertainty in measurement in MRVA
Calibration and legal metrological control
National legal metrological control – what is it? How is it organised in the MS?
Calibration and (metrological) verification Where to obtain evidence for uncertainty from? State of play regarding harmonisation of calibration/verification
across Member States Implications of MID and NAWI Directive
How to demonstrate compliance
A “step-by-step guide” on how to demonstrate compliance Measuring instruments under operator's or trading partner's control Introduction to uncertainty propagation laws Examples
Checking Compliance with the tier requirements:
Practical approach to checking operators' uncertainty assessments Common difficulties and limitations Required time effort and expertise (e.g. use of external consultants) Best practice examples: What kind of checks are performed? Best practice examples: What kind of evidence is requested from
operators?
Group discussion on case studies
Discussions guided by volunteered trainers
4
5. CONCLUSIONS
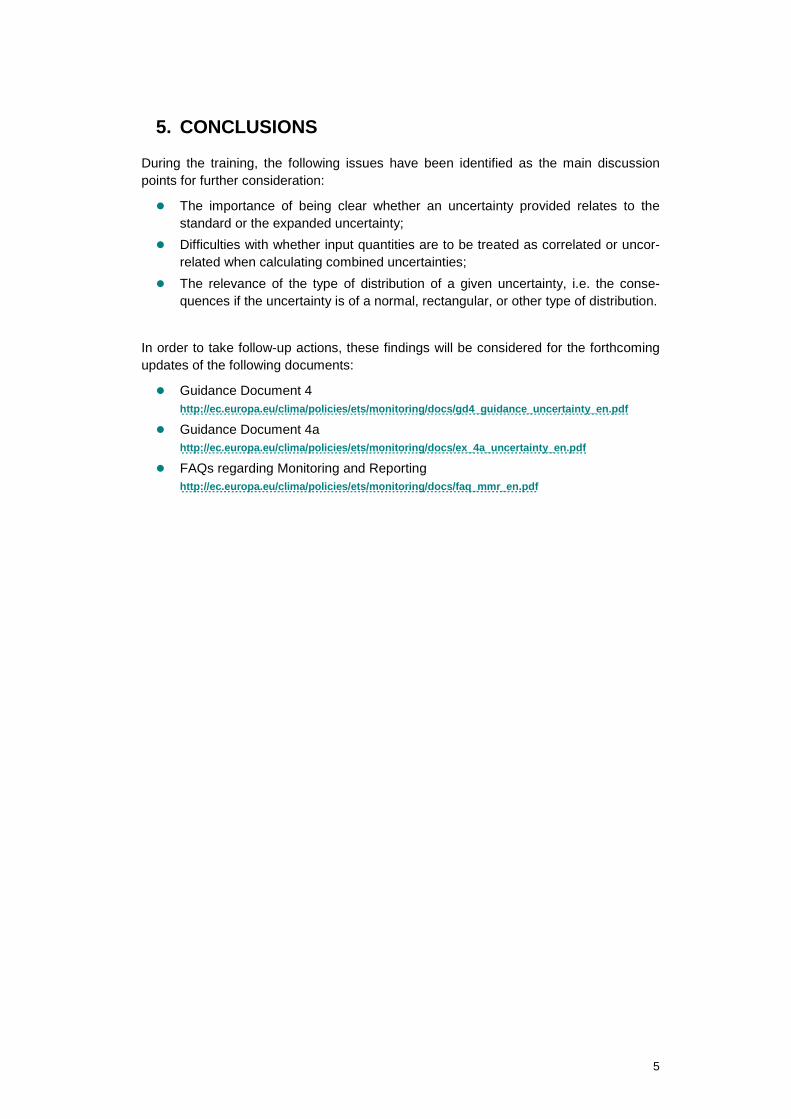
During the training, the following issues have been identified as the main discussion points for further consideration:
The importance of being clear whether an uncertainty provided relates to the standard or the expanded uncertainty;
Difficulties with whether input quantities are to be treated as correlated or uncor-related when calculating combined uncertainties;
The relevance of the type of distribution of a given uncertainty, i.e. the conse-quences if the uncertainty is of a normal, rectangular, or other type of distribution.
In order to take follow-up actions, these findings will be considered for the forthcoming updates of the following documents:
Guidance Document 4 http://ec.europa.eu/clima/policies/ets/monitoring/docs/gd4_guidance_uncertainty_en.pdf
Guidance Document 4a http://ec.europa.eu/clima/policies/ets/monitoring/docs/ex_4a_uncertainty_en.pdf
FAQs regarding Monitoring and Reporting http://ec.europa.eu/clima/policies/ets/monitoring/docs/faq_mmr_en.pdf
5


Annex I: Main plenary presentations
6
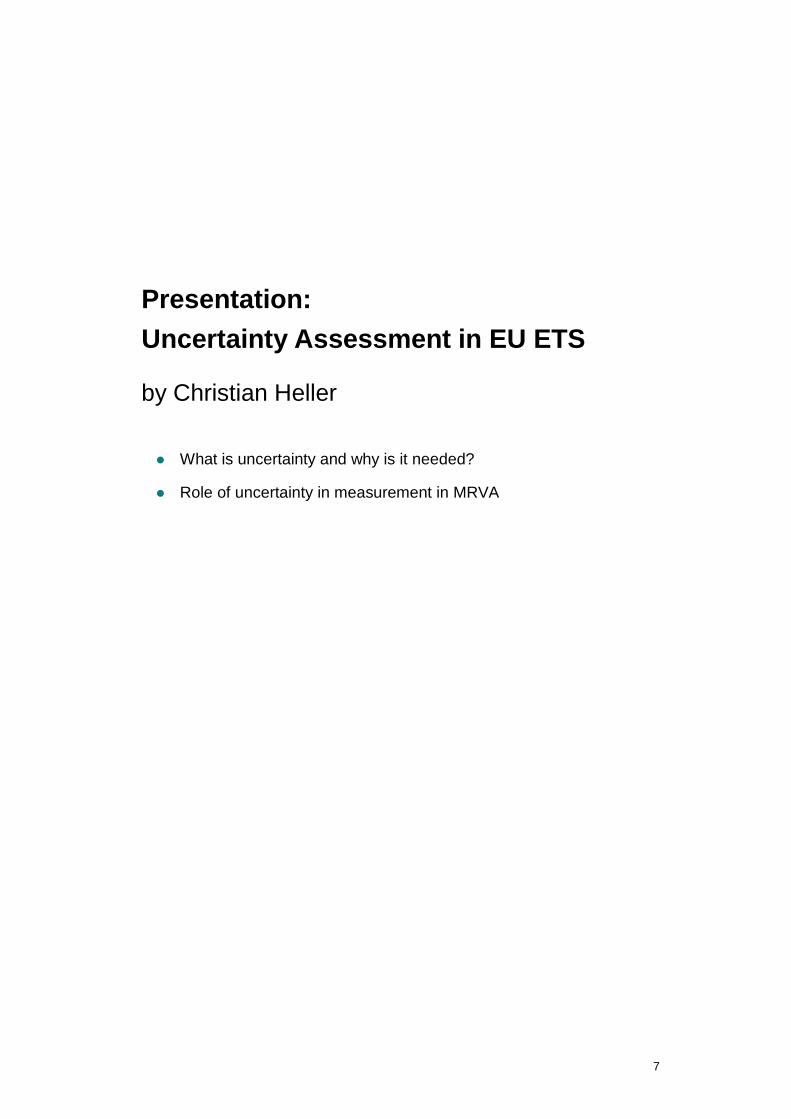
Presentation: Uncertainty Assessment in EU ETS
by Christian Heller What is uncertainty and why is it needed?
Role of uncertainty in measurement in MRVA
7

Climate Action
Uncertainty assessment in the EU ETS
Christian HELLER
M&R Training Event on Uncertainty AssessmentBrussels, 31 May 2016

Climate Action
2
51m
Calibration CertificateBrakes
Why not exactly 50m?
• Car (wheels, brakes,..) tested for the certificate do not have exact same properties
• Temperature/material properties differences to testing conditions causes differences in:
• Friction within the braking system
• Rolling resistance between wheels and road
• Air resistance (which also depends on density/viscosity of the air, wind speed)
• Speedometer display or its reading may not be correct
• Etc.
What is the best guess for your chances of stopping before hitting the wall?
Braking distance(100 km/h):
50m (±±±±4; 95%)
≈69%
50m

Climate Action
3
Uncertainty Assessment –Legal Requirements in MRVA
• Article 12(1) MRR requires the operator to submit to CA an uncertainty assessment as supporting document to the MP that should contain the following information:
• Evidence for compliance with uncertainty thresholds for activity data
• Evidence for compliance with uncertainty required for calculation factors, if applicable
• Evidence for compliance with uncertainty requirements for measurement based methodologies, if applicable
• If a fall-back methodology is applied, an uncertainty assessment for the total emissions

Climate Action
4
Uncertainty Assessment –Legal Requirements in MRVA
• Article 19(1) AVR requires the verifier to confirm the validity of the information used to calculate the uncertainty levels
• Article 47(4) MRR exempts operators of installations with low emissions from submission of an uncertainty assessment to the competent authority.
• Paragraph 5 also exempts those operators from including uncertainty of determining stock changes in their uncertainty assessment.
• Article 22(b) MRR requires operators to carry out an uncertainty asssessment annually, where fall-back approaches are applied
• Article 19(2) AVR requires verifier to check details
Climate Action
5
Structure of Guidance Document 4
http://ec.europa.eu/clima/policies/ets/monitoring/docs/gd4_guidance_uncertainty_en.pdf
Main focus of this training

Climate Action
6
Calculation-based methodology(Emissions from source streams)
Combustionemissions
Processemissions
Mass balanceemissions
OFEFNCVFQEm ⋅⋅⋅= CFEFADEm ⋅⋅= ( )∑ ⋅⋅=
ii
CCi
ADfEm

Climate Action
7
Fuel and material quantities
• Article 27 of the MRR (No. 601/2012)
• There are two ways how the activity data (fuel/material quantity) can be determined:
• based on continual metering at process which causes emissions
• based on aggregation of metering of quantities separately delivered (batch metering) taking into account relevant stock changes.
� In both cases, the fuel or material quantity of source streams will be determined by metering using measuring instruments (MIs)

Climate Action
8
Continual metering
• Fuel/material directly passing a MI
• Flow measurement metering of either:
• Gases (e.g. natural gas)
• Liquids (e.g. fuel oil delivered on trucks)
• Solids (e.g. (continuous) belt weigher)
• Fuel/material consumed:e.g. meter readings or invoices
FLOW

Climate Action
9
Batch metering (aggregation of metering of quantities)
• Q Quantity of fuel/material
• P Purchased quantity (e.g. invoices)
• E Exported quantity (e.g. to non-ETS entity)
• Sbegin Stock of fuel/material at the beginning of the year
• Send Stock of fuel/material at the end
� Example: limestone delivered on trucks, weighed on weighing bridges (invoices)
)( endbegin SSEPQ −+−=
weighing bridge
limestone batch

Climate Action
10
Any questions so far?
Climate Action
11
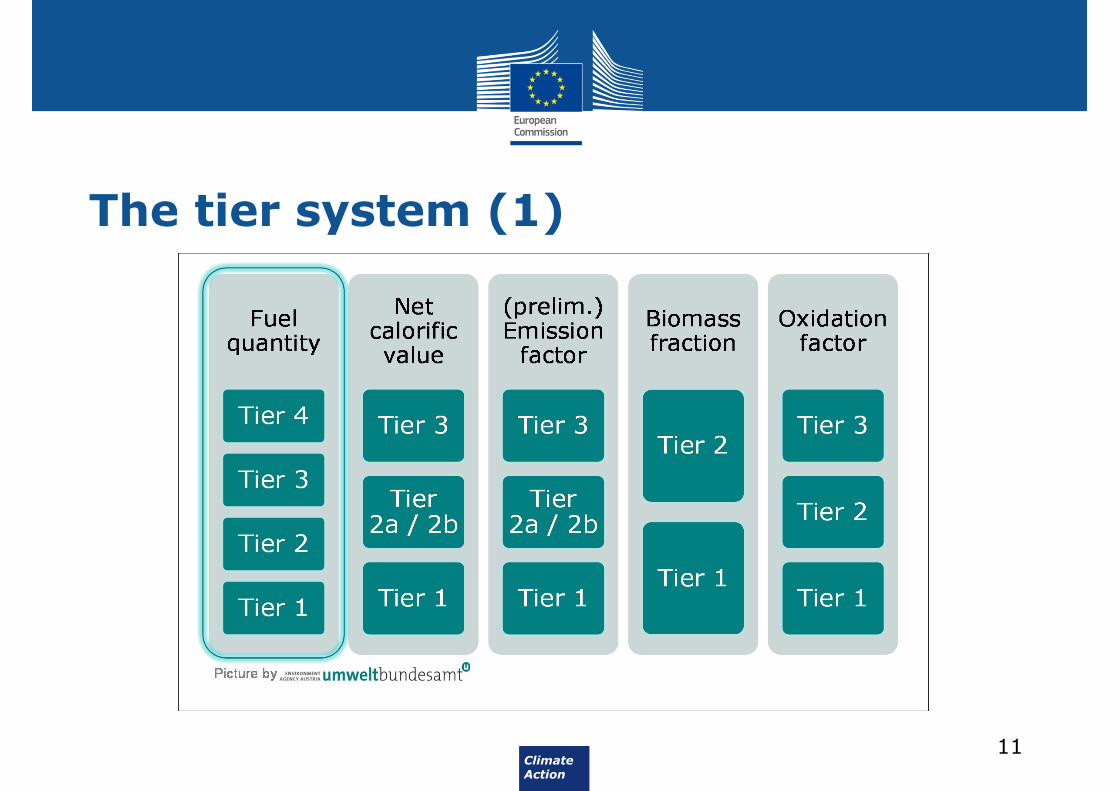
The tier system (1)

Climate Action
12
The tier system (2)
Tier Definition
1Amount of fuel [t] or [Nm3] over the reporting period is determined with a maximum uncertainty of less than ± 7.5 %.
2Amount of fuel [t] or [Nm3] over the reporting period is determined with a maximum uncertainty of less than ± 5.0 %.
3Amount of fuel [t] or [Nm3] over the reporting period is determined with a maximum uncertainty of less than ± 2.5 %.
4Amount of fuel [t] or [Nm3] over the reporting period is determined with a maximum uncertainty of less than ± 1.5 %.
� Tiers for fuel/material quantity (activity data) relate to the “permissible” uncertainty of measurements
Tiers for activity data of e.g. solid fuels
Climate Action
13
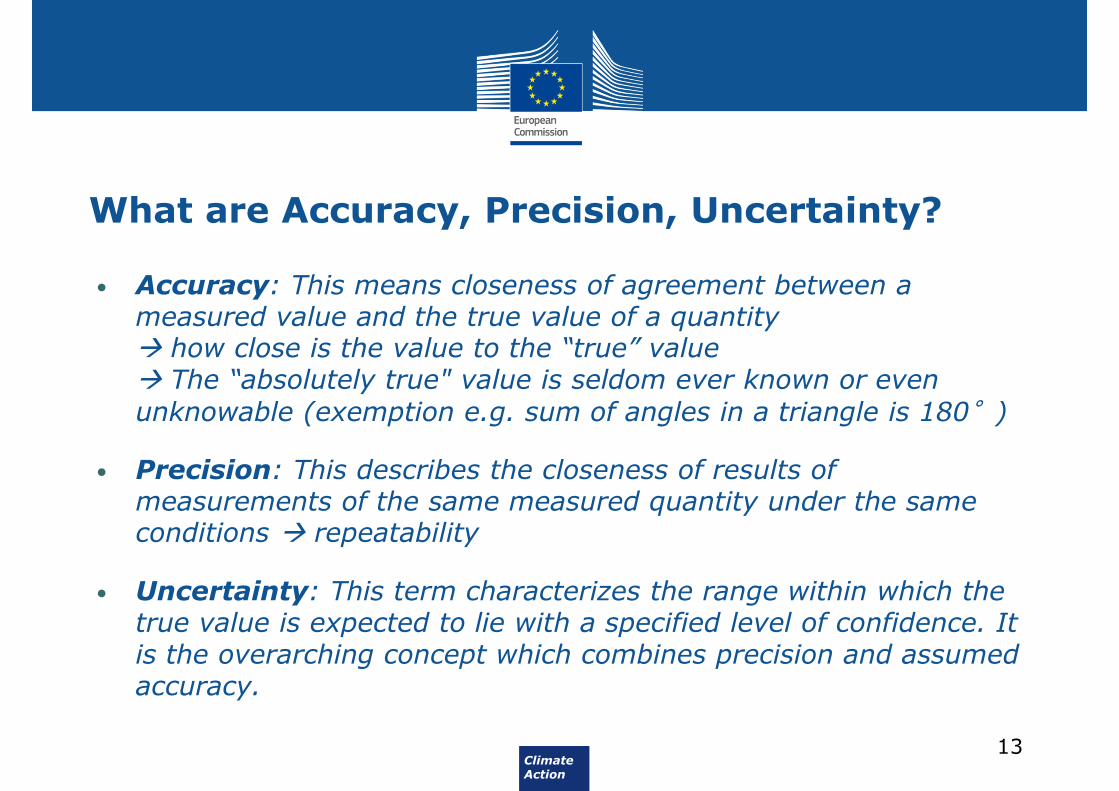
What are Accuracy, Precision, Uncertainty?
• Accuracy: This means closeness of agreement between a measured value and the true value of a quantity� how close is the value to the “true” value� The “absolutely true" value is seldom ever known or even
unknowable (exemption e.g. sum of angles in a triangle is 180°)
• Precision: This describes the closeness of results of measurements of the same measured quantity under the same conditions � repeatability
• Uncertainty: This term characterizes the range within which the true value is expected to lie with a specified level of confidence. It is the overarching concept which combines precision and assumed accuracy.

Climate Action
14
What is Uncertainty?

Climate Action
15
The “GUM”
Evaluation of measurement data — Guide to the expression ofuncertainty in measurement (JCGM 100:2008)
Climate Action
16
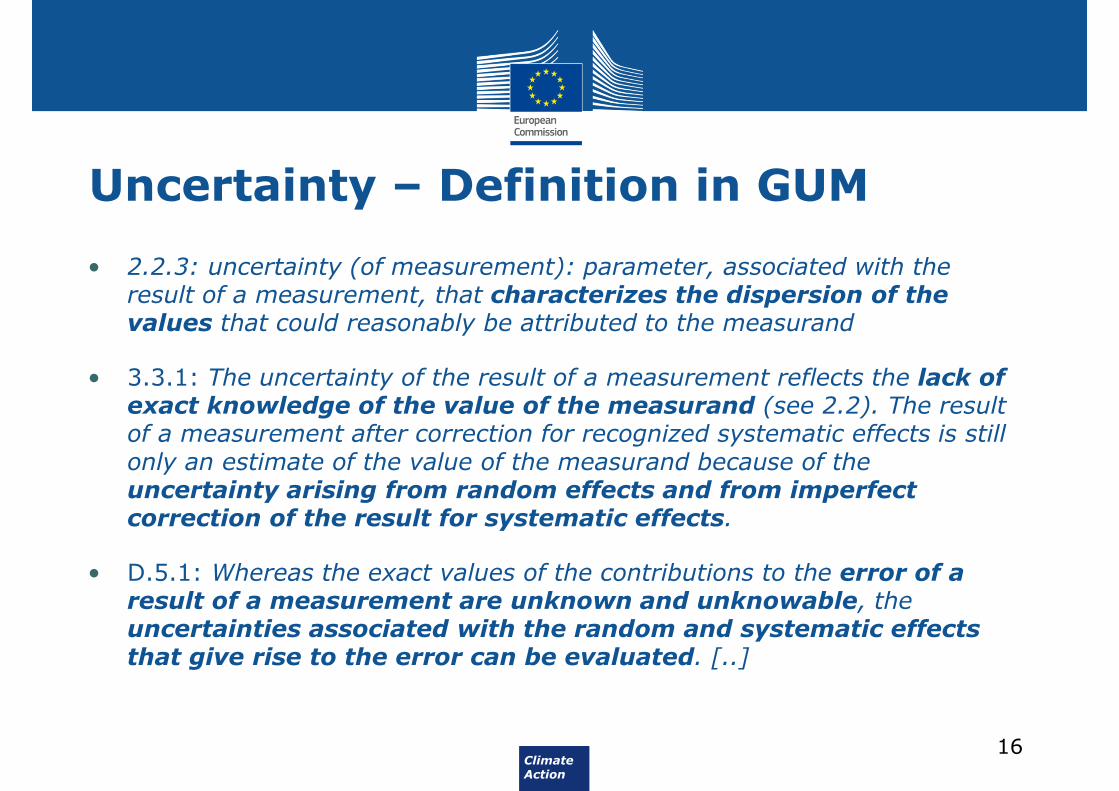
Uncertainty – Definition in GUM
• 2.2.3: uncertainty (of measurement): parameter, associated with the result of a measurement, that characterizes the dispersion of the values that could reasonably be attributed to the measurand
• 3.3.1: The uncertainty of the result of a measurement reflects the lack of exact knowledge of the value of the measurand (see 2.2). The result of a measurement after correction for recognized systematic effects is still only an estimate of the value of the measurand because of the uncertainty arising from random effects and from imperfect correction of the result for systematic effects.
• D.5.1: Whereas the exact values of the contributions to the error of a result of a measurement are unknown and unknowable, the uncertainties associated with the random and systematic effects that give rise to the error can be evaluated. [..]

Climate Action
17

Climate Action
18
Sources of Uncertainty – GUM
3.3.2: In practice, there are many possible sources of uncertainty in a measurement, including:• incomplete definition of the measurand;
• imperfect realization of the definition of the measurand;
• nonrepresentative sampling — the sample measured may not represent the defined measurand;
• inadequate knowledge of the effects of environmental conditions on the measurement or imperfect measurement of environmental conditions;
• personal bias in reading analogue instruments;
• finite instrument resolution or discrimination threshold;
• inexact values of measurement standards and reference materials;
• inexact values of constants and other parameters obtained from external sources and used in the data-reduction algorithm;
• approximations and assumptions incorporated in the measurement method and procedure;
• variations in repeated observations of the measurand under apparently identical conditions.
Climate Action
19
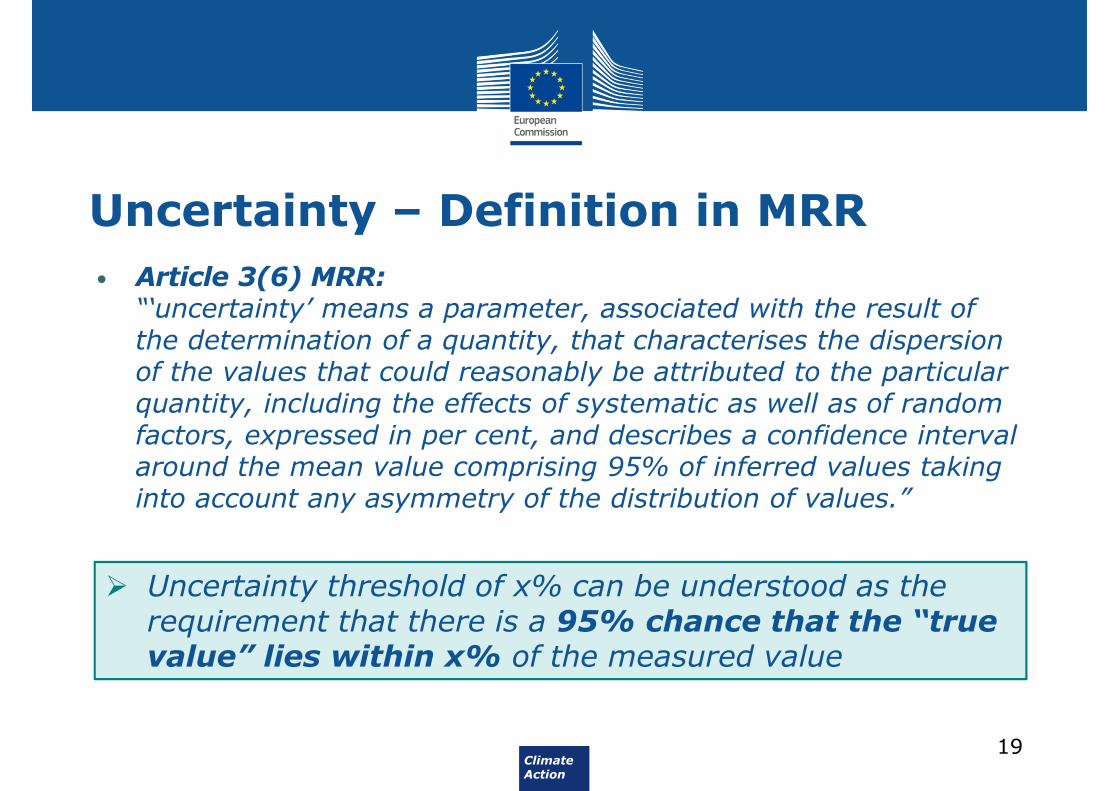
Uncertainty – Definition in MRR
• Article 3(6) MRR: “‘uncertainty’ means a parameter, associated with the result of the determination of a quantity, that characterises the dispersion of the values that could reasonably be attributed to the particular quantity, including the effects of systematic as well as of random factors, expressed in per cent, and describes a confidence interval around the mean value comprising 95% of inferred values taking into account any asymmetry of the distribution of values.”
� Uncertainty threshold of x% can be understood as the requirement that there is a 95% chance that the “true value” lies within x% of the measured value
Climate Action
20
Uncertainty – What it means
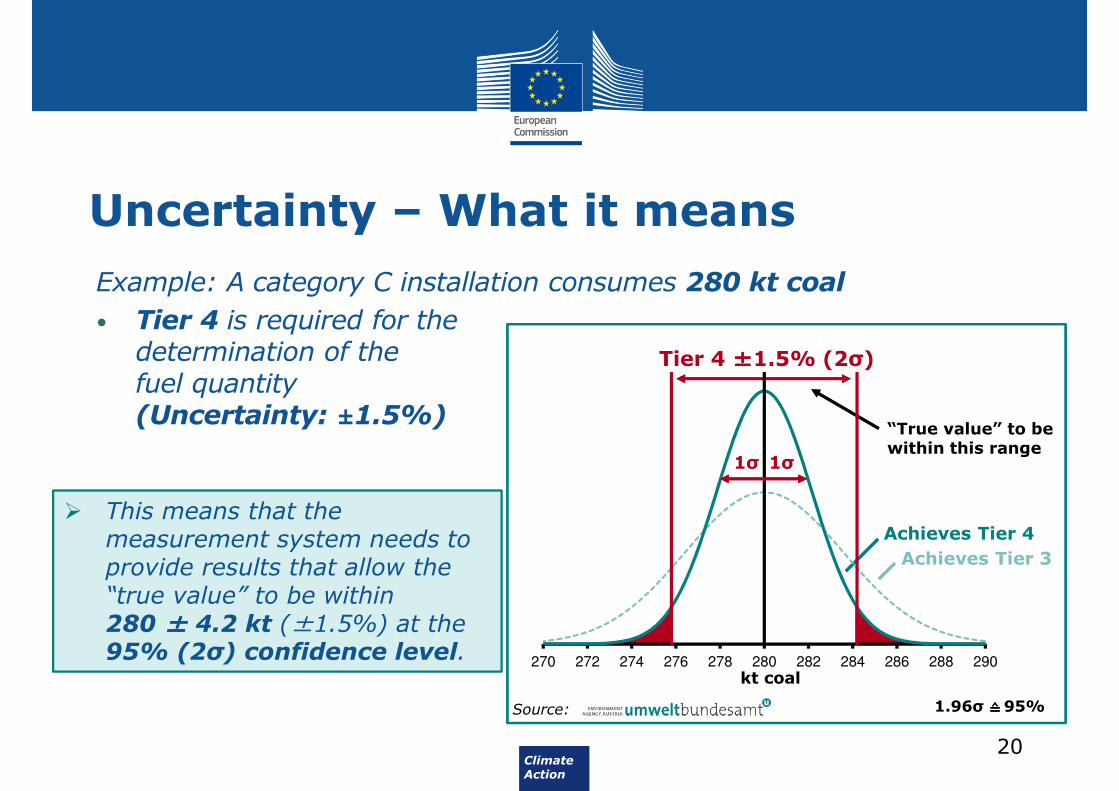
Example: A category C installation consumes 280 kt coal
• Tier 4 is required for the determination of the fuel quantity (Uncertainty: ±1.5%)
kt coal
Tier 4 ±±±±1.5% (2σ)
Source: 1.96σ ≙ ≙ ≙ ≙ 95%
Achieves Tier 4
Achieves Tier 3
“True value” to bewithin this range
� This means that the measurement system needs to provide results that allow the “true value” to be within 280 ±±±± 4.2 kt (±1.5%) at the 95% (2σ) confidence level.
270 272 274 276 278 280 282 284 286 288 290
1σ1σ
Climate Action
21
Uncertainty of emissions
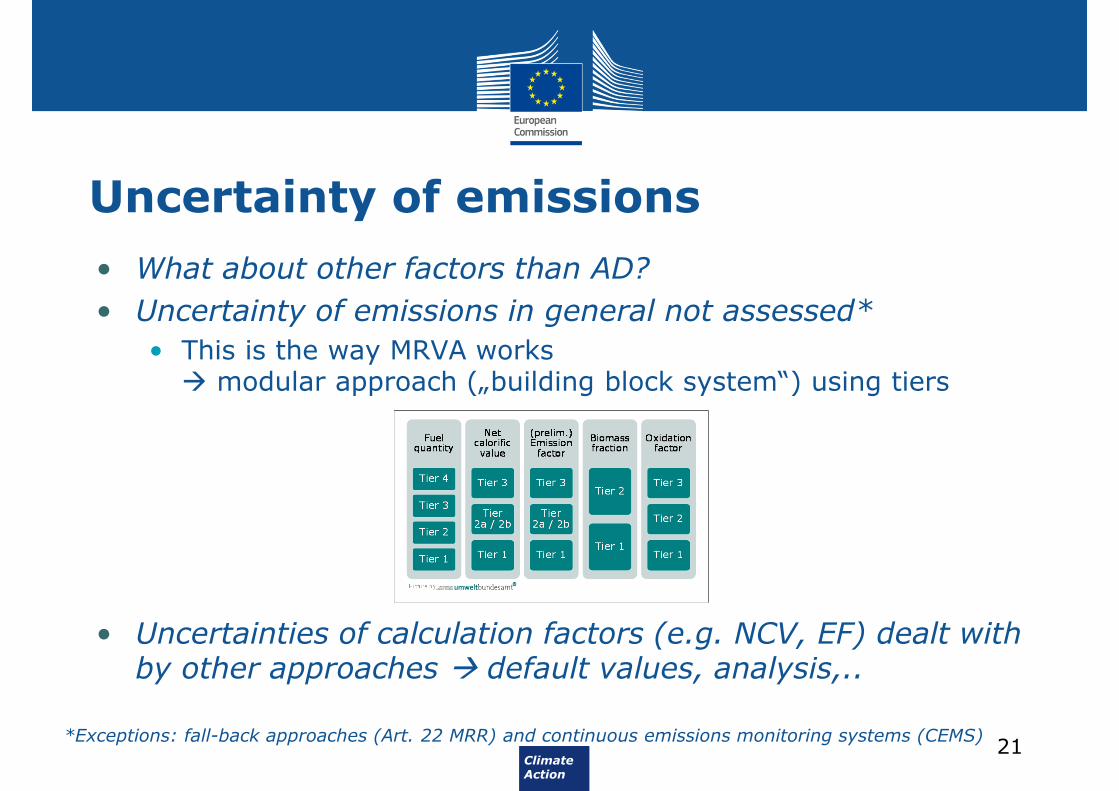
• What about other factors than AD?
• Uncertainty of emissions in general not assessed*
• This is the way MRVA works� modular approach („building block system“) using tiers
• Uncertainties of calculation factors (e.g. NCV, EF) dealt withby other approaches � default values, analysis,..
*Exceptions: fall-back approaches (Art. 22 MRR) and continuous emissions monitoring systems (CEMS)
Climate Action
22
Where to obtain uncertainties from?
• In princple, uncertainty has to be demonstrated usingappropriate standards (e.g. GUM)
• BUT, MRVA allows for simplifications, where appropriate:
• Using maximum permissible error in service, e.g. as specified in relevant national legal metrological control (NLMC), where available
• based on the uncertainty from other sources (e.g. calibration), if the measuring instrument is used properly

Climate Action
23
Next steps
• What is NLMC, what is regulated by it and to what extent is itharmonised across the EU?
• What is the maximum permissible error and where is it stated?
• What is calibration and what is (metrological) verification? When, how and by whom are they to be done?
• How is the relevant uncertainty obtained and where is it stated?
� Answers are given in the next presentation
Climate Action
Questions?
Where to find more information?
Regulation No. 601/2012 (MRR)http://eur-lex.europa.eu/legal-content/EN/TXT/?qid=1462274244220&uri=CELEX:02012R0601-20140730
Guidance Documents on European Commission’s websitehttp://ec.europa.eu/clima/policies/ets/monitoring/documentation_en.htmin particular Guidance Documents 4 and 4a

Presentation: Calibration and legal metrological control
by Jeroen Rommerts National legal metrological control – what is it? How is it organised in
the MS?
Calibration and (metrological) verification
Where to obtain evidence for uncertainty from?
State of play regarding harmonisation of calibration/verification across Member States
Implications of MID and NAWI Directive
8

Legal metrology in Europe
Jeroen Rommerts
078 633 23 55
legal – terms – MPE – uncertainty
• intro
• what is Legal Metrology
instruments – applications – markings – tolerances
• terminology: what is what
calibration – (legal) verification – adjustment
• where are ‘sources’ of uncertainty
• MID and NAWI-Directive
• questions
Plan
2
Legal metrology in Europe May 2016

May 2016 Legal metrology in Europe
NMi Notified Body (0122) for
MID and NAWI Directive.
Accreditations:
- ISO/IEC 17021
system certification
- ISO/IEC 17020
product certification
- ISO/IEC 17025
measuring & calibration
Representing Netherlands
in WELMEC, OIML, NEN
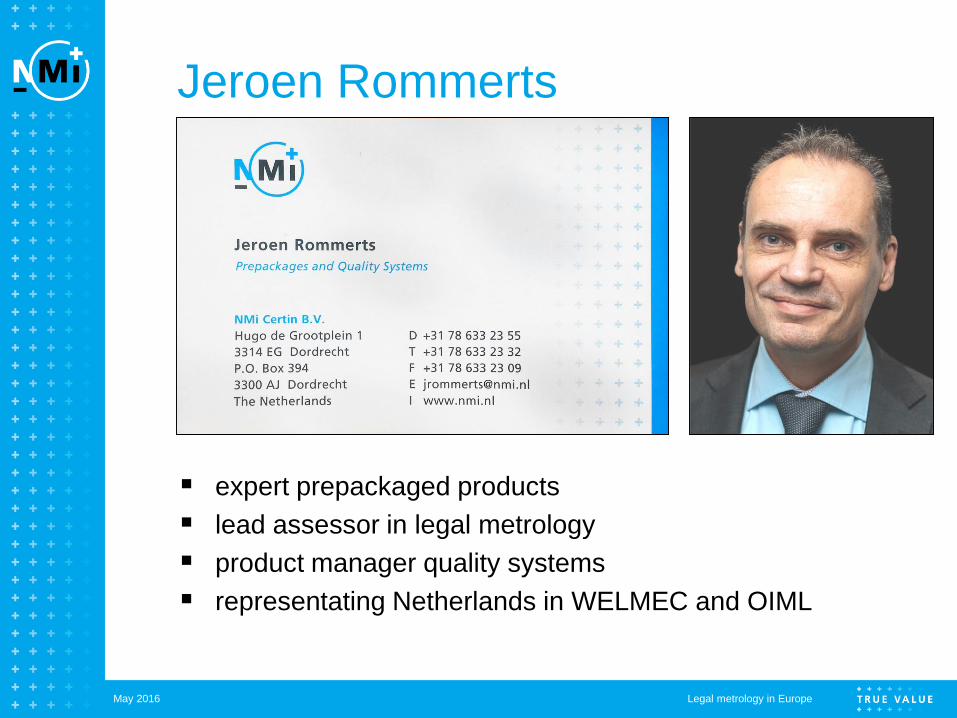
Jeroen Rommerts
4
expert prepackaged products
lead assessor in legal metrology
product manager quality systems
representating Netherlands in WELMEC and OIML
Legal metrology in Europe May 2016
what is ‘legal metrology’
Legal metrology in Europe May 2016
Legal metrology is the application of legal
requirements to measurements and measuring
instruments.
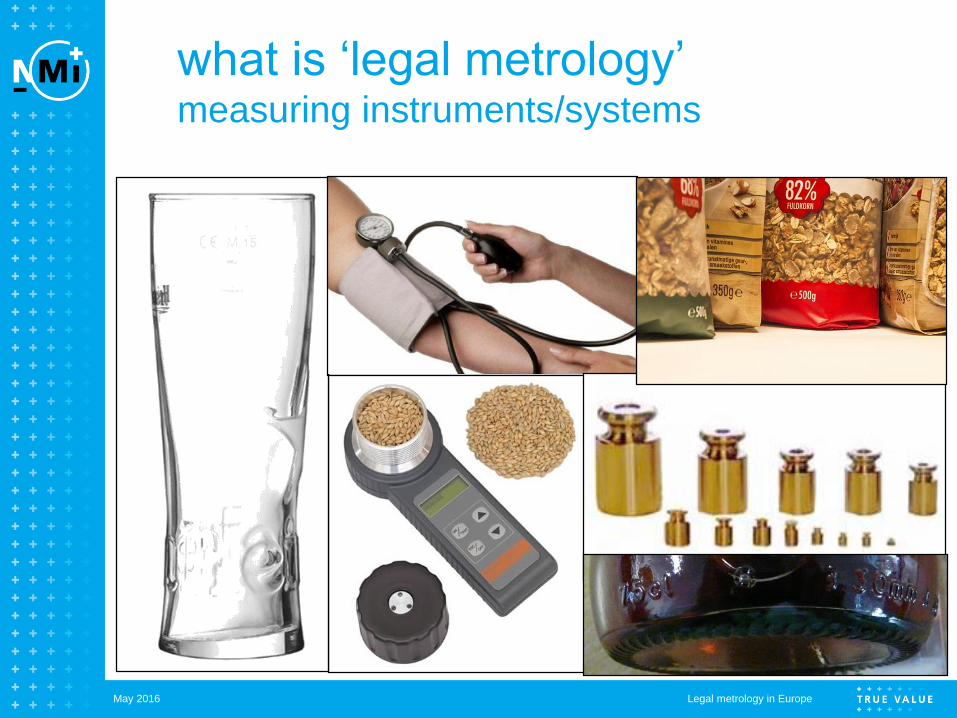
Legal metrology in Europe May 2016
what is ‘legal metrology’ measuring instruments/systems
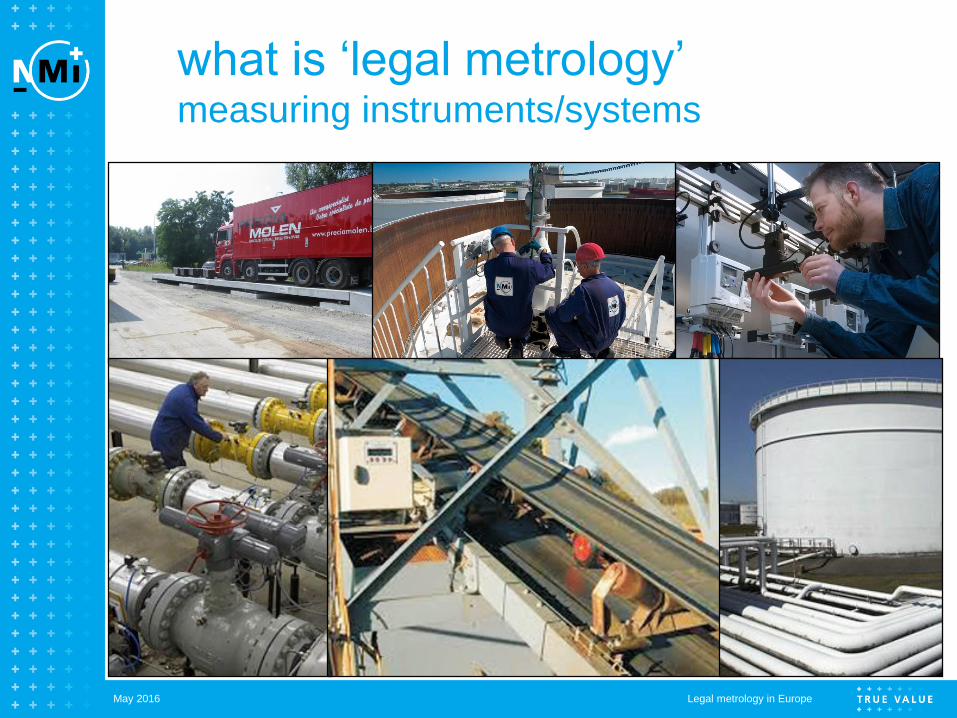
Legal metrology in Europe May 2016
what is ‘legal metrology’ measuring instruments/systems
Legal metrology in Europe May 2016
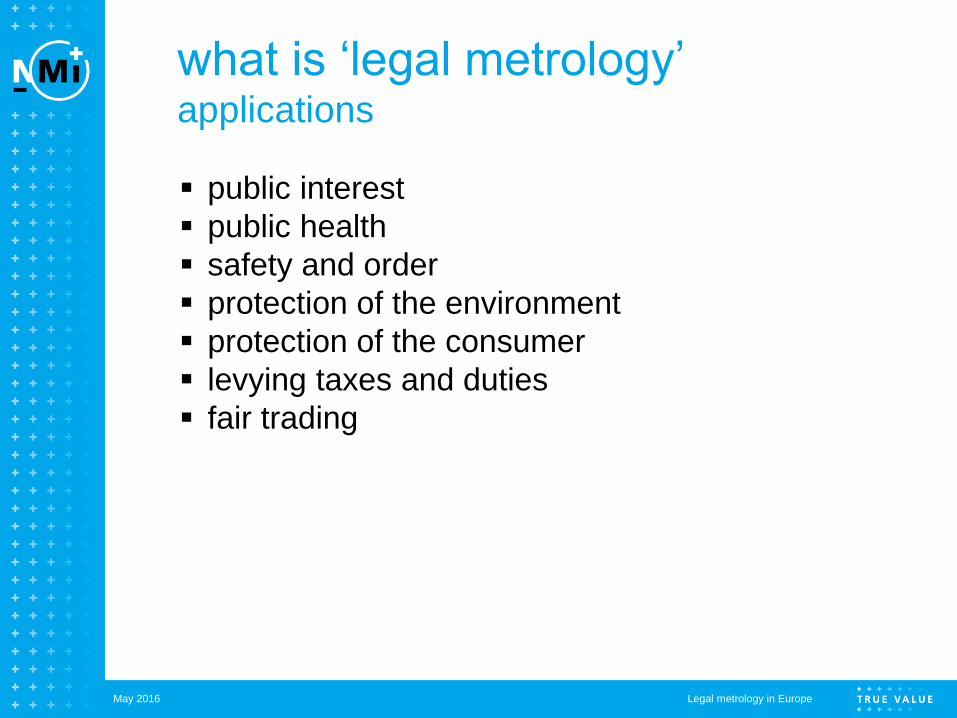
what is ‘legal metrology’ applications
public interest
public health
safety and order
protection of the environment
protection of the consumer
levying taxes and duties
fair trading
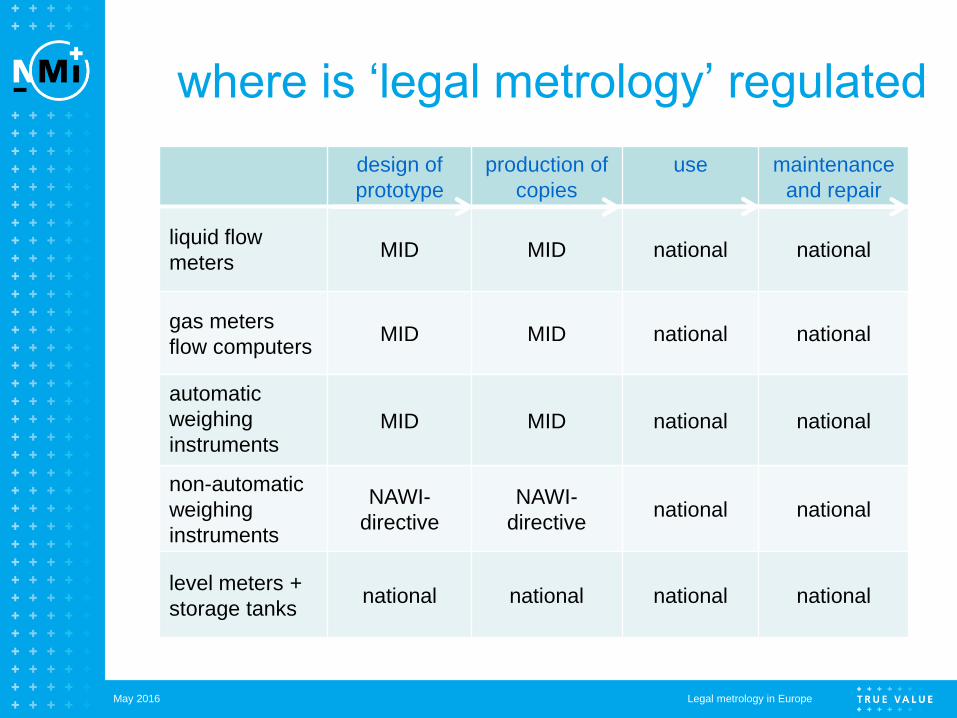
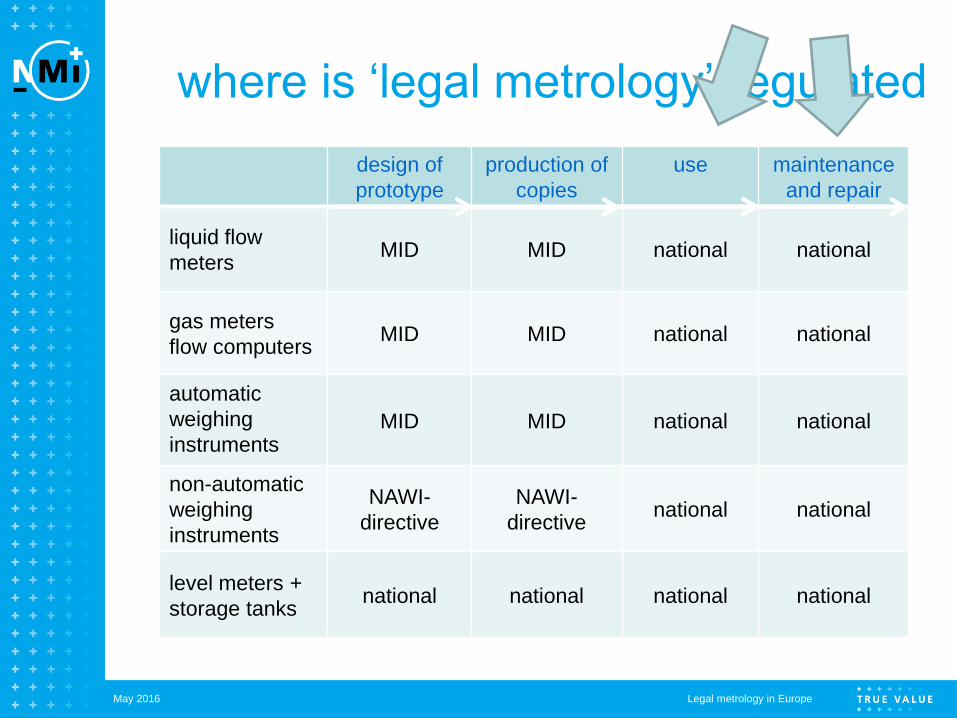
where is ‘legal metrology’ regulated
Legal metrology in Europe May 2016
design of
prototype
production of
copies
use maintenance
and repair
liquid flow
meters MID MID national national
gas meters
flow computers MID MID national national
automatic
weighing
instruments MID MID national national
non-automatic
weighing
instruments
NAWI-
directive
NAWI-
directive national national
level meters +
storage tanks national national national national

verification marks
Legal metrology in Europe May 2016
• Measuring Instruments Directive
• NAWI-Directive
• national metrological markings
M 16 0122
0122 15 M 16 0122
and more…
notified body number
(see NANDO)
year of manufacture
‘M’ for ‘metrology

Maximum Permissible Error (MPE)
12
Legal metrology in Europe May 2016
Extreme value of measurement error, with respect to a
standard, permitted for a given measurement, measuring
instrument, or measuring system.
MPE
standard

Maximum Permissible Error
• MID 2014/32/EU
– gasmeters/flow computers: annex IV MI-002
– residential electricity meters: annex V MI-003
– residential heat meters: annex VI MI-003
– non-water liquid flow meters: annex VII MI-005
– automatic weighing: annex VIII MI-006
• NAWI Directive 2014/31/EU
– non-automatic weighing instruments: annex I
• national legislation
…
13
Legal metrology in Europe May 2016

the data plate / sheet
What information must be on or
acommpany the instrument
– product to be measured
– class
– MPE
– envoriment (temperature / pressure range)
– speed / flow rate range
– measured quantity range
– verification mark
– …
14
Legal metrology in Europe May 2016
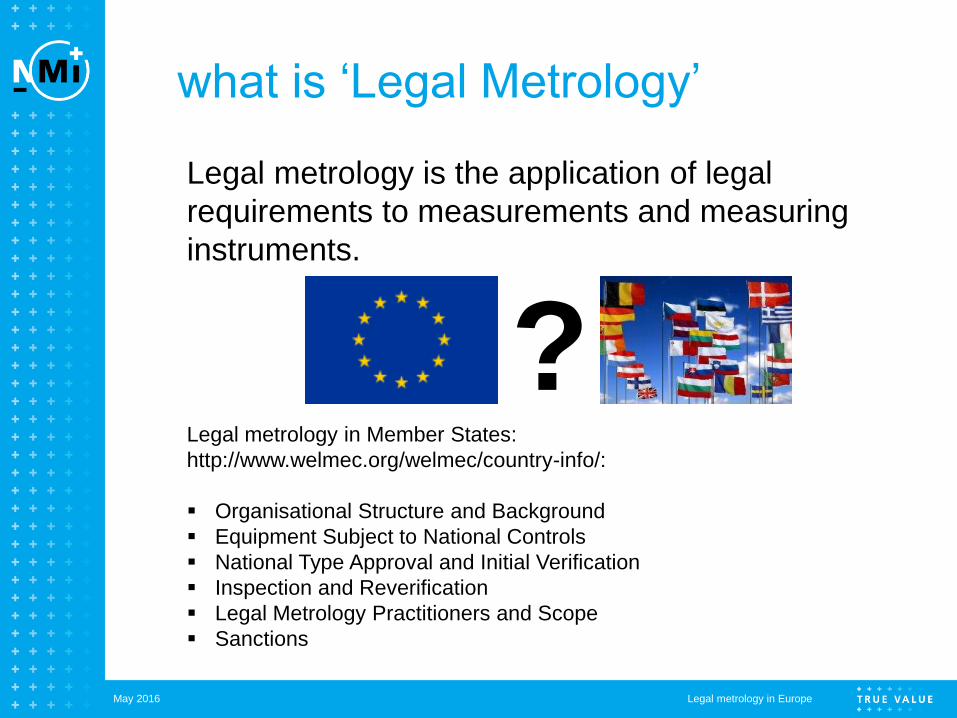
what is ‘Legal Metrology’
Legal metrology in Europe May 2016
Legal metrology is the application of legal
requirements to measurements and measuring
instruments.
Legal metrology in Member States:
http://www.welmec.org/welmec/country-info/:
Organisational Structure and Background
Equipment Subject to National Controls
National Type Approval and Initial Verification
Inspection and Reverification
Legal Metrology Practitioners and Scope
Sanctions
?

terminology
• calibration: …
• verification: …
– voluntary
– legal: …
– periodic re-verification: …
• inspection: …
• adjustment: …
16
Legal metrology in Europe May 2016

terminology calibration
17
uncertainty uncertainty
uncertainty of
measurement
standard measuring instrument
deviation
responsible result
user certificate
Legal metrology in Europe May 2016
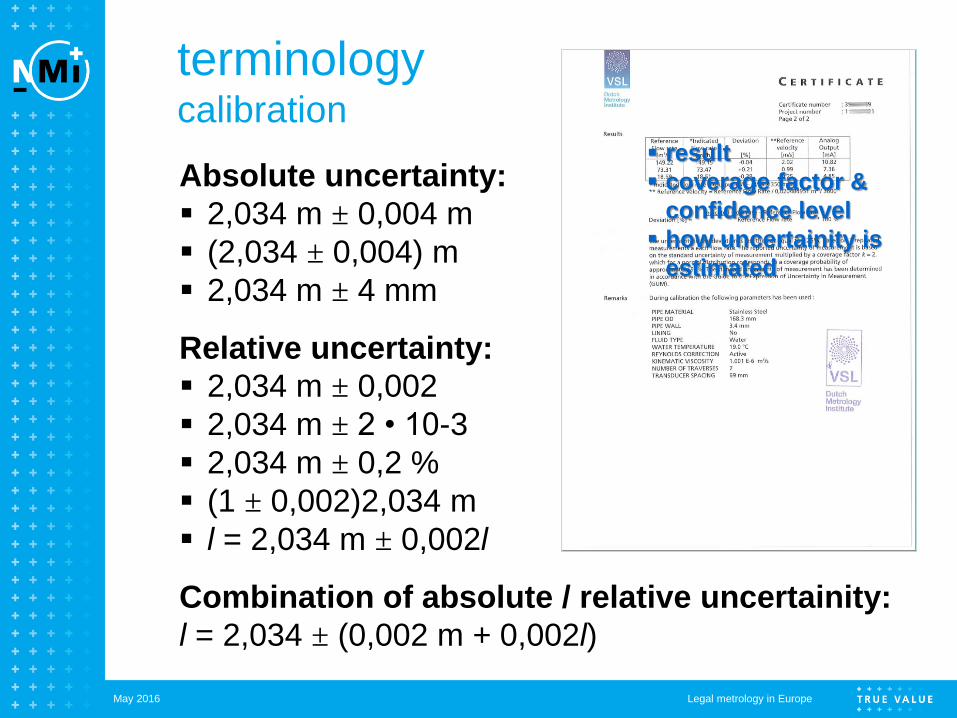
terminology calibration
18
Absolute uncertainty:
2,034 m ± 0,004 m
(2,034 ± 0,004) m
2,034 m ± 4 mm
Relative uncertainty:
2,034 m ± 0,002
2,034 m ± 2 • 10-3
2,034 m ± 0,2 %
(1 ± 0,002)2,034 m
l = 2,034 m ± 0,002l
Combination of absolute / relative uncertainity:
l = 2,034 ± (0,002 m + 0,002l)
result
coverage factor &
confidence level
how uncertainity is
estimated
Legal metrology in Europe May 2016

terminology (voluntary) validation
19
standard measuring instrument
≤ legal tolerance
deviation
responsible result
user data sheet plate
Legal metrology in Europe May 2016
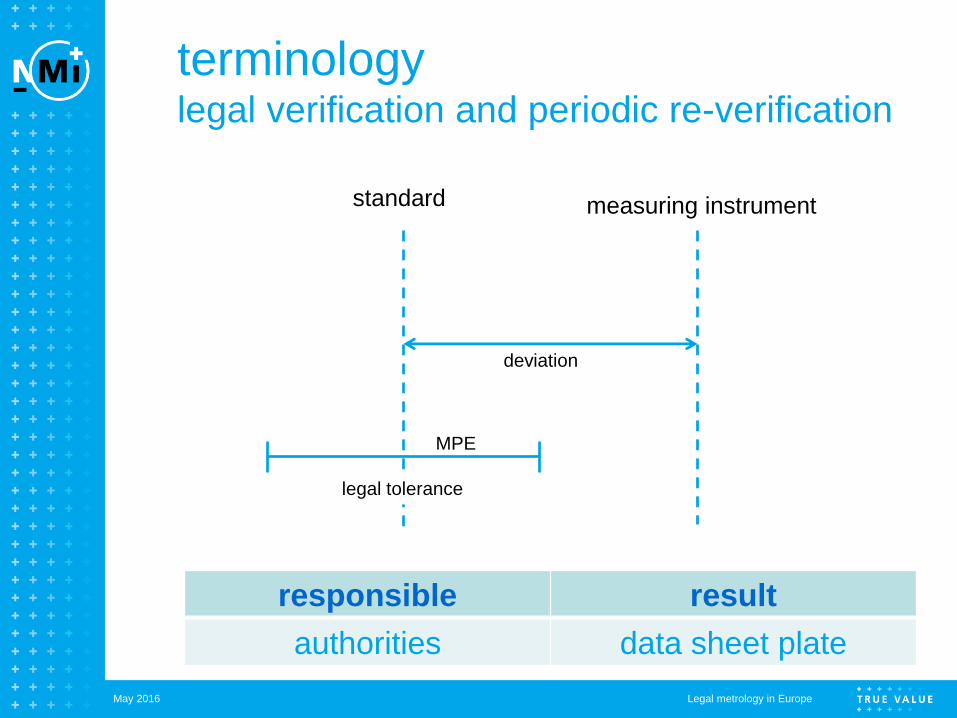
terminology legal verification and periodic re-verification
20
standard measuring instrument
legal tolerance
deviation
MPE
responsible result
authorities data sheet plate
Legal metrology in Europe May 2016

terminology inspection
21
standard measuring instrument
tolerance
deviation
MPE
responsible result
authorities data sheet plate
legal tolerance
Legal metrology in Europe May 2016

allowed errors in service
Legal metrology in Europe May 2016
equal MPE than MID: ‘=‘ larger MPE than MID: ‘+’ source: www.welmec.org
find MS contact details: http://www.welmec.org/welmec/country-info/
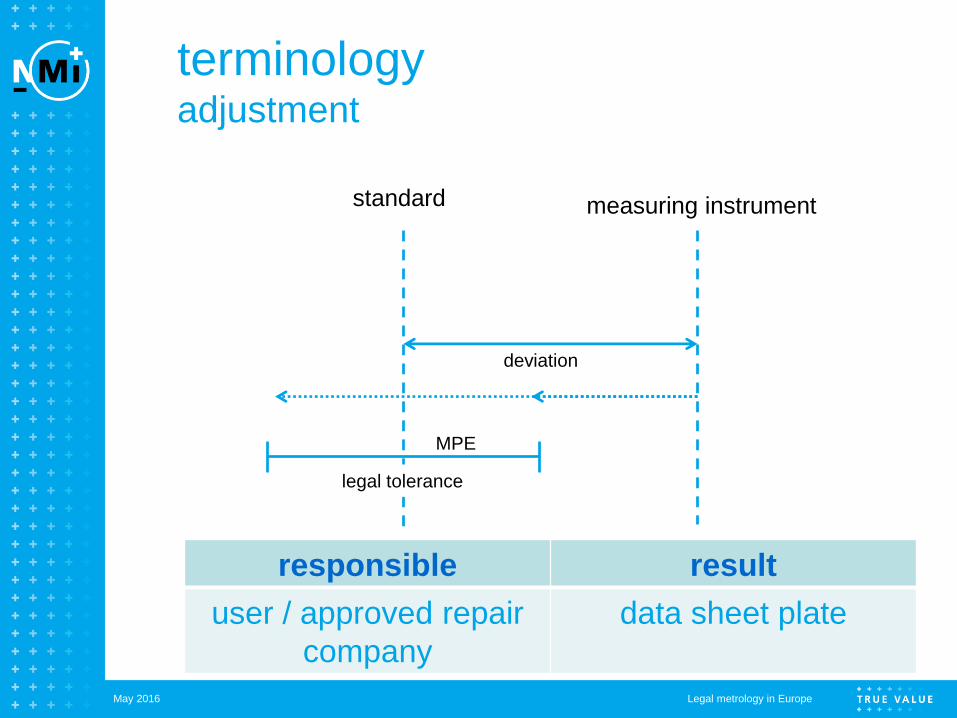
terminology adjustment
23
standard measuring instrument
deviation
MPE
responsible result
user / approved repair
company
data sheet plate
legal tolerance
Legal metrology in Europe May 2016

terminology summary
24
what is it result responsible uncertainty
calibration establish
deviation!
value ±
uncertainty
user certificate
verification deviation
within a
tolerance?
yes / no
marking /
data plate
user tolerance
(often: MPE)
‘legal’ verification at
‘first use’
deviation
within MPE
marking /
data plate
manufacturer MPE
‘legal’ periodical re-
verification
deviation
within in-
service
tolerance?
yes / no
marking /
data plate
user /
authorities
‘in service’
tolerance
‘legal’ re-verification
after repair
deviation
within MPE
MPE user / repair
company
MPE
‘legal’ inspection deviation
within in-
service
tolerance?
yes / no
marking /
data plate
authorities ‘in service’
tolerance
Legal metrology in Europe May 2016
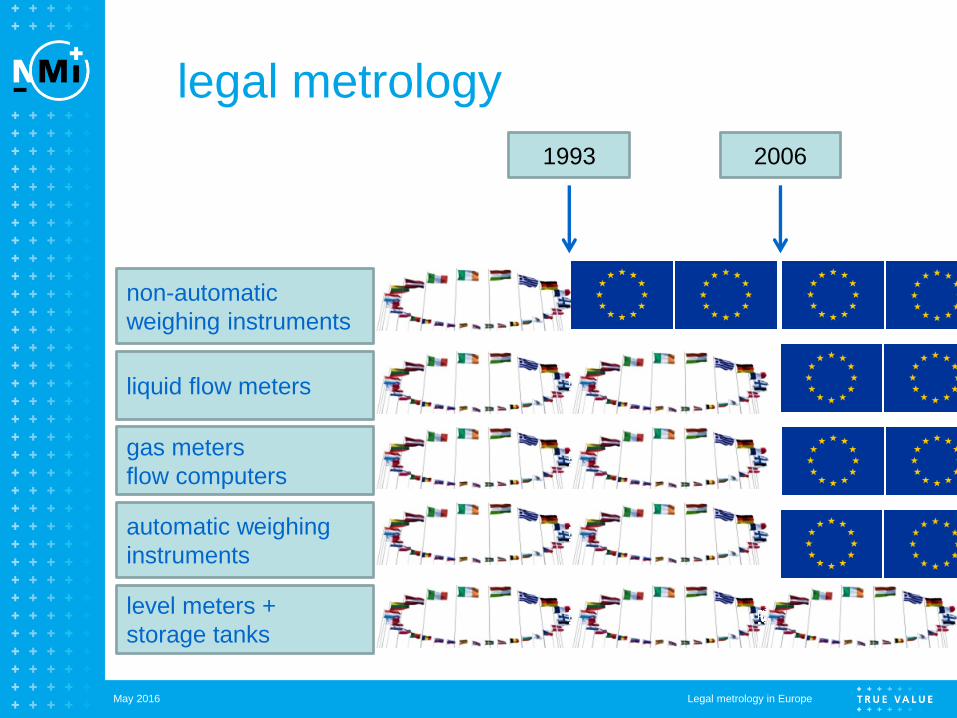
legal metrology
Legal metrology in Europe May 2016
1993 2006
liquid flow meters
gas meters
flow computers
automatic weighing
instruments
non-automatic
weighing instruments
level meters +
storage tanks
design prototype
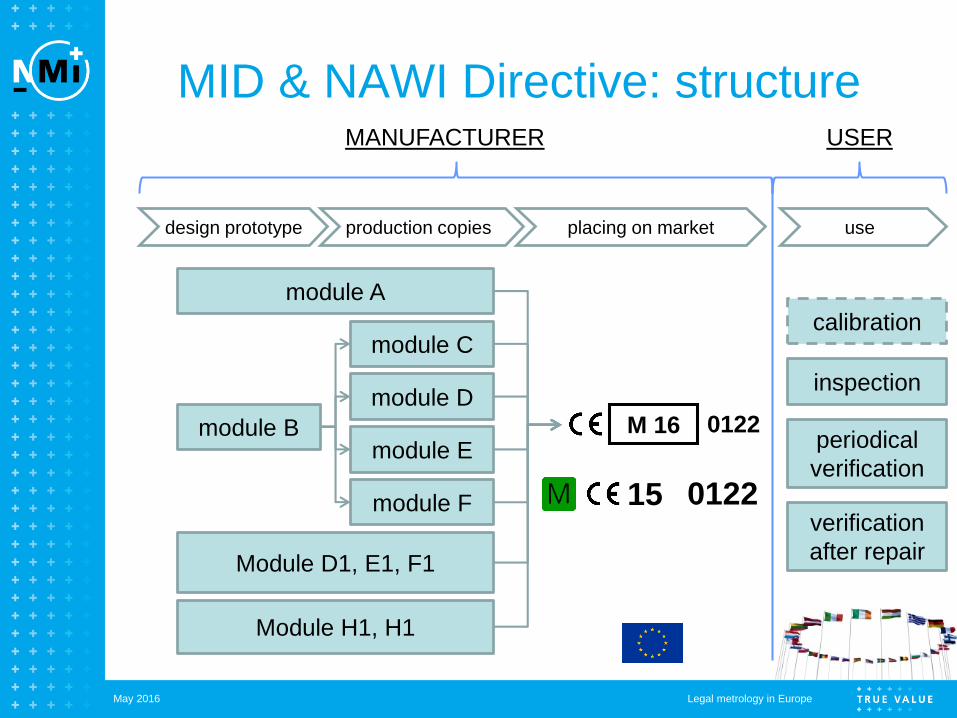
MID & NAWI Directive: structure
Legal metrology in Europe May 2016
module A
module B
module C
module D
module E
module F
Module D1, E1, F1
Module H1, H1
MANUFACTURER
production copies placing on market use
USER
inspection
calibration
periodical
verification
verification
after repair
M 16 0122
0122 15

MID & NAWI Directive: scope
Legal metrology in Europe May 2016
instrument modules watermeters B+F, B+D, H1 gasmeters B+F, B+D, H1 kWh meters B+F, B+D, H1 heatmeters B+F, B+D, H1 liquidmeters B+F, B+D, H1, G automatic weighing B+F, B+D, H1, G (B+E, D1,F1) taximeters B+F, B+D, H1 material measures A1, F1, D1, E1, B+E, B+D,H dimensional B+F, B+D, H1, G (F1, D1, E1, B+E ,H) exhaust gas analysers B+F, B+D, H1
non-automatic weighing B+D, D1, B+F, F1, G
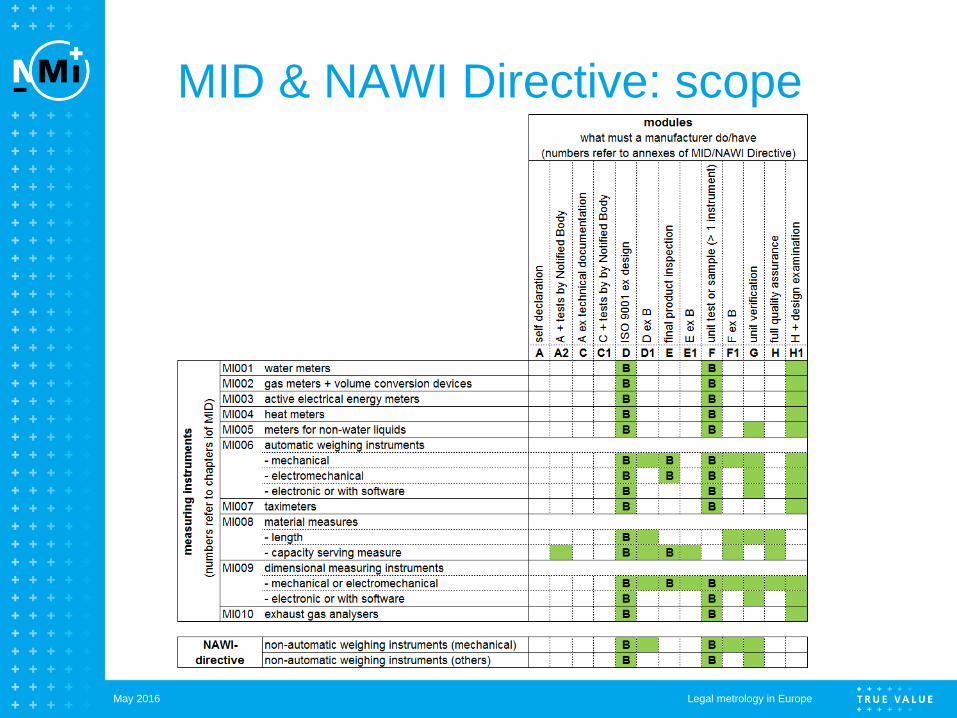
MID & NAWI Directive: scope
Legal metrology in Europe May 2016

conclusion
Legal metrology in Europe May 2016
no general ‘structure’ in member
states (see WELMEC.org)
Measuring Instruments Directive and
NAWI Directive: bringing on the
market + putting into use
measuring instruments ‘in use’,
inspection periodic re-verification,
verification after repair: national
(contacts: see WELMEC.org)
check data plate or data sheet for
MPE measurement uncertainty

questions
Legal metrology in Europe May 2016


Presentation: How to demonstrate compliance
by Christian Heller A “step-by-step guide” on how to demonstrate compliance
Measuring instruments under operator's or trading partner's control
Introduction to uncertainty propagation laws
Examples
9

Climate Action
How to demonstrate compliance Christian HELLER M&R Training Event on Uncertainty Assessment Brussels, 31 May 2016
Climate Action
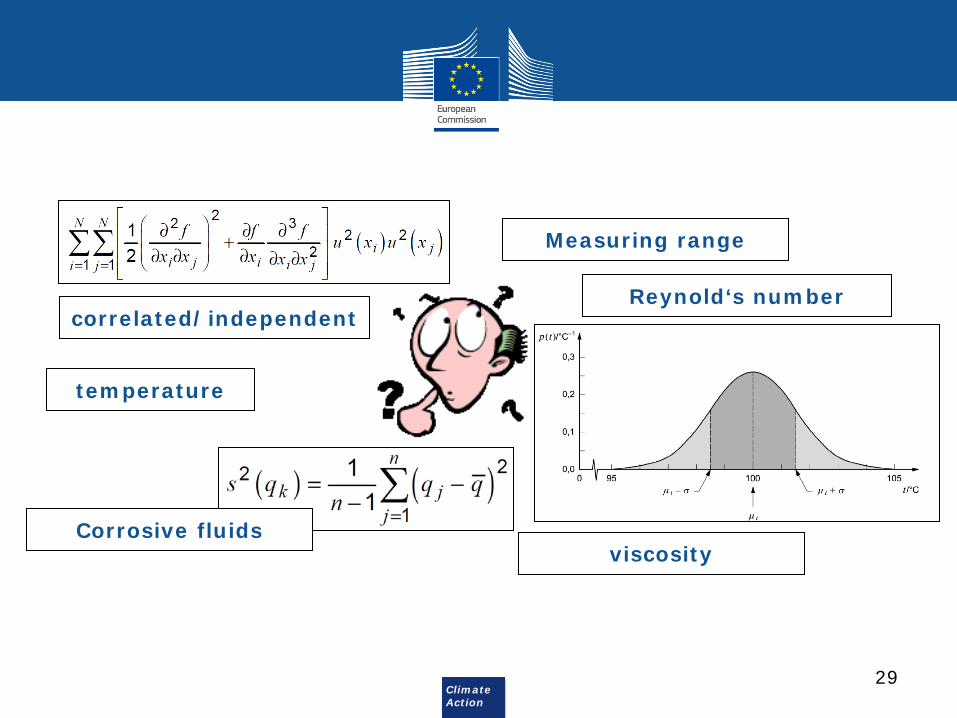
29
temperature
correlated/independent
Measuring range
Reynold‘s number
Corrosive fluids viscosity
Climate Action
30
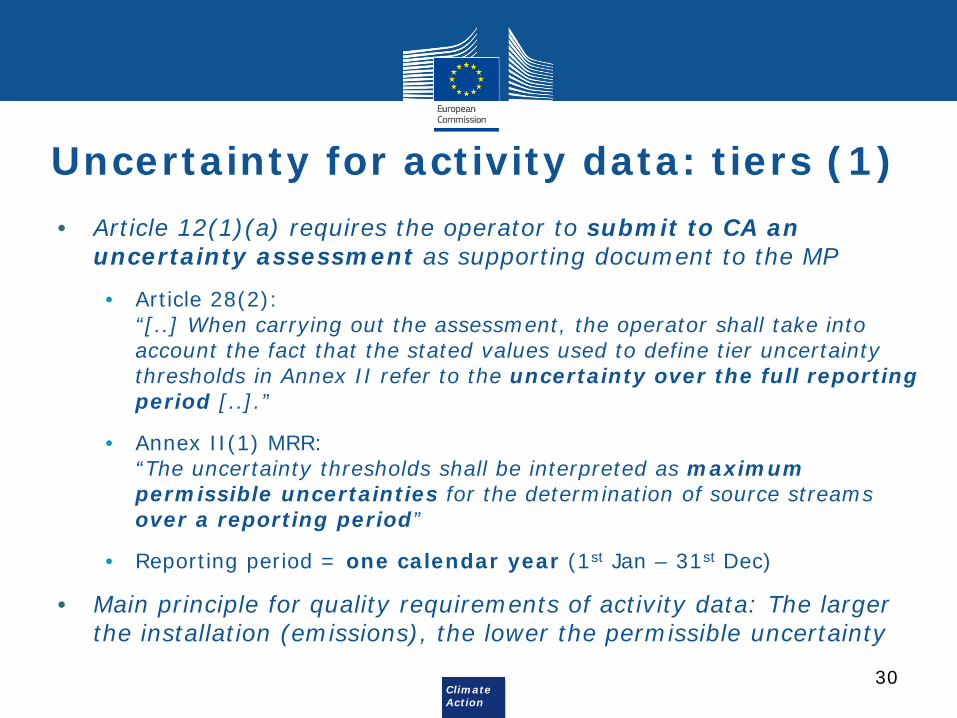
Uncertainty for activity data: tiers (1) • Article 12(1)(a) requires the operator to submit to CA an
uncertainty assessment as supporting document to the MP
• Article 28(2): “[..] When carrying out the assessment, the operator shall take into account the fact that the stated values used to define tier uncertainty thresholds in Annex II refer to the uncertainty over the full reporting period [..].”
• Annex II(1) MRR: “The uncertainty thresholds shall be interpreted as maximum permissible uncertainties for the determination of source streams over a reporting period”
• Reporting period = one calendar year (1st Jan – 31st Dec)
• Main principle for quality requirements of activity data: The larger the installation (emissions), the lower the permissible uncertainty

Climate Action
31
Uncertainty for activity data: tiers (2) • “Over full reporting period“ implies that also
ongoing QA/QC measures in service are of relevance: • Art 28(1)(b): operator to ensure at least once per year, and after each
calibration of MIs, that the calibration results multiplied by a conservative adjustment factor based on an appropriate time series of previous calibrations for taking into account the effect of uncertainty in service, are compared with the relevant uncertainty thresholds.
• Art 58(3)(a): Quality assurance to be laid down in written procedures summary of this procedure part of the monitoring plan
• Art. 59(1): Operators are required to “ensure that all relevant measuring equipment is calibrated, adjusted and checked at regular intervals including prior to use, and checked against measurement standards traceable to international measurement standards, where available, in accordance with the requirements of this Regulation and proportionate to the risks identified.”
Uncertainty assessment has to take into account QA/QC in service
Climate Action
32
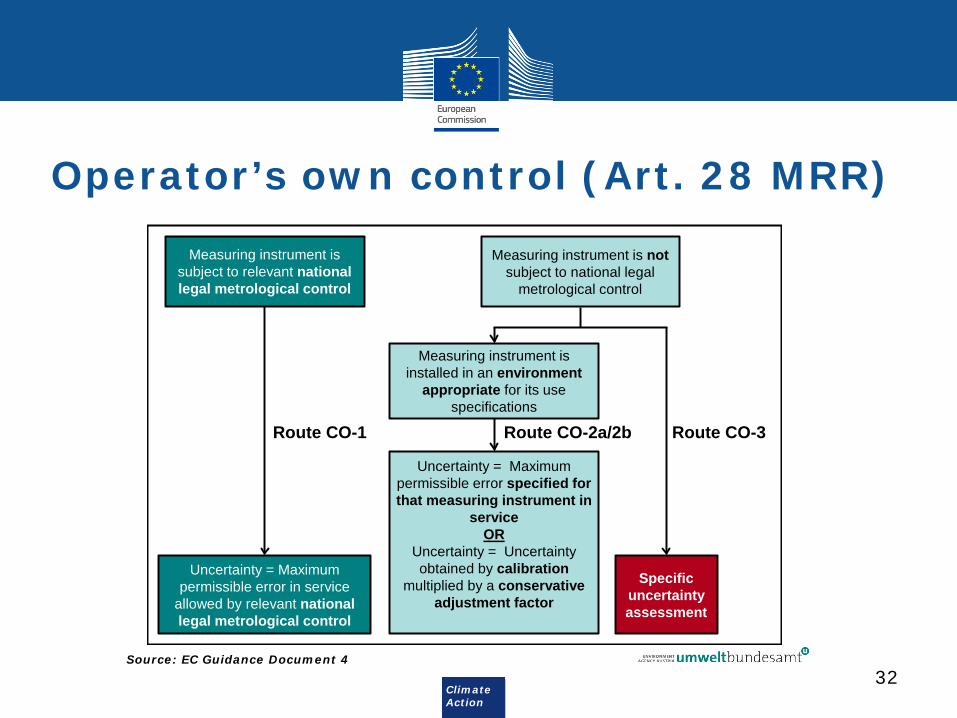
Measuring instrument is subject to relevant national legal metrological control
Measuring instrument is notsubject to national legal
metrological control
Uncertainty = Maximum permissible error in service
allowed by relevant national legal metrological control
Specific uncertainty assessment
Measuring instrument is installed in an environment
appropriate for its use specifications
Uncertainty = Maximum permissible error specified for that measuring instrument in
serviceOR
Uncertainty = Uncertainty obtained by calibration
multiplied by a conservative adjustment factor
Route CO-1 Route CO-2a/2b Route CO-3
Operator’s own control (Art. 28 MRR)
Source: EC Guidance Document 4
Climate Action
33
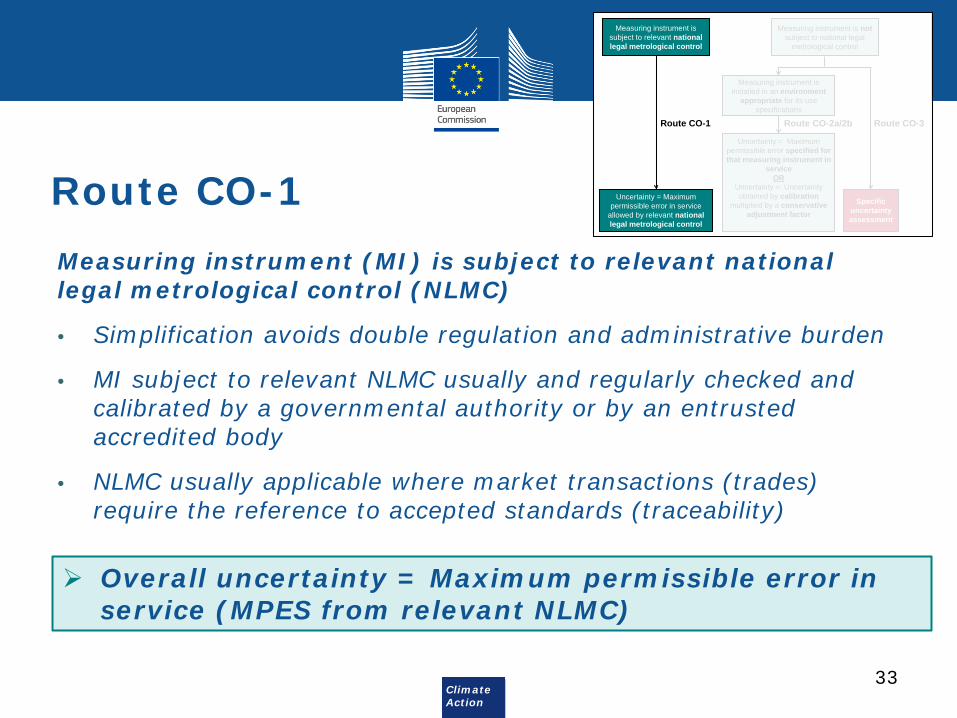
Route CO-1 Measuring instrument (MI) is subject to relevant national legal metrological control (NLMC)
• Simplification avoids double regulation and administrative burden
• MI subject to relevant NLMC usually and regularly checked and calibrated by a governmental authority or by an entrusted accredited body
• NLMC usually applicable where market transactions (trades) require the reference to accepted standards (traceability)
Overall uncertainty = Maximum permissible error in service (MPES from relevant NLMC)
Measuring instrument is subject to relevant national legal metrological control
Measuring instrument is notsubject to national legal
metrological control
Uncertainty = Maximum permissible error in service
allowed by relevant national legal metrological control
Specific uncertainty assessment
Measuring instrument is installed in an environment
appropriate for its use specifications
Uncertainty = Maximum permissible error specified for that measuring instrument in
serviceOR
Uncertainty = Uncertainty obtained by calibration
multiplied by a conservative adjustment factor
Route CO-1 Route CO-2a/2b Route CO-3

Climate Action
34
Route CO-1
How to demonstrate evidence?
• The most appropriate evidence for being under NLMC is a certificate of the latest (metrological) verification/(re-)calibration of the instrument
• Alternatively, evidence (e.g. a picture) can be provided of the legal metrology label affixed to the MI
Measuring instrument is subject to relevant national legal metrological control
Measuring instrument is notsubject to national legal
metrological control
Uncertainty = Maximum permissible error in service
allowed by relevant national legal metrological control
Specific uncertainty assessment
Measuring instrument is installed in an environment
appropriate for its use specifications
Uncertainty = Maximum permissible error specified for that measuring instrument in
serviceOR
Uncertainty = Uncertainty obtained by calibration
multiplied by a conservative adjustment factor
Route CO-1 Route CO-2a/2b Route CO-3
Climate Action
35
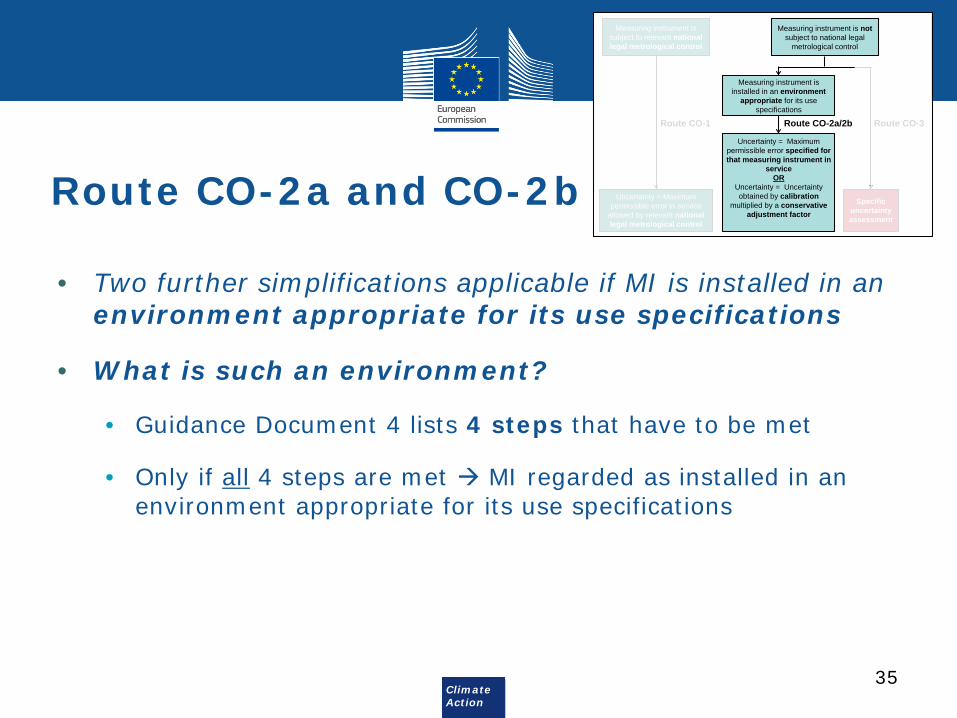
Route CO-2a and CO-2b
• Two further simplifications applicable if MI is installed in an environment appropriate for its use specifications
• What is such an environment?
• Guidance Document 4 lists 4 steps that have to be met
• Only if all 4 steps are met MI regarded as installed in an environment appropriate for its use specifications
Measuring instrument is subject to relevant national legal metrological control
Measuring instrument is notsubject to national legal
metrological control
Uncertainty = Maximum permissible error in service
allowed by relevant national legal metrological control
Specific uncertainty assessment
Measuring instrument is installed in an environment
appropriate for its use specifications
Uncertainty = Maximum permissible error specified for that measuring instrument in
serviceOR
Uncertainty = Uncertainty obtained by calibration
multiplied by a conservative adjustment factor
Route CO-1 Route CO-2a/2b Route CO-3

Climate Action
36
Appropriate environment
• Step 1: Operating conditions regarding relevant influencing parameters (e.g. flow rate range, medium, T, p,..) and maximum permissible deviations for those are available • Alternative: manufacturer declares that MI complies with an international
standard (CEN, ISO, OIML, ‘CE’ labelling,..), laying down operating conditions regarding influencing parameters.
• Step 2: Operating conditions under step 1 are met • Evidence could be provided by e.g. making a checklist of each relevant
influencing parameter • Evidence should be provided that the MI is installed appropriately
Climate Action
37
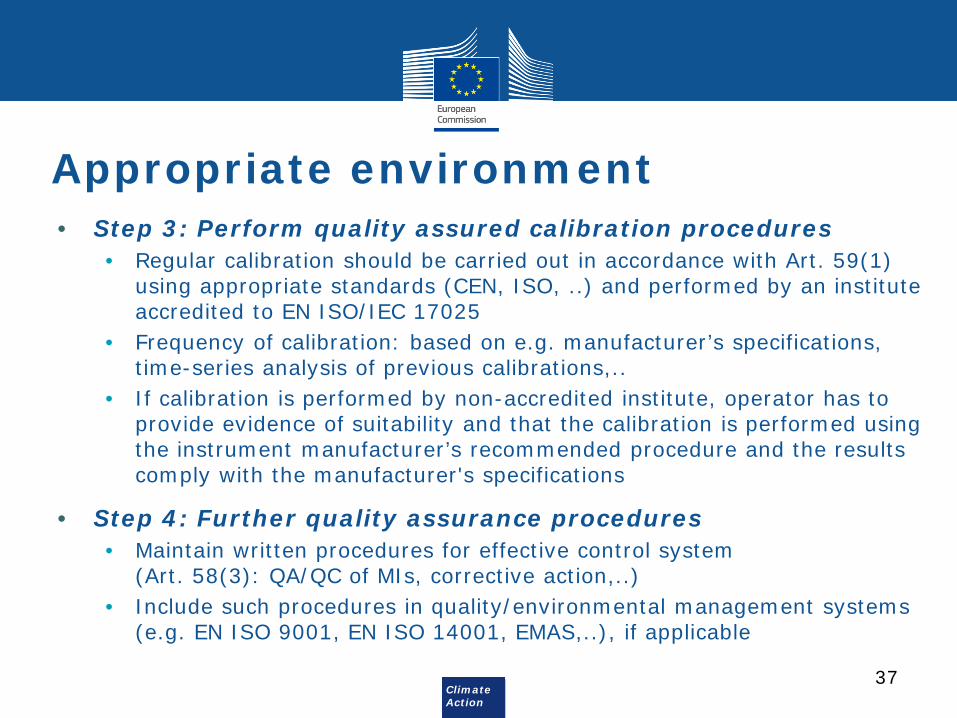
Appropriate environment • Step 3: Perform quality assured calibration procedures
• Regular calibration should be carried out in accordance with Art. 59(1) using appropriate standards (CEN, ISO, ..) and performed by an institute accredited to EN ISO/IEC 17025
• Frequency of calibration: based on e.g. manufacturer’s specifications, time-series analysis of previous calibrations,..
• If calibration is performed by non-accredited institute, operator has to provide evidence of suitability and that the calibration is performed using the instrument manufacturer’s recommended procedure and the results comply with the manufacturer's specifications
• Step 4: Further quality assurance procedures • Maintain written procedures for effective control system
(Art. 58(3): QA/QC of MIs, corrective action,..) • Include such procedures in quality/environmental management systems
(e.g. EN ISO 9001, EN ISO 14001, EMAS,..), if applicable

Climate Action
38
Route CO-2a • Only if all of the 4 steps are met, it may be assumed that:
• manufacturer’s specifications, • specifications from legal metrological control, and • guidance documents such as the Commission’s guidance
(Annex II of Guidance Document 4 provides conservative values for uncertainty ranges of common measuring instruments and additional operating conditions)
• are suitable sources for the maximum permissible error in service
Overall uncertainty = Maximum permissible error in service (MPES from suitable source)
Measuring instrument is subject to relevant national legal metrological control
Measuring instrument is notsubject to national legal
metrological control
Uncertainty = Maximum permissible error in service
allowed by relevant national legal metrological control
Specific uncertainty assessment
Measuring instrument is installed in an environment
appropriate for its use specifications
Uncertainty = Maximum permissible error specified for that measuring instrument in
serviceOR
Uncertainty = Uncertainty obtained by calibration
multiplied by a conservative adjustment factor
Route CO-1 Route CO-2a/2b Route CO-3

Climate Action
39
Route CO-2b • Only if all of the 4 steps are met, it may be assumed that:
• the expanded uncertainty from calibration, multiplied by • a conservative adjustment factor (e.g. 2) to take into account any
further errors in service • can be used as the overall uncertainty • Note: calibration is not a “one-point” check in best-case scenario carried out by an accredited body using appropriate standards (CEN, ISO or follow principles in e.g. EA 4/02 - Guidance to Expression of Uncertainty of Measurement in Calibration) Overall uncertainty = Uncertainty from calibration × conservative adjustment factor
Measuring instrument is subject to relevant national legal metrological control
Measuring instrument is notsubject to national legal
metrological control
Uncertainty = Maximum permissible error in service
allowed by relevant national legal metrological control
Specific uncertainty assessment
Measuring instrument is installed in an environment
appropriate for its use specifications
Uncertainty = Maximum permissible error specified for that measuring instrument in
serviceOR
Uncertainty = Uncertainty obtained by calibration
multiplied by a conservative adjustment factor
Route CO-1 Route CO-2a/2b Route CO-3

Climate Action
40
Appropriate environment (cnt‘d)
Note on NLMC • Also in the case of Route CO-1 the MI has to be installed in such
appropriate environment
• It is just assumed that if relevant NLMC is available (e.g. it lays down MPES valid between re-calibration intervals), the 4 steps are typically met by complying with the provisions set out under NLMC
• If there is no relevant NLMC (e.g. it does not regulate anything that happens after putting MI into use, like the MID does), the 4 steps are no longer automatically met use another Route
Climate Action
41
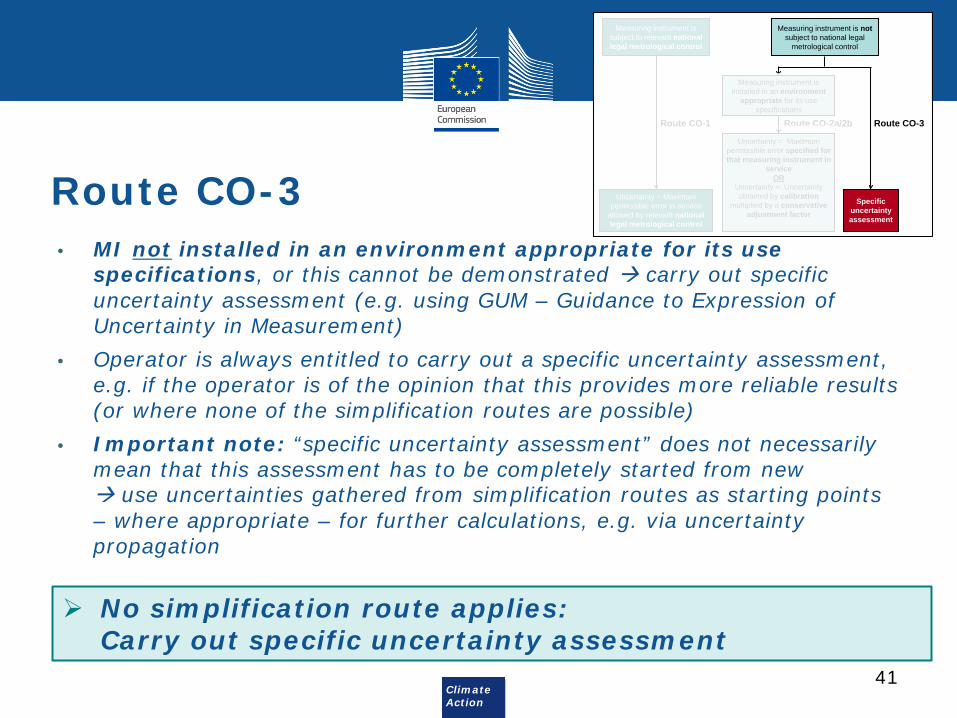
Route CO-3 • MI not installed in an environment appropriate for its use
specifications, or this cannot be demonstrated carry out specific uncertainty assessment (e.g. using GUM – Guidance to Expression of Uncertainty in Measurement)
• Operator is always entitled to carry out a specific uncertainty assessment, e.g. if the operator is of the opinion that this provides more reliable results (or where none of the simplification routes are possible)
• Important note: “specific uncertainty assessment” does not necessarily mean that this assessment has to be completely started from new use uncertainties gathered from simplification routes as starting points – where appropriate – for further calculations, e.g. via uncertainty propagation
No simplification route applies: Carry out specific uncertainty assessment
Measuring instrument is subject to relevant national legal metrological control
Measuring instrument is notsubject to national legal
metrological control
Uncertainty = Maximum permissible error in service
allowed by relevant national legal metrological control
Specific uncertainty assessment
Measuring instrument is installed in an environment
appropriate for its use specifications
Uncertainty = Maximum permissible error specified for that measuring instrument in
serviceOR
Uncertainty = Uncertainty obtained by calibration
multiplied by a conservative adjustment factor
Route CO-1 Route CO-2a/2b Route CO-3
Climate Action
42
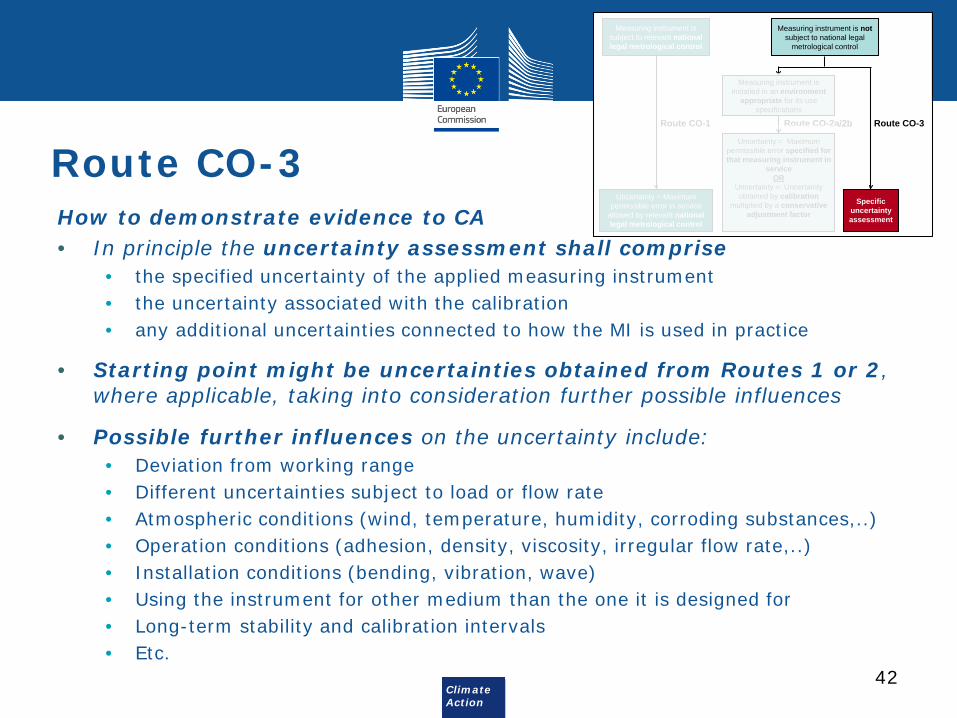
Route CO-3 How to demonstrate evidence to CA • In principle the uncertainty assessment shall comprise
• the specified uncertainty of the applied measuring instrument • the uncertainty associated with the calibration • any additional uncertainties connected to how the MI is used in practice
• Starting point might be uncertainties obtained from Routes 1 or 2, where applicable, taking into consideration further possible influences
• Possible further influences on the uncertainty include: • Deviation from working range • Different uncertainties subject to load or flow rate • Atmospheric conditions (wind, temperature, humidity, corroding substances,..) • Operation conditions (adhesion, density, viscosity, irregular flow rate,..) • Installation conditions (bending, vibration, wave) • Using the instrument for other medium than the one it is designed for • Long-term stability and calibration intervals • Etc.
Measuring instrument is subject to relevant national legal metrological control
Measuring instrument is notsubject to national legal
metrological control
Uncertainty = Maximum permissible error in service
allowed by relevant national legal metrological control
Specific uncertainty assessment
Measuring instrument is installed in an environment
appropriate for its use specifications
Uncertainty = Maximum permissible error specified for that measuring instrument in
serviceOR
Uncertainty = Uncertainty obtained by calibration
multiplied by a conservative adjustment factor
Route CO-1 Route CO-2a/2b Route CO-3

Climate Action
43
requirements under relevant national legal metrological
control are at least as stringent as the required tier
Uncertainty = Maximum permissible error in service
allowed by relevant national legal metrological control
Route CT-1 Route CT-2
Measuring instrument is subject to relevant national legal metrological control
requirements under relevant national legal metrological
control are less stringent than the required tier
Obtain evidence on the applicable uncertainty from the trade partner
• Use amounts from invoices, provided that a commercial transaction between two independent trade partners takes place
• Use of direct readings from the measurement system
Route CT-3
Measuring instrument is notsubject to relevant national legal metrological control
MI under trading partner’s control (Art. 29)
Source: EC Guidance Document 4

Climate Action
44
Routes CT Condition:
• Operator must confirm that those instruments allow the operator to comply with at least as high a tier, give more reliable results and are less prone to control risks compared to using own instruments
• General assumption is that NLMC is applicable due to commercial relationship (Route CT-1, similar to Route CO-1)
• Use max. permissible error in service (MPES) under NLMC for uncertainty • If MPES too high for required tier operator shall obtain evidence on
uncertainty from trade partner • Operator may also directly read from trading partner’s instrument, where
this is possible • Responsibility for maintenance and calibration “outsourced” but operator still
required to exert control measures (Art. 58(3)(f) and 64)
MI under trading partner’s control instead of own MI: only use if it allows to comply with at least as high a tier, gives more reliable results and is less prone to control risks

Climate Action
45
Derogations
• What if none of the Routes provides evidence that the required tier can be met?
Carry out corrective action, e.g. install a measurement system that meets the required tier, OR
Provide evidence that meeting the required tier is technically infeasible or would incur unreasonable costs

Climate Action
46
Any questions so far?
Climate Action
47
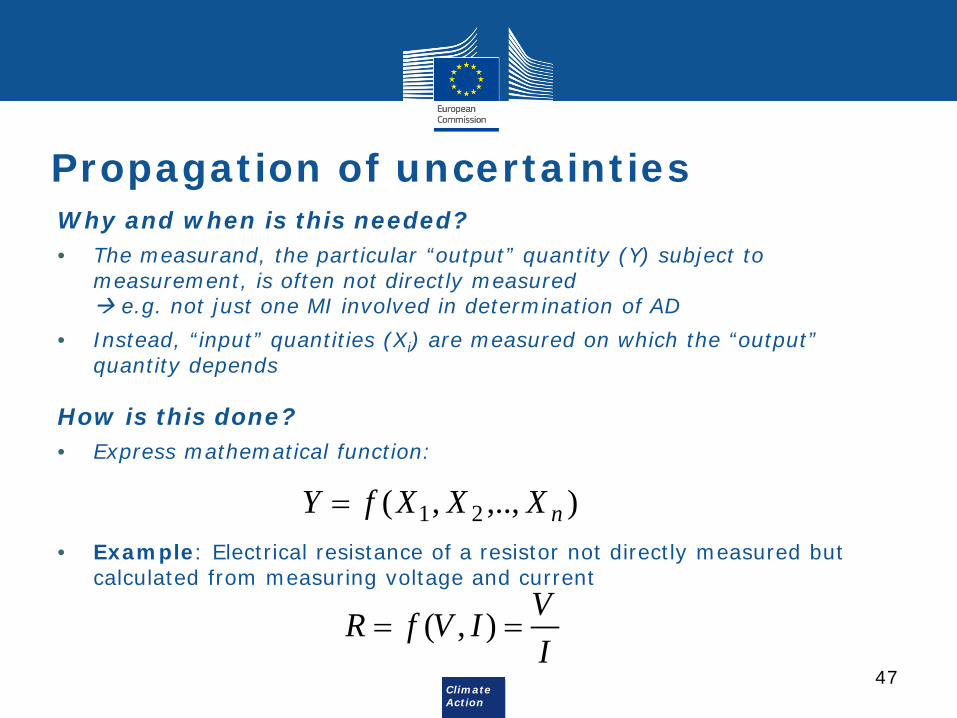
Propagation of uncertainties Why and when is this needed? • The measurand, the particular “output” quantity (Y) subject to
measurement, is often not directly measured e.g. not just one MI involved in determination of AD
• Instead, “input” quantities (Xi) are measured on which the “output” quantity depends
How is this done? • Express mathematical function:
• Example: Electrical resistance of a resistor not directly measured but calculated from measuring voltage and current
),..,,( 21 nXXXfY =
IVIVfR == ),(
Climate Action
48
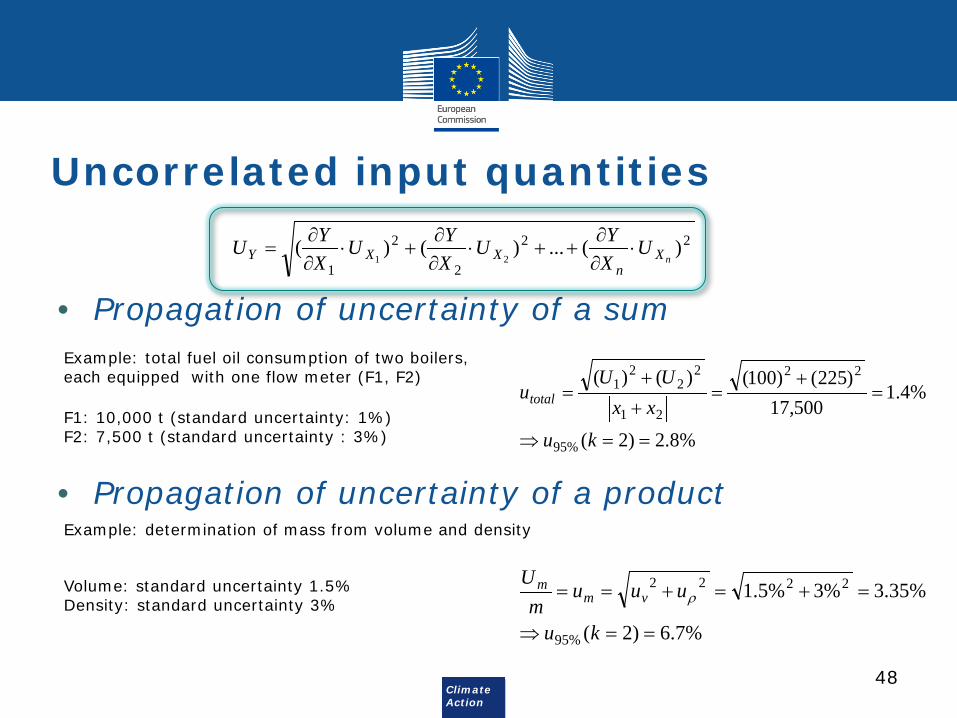
Uncorrelated input quantities
• Propagation of uncertainty of a sum
• Propagation of uncertainty of a product
22
2
2
1)(...)()(
21 nXn
XXY UXYU
XYU
XYU ⋅
∂∂
++⋅∂∂
+⋅∂∂
=
%8.2)2(
%4.1500,17
)225()100()()(
%95
22
21
22
21
==⇒
=+
=+
+=
kuxx
UUutotal
Example: total fuel oil consumption of two boilers, each equipped with one flow meter (F1, F2)
F1: 10,000 t (standard uncertainty: 1%) F2: 7,500 t (standard uncertainty : 3%)
Example: determination of mass from volume and density
Volume: standard uncertainty 1.5% Density: standard uncertainty 3%
%7.6)2(
%35.3%3%5.1
%95
2222
==⇒
=+=+==
ku
uuum
Uvm
mρ
Climate Action
49
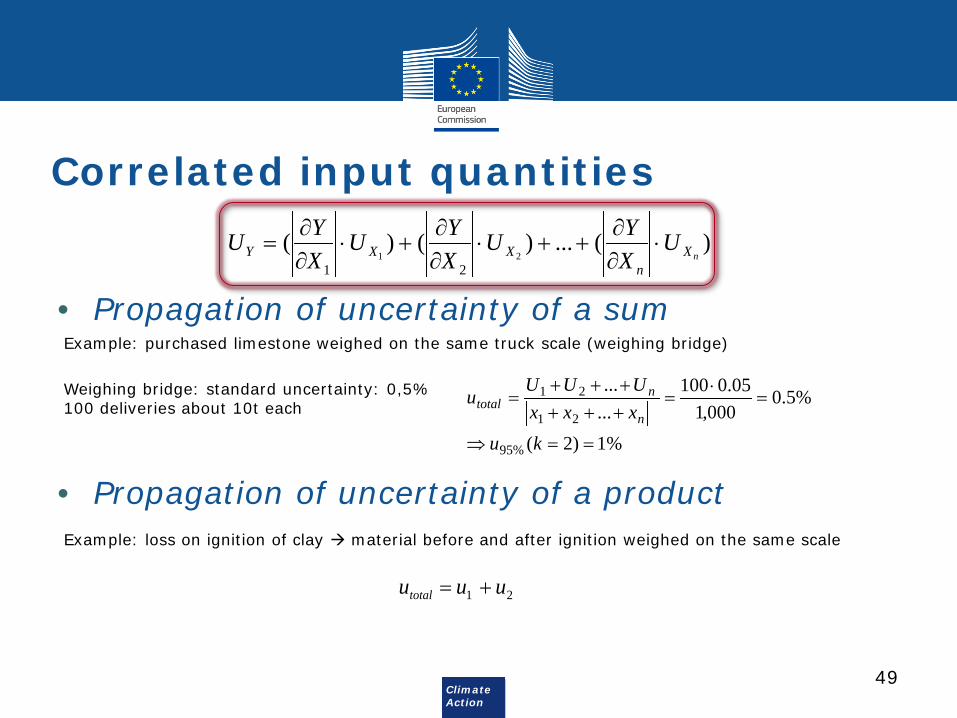
Correlated input quantities
• Propagation of uncertainty of a sum
• Propagation of uncertainty of a product
Example: purchased limestone weighed on the same truck scale (weighing bridge)
Weighing bridge: standard uncertainty: 0,5% 100 deliveries about 10t each
Example: loss on ignition of clay material before and after ignition weighed on the same scale
)(...)()(21
21nX
nXXY U
XYU
XYU
XYU ⋅
∂∂
++⋅∂∂
+⋅∂∂
=
%1)2(
%5.0000,1
05.0100......
%95
21
21
==⇒
=⋅
=++++++
=
kuxxxUUUun
ntotal
21 uuutotal +=

Climate Action
50
Step-by-step approach
• Step 1: Express mathematical relationship “input output quantities” • e.g. Q = P – E + (Sbegin – Send) (see batch metering) or Q = Q1 + Q2
• Step 2: Determine standard uncertainty for each input quantity • Route 1: MPES from NLMC • Route 2a: MPES from manufacturer‘s specification, NLMC, OIML,.. • Route 2b: Calibration x conservative adjustment factor • Route 3: Full uncertainty assessment for the input quantity
• Step 3: Check for any correlation between e.g. P, S, Q1,..
• Step 4: Combine uncertainties (propagation laws) obtain uQ
• Step 5: Calculate expanded uncertainty (coverage factor k =2; 95%)

Climate Action
51
Type of distributions
Standard uncertainty u (standard deviation)
Typical occurrences • Calibration reports • Manufacturer’s specifications • Combined uncertainties
Standard uncertainty u =
𝑎𝑎3
Normal Rectangular
Typical occurrences • Maximum permissible errors • Tolerances • Reference book values
Climate Action
52
Example: Clay in ceramics plant
• Specific information • Clay is gathered from the clay pit directly by the operator • Operator transports the clay from the pit to the installation on trucks • Trucks weighed on a weighing bridge owned by the operator • No commercial transaction not subject to NLMC • Measurement instrument is used in an environment appropriate for its
use specifications (“Route CO-2a”)
• See more details in Guidance Document 4a

Climate Action
53
Example – Step-by-step approach • Step 1: Mathematical relationship Q = P – E + (Sbegin – Send)
• Step 2: Determine standard uncertainty for each input quantity • Route 2a: MPES from manufacturer‘s specification for P (e.g. ±1%) MPES usually rectangular distribution convert to standard uncertainty
• Route 3: (Simplified) uncertainty assessment for Sbegin, end (e.g. standard u ±5%)
• Step 3: Check for any correlation between input quantities (e.g. all Pi correlated because they are measured on the same instrument)
• Step 4: Combine uncertainties
• Step 5: Calculate expanded uncertainty u(95%, k=2)= 2*uQ
𝑢𝑢𝑷𝑷𝑷𝑷 =𝑴𝑴𝑷𝑷𝑴𝑴𝑴𝑴
3
𝑢𝑢𝑸𝑸 =𝟐𝟐 ∙ 𝑼𝑼𝑴𝑴
𝟐𝟐 + 𝑼𝑼𝑷𝑷𝟐𝟐
𝑸𝑸
Climate Action
54
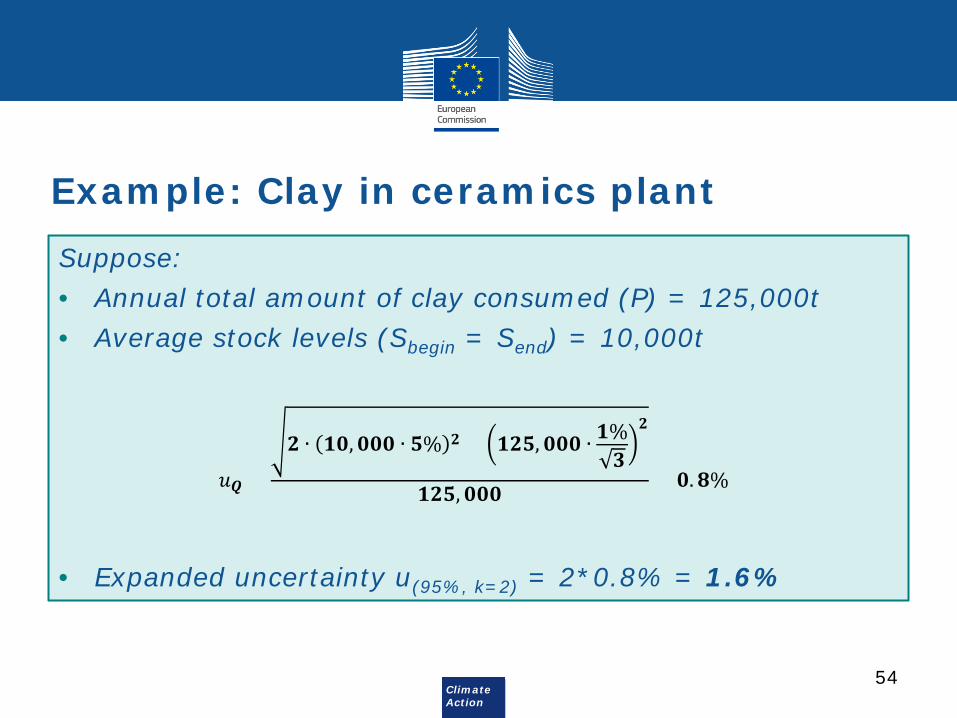
Example: Clay in ceramics plant Suppose: • Annual total amount of clay consumed (P) = 125,000t • Average stock levels (Sbegin = Send) = 10,000t
• Expanded uncertainty u(95%, k=2) = 2*0.8% = 1.6%
𝑢𝑢𝑸𝑸 =
𝟐𝟐 ∙ 𝟏𝟏𝟏𝟏, 𝟏𝟏𝟏𝟏𝟏𝟏 ∙ 𝟓𝟓𝟓 𝟐𝟐 + 𝟏𝟏𝟐𝟐𝟓𝟓, 𝟏𝟏𝟏𝟏𝟏𝟏 ∙ 𝟏𝟏𝟓𝟑𝟑
𝟐𝟐
𝟏𝟏𝟐𝟐𝟓𝟓, 𝟏𝟏𝟏𝟏𝟏𝟏= 𝟏𝟏. 𝟖𝟖𝟓
Climate Action
55
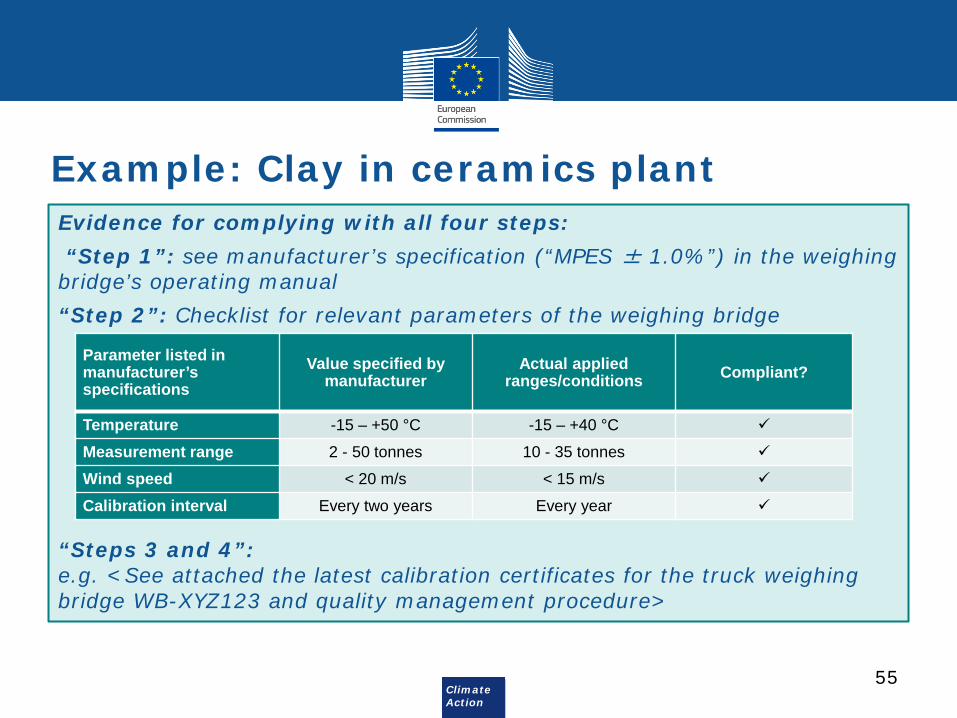
Evidence for complying with all four steps: “Step 1”: see manufacturer’s specification (“MPES ± 1.0%”) in the weighing bridge’s operating manual “Step 2”: Checklist for relevant parameters of the weighing bridge “Steps 3 and 4”: e.g. <See attached the latest calibration certificates for the truck weighing bridge WB-XYZ123 and quality management procedure>
Parameter listed in manufacturer’s specifications
Value specified by manufacturer
Actual applied ranges/conditions Compliant?
Temperature -15 – +50 °C -15 – +40 °C
Measurement range 2 - 50 tonnes 10 - 35 tonnes
Wind speed < 20 m/s < 15 m/s
Calibration interval Every two years Every year
Example: Clay in ceramics plant
Climate Action
56
Any questions so far?

Climate Action
57
Fall-back approaches
Climate Action
58
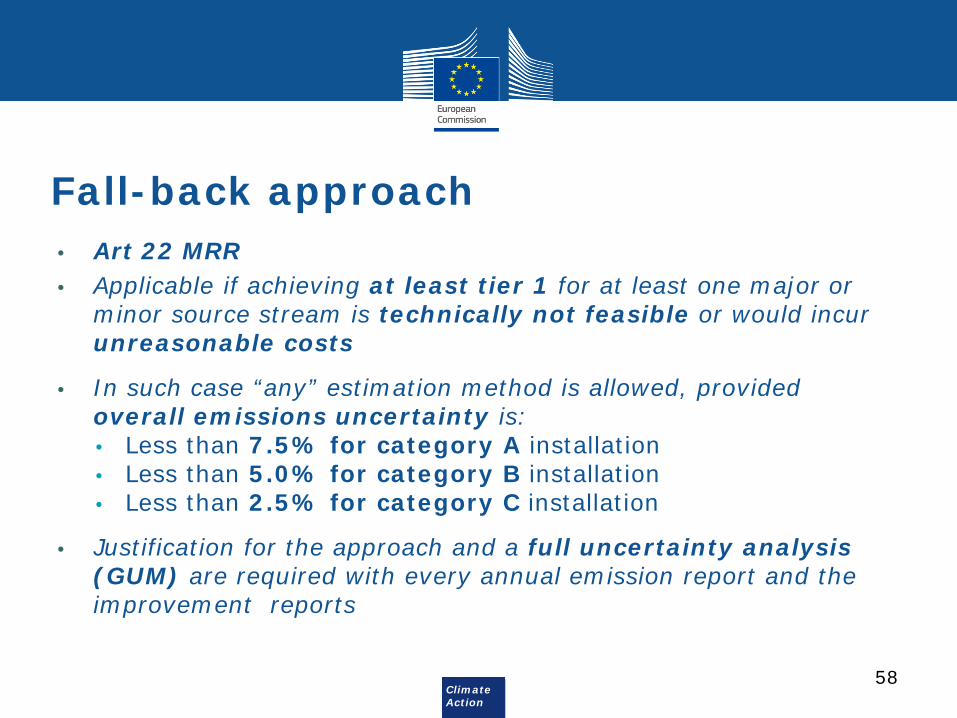
Fall-back approach • Art 22 MRR • Applicable if achieving at least tier 1 for at least one major or
minor source stream is technically not feasible or would incur unreasonable costs
• In such case “any” estimation method is allowed, provided overall emissions uncertainty is: • Less than 7.5% for category A installation • Less than 5.0% for category B installation • Less than 2.5% for category C installation
• Justification for the approach and a full uncertainty analysis (GUM) are required with every annual emission report and the improvement reports

Climate Action
59
Fall-back approach – example • Installation category A • Uncertainty of the determination of the emissions for the whole
installation must not exceed 7.5%
• Emtotal .. total emissions of the installation • EmNG ... emissions resulting from natural gas burning (2%; 35,000 t CO2) • EmFB ... emissions resulting from the source stream monitored by a fall-
back approach (18%; 12,000 t CO2)
FBNGtotal EmEmEm +=
%8.4000,12000,35
)000,12%18()000,35%0.2( 22
=+
⋅+⋅=totalu
Climate Action
60
Measurement-based approaches

Climate Action
61
Measurement-based methodology • Section 3 of the MRR
• Continuous emissions measurement systems (CEMS)
• Requires two elements: • Measurement of the GHG concentration • Volumetric flow of the gas stream
• Extensive QA/QC measures required • Application EN 14181, EN 15259, etc.
• Pass Quality Assurance Levels QAL 1, 2, 3 and Annual Surveillance Test (AST)
• Corroborating calculations

Climate Action
62
CEMS – Overview of requirements
QAL1 QAL2 QAL3 AST
When? Before
installation of the CEMS
Installation and calibration
During operation
Starting one year after QAL2
Frequency Once At least every five years Continuously Annually
Who? Operator Accredited laboratory Operator Accredited
laboratory
Relevant standards
EN 14181, EN ISO 14956,
EN 15267-3
EN 14181, EN 15259 EN 14181 EN 14181,
EN 15259

Climate Action
63
CEMS – QA/QC requirements • QAL 1: Procedure used to demonstrate the potential suitability of the
CEMS before it is installed (EN ISO 14956, EN 15267-3) • QAL 2: Obtain uncertainty from the calibration function against a standard
reference method (recommended standard for flue gas flow: EN 16911-2)
• QAL 3: Ongoing quality control using control charts (e.g. Shewart, CUSUM), determine appropriate maintenance interval and action limits (ref. QAL1)
• Annual Surveillance Test (AST): “mini”-QAL 2; confirm that CEMS functions correctly and calibration function valid
• Further readings: see EC Guidance Document 7
Uncertainty obtained by QAL2 (incl. flue gas flow) to be compared to tier requirements in the Regulation
22
flowgasflueionconcentratGHGemissionshourlyav uuu +=

Climate Action
Questions? Where to find more information? Regulation No. 601/2012 (MRR) http://eur-lex.europa.eu/legal-content/EN/TXT/?qid=1462274244220&uri=CELEX:02012R0601-20140730 Guidance Documents on European Commission’s website http://ec.europa.eu/clima/policies/ets/monitoring/documentation_en.htm in particular Guidance Documents 4 and 4a


Annex II - Presentations: Checking Compliance with the tier requirements:
by Member States Representatives Practical approach to checking operators' uncertainty assessments
Common difficulties and limitations
Required time effort and expertise (e.g. use of external consultants)
Best practice examples: What kind of checks are performed?
Best practice examples: What kind of evidence is requested from op-erators?
10

Uncertainty assessment
Alex PijnenburgCoordinator EU-ETS

Approach
Uncertainty: important for NEa
• One of the key elements of monitoring
a few % more can make a large difference
• One of the elements with the most mistakes
Lack of understanding of the basics
In NL uncertainty assessments of all installations are
assessed
• Before approval of the monitoring plan
• When changes are notified
• Pragmatic/practical approach where possible
2

Requirements by NEa
Activity data
• Sources of uncertainties listed for different measurement
devices.
(e.g. calibration certificate, specifications, ISO 5168)
• Error propagation calculation checked
• Evidence documents (certificates) not always requested to
submit to competent authority (only on request for
information purposes).
Limits for assessing evidence “behind the desk”
More effective to evaluate evidence documents on site
(by verifier and NEa-inspectors)
Assess effectiveness operators procedures and Q-
systems on measurements instruments3

Expertise
In House
• Training course by Dutch Metrological institute
• Specific guidance document including aspects National
metrology.
• Getting more experienced each year (“the hard way”)
External
• Permitting phase 3: contract with Dutch Metrological
institute for support
• On going: support from engineering consultancy if needed
4


Uncertainty Assessment Check Compliance with Tier
Requirements
Annette PrendergastEmissions Trading [email protected]

Overview of Situation in Ireland
44 out of 99 stationary installations are required to submit an Uncertainty Assessment.
55 installations with low emissions are required to submit evidence that they can achieve the required tier such as current calibration certificates for meters or confirmation that legal metrology meters used.
We have no Fall Back methods applied in Ireland. All uncertainty Assessments are examined in detail by the
team. Time taken depends on the complexity and the quality of information submitted. Less than an hour for simple uncertainty assessments up to a day for complex assessments.

Uncertainty Assessment
Detailed checks are performed on calculations to ensure correct formula are applied. Back-up data which justifies uncertainty assumptions is checked.
Commission Guidance on Uncertainty Assessment and Commission Examples are used for Guidance.
Types of Legal Metrology meters include: Weighbridges for solid/ liquid fuels/ materials, beltweighers for solid fuels/materials, truck meters for liquid fuels.
Types of non legal meteorology meters include; Gas and liquid meters (turbine, vortex, orifice plate, ultrasonic, Coriolis, rotor), level indicators, weigh scales, various methods for stock determination, draught surveys.
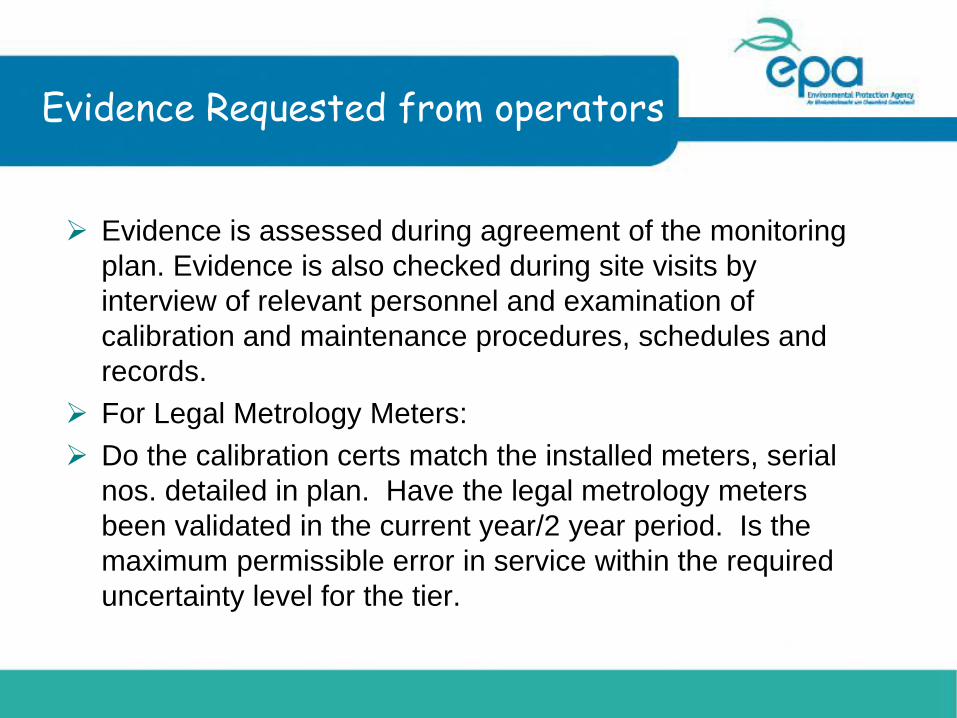
Evidence Requested from operators
Evidence is assessed during agreement of the monitoring plan. Evidence is also checked during site visits by interview of relevant personnel and examination of calibration and maintenance procedures, schedules and records.
For Legal Metrology Meters: Do the calibration certs match the installed meters, serial
nos. detailed in plan. Have the legal metrology meters been validated in the current year/2 year period. Is the maximum permissible error in service within the required uncertainty level for the tier.
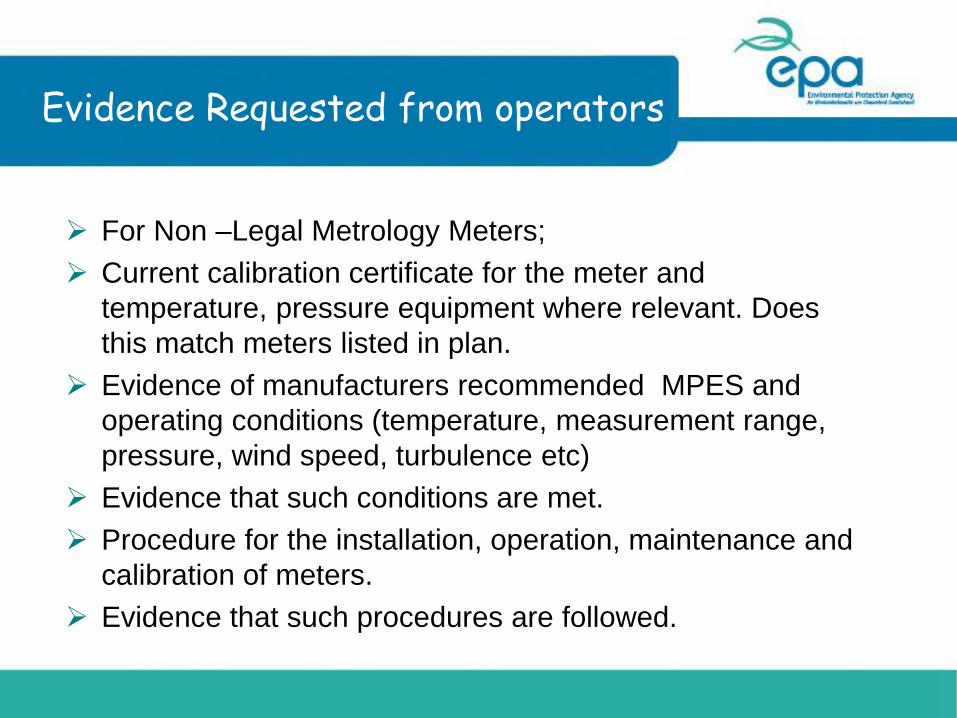
Evidence Requested from operators
For Non –Legal Metrology Meters; Current calibration certificate for the meter and
temperature, pressure equipment where relevant. Does this match meters listed in plan.
Evidence of manufacturers recommended MPES and operating conditions (temperature, measurement range, pressure, wind speed, turbulence etc)
Evidence that such conditions are met. Procedure for the installation, operation, maintenance and
calibration of meters. Evidence that such procedures are followed.

Additional evidence in specific cases
Sampling /analysis plan for determination of moisture content of raw material, method uncertainty.
Uncertainly associated with, pressure change and molecular weight determination (e.g. use of orifice meters for gaseous fuels).Sampling/ analysis plan, calibration, operation maintenance of gas chromatograph, is the sampling and analysis method 17025 accredited.
Are the calibration gases supplied by accredited lab and are they in date.
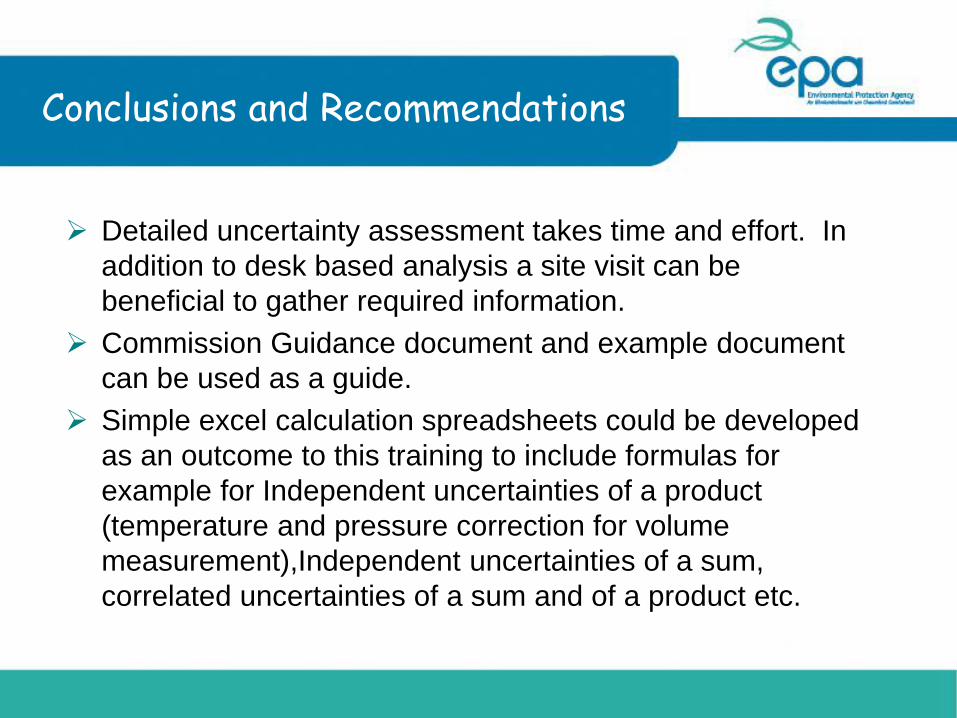
Conclusions and Recommendations
Detailed uncertainty assessment takes time and effort. In addition to desk based analysis a site visit can be beneficial to gather required information.
Commission Guidance document and example document can be used as a guide.
Simple excel calculation spreadsheets could be developed as an outcome to this training to include formulas for example for Independent uncertainties of a product (temperature and pressure correction for volume measurement),Independent uncertainties of a sum, correlated uncertainties of a sum and of a product etc.


M&R Training Event on Uncertainty Assessment
Joana VelosoClimate Change Department/Unit of Mitigation and Carbon [email protected]; [email protected]
CONTENTS
1. Practical approach to check operators' uncertainty assessments
2. Common difficulties and limitations
3. Possible ways forward

1. Practical approach to check operators' uncertainty assessments
CA checks the uncertainty assessments of allthe operators (exception for < 25 kt)
Main Topics:
Natural gas meters – did the operator considered notonly the uncertainty of the volume measurement, butalso the temperature and pressure measurements?
Other fuels and materials – did the operatorconsidered the uncertainty related to the stock (whenapplicable)?
60%
Installations < 25 kt
CA checks which route the operator followedand if the formulas used are correct accordingto EC’s Guidance doc. n.º4 17%
Installations A
15%Installations
B
8%Installations
C
CA checks the verification reports for anyrecommendation concerning uncertaintyassessment

2. Common difficulties and limitations
National metrological legislation is disperse and it´s not alwaysclear what is the maximum permissible error in service (since itresults from the combination of several parameters)
Difficult for CA to assess if the MPES meetsthe tier requirement
Difficult for CA to assess it since there are no uncertainty expertsin the team
Operators tend to submit a full uncertainty assessment, notalways with the same formula that are presented in the guidancedoc.

3. Possible ways forward
In line with the spirit of simplification, this could be a greatopportunity to think on pragmatic approaches on uncertaintyassessment for phase IV
In cases where the amount of fuel consumed isdetermined based on invoices, with national metrologicalcontrol and there is an independent relation between theoperator and the supplier -> could we derogate the needfor an uncertainty assessment?


0
M&R Training on„Uncertainty Assessment“
Checking Compliance with the tier requirements
Lisa Buchner
German Emissions Trading Authority, 2016-05-31, Brussels
3
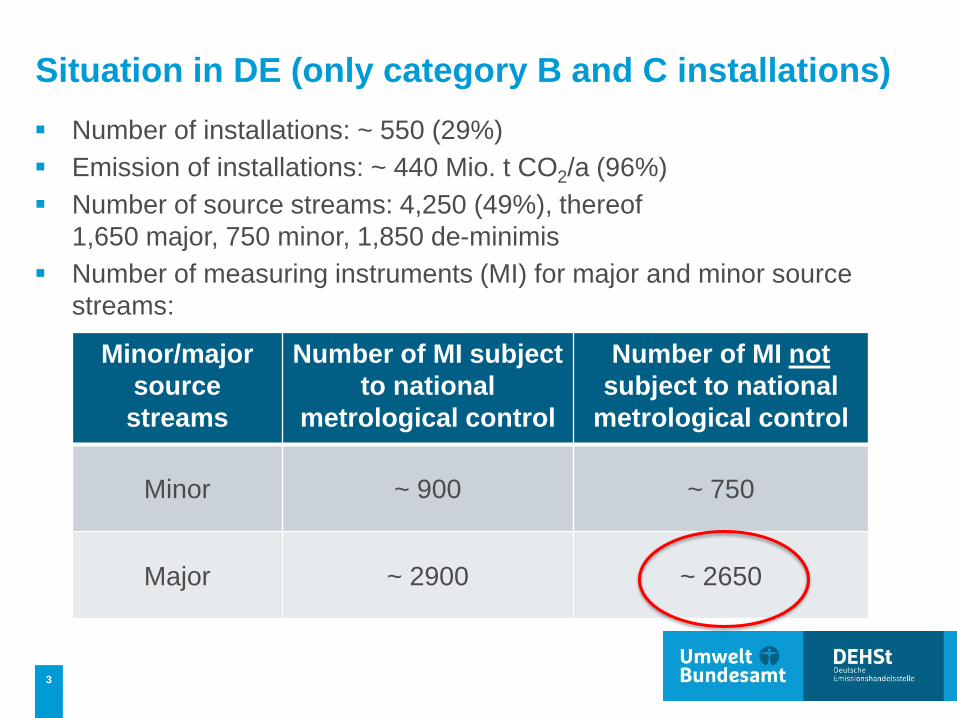
Situation in DE (only category B and C installations) Number of installations: ~ 550 (29%) Emission of installations: ~ 440 Mio. t CO2/a (96%) Number of source streams: 4,250 (49%), thereof
1,650 major, 750 minor, 1,850 de-minimis Number of measuring instruments (MI) for major and minor source
streams:
Minor/majorsource streams
Number of MI subject to national
metrological control
Number of MI notsubject to national
metrological control
Minor ~ 900 ~ 750
Major ~ 2900 ~ 2650

4
Practical approach to check uncertainty assessment
MI subject to national metrological control?
yes Check finished
MI calibrated?
no
yesno
One or more MI?
one more
UA: Uncertainty AssessmentMI: Measuring Instrument
Look at UA of each MI
4 step UA performed?
individual UA performed?
Overall UA (error propagation) performed?
5
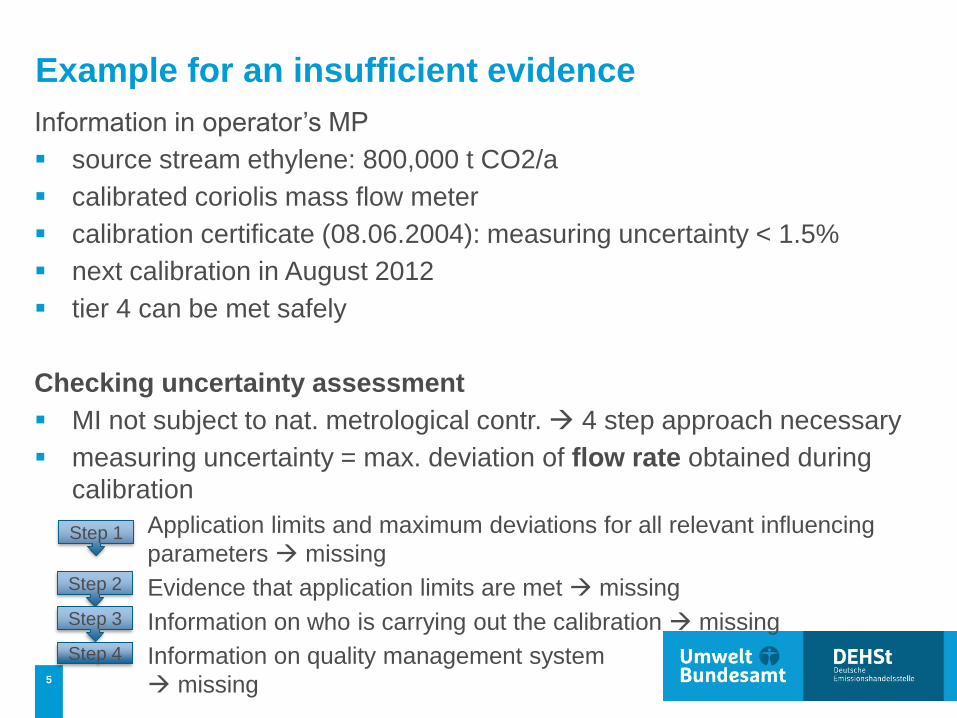
Information in operator’s MP
source stream ethylene: 800,000 t CO2/a calibrated coriolis mass flow meter calibration certificate (08.06.2004): measuring uncertainty < 1.5% next calibration in August 2012 tier 4 can be met safely
Checking uncertainty assessment MI not subject to nat. metrological contr. 4 step approach necessary measuring uncertainty = max. deviation of flow rate obtained during
calibrationApplication limits and maximum deviations for all relevant influencing parameters missingEvidence that application limits are met missingInformation on who is carrying out the calibration missingInformation on quality management system missing
Example for an insufficient evidence
Step 1
Step 2
Step 3
Step 4


Uncertainty on MW measured withonline gaschromatograph
• Typical application: determination of activity data (mass flow) of gaseous fuels (natural gas, process gases in refineries, steel plants or chemical plants)
• Mass flowrate, measured with a venturimeter or orificemeter is:
• Uncertainty analysis on mass flowrate is:
• How to find UMW ?• Note: Also in case of volumetric flowrate (Nm³/h or Am³/h) of gaseous fuels
measured with an orifice type meter UMW must be calculated
• Example: An on line gaschromatograph determines the composition (MW) of a gas source stream with 9 components
Verificatiebureau Benchmarking Vlaanderen Uncertainty analyser 31 05 2016
2222*5.0 MWPTpM UUUUU
T
pMWpdCFM **2
0

Input 1: Reference used to validate
Verificatiebureau Benchmarking Vlaanderen Uncertainty analyser 31 05 2016
Composition Uncert Composition Uncert
(Mwi) MJ/Nm³mol C/mol
comp xi (mol%) (%) xi (mol%) (%)
Since 1/06/2015
hydrogen 2,016 10,835 0 51,21 2 51,25 2
methane 16,032 35,963 1 4,005 2 4 2
ethane 30,048 64,632 2 37 2 37 2
propane 44,064 93,935 3 2,002 2 2 2
butane 58,08 122,805 4 0,6 2 0,6 2
pentane 72,096 141,558 5 0,3976 2 0,4 2
benzene 78,048 142,403 6 0,2952 1 0,3 1
CO2 44 0 1 0,4989 2 0,5 2
nitrogen 28 0 0 4,011 2 4 2
COMP-10 0 0 0 0 0 0 0
COMP-11 0 0 0 0 0 0 0
COMP-12 0 0 0 0 0 0 0
COMP-13 0 0 0 0 0 0 0
COMP-14 0 0 0 0 0 0 0
COMP-15 0 0 0 0 0 0 0
2015
INPUT References
Name of
component
Molecular
weight
Reference 1 Reference 2Caloric value C-factor
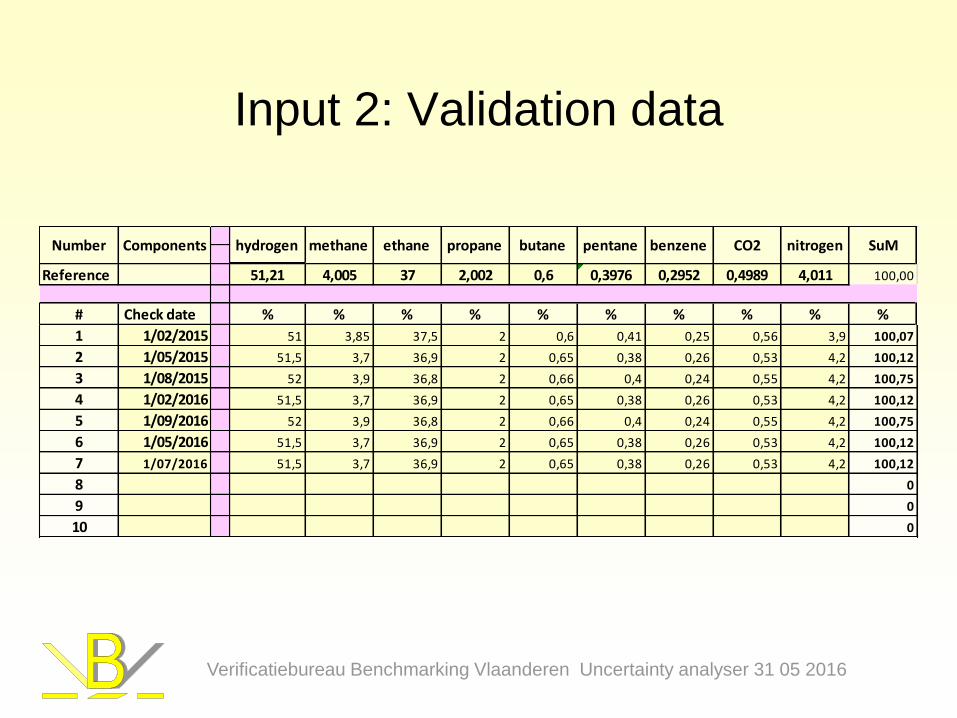
Input 2: Validation data
Verificatiebureau Benchmarking Vlaanderen Uncertainty analyser 31 05 2016
Reference 51,21 4,005 37 2,002 0,6 0,3976 0,2952 0,4989 4,011 100,00
# Check date % % % % % % % % % %
1 1/02/2015 51 3,85 37,5 2 0,6 0,41 0,25 0,56 3,9 100,07
2 1/05/2015 51,5 3,7 36,9 2 0,65 0,38 0,26 0,53 4,2 100,12
3 1/08/2015 52 3,9 36,8 2 0,66 0,4 0,24 0,55 4,2 100,75
4 1/02/2016 51,5 3,7 36,9 2 0,65 0,38 0,26 0,53 4,2 100,12
5 1/09/2016 52 3,9 36,8 2 0,66 0,4 0,24 0,55 4,2 100,75
6 1/05/2016 51,5 3,7 36,9 2 0,65 0,38 0,26 0,53 4,2 100,12
7 1/07/2016 51,5 3,7 36,9 2 0,65 0,38 0,26 0,53 4,2 100,12
8 0
9 0
10 0
Components SuMCO2 nitrogenethane propane butane pentaneNumber hydrogen methane benzene

Results
Verificatiebureau Benchmarking Vlaanderen Uncertainty analyser 31 05 2016
Check Ref1 Σx = OK
Check Ref2 Σx = OK
Average MW= 15,87 kg/kmol
Uncert. on MW= 1,60 %
Average C-fact= 2,51 kg/kg
Uncert. on C-fact= 0,18 %
Aver. Emission factor 51,62 kg CO2/GJ
Uncert. on Emissionfact= 0,44 %
Further information: Related example (gaseous fuels - orifice meter) is part of the discussion group session.

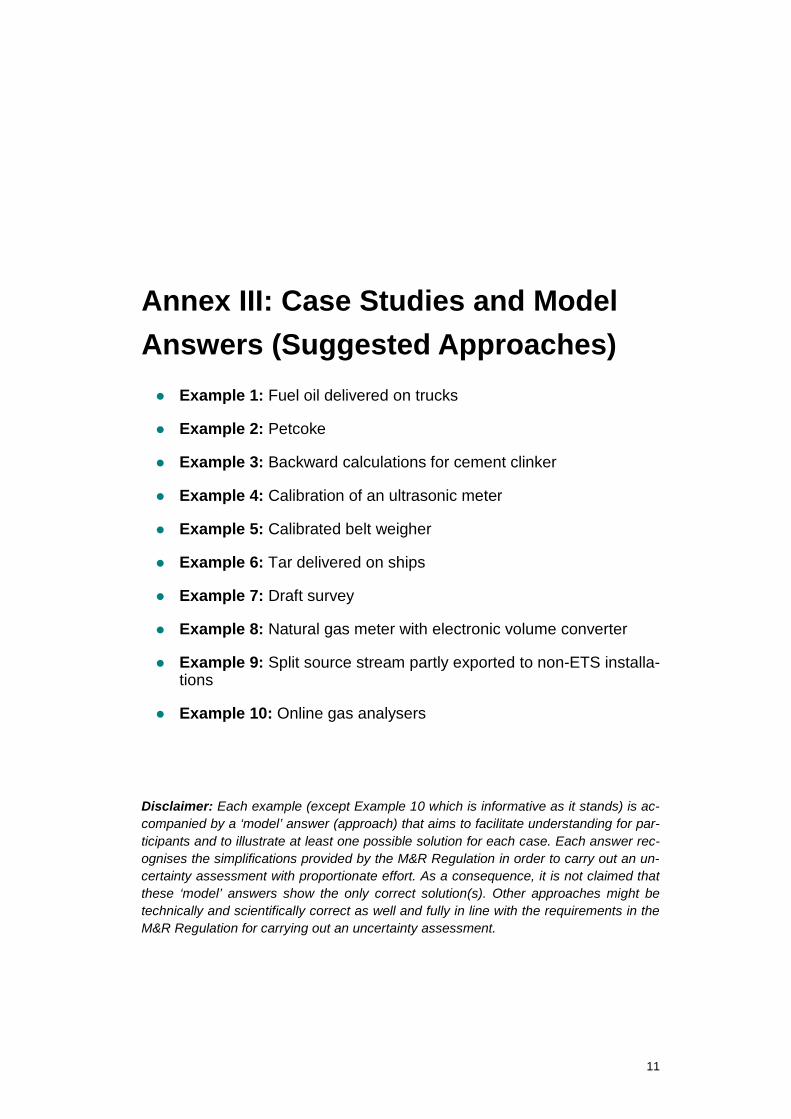
Annex III: Case Studies and Model Answers (Suggested Approaches) Example 1: Fuel oil delivered on trucks
Example 2: Petcoke
Example 3: Backward calculations for cement clinker
Example 4: Calibration of an ultrasonic meter
Example 5: Calibrated belt weigher
Example 6: Tar delivered on ships
Example 7: Draft survey
Example 8: Natural gas meter with electronic volume converter
Example 9: Split source stream partly exported to non-ETS installa-tions
Example 10: Online gas analysers
Disclaimer: Each example (except Example 10 which is informative as it stands) is ac-companied by a ‘model’ answer (approach) that aims to facilitate understanding for par-ticipants and to illustrate at least one possible solution for each case. Each answer rec-ognises the simplifications provided by the M&R Regulation in order to carry out an un-certainty assessment with proportionate effort. As a consequence, it is not claimed that these ‘model’ answers show the only correct solution(s). Other approaches might be technically and scientifically correct as well and fully in line with the requirements in the M&R Regulation for carrying out an uncertainty assessment.
11
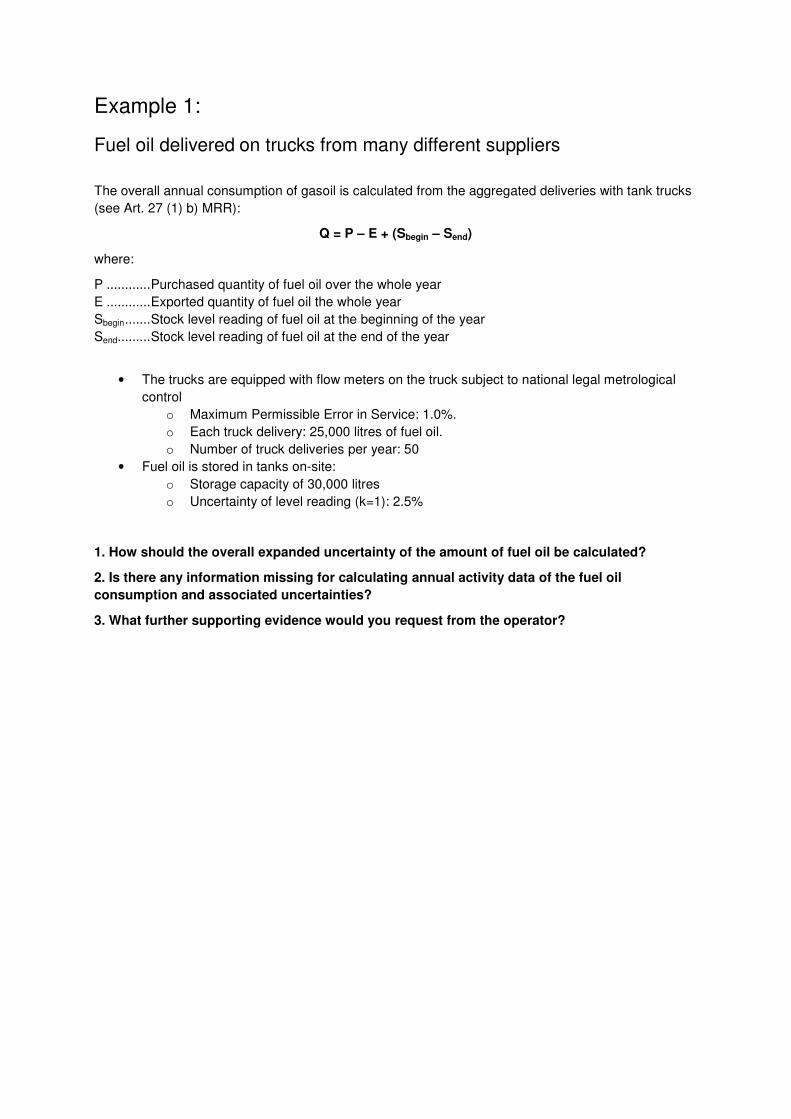
Example 1:
Fuel oil delivered on trucks from many different suppliers
The overall annual consumption of gasoil is calculated from the aggregated deliveries with tank trucks
(see Art. 27 (1) b) MRR):
Q = P – E + (Sbegin – Send)
where:
P ............ Purchased quantity of fuel oil over the whole year
E ............ Exported quantity of fuel oil the whole year
Sbegin ....... Stock level reading of fuel oil at the beginning of the year
Send......... Stock level reading of fuel oil at the end of the year
• The trucks are equipped with flow meters on the truck subject to national legal metrological
control
o Maximum Permissible Error in Service: 1.0%.
o Each truck delivery: 25,000 litres of fuel oil.
o Number of truck deliveries per year: 50
• Fuel oil is stored in tanks on-site:
o Storage capacity of 30,000 litres
o Uncertainty of level reading (k=1): 2.5%
1. How should the overall expanded uncertainty of the amount of fuel oil be calculated?
2. Is there any information missing for calculating annual activity data of the fuel oil
consumption and associated uncertainties?
3. What further supporting evidence would you request from the operator?
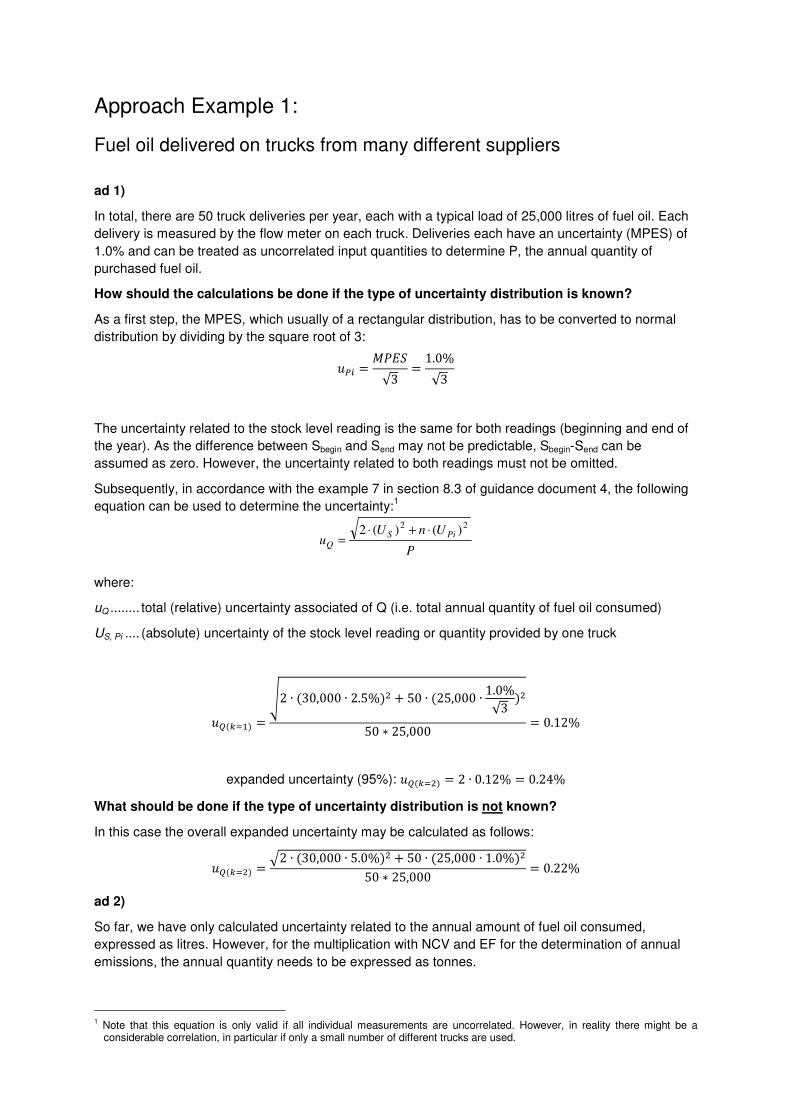
Approach Example 1:
Fuel oil delivered on trucks from many different suppliers
ad 1)
In total, there are 50 truck deliveries per year, each with a typical load of 25,000 litres of fuel oil. Each
delivery is measured by the flow meter on each truck. Deliveries each have an uncertainty (MPES) of
1.0% and can be treated as uncorrelated input quantities to determine P, the annual quantity of
purchased fuel oil.
How should the calculations be done if the type of uncertainty distribution is known?
As a first step, the MPES, which usually of a rectangular distribution, has to be converted to normal
distribution by dividing by the square root of 3:
��� = ����√3 = 1.0%√3
The uncertainty related to the stock level reading is the same for both readings (beginning and end of
the year). As the difference between Sbegin and Send may not be predictable, Sbegin-Send can be
assumed as zero. However, the uncertainty related to both readings must not be omitted.
Subsequently, in accordance with the example 7 in section 8.3 of guidance document 4, the following
equation can be used to determine the uncertainty:1
P
UnUu
PiSQ
22)()(2 ⋅+⋅
=
where:
uQ ........ total (relative) uncertainty associated of Q (i.e. total annual quantity of fuel oil consumed)
US, Pi .... (absolute) uncertainty of the stock level reading or quantity provided by one truck
��(���) =�2 ∙ (30,000 ∙ 2.5%)� + 50 ∙ (25,000 ∙ 1.0%√3 )�
50 ∗ 25,000 = 0.12%
expanded uncertainty (95%): ��(���) = 2 ∙ 0.12% = 0.24%
What should be done if the type of uncertainty distribution is not known?
In this case the overall expanded uncertainty may be calculated as follows:
��(���) = �2 ∙ (30,000 ∙ 5.0%)� + 50 ∙ (25,000 ∙ 1.0%)�50 ∗ 25,000 = 0.22%
ad 2)
So far, we have only calculated uncertainty related to the annual amount of fuel oil consumed,
expressed as litres. However, for the multiplication with NCV and EF for the determination of annual
emissions, the annual quantity needs to be expressed as tonnes.
1 Note that this equation is only valid if all individual measurements are uncorrelated. However, in reality there might be a
considerable correlation, in particular if only a small number of different trucks are used.

Therefore, the operator has to describe in the monitoring plan how the density of the fuel oil is
determined and how associated uncertainties are being assessed. For instance, if the density of a
mixed sample from samples drawn from each fuel oil delivery is determined with an uncertainty (k=1)
of 2%, the annual uncertainty of the quantity in tonnes would be as follows2:
��(� !!"#) = $��(% &'(")� + �)"!#��*� = $0.12%� + 2%� = 2% → ��(���) = 4%
As can be seen, despite the very good uncertainty achieved for the volume-based quantity, the mass-
based uncertainty is considerably higher in comparison. This is almost exclusively caused by the
uncertainty related to the determination of the density. Therefore, if the operator has to achieve a
higher tier, the uncertainty associated with the determination of the density would have to be
improved, e.g. by measuring the density of each truck delivery.
ad 3)
In principle, the operator should obtain copies of (metrological) verification certificates for the flow
meters from each supplier. It may be reasonable for an operator to suggest the seeking of certificates
only from a smaller number of suppliers which would still leave enough margin to prove that the overall
uncertainty is well below the next tier threshold. How many certificates are sought with a year and how
it is ensured that track is kept appropriately, may best be addressed by an appropriate procedure
which would be part of the monitoring plan and subject to the CA´s approval, provided that the
sampling of the selection is done in a representative way, e.g. randomly.
In addition to that, the operator should provide you with further information of how he determined the
uncertainty of the stock readings. However, with storage facilities capable of containing only less than
5 % of the annual quantity of fuel oil (30,000/1,250,000), Art. 28(2) of the MRR would also allow to
exclude stock level readings from the uncertainty assessment in the first place.
2 assuming measurements of volume and density are not correlated to any significant extent.

Example 2:
Uncertainty Associated with Measurement of Petcoke Activity Data
Petcoke usage in an installation is determined by aggregation of metering of quantities separately
delivered taking into account relevant stock changes (see Art. 27 (1) b) MRR), using the following
formula:
Q = P – E + (Sbegin – Send)
where:
P ............ Purchased quantity over the whole year
E ............ Exported quantity of petcoke over the whole year
Sbegin ....... Stock of petcoke at the beginning of the year
Send......... Stock of petcoke at the end of the year
The weighbridge (scale interval 25 kg) used for the purchased amount of petcoke delivered on trucks
is subject to Legal Metrological Control.
• Maximum Permissible Error: +/- 1.5 scale intervals.
• Truck deliveries per year: 95
• Typical load on each truck: 30t (=total purchased amount of 2,850t)
• No export of petcoke.
Stock measurements are carried out at year end to determine closing stock / opening stock. There is a
maximum surveyors uncertainty of 1-1.5%. A value of 1.5% is chosen as a worst case scenario.
For the weighbridge (25kg scale interval; typical load of 30t), an adjustment factor of x 2 is applied for
converting the MPE (+/- 1.5 scale intervals) to MPE “in service”.
���� =1.5 ∙ 25�� ∙ 230,000��
= 0.25%
The operator follows the example provided in MRR Guidance Document 4, section 8.3, and provides
you with the following calculation of the overall uncertainty:
��������,(���) =�2 ∙ (1,300 ∙ 1.5%)� + 95 ∙ (30 ∙ 0.25%)�
2,850= 0.97%
1. Do you agree with the way the operator calculated the overall uncertainty?
2. What further supporting evidence would your request from the operator?

Approach Example 2:
Uncertainty Associated with Measurement of Petcoke Activity Data
ad 1)
The general outline of the uncertainty assessment seems to be reasonable. However, the operator
failed to provide you with one very important information: what coverage factor is used for the
uncertainty assessment.
Without further information, the term “uncertainty” is commonly understood as the “standard”
uncertainty, i.e. the uncertainty related to the coverage factor of 1 implying a confidence level of only
68%.
For instance, if the uncertainty related to the stock surveyors of 1.5% only corresponds to the 68%
confidence level (k=1), the whole calculation of the overall uncertainty would only correspond to the
coverage of k=1 and would need to multiplied by 2 to obtain the uncertainty at the 95% level.
Moreover, the operator assumed that individual measurements are uncorrelated. However, in reality
this may not be the case as the same weighbridge is used for all measurements. In the absence of
further information on correlation it would be the more conservative approach to assume correlation
between measurements.
How should the calculations be done if the type of uncertainty distribution is known?
Furthermore, a minor incorrectness (minor only in this specific case due to the figures provided)
concerns the use of the MPES for the weighing bridge. If this was the sole MI used for determination
annual quantities the use of MPES without further adjustment would be allowed by the MRR.
However, this is not the case because also stock changes are factored in as well. Where an MPES is
combined with other uncertainties it would, as a first step, have to be appreciated that an MPES most
commonly exhibits a rectangular distribution and needs to be converted into a standard uncertainty
(k=1) prior to combination. This is achieved by dividing the MPES by the square root of 3.
���� = 0.25%√3
When taking this into account and suppose the uncertainty related to the stock levels is indeed only
the standard uncertainty, the correct calculation should look as follows:
�������,(���) =�2 ∙ (1,300 ∙ 1.5%)� + (2,850 ∙ 0.25%√3 )�
2,850 = √760.5 + 16.92,850 = 0.98%
�������,(���) = 2 ∙ 0.98% = 1.96%
Two things can be seen:
• Firstly, if the uncertainty related to the stock levels only denotes the standard uncertainty, the
highest tier would no longer be achieved because the overall uncertainty at the 95%
confidence level is above 1.5%.
• Secondly, as stated above, the treatment of the MPES only plays a minor role due to the high
stock levels (1,300t) compared to the quantities purchased (2,850).
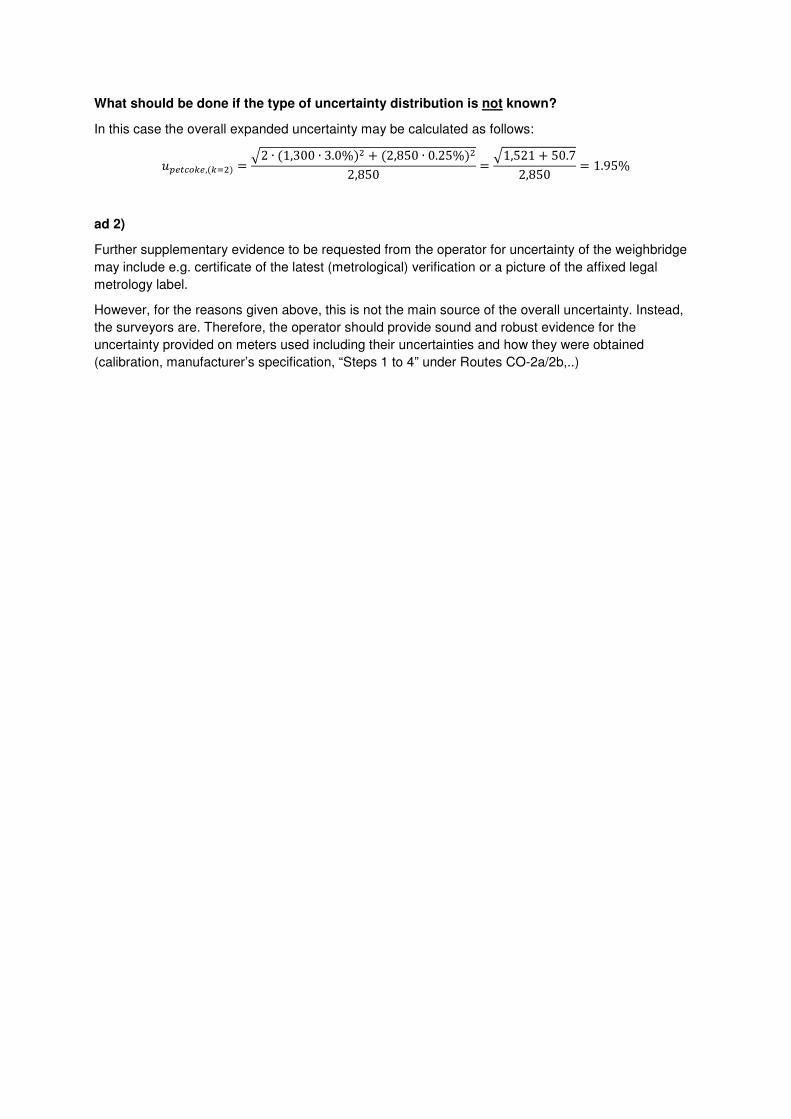
What should be done if the type of uncertainty distribution is not known?
In this case the overall expanded uncertainty may be calculated as follows:
�������,(���) = "2 ∙ (1,300 ∙ 3.0%)� + (2,850 ∙ 0.25%)�2,850 = "1,521 + 50.72,850 = 1.95%
ad 2)
Further supplementary evidence to be requested from the operator for uncertainty of the weighbridge
may include e.g. certificate of the latest (metrological) verification or a picture of the affixed legal
metrology label.
However, for the reasons given above, this is not the main source of the overall uncertainty. Instead,
the surveyors are. Therefore, the operator should provide sound and robust evidence for the
uncertainty provided on meters used including their uncertainties and how they were obtained
(calibration, manufacturer’s specification, “Steps 1 to 4” under Routes CO-2a/2b,..)
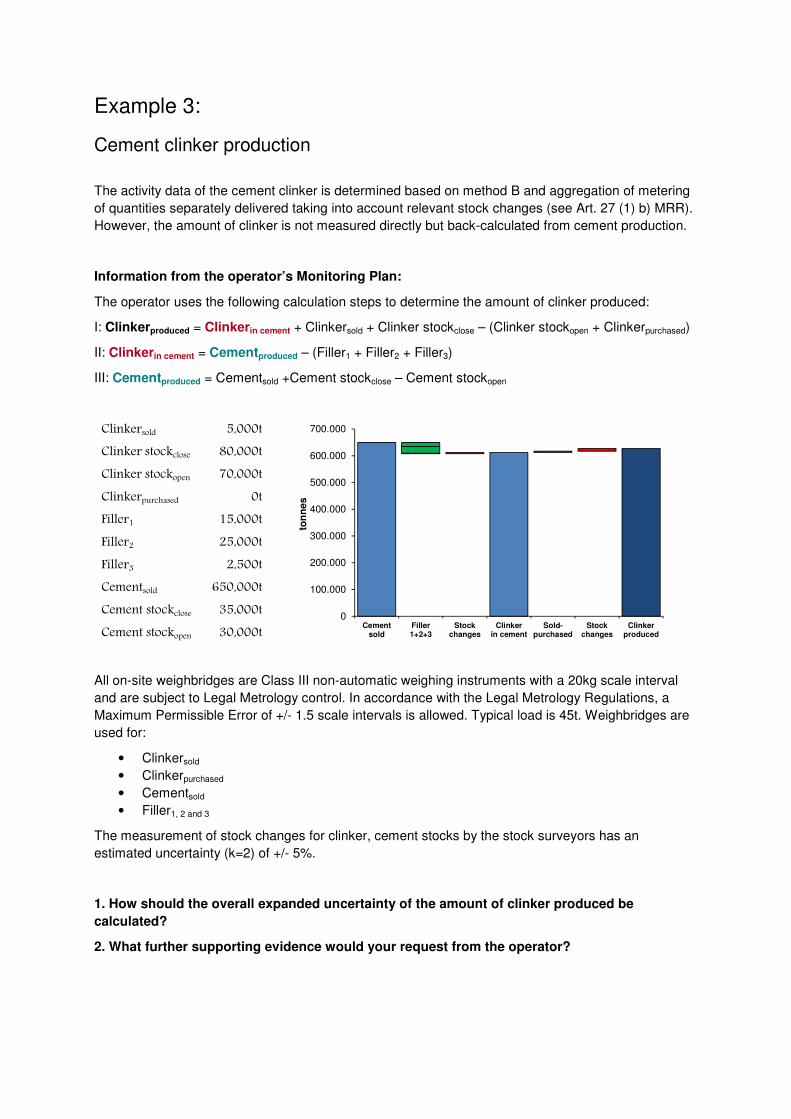
Example 3:
Cement clinker production
The activity data of the cement clinker is determined based on method B and aggregation of metering
of quantities separately delivered taking into account relevant stock changes (see Art. 27 (1) b) MRR).
However, the amount of clinker is not measured directly but back-calculated from cement production.
Information from the operator’s Monitoring Plan:
The operator uses the following calculation steps to determine the amount of clinker produced:
I: Clinkerproduced = Clinkerin cement + Clinkersold + Clinker stockclose – (Clinker stockopen + Clinkerpurchased)
II: Clinkerin cement = Cementproduced – (Filler1 + Filler2 + Filler3)
III: Cementproduced = Cementsold +Cement stockclose – Cement stockopen
Clinkersold 5,000t
Clinker stockclose 80,000t
Clinker stockopen 70,000t
Clinkerpurchased 0t
Filler1 15,000t
Filler2 25,000t
Filler3 2,500t
Cementsold 650,000t
Cement stockclose 35,000t
Cement stockopen 30,000t
All on-site weighbridges are Class III non-automatic weighing instruments with a 20kg scale interval
and are subject to Legal Metrology control. In accordance with the Legal Metrology Regulations, a
Maximum Permissible Error of +/- 1.5 scale intervals is allowed. Typical load is 45t. Weighbridges are
used for:
• Clinkersold
• Clinkerpurchased
• Cementsold
• Filler1, 2 and 3
The measurement of stock changes for clinker, cement stocks by the stock surveyors has an
estimated uncertainty (k=2) of +/- 5%.
1. How should the overall expanded uncertainty of the amount of clinker produced be
calculated?
2. What further supporting evidence would your request from the operator?
0
100.000
200.000
300.000
400.000
500.000
600.000
700.000
Cementsold
Filler1+2+3
Stockchanges
Clinkerin cement
Sold-purchased
Stockchanges
Clinkerproduced
ton
ne
s

Approach Example 3:
Cement clinker production
ad 1)
For weighbridges (20kg scale interval; typical load of 45t), an adjustment factor of x 2 is applied for
converting the MPE (+/- 1.5 scale intervals) to MPE “in service”.
���� =1.5 ∙ 20� ∙ 245,000�
= 0.14%
ParameterParameterParameterParameter QuantityQuantityQuantityQuantity Relative Relative Relative Relative
uncertainty(k=2)uncertainty(k=2)uncertainty(k=2)uncertainty(k=2)
Clinkersold 5,000t 0.14%
Clinker stockclose 80,000t 5%
Clinker stockopen 70,000t 5%
Clinkerpurchased 0t 0.14%
Filler1 15,000t 0.14%
Filler2 25,000t 0.14%
Filler3 2,500t 0.14%
Cementsold 650,000t 0.14%
Cement stockclose 35,000t 5%
Cement stockopen 30,000t 5%
III: Cementproduced = Cementsold +Cement stockclose – Cement stockopen
��������������� =�(650,000 ∙ 0.14%)! + (35,000 ∙ 5%)! + (30,000 ∙ 5%)!
650,000 + 35,000 − 30,000= 0.38%
II: Clinkerin cement = Cementproduced – (Filler1 + Filler2 + Filler3)
��&'�(��'������� =�(655,000 ∙ 0.38%)! + (15,000 ∙ 0.14%)! + (25,000 ∙ 0.14%)! + (2,500 ∙ 0.14%)!
655,000 − 15,000 − 25,000 − 2,500= 0.40%
I: Clinkerproduced = Clinkerin cement + Clinkersold + Clinker stockclose – (Clinker stockopen + Clinkerpurchased)
��&'�(���������� =�(612,500 ∙ 0.40%)! + (5,000 ∙ 0.14%)! + (80,000 ∙ 5%)! + (70,000 ∙ 5%)! + 0
612,500 + 5,000 + 80,000 − 70,000 − 0= 0.93%
ad 2)
Further supplementary evidence to be requested from operator for uncertainty of the weighbridges
may include e.g. certificates of the latest (metrological) verification or pictures of the affixed legal
metrology label. In addition to that, the operator should provide you with further evidence of how he
determined the uncertainty of 5% for the stock surveyors (Note that even if only an uncertainty of 8%
could be demonstrated for the stock surveyors, the overall uncertainty would still be below the 1.5%
threshold, thus in compliance with the highest tier)
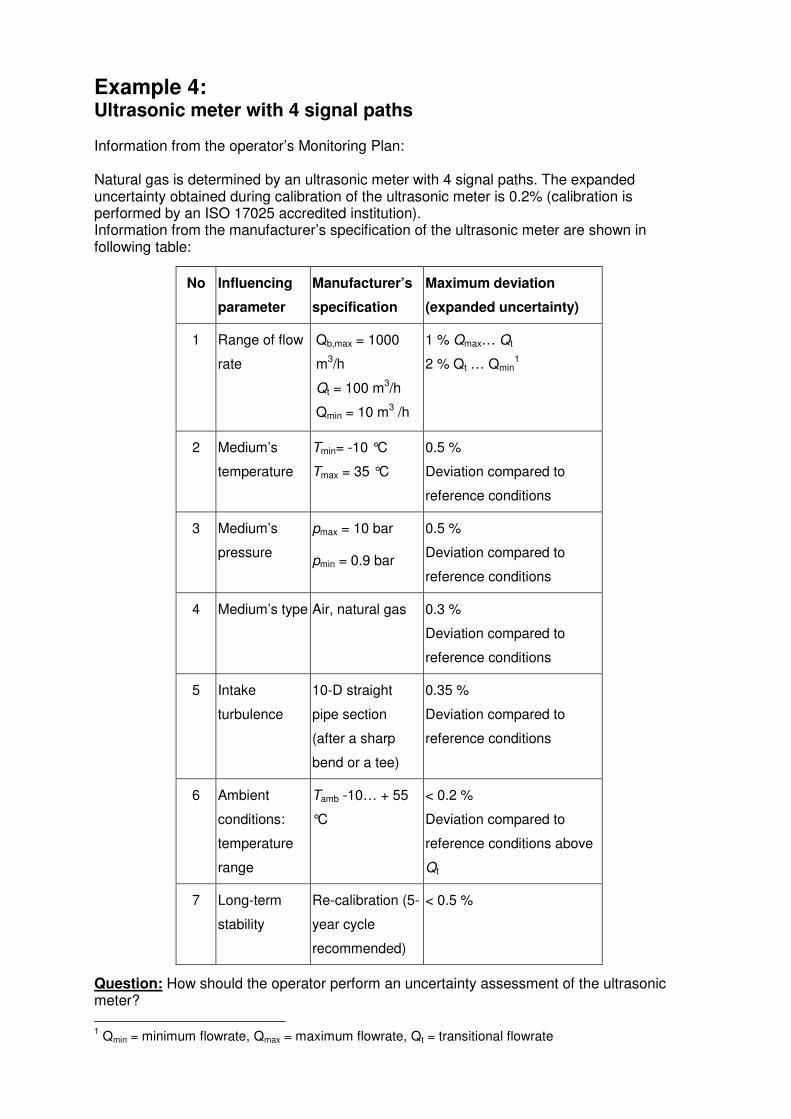
Example 4: Ultrasonic meter with 4 signal paths
Information from the operator’s Monitoring Plan:
Natural gas is determined by an ultrasonic meter with 4 signal paths. The expanded
uncertainty obtained during calibration of the ultrasonic meter is 0.2% (calibration is
performed by an ISO 17025 accredited institution).
Information from the manufacturer’s specification of the ultrasonic meter are shown in
following table:
Question: How should the operator perform an uncertainty assessment of the ultrasonic
meter?
1 Qmin = minimum flowrate, Qmax = maximum flowrate, Qt = transitional flowrate
No Influencing
parameter
Manufacturer’s
specification
Maximum deviation
(expanded uncertainty)
1 Range of flow
rate
Qb,max = 1000
m3/h
Qt = 100 m3/h
Qmin = 10 m3 /h
1 % Qmax… Qt
2 % Qt … Qmin
1
2 Medium’s
temperature
Tmin= -10 °C
Tmax = 35 °C
0.5 %
Deviation compared to
reference conditions
3 Medium’s
pressure
pmax = 10 bar
pmin = 0.9 bar
0.5 %
Deviation compared to
reference conditions
4 Medium’s type Air, natural gas 0.3 %
Deviation compared to
reference conditions
5 Intake
turbulence
10-D straight
pipe section
(after a sharp
bend or a tee)
0.35 %
Deviation compared to
reference conditions
6 Ambient
conditions:
temperature
range
Tamb -10… + 55
°C
< 0.2 %
Deviation compared to
reference conditions above
Qt
7 Long-term
stability
Re-calibration (5-
year cycle
recommended)
< 0.5 %

Example 4 - Approach:
Operator’s description of measures for adhering to manufacturer’s specifications
COM Gudiance Nr. 4 approach (route CO-2b):
������ = �. % ∗ = �. %
Germany’s approach:
������ = √� + �. � + �. � + �. � + �. �� + �. + �. � = 1.42%
No Influencing
parameter
Manufacturer’s
specification
Maximum deviation Operator’s description of measures for adhering
to manufacturer’s specifications
1 Range of flow
rate
Qb,max = 1000
m3/h
Qt = 100 m3/h
Qmin = 10 m3 /h
1 % Qmax… Qt
2 % Qt … Qmin
Average flow rate exceeding Qt
2 Medium’s
temperature
Tmin= -10 °C
Tmax = 35 °C
0.5 %
Deviation compared to
reference conditions
The medium is transported in a buried pipeline. The
pipeline is thermally insulated between the
measuring device and the point where the pipeline
leaves the earth.
3 Medium’s
pressure
pmax = 10 bar
pmin = 0.9 bar
0.5 %
Deviation compared to
reference conditions
Safety valves guarantee that the pressure remains
within specifications.
4 Medium’s type Air, natural gas 0.3 %
Deviation compared to
reference conditions
Only natural gas is used.
5 Intake
turbulence
10-D straight
pipe section
(after a sharp bend
or a tee)
0.35 %
Deviation compared to
reference conditions
The measuring instrument is installed after a 15-D
straight pipe length downstream. The diameter of the
inlet pipe is 1 % greater than the diameter of the
measuring instrument.
6 Ambient
conditions:
temperature
range
Tamb -10… + 55 °C < 0.2 %
Deviation compared to
reference conditions
above Qt
The measuring instrument is installed in an unheated
insulated container that is equipped with a fan to the
environment when the temperature within the
container should rise above 35 °C.
7 Long-term
stability
Re-calibration (5-
year cycle
recommended)
< 0.5 % Requirement which is integrated in the operator’s
quality management

Example 5: Belt weigher not subject to national metrological control
Information stated by the operator in the Monitoring Plan for your approval:
• Estimated emissions from the source stream: 90,000 t CO2/a
• Specification of measuring instrument: o Operator’s own measuring instrument
o Type of measuring instrument: „belt weigher“
o Measuring range: 0-40 t/h
o Typical use range: 27 t/h
• Specification of quality assurance: o Calibrated measuring instrument (not subject to national metrological control)
o Measuring instrument’s uncertainty: 1.10%
o Interval of checking: 3 years
o Previous date of checking: January 2015
o Description of quality assurance and uncertainty assessment: see checking
protocols 2013 and 2015
1) What information is missing or unclear? 2) Which information can be gained from the checking protocols (e.g. by comparing 2013 and 2015 results)? 3) What should the operator be asked to do/justify?

Checking protocol 2013, page 1
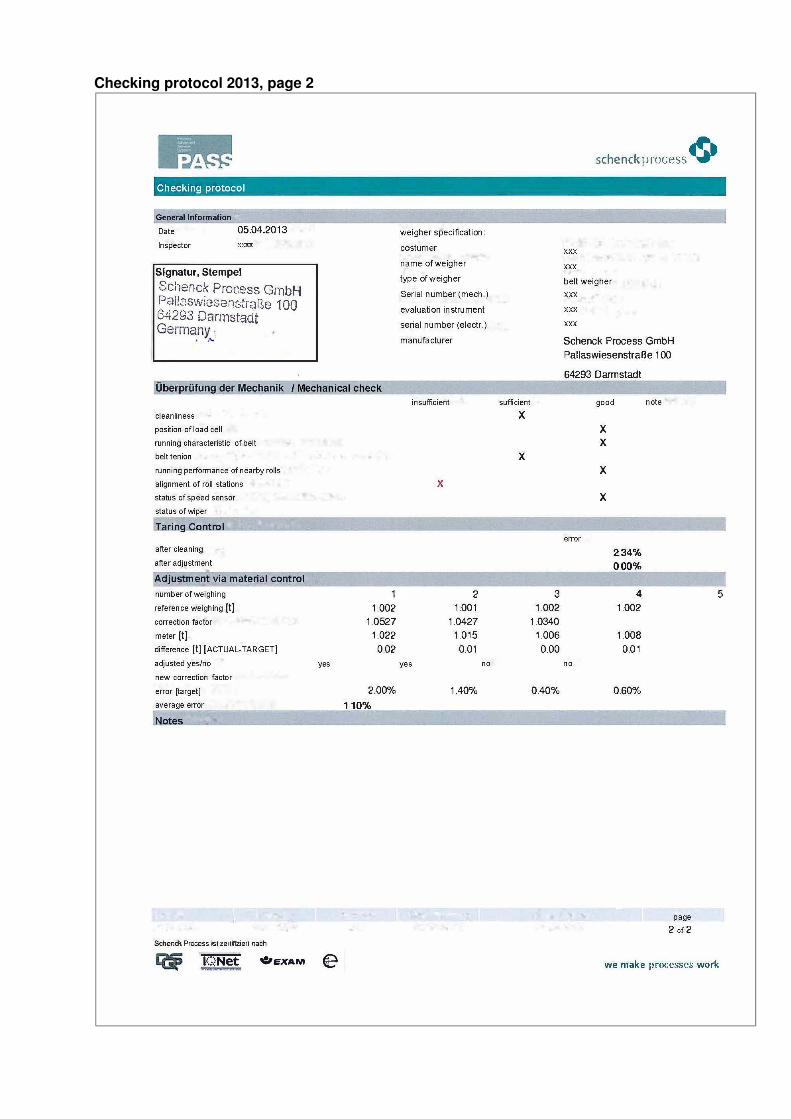
Checking protocol 2013, page 2

Checking protocol 2015, page 1

Checking protocol 2015, page 2

Example 5 - Approach:
Ad 1) According to the checking protocols the quality assurance of the belt weigher is carried out
both by comparison measurement and by checking the load cells and the belt speed.
A calibration of a belt weigher is performed by a comparison measurement of a defined
source stream amount on an officially (metrological) verified measuring instrument. The
checking of the load cell (e.g. through placing or hanging weights or roller chains) and of the
belt speed via test equipment, is not a “real” calibration, because the influence of the belt
itself is not considered when checking the load cell (belt is lifted from the load cell).
From the protocols it is not clear which method (calibration with reference measuring
instrument or checking load cell and belt speed) is the primary method for quality assurance.
Ad 2) In the checking protocol 2013 the set correction factor is not identical with the correction
factor at actual state in the protocol 2015. This indicates that between 2013 and 2015 a
change of the correction factor was carried out. However the operator stated that no other
checks were performed until now in the 3rd trading period.
In order to determine the uncertainty associated with long-term stability (drift) of the belt
weigher (most important influencing parameter), the results during a check have to be
documented both before and after the checking.
After checking the belt weigher in 2013, a deviation of 0.4-0.6% was documented. In 2015
the belt weigher showed a deviation of 12% at actual state after two years of operation. Due
to only one check via material control performed, no further reliable data is available.
However it is clear, that the required tier of 1.5% cannot be met with 12% deviation.
Ad 3) CA’s request:
• The operator should be required to deliver an explanation on the primary method for
quality assurance of the belt weigher
• To reduce the drift, the operator should be required to raise his frequency of checking
by dividing in half the interval of checking
• The operator should be required to justify, why the error remained undetected despite
quality assurance measures.

Example 6:
Steel production – tar on ships
A steel producer produces tar which is exported to consumers by ships. The amount of tar leaving the
installations is part of the mass balance applied by the operator and is one of the outgoing source streams.
The quantity of the tar is measured by radar tank gauge technology. This technology measures the distance from
a single point to the surface of the tar in the tank. With an internal algorithm the volume of the tar can be
measured. This volume needs then to be converted into a mass by a measurement of the density which is
determined by analysis of tar samples.
• Amount of tar exported per year: 90,000m³
• Average density of the tar: 0.83t/m³
The amount of tar exported is calculated as follows:
Total amount of tar (t) = Volume of tar (m³)* · ρ (t/m³)
The uncertainties related to the measurements are:
• Standard uncertainty (i.e. k=1) of this source stream: 0.75%
• Uncertainty (k=1) of the pycnometer1 used for the density: 1%
The operators follow the solution example 1 of Guidance Document 4 of the Commission:
1. Does the operator comply with the highest tier (1.5%)?
2. What further supporting evidence would your request from the operator?
1 The operator provided evidence by submitting the latest calibration certificate of the pycnometer and
multiplying the result by a conservative estimation factor of 2.

Approach Example 6:
Steel production – tar on ships
ad 1)
With the use of the formula in Guidance Document 4 the operator would obtain the following overall
uncertainty:
�����,(��) = �0.75%� + 1%� = 1.25%
�����,(���) = 2 ∙ 1.25% = 2.5%
As a result, the operator does not achieve the highest tier and would have either to improve the
measurement quality or demonstrate technical infeasibility or unreasonable costs.
It has to be noted though that this approach is only applicable if uncertainties associated with the
determination of volume and density are independent (i.e. uncorrelated). If both volume and density
are measured at the same temperature, this approach seems reasonable. However, volume and
density are strongly negatively correlated via temperature, i.e. higher temperatures lead to volume
expansion but at the same time to a lower density.
Although, despite this correlation, it has to be born in mind that temperature is just one of the
influencing parameters on the overall uncertainty. This means that while both values being correlated
the uncertainties associated with the radar tank gauge and the pycnometer may not. For instance, if
the uncertainty of the radar tank gauge is largely attributable to its drift or other source of uncertainty
and to the temperature only to negligible extent. In such a case, small deviations in temperature would
only have small impact on the measurement’s uncertainty.
Furthermore, as volume and density are negatively correlated (0 ≥ correlation coefficient ≥ -1),
uncertainties would outweigh each other to some extent (see for instance formula (16) in the GUM).
Therefore, in contrast to a positive correlation with a correlation coefficient of 1 (see example 6 in
GD4), assuming independence (i.e. uncorrelated input quantities) would provide the more
conservative results (i.e. higher uncertainty) for this case anyway.
Nevertheless, the operator should be required to explain the measurements in more detail, e.g.
whether they are conducted in accordance with appropriate standards and whether the usual
temperature during measurement is covered by the uncertainties provided and within allowed ranges.
This information may be supported if the operator can demonstrate that the temperature-induced
thermal expansion has only a negligible effect compared to the other sources of uncertainties. The
latter would be particularly helpful if density measurements are not carried out at different
temperatures, e.g. in a laboratory under controlled climatic conditions. Furthermore, the operator
should demonstrate that sampling for analysis of the density is done representatively, e.g. by providing
a suitable sampling plan.
ad 2)
Since the tar exported on ships is presumably sold to third parties the radar tank gauge may be
subject to legal metrological control. If this is the case, the operator should provide evidence for the
MPES of the radar tank gauge e.g. certificates of the latest (metrological) verification or pictures of the
affixed legal metrology label. Where this is not available or no relevant legal metrological control is in
place, the operator would have to demonstrate other sound and robust evidence for the uncertainty,
e.g. calibration, manufacturer’s specifications, “Steps 1 to 4” under Routes CO-2a/2b,..

Example 7: Aggregation of metering of quantities delivered and consideration of relevant stock changes
The activity data of a solid source stream is determined based on aggregation of metering of
quantities separately delivered taking into account relevant stock changes: (see Art. 27 (1) b)
MRR)
Information from the operator’s Monitoring Plan:
Uncertainties of measuring instruments
• truck scale (subject to national metrological control): o Maximum permissible error in service: U1 = 1.0%
• draft survey1 (subject to national metrological control): o Maximum permissible error in service: U2 = 1.0%
• measuring system for stock changes (belt weighers) o Overall expanded uncertainty of the measuring system: U3 = 7.5%
Amounts determined by measuring instruments:
• truck scale: o x1 = 0.5 Mio. t
• draft survey: o x2 = 1.5 Mio. t
• measuring system for stock changes (belt weighers) o x3 = 150,000 t
Question: How to calculate the overall uncertainty associated with the determination
of the source stream’s activity data?
1 A draft survey is a calculation of the weight of cargo loaded or unloaded to or from a ship from measurements of
changes in its displacement (Archimedes' principle)

Example 7 - Approach:
Determination of the overall uncertainty:
1) Simplified approach (assumption of Gaussian distribution for all errors)
� no conversion to standard uncertainty necessary to calculate the combined
uncertainty at 95 percentile
������ = �(� ∗ �) + (� ∗ � ) + (�� ∗ ��) |� + � + ��|
������ = �(% ∗ ���, ���) + (% ∗ , ���, ���) + ∗ (�. �% ∗ ��, ���) |���, ��� + , ���, ��� + ��, ���|
expanded uncertainty: ������,�� =1.0%
2) Approach according to GUM
As a first step, the MPES (for truck scale and draft survey), which are usually of a rectangular
distribution, have to be converted to a standard uncertainty by dividing by the square root of
3:
��� = �� !√3 = 1.0%√3
Subsequently, with an expanded uncertainty of 7.5% (for the belt weighers) for stock
changes, a standard uncertainty has to be calculated by dividing 7.5% (expanded
uncertainty) by the factor 2 (because of Gaussian distribution) to 3.75%. Furthermore,
uncertainties associated with stock level readings have to be taken into account for both,
reading at the beginning and at the end of the year (indicated by a multiplier of 2).
������ =&(%√� ∗ ���, ���) + (%√� ∗ , ���, ���) + ∙ (�. ��% ∗ ��, ���)
|���, ��� + , ���, ��� + ��, ���| = �. �(%
expanded uncertainty: ������,�� = ∙ �. �(% = . %
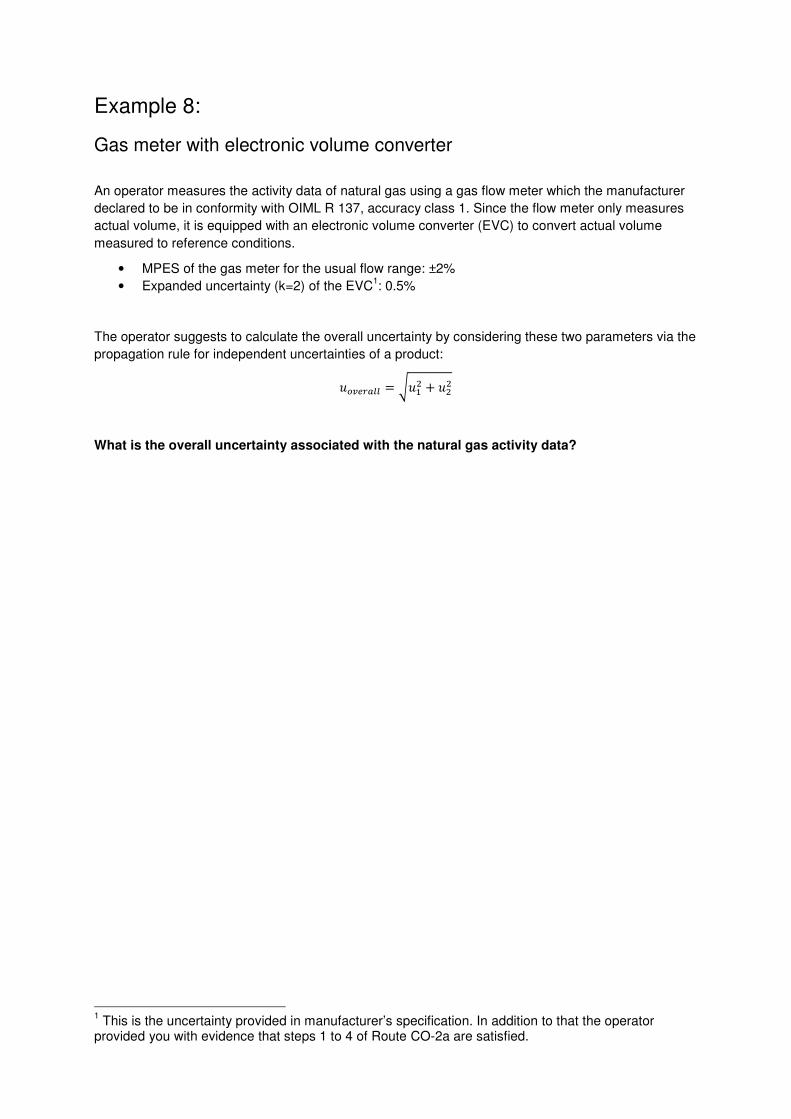
Example 8:
Gas meter with electronic volume converter
An operator measures the activity data of natural gas using a gas flow meter which the manufacturer
declared to be in conformity with OIML R 137, accuracy class 1. Since the flow meter only measures
actual volume, it is equipped with an electronic volume converter (EVC) to convert actual volume
measured to reference conditions.
• MPES of the gas meter for the usual flow range: ±2%
• Expanded uncertainty (k=2) of the EVC1: 0.5%
The operator suggests to calculate the overall uncertainty by considering these two parameters via the
propagation rule for independent uncertainties of a product:
�������� = �� + ���
What is the overall uncertainty associated with the natural gas activity data?
1 This is the uncertainty provided in manufacturer’s specification. In addition to that the operator
provided you with evidence that steps 1 to 4 of Route CO-2a are satisfied.

Approach Example 8:
Gas meter with electronic volume converter
How should the calculations be done if the type of uncertainty distribution is known?
In order to combine uncertainties the MPES for the gas flow meter is divided by the square root of 3 to
account for the rectangular distribution of the MPES. The resulting standard uncertainty (k=1) of the
gas flow meter is combined with the standard uncertainty of the EVC using the formula suggested by
the operator:
���������,( ��) = ��2%√3�� + 0.25%� = 1.18%
Finally, in order to obtain the overall uncertainty at the 95% confidence level, a coverage factor of two
is applied to the combined uncertainty above:
expanded uncertainty: ���������,( ��) = 2 ∙ 1.18% = 2.36%
What should be done if the type of uncertainty distribution is not known?
In this case the overall expanded uncertainty may be calculated as follows:
���������,( ��) = "2%� + 0.5%� = 2.06%
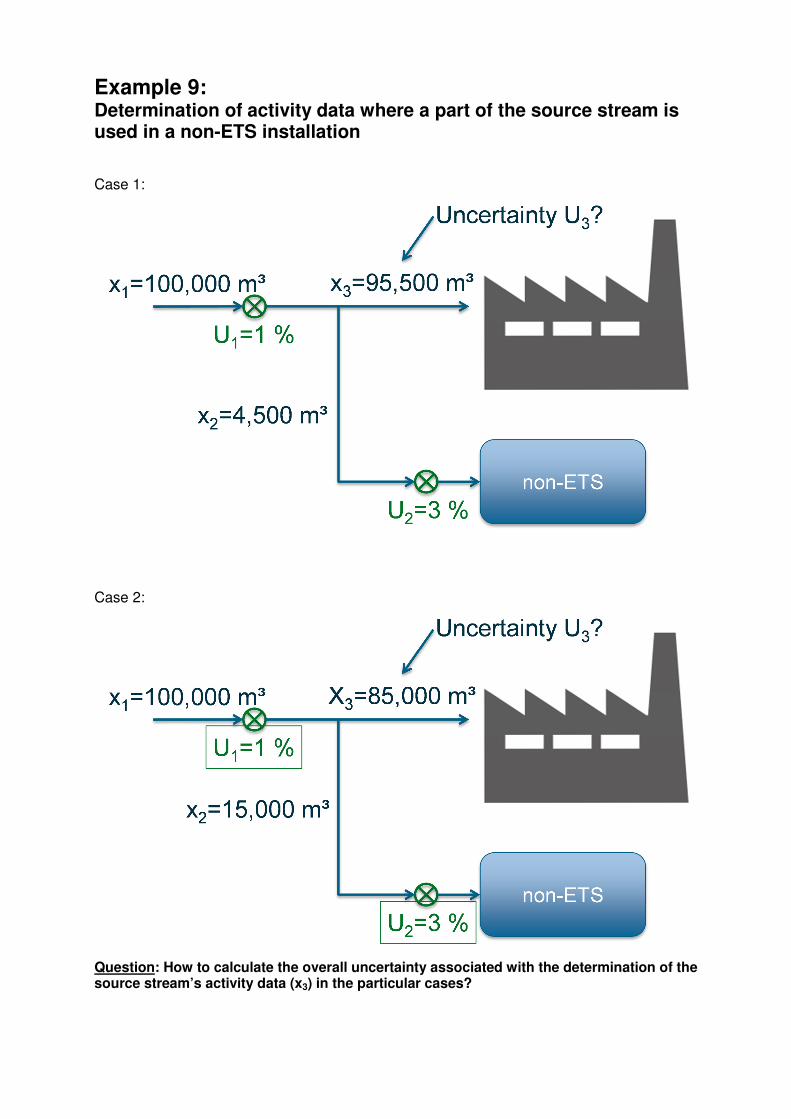
Example 9: Determination of activity data where a part of the source stream is used in a non-ETS installation
Case 1:
Case 2:
Question: How to calculate the overall uncertainty associated with the determination of the source stream’s activity data (x3) in the particular cases?
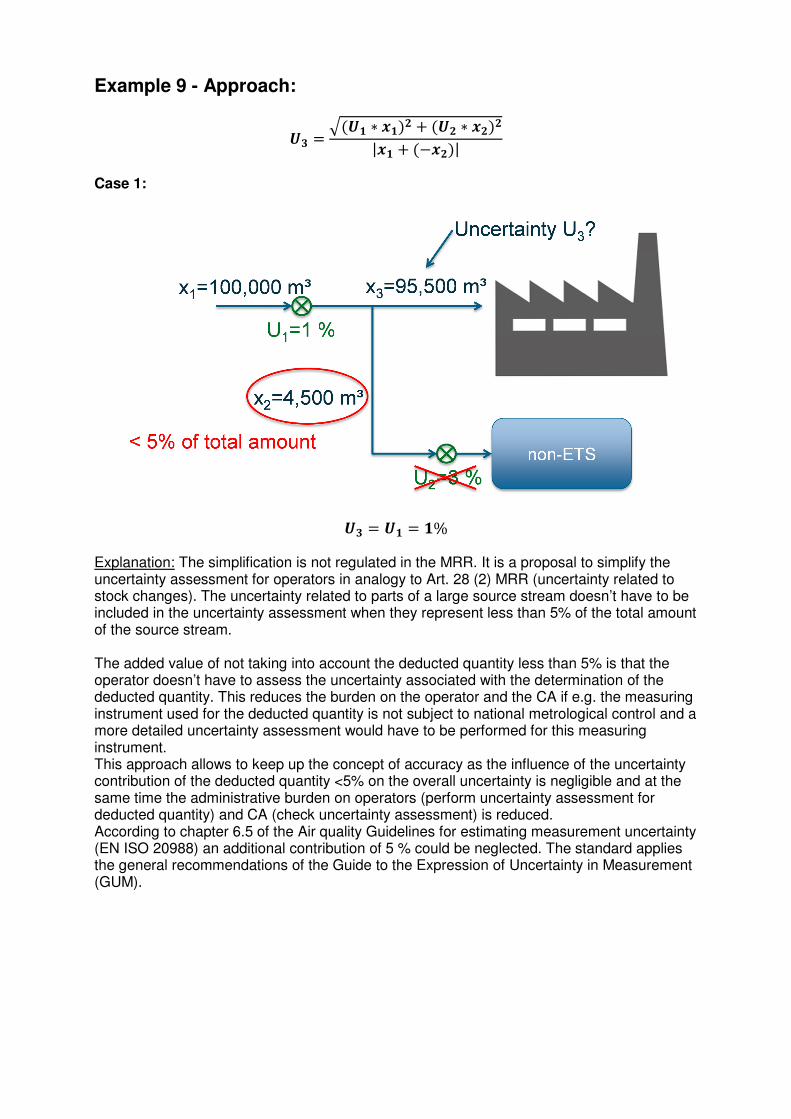
Example 9 - Approach:
�� ����� ∗ �� � �� ∗ �
|�� � � �|
Case 1:
�� � �� � �%
Explanation: The simplification is not regulated in the MRR. It is a proposal to simplify the
uncertainty assessment for operators in analogy to Art. 28 (2) MRR (uncertainty related to
stock changes). The uncertainty related to parts of a large source stream doesn’t have to be
included in the uncertainty assessment when they represent less than 5% of the total amount
of the source stream.
The added value of not taking into account the deducted quantity less than 5% is that the
operator doesn’t have to assess the uncertainty associated with the determination of the
deducted quantity. This reduces the burden on the operator and the CA if e.g. the measuring
instrument used for the deducted quantity is not subject to national metrological control and a
more detailed uncertainty assessment would have to be performed for this measuring
instrument.
This approach allows to keep up the concept of accuracy as the influence of the uncertainty
contribution of the deducted quantity <5% on the overall uncertainty is negligible and at the
same time the administrative burden on operators (perform uncertainty assessment for
deducted quantity) and CA (check uncertainty assessment) is reduced.
According to chapter 6.5 of the Air quality Guidelines for estimating measurement uncertainty
(EN ISO 20988) an additional contribution of 5 % could be neglected. The standard applies
the general recommendations of the Guide to the Expression of Uncertainty in Measurement
(GUM).
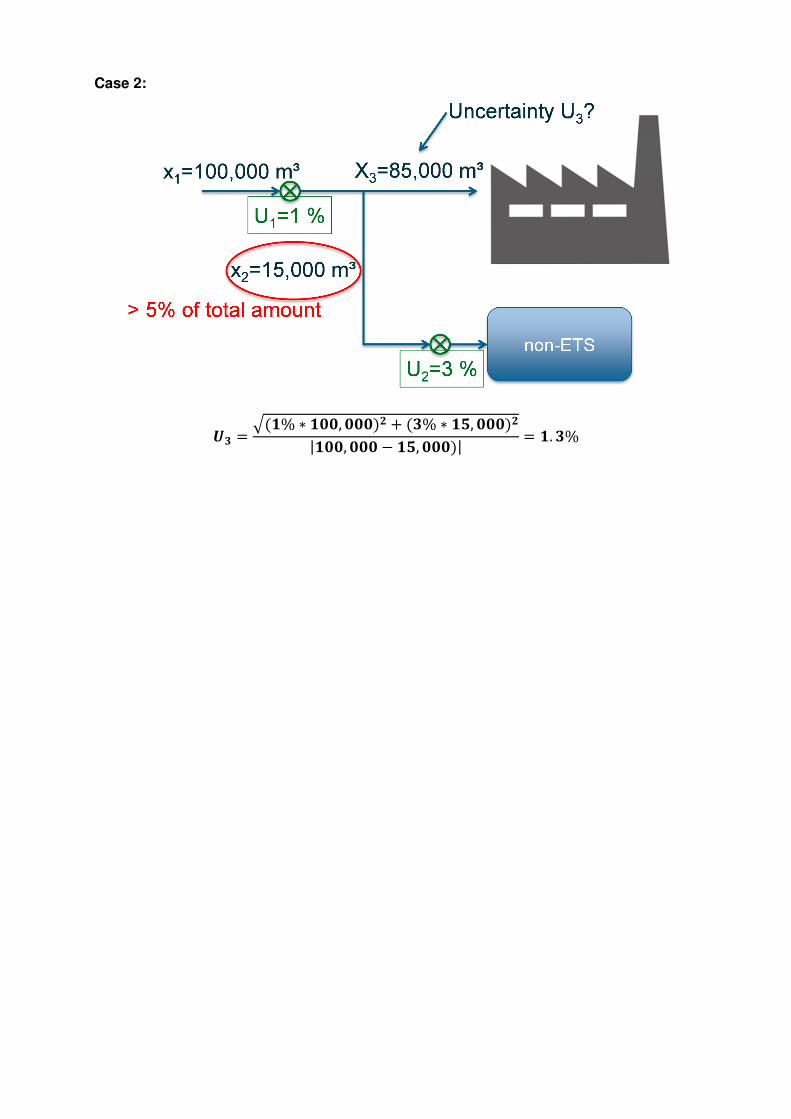
Case 2:
�� ����% ∗ ���, ��� � ��% ∗ ��, ���
|���, ��� ��, ���|� �. �%

Example 10:
Gaseous fuels – uncertainty of orifice meters
Orifice meters are, amongst others (turbine, vortex, ultrasonic…), common measuring instruments
used for the determination of activity data of gaseous fuels such as natural gas or other process gases
used in e.g. refineries, steel plants or chemical plants. The measurement principle is based on
Bernoulli’s principle by establishing a relation between a measured differential pressure and the
volumetric gas flow. The appropriate use of orifice meter is covered by ISO standard 51671.
The mass flow rate (FM) is the product of the volumetric flow rate (FV) and the fuel density (ρ). In case
of gaseous fuels the density is influenced by temperature, pressure and composition of the gas. If
these parameters are not constant one has to take them into account in the uncertainty assessment.
T
pMWpdCFM **
20 ∆⋅⋅=
By means of propagation of uncertainties, the combined uncertainty associated with the mass flow is
determined by the following mathematical relationship2:
Composition Uncertainty
Constant 222
*5.0 PTVM UUUU ++=
Variable 2222
*5.0 MWPTVM UUUUU +++=
C ............ a constant taking into account the discharge coefficient, expansion coefficient and several
other parameters that are nearly constant, hence negligible
d0 ............ diameter of the orifice plate opening
UM .......... uncertainty on quantity FM of fuel consumed in a year (in %)
UV ........... uncertainty on orifice meter (also applicable to all other ∆p-meters such as orifices, dall
tubes, annubar, venturi’s, etc. or speed in case of turbine-, vortex-, ultrasonic meters and others) (%)
UT ........... uncertainty of the temperature of a gaseous fuel at the metering point ( %)
UP ........... uncertainty of the pressure of a gaseous fuel at the metering point (in %)
UMW ........ uncertainty of the averaged molecular weight of a gaseous fuel (%).
1 ISO 5167 Measurement of fluid flow by means of pressure differential devices inserted in circular cross-section
conduits running full
2 Note: Following the principles in ISO 5167, several other parameters are influencing the flow rate’s uncertainty
as well, e.g. the discharge coefficient, expansion coefficient, etc. However, as these uncertainties are in general
small and negligible compared to the other sources of uncertainty, they are omitted here.

Determination of the uncertainty of the composition (UMW):
In case the molecular weight is measured with an on-line gas analyser such as a gas chromatograph,
an excel-tool was developed in cooperation between several operators and the VBBV for calculation
of UMW (see presentation by Xavier Martens in the session: “How to check compliance”).
The correct operation of a gas chromatograph must be checked regularly (weekly, monthly,..). For this
purpose, a reference with known composition is fed to the analyser and the deviation to the reference
is noted for each component. This action is called ‘validation. The output is UMW.
This tool is now in use by almost all Flemish chemical companies and refineries to their satisfaction.