eu-28 fresh deciduous fruit annual 2018 - gain.fas.usda.gov gain publications/fresh deciduous... ·...
TRANSCRIPT
THIS REPORT CONTAINS ASSESSMENTS OF COMMODITY AND TRADE ISSUES MADE BY
USDA STAFF AND NOT NECESSARILY STATEMENTS OF OFFICIAL U.S. GOVERNMENT
POLICY
Date:
GAIN Report Number:
Approved By:
Prepared By:
Report Highlights:
In Marketing Year 2018/19, apple, pear, and table grape production in the European Union is forecast to
be significantly up after low production in the previous year. Expectations for apple production are for
a 34 percent increase compared to the frost-stricken previous year, which would represent the largest
production ever recorded in the EU. The forecast for pear production is up four percent while the
increase for table grapes is forecast at eleven percent. As a result of the high domestic supply, imports
of apples and pears are expected to decline, whereas exports are forecast to increase.
Roswitha Krautgartner, Tania De Belder, Sabine Lieberz,
Marcel Pinckaers, Ornella Bettini, and the group of FAS fruit
specialists in the EU
Emily Scott
2018
Fresh Deciduous Fruit Annual
EU-28
AU1809
10/30/2018
Required Report - public distribution
EU-28 Fresh Deciduous Fruit Annual Report 2018
2
This report covers the commodities:
Apples, Fresh Pears, Fresh
Table Grapes, Fresh
Disclaimer: This report presents the situation and outlook for apples, pears, and table grapes in the EU-28. This
report presents the views of the authors and does not reflect the official views of the U.S. Department of
Agriculture (USDA). The data are not official USDA data.
This report was a group effort of the following FAS analysts:
Xavier Audran FAS/Paris covering France
Tania De Belder USEU/FAS Brussels covering Belgium, Luxemburg, and EU policy
Ornella Bettini FAS/Rome covering Italy
Mila Boshnakova FAS/Sofia covering Bulgaria
Monica Dobrescu FAS/Bucharest covering Romania
Dimosthenis Faniadis FAS/Rome covering Greece
Gellert Golya FAS Budapest covering Hungary
Mira Kobuszynska FAS/Warsaw covering Poland, Lithuania, and Latvia
Roswitha Krautgartner FAS/Vienna covering Austria and Slovenia
Sabine Lieberz FAS/Berlin covering Germany
Jana Mikulasova FAS/Prague covering the Czech Republic and Slovakia
Andreja Misir FAS/Zagreb covering Croatia
Marcel Pinckaers FAS/The Hague covering the Netherlands, Denmark, Finland and Sweden
Carmen Valverde FAS/Madrid covering Spain and Portugal
Jennifer Wilson FAS/London covering the U.K. and Ireland
The chapters were coordinated by:
Overall coordination Roswitha Krautgartner
Policy Tania De Belder
Apples Sabine Lieberz
Pears Marcel Pinckaers
Table Grapes Ornella Bettini
EU-28 Fresh Deciduous Fruit Annual Report 2018
3
Table of Contents:
Policy
Apples
Pears
Table Grapes
Trade Fairs
Abbreviations and definitions used in this report:
APHIS Animal and Plant Health Inspection Service
CAJ Concentrated Apple Juice
CAP Common Agricultural Policy
CMO Common Market Organization
DG Directorate General
DPA Diphenylamine
e Estimate
EU European Union
EE Eastern European
EFSA European Food Safety Authority
EPS Entry Price System
FAS Foreign Agricultural Service
GTA Global Trade Atlas
Ha Hectare; 1 ha = 2.471 Acres
HS Harmonized Commodity Description and Coding System
MT Metric Ton = 1000 kg
MMT Million Metric Tons
MRLs Maximum Residue Levels
MS EU Member State(s)
MY Marketing year
Apples: July/June
Pears: July/June
Table Grapes: June/May
NEF National Framework for Environmental Action
OP Operational Program
PO Producer Organization
PPPs Plant Protection Products
PSD Production, supply and demand
R revised
RMS Rapporteur Member State
RO Reasoned Opinion by EFSA
SFS School Fruit Scheme
UAE United Arab Emirates
U.K. United Kingdom
U.S. United States
USD U.S. Dollar
USDA United States Department of Agriculture
USEU U.S. Mission to the European Union
WAPA World Apple and Pear Association
EU-28 Fresh Deciduous Fruit Annual Report 2018
4
Trade data cited in this report was derived by using the following Harmonized Commodity Description
and Coding System (HS) tariff codes: Apples: 0808 10
Pears: Until 12/31/2011: 0808 20 (pears and quinces);
as of 01/01/2012: 0808 30 (pears)
Table grapes: 0806 10
Policy Coordinated by Tania De Belder/USEU/FAS Brussels
Fresh deciduous fruit falls under the European Union (EU) fruit and vegetables regime and is part of the Common
Agriculture Policy (CAP). The following sections explain the main elements of the EU fruit and vegetables
policy that refer to the fresh deciduous fruit sector. The second part explains the EU measures that were taken in
response to the Russian embargo. The third part lists the upcoming Maximum Residue Levels (MRL) reviews
under Article 12 of Regulation 396/2005.
I. EU Policy Related to Fresh Deciduous Fruit
1. The Common Agriculture Policy
Regulation (EU) No 1308/2013 outlines a framework for market measures under the CAP by the single Common
Market Organization (CMO) and it entered into force on January 1, 2014. The CAP 2020 reform consists of four
basic regulations, supplemented by delegated acts, and amends the implementing rules for the fresh and processed
fruit and vegetables sectors (Commission implementing Regulation (EU) No 543/2011).
On June 1, 2017, Commission Delegated Regulation 2017/891 entered into force and amended regulation
543/2011. The new framework seeks to make Producer Organizations (POs) more attractive to non-members and
provide greater clarity about what actions are eligible for EU funding. The framework seeks to set the maximum
percentage of produce that can be marketed outside the organization to 25 percent in order to create shorter supply
chains where producers can sell directly to consumers. It also simplifies and clarifies legislation with regard to
payments to transnational POs and their associations. In addition, it increases the support for withdrawals for fruit
and vegetable from the market POs.
These market measures under the CAP aim to:
a) Create a more competitive and market-oriented sector
The POs are still the key elements in the EU's CMO for fruit and vegetables. POs are legal entities established by
producers to market commodities, including fresh deciduous fruit. These POs are eligible to receive EU subsidies
instead of individual producers. In order to qualify for EU subsidies, a PO must submit an operational program
financed through an operational fund and directly receives the EU's financial contribution. The basis for the
calculation of the estimated amount of the operational fund is the operational program and the value of the
marketed production. The approval of operational programs happens under Regulation (EU) No 1308/2013.
Fresh fruit and vegetable imports into the EU have to comply with EU-harmonized marketing standards. These
standards apply at all marketing stages and include criteria such as quality, size, labeling, packaging, and
presentation. Commission implementing Regulation (EU) No 543/2011 provides for a general marketing
standard for all fresh fruits and vegetables. Specific marketing standards are still in place for ten products,
including apples and pears, and are set out in Part B of Annex I to this Regulation: for apples in Part 1 of that
same section on page 95 and for pears in Part 6 on page 129.
EU-28 Fresh Deciduous Fruit Annual Report 2018
5
b) Diminish crisis-related fluctuations in producers’ income
To achieve this objective, the EU offers funding under the operational programs for:
- Product withdrawal
- Green harvesting/non-harvesting;
- Promotion/communication tools;
- Training measures;
- Harvest insurance;
- Assistance to secure bank loans, and support for administrative costs associated with setting up mutual
funds.
In their national strategies, the national authorities must determine which of these instruments can receive funds in
their respective countries. The POs may take out loans on commercial terms to finance crisis prevention and
management measures. The repayment of the capital and the interest on those loans may be eligible for financial
assistance under the operational programs of POs.
c) Encourage increased consumption of fruit and vegetables in the EU
The European “School Fruit Scheme” originated in 2009 as a measure to combat child obesity and includes three
elements: free distribution of fruit and vegetables in schools, informational campaigns on healthy eating habits,
and monitoring and evaluation. As in previous years, the EU funds of $164 million (€150 million) were allocated
in the school year 2017/2018 to all of the Member States (MS).
Commission Implementing Decision C(2018) 1762 on the new School Scheme for Milk, Fruit and Vegetables
applies since August 1, 2018.
The sector may also benefit from the European promotion budget for agricultural products and quality schemes.
The Commission reformed its promotion policy with an extension of the product scope and a greater focus on
export markets. The current promotion budget of $76 million (€60 million) will increase annually until it reaches
$255 million (€200 million) in 2020. There will no longer be a need for national co-funding; EU associations will
be able to apply directly for a program.
d) Increase the use of environmentally friendly cultivation and production techniques
At least ten percent of operational program funding must be spent on environmental actions that go beyond
mandatory environmental standards. The EU member states with recognized POs must draw up a National
Framework for Environmental Action (NEF) as part of their “national strategy for sustainable operational
program.” The NEF must contain a non-exhaustive list of environmental actions and the conditions applicable to
them in the concerned MS.
CAP after 2020
On 1 June 2018, the European Commission presented legislative proposals on the CAP beyond 2020. The aim of
the new proposals is to better respond to current and future challenges such as climate change. The CAP will
continue to support European farmers, but the overall budget is lower compared to the previous period. For
information on the CAP after 2020, please see:
https://ec.europa.eu/info/food-farming-fisheries/key-policies/common-agricultural-policy/future-cap_en
2. Certification of Fruit Shipments
Fruit, vegetable, and nut shipments exported to the EU require a phytosanitary certificate. A USDA/Animal Plant
Health Inspection Service (APHIS) inspector issues these certificates in accordance with international regulations
established by the International Plant Protection Convention of the Food and Agriculture Organization of the
United Nations. This standard-setting body coordinates cooperation between nations to control plant and plant
product pests and to prevent their spread.
EU-28 Fresh Deciduous Fruit Annual Report 2018
6
Council Directive 2000/29/EC contains provisions concerning compulsory plant health checks. This includes
documentary, identity, and physical plant health checks to verify compliance with EU import requirements.
There is more information available on the DG Health and Food Safety (DG SANTE) website :
http://ec.europa.eu/food/plant/plant_health_biosecurity/non_eu_trade/index_en.htm
Commission Regulation 1756/2004 provides for a possibility to carry out plant health checks at reduced
frequency when justified. The European Commission published the updated list of products on January 1, 2018.
The Commission monitors imports of fruit and vegetables on an annual basis to determine how to adjust the
frequency of testing consignments.
3. Maximum Residue Levels for Fruit
Maximum Residue Levels (MRLs) for pesticides, including import tolerances, have been harmonized throughout
the EU since September 2008. As a marketing tool, some retail chains in the EU adopt private standards that
exceed EU regulations by requiring their suppliers to adhere to stricter company policies that limit the maximum
residues to 30, 50, or 70 percent of the respective EU MRL. Please find the link to the EU MRL database , as
well as to the global MRL database for MRLs worldwide.
Note: Diphenylamine (DPA) is a pesticide used on apples and pears to prevent scalding but is no longer
authorized for use in the EU. Subsequently, the MRLs for DPA decreased to 0.1 mg/kg for both apples and pears
on March 2, 2014. Since then, the volumes of apples exported to the EU have decreased substantially. Only a
few shippers exporting to Europe have designated special DPA-free facilities to stay below the currently allowed
levels.
4. Tariffs
EU imports of fresh fruit and vegetables are subject to the Entry Price System, which has been in place in its
current form since the Uruguay Round. It is a complex tariff system, which provides a high level of protection to
EU producers. In this system, fruits and vegetables imported at or above an established entry price are charged an
ad valorem duty only. Produce valued below the entry price are charged a tariff equivalent in addition to the ad
valorem duty. The tariff equivalent is graduated for products valued between 92 and 100 percent of the entry
price. The ad valorem duty and the full tariff equivalent are levied on imports valued at less than 92 percent of
the entry price.
Commission Implementing Regulation 2017/1925 published the tariff levels for 2018.
Apples see pages 97 and 687-689
Pears see pages 97 and 689-691
CAJ see pages 168 and 888
Grapes see pages 96 and 686
II. Russian Ban on Agricultural Products
On August 7, 2014, the Russian government implemented a (then) one-year ban on a range of agricultural and
food products, including fresh deciduous fruit, from the United States, the EU, Canada, Australia, and Norway, in
response to U.S. and EU sanctions over Russian actions in Ukraine. Rather than allow the ban to expire, Russia
opted to extend it; the (current) ban runs until December 31, 2019.
EU-28 Fresh Deciduous Fruit Annual Report 2018
7
The CMO rules (see Regulation 1308/2013 in part I) provide various market management tools to stabilize
markets and the Commission is empowered under the reformed CAP to take "exceptional measures" in case of
market disruption. As such, the Commission introduced specific market support measures for the European fruit
and vegetable sector since the start of the ban in 2014 until 2017. The last emergency measures for fruit and
vegetables were phased out on June 30, 2018. The EU granted $588 million (€500 million) of aid to EU
producers of fruit and vegetables corresponding to 1.7 million tons of withdrawals from the market.
Please find more information on the Commission’s response to the Russian ban here:
http://ec.europa.eu/agriculture/russian-import-ban/index_en.htm
III. Upcoming MRL reviews under Article 12 of Regulation 396/2005
Plant protection products (PPPs) along with MRLs and import tolerances are an increasingly important issue in
the EU since there is a significant reduction in the number of active substances approved for use. Regulation
(EC) No 1107/2009 and Regulation (EC) No 396/2005 regulate PPPs and MRLs, respectively. There is a
consistent review of active substances for which the approval is up for renewal, as well as their associated MRLs.
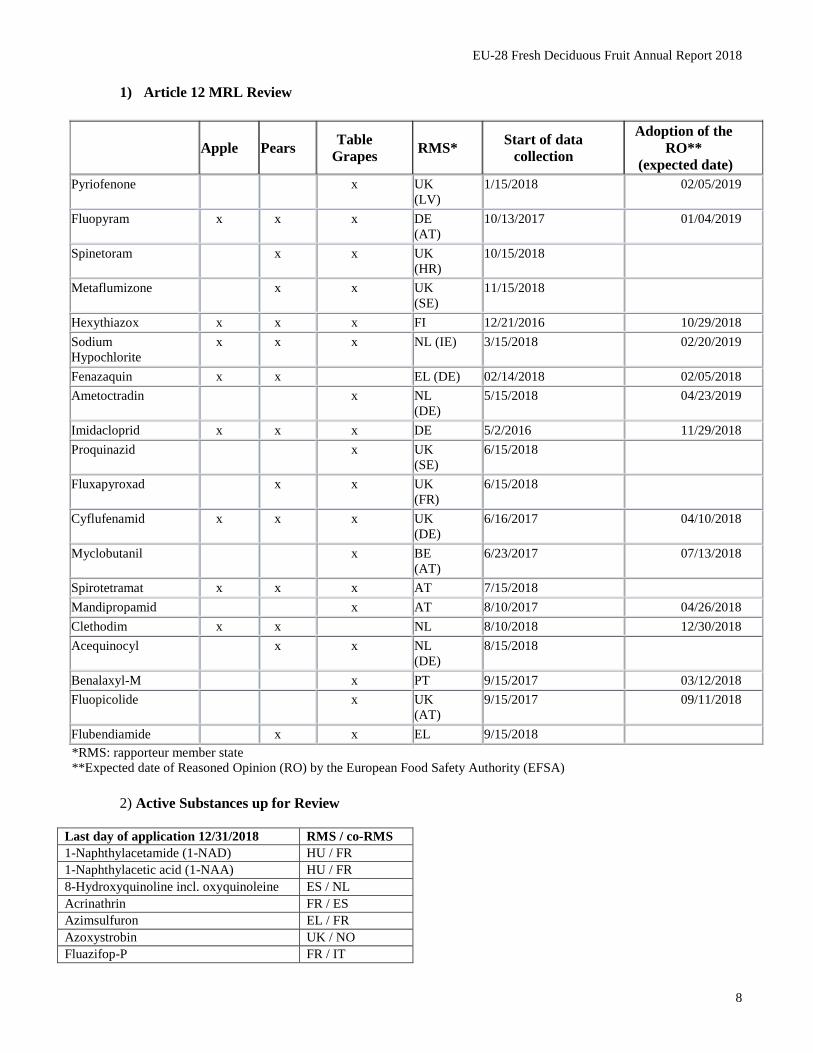
Existing MRLs are also being reviewed through a process known as an Article 12 review. The first list below
indicates the upcoming MRL reviews for the main fresh deciduous fruit commodities under this Article 12
process. The second list includes the active substances which are, or will soon be, up for renewal. It is important
to note that these lists are not all-inclusive. Due to the complexity of the renewal process and the importance of
the issue, stakeholders are encouraged to actively engage early in these review processes by reaching out to
the applicant. Together with the applicant, they can ensure that the necessary data is available for the review or
if trials for data collection are in progress or should be initiated etc, especially if the substance is not used or
authorized in the EU. It is highly recommended to contact the assigned "Rapporteur Member State" (RMS) which
will carry out the first evaluation of the active substance and existing EU pesticide MRLs. Stakeholders are
encouraged to engage with FAS on substances and MRLs of importance to their commodities.
EU-28 Fresh Deciduous Fruit Annual Report 2018
8
1) Article 12 MRL Review
Apple Pears
Table
Grapes RMS*
Start of data
collection
Adoption of the
RO**
(expected date)
Pyriofenone x UK
(LV)
1/15/2018 02/05/2019
Fluopyram x x x DE
(AT)
10/13/2017 01/04/2019
Spinetoram x x UK
(HR)
10/15/2018
Metaflumizone x x UK
(SE)
11/15/2018
Hexythiazox x x x FI 12/21/2016 10/29/2018
Sodium
Hypochlorite
x x x NL (IE) 3/15/2018 02/20/2019
Fenazaquin x x EL (DE) 02/14/2018 02/05/2018
Ametoctradin x NL
(DE)
5/15/2018 04/23/2019
Imidacloprid x x x DE 5/2/2016 11/29/2018
Proquinazid x UK
(SE)
6/15/2018
Fluxapyroxad x x UK
(FR)
6/15/2018
Cyflufenamid x x x UK
(DE)
6/16/2017 04/10/2018
Myclobutanil x BE
(AT)
6/23/2017 07/13/2018
Spirotetramat x x x AT 7/15/2018
Mandipropamid x AT 8/10/2017 04/26/2018
Clethodim x x NL 8/10/2018 12/30/2018
Acequinocyl x x NL
(DE)
8/15/2018
Benalaxyl-M x PT 9/15/2017 03/12/2018
Fluopicolide x UK
(AT)
9/15/2017 09/11/2018
Flubendiamide x x EL 9/15/2018
*RMS: rapporteur member state
**Expected date of Reasoned Opinion (RO) by the European Food Safety Authority (EFSA)
2) Active Substances up for Review
Last day of application 12/31/2018 RMS / co-RMS
1-Naphthylacetamide (1-NAD) HU / FR
1-Naphthylacetic acid (1-NAA) HU / FR
8-Hydroxyquinoline incl. oxyquinoleine ES / NL
Acrinathrin FR / ES
Azimsulfuron EL / FR
Azoxystrobin UK / NO
Fluazifop-P FR / IT

EU-28 Fresh Deciduous Fruit Annual Report 2018
9
Fluquinconazole UK / SK
Fluroxypyr SE / SI
Imazalil (aka enilconazole) NL / BE
Kresoxim-methyl SE / FR
Oxyfluorfen ES / HU
Prochloraz BE / DE
Prohexadione FR / IE
Spiroxamine AT / EE
Tefluthrin HU / DK
Terbuthylazine ES / HR
EU-28 Fresh Deciduous Fruit Annual Report 2018
10
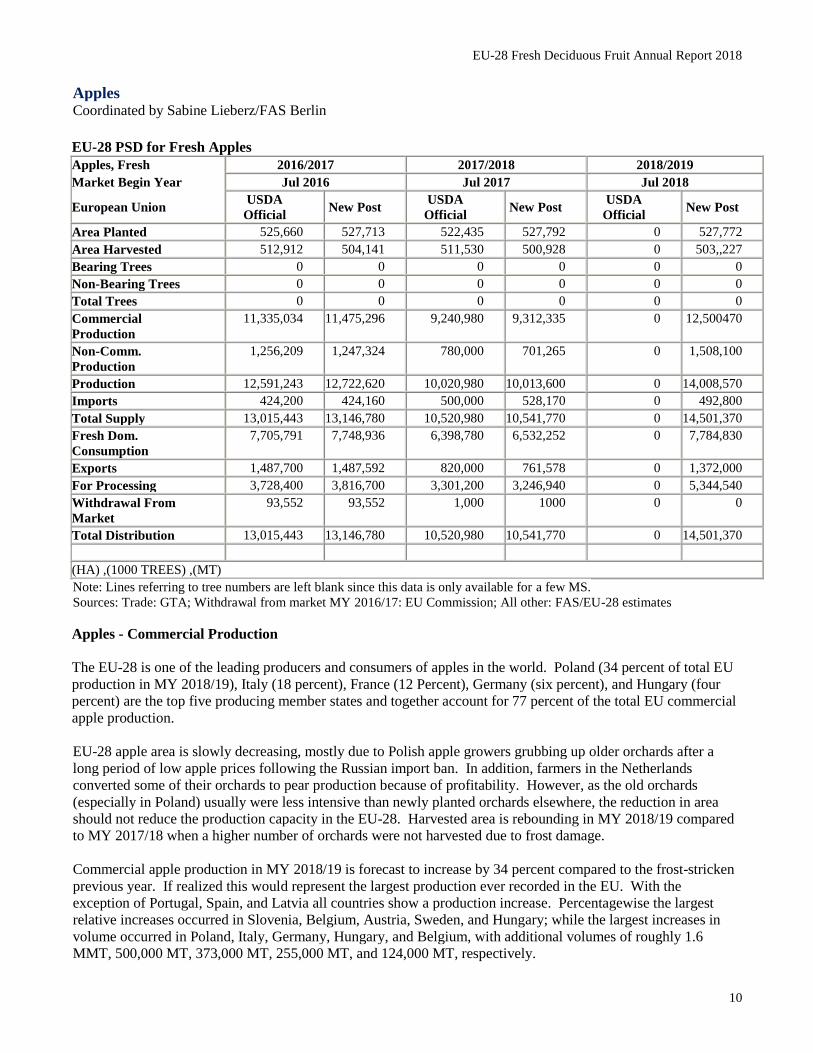
Apples Coordinated by Sabine Lieberz/FAS Berlin
EU-28 PSD for Fresh Apples
Apples, Fresh 2016/2017 2017/2018 2018/2019
Market Begin Year Jul 2016 Jul 2017 Jul 2018
European Union USDA
Official New Post
USDA
Official New Post
USDA
Official New Post
Area Planted 525,660 527,713 522,435 527,792 0 527,772
Area Harvested 512,912 504,141 511,530 500,928 0 503,,227
Bearing Trees 0 0 0 0 0 0
Non-Bearing Trees 0 0 0 0 0 0
Total Trees 0 0 0 0 0 0
Commercial
Production
11,335,034 11,475,296 9,240,980 9,312,335 0 12,500470
Non-Comm.
Production
1,256,209 1,247,324 780,000 701,265 0 1,508,100
Production 12,591,243 12,722,620 10,020,980 10,013,600 0 14,008,570
Imports 424,200 424,160 500,000 528,170 0 492,800
Total Supply 13,015,443 13,146,780 10,520,980 10,541,770 0 14,501,370
Fresh Dom.
Consumption
7,705,791 7,748,936 6,398,780 6,532,252 0 7,784,830
Exports 1,487,700 1,487,592 820,000 761,578 0 1,372,000
For Processing 3,728,400 3,816,700 3,301,200 3,246,940 0 5,344,540
Withdrawal From
Market
93,552 93,552 1,000 1000 0 0
Total Distribution 13,015,443 13,146,780 10,520,980 10,541,770 0 14,501,370
(HA) ,(1000 TREES) ,(MT)
Note: Lines referring to tree numbers are left blank since this data is only available for a few MS.
Sources: Trade: GTA; Withdrawal from market MY 2016/17: EU Commission; All other: FAS/EU-28 estimates
Apples - Commercial Production
The EU-28 is one of the leading producers and consumers of apples in the world. Poland (34 percent of total EU
production in MY 2018/19), Italy (18 percent), France (12 Percent), Germany (six percent), and Hungary (four
percent) are the top five producing member states and together account for 77 percent of the total EU commercial
apple production.
EU-28 apple area is slowly decreasing, mostly due to Polish apple growers grubbing up older orchards after a
long period of low apple prices following the Russian import ban. In addition, farmers in the Netherlands
converted some of their orchards to pear production because of profitability. However, as the old orchards
(especially in Poland) usually were less intensive than newly planted orchards elsewhere, the reduction in area
should not reduce the production capacity in the EU-28. Harvested area is rebounding in MY 2018/19 compared
to MY 2017/18 when a higher number of orchards were not harvested due to frost damage.
Commercial apple production in MY 2018/19 is forecast to increase by 34 percent compared to the frost-stricken
previous year. If realized this would represent the largest production ever recorded in the EU. With the
exception of Portugal, Spain, and Latvia all countries show a production increase. Percentagewise the largest
relative increases occurred in Slovenia, Belgium, Austria, Sweden, and Hungary; while the largest increases in
volume occurred in Poland, Italy, Germany, Hungary, and Belgium, with additional volumes of roughly 1.6
MMT, 500,000 MT, 373,000 MT, 255,000 MT, and 124,000 MT, respectively.

EU-28 Fresh Deciduous Fruit Annual Report 2018
11
EU-28 Fresh Deciduous Fruit Annual Report 2018
12
Throughout Europe growing conditions were favorable for apple production during most of the growing season.
The winter was mild and the major production regions were spared from frost damage. Apple trees were less
affected by the drought in North and North-East Europe than grains, for instance, as they were able to reach
moisture in deeper soil layers thanks to their extensive root system. Fruit quality is generally good to excellent as
the dry weather significantly reduced the occurrence of pests and fungal diseases. However, some concerns
regarding the long-term shelf life exist. Warm temperatures resulted in a two-to-three week earlier harvest
compared to the long-term average date for most countries. In regions where the difference between day and
night temperatures was not large enough to induce appropriate anthocyanin (the red color) production, problems
with insufficient coloring of red varieties are reported. In addition, in some countries, fruit size is smaller than
usual. This applies for example to the Czech Republic, France, Hungary, and the Netherlands.
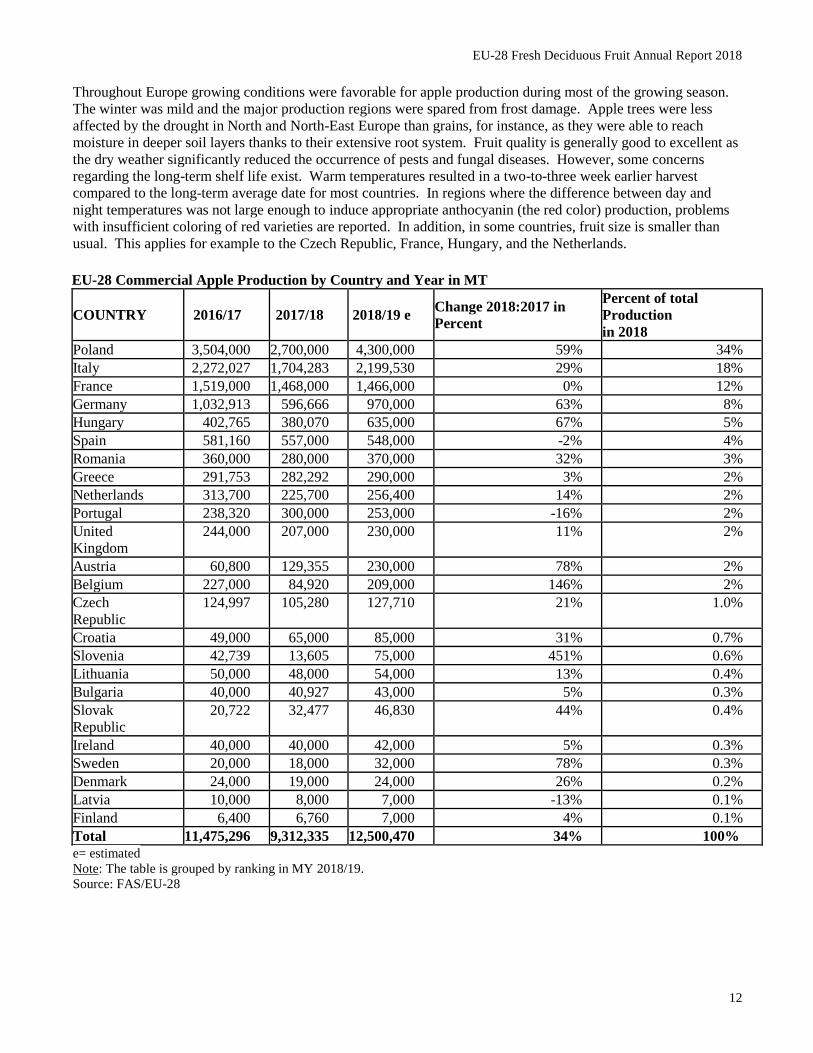
EU-28 Commercial Apple Production by Country and Year in MT
COUNTRY 2016/17 2017/18 2018/19 e Change 2018:2017 in
Percent
Percent of total
Production
in 2018
Poland 3,504,000 2,700,000 4,300,000 59% 34%
Italy 2,272,027 1,704,283 2,199,530 29% 18%
France 1,519,000 1,468,000 1,466,000 0% 12%
Germany 1,032,913 596,666 970,000 63% 8%
Hungary 402,765 380,070 635,000 67% 5%
Spain 581,160 557,000 548,000 -2% 4%
Romania 360,000 280,000 370,000 32% 3%
Greece 291,753 282,292 290,000 3% 2%
Netherlands 313,700 225,700 256,400 14% 2%
Portugal 238,320 300,000 253,000 -16% 2%
United
Kingdom
244,000 207,000 230,000 11% 2%
Austria 60,800 129,355 230,000 78% 2%
Belgium 227,000 84,920 209,000 146% 2%
Czech
Republic
124,997 105,280 127,710 21% 1.0%
Croatia 49,000 65,000 85,000 31% 0.7%
Slovenia 42,739 13,605 75,000 451% 0.6%
Lithuania 50,000 48,000 54,000 13% 0.4%
Bulgaria 40,000 40,927 43,000 5% 0.3%
Slovak
Republic
20,722 32,477 46,830 44% 0.4%
Ireland 40,000 40,000 42,000 5% 0.3%
Sweden 20,000 18,000 32,000 78% 0.3%
Denmark 24,000 19,000 24,000 26% 0.2%
Latvia 10,000 8,000 7,000 -13% 0.1%
Finland 6,400 6,760 7,000 4% 0.1%
Total 11,475,296 9,312,335 12,500,470 34% 100%
e= estimated
Note: The table is grouped by ranking in MY 2018/19.
Source: FAS/EU-28
EU-28 Fresh Deciduous Fruit Annual Report 2018
13
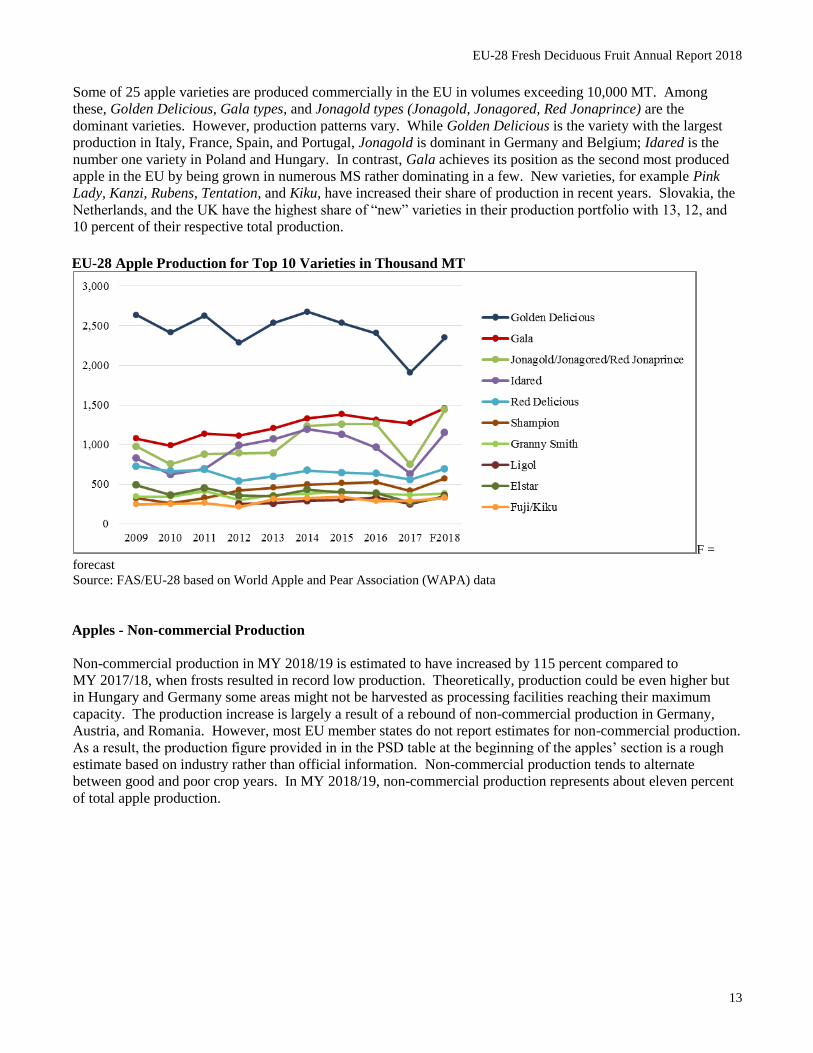
Some of 25 apple varieties are produced commercially in the EU in volumes exceeding 10,000 MT. Among
these, Golden Delicious, Gala types, and Jonagold types (Jonagold, Jonagored, Red Jonaprince) are the
dominant varieties. However, production patterns vary. While Golden Delicious is the variety with the largest
production in Italy, France, Spain, and Portugal, Jonagold is dominant in Germany and Belgium; Idared is the
number one variety in Poland and Hungary. In contrast, Gala achieves its position as the second most produced
apple in the EU by being grown in numerous MS rather dominating in a few. New varieties, for example Pink
Lady, Kanzi, Rubens, Tentation, and Kiku, have increased their share of production in recent years. Slovakia, the
Netherlands, and the UK have the highest share of “new” varieties in their production portfolio with 13, 12, and
10 percent of their respective total production.
EU-28 Apple Production for Top 10 Varieties in Thousand MT
F =
forecast
Source: FAS/EU-28 based on World Apple and Pear Association (WAPA) data
Apples - Non-commercial Production
Non-commercial production in MY 2018/19 is estimated to have increased by 115 percent compared to
MY 2017/18, when frosts resulted in record low production. Theoretically, production could be even higher but
in Hungary and Germany some areas might not be harvested as processing facilities reaching their maximum
capacity. The production increase is largely a result of a rebound of non-commercial production in Germany,
Austria, and Romania. However, most EU member states do not report estimates for non-commercial production.
As a result, the production figure provided in in the PSD table at the beginning of the apples’ section is a rough
estimate based on industry rather than official information. Non-commercial production tends to alternate
between good and poor crop years. In MY 2018/19, non-commercial production represents about eleven percent
of total apple production.
EU-28 Fresh Deciduous Fruit Annual Report 2018
14
Non-commercial production includes apples grown in home gardens and in untended trees in meadows or field
edges. Typically, non-commercial production is used for fresh consumption, apple juice and spirits production,
baking (cakes, tarts) or preserved foods (canned, dried, and cooked). The amount of apples diverted to the
different segments varies depending on the price for processing apples. Higher processing apple prices generally
result in a higher proportion of fruit entering juice production. In general, non-commercial production is
gradually decreasing in the EU-28 as hobby farmers age. Younger generations have not shown the same interest
in small-scale production. Instead, commercial production of higher acid apple varieties for processing is
expected to increase to meet demand from the juice concentrate industry.
Apples – Stocks
According to WAPA, EU apple stocks amounted to 165,884 MT on July 1, 2018, compared to 286,380 MT at the
same time in 2017, i.e. a decrease of 42 percent. In some member states the stock number comprised of apples
stored at POs while in other member states stocks are at POs and wholesalers. More important than the actual
number is the year-on-year-change in stocks as end of MY stocks can have a detrimental effect on the prices for
the new harvest. In this report, stocks are included in the “fresh domestic consumption” line in the PSD.
Apples – Consumption
Apples are the most popular fruit in all member states except for Spain, where oranges are number one.
However, per capita consumption of apples has been decreasing in recent years as consumers eat more soft fruit
instead (for example in the U.K. and Germany) or reduce fresh fruits consumption altogether (for example in
Spain). The large domestic production and expected lower consumer prices are expected to foster a significant
fresh consumption increase compared to the previous year. However, until November, much of the additional
consumption will likely consist of apples from backyard production.
Apples - Processing
In MY 2018/19, processing use of apples is expected to increase compared to MY 2017/18 by 65 percent. This
will be the highest level in the past ten marketing years. This is largely due to the abundant domestic non-
commercial production. In addition, a larger share of table apples are expected to be processed; especially in
areas with limited long-term storage capacity. Stocks of concentrated apple juice (CAJ) had been largely
depleted at the beginning of MY 2018/19. As a result, prices for processing apples have dropped less than in the
previous two years with high non-commercial production (2014 and 2016).
Processing uses for apples include, among others, apple juice, concentrated apple juice (CAJ), cider, wine/brandy,
apple sauce, preserves, canning, apple chips, and peeled apples for bakeries. The share of apples used for
processing varies significantly by member state, ranging from none in Greece, and the Scandinavian countries to
well over 70 percent in Hungary. The processing share also varies from year to year. The EU-28 average share
of apples going into processing is forecast to amount to about 34 percent of total supply in MY 2018/19. Major
member states with apple processing include Poland, Germany, Hungary, Italy, France, Romania, Austria, Spain,
the U.K., and the Czech Republic (in order of descending volume).
EU-28 Fresh Deciduous Fruit Annual Report 2018
15
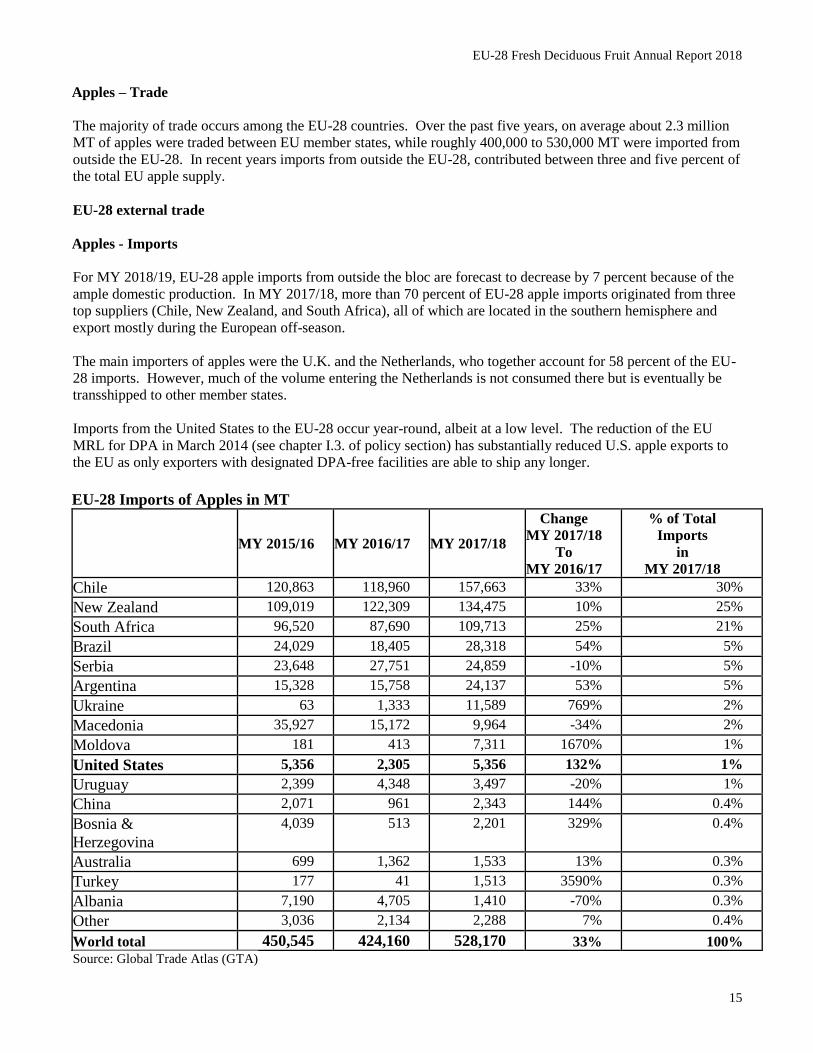
Apples – Trade
The majority of trade occurs among the EU-28 countries. Over the past five years, on average about 2.3 million
MT of apples were traded between EU member states, while roughly 400,000 to 530,000 MT were imported from
outside the EU-28. In recent years imports from outside the EU-28, contributed between three and five percent of
the total EU apple supply.
EU-28 external trade
Apples - Imports
For MY 2018/19, EU-28 apple imports from outside the bloc are forecast to decrease by 7 percent because of the
ample domestic production. In MY 2017/18, more than 70 percent of EU-28 apple imports originated from three
top suppliers (Chile, New Zealand, and South Africa), all of which are located in the southern hemisphere and
export mostly during the European off-season.
The main importers of apples were the U.K. and the Netherlands, who together account for 58 percent of the EU-
28 imports. However, much of the volume entering the Netherlands is not consumed there but is eventually be
transshipped to other member states.
Imports from the United States to the EU-28 occur year-round, albeit at a low level. The reduction of the EU
MRL for DPA in March 2014 (see chapter I.3. of policy section) has substantially reduced U.S. apple exports to
the EU as only exporters with designated DPA-free facilities are able to ship any longer.
EU-28 Imports of Apples in MT
MY 2015/16 MY 2016/17 MY 2017/18
Change
MY 2017/18
To
MY 2016/17
% of Total
Imports
in
MY 2017/18
Chile 120,863 118,960 157,663 33% 30%
New Zealand 109,019 122,309 134,475 10% 25%
South Africa 96,520 87,690 109,713 25% 21%
Brazil 24,029 18,405 28,318 54% 5%
Serbia 23,648 27,751 24,859 -10% 5%
Argentina 15,328 15,758 24,137 53% 5%
Ukraine 63 1,333 11,589 769% 2%
Macedonia 35,927 15,172 9,964 -34% 2%
Moldova 181 413 7,311 1670% 1%
United States 5,356 2,305 5,356 132% 1%
Uruguay 2,399 4,348 3,497 -20% 1%
China 2,071 961 2,343 144% 0.4%
Bosnia &
Herzegovina
4,039 513 2,201 329% 0.4%
Australia 699 1,362 1,533 13% 0.3%
Turkey 177 41 1,513 3590% 0.3%
Albania 7,190 4,705 1,410 -70% 0.3%
Other 3,036 2,134 2,288 7% 0.4%
World total 450,545 424,160 528,170 33% 100%
Source: Global Trade Atlas (GTA)

EU-28 Fresh Deciduous Fruit Annual Report 2018
16
Note: The table is grouped by ranking in MY 2017/18.
EU-28 Fresh Deciduous Fruit Annual Report 2018
17
Apples - Exports
In MY 2018/19, EU-28 apple exports are forecast to rebound and increase by about 610,000 MT (translating into
80 percent) following the large domestic production. As a result, U.S. apple exporters could face stronger
competition on foreign markets, especially from apples originating in Poland and Italy.
In MY 2017/18, exports were 49 percent lower than in the previous marketing year as European apples were
significantly more expensive than in the previous season. The large decline of shipments to Algeria followed the
introduction of an import-licensing regime in Algeria at the end of 2015. Prior to the announcement of the
import-licensing regime, export to Algeria comprised nine percent of all EU apple exports.
In response to the Russian import ban, EU exporters looked at increasing exports to other destinations (Eastern
Europe, Northern Africa, the Middle East, and Brazil) with varying success. Those countries that were most
successful either have the right variety mix (Gala, Granny Smith, Golden Delicious, Red Delicious) and/or were
able to build on efforts to open new markets that they started well before the Russian import ban. For example,
efforts to open or expand new or nascent markets proved successful in India. Italy, Poland, France, Spain, and
Belgium are already exporting to India, while the Czech Republic has concluded a phytosanitary agreement with
India in October of 2017 but so far only exported a negligible amount to this destination. Since the start of the
pre-clearance program in October 2014, Italy and France are eligible for export to the United States. Poland has
concluded agreements with Vietnam and a number of other Asian countries.
The top destinations for EU-28 apples in MY 2017/18 were Belarus, Egypt, and Saudi Arabia. The five largest
EU exporters, together accounting for 90 percent of EU apples exports, were Poland (mostly to Belarus,
Kazakhstan, Serbia, and Egypt), Italy (to Saudi Arabia, Egypt, and Norway), France (mainly to UAE, Saudi
Arabia, Israel, and Thailand), Greece (mainly to Egypt and Jordan), and Spain (mostly to Morocco, Mauritania,
and UAE.)
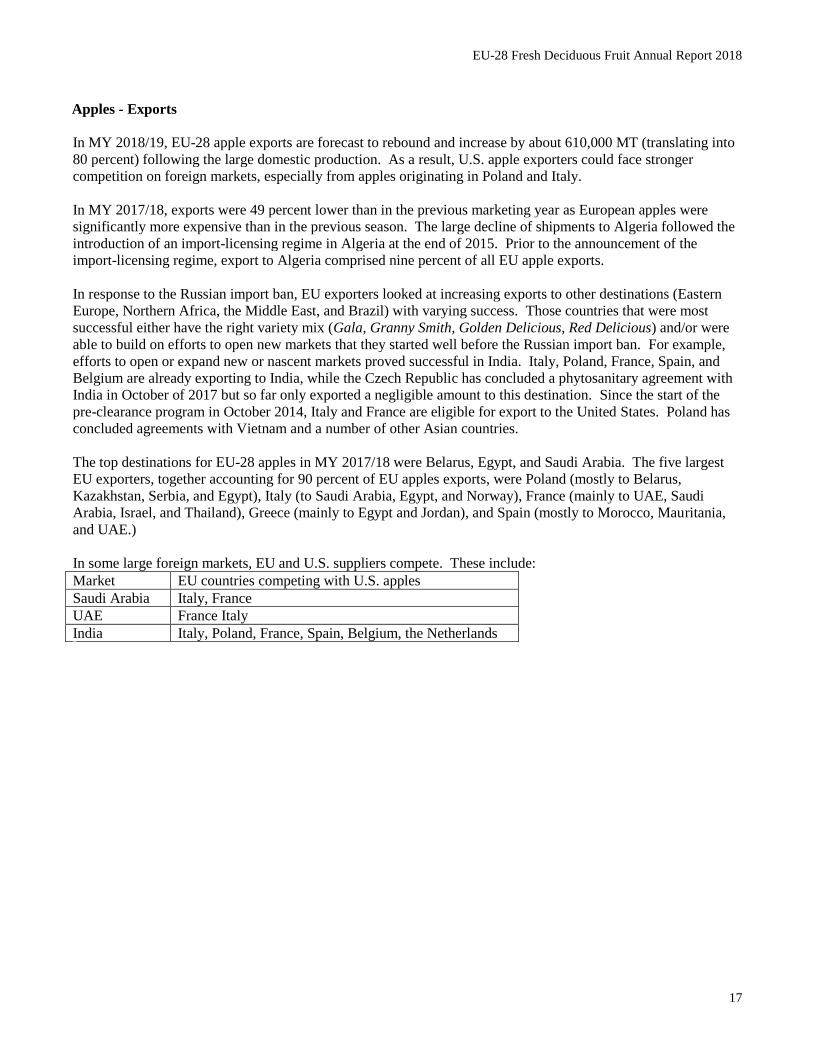
In some large foreign markets, EU and U.S. suppliers compete. These include:
Market EU countries competing with U.S. apples
Saudi Arabia Italy, France
UAE France Italy
India Italy, Poland, France, Spain, Belgium, the Netherlands
EU-28 Fresh Deciduous Fruit Annual Report 2018
18
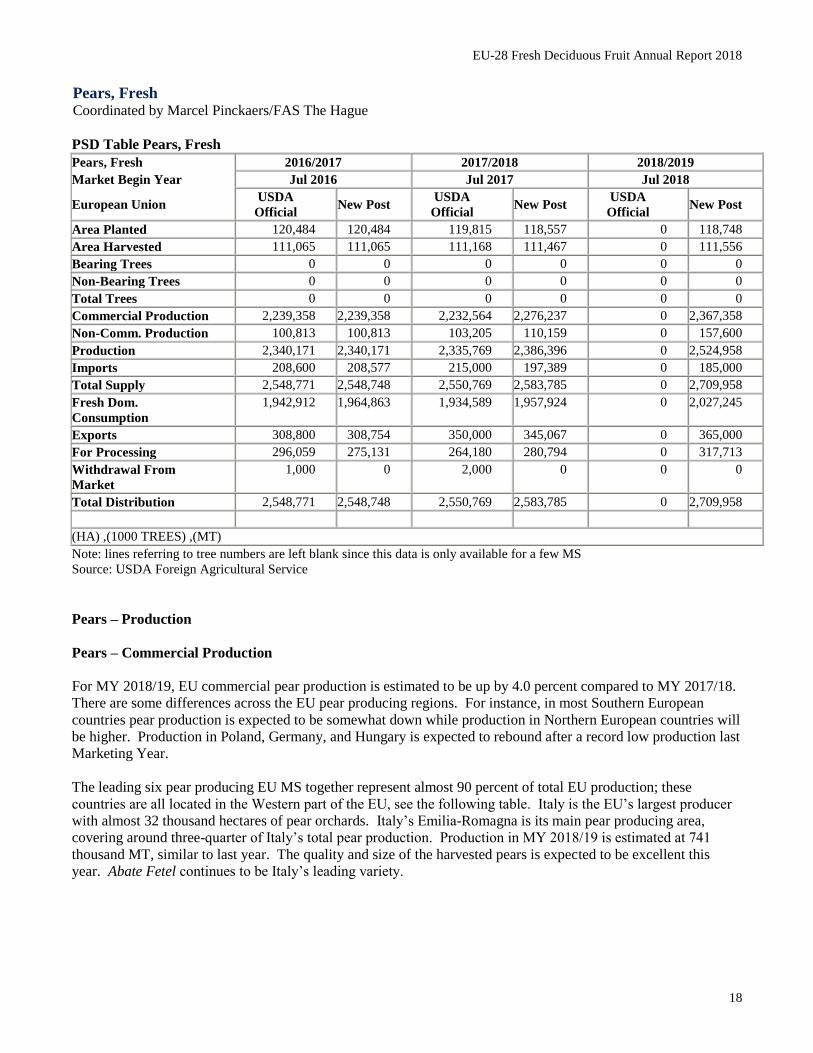
Pears, Fresh Coordinated by Marcel Pinckaers/FAS The Hague
PSD Table Pears, Fresh
Pears, Fresh 2016/2017 2017/2018 2018/2019
Market Begin Year Jul 2016 Jul 2017 Jul 2018
European Union USDA
Official New Post
USDA
Official New Post
USDA
Official New Post
Area Planted 120,484 120,484 119,815 118,557 0 118,748
Area Harvested 111,065 111,065 111,168 111,467 0 111,556
Bearing Trees 0 0 0 0 0 0
Non-Bearing Trees 0 0 0 0 0 0
Total Trees 0 0 0 0 0 0
Commercial Production 2,239,358 2,239,358 2,232,564 2,276,237 0 2,367,358
Non-Comm. Production 100,813 100,813 103,205 110,159 0 157,600
Production 2,340,171 2,340,171 2,335,769 2,386,396 0 2,524,958
Imports 208,600 208,577 215,000 197,389 0 185,000
Total Supply 2,548,771 2,548,748 2,550,769 2,583,785 0 2,709,958
Fresh Dom.
Consumption
1,942,912 1,964,863 1,934,589 1,957,924 0 2,027,245
Exports 308,800 308,754 350,000 345,067 0 365,000
For Processing 296,059 275,131 264,180 280,794 0 317,713
Withdrawal From
Market
1,000 0 2,000 0 0 0
Total Distribution 2,548,771 2,548,748 2,550,769 2,583,785 0 2,709,958
(HA) ,(1000 TREES) ,(MT)
Note: lines referring to tree numbers are left blank since this data is only available for a few MS
Source: USDA Foreign Agricultural Service
Pears – Production
Pears – Commercial Production
For MY 2018/19, EU commercial pear production is estimated to be up by 4.0 percent compared to MY 2017/18.
There are some differences across the EU pear producing regions. For instance, in most Southern European
countries pear production is expected to be somewhat down while production in Northern European countries will
be higher. Production in Poland, Germany, and Hungary is expected to rebound after a record low production last
Marketing Year.
The leading six pear producing EU MS together represent almost 90 percent of total EU production; these
countries are all located in the Western part of the EU, see the following table. Italy is the EU’s largest producer
with almost 32 thousand hectares of pear orchards. Italy’s Emilia-Romagna is its main pear producing area,
covering around three-quarter of Italy’s total pear production. Production in MY 2018/19 is estimated at 741
thousand MT, similar to last year. The quality and size of the harvested pears is expected to be excellent this
year. Abate Fetel continues to be Italy’s leading variety.
EU-28 Fresh Deciduous Fruit Annual Report 2018
19
Planted pear acreage continues to grow in the Netherlands and is expected to pass the ten thousand hectares
(10,058 hectares) this year. Despite the drought, Dutch pear production (mainly Conference pears) is estimated at
398 thousand MT, up by 21 percent compared to last year’s low production figures. High temperatures in
combination with a lack of rainfall between May and the end of August initially had a negative impact on the pear
size. During these months, growers in the middle of the country irrigated their orchards. This, in combination
with rainfall as of the end of August, resulted in good-sized pears in the center of the Netherlands and, therefore,
an overall good harvest. In most cases it is not possible to irrigate orchards in the Southern part of the
Netherlands and this resulted in smaller sized pears. Furthermore, there was hardly any damage due to freezing or
hail this year. The abundance of sun had a positive impact on the taste. The keeping quality of Dutch pears is
expected to be good this year especially for pears from irrigated orchards.
Pear production in Spain is expected to decrease by six percent this MY to 334 thousand MT due to unfavorable
weather conditions during spring and hailstorms during summer. Catalonia continues to be Spain’s leading pear
producing region, responsible for 40 percent of total production, followed by Aragon and La Rioja. The main
varieties are Conference, Limonera (in Catalonia and Aragon), Ercolini (in Murcia and Catalonia) and Blanquilla
(in Catalonia, Aragon and Murcia). The harvested area has been decreasing over the past ten years as stone fruit
orchards slowly replace pear orchards due to improved profitability.
Pear area planted continues to increase not only in the Netherlands but also in Belgium and now totals 10,184
hectares. Pear production is concentrated in Flanders. Flowering and the early part of the growing season were
good due to the optimal weather conditions. However, the drought that followed, in combination with several
heat waves, negatively influenced the pear size. Most Belgian growers were unable to irrigate their orchards,
similar to growers in the Southern part of the Netherlands. Once the drought was over, it was too late for the
pears to fully catch up. Due to the somewhat smaller sized pears, production is estimated at 309 thousand MT.
The taste is expected to be good.
After a very high pear production in Portugal in MY 2017/18 (184 thousand MT), production is estimated at 156
thousand MT this Marketing Year, down by 15 percent. The decline is mainly due to unfavorable weather
conditions during flowering, heavy rain in June and some hail in the North of Portugal. The unique pear variety
growing in Portugal is Rocha.
EU-28 Fresh Deciduous Fruit Annual Report 2018
20
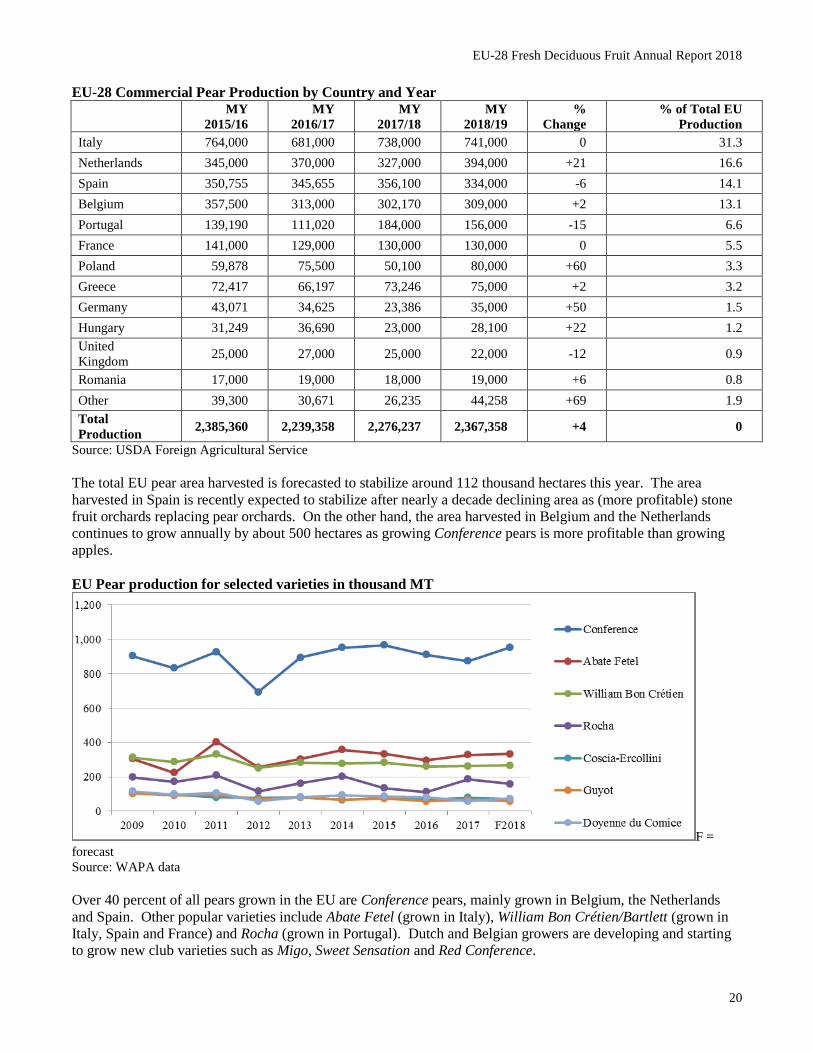
EU-28 Commercial Pear Production by Country and Year
MY
2015/16
MY
2016/17
MY
2017/18
MY
2018/19
%
Change
% of Total EU
Production
Italy 764,000 681,000 738,000 741,000 0 31.3
Netherlands 345,000 370,000 327,000 394,000 +21 16.6
Spain 350,755 345,655 356,100 334,000 -6 14.1
Belgium 357,500 313,000 302,170 309,000 +2 13.1
Portugal 139,190 111,020 184,000 156,000 -15 6.6
France 141,000 129,000 130,000 130,000 0 5.5
Poland 59,878 75,500 50,100 80,000 +60 3.3
Greece 72,417 66,197 73,246 75,000 +2 3.2
Germany 43,071 34,625 23,386 35,000 +50 1.5
Hungary 31,249 36,690 23,000 28,100 +22 1.2
United
Kingdom 25,000 27,000 25,000 22,000 -12 0.9
Romania 17,000 19,000 18,000 19,000 +6 0.8
Other 39,300 30,671 26,235 44,258 +69 1.9
Total
Production 2,385,360 2,239,358 2,276,237 2,367,358 +4 0
Source: USDA Foreign Agricultural Service
The total EU pear area harvested is forecasted to stabilize around 112 thousand hectares this year. The area
harvested in Spain is recently expected to stabilize after nearly a decade declining area as (more profitable) stone
fruit orchards replacing pear orchards. On the other hand, the area harvested in Belgium and the Netherlands
continues to grow annually by about 500 hectares as growing Conference pears is more profitable than growing
apples.
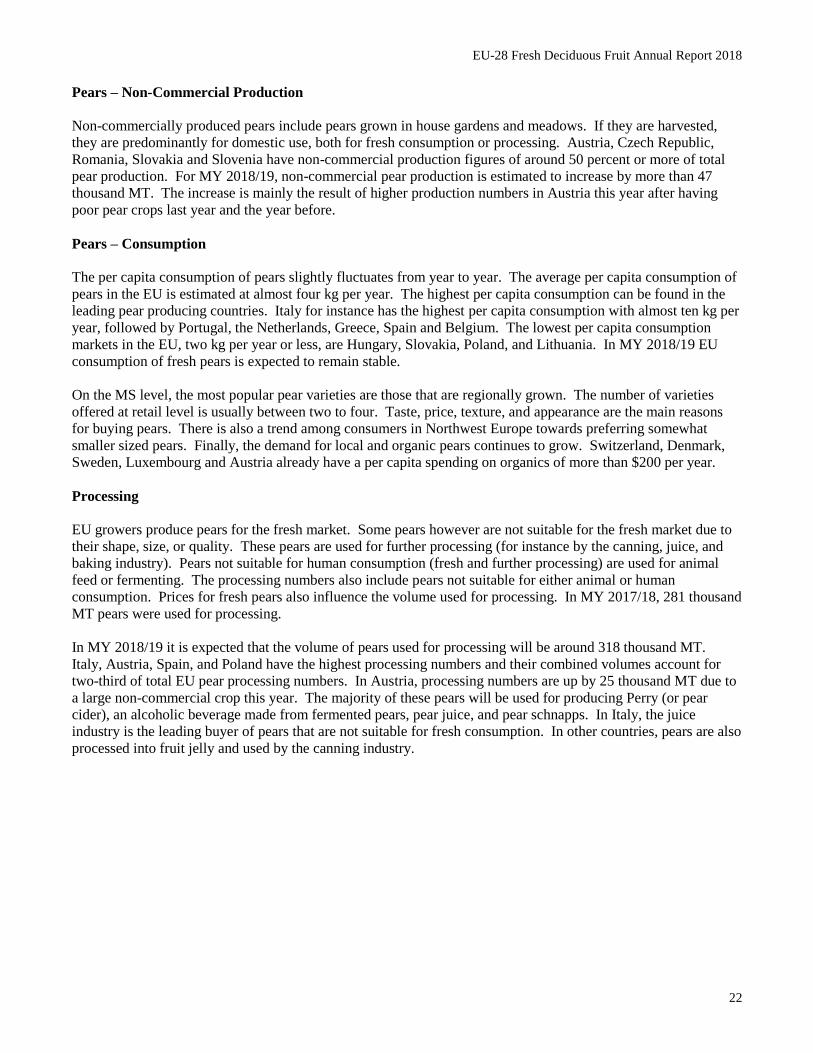
EU Pear production for selected varieties in thousand MT
F =
forecast
Source: WAPA data
Over 40 percent of all pears grown in the EU are Conference pears, mainly grown in Belgium, the Netherlands
and Spain. Other popular varieties include Abate Fetel (grown in Italy), William Bon Crétien/Bartlett (grown in
Italy, Spain and France) and Rocha (grown in Portugal). Dutch and Belgian growers are developing and starting
to grow new club varieties such as Migo, Sweet Sensation and Red Conference.

EU-28 Fresh Deciduous Fruit Annual Report 2018
21
EU-28 Fresh Deciduous Fruit Annual Report 2018
22
Pears – Non-Commercial Production
Non-commercially produced pears include pears grown in house gardens and meadows. If they are harvested,
they are predominantly for domestic use, both for fresh consumption or processing. Austria, Czech Republic,
Romania, Slovakia and Slovenia have non-commercial production figures of around 50 percent or more of total
pear production. For MY 2018/19, non-commercial pear production is estimated to increase by more than 47
thousand MT. The increase is mainly the result of higher production numbers in Austria this year after having
poor pear crops last year and the year before.
Pears – Consumption
The per capita consumption of pears slightly fluctuates from year to year. The average per capita consumption of
pears in the EU is estimated at almost four kg per year. The highest per capita consumption can be found in the
leading pear producing countries. Italy for instance has the highest per capita consumption with almost ten kg per
year, followed by Portugal, the Netherlands, Greece, Spain and Belgium. The lowest per capita consumption
markets in the EU, two kg per year or less, are Hungary, Slovakia, Poland, and Lithuania. In MY 2018/19 EU
consumption of fresh pears is expected to remain stable.
On the MS level, the most popular pear varieties are those that are regionally grown. The number of varieties
offered at retail level is usually between two to four. Taste, price, texture, and appearance are the main reasons
for buying pears. There is also a trend among consumers in Northwest Europe towards preferring somewhat
smaller sized pears. Finally, the demand for local and organic pears continues to grow. Switzerland, Denmark,
Sweden, Luxembourg and Austria already have a per capita spending on organics of more than $200 per year.
Processing
EU growers produce pears for the fresh market. Some pears however are not suitable for the fresh market due to
their shape, size, or quality. These pears are used for further processing (for instance by the canning, juice, and
baking industry). Pears not suitable for human consumption (fresh and further processing) are used for animal
feed or fermenting. The processing numbers also include pears not suitable for either animal or human
consumption. Prices for fresh pears also influence the volume used for processing. In MY 2017/18, 281 thousand
MT pears were used for processing.
In MY 2018/19 it is expected that the volume of pears used for processing will be around 318 thousand MT.
Italy, Austria, Spain, and Poland have the highest processing numbers and their combined volumes account for
two-third of total EU pear processing numbers. In Austria, processing numbers are up by 25 thousand MT due to
a large non-commercial crop this year. The majority of these pears will be used for producing Perry (or pear
cider), an alcoholic beverage made from fermented pears, pear juice, and pear schnapps. In Italy, the juice
industry is the leading buyer of pears that are not suitable for fresh consumption. In other countries, pears are also
processed into fruit jelly and used by the canning industry.
EU-28 Fresh Deciduous Fruit Annual Report 2018
23
Pears – Trade
EU 28 external trade
Imports
The Netherlands and Italy together account for almost 70 percent of EU pear imports. The majority of the volume
entering the port of Rotterdam is shipped to MS like Germany, France, and the U.K. while Italy’s imports
predominantly stay on the Italian market. Other importing MS, albeit at much smaller scale, are the U.K., France,
and Spain.
The amount of pears imported in MY 2017/18 was down since several former export markets now import directly
from Southern Hemisphere countries whereas before these pears were traded via the EU; this trend is expected to
continue. For MY 2018/19, total EU pear imports are expected to further drop to an estimated 185 thousand MT
due to sufficient good quality pears available within the EU this year.
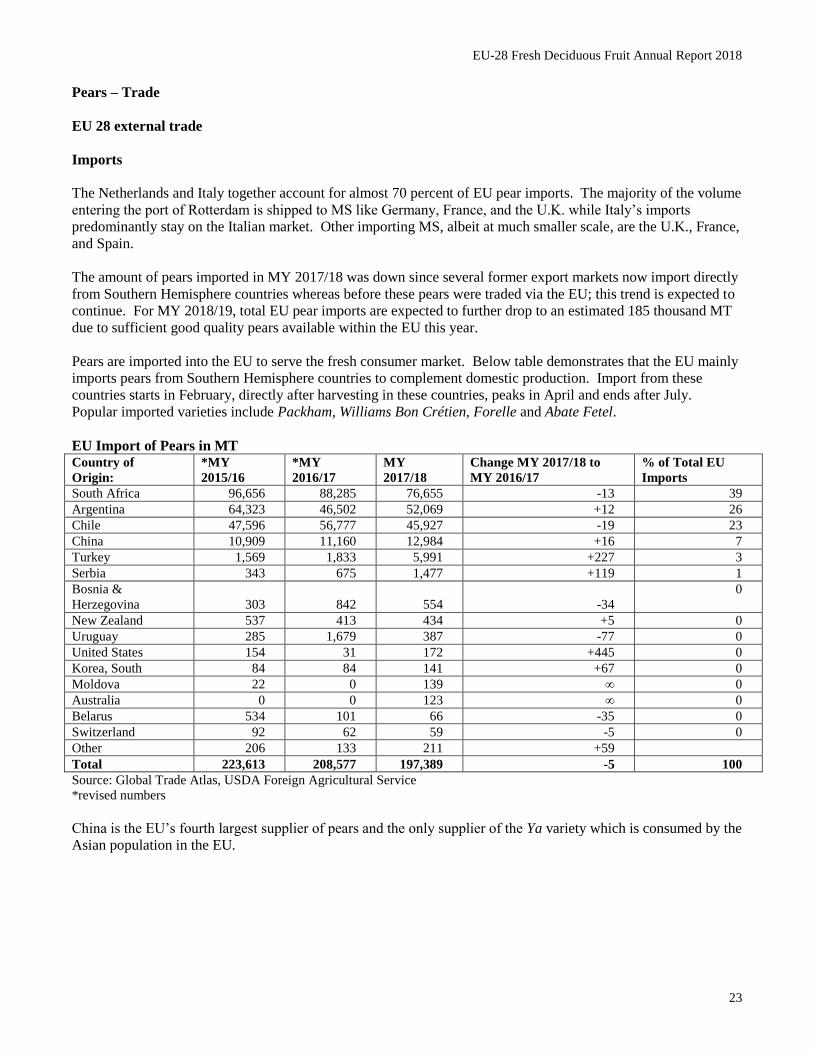
Pears are imported into the EU to serve the fresh consumer market. Below table demonstrates that the EU mainly
imports pears from Southern Hemisphere countries to complement domestic production. Import from these
countries starts in February, directly after harvesting in these countries, peaks in April and ends after July.
Popular imported varieties include Packham, Williams Bon Crétien, Forelle and Abate Fetel.
EU Import of Pears in MT Country of
Origin:
*MY
2015/16
*MY
2016/17
MY
2017/18
Change MY 2017/18 to
MY 2016/17
% of Total EU
Imports
South Africa 96,656 88,285 76,655 -13 39
Argentina 64,323 46,502 52,069 +12 26
Chile 47,596 56,777 45,927 -19 23
China 10,909 11,160 12,984 +16 7
Turkey 1,569 1,833 5,991 +227 3
Serbia 343 675 1,477 +119 1
Bosnia &
Herzegovina 303 842 554 -34
0
New Zealand 537 413 434 +5 0
Uruguay 285 1,679 387 -77 0
United States 154 31 172 +445 0
Korea, South 84 84 141 +67 0
Moldova 22 0 139 ∞ 0
Australia 0 0 123 ∞ 0
Belarus 534 101 66 -35 0
Switzerland 92 62 59 -5 0
Other 206 133 211 +59
Total 223,613 208,577 197,389 -5 100
Source: Global Trade Atlas, USDA Foreign Agricultural Service
*revised numbers
China is the EU’s fourth largest supplier of pears and the only supplier of the Ya variety which is consumed by the
Asian population in the EU.

EU-28 Fresh Deciduous Fruit Annual Report 2018
24
Imports of pears from the United States dropped to a record low number in MY 2016/17 (31 MT) mainly due to
strict pesticide MRLs. U.S. pears compete with pears produced in the EU. Besides a price difference, consumers
(especially in the Nordic region), seem to prefer Conference pears above Anjou pears from the United States. In
MY 2017/18, imports of pears from the United States rebounded to 172 MT, however. Industry contacts indicate
that these pears are certified organic pears and are mainly sold in high-end U.K. supermarkets.
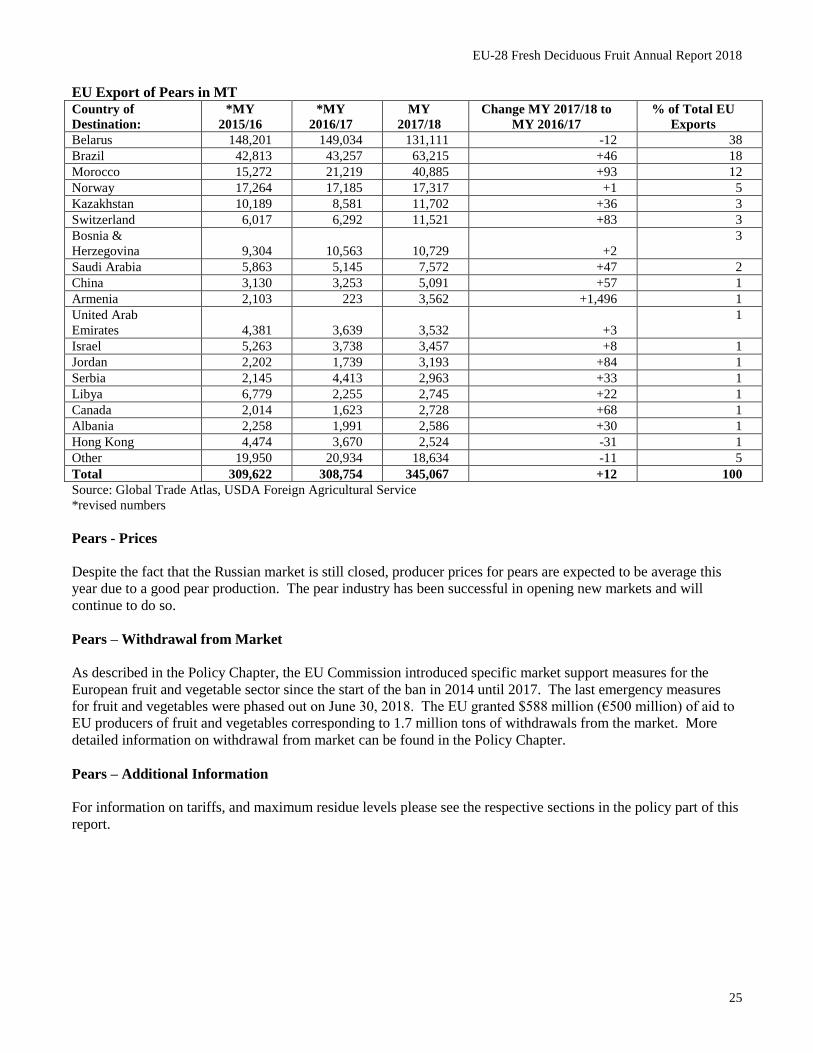
Exports
EU pear exports stabilized in MY 2016/17 but grew again in MY 2017/18 due to increased trade with the main
existing (except Belarus) and new export markets. For MY 2018/19 pear exports are expected to be somewhat up
due to sufficient good quality pears available within the EU.
Belarus continues to be the largest export market for EU pears but also other countries that have close proximity
to Russia are important markets for mainly Conference pears, especially those produced in Belgium and the
Netherlands.
Pear exports to Brazil grew by almost 50 percent in MY 2017/18 due to a high harvest of Rocha pears in Portugal.
With an expected lower harvest in MY 2018/18 compared to record high harvest last year, exports to Brazil are
expected to slightly decrease.
EU pear exports to mature markets Norway and Switzerland are expected to not change much compared to MY
2017/18. This also applies to exports to Morocco and countries in the Middle and Far East which have all proven
to be profitable and stable markets for EU pears.
Trade with Hong Kong dropped while pear exports to China grew by over 50 percent in MY 2017/18 and now
totals five thousand MT. Industry experts expects exports to China to grow further in MY 2018/19.
Due to the existing Russian import ban and uncertainty regarding Brexit, pear producers not only want to grow
existing markets but also are looking for new markets in Asia, the Middle East, and the Americas. It is important
to note that even when these new markets like Canada and Mexico open, it takes years to develop a sustainable
market for unknown varieties.
EU-28 Fresh Deciduous Fruit Annual Report 2018
25
EU Export of Pears in MT Country of
Destination:
*MY
2015/16
*MY
2016/17
MY
2017/18
Change MY 2017/18 to
MY 2016/17
% of Total EU
Exports
Belarus 148,201 149,034 131,111 -12 38
Brazil 42,813 43,257 63,215 +46 18
Morocco 15,272 21,219 40,885 +93 12
Norway 17,264 17,185 17,317 +1 5
Kazakhstan 10,189 8,581 11,702 +36 3
Switzerland 6,017 6,292 11,521 +83 3
Bosnia &
Herzegovina 9,304 10,563 10,729 +2
3
Saudi Arabia 5,863 5,145 7,572 +47 2
China 3,130 3,253 5,091 +57 1
Armenia 2,103 223 3,562 +1,496 1
United Arab
Emirates 4,381 3,639 3,532 +3
1
Israel 5,263 3,738 3,457 +8 1
Jordan 2,202 1,739 3,193 +84 1
Serbia 2,145 4,413 2,963 +33 1
Libya 6,779 2,255 2,745 +22 1
Canada 2,014 1,623 2,728 +68 1
Albania 2,258 1,991 2,586 +30 1
Hong Kong 4,474 3,670 2,524 -31 1
Other 19,950 20,934 18,634 -11 5
Total 309,622 308,754 345,067 +12 100
Source: Global Trade Atlas, USDA Foreign Agricultural Service
*revised numbers
Pears - Prices
Despite the fact that the Russian market is still closed, producer prices for pears are expected to be average this
year due to a good pear production. The pear industry has been successful in opening new markets and will
continue to do so.
Pears – Withdrawal from Market
As described in the Policy Chapter, the EU Commission introduced specific market support measures for the
European fruit and vegetable sector since the start of the ban in 2014 until 2017. The last emergency measures
for fruit and vegetables were phased out on June 30, 2018. The EU granted $588 million (€500 million) of aid to
EU producers of fruit and vegetables corresponding to 1.7 million tons of withdrawals from the market. More
detailed information on withdrawal from market can be found in the Policy Chapter.
Pears – Additional Information
For information on tariffs, and maximum residue levels please see the respective sections in the policy part of this
report.
EU-28 Fresh Deciduous Fruit Annual Report 2018
26
Table Grapes Coordinated by Ornella Bettini/FAS Rome
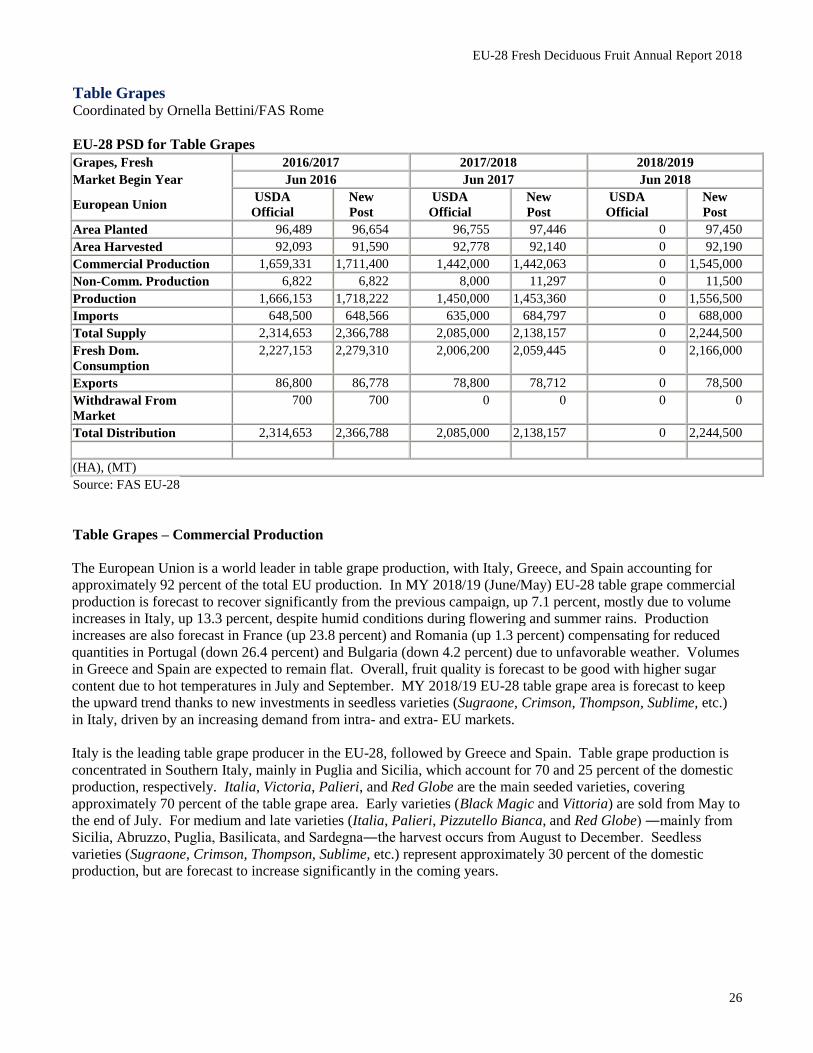
EU-28 PSD for Table Grapes
Grapes, Fresh 2016/2017 2017/2018 2018/2019
Market Begin Year Jun 2016 Jun 2017 Jun 2018
European Union USDA
Official
New
Post
USDA
Official
New
Post
USDA
Official
New
Post
Area Planted 96,489 96,654 96,755 97,446 0 97,450
Area Harvested 92,093 91,590 92,778 92,140 0 92,190
Commercial Production 1,659,331 1,711,400 1,442,000 1,442,063 0 1,545,000
Non-Comm. Production 6,822 6,822 8,000 11,297 0 11,500
Production 1,666,153 1,718,222 1,450,000 1,453,360 0 1,556,500
Imports 648,500 648,566 635,000 684,797 0 688,000
Total Supply 2,314,653 2,366,788 2,085,000 2,138,157 0 2,244,500
Fresh Dom.
Consumption
2,227,153 2,279,310 2,006,200 2,059,445 0 2,166,000
Exports 86,800 86,778 78,800 78,712 0 78,500
Withdrawal From
Market
700 700 0 0 0 0
Total Distribution 2,314,653 2,366,788 2,085,000 2,138,157 0 2,244,500
(HA), (MT)
Source: FAS EU-28
Table Grapes – Commercial Production
The European Union is a world leader in table grape production, with Italy, Greece, and Spain accounting for
approximately 92 percent of the total EU production. In MY 2018/19 (June/May) EU-28 table grape commercial
production is forecast to recover significantly from the previous campaign, up 7.1 percent, mostly due to volume
increases in Italy, up 13.3 percent, despite humid conditions during flowering and summer rains. Production
increases are also forecast in France (up 23.8 percent) and Romania (up 1.3 percent) compensating for reduced
quantities in Portugal (down 26.4 percent) and Bulgaria (down 4.2 percent) due to unfavorable weather. Volumes
in Greece and Spain are expected to remain flat. Overall, fruit quality is forecast to be good with higher sugar
content due to hot temperatures in July and September. MY 2018/19 EU-28 table grape area is forecast to keep
the upward trend thanks to new investments in seedless varieties (Sugraone, Crimson, Thompson, Sublime, etc.)
in Italy, driven by an increasing demand from intra- and extra- EU markets.
Italy is the leading table grape producer in the EU-28, followed by Greece and Spain. Table grape production is
concentrated in Southern Italy, mainly in Puglia and Sicilia, which account for 70 and 25 percent of the domestic
production, respectively. Italia, Victoria, Palieri, and Red Globe are the main seeded varieties, covering
approximately 70 percent of the table grape area. Early varieties (Black Magic and Vittoria) are sold from May to
the end of July. For medium and late varieties (Italia, Palieri, Pizzutello Bianca, and Red Globe) ―mainly from
Sicilia, Abruzzo, Puglia, Basilicata, and Sardegna―the harvest occurs from August to December. Seedless
varieties (Sugraone, Crimson, Thompson, Sublime, etc.) represent approximately 30 percent of the domestic
production, but are forecast to increase significantly in the coming years.
EU-28 Fresh Deciduous Fruit Annual Report 2018
27
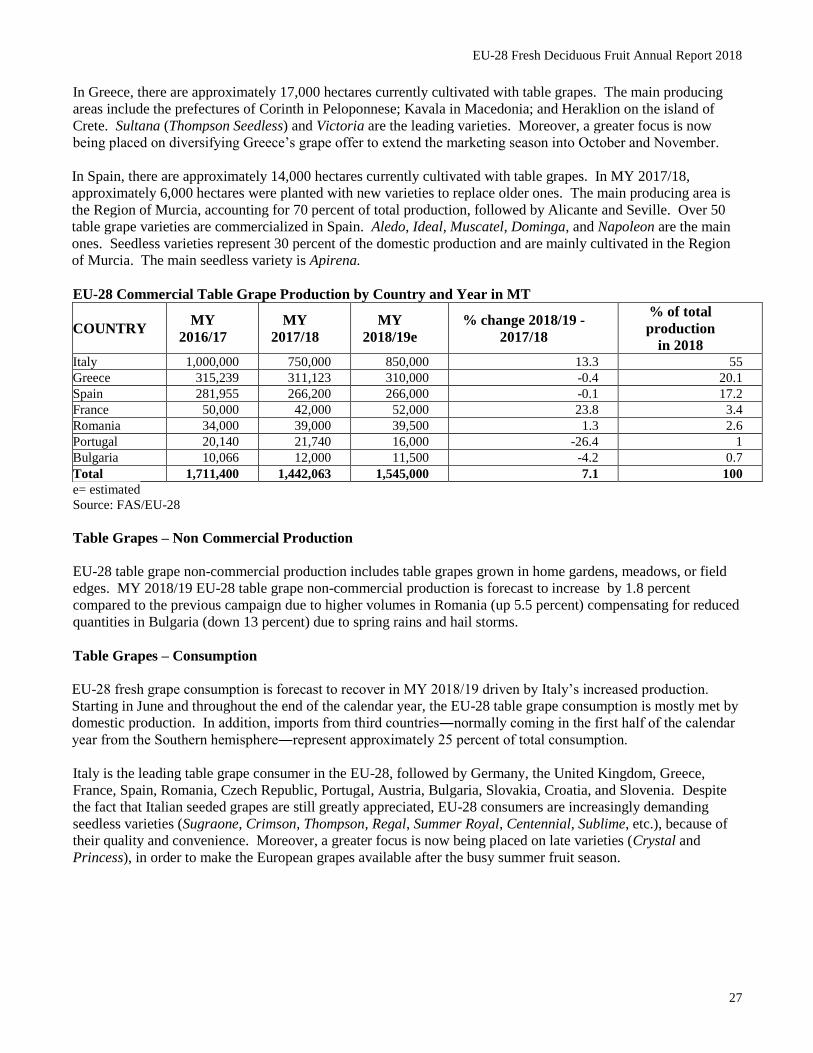
In Greece, there are approximately 17,000 hectares currently cultivated with table grapes. The main producing
areas include the prefectures of Corinth in Peloponnese; Kavala in Macedonia; and Heraklion on the island of
Crete. Sultana (Thompson Seedless) and Victoria are the leading varieties. Moreover, a greater focus is now
being placed on diversifying Greece’s grape offer to extend the marketing season into October and November.
In Spain, there are approximately 14,000 hectares currently cultivated with table grapes. In MY 2017/18,
approximately 6,000 hectares were planted with new varieties to replace older ones. The main producing area is
the Region of Murcia, accounting for 70 percent of total production, followed by Alicante and Seville. Over 50
table grape varieties are commercialized in Spain. Aledo, Ideal, Muscatel, Dominga, and Napoleon are the main
ones. Seedless varieties represent 30 percent of the domestic production and are mainly cultivated in the Region
of Murcia. The main seedless variety is Apirena.
EU-28 Commercial Table Grape Production by Country and Year in MT
COUNTRY MY
2016/17
MY
2017/18
MY
2018/19e
% change 2018/19 -
2017/18
% of total
production
in 2018 Italy 1,000,000 750,000 850,000 13.3 55
Greece 315,239 311,123 310,000 -0.4 20.1
Spain 281,955 266,200 266,000 -0.1 17.2
France 50,000 42,000 52,000 23.8 3.4
Romania 34,000 39,000 39,500 1.3 2.6
Portugal 20,140 21,740 16,000 -26.4 1
Bulgaria 10,066 12,000 11,500 -4.2 0.7
Total 1,711,400 1,442,063 1,545,000 7.1 100
e= estimated
Source: FAS/EU-28
Table Grapes – Non Commercial Production
EU-28 table grape non-commercial production includes table grapes grown in home gardens, meadows, or field
edges. MY 2018/19 EU-28 table grape non-commercial production is forecast to increase by 1.8 percent
compared to the previous campaign due to higher volumes in Romania (up 5.5 percent) compensating for reduced
quantities in Bulgaria (down 13 percent) due to spring rains and hail storms.
Table Grapes – Consumption
EU-28 fresh grape consumption is forecast to recover in MY 2018/19 driven by Italy’s increased production.
Starting in June and throughout the end of the calendar year, the EU-28 table grape consumption is mostly met by
domestic production. In addition, imports from third countries―normally coming in the first half of the calendar
year from the Southern hemisphere―represent approximately 25 percent of total consumption.
Italy is the leading table grape consumer in the EU-28, followed by Germany, the United Kingdom, Greece,
France, Spain, Romania, Czech Republic, Portugal, Austria, Bulgaria, Slovakia, Croatia, and Slovenia. Despite
the fact that Italian seeded grapes are still greatly appreciated, EU-28 consumers are increasingly demanding
seedless varieties (Sugraone, Crimson, Thompson, Regal, Summer Royal, Centennial, Sublime, etc.), because of
their quality and convenience. Moreover, a greater focus is now being placed on late varieties (Crystal and
Princess), in order to make the European grapes available after the busy summer fruit season.

EU-28 Fresh Deciduous Fruit Annual Report 2018
28
Table Grapes - Trade
Imports
The EU-28 is a net importer of fresh table grapes. MY 2018/19 EU-28 table grape imports are forecast to keep an
upward trend―despite the increased domestic production―due to a rather stable demand. During MY 2017/18,
EU-28 table grape imports increased by 5.6 percent from the previous campaign due to bigger volumes from
Moldova ( up 66 percent), Egypt (up 54 percent), Namibia ( up 31 percent), Turkey ( up 26 percent), and Brazil
(up 23 percent). South Africa, Chile, and India remain the leading suppliers, accounting for 30, 16, and 13
percent of total imports. The largest EU-28 importing countries remain the Netherlands, Germany, and the
United Kingdom. These are followed by France, Belgium, Austria, Spain, and Italy. The Netherlands serves
mainly as a trans-shipping point.
EU-28 Imports of Table Grapes in MT
COUNTRY MY
2015/16
MY
2016/17
MY
2017/18
% change 2017/18 -
2016/17
% of total imports in
2017/18
South Africa 197,669 214,909 205,128 - 4.55 29.95
Chile 103,071 109,289 111,033 1.60 16.21
India 82,290 94,851 88,575 - 6.62 12.93
Egypt 54,997 49,578 76,329 53.96 11.15
Peru 64,058 62,921 63,102 0.29 9.21
Turkey 24,344 31,404 39,735 26.53 5.80
Brazil 29,324 28,018 34,362 22.64 5.02
Namibia 18,070 18,976 24,899 31.22 3.64
Moldova 11,730 12,313 20,471 66.25 2.99
Morocco 8,093 6,851 6,424 - 6.23 0.94
United States 6,401 4,399 5,199 18.17 0.76
Macedonia 6,394 10,632 3,965 - 62.70 0.58
Mexico 1,797 1,471 1,597 8.56 0.23
Bosnia &
Herzegovina 730 543 1,007 85.31 0.15
Israel 1,649 665 795 19.64 0.12
Argentina 3,293 543 729 34.45 0.11
Lebanon 397 673 502 - 25.42 0.07
China 14 35 284 713.69 0.04
Norway 34 25 60 135.95 0.01
Japan - 6 53 721.09 0.01
Other 614 460 543 18.04 0.08
World 614,969 648,566 684,797 5.59 100.00
Source: Global Trade Atlas (GTA)
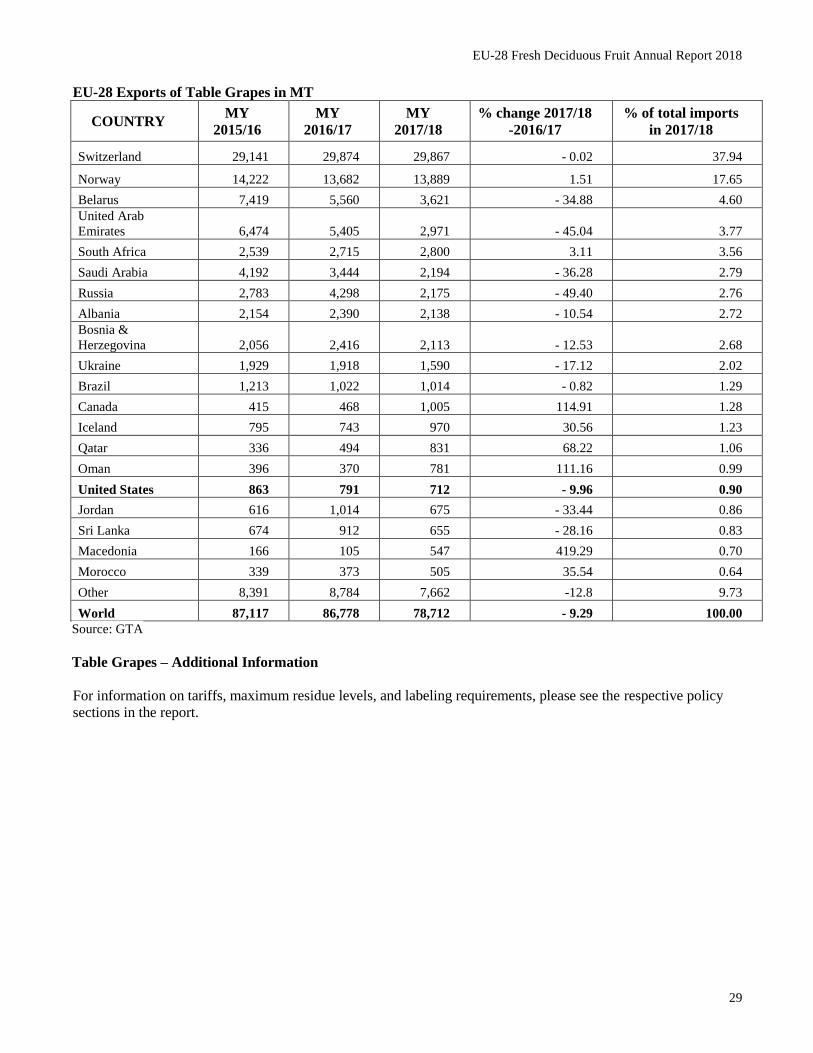
Exports
MY 2018/19 EU-28 table grape exports are forecast to continue the downward trend due to high transportation
costs and discouraging bureaucratic delays. During MY 2017/18, EU-28 table grape exports went down by 9.3
percent from the previous campaign as a result of the decreased production. Switzerland and Norway confirmed
to be the leading destinations, accounting for 38 and 17 percent of total exports, respectively. Seedless varieties
(Sugar Crisp, Sweet Sunshine, Sweet Celebration, Sweet Sapphire, Jack’s Salute, and Cotton Candy) are mainly
sent to the United Kingdom, Scandinavian countries, and the United Arab Emirates.
EU-28 Fresh Deciduous Fruit Annual Report 2018
29
EU-28 Exports of Table Grapes in MT
COUNTRY MY
2015/16
MY
2016/17
MY
2017/18
% change 2017/18
-2016/17
% of total imports
in 2017/18
Switzerland 29,141 29,874 29,867 - 0.02 37.94
Norway 14,222 13,682 13,889 1.51 17.65
Belarus 7,419 5,560 3,621 - 34.88 4.60
United Arab
Emirates 6,474 5,405 2,971 - 45.04 3.77
South Africa 2,539 2,715 2,800 3.11 3.56
Saudi Arabia 4,192 3,444 2,194 - 36.28 2.79
Russia 2,783 4,298 2,175 - 49.40 2.76
Albania 2,154 2,390 2,138 - 10.54 2.72
Bosnia &
Herzegovina 2,056 2,416 2,113 - 12.53 2.68
Ukraine 1,929 1,918 1,590 - 17.12 2.02
Brazil 1,213 1,022 1,014 - 0.82 1.29
Canada 415 468 1,005 114.91 1.28
Iceland 795 743 970 30.56 1.23
Qatar 336 494 831 68.22 1.06
Oman 396 370 781 111.16 0.99
United States 863 791 712 - 9.96 0.90
Jordan 616 1,014 675 - 33.44 0.86
Sri Lanka 674 912 655 - 28.16 0.83
Macedonia 166 105 547 419.29 0.70
Morocco 339 373 505 35.54 0.64
Other 8,391 8,784 7,662 -12.8 9.73
World 87,117 86,778 78,712 - 9.29 100.00
Source: GTA
Table Grapes – Additional Information
For information on tariffs, maximum residue levels, and labeling requirements, please see the respective policy
sections in the report.
EU-28 Fresh Deciduous Fruit Annual Report 2018
30
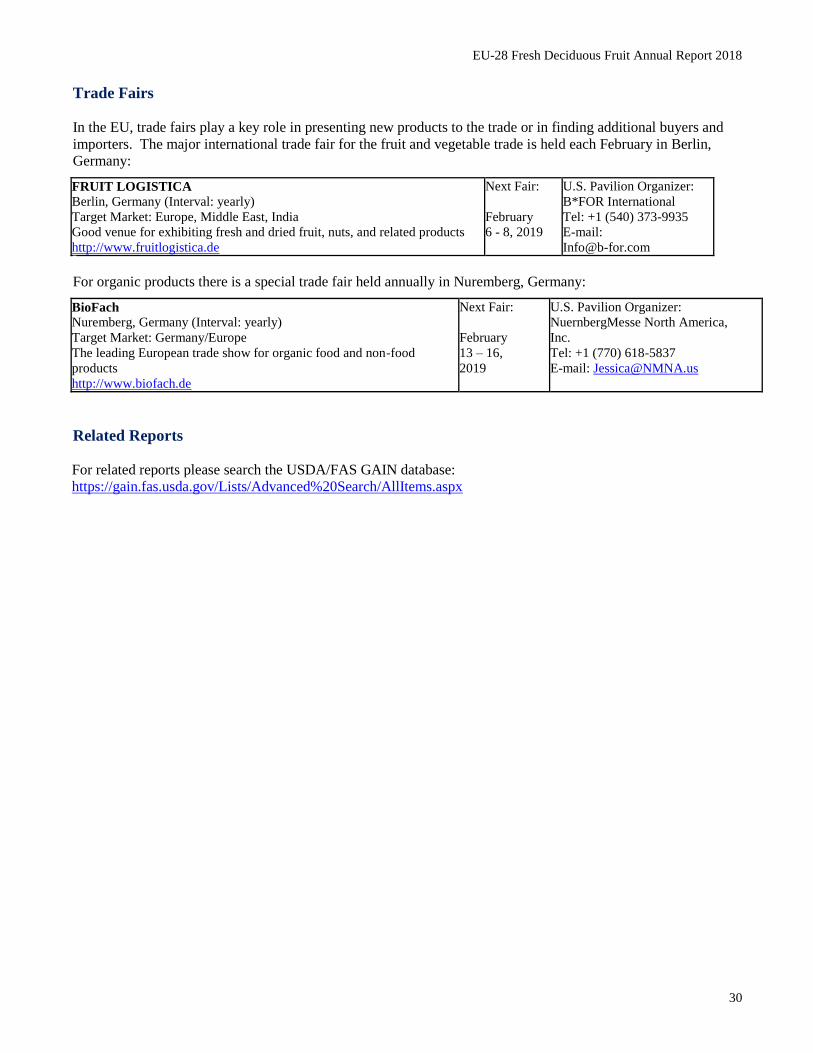
Trade Fairs
In the EU, trade fairs play a key role in presenting new products to the trade or in finding additional buyers and
importers. The major international trade fair for the fruit and vegetable trade is held each February in Berlin,
Germany:
FRUIT LOGISTICA Berlin, Germany (Interval: yearly)
Target Market: Europe, Middle East, India
Good venue for exhibiting fresh and dried fruit, nuts, and related products
http://www.fruitlogistica.de
Next Fair:
February
6 - 8, 2019
U.S. Pavilion Organizer:
B*FOR International
Tel: +1 (540) 373-9935
E-mail:
For organic products there is a special trade fair held annually in Nuremberg, Germany:
BioFach Nuremberg, Germany (Interval: yearly)
Target Market: Germany/Europe
The leading European trade show for organic food and non-food
products
http://www.biofach.de
Next Fair:
February
13 – 16,
2019
U.S. Pavilion Organizer:
NuernbergMesse North America,
Inc.
Tel: +1 (770) 618-5837
E-mail: [email protected]
Related Reports
For related reports please search the USDA/FAS GAIN database:
https://gain.fas.usda.gov/Lists/Advanced%20Search/AllItems.aspx