eu-27 wine annual wine annual report and statistics · domestic eu wine consumption continues to...
TRANSCRIPT

THIS REPORT CONTAINS ASSESSMENTS OF COMMODITY AND TRADE ISSUES MADE BY
USDA STAFF AND NOT NECESSARILY STATEMENTS OF OFFICIAL U.S. GOVERNMENT
POLICY
Date:
GAIN Report Number:
Approved By:
Prepared By:
Report Highlights:
The European Union (EU) is the world‘s largest wine producer, consumer, exporter, and importer.
Total EU-27 MY 2010/11 wine production is still preliminarily estimated at 156 Mhl, down 3.5
percent from the previous marketing year. Sharp production decreases in Germany, Romania, and
Hungary and small decreases in France, Italy, and Spain were only partly offset by significantly
higher production in Portugal. Domestic EU wine consumption continues to decline due to the
continued general economic crisis and are forecast to stagnate in MY 2010/2011. EU-27 wine
exports partially recovered in MY 2009/2010 and are expected to further increase in MY 2010/2011
thanks to growing demand both from developed countries (United States, Canada, Japan) and
BRIC economies (such as Russia and China). The United States remains the leading export market
(24.6 percent of the total in volume and 30.7 percent in value) for the EU-27. EU wine imports
Stefano Baldi
James Dever
Wine Annual Report and Statistics
Wine Annual
EU-27
IT1105
3/1/2011
Required Report - public distribution

slightly declined in MY 2009/2010 but are expected to increase in current marketing year.

Executive Summary:
This report presents the outlook for wine production, trade, consumption and stocks for the EU-
27. Unless specifically stated otherwise, data in this report are based on the views of Foreign
Agricultural Service analysts in the EU and are not official USDA data.
This report has been made possible due to the expert contributions of the following Foreign
Agricultural Service analysts:
Karin Bendz from FAS Brussels
Ornella Bettini from FAS Rome
Jolanta Figurska from FAS Warsaw
Laurent Journo from FAS Paris
Roswitha Krautgartner from FAS Vienna
Sabine Lieberz from FAS Berlin
Arantxa Medina from FAS Madrid
Ferenc Nemes from FAS Budapest
Jennifer Wilson from FAS London
HL = Hectoliter = 100 liters
Mhl = Million Hectoliters
MY = Marketing Year. The EU local marketing year used in this report is August to July
Harmonized System (HS) code: Grape wine (HS2204)
EU-27 Production, Supply and Demand (‘000 Hectolitres, MY Aug-Jul)
2009/2010 2010/2011 2011/2012 Beginning stocks 174,626 170,336 164,000 Production 161,633 155,935 158,000 Imports 12,957 14,000 16,000 TOTAL SUPPLY 349,216 340,271 338,000 Exports 18,157 22,000 23,000 Total consumption 160,723 154,271 155,000 - human 131,182 128,000 127,000 - other 29,541 26,271 28,000 Ending stocks 170,336 164,000 160,000 TOTAL DISTRIBUTION 349,216 340,271 338,000

Commodities:
Production: The European Union (EU) is the world leader in wine production, with almost half of the world‘s
total vine-growing area and 60 percent of production wine volume. Within the EU, France, Italy,
and Spain represents about 80 percent of total production. Other important EU producers include
Germany, Portugal, Romania, Greece, and Hungary. Wine is also an important sector in Austria,
Bulgaria, and Slovenia. The following table shows production trends in the leading EU wine-
producing countries during recent years.
Table 1 – Wine production* trend in the EU-27 (‘000 Hectolitres)
2005/06 2006/07 2007/08 2008/09 2009/10 2010/11
France 52,105 52,127 45,672 41,640 46,269 45,662
Italy 50,566 49,633 42,514 46,245 45,800 45,500
Spain 36,158 38,290 36,408 35,913 36,097 35,900
Portugal 7,266 7,542 6,074 5,620 5,872 7,120
Germany 9,153 8,916 10,261 9,991 9,228 6,900
Romania 2,602 5,014 5,289 5,159 6,703 4,700
Greece 4,027 3,938 3,511 3,873 3,080 3,100
Hungary 3,103 3,271 3,222 3,460 3,198 2,700
Other EU-27 countries 5,595 5,545 6,481 6,597 5,386 4,353
EU27 170,575 174,276 159,432 158,498 161,633 155,935
*Production of wine and of must intended for wine production (juices and other musts excluded)
2009/2010 (provisional) – 2010/2011 (estimates)
Source: OIV, Eurostat, FAS Europe Offices.
EU vine-growing area has been declining for the past few years due to shrinking margins and the
implementation of the new Common Market Organization grubbing-up scheme (see the Policy
section for details). The grubbing-up scheme involves voluntary withdrawal from vine growing by
decreasing subsidies over three years to reduce production of uncompetitive wines, cut surpluses,
and compensate producers by offering them alternatives. Thus far, 175,000 hectares have been
taken out of production, with additional reductions expected in 2011 – the third and final year of
the scheme.
Wine

EU-27 total vineyards area* trend (mil ha)
0
0.5
1
1.5
2
2.5
3
3.5
4
4.5
Other EU27 MS
Romania
Portugal
Italy
France
Spain
*Area harvested (wine grapes+ table grapes)
Source: FAOstat.
Total EU-27 MY 2010/11 wine production is still preliminarily estimated at 156 Mhl, down 3.5
percent from the previous marketing year. Sharp production decreases in Germany, Romania, and
Hungary and small decreases in France, Italy, and Spain were only partly offset by significantly
higher production in Portugal.
Despite this negative trend (production has been declining for the last ten years), France is
ranked as the world‘s largest wine producer this year with 17 percent of the world market share,
followed closely by Italy. France‘s MY 2010/2011 production is expected to show a 1.3 percent
drop, partially due to the gradual reduction of French land under vines connected to the grubbing-
up scheme. Compensation for producers to up root their vines has resulted in a reduction of
almost 18,500 hectares for each of the last three years. Based on estimates from the Ministry of
Agriculture, France had 786,804 hectares of vineyards for wine production in 2009. 59 percent of
French vineyards were devoted to VQPRD wines. Due to the continuing program of reducing the
planted area of lower quality production, planted area is expected to fall to about 750,000 hectares
by the end of 2011. In 2009, there were more than 3,000 organic wine growers on about 39,000
hectares, up 38.9 percent, compared to 2008, representing 4.6 percent of the total planted area
for wine.
Italy’s MY 2010/2011 wine production is estimated at 45.5 Mhl, which is about the same as the
previous marketing year but slight below Italy‘s 5-year average. The situation is not
homogeneous among the different Italian producing regions or even within them, due to diverse
weather problems. Italy‘s central and northern regions were cold and rainy, while the south was
hot. These diverse weather conditions caused both increases or decreases in both quantity and
quality and delayed the harvest by 10-to-15 days. Significant decreases occurred in the south,
especially in Sicily, which recorded a production decrease of 30 percent compared to MY
2009/2010. As a result, many Sicilian growers applied to the grubbing-up and green-harvesting

schemes (i.e., the total destruction or removal of grape bunches while still in their immature stage,
thereby reducing the yield of the relevant area to zero per EC Reg 479/2008). About one-third of
Italy‘s wine production is Controlled Appellation wines (DOC and DOCG), most of which are
produced in northern and, to a lesser extent, central regions. MY 2009/2010 production area was
officially reported at 702.550 hectares.
Despite having the largest area of vineyards in the world, Spain ranks 3rd in the EU-27 production
behind France and Italy, primarily due to low yields because some vineyards are cultivated on
marginal lands with reduced water supply. MY 2010/2011 production is estimated at 35.9 Mhl,
quite close to the previous year‘s level but still lower than the 5- year average. Spanish vine area
has been decreasing due to the uprooting of vineyards in the frame of the CMO reforms. The
production of controlled appellation wine in Spain has been constant over the past years.
However, total wine production, especially wine not under regulatory controls, has tended slightly
downward. According to national data, production of red and rosé wine is relatively stable, while
white wine production is declining.
German wine production for MY 2010/11 is estimated at 6.9 Mhl, which is 25 percent less than in
the previous MY. This decline is the result of low fruit set caused by very cold weather during
blossoming time. In addition, cold and rainy August weather required strict quality control at
harvest, which further reduced grape production. additionally, some regions suffered from hail. In
Germany, a little over 100,000 ha are currently planted with grapes for wine production: 63
percent of which are for white wine varieties, and 36 percent for red varieties. However, in terms
of wine production, 60 percent of German production consists of white wines and 40 percent are
red wines as red varieties generally have a slightly higher yield. The top five varieties in the white
section are: Riesling, Mueller-Thurgau, Silvaner, Pinot Grigio, and Pinot Blanc. Pinot Noir,
Dornfelder, Portugieser, Trollinger, and Black Riesling are the major reds.
MY 2010/2011 wine production in Portugal is estimated at 7.1 Mhl, 21.3 percent above MY
2009/2010. Around 71 percent of total production is red/rosè while the remainder 29 percent is
white with Vinho Verde Branco representing one third of it.
Hungary‘s MY 2010/11 grape wine production is estimated at 2.4 Mhl, which is significantly below
MY 2009/10 production (3.4 Mhl) and the 5-year average (3.6 Mhl). A slow decrease of wine
production along with the shrinking vineyard area is expected for the next couple of years in
Hungary. About 70 percent of wine produced in Hungary is white, 28 percent red, and less than 2
percent is rosé.
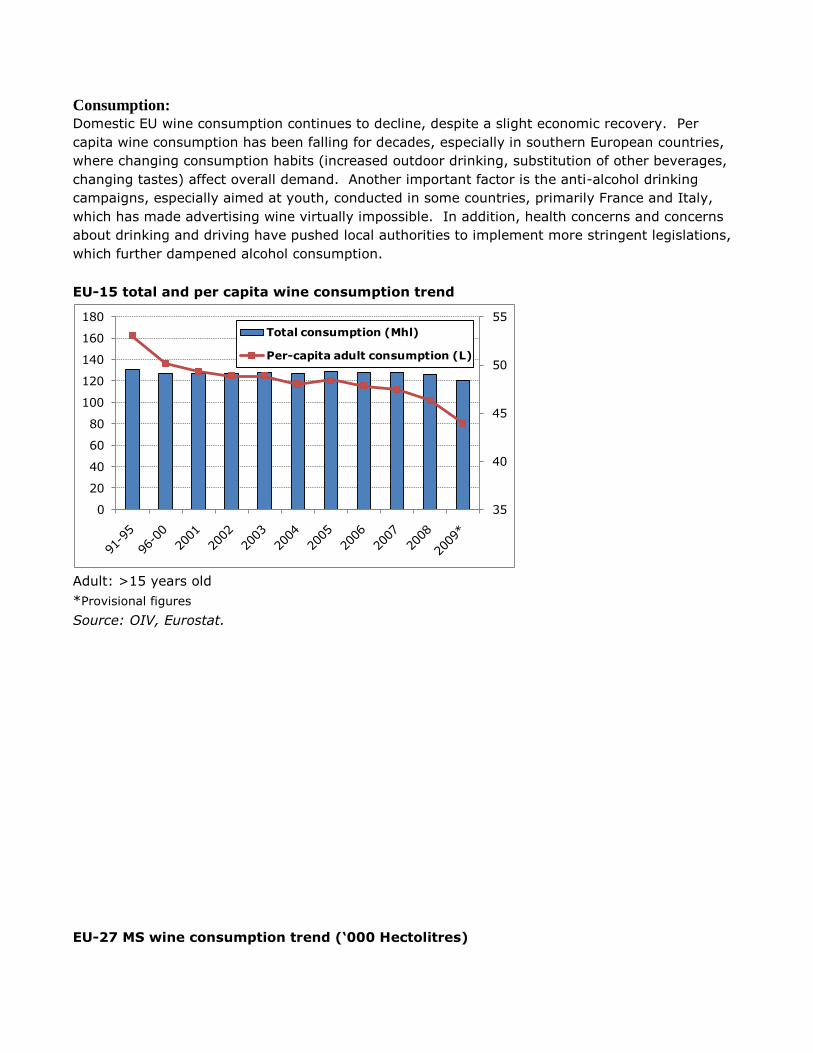
Consumption: Domestic EU wine consumption continues to decline, despite a slight economic recovery. Per
capita wine consumption has been falling for decades, especially in southern European countries,
where changing consumption habits (increased outdoor drinking, substitution of other beverages,
changing tastes) affect overall demand. Another important factor is the anti-alcohol drinking
campaigns, especially aimed at youth, conducted in some countries, primarily France and Italy,
which has made advertising wine virtually impossible. In addition, health concerns and concerns
about drinking and driving have pushed local authorities to implement more stringent legislations,
which further dampened alcohol consumption.
EU-15 total and per capita wine consumption trend
35
40
45
50
55
0
20
40
60
80
100
120
140
160
180
Total consumption (Mhl)
Per-capita adult consumption (L)
Adult: >15 years old
*Provisional figures
Source: OIV, Eurostat.
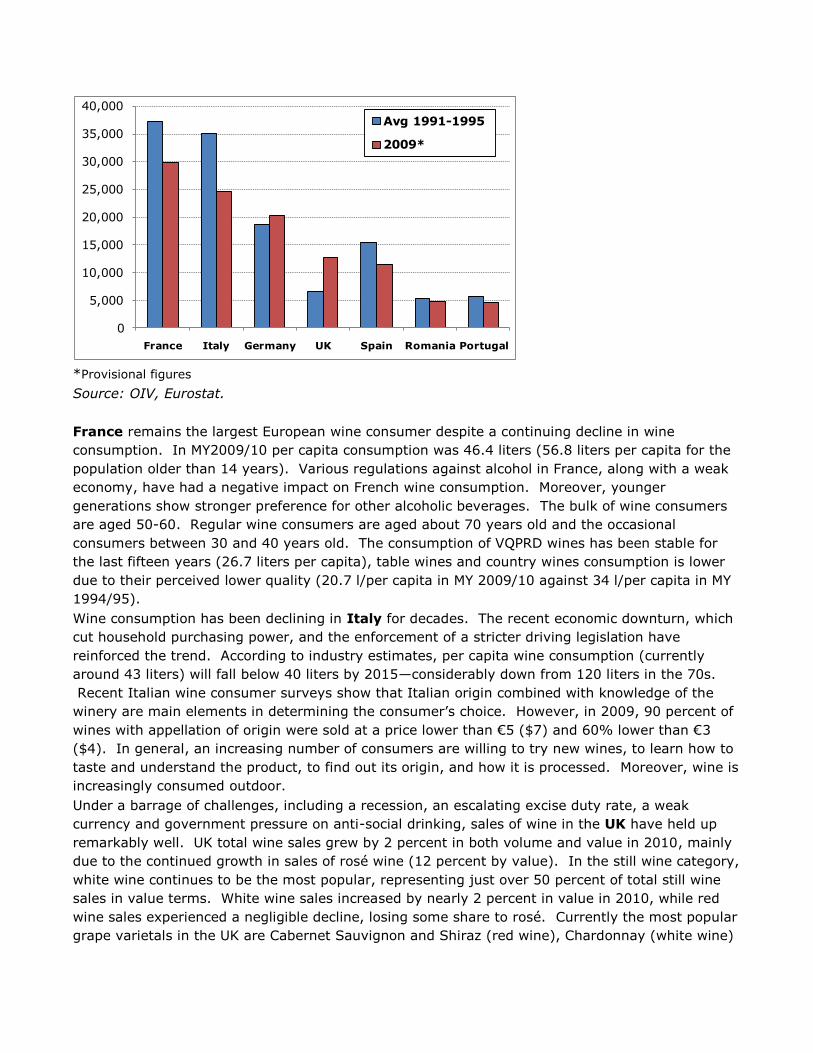
EU-27 MS wine consumption trend (‘000 Hectolitres)
0
5,000
10,000
15,000
20,000
25,000
30,000
35,000
40,000
France Italy Germany UK Spain Romania Portugal
Avg 1991-1995
2009*
*Provisional figures
Source: OIV, Eurostat.
France remains the largest European wine consumer despite a continuing decline in wine
consumption. In MY2009/10 per capita consumption was 46.4 liters (56.8 liters per capita for the
population older than 14 years). Various regulations against alcohol in France, along with a weak
economy, have had a negative impact on French wine consumption. Moreover, younger
generations show stronger preference for other alcoholic beverages. The bulk of wine consumers
are aged 50-60. Regular wine consumers are aged about 70 years old and the occasional
consumers between 30 and 40 years old. The consumption of VQPRD wines has been stable for
the last fifteen years (26.7 liters per capita), table wines and country wines consumption is lower
due to their perceived lower quality (20.7 l/per capita in MY 2009/10 against 34 l/per capita in MY
1994/95).
Wine consumption has been declining in Italy for decades. The recent economic downturn, which
cut household purchasing power, and the enforcement of a stricter driving legislation have
reinforced the trend. According to industry estimates, per capita wine consumption (currently
around 43 liters) will fall below 40 liters by 2015—considerably down from 120 liters in the 70s.
Recent Italian wine consumer surveys show that Italian origin combined with knowledge of the
winery are main elements in determining the consumer‘s choice. However, in 2009, 90 percent of
wines with appellation of origin were sold at a price lower than €5 ($7) and 60% lower than €3
($4). In general, an increasing number of consumers are willing to try new wines, to learn how to
taste and understand the product, to find out its origin, and how it is processed. Moreover, wine is
increasingly consumed outdoor.
Under a barrage of challenges, including a recession, an escalating excise duty rate, a weak
currency and government pressure on anti-social drinking, sales of wine in the UK have held up
remarkably well. UK total wine sales grew by 2 percent in both volume and value in 2010, mainly
due to the continued growth in sales of rosé wine (12 percent by value). In the still wine category,
white wine continues to be the most popular, representing just over 50 percent of total still wine
sales in value terms. White wine sales increased by nearly 2 percent in value in 2010, while red
wine sales experienced a negligible decline, losing some share to rosé. Currently the most popular
grape varietals in the UK are Cabernet Sauvignon and Shiraz (red wine), Chardonnay (white wine)
and Zinfandel (rosé). The popularity of ‗New World‘ wines continues to increase at the expense of
the traditional EU producers. South Africa, Chile and New Zealand are showing strong growth,
spurred on by branded promotions in retail outlets. Growth in U.S. sales is mainly driven by rosé,
and again brands are dominant. The lack of branding and/or instant grape varietal identification in
many wines from France and Germany mean that the UK consumer is unable to understand the
product and unlikely to repeat the purchase. Italian wine sales are benefiting from an increasing
UK consumer appreciation of Pinot Grigio and Prosecco. During the recession, supermarket wine
sales have been increasingly discount driven with deals such as three for £10 ($16) driving volume
sales. While consumers have partly been trading down to less expensive wines, many have
chosen to limit volume consumption, and opt for better-quality wines. Sales of the fastest-growing
red and white wines were in the above £5 ($8) price range. Champagne sales recovered
somewhat in the UK in 2010. However, consumers are increasingly choosing cheaper but high-
quality sparkling wine alternatives, such as Cava and Prosecco. Champagne sales in the ―on-
trade‖ (foodservice/bar sector) have been particularly hit by the recession to the extent that sales
decreased 7 percent by volume and 3 percent by value in 2010. Heavy promotional campaigning
in the ―off-trade‖ (retail sector) encouraged champagne sales in that sector to grow 4 percent in
volume and 3 percent in value during the same time period. As consumers become more
environmentally responsible, manufacturers, retailers and producers are responding to the ‗green‘
packaging sustainable trend. Plastic bottles are increasingly replacing glass, especially in the 25cl
bottle. Screw caps are also becoming more prevalent as consumers embrace the consistency and
convenience that they offer. 2011 is likely to be a difficult year for UK wine sales as the recession
continues and consumers trade down or reduce their consumption. Total UK wine sales are
expected to return to growth in 2012 as the grip of the recession fades. However, looking further
ahead the UK market is unlikely to experience the level of growth seen before 2007.
The wine sector in Spain is suffering the effects of the global and domestic economic downturn,
with lower consumption rates and lower sales, continuing the trend that began in 2000. The
negative economic scenario, like the high rate of unemployment, along with other factors such as
the no-alcohol traffic campaigns and the changes in consumer preferences in favor of beer and
other drinks are having a significant impact in the per capita consumption. The brand new anti-
tobacco law, implemented in January 2011, might also have a negative impact in the consumption
of wine in bars and restaurants. 2010 figures (Jan-Nov) show a slight increase of 2.5 percent in
the consumption of wine at home, compared to the same period of previous year. Hotels and
restaurants consumption figures (Jan-Sep) show a 12.3 percent decrease in quantity and a 9.2
percent in price, compared to the same period of previous year. This means a reduction of € 871.6
million and 224.1 million liters. On the same period, table wines continue a steep downward trend
(18.3 percent decrease in volume and almost 20 percent decrease in value). Consumption of
wines with Designation of Origin decreases 6 and 6.5 percent in value and volume respectively.
Total German consumption in recent years fluctuated between 19.3 and 20.0 Mhl. Similarly, per
capita consumption varied between 23.3 and 24.4 liters. As a comparison, per capita consumption
of beer has been steadily decreasing and currently amounts top 111 liters. In 2009, German
households spent 11.1 billion Euro on alcoholic beverages. Within this category, wine and
sparkling wine together accounted for 41 percent of expenditures, followed by beer (29 percent)
and spirits with 25 percent. When looking at imported wine, German households tend to favour
red wines over white wine. In 2009, 63 percent of household purchases at retailers consisted of
red wine, 29 percent of white wines and 8 percent of rosé wines.

In MY 2008/09 (latest available statistics) Austrian human consumption totaled 2.4 Mhl. During,
the same period, Austrian per capita consumption of wine was 29.2 liters. Austrians consume
about 73 percent of their own production. The consumption of domestic wines especially at
restaurants is increasing. About 50,000 hectoliters of Austrian wine is used industrially. Austrian
consumers generally prefer locally grown light white wines. The latest trend by Austrian wine-
growers is the production of full bodied high alcohol content red wines. This development favors
new world wines, which are known for their high alcohol content. There is especially demand for
good quality, inexpensive U.S. wine priced from $5 to $10 a bottle.
In Hungary, the decades-long decline in wine consumption has slowed during the past several
years due to a stronger demand for quality wine and imported wines as well as to the increase in
beer prices growth in 2007-2008, which temporarily resulted in increased wine consumption.
Homemade wine is estimated to be about 20 percent of total consumption in Hungary. The
deepening economic crisis may increase the consumption and sales of homemade wine (which is
not taxed).
Trade: Intra-EU trade, still representing the major share of the total world volume, which totaled 43Mhl in
MY 2009/10, according to recent EU Commission data. A large portion of this trade involves the
shipments of bulk wines, used mainly for blending purposes, from both Italy to Germany (about
3.4 Mhl) and France (0.8 Mhl), and from Spain to France (2.7 Mhl in the same period), Portugal
(1.3 Mhl), and Germany (1.2 Mhl).
Total Italian wine exports to the EU-27 in MY 2009/2010 were 14 Mhl, or 4 percent more than MY
2008/2009, due to increased shipments to Germany of bulk table wines, used locally for blending,
as mentioned above but also to increasing imports of bottled wines from Germany and the United
States.
Spanish exports to the rest of the EU in MY 2009/2010 reached 10.9 Mhl (around 70 percent of
Spanish wine exports), increasing by 3 percent from the previous MY. According to the latest
export data in the first quarter of MY 2010/2011, total Spanish wine exports have gone up 19
percent and 6 percent in quantity and value respectively, compared to the same period in the
previous year. This is due to the fact that the increase has been pushed by exports of bottled wine
without Designation of Origin (DO). The sales of bulk wine also continue at a good pace, due to
the recovery of markets like Russia, China and Italy. The negative tendency is for the bottled wine
with DO, which are unlikely to recover in the near future. Spanish wine producers and associations
are trying to give a boost to the export market for their products in order to fight the falling sales
in the domestic market and the crisis in prices. Spain is interested in changing their strategy and
focusing on exports under geographical indications, with higher quality and more added value
wines.
French shipments to EU destinations in MY 2009/2010 were 8.5 Mhl (1 percent higher than in the
previous year), directed to virtually all the major European markets.
Excluding intra-EU trade, wine exports from the European Union to third countries in MY
2009/2010 significantly recovered from the previous year both in quantity and value and first MY
2010/2011 estimates show a 30 percent increase in volume and 18 percent in U.S. dollar value.
The recovering economy and the increasing demand both from developed and BRIC countries are
the major reasons of this surge. Furthermore, the weaker increase reported in terms of value
than in volume can be explained by both by the decline of the wine prices recently occurred and
the stronger preference from the consumers in the importing countries towards cheaper wines.

EU-27 wine exports by category
000 HL % var. Aug-Dec 10/11-
09/10
$ mil % var. Aug-Dec 10/11-
09/10 2008/2009 2009/2010 2008/2009 2009/2010
Sparkling wine
1,599 1,699 23% 1,527 1,656 14%
Bottled 11,114 12,346 24% 5,715 6,217 19% Bulk 3,496 4,014 52% 361 353 30% Wine total 16,209 18,059 30% 7,603 8,226 18%
Source: Global Trade Atlas (GTA).
EU-27 wine exports by trading partner
000 HL % var. Aug-
Dec 10/11-09/10
$ mil % var. Aug-
Dec 10/11-09/10 2008/2009 2009/2010 2008/2009 2009/2010
United States 4,406 4,456 11% 2,555 2,533 6% Switzerland 1,580 1,705 -1% 920 946 2% Canada 1,474 1,503 28% 739 765 22% Japan 1,186 1,157 10% 737 699 10% Hong Kong 133 195 50% 347 569 75% Russia 2,463 3,126 63% 405 433 40% China 555 1,169 98% 211 386 77% Norway 495 522 16% 239 264 4% Singapore 100 121 2% 219 250 10% Australia 145 175 2% 100 123 8% World 16,209 18,059 30% 7,603 8,226 18%
Source: GTA.
The United States remains the leading export market (24.6 percent of the total in volume and 30.7
percent in value) for the EU-27 as a whole. In MY 2009/2010, the United States was the largest
extra-EU export partner for both Italy ($1.1 billion) and France ($0.9 billion).
In volume terms, Italian exports to the United States are two and half times compared to French
shipments. Russia is the second largest importer of EU wines (based on volume), with shipments
remarkably increasing in first quarter MY 2010/2011 (+63 percent), although they are mainly
represented by inexpensive Bulgarian and Spanish wines. Exports to China more than doubled in
MY 2009/2010 in terms of quantity and are forecast to keep on following the same trend even in
MY 2010/2011. The EU is not only the largest wine exporter in the world, but also the largest
importer. The main countries of origin remain, as can be seen from the table below, Australia,
Chile, South Africa, and the United States. Total imports, in any case, after the slight decrease
reported in MY 2009/2010, in the next MY should recover (a 10% increase has been reported for
the first quarter). In value terms, however, imports are falling by 6 percent, consequent to the
lower demand for the more expensive wines.
EU-27 wine imports by category
000 HL % var. Aug-Dec 10/11-
09/10
$ mil % var. Aug-Dec 10/11-
09/10 2008/2009 2009/2010 2008/2009 2009/2010
Sparkling wine 146 163 -3% 77 89 -14%
Bottled 6,864 6,472 -6% 2,589 2,447 -9% Bulk 6,279 6,320 29% 683 666 9% Wine total 13,289 12,955 10% 3,349 3,201 -6%
Source: GTA.
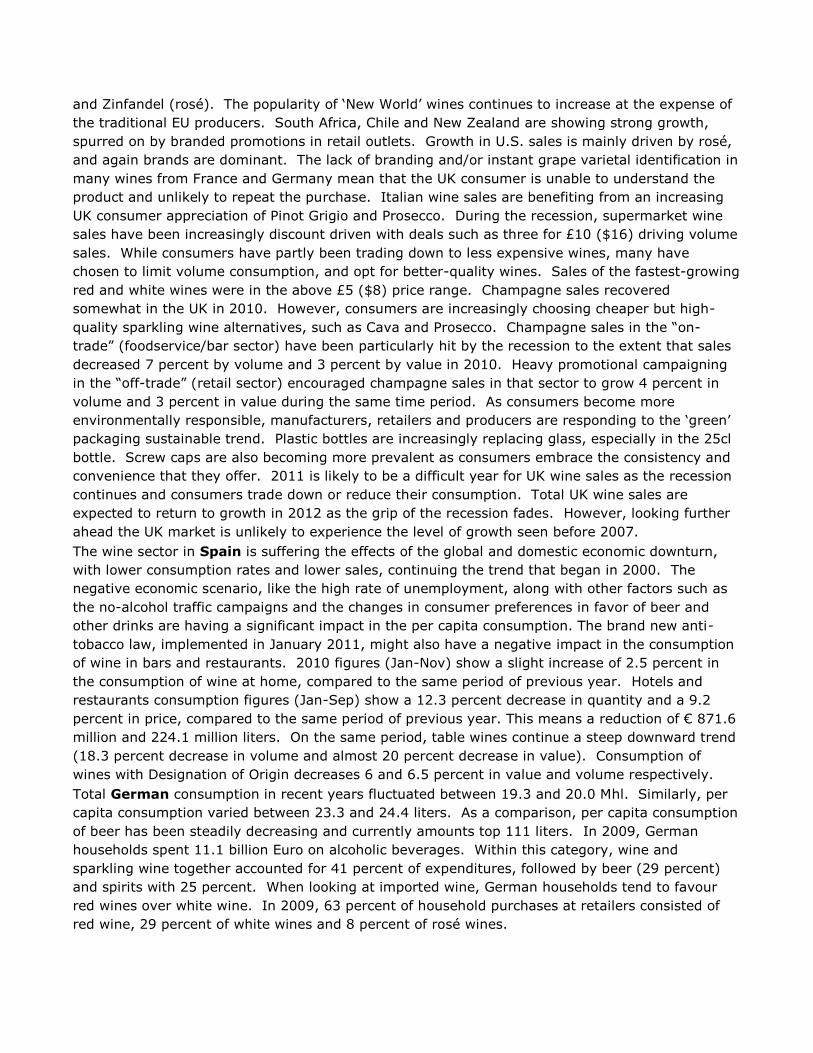
EU-27 wine imports by trading partner
000 HL % var. Aug-Dec 10/11-
09/10
$ mil % var. Aug-Dec 10/11-
09/10 2008/2009 2009/2010 2008/2009 2009/2010
Australia 3,305 3,233 19% 969 817 -20% Chile 2,935 2,983 2% 778 772 -7% South Africa 2,948 2,938 -7% 594 614 -16% United
States 2,138 2,067 26% 418 397 7% New
Zealand 413 508 37% 229 262 23% Argentina 717 596 1% 198 175 11% Switzerland 15 15 -14% 44 64 23% Moldova 107 112 -5% 20 21 -16% Macedonia 483 312 296% 31 19 177% Morocco 44 36 29% 7 7 -8% World 13,289 12,955 10% 3,349 3,201 -6%
Source: GTA.
U.S. exports to the European Union, after growing gradually in the recent past, have remained
stable during the last few years in quantity, but declined in dollar value. A large share of these
U.S. exports (over 70 percent) are represented by bulk Californian wine, which is bottled in Europe
for local consumption. Beginning in 2004, this bulk trade assisted the competitiveness of
Californian wine by reducing tariff, transportation and bottling costs. In particular, the bulk
exports to Italy in MY 2009/2010 were more than 600,000 hectoliters (99% of the U.S. exports to
Italy). Once bottled, this product is sold within the EU, mainly in the UK market. These sales have
tended to result in a statistical overestimate of Italian imports of US wines and under represent the
UK imports. Also 70 percent of the U.S. wine imported into Germany, is shipped as bulk wine,
bottled locally, and sold in leading German supermarket chains and discount food stores.
TRADE TABLES FOR SELECTED EU COUNTRIES
Italian wine exports
000 HL % var. Aug-Nov 10/11-
09/10
$ mil % var. Aug-Nov 10/11-
09/10 2008/2009 2009/2010 2008/2009 2009/2010
Germany 6,279 6,621 3% 1,086 1,128 -3% United States 2,380 2,542 2% 1,003 1,075 -1% UK 2,591 2,625 -8% 627 613 -13% Switzerland 637 670 -3% 298 335 4%
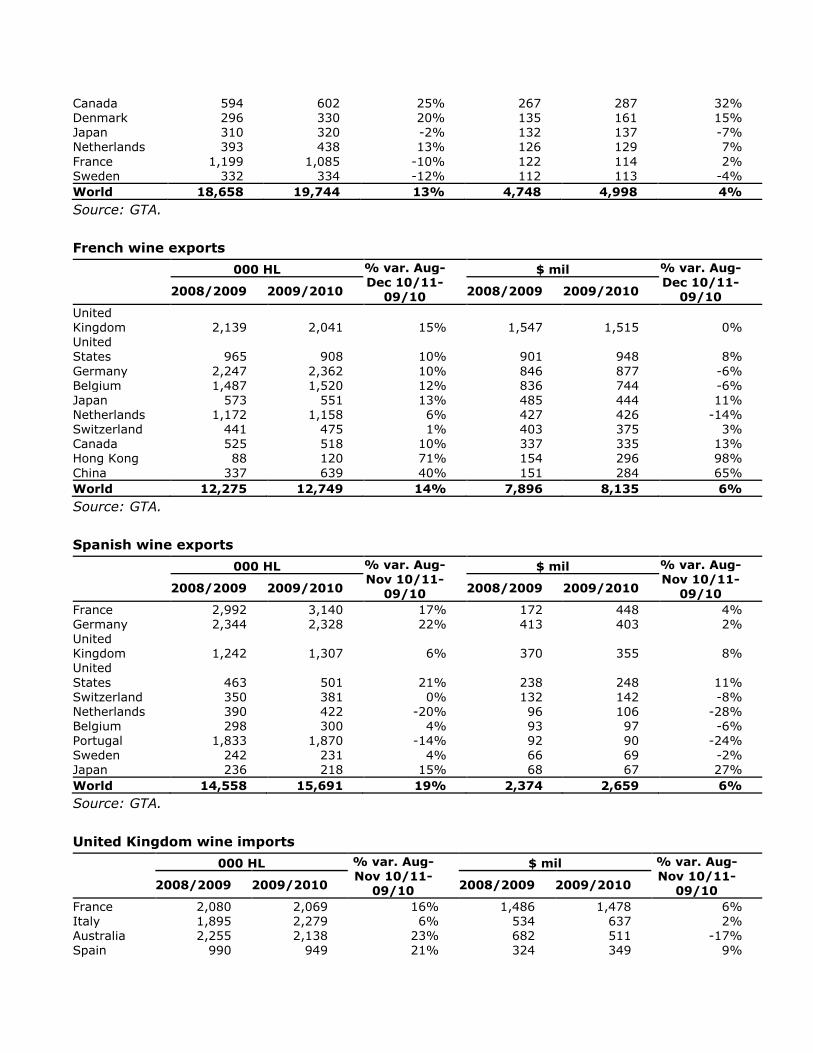
Canada 594 602 25% 267 287 32% Denmark 296 330 20% 135 161 15% Japan 310 320 -2% 132 137 -7% Netherlands 393 438 13% 126 129 7% France 1,199 1,085 -10% 122 114 2% Sweden 332 334 -12% 112 113 -4% World 18,658 19,744 13% 4,748 4,998 4%
Source: GTA.
French wine exports
000 HL % var. Aug-Dec 10/11-
09/10
$ mil % var. Aug-Dec 10/11-
09/10 2008/2009 2009/2010 2008/2009 2009/2010
United Kingdom 2,139 2,041 15% 1,547 1,515 0% United States 965 908 10% 901 948 8% Germany 2,247 2,362 10% 846 877 -6% Belgium 1,487 1,520 12% 836 744 -6% Japan 573 551 13% 485 444 11% Netherlands 1,172 1,158 6% 427 426 -14% Switzerland 441 475 1% 403 375 3% Canada 525 518 10% 337 335 13% Hong Kong 88 120 71% 154 296 98% China 337 639 40% 151 284 65% World 12,275 12,749 14% 7,896 8,135 6%
Source: GTA.
Spanish wine exports
000 HL % var. Aug-Nov 10/11-
09/10
$ mil % var. Aug-Nov 10/11-
09/10 2008/2009 2009/2010 2008/2009 2009/2010
France 2,992 3,140 17% 172 448 4% Germany 2,344 2,328 22% 413 403 2% United Kingdom 1,242 1,307 6% 370 355 8% United
States 463 501 21% 238 248 11% Switzerland 350 381 0% 132 142 -8% Netherlands 390 422 -20% 96 106 -28% Belgium 298 300 4% 93 97 -6% Portugal 1,833 1,870 -14% 92 90 -24% Sweden 242 231 4% 66 69 -2% Japan 236 218 15% 68 67 27% World 14,558 15,691 19% 2,374 2,659 6%
Source: GTA.
United Kingdom wine imports
000 HL % var. Aug-Nov 10/11-
09/10
$ mil % var. Aug-Nov 10/11-
09/10 2008/2009 2009/2010 2008/2009 2009/2010
France 2,080 2,069 16% 1,486 1,478 6% Italy 1,895 2,279 6% 534 637 2% Australia 2,255 2,138 23% 682 511 -17% Spain 990 949 21% 324 349 9%

Chile 1,033 1,095 24% 331 325 2% South Africa 1,100 1,071 0% 230 229 -23% New
Zealand 351 428 37% 188 214 20% Germany 668 620 4% 163 167 11% United States 850 755 78% 178 143 20% Portugal 170 171 -22% 77 97 -25% World 11,936 11,995 18% 4,374 4,320 2%
Source: GTA.
German wine imports
000 HL % var. Aug-Nov 10/11-
09/10
$ mil % var. Aug-Nov 10/11-
09/10 2008/2009 2009/2010 2008/2009 2009/2010
Italy 6,038 6,445 -16% 1,019 1,038 -18% France 2,308 2,360 3% 840 828 -8% Spain 2,172 2,087 6% 350 339 -8% South Africa 691 734 -1% 91 107 -7% Austria 405 438 -18% 76 87 -19% United States 385 407 10% 61 75 36% Chile 453 474 16% 69 67 22% Australia 301 352 14% 53 59 -5% Denmark 249 239 -52% 49 52 -37% Portugal 191 185 -5% 53 48 -4% World 14,355 14,550 -6% 2,844 2,839 -11%
Source: GTA.

Policy:
In April 2008, the EU Council of Ministers reformed the Common Market Organization (CMO) for
wine. The reform aimed to reduce overproduction, phase out expensive market intervention
measures and to make EU wine more competitive on the world market.
The European Commission claims that EU wine producers are disadvantaged because they are
smaller than major competitors‘ in other countries and their production is not adequate to the
needs of large-scale retailers. EU wine is losing market share because of regulatory constraints
and ineffective market strategies.
Other issues officials hope the CMO will address: increasing production and competition from the
New World, a systematic recourse to crisis distillation, an overly cautious grubbing-up policy,
exaggerated use of enrichment practices, confusing labeling rules, and rigid oenological practices.
Grubbing-up: wine grape growers receive a financial incentive to uproots grape vines. In the
wine reform the EU targeted an area of 175,000 hectares to be grubbed up over a three year
period. For 2010 there was a substantial oversubscription and the Commission set a ―reduction
coefficient‖ (to accommodate oversubscription for the scheme) of 45.9. The budget for 2010 was
€334 million. The budget for 2011, which is the final year for the grubbing-up scheme, is €276
million. The reasons for the oversubscription of the grubbing-up program are low wine prices, labor
intense practices, and financial difficulties.
Implementation of the Grubbing Up scheme
2008/2009 2009/2010 2010/2011 Total Available Resources (million €) 464 334 276 1,074
Requested by Member
States
Amounts (million
€) 1,011 666 463 2,140
Areas ('000 ha) 159.9 108.1 83.2 351.2
Acceptance (%) 45.875 50.125 59.622 50.000
Estimated areas to be Grubbed-up
('000 ha) 73.4 54.2 49.6 177.2
Source: European Commission.
The sums are allocated to interested Member States (MS), which then decide how to distribute the
amount. For example, a MS could distribute its allocations to all applicants providing only partial
compensation or it could prioritize which applicants are accepted. In order to avoid
abandonments, specific areas can be exempted from the grubbing-up scheme for environmental
reasons.
Planting rights: Planting rights refers to the right of a wine producer to plant vine. There is
currently a prohibition of new plantings in place until December 31, 2015. Replanting is allowed
only where producers grub up equivalent areas planted with vines. After this current restrictive
planting rights regime in the EU ends, MS may decide to extend the prohibition in their territories
until 2018.
Single Payment: In order to bring the sector in line with the reformed Common Agricultural
Policy (CAP), all areas formerly under vine can claim the status of areas eligible for decoupled
single payments. The reasons of this measure are to gain the beneficial effects on the
environment, due to the application of the cross-compliance rules.
National Envelopes: The term ―National Envelope‖ is used to refer to a funding allocation to
Member States giving them flexibility to distribute according to their own priorities. Article 7 of the
Wine CMO outlines 11 measures that MS can chooses from to support its wine industry. In 2010,
MS plan to use about one third of the funds for wine sector restructuring and conversion. MS plan
to use 15 percent for distillation of potable alcohol which will be phased out by July 31, 2012.
Restructuring and conversion of the wine yards is done to improve competitiveness and can include
relocation and improvements to vineyard techniques.
Promotion in third-country markets: in the wine CMO there is a possibility for MS to promote
wine in third country markets with funding from the National Envelopes. The Community
contribution for this may not exceed 50 percent of the eligible expenditure. However, the
Commission is not placing a priority on promotion during the recession so funding has been
minimal, around 5 percent of the budget.
Crises Distillation scheme: crises distillation of wine is one way for the EU to get rid of surplus
production. The distillation scheme of surplus wine will be a gradually phased–out. The emergency
distillation scheme has a four-year phase out scheme until 2012, going from a maximum of 20
percent of national funding in 2009, 15 percent in 2010, 10 percent in 2011 and to a maximum of
5 percent in 2012. MS are allowed to increase the available funds for crisis distillation by
contribution of national funds. Distilled alcohol must be used in the industrial sector.
Rural Development (RD) Funding: all RD measures are jointly funded between the EU and
national authorities. The rate of EU co-financing varies between 50 and 80 percent depending on
what the funding is for and the region. The MS or local authority pays the reminder. Only three MS
have allocated budget for using RD funds for the wine sector: Spain, France and Italy. The total
budget for these MS increased from about €40 million in 2009 to €80 million in 2010 and €120
million annually for 2011 and onwards. The largest part of this money is used to improve the
quality of the wine. Some of this money is also used for environmental purposes, for example to
keep vineyards on slopes where other types of agriculture are difficult, and where there is risk of
abandonment of land and the cultural environment is important for the region.

Marketing: Health Issues: Alcohol is a key public health and social concern across the EU. Europe has the
highest proportion of drinkers in the world, the highest levels of alcohol consumption per capita,
and a high level of alcohol-related harm. Nonetheless, effective alcohol policies to address health-
related issues will require EU-level support and coordination. Targeted measures aimed at limiting
the availability of alcohol, reduced exposure to commercial communication, drunk-driving
countermeasures, and improved education and information are currently lacking.
EU wine promotion abroad
The promotional activities for EU wines are implemented differently by each leading wine producer
and exporter, and are carried out both within the EU and in the most important world markets.
In France the GOF and inter-professional organizations underwrite assistance for domestic and
international promotion of wines and spirits for the French market promotion agency (SOPEXA)
which actively promotes French wines in EU and overseas markets. FRANCE AGRIMER (the new
French Association for Horticultural and Wine Products) receives funding from SOPEXA for foreign
promotions, mainly in Europe, the Americas, and in Asia. Promotional activities are focused on
advertising campaigns, POS, in-store promotions in hotels, restaurants, specialized outlets, trade
shows and fairs. For help with promotion to third country, the total amount of EU funds allocated
is 250 million dollars over 5 years.
The ‗Activity Plan 2011‘, carried out by the Spanish Institute of Foreign Trade (ICEX), includes a
list of promotional activities to push Spanish wines in foreign markets. This activity plan includes a
wide range of activities and actions in more than 30 countries, such as trade shows, seminars,
meetings with journalists, wine tastings, advertising, and promotional events.
Most of the generic marketing for German wines, both domestically and abroad, is carried out by
the German Wine Institute (Deutsches Weininstitut, DWI). The DWI is funded through a
mandatory check-off program. In addition, the German Ministry of Food, Agriculture (BMELV)
supports pavilions on selected trade shows abroad. With this program, 60 German wineries
participated in VINEXPO Asia Pacific in May 2010. For June 2011, BMELV offers participation in the
VINEXPO, Bordeaux.
Austrian wine promotion is carried out by the Austrian Wine Marketing Board (AWMB). The
purpose of the AWMB is the implementation of marketing measures for Austrian wine and receives
its budget form marketing contributions of the Austrian wine industry (about 3 million Euros), the
federal states (about 2.5 million Euros) and the Austrian federal budget (about 1.5 million).
In Italy the Italian Trade Commission (ICE), an agency of the Ministry of Economic Development,
continues to be the main public institution providing export and promotion assistance in foreign
markets. Funds from the EU wine Common Market Organization will be available for Italian wine
companies in the next three years. MY 2010/2011 funds totaled € 48 million and will gradually
increase to € 82 million and € 102 million in MYs 2011/2012 and 2012/2013 respectively. Funds
are targeted to promote events (mainly fairs, shows, workshops and wine tastings) in specific
countries.
In the UK, the most extensive program for US wine promotion is carried out by the Wine Institute
of California. Their long term strategy focuses on demonstrating the breadth and quality of
California wine to ensure that heavy discounting of branded wine does not taint the image of the
origin. The Wine Institute works hard to maintain the reliability of developed brands and the
quality of high end boutique wines, as well as developing the profile and availability of the mid-
price ($10-20) sector. The UK continues to be the most important export market for the Napa
Valley Vintners. Their trade body has a promotional program in the UK, administered through a
Public Relations agency, Emma Wellings PR. Their program focuses on moving consumers from
lower priced wines into the mid and upper tier, through a combination of their annual trade events
and trade and consumer education. The Washington Wine Coalition and the Oregon Wine Board
are represented in the UK by trade consultant – Hilltop Wines. Their priority is to establish a clear
identity in terms of quality and value for the Pacific Northwest wines. Their marketing strategy
includes attendance at trade shows, tastings and media/buyer tours.
Wine imported in Hungary from the USA needs to be covered by an analytical report (certificate)
from an accredited laboratory in the US. If the wine (from the US) has been imported by another
MS it can be sold in Hungary without further administrative measures. A sticker in Hungarian is
required if the label is in a foreign language. The label of wine bottles in Hungary usually contains
the name of the region (appellation/and or micro region) of production (e.g. Badacsony, Eger etc.)
and the kind of grape the wine made of (e.g. Riesling, Cabernet Franc etc. or Cuvee of certain
grape varieties).
Sales of U.S. wines to Poland increase every year. Direct sales of U.S. wines to Poland are valued
at nearly 3 mln. Total value of U.S. exports (direct and in-direct through EU counties) is valued at
USD 25 mln. Californian wines comprise about 16% of the Polish wine market, making California
the single largest supplier of wines in Poland. Every second year sales to the Polish market are
supported by a Wine Institute of California Event.
Allergen Labeling: Commission Directive 2007/68/EC sets out a list of ingredients and
substances that are likely to trigger allergic reactions. A temporary derogation from the
mandatory indication on wine labels of the use of casein and ovalbumin as clarification processing
aids was granted until December 31, 2010. Commission Regulation 1266/2010 extends this
derogation until June 30, 2012.
Excises and Other Taxes
Details on wine excises and Value Added Tax (VAT) in the different EU countries can be found in
the following document:
http://ec.europa.eu/taxation_customs/resources/documents/taxation/excise_duties/alcoholic_beve
rages/rates/excise_duties-part_i_alcohol_en.pdf
Excise taxes vary considerably among member countries, ranging between zero in many producing
countries to different levels in the non-producing countries. VAT rate (ad valorem) rates also vary
among the different countries, with a maximum rate of 25 percent in Denmark, Sweden and
Hungary.

Author Defined:
RELATED REPORTS FROM EU POSTS
Report
Number
Title Date
Released
AU1005 First Hailstorm in 2010 Causes Damage on More than 6000
Hectares
5/27/2010
IT1017 Italians Sequence Corvina - Amarone Genome 3/5/2010
For more on the EU wine reform please see GAIN E48026
The above reports can be accessed through the FAS website
http://www.fas.usda.gov/scriptsw/attacherep/default.asp