ethnic economies in metropolitan regions: miami and beyond
TRANSCRIPT

Ethnic Economies in Metropolitan Regions: Miami and BeyondAuthor(s): John R. Logan, Richard D. Alba and Thomas L. McNultySource: Social Forces, Vol. 72, No. 3 (Mar., 1994), pp. 691-724Published by: Oxford University PressStable URL: http://www.jstor.org/stable/2579777 .
Accessed: 11/06/2014 08:33
Your use of the JSTOR archive indicates your acceptance of the Terms & Conditions of Use, available at .http://www.jstor.org/page/info/about/policies/terms.jsp
.JSTOR is a not-for-profit service that helps scholars, researchers, and students discover, use, and build upon a wide range ofcontent in a trusted digital archive. We use information technology and tools to increase productivity and facilitate new formsof scholarship. For more information about JSTOR, please contact [email protected].
.
Oxford University Press is collaborating with JSTOR to digitize, preserve and extend access to Social Forces.
http://www.jstor.org
This content downloaded from 188.72.96.138 on Wed, 11 Jun 2014 08:33:20 AMAll use subject to JSTOR Terms and Conditions
Ethnic Economies in Metropolitan Regions: Miami and Beyond
JOHN R LOGAN, State University of New York at Albany RICHARD D. ALBA, State University of New York at Albany THOMAS L. McNULTY, State University of New York at Albany
Abstract
T7is article surveys the labor market status of racial and ethnic groups in seventeen metropolitan areas. Five Asian groups (Japanese, Chinese, Koreans, Filipinos, and Asian Indians) and three Hispanic groups (Cubans, Mexicans, and Puerto Ricans) are coniipared to non-Hispanic whites and blacks. Minority business concentrations are found niostly in a few low-wage sectors with low capitalization, low levels of unionization, and high proportions of femiiale employees. Patterns of economic incorporation meeting a minimal definition of an enclave economy are identified for several groups. Of these, the Cuban economy in Miami (along with Japanese in Honolulu and Koreans in Los Angeles) is unusual in terms of both size and sectoral diversity; the typical "enclave" appears to be based on a combination of apparel manufacturing and ethnicfoods.
We study the incorporation of racial and ethnic minorities into the United States economy as of 1980. We begin with questions framed at the level of the country as a whole. In what parts of the economy is business ownership especially common for each minority group? What distinguishes those sectors in which whites predominate from those in which minority owners are strongly represented? We then turn to analyses of patterns of incorporation of specific groups in those metropolitan areas that have large numbers of group members. It is in these local analyses that we may expect to find ethnic economies, i.e., distinctive constellations of business ownership and/or employment of group members in certain economic sectors. We describe the contours of these ethnic economies, comparing them across minority groups and metropolitan regions.
?) The University of North Carolina Press Social Forces, March 1994, 72(3):691-724
* Thzis research was suipported by grants from the National Science Foundation (SES 89 21273) and National Instituttes of Health (ROI HD 25250). We appreciate the assistance of Michael Wallace and Lawrence Raffalovich, who provided information on indutstnr characteristics, and helpful comnmnentaries of anonymouis reviewers. Direct correspondence to John R. Logan, Department of Sociology, SUNY, Social Science 340, Albany, NY 12222.
This content downloaded from 188.72.96.138 on Wed, 11 Jun 2014 08:33:20 AMAll use subject to JSTOR Terms and Conditions
692 / Social Forces 72:3, March 1994
Of special interest is the extent to which ethnic economies fit within the concept of ethnic enclave as introduced by Portes and his associates (Portes & Bach 1985; Wilson & Portes 1980) and subsequently elaborated. Portes specifically contrasted the ethnic enclave to the sectors of a dual economy, which include a primary - predominantly white - and secondary - dispropor- tionately minority - labor market. Some immigrant minorities, Wilson and Portes (1980) argued, could avoid the "low prestige, low income, job dissatisfac- tion, and the absence of return to past human capital investments" (301) that characterize the secondary labor market. Where immigrants have sufficient capital and entrepreneurial skills to control their own businesses, it may be possible to establish a semiautonomous enclave economy with opportunities that in some ways rival the primary sector of the mainstream economy.
The original studies of the Cuban enclave in Miami (Portes & Bach 1985; Wilson & Portes 1980) have been supplemented with case studies of the Chinese in New York, San Francisco, and Los Angeles, and the Koreans in New York and Los Angeles (Model 1992; Sakong 1990; Sanders & Nee 1987; Zhou & Logan 1989). These communities have much in common: they include large and spatially concentrated minorities, renewed at a rapid rate through new immigration from non-English speaking countries, and with a highly visible small business component. They represent the "new migration" into the U.S. since 1965, particularly from Asia and Latin America. Their apparent success suggests that there may now be favorable conditions for development of enclaves by other groups and in other parts of the country.
Such cases provide a stark contrast to the experience of African Americans in the U.S. Employment opportunities for African Americans have been restricted historically by outright discrimination, exclusion from some sorts of jobs and labor unions, low education, residential concentration at a distance from areas of new job creation, and a variety of other forces. Although this picture is changing, especially as a result of increasing opportunities in government (Waldinger 1986-87; Wilson 1978), African Americans are still a source of low- wage labor outside the primary labor market, principally for enterprises controlled by nonminority owners. African Americans have a low rate of self- employment outside of the underground economy, suffering unequal access to capital and to jobs that might otherwise provide the requisite experience for entrepreneurship (Light 1984). It is well known that a large share of retail stores in African American neighborhoods are owned by outsiders, giving rise to the characterization of the black experience as one of "internal colonialism" (Blauner 1972). Wilson and Martin (1982) argue, in addition, that there are few functional linkages among black-owned firms, and that black ownership therefore has weak multiplier effects for the community.
Yet the literature has been clearer about what outcomes are hypothesized for enclave participants than about how to define the enclave itself. Extant case studies have pointed out a variety of ways in which their subjects (e.g., Miami's Cuban community, San Francisco's Chinese) are distinct from others (e.g., Mexi- cans in much of the sunbelt). But even some researchers deeply involved in studies of ethnic economies have recently commented that the boundary between the enclave and nonenclave sectors of the metropolitan economy "remains ambiguous and under-specified conceptually" (Nee, Sanders & Sernau
This content downloaded from 188.72.96.138 on Wed, 11 Jun 2014 08:33:20 AMAll use subject to JSTOR Terms and Conditions
Ethnic Economies in Metro Regions / 693
1992:3). More tersely, Light and his colleagues (1992) conclude that "the ethnic enclave economy has become a rubber yardstick" (12, see also the review in Light & Bonacich 1991:x-xiii). A more apt metaphor, we suggest, would be a stew, to which researchers have added so many ingredients and seasonings that it is hard to tell what is essential.
A central purpose of our analysis is to sort out some of these ingredients. Based on a review of the literature and within the limits of available data, we propose a working definition of the enclave based on co-ethnicity of owners and workers, spatial concentration, and sectoral specialization. We describe ethnic economies around the country in these terms, leading to conclusions about the extent to which they meet these minimal elements of an ethnic enclave. We explicitly compare the situation of several minority groups composed largely of recent immigrants with that of non-Hispanic whites and, African Americans.
Some Dimensions of the Enclave Economy
The key feature of an ethnic economy is that it is bounded by race, ethnicity, or national origin. An ethnic economy could be defined as any situation where common ethnicity provides an economic advantage: in relations among owners in the same or complementary business sectors, between owners and workers, or even among workers in the same firm or industry regardless of the owner's ethnicity. Research on immigrant small business has long highlighted the contribution of ethnic solidarity to small-scale entrepreneurship. Bonacich (1973), for example, identified "middleman minorities," who specialized in (and sometimes dominated) certain economic activities, partly by taking advantage of linkages with other co-ethnic firms (see also Light 1972; Light & Bonacich 1991). Their customers may be principally located among persons of the same ethnic background (as in the case of Cuban grocers). They may operate in a protected labor market, finding workers at low wage rates through family or ethnic networks, common language, or legal constraints.
As this term has been used in the literature, an enclave econony is a specific type of ethnic economy. It rests fundamentally on co-ethnicity of owners and thieir employees. In their seminal article on Cubans in Miami, Wilson and Portes (1980) identify enclave participants simply as Cubans who have a Cuban employer. Co- ethnicity is at the heart of the advantages that they believe enclave entrepreneurs have over their competitors, providing them a 'privileged access to markets and sources of labor ... [and] the reciprocal obligations attached to a common ethnicity" (Wilson & Portes 1980:315). It is presumed that minority entrepreneurs create job opportunities for fellow group members - jobs that may not require English language facility, in which workers are protected from discrimination based on their race/ethnicity, and in which it is possible to learn the skills and develop the networks that would facilitate an eventual move into self-employ- ment. Bailey and Waldinger (1991) argue, in fact, that the ethnic enclave is essentially a 'training system" that would be too risky to sustain without the guarantees provided by ethnic ties between employers and employees.
The review of the enclave concept by Light et al. (1992) argues that co- ethnicity of employers and workers was sufficient in itself to define what
This content downloaded from 188.72.96.138 on Wed, 11 Jun 2014 08:33:20 AMAll use subject to JSTOR Terms and Conditions
694 / Social Forces 72:3, March 1994
Bonacich and Modell (1980) first called an ethnic economy. "The ethnic economy was ethnic simply because the personnel (owners and employees) were co- ethnics. Bonacich and Modell's concept of ethnic economy made no claims about the locational clustering or density of firms which might, indeed, be evenly distributed among neighborhoods and industries" (Light et al. 1992:5). But clustering - in space and economic sectors - is essential to the concept of enclave economy as it has developed over the last decade.
Thus the second key element is spatial concentration. Portes and Jensen (1989) define the enclave as "a concentration of [ethnic-owned] firms in physical space - generally a metropolitan area - which employ a significant proportion of workers from the same minority" (930, see also Portes 1981:290-91). Emphasis on concentration in a single metropolitan area acknowledges the advantages of spatial agglomeration effects. Wilson and Martin (1982) hypothesize in fact that the linkages created among Cuban-owned firms in Miami were made possible by their proximity to one another in Miami and Hialeah. Spatial concentration is also likely to be encouraged by the typically segregated residential pattern of ethnic communities, which provide both a labor pool and a market for many enclave firms.
A third element is sectoral specialization. Wilson and Portes (1980:303-304) note that Cuban firms in Miami 'tend to concentrate" in four or five manufac- turing sectors (textiles, leather, furniture, and cigar making), construction and finance, and several consumer services including restaurants, supermarkets, health clinics, and law firms. Like ethnic solidarity and spatial concentration, sectoral specialization also provides competitive advantages to enclave firms. According to the enclave model there are unique opportunities for self- employment by minority group members in certain economic sectors, oppor- tunities that may have diverse origins. Group members may have unique access to a particular supply of raw materials or finished goods, they may have unusual skills that are in demand, or a special willingness to operate a certain type of business. But whatever the reason, it is presumed that they enjoy a favorable competitive position in some niche of the economy that is not equally available to members of other groups with whom they are competing. In their research on New York City, Bailey and Waldinger (1991) note that every major minority group "has a marked concentration in one or two industries. And since access to ethnic networks is based on particularistic criteria, and job inforrhation and assistance comprise scarce resources, the creation of the specializations involves a process of boundary creation and maintenance, restricting members of other groups from jobs or occupations within the niche" (48).
Specialization within the enclave is further defined to include botlh productive industries and connmunity-based goods and services. Zhou (1992) identifies an "enclave protected sector" and an "enclave export sector" in the Chinese enclave economy in New York (see also Jiobu 1988). The protected sector "arises within the ethnic community itself. It represents a captive market, oriented toward ethnic-specific goods and services that are not easily accessible outside the enclave and toward solutions to various adjustment and settlement problems relating to immigration" (110). The export sector, typified by the garment industry, "contains a nonethnic market characteristic of leftover niches of the larger secondary economy" (112). It "generates income to be circulated back into
This content downloaded from 188.72.96.138 on Wed, 11 Jun 2014 08:33:20 AMAll use subject to JSTOR Terms and Conditions
Ethnic Economies in Metro Regions / 695
the ethnic markets and reinvested in both sectors" (116). This duality distin- guishes the enclave economy from what Portes and Bach (1985) describe as merely "ethnic neighborhoods," which may have many ethnic shops and services but do not serve the larger economy.
The distinction between an export sector and an enclave protected sector is clearer in theory than in practice. As one example, Zhou (1992) shows that the Chinese restaurant industry in Manhattan has a solid base within the Chinese community itself (suggesting that it is an enclave protected sector), but it also caters to a large non-Chinese market (suggesting that it is an export sector). Similarly, Cuban furniture makers in Miami - as manufacturers - might be categorized as an export sector, but conceivably most of their customers are local Cubans. For these reasons, we place more weight on diversification of the ethnic economy, as emphasized in Wilson and Portes's original description of Miami. In the following analyses, we will distinguish between agriculture and manufacturing on the one hand and trade and services on the other. Firms in agriculture and manufacturing employ larger numbers of workers than those in trade and services, and they are assumed by regional economists to have stronger multiplier effects on other economic activities. Ethnic economies based entirely on trade and services, while not necessarily lacking "export" activities as defined by Zhou, are more likely to fall into Portes and Bach's category of "ethnic neighborhoods."
These three dimensions - co-ethnicity of owners and employees, spatial concentration, and sectoral specialization - are key elements of an enclave economy. Situations meeting all three criteria are distinguished in the enclave literature from other modes of economic incorporation of minorities. Of these the best known are ethnic assimilation (where a group is absorbed equally into all sectors of the economy), ethnic neighborhoods (where ethnic-owned businesses deal only in locally consumed goods and services), middleman minorities (where ethnic entrepreneurs engage a workforce not necessarily composed of co- ethnics), and the secondary labor market or internal colony (where group members are concentrated only as employees in some disadvantaged economic sectors).
A fourth element, functional linkages among firms of the same ethnicity, is often mentioned in discussions of enclave economies. Such linkages could take many forms, such as trade or marketing associations among owners of similar businesses, buyer-supplier relationships within the community, and external dependencies for capital, materials, or technologies. Some researchers, including Wilson and Martin (1982), would consider the network of functional linkages to be essential to any definition of an enclave economy. However, to date there has been little research on these networks, and relevant data are available neither in the census (the data source on which we rely here) nor in publicly available surveys specifically designed to study ethnic economies. Therefore, we limit our survey of ethnic economies to the first three elements and leave for future research to discover what part is played by ethnic networking.
This content downloaded from 188.72.96.138 on Wed, 11 Jun 2014 08:33:20 AMAll use subject to JSTOR Terms and Conditions
696 / Social Forces 72:3, March 1994
Operational Measures
The most direct operationalization of the enclave concept would be at the level of the firm, based on the race, ethnicity, or national origin of employers and employees. Firms could be categorized as having the employer from a given minority group, employees predominantly from that group, both, or neither. Firms with both employer and employees of a given ethnicity could then be studied in other respects. Following the criteria described above, one would consider an enclave to exist to the extent that (1) ethnic firms are spatially concentrated in a single metropolitan area or central city, (2) they are specialized in some particular economic activities, and (3) these activities include both community trade/services and a productive sector in agriculture or manufac- turing.
Unfortunately, few data sets provide information on the racial/ethnic ownership and workforce composition of firms. The analysis by Portes and Bach (1985) is based on one such source, a survey of Cubans that asked about the ownership of the respondent's firm and the composition of the workforce. Most recent research, however, has relied on available data from the Census of Population. Census data provide direct information on the criteria of spatial concentration and sectoral specialization, but these data bear only indirectly on co-ethnicity of owners and workers.
Using census data, Sanders and Nee (1987) identify the enclave economies of Cubans in Miami and Chinese in San Francisco on the basis of place of residence. As a secondary operationalization they also use place of work (within the central city or metropolitan county versus the remainder of the state) to indicate enclave participation. Portes endorses this latter approach. As he points out, "the necessary data for an appropriate empirical definition of enclave employment - ethnicity of firm owners - is not available and must be approximated by the physical location of the firm" (Portes & Jensen 1992:419). In the absence of data on ownership, "it is still possible to assume that Cuban immigrants in Florida who work in the cities of Miami and Hialeah are more likely to be enclave participants because these are the sites where most Cuban- owned firms concentrate" (Portes & Jensen 1989:933).
Identification of the enclave by place of work corresponds to only one aspect of an ethnic economy: the spatial concentration of minority-owned firms. A high density of minority owners and self-employed persons in a single city or metropolitan area is considered to be a necessary condition for the existence of an enclave. It only weakly suggests that many minority workers in this area may be employed by co-ethnic business owners. It does not address the sectoral composition of minority businesses.
Sectoral specialization can be directly measured by drawing on the industry classifications of owners and self-employed persons provided by census data. These same data, applied to workers, provide an inferential measure of co- ethnicity: where workers are concentrated in the same sectors as owners, it is more likely that they actually work for co-ethnic employers. One version of this approach was introduced by Zhou and Logan (1989) in their study of Chinese immigrants in the New York region. They identified economic sectors in which Chinese immigrant workers were overrepresented, checked these sectors against
This content downloaded from 188.72.96.138 on Wed, 11 Jun 2014 08:33:20 AMAll use subject to JSTOR Terms and Conditions
Ethnic Economies in Metro Regions / 697
ownership patterns as revealed in Chinese business directories, and defined the enclave in terms of these industries. (This operationalization, therefore, took account of co-ethnicity and sectoral specialization, but ignored the issue of spatial concentration). A similar approach has also been used by Model (1992) to study Cuban and Chinese enclaves, using Census of Population sources (see also Light & Bonacich 1991).
This operationalization does not ensure that group members are dispropor- tionately employed by co-ethnics. It omits industrial sectors in which group members are underrepresented, but in which all group members are actually employed by persons of the same ethnicity (if such sectors exist). Nevertheless it is most likely that employment by co-ethnics occurs in those sectors where minority owners and workers are both concentrated; in a probabilistic sense, this assumption has a stronger basis than the assumption that all group members who work in the central city are employed by co-ethnics.
We believe that researchers should conduct extensive firm-level inves- tigations before drawing strong conclusions about the existence and character of enclave economies. Investigations based on census data can measure directly the spatial concentration (at the level of a metropolitan area, a county, or a central city) and the sectoral differentiation of the ethnic economy. They can identify economic activities in which the concentration of both employers and workers of the same ethnic background support a presumption that employers provide jobs disproportionately to co-ethnic workers. To this extent it is possible to determine whether a given ethnic economy has the three basic elements of our working definition of an enclave economy.
An advantage of research with census data is that these data are available for all major racial and ethnic groups, and the contours of economic incor- poration of different groups can be readily compared. In the following analyses we will compare patterns for the "new immigrant" minorities with those of whites and African Americans. For example, we will evaluate how large and how diversified is the Cuban economy in Miami compared to the positions typically held by non-Hispanic whites, and how the sectors dominated by these two groups compare to one another. We will determine whether the ethnic economies of any other groups in other regions meet our criteria of an enclave economy as fully as do Miami's Cubans, and whether there are regions where these same groups have economies comparable to the pattern of African Americans.
Research Design
Our analysis focuses on ten racial/ethnic groups. To examine groups figuring importantly in post-1965 immigration to the U.S., we include five Asian and two Hispanic groups: Asian Indians, Chinese, Filipinos, Japanese, Koreans, Cubans, and Mexicans.' Since Puerto Rican migration to the mainland U.S. can be considered as tantamount to immigration, this group is also studied. For comparative purposes, non-Hispanic blacks and whites are included, the former as the most important instance of a largely native-born minority and the latter
This content downloaded from 188.72.96.138 on Wed, 11 Jun 2014 08:33:20 AMAll use subject to JSTOR Terms and Conditions
698 / Social Forces 72:3, March 1994
because it is the majority group and therefore a natural point of comparison for minority economic achievement.
We examine the pattern of economic incorporation of these groups in the specific metropolitan areas in which they are most numerous. We have selected metropolitan areas that rank among the top five areas of concentration of any group. This criterion yields a total sample of seventeen metropolitan areas (primary metropolitan statistical areas [PMSAs] or metropolitan statistical areas [MSAs]), in which we examine the labor force representation of each of the ten groups. The areas are: New York PMSA, Los Angeles-Long Beach PMSA, Chicago PMSA, Philadelphia PMSA, Detroit PMSA, Washington MSA, Houston PMSA, San Diego MSA, Anaheim-Santa Ana PMSA, Newark PMSA, Miami- Hialeah PMSA, San Francisco PMSA, San Jose PMSA, San Antonio MSA, Honolulu MSA, Jersey City PMSA, and El Paso MSA. This list obviously includes most of the largest metropolitan areas in the nation, such as New York, Los Angeles, and Chicago, where several minority groups are present in large numbers. It also includes some West Coast receiving grounds of recent immigration, such as San Jose (an area of concentration for Japanese), and southwestern areas, such as El Paso (where many Mexicans are found).
There are few guidelines in the literature with respect to spatial boundaries. Following Portes, we define the population as persons who work within a given region (rather than by place of residence). We satisfy the criterion of spatial concentration partly by studying regions where each group is most populous. Many fieldwork studies have focused more specifically on neighborhoods within a city (e.g., the Chinatowns established in Manhattan and Queens, New York). But the Korean economy in Los Angeles, on the other hand, has been described as spatially dispersed throughout the region (Light & Bonacich 1991). Portes and Jensen (1989) make a similar observation about the Cuban enclave in Miami: "Although Cuban-owned enterprises concentrate in the municipalities of Miami and Hialeah, they are also found throughout Dade County (Miami SMSA). Networks tying these enterprises together are certainly not limited to those in the two central cities ... For this reason, it is appropriate to base the analysis on immigrant entrepreneurs in the entire Miami metropolitan area" (935). Nevertheless, we conduct separate analyses for the metropolitan area as a whole and for its central cities. It might prove unnecessarily confining to focus only on the central city and exclude the labor force of ethnic firms in the suburbs. On the other hand, some well-known enclaves are located in large cities (e.g., the Chinese in New York's garment sector), and the inclusion of the entire metropolitan area might obscure them. Our procedure allows us to determine empirically whether a particular pattern of economic incorporation is limited to the city or encompasses the entire region.
Sectoral specialization is measured here as an overrepresentation of group members as owners in particular industrial categories. As discussed above, co- ethnicity is implied (but not directly measured) by a corresponding over- representation of group members as workers in the same industrial categories in which the group appears as a collection of owners. These overrepresentations are calculated as odds ratios through the following procedures.
First, the labor-force samples for metropolitan areas and central cities are cross-classified by three variables: race/ethnicity (in the ten categories named
This content downloaded from 188.72.96.138 on Wed, 11 Jun 2014 08:33:20 AMAll use subject to JSTOR Terms and Conditions
Ethnic Economies in Metro Regions / 699
above); type of worker, whether self-employed or employed by someone else (based on the class-of-worker variable in the Public Use Microdata Sample [PUMS]); and industry sector. We include unpaid family workers in the employee category, since such workers are often thought to form an important component of an enclave work force. We employ a 47-category industry scheme used in the 1980 census (Office of Management and Budget 1972). Compared to the full set of 3-digit SIC codes, this categorization has the disadvantage that it may miss ethnic concentrations in some very specific lines of business. But it has the advantage of avoiding the sparsely populated cells that would occur if the fully detailed (231 category) industry classification were applied to 2.5% samples of minority groups. It is sufficiently detailed to allow for many important distinctions within the manufacturing, trade, and service sectors. The industry categories and their SIC codes are presented in Appendix 1.
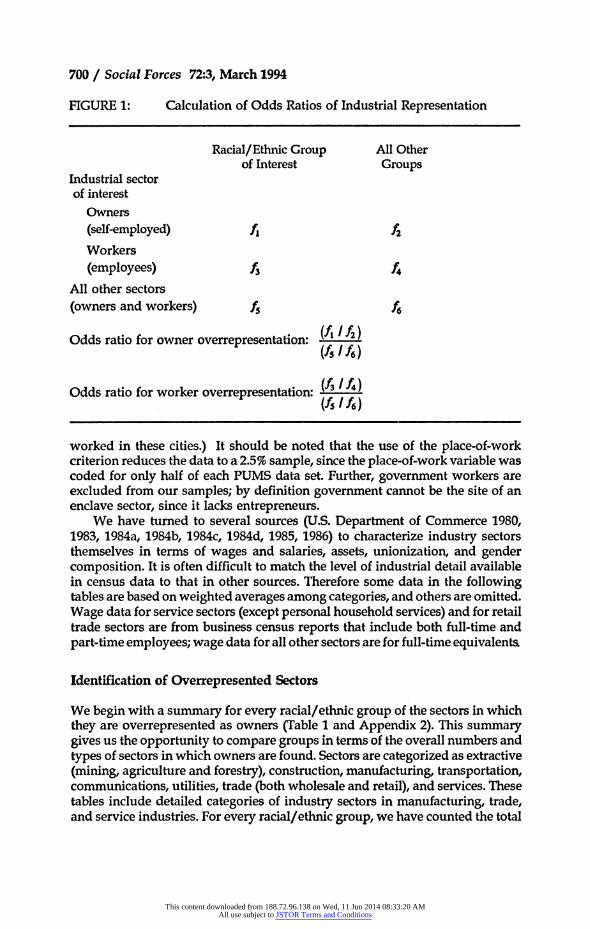
The resulting cross-classification is then condensed into a series of simpler 3 x 2 tables, one for every combination of racial/ethnic groups and discrete industries. In these tables, one dimension contrasts the selected group's members with others (two categories); the other contrasts the selected industrial sector with others, and also distinguishes between owners and employees in the given industry (three categories in total). Figure 1 depicts this layout. Two odds ratios are calculated from the array. One compares the odds of a group's represen- tation among an industry's owners to its overall representation in all other industrial sectors (i.e., the rest of the work force). This ratio, in other words, contrasts the odds in row 1 (fi If2 ) to that in row 3 (f5 If6 ). A second odds ratio accomplishes the equivalent comparison for the group's representation among the workers of the given sector (i.e., the odds in row 2 versus that in row 3). In the following analyses, we consider a group to be overrepresented in a sector if the odds ratio is at least 1.5, implying that a group's representation as owners or workers in a sector is 50% more than in the rest of the workforce.2
An odds ratio criterion has advantages over other potential measures. Most importantly, it is not sensitive to the very different sizes of the groups in the analysis (with the exception that, because whole numbers in a sample are used, very small groups may yield erratic results). One alternative, a criterion based on percentage comparisons (such as a ratio of a group's percent of an industry sector compared to its percent of the work force) has the difficulty that it would be easier for small groups to satisfy. The odds ratio avoids this problem. Recently, Model (1992) has employed a chi-square based significance test in a similar situation. It can be satisfied more easily by large groups (since chi square and its components depend upon N).
The data for our analysis are taken mainly from the 5% Public Use Microdata Samples of the 1980 census (the "A" geography; U.S. Department of Commerce 1983). For each metropolitan area (or each central city), we select all persons who in 1980 held a private-sector job located in that area (or city). (In the cases of metropolitan areas situated within larger metropolitan contexts, e.g., consolidated metropolitan statistical areas [CMSAsJ, we have screened the PUMS data for the larger area to find all persons who worked in the area to be analyzed.3 Similarly, for central cities, we have screened the surrounding suburbs to generate as comprehensive a sample as possible of persons who
This content downloaded from 188.72.96.138 on Wed, 11 Jun 2014 08:33:20 AMAll use subject to JSTOR Terms and Conditions
700 / Social Forces 72:3, March 1994
FIGURE 1: Calculation of Odds Ratios of Industrial Representation
Racial/Ethnic Group All Other of Interest Groups
Industrial sector of interest
Owners (self-employed) f Workers (employees) f3 4
All other sectors (owners and workers) f6
Odds ratio for owner overrepresentation: (f / f2)
(f5 f6)
Odds ratio for worker overrepresentation: (A If4) (A f6)
worked in these cities.) It should be noted that the use of the place-of-work criterion reduces the data to a 2.5% sample, since the place-of-work variable was coded for only half of each PUMS data set. Further, government workers are excluded from our samples; by definition government cannot be the site of an enclave sector, since it lacks entrepreneurs.
We have turned to several sources (U.S. Department of Commerce 1980, 1983, 1984a, 1984b, 1984c, 1984d, 1985, 1986) to characterize industry sectors themselves in terms of wages and salaries, assets, unionization, and gender composition. It is often difficult to match the level of industrial detail available in census data to that in other sources. Therefore some data in the following tables are based on weighted averages among categories, and others are omitted. Wage data for service sectors (except personal household services) and for retail trade sectors are from business census reports that include both full-time and part-time employees; wage data for all other sectors are for full-time equivalents.
Identification of Overrepresented Sectors
We begin with a summary for every racial/ethnic group of the sectors in which they are overrepresented as owners (Table 1 and Appendix 2). This summary gives us the opportunity to compare groups in terms of the overall numbers and types of sectors in which owners are found. Sectors are categorized as extractive (mining, agriculture and forestry), construction, manufacturing, transportation, communications, utilities, trade (both wholesale and retail), and services. These tables include detailed categories of industry sectors in manufacturing, trade, and service industries. For every racial/ethnic group, we have counted the total
This content downloaded from 188.72.96.138 on Wed, 11 Jun 2014 08:33:20 AMAll use subject to JSTOR Terms and Conditions
Ethnic Economies in Metro Regions / 701
number of industry sectors (that is, summed across all seventeen metropolitan areas) in which group members are overrepresented as owners. A case is counted if there is an overrepresentation in the central city and/or the MSA.
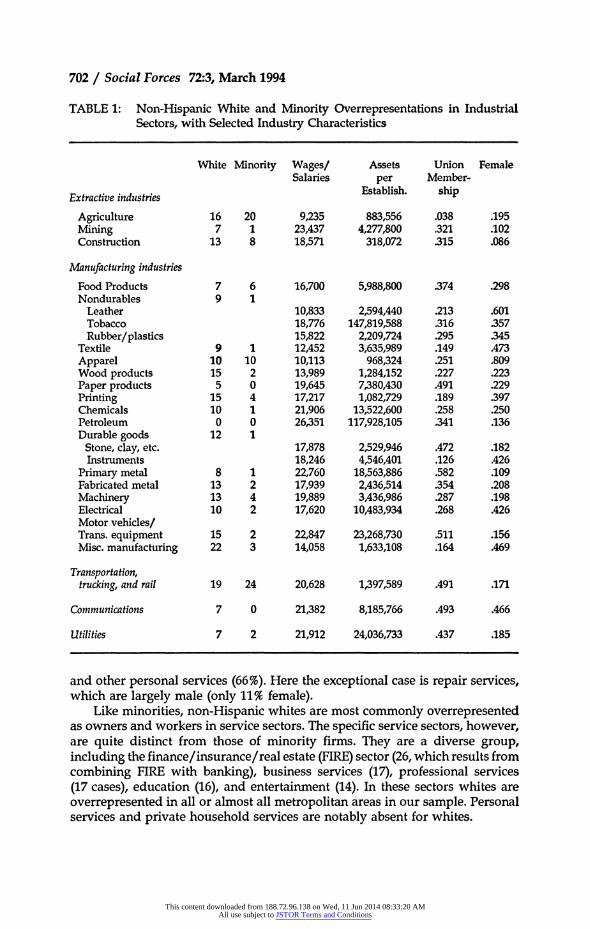
Table 1 compares non-Hispanic whites to all other groups combined; detailed information on every minority group is presented in Appendix 2. Table 1 also includes summary information on characteristics of each sector. Note that these comparisons are based on the average characteristics of all firms in each industry sector; we do not have comparable information disaggregated for white-owned or minority firms.
The outstanding result from this classification is that non-Hispanic whites have many more sectors of overrepresentation than any other group. Across the seventeen MSAs, we find 451 instances in which whites are overrepresented as owners. All other groups combined have a smaller total number of over- represented sectors. This predominance cannot be explained simply by the observation that whites are the majority of the population in most regions; the odds ratio is constructed to control for group size.
More important than sheer numbers is the pattern of sectors in which overrepresentations are found. That is, we find that minorities find business opportunities in qualitatively different economic sectors than do non-Hispanic whites. To assess these differences, we take into account the other characteristics of industry sectors that are provided in Table 1. We begin with the service sectors, in which minority overrepresentations are most common.
SERVICES
The service sector has traditionally offered opportunities for minority small businesses, which often have clients of the same ethnicity. For example, personal services, a diverse collection of activities such as beauty and barber shops and shoe repair, are likely to be geared to an ethnic market. Minority overrepresen- tation in service industries stands out in personal services (35 cases), health services (32 cases) and hospitals (12 cases), and repair services (17 cases). The service sector as a whole is characterized by very low levels of capitalization. This is especially true of private household and personal services, reported in the Census of Service Industries as a single sector, at $55,762 per establishment, repair services at $67,015, and health services at $82,680. As a reference point, most manufacturing sectors have averages well above $1 million. The service sectors also have very low levels of unionization - generally below 20%.
Among service industries, aside from the social service sector (which includes religious organizations), personal services and private household services have the lowest average wages (ust over $8,000), and repair services are at about the median ($12,756). Health services, by contrast, have a high average wage ($17,522), which reflects the concentration of professionals among employees (among minorities, these are mostly Asian - see Appendix 2) in this sector.
Service industries tend to have large proportions of women, although not uniformly so. Within this overall sector, the highest proportions of women are found in private household services (91%), health services and hospitals (76%),
This content downloaded from 188.72.96.138 on Wed, 11 Jun 2014 08:33:20 AMAll use subject to JSTOR Terms and Conditions
702 / Social Forces 72:3, March 1994
TABLE 1: Non-Hispanic White and Minority Overrepresentations in Industrial Sectors, with Selected Industry Characteristics
White Minority Wages/ Assets Union Female Salaries per Member-
Extractive industries Establish, ship
Agriculture 16 20 9,235 883,556 .038 .195 Mining 7 1 23,437 4,277,800 .321 .102 Construction 13 8 18,571 318,072 .315 .086
Manufacturing industries
Food Products 7 6 16,700 5,988,800 .374 .298 Nondurables 9 1
Leather 10,833 2,594,440 .213 .601 Tobacco 18,776 147,819,588 .316 .357 Rubber/plastics 15,822 2,209,724 .295 .345
Textile 9 1 12,452 3,635,989 .149 .473 Apparel 10 10 10,113 968,324 .251 .809 Wood products 15 2 13,989 1,284,152 .227 .223 Paper products 5 0 19,645 7,380,430 .491 .229 Printing 15 4 17,217 1,082,729 .189 .397 Chemicals 10 1 21,906 13,522,600 .258 .250 Petroleum 0 0 26,351 117,928,105 .341 .136 Durable goods 12 1
Stone, clay, etc. 17,878 2,529,946 .472 .182 Instruments 18,246 4,546,401 .126 .426
Primary metal 8 1 22,760 18,563,886 .582 .109 Fabricated metal 13 2 17,939 2,436,514 .354 .208 Machinery 13 4 19,889 3,436,986 .287 .198 Electrical 10 2 17,620 10,483,934 .268 .426 Motor vehicles/ Trans. equipment 15 2 22,847 23,268,730 .511 .156 Misc. manufacturing 22 3 14,058 1,633,108 .164 .469
Transportation, trucking, and rail 19 24 20,628 1,397,589 .491 .171
Communications 7 0 21,382 8,185,766 .493 .466
Utilities 7 2 21,912 24,036,733 .437 .185
and other personal services (66%). Here the exceptional case is repair services, which are largely male (only 11% female).
Like minorities, non-Hispanic whites are most commonly overrepresented as owners and workers in service sectors. The specific service sectors, however, are quite distinct from those of minority firms. They are a diverse group, including the finance/insurance/real estate (FIRE) sector (26, which results from combining FIRE with banking), business services (17), professional services (17 cases), education (16), and entertainment (14). In these sectors whites are overrepresented in all or almost all metropolitan areas in our sample. Personal services and private household services are notably absent for whites.
This content downloaded from 188.72.96.138 on Wed, 11 Jun 2014 08:33:20 AMAll use subject to JSTOR Terms and Conditions
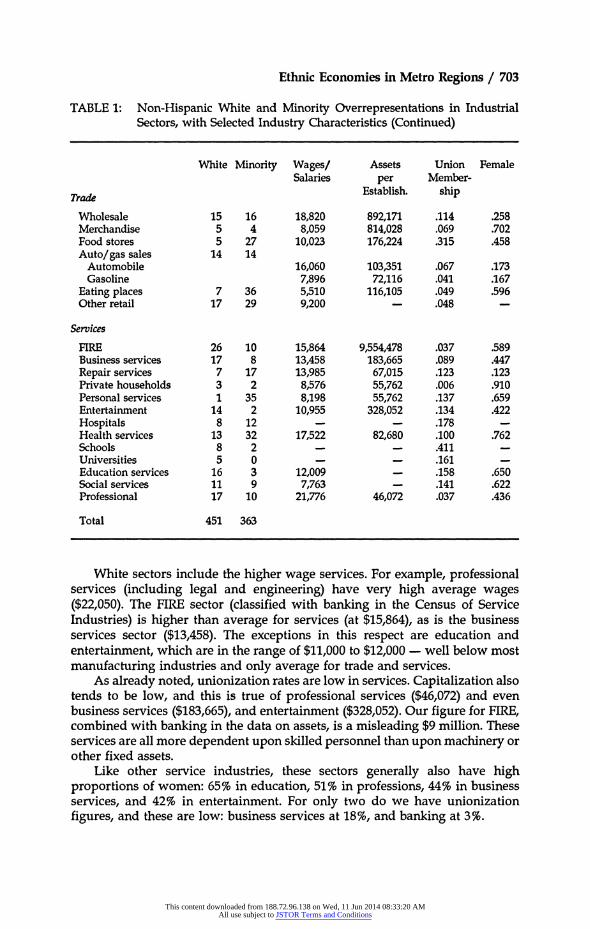
Ethnic Economies in Metro Regions / 703
TABLE 1: Non-Hispanic White and Minority Overrepresentations in Industrial Sectors, with Selected Industry Characteristics (Continued)
White Minority Wages/ Assets Union Female Salaries per Member-
Trade Establish. ship
Wholesale 15 16 18,820 892,171 .114 .258 Merchandise 5 4 8,059 814,028 .069 .702 Food stores 5 27 10,023 176,224 .315 .458 Auto/gas sales 14 14
Automobile 16,060 103,351 .067 .173 Gasoline 7,896 72,116 .041 .167
Eating places 7 36 5,510 116,105 .049 .596 Other retail 17 29 9,200 - .048 -
Services
FIRE 26 10 15,864 9,554,478 .037 .589 Business services 17 8 13,458 183,665 .089 .447 Repair services 7 17 13,985 67,015 .123 .123 Private households 3 2 8,576 55,762 .006 .910 Personal services 1 35 8,198 55,762 .137 .659 Entertainment 14 2 10,955 328,052 .134 .422 Hospitals 8 12 - - .178 -
Health services 13 32 17,522 82,680 .100 .762 Schools 8 2 - - .411 - Universities 5 0 - - .161 -
Education services 16 3 12,009 - .158 .650 Social services 11 9 7,763 - .141 .622 Professional 17 10 21,776 46,072 .037 .436
Total 451 363
White sectors include the higher wage services. For example, professional services (including legal and engineering) have very high average wages ($22,050). The FIRE sector (classified with banking in the Census of Service Industries) is higher than average for services (at $15,864), as is the business services sector ($13,458). The exceptions in this respect are education and entertainment, which are in the range of $11,000 to $12,000 - well below most manufacturing industries and only average for trade and services.
As already noted, unionization rates are low in services. Capitalization also tends to be low, and this is true of professional services ($46,072) and even business services ($183,665), and entertainment ($328,052). Our figure for FIRE, combined with banking in the data on assets, is a misleading $9 million. These services are all more dependent upon skilled personnel than upon machinery or other fixed assets.
Like other service industries, these sectors generally also have high proportions of women: 65% in education, 51% in professions, 44% in business services, and 42% in entertainment. For only two do we have unionization figures, and these are low: business services at 18%, and banking at 3%.
This content downloaded from 188.72.96.138 on Wed, 11 Jun 2014 08:33:20 AMAll use subject to JSTOR Terms and Conditions
704 / Social Forces 72:3, March 1994
TRADE
After services, the next most common minority sectors are those in the trade sector, particularly eating and drinking places (36 cases), other retail (29 cases), and food stores (27 cases). These are classic areas of immigrant economic activity because of the existence of an ethnic market in which specialized tastes are best known by co-ethnics. Information on average assets is available for two of these sectors ($116,000 for eating and drinking places and $176,000 for food stores). Both are well below those of general merchandise stores ($814,000), and less than any manufacturing sector (in which the lowest is $968,000), but on a par with several service industries. Eating and drinking places have the lowest average wages of any sector, including those outside of trade: $5,510 (this figure is depressed by the inclusion of part-time employees, as are other retail and service wages reported here). Food stores, at $10,023, are about average for retail or service sectors, but below the average wages for any manufacturing sector. Other retail has average wages of only $9,200.
Unionization is also very low in eating places and other retail, below 5%. The average for food stores is, by contrast, quite high (31.5%), but we suspect that this represents the situation of larger supermarket chains rather than minority-owned shops.
The employment of women is about average for eating places (60%) and for food stores (46%) - less than some other retail and 'service, and even some manufacturing sectors, but considerably above the average for manufacturing.
Among the trade sectors, whites are commonly overrepresented in other retail (all 17 cases), auto/gas sales (14 cases), and wholesale trade (15 cases). Of all trade sectors, wholesale has the highest level of capitalization ($892,000) and the highest wages ($18,820). Auto and gas sales has high wages for a retail sector ($16,060), but only modest capitalization (just above $100,000). Other retail, noted above, is a relatively low wage sector ($9,200).
MANUFACTURING
Manufacturing sectors are much less common areas of minority ownership than services or trade. Among 16 manufacturing sectors separately listed in the PUMS data, the apparel industry is by far the most common area of minority overrepresentation (showing up in 10 cases). This industry has drawn con- siderable attention as a "sweatshop" prototype. Apparel manufacturing has the lowest average wages ($10,113), as well as the lowest average assets per establishment (under $1 million), of any manufacturing sector. Light and Bonacich (1991) note, for example, that many Korean garment shops in Los Angeles opened with only $2,000 investment, "the cost of six sewing machines" (243). It is also distinguished by the largest percentage of females (over 80%), and a lower than average proportion (for manufacturing) of union members (25.1%), despite the historical strength of the Intemational Ladies Garment Workers Union (ILGWU). In all these ways it stands out as a sector that offers few advantages to employees and that may be relatively easy to enter as an entrepreneur.
This content downloaded from 188.72.96.138 on Wed, 11 Jun 2014 08:33:20 AMAll use subject to JSTOR Terms and Conditions
Ethnic Economies in Metro Regions / 705
Whites are widely distributed as owners among all categories of manufac- turing. They appear in apparel (10 cases) as do minorities, but also in many other categories, like wood products (15), printing (15), durable goods (12), fabricated metal (13), machinery (13), and motor vehicles and transportation equipment (15). In this respect their experience is quite unlike that of minority group members. Manufacturing on the whole is characterized by high average wages and capitalization, and (with some exceptions) low proportions of women and high unionization.
OTHER SECTORS
Another sector deserving mention for both whites and minorities is agriculture. Agriculture includes a relatively large number, 20, of overrepresentations of minorities, and 16 cases for whites. Agriculture is a low wage sector (just over $9,000), although average assets including land are near those of manufacturing (close to $900,000). Union membership is particularly low (3.8%). Because agriculture is an export industry - that is, it likely produces goods for sale on the larger market - and because it may employ large number of workers, it could be an important component of an ethnic economy. In terms of wages, assets, and unionization, it is difficult to distinguish from such industries as apparel manufacturii'g.
Also relevant for both whites (19 cases) and minorities (24 cases) is the transportation, trucking, and rail sector (these three sectors are separately listed in Appendix 2 but combined in Table 1). On average it has high wages, moderate capitalization, high unionization, and a low proportion of women in the labor force.
ETHNIC ECONOMIES IN METROPOLrTAN AREAS
Of course, these summaries conceal substantial differences among minorities in the number and sectoral distribution of overrepresentations. As shown in Appendix 2, the Japanese, Chinese, Koreans, and Cubans have more over- represented sectors than other groups, and are approximately equal to one another (in the range of 56 to 65). These are the groups most commonly referred to in the literature on ethnic economies. All have more than five cases in a manufacturing sector, as well as 18 or more in both trade and service sectors. These are not large numbers when spread across seventeen metropolitan regions, particularly when compared to the pattern of disproportionate ownership by whites, but as we shall see below, they are actually concentrated in a much smaller number of regions.
Blacks, Asian Indians, and Mexicans have smaller numbers of over- represented sectors, followed by Filipinos and Puerto Ricans. Blacks, Filipinos, and Puerto Ricans are found mostly in services, Asian Indians in trade and services, and Mexicans in services and manufacturing.
We now examine the spatial concentration of these entrepreneurial activities. Ethnic economies are presumed to be tied to particular regional economies. Our approach is to review each group separately with a focus on the five metro- politan areas in which the group is most numerous; where appropriate, the text
This content downloaded from 188.72.96.138 on Wed, 11 Jun 2014 08:33:20 AMAll use subject to JSTOR Terms and Conditions
706 / Social Forces 72:3, March 1994
refers to other cases. Tables 2 through 8 list all the sectors in which group members are disproportionately represented as owners and self-employed. (A notation following each sector indicates whether our procedure identified it for the metropolitan area as a whole or only for the central city. Where no notation appears, a sector was identified in both.) In order to establish the enclave criterion of co-ethnicity of owners and workers, the tables also distinguish those sectors in which - in addition to disproportionate entre- preneurship - the group is also overrepresented as employees. These sectors are italicized. Finally, sectors in agriculture and manufacturing are listed in a separate column from trade and service sectors.
It is possible that even a small presence of a group's members as owners in an economic sector creates possibilities of co-ethnic employment and functional linkages across sectors among minority firms. From this perspective it could be useful to identify economic sectors in which, without being overrepresented, the number of entrepreneurs belonging to a particular group reaches a certain threshold level. Such data would be especially relevant to the enclave model if they revealed additional sectors in agriculture or manufacturing, which have the greatest potential for multiplier effects both through employment of group members and through networks of suppliers and distributors. To assess this aspect of ethnic economies, we have identified additional sectors in which the census samples include at least five owners and self-employed group members. (Based on a 2.5% sample, this means that there are estimated to be about 200 owners in the population). These are not included in the tables but are noted in the text.
NON-HISPANIC WHrTES
Because non-Hispanic whites are overrepresented as entrepreneurs in so many sectors in almost every metropolitan area, we do not present these breakdowns for whites, However, it is useful to summarize the white pattern because there is a striking disparity between non-Hispanic whites and all other groups. In all the metropolitan areas and all their central cities, whites dominate multiple industrial sectors, wrhich typically encompass prestigious and remunerative occupations. Everywhere, for instance, whites are disproportionately found as both owners and workers in the professional services sector. They similarly predominate in the financial sector (FIRE) in most metropolitan areas, although not in New York, one of the national centers of the financial industry (where they are, however, overrepresented as owners). They are frequently over- represented in education, business services, health and social services, and entertainment. Many of these sectors can be interpreted as "control" activities in the mainstream economy, central to modern business activity.
Non-Hispanic white predominance in many metropolitan areas extends beyond sectors where white-collar occupations are prevalent to include those where unionized and highly paid blue-collar work are more typical. In the Northeast and Midwest, whites are overrepresented as entrepreneurs and workers in construction; in a number of metropolitan areas spread throughout the nation, they are overrepresented in printing. In Detroit, where manufacturing industries have traditionally accounted for a large share of the work force,
This content downloaded from 188.72.96.138 on Wed, 11 Jun 2014 08:33:20 AMAll use subject to JSTOR Terms and Conditions
Ethnic Economies in Metro Regions / 707
whites are concentrated in numerous manufacturing sectors, ranging from electrical equipment to wood products. Automobile manufacturing itself shows up as a sector of concentration of white owners, but not workers.
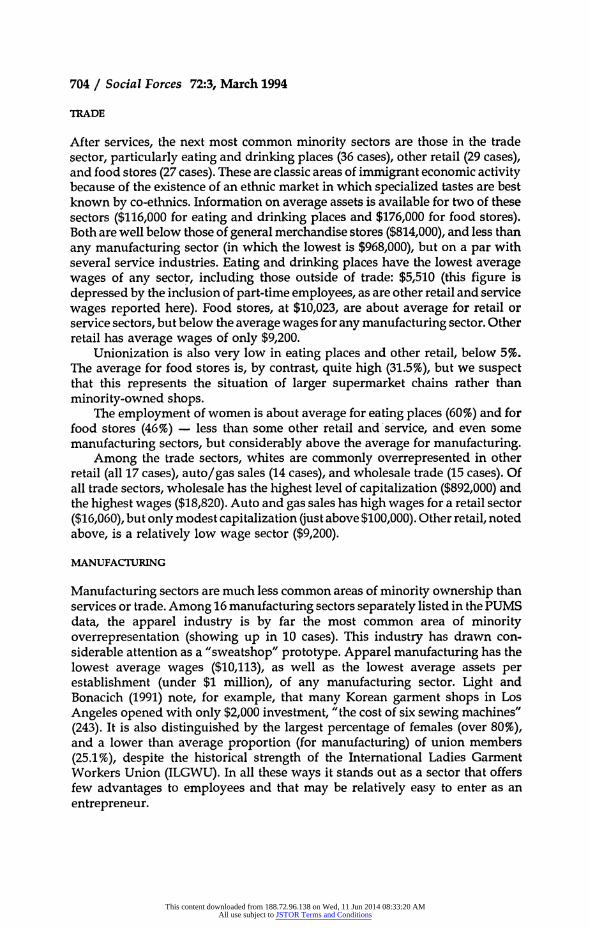
AFRICAN AMERICANS
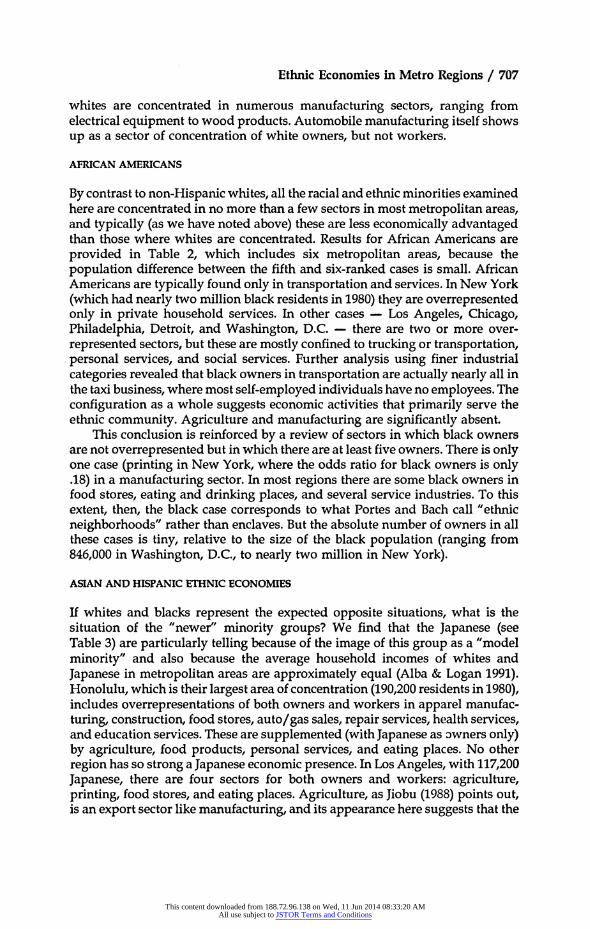
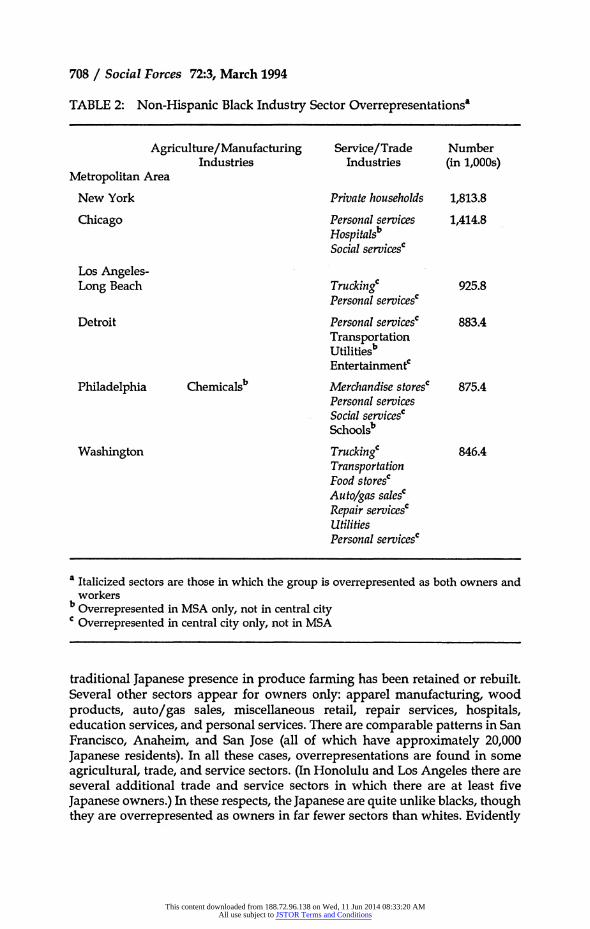
By contrast to non-Hispanic whites, all the racial and ethnic minorities examined here are concentrated in no more than a few sectors in most metropolitan areas, and typically (as we have noted above) these are less economically advantaged than those where whites are concentrated. Results for African Americans are provided in Table 2, which includes six metropolitan areas, because the population difference between the fifth and six-ranked cases is small. African Americans are typically found only in transportation and services. In New York (which had nearly two million black residents in 1980) they are overrepresented only in private household services. In other cases - Los Angeles, Chicago, Philadelphia, Detroit, and Washington, D.C. - there are two or more over- represented sectors, but these are mostly confined to trucking or transportation, personal services, and social services. Further analysis using finer industrial categories revealed that black owners in transportation are actually nearly all in the taxi business, where most self-employed individuals have no employees. The configuration as a whole suggests economic activities that primarily serve the ethnic community. Agriculture and manufacturing are significantly absent.
This conclusion is reinforced by a review of sectors in which black owners are not overrepresented but in which there are at least five owners. There is only one case (printing in New York, where the odds ratio for black owners is only .18) in a manufacturing sector. In most regions there are some black owners in food stores, eating and drinking places, and several service industries. To this extent, then, the black case corresponds to what Portes and Bach call "ethnic neighborhoods" rather than enclaves. But the absolute number of owners in all these cases is tiny, relative to the size of the black population (ranging from 846,000 in Washington, D.C., to nearly two million in New York).
ASIAN AND HISPANIC ETHNIC ECONOMIES
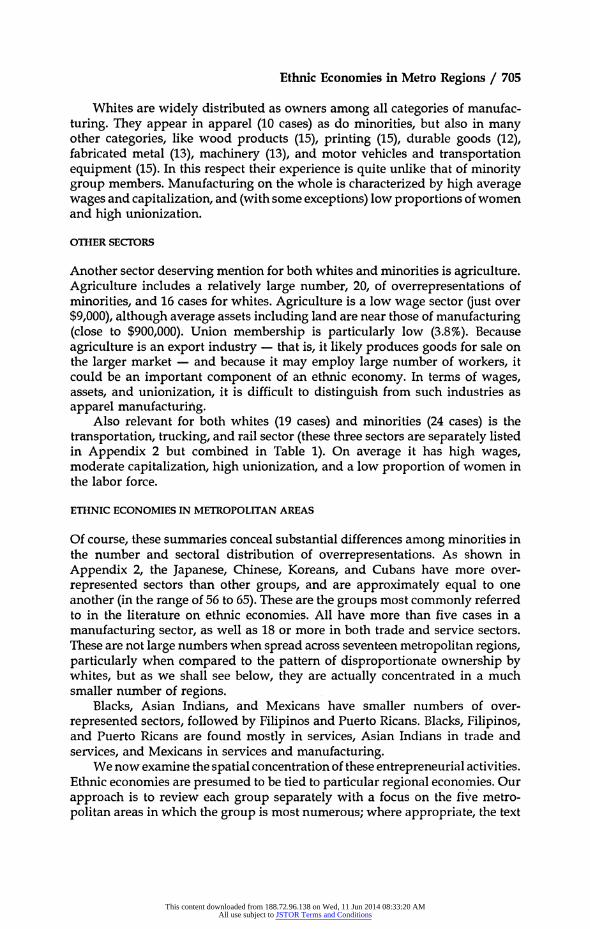
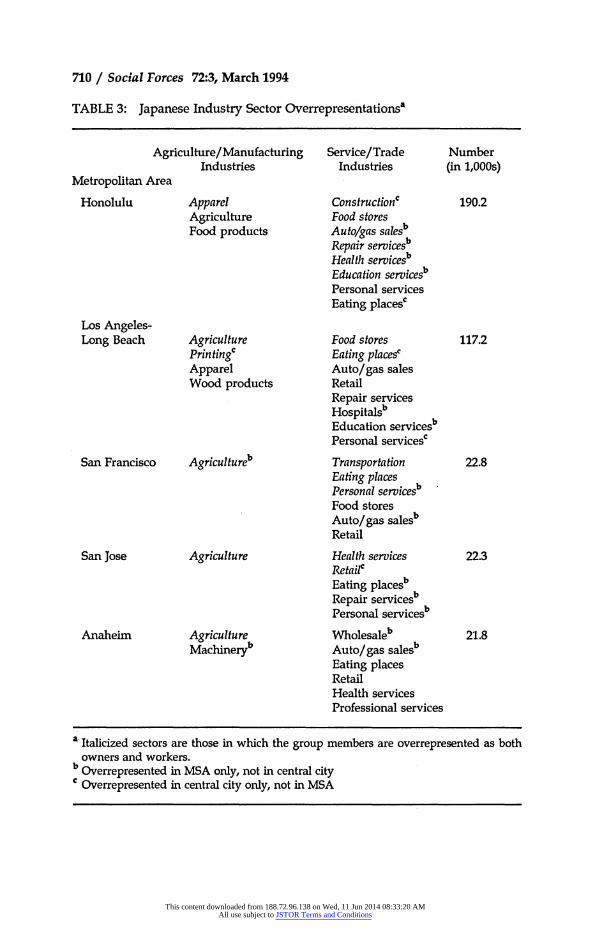
If whites and blacks represent the expected opposite situations, what is the situation of the "newer" minority groups? We find that the Japanese (see Table 3) are particularly telling because of the image of this group as a "model minority" and also because the average household incomes of whites and Japanese in metropolitan areas are approximately equal (Alba & Logan 1991). Honolulu, which is their largest area of concentration (190,200 residents in 1980), includes overrepresentations of both owners and workers in apparel manufac- turing, construction, food stores, auto/gas sales, repair services, health services, and education services. These are supplemented (with Japanese as owners only) by agriculture, food products, personal services, and eating places. No other region has so strong a Japanese economic presence. In Los Angeles, with 117,200 Japanese, there are four sectors for both owners and workers: agriculture, printing, food stores, and eating places. Agriculture, as Jiobu (1988) points out, is an export sector like manufacturing, and its appearance here suggests that the
This content downloaded from 188.72.96.138 on Wed, 11 Jun 2014 08:33:20 AMAll use subject to JSTOR Terms and Conditions
708 / Social Forces 72:3, March 1994
TABLE 2: Non-Hispanic Black Industry Sector Overrepresentationsa
Agriculture/Manufacturing Service/Trade Number Industries Industries (in 1,OOOs)
Metropolitan Area
New York Private households 1,813.8
Chicago Personal services 1,414.8 Hospitalsb
Social servicesC
Los Angeles- Long Beach TruckingC 925.8
Personal servicesC
Detroit Personal servicesC 883.4 Transportation Utilitiesb EntertainmentC
Philadelphia Chemicalsb Merchandise storesC 875.4 Personal services Social servicesC Schoolsb
Washington Truckingc 846.4 Transportation Food storesC Auto/gas salesc Repair servicesC Utilities Personal servicesC
a Italicized sectors are those in which the group is overrepresented as both owners and workers
b Overrepresented in MSA only, not in central city c Overrepresented in central city only, not in MSA
traditional Japanese presence in produce farming has been retained or rebuilt. Several other sectors appear for owners only: apparel manufacturing, wood products, auto/gas sales, miscellaneous retail, repair services, hospitals, education services, and personal services. There are comparable patterns in San Francisco, Anaheim, and San Jose (all of which have approximately 20,000 Japanese residents). In all these cases, overrepresentations are found in some agricultural, trade, and service sectors. (In Honolulu and Los Angeles there are several additional trade and service sectors in which there are at least five Japanese owners.) In these respects, the Japanese are quite unlike blacks, though they are overrepresented as owners in far fewer sectors than whites. Evidently
This content downloaded from 188.72.96.138 on Wed, 11 Jun 2014 08:33:20 AMAll use subject to JSTOR Terms and Conditions
Ethnic Economies in Metro Regions / 709
(insofar as these data can determine) they have developed an enclave economy in Honolulu, and their situations in Los Angeles, San Francisco, San Jose, and Anaheim might also be considered enclaves.
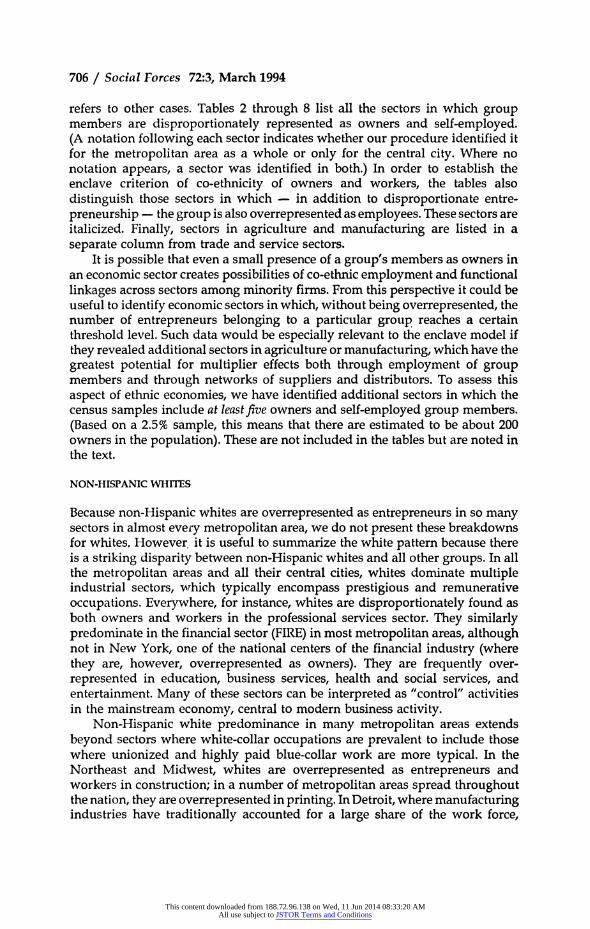
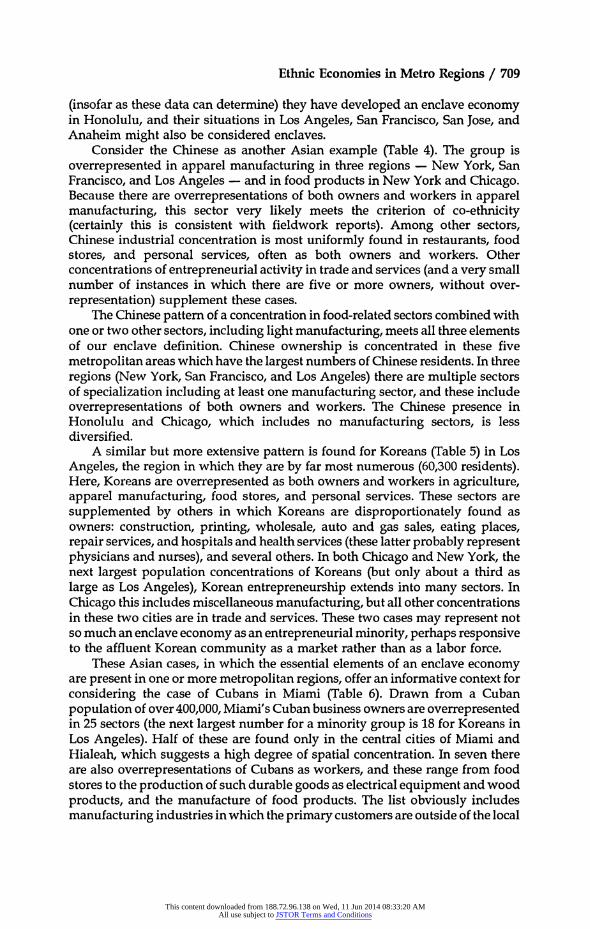
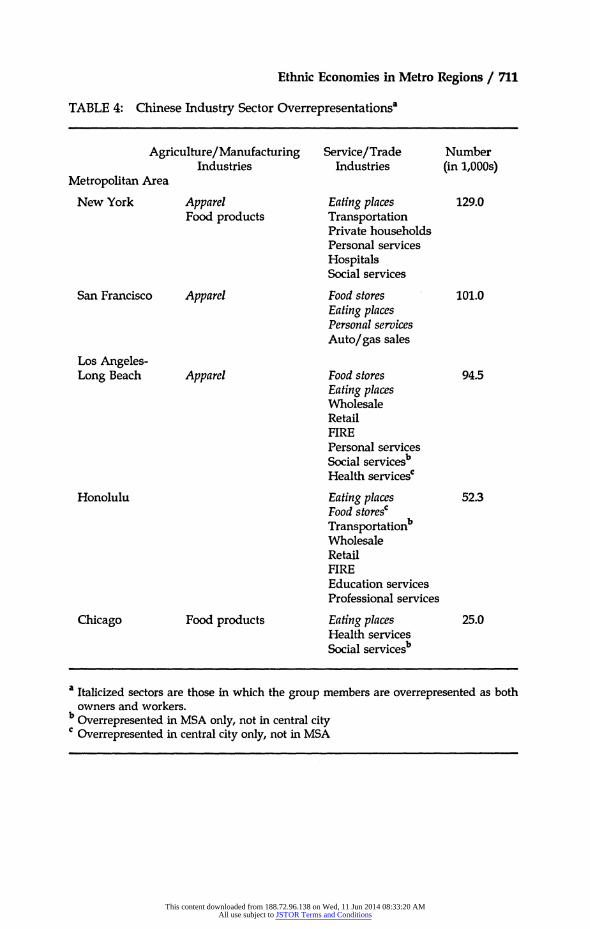
Consider the Chinese as another Asian example (Table 4). The group is overrepresented in apparel manufacturing in three regions - New York, San Francisco, and Los Angeles - and in food products in New York and Chicago. Because there are overrepresentations of both owners and workers in apparel manufacturing, this sector very likely meets the criterion of co-ethnicity (certainly this is consistent with fieldwork reports). Among other sectors, Chinese industrial concentration is most uniformly found in restaurants, food stores, and personal services, often as both owners and workers. Other concentrations of entrepreneurial activity in trade and services (and a very small number of instances in which there are five or more owners, without over- representation) supplement these cases.
The Chinese pattern of a concentration in food-related sectors combined with one or two other sectors, including light manufacturing, meets all three elements of our enclave definition. Chinese ownership is concentrated in these five metropolitan areas which have the largest numbers of Chinese residents. In three regions (New York, San Francisco, and Los Angeles) there are multiple sectors of specialization including at least one manufacturing sector, and these include overrepresentations of both owners and workers. The Chinese presence in Honolulu and Chicago, which includes no manufacturing sectors, is less diversified.
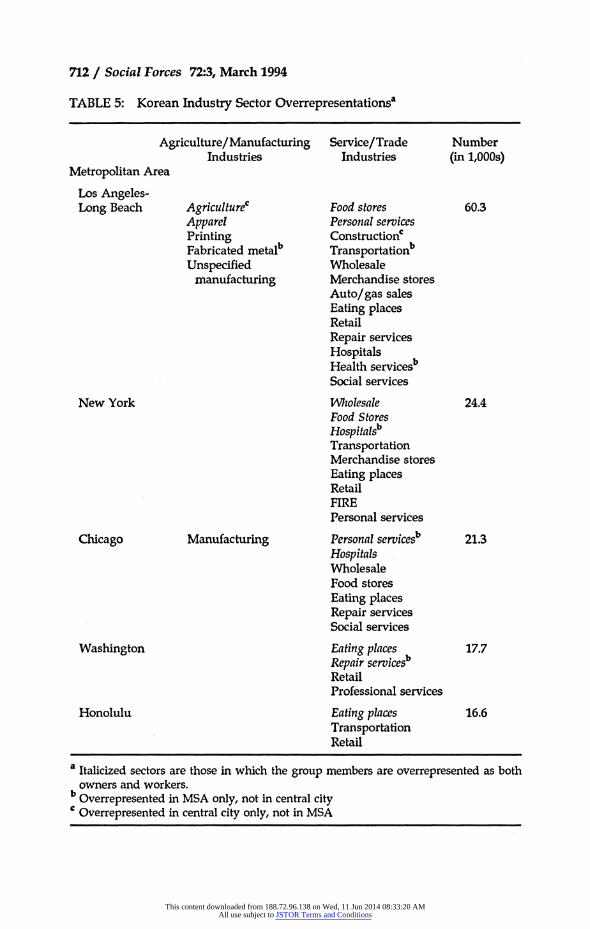
A similar but more extensive pattern is found for Koreans (Table 5) in Los Angeles, the region in which they are by far most numerous (60,300 residents). Here, Koreans are overrepresented as both owners and workers in agriculture, apparel manufacturing, food stores, and personal services. These sectors are supplemented by others in which Koreans are disproportionately found as owners: construction, printing, wholesale, auto and gas sales, eating places, repair services, and hospitals and health services (these latter probably represent physicians and nurses), and several others. In both Chicago and New York, the next largest population concentrations of Koreans (but only about a third as large as Los Angeles), Korean entrepreneurship extends into many sectors. In Chicago this includes miscellaneous manufacturing, but all other concentrations in these two cities are in trade and services. These two cases may represent not so much an enclave economy as an entrepreneurial minority, perhaps responsive to the affluent Korean community as a market rather than as a labor force.
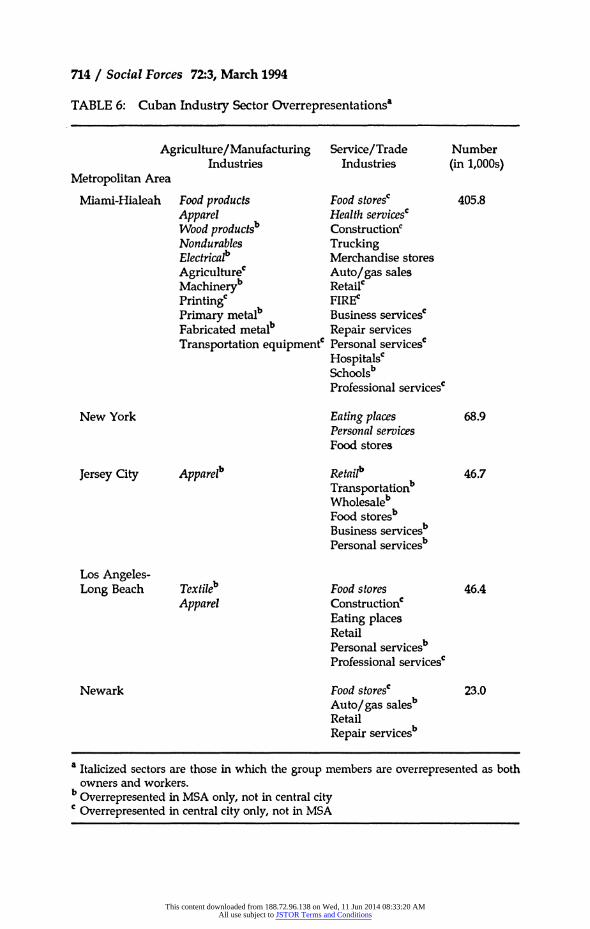
These Asian cases, in which the essential elements of an enclave economy are present in one or more metropolitan regions, offer an informative context for considering the case of Cubans in Miami (Table 6). Drawn from a Cuban population of over 400,000, Miami's Cuban business owners are overrepresented in 25 sectors (the next largest number for a minority group is 18 for Koreans in Los Angeles). Half of these are found only in the central cities of Miami and Hialeah, which suggests a high degree of spatial concentration. In seven there are also overrepresentations of Cubans as workers, and these range from food stores to the production of such durable goods as electrical equipment and wood products, and the manufacture of food products. The list obviously includes manufacturing industries in which the primary customers are outside of the local
This content downloaded from 188.72.96.138 on Wed, 11 Jun 2014 08:33:20 AMAll use subject to JSTOR Terms and Conditions
710 / Social Forces 72:3, March 1994
TABLE 3: Japanese Industry Sector Overrepresentationsa
Agriculture/Manufacturing Service/Trade Number Industries Industries (in 1,OOOs)
Metropolitan Area
Honolulu Apparel ConstructionC 190.2 Agriculture Food stores Food products Auto/gas salesb
Repair servicesb Health servicesb Education servicesb Personal services Eating placesC
Los Angeles- Long Beach Agriculture Food stores 117.2
Printingc Eating placesc Apparel Auto/gas sales Wood products Retail
Repair services Hospitalsb Education servicesb Personal servicesC
San Francisco Agricultureb Transportation 22.8 Eating places b Personal services Food stores Auto/gas salesb Retail
San Jose Agriculture Health services 22.3 Retailc Eating placesb Repair servicesb Personal servicesb
Anaheim Agriculture Wholesaleb 21.8 Machineryb Auto/gas salesb
Eating places Retail Health services Professional services
a Italicized sectors are those in which the group members are overrepresented as both owners and workers.
b Overrepresented in MSA only, not in central city c Overrepresented in central city only, not in MSA
This content downloaded from 188.72.96.138 on Wed, 11 Jun 2014 08:33:20 AMAll use subject to JSTOR Terms and Conditions
Ethnic Economies in Metro Regions / 711
TABLE 4: Chinese Industry Sector Overrepresentations"
Agriculture/Manufacturing Service/Trade Number Industries Industries (in 1,000s)
Metropolitan Area
New York Apparel Eating places 129.0 Food products Transportation
Private households Personal services Hospitals Social services
San Francisco Apparel Food stores 101.0 Eating places Personal services Auto/gas sales
Los Angeles- Long Beach Apparel Food stores 94.5
Eating places Wholesale Retail FIRE Personal services Social servicesb Health servicesC
Honolulu Eating places 52.3 Food storesC Transportationb Wholesale Retail FIRE Education services Professional services
Chicago Food products Eating places 25.0 Health services Social servicesb
a Italicized sectors are those in which the group members are overrepresented as both owners and workers.
b Overrepresented in MSA only, not in central city c Overrepresented in central city only, not in MSA
This content downloaded from 188.72.96.138 on Wed, 11 Jun 2014 08:33:20 AMAll use subject to JSTOR Terms and Conditions
712 / Social Forces 72:3, March 1994
TABLE 5: Korean Industry Sector Overrepresentationsa
Agriculture/Manufacturing Service/Trade Number Industries Industries (in 1,000s)
Metropolitan Area
Los Angeles- Long Beach AgricultureC Food stores 60.3
Apparel Personal services Printing Constructionb Fabricated metal' Transportationb Unspecified Wholesale
manufacturing Merchandise stores Auto/gas sales Eating places Retail Repair services Hospitals Health servicesb Social services
New York Wholesale 24.4 Food Stores Hospitalsb Transportation Merchandise stores Eating places Retail FIRE Personal services
Chicago Manufacturing Personal servicesb 21.3 Hospitals Wholesale Food stores Eating places Repair services Social services
Washington Eating places 17.7 Repair servicesb Retail Professional services
Honolulu Eating places 16.6 Transportation Retail
a Italicized sectors are those in which the group members are overrepresented as both owners and workers.
b Overrepresented in MSA only, not in central city c Overrepresented in central city only, not in MSA
This content downloaded from 188.72.96.138 on Wed, 11 Jun 2014 08:33:20 AMAll use subject to JSTOR Terms and Conditions
Ethnic Economies in Metro Regions / 713
community. Also included are industries, such as food stores and health services, which mainly serve the Miami Cuban community. There is also an extensive list of sectors in which Cubans appear as owners only: agriculture, construction, printing, fabricated metal, machinery, transportation equipment, trucking, merchandise stores, auto/gas sales, miscellaneous retail, business services, FIRE, repair services, personal services, hospitals, and professional services. This combination is actually more similar to the pattern for non-Hispanic whites in the typical metropolitan area than it is to the typical minority pattern.
Yet the Cubans outside of Miami are not unlike other minorities. Their next largest concentrations are New York (68,900), Jersey City (46,700), and Los Angeles (46,400). New York's Cuban businesses are concentrated only in personal services, food stores, and eating places (in one other sector, legal services, there are more than five Cuban owners or self-employed). In Jersey City and Los Angeles there are Cuban concentrations in both manufacturing industries (textiles, apparel) and trade and services. These two regions are similar to the pattern of the Chinese discussed above, but not nearly as extensive as in Miami.
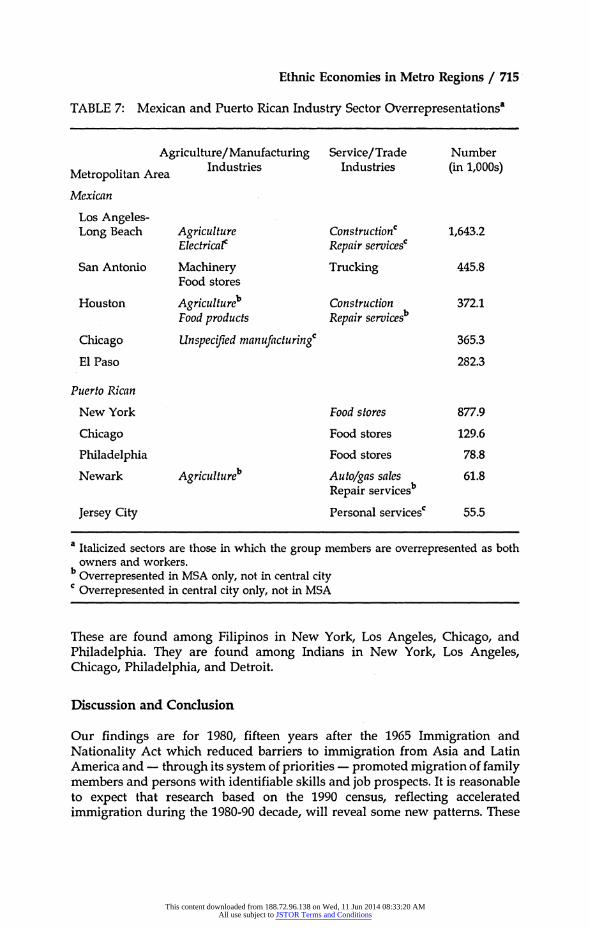
Cubans in these two places are also similar to the Mexicans in Los Angeles and Houston (Table 7). Mexicans are present in very large numbers in many metropolitan areas (Los Angeles, 1,643,200; San Antonio, 445,800; Houston, 372,100; Chicago, 365,300; El Paso, 282,300 - see Table 7). Of these, Los Angeles, by far the largest in Mexican population, stands out. Its central cities have concentrations of Mexican business owners in construction, electrical manufac- turing, and repair services, and the metropolis as a whole has an overrepresen- tation of Mexican owners in agriculture. All of these concentrations of owners are complemented by concentrations of workers as well. Further, there are five or more Mexican owners in several other manufacturing industries (apparel, printing, wood products, and machinery manufacturing) and in most trade and service sectors.
Mexicans in Houston also have sectoral overrepresentations of both owners and workers in two productive industries (agriculture and food products manufacturing) and two other sectors (construction and repair services). A similar combination of agriculture and food products also appears for Mexicans in one region in which they are less numerous: San Francisco (71,500). But in other regions with large Mexican populations, such as San Antonio, Chicago, and El Paso, Mexican entrepreneurship is minimal.
OTHER MINORITIES
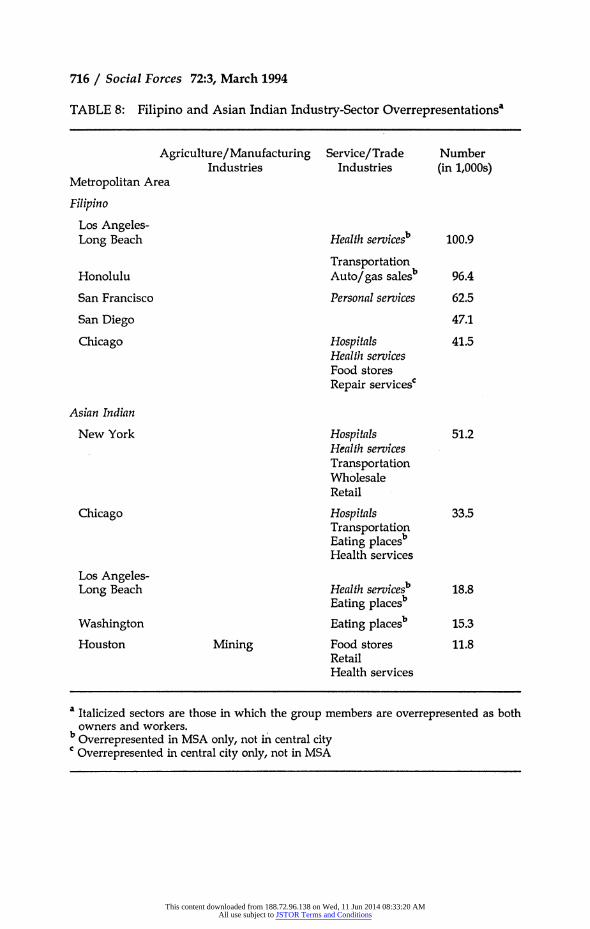
Among other minorities, business concentrations are rare. Food stores and restaurants are identified in several regions for Puerto Ricans, Filipinos, and Asian Indians (Tables 7 and 8). In New York, where the Puerto Rican population is nearly one million, there are several additional trade and service sectors with at least five owners, but only one manufacturing sector (apparel). There is one other noteworthy and more specialized area of concentration. Both the Filipino and Asian Indian groups (Table 8) include many health-care professionals -
doctors and, in the case of Filipinos, nurses. Accordingly, the sectors of concentration for these two groups are mostly in hospitals and health services.
This content downloaded from 188.72.96.138 on Wed, 11 Jun 2014 08:33:20 AMAll use subject to JSTOR Terms and Conditions
714 / Social Forces 72:3, March 1994
TABLE 6: Cuban Industry Sector Overrepresentationsa
Agriculture/Manufacturing Service/Trade Number Industries Industries (in 1,000s)
Metropolitan Area
Miami-Hialeah Food products Food storesc 405.8 Apparel Health servicesC Wood productsb Constructionr Nondurables Trucking Electricalb Merchandise stores Agriculturec Auto/gas sales Machineryb RetailC PrintingC FIREC Primary metalb Business servicesC Fabricated metalb Repair services Transportation equipmentC Personal servicesC
Hospitalsc Schoolsb Professional servicesC
New York Eating places 68.9 Personal services Food stores
Jersey City Apparelb Retailb 46.7 Transportation Wholesaleb Food storesb Business servicesb Personal services b
Los Angeles- Long Beach Textileb Food stores 46.4
Apparel Construction Eating places Retail Personal servicesb Professional servicesC
Newark Food storesc 23.0 Auto/gas salesb Retail Repair servicesb
a Italicized sectors are those in which the group members are overrepresented as both owners and workers.
b Overrepresented in MSA only, not in central city c Overrepresented in central city only, not in MSA
This content downloaded from 188.72.96.138 on Wed, 11 Jun 2014 08:33:20 AMAll use subject to JSTOR Terms and Conditions
Ethnic Economies in Metro Regions / 715
TABLE 7: Mexican and Puerto Rican Industry Sector OverrepresentationsA
Agriculture/Manufacturing Service/Trade Number
Metropolitan Area Industries Industries (in 1,000s)
Mexican
Los Angeles- Long Beach Agriculture ConstructionC 1,643.2
Electricalc Repair servicesC
San Antonio Machinery Trucking 445.8 Food stores
Houston Agricultureb Construction 372.1 Food products Repair servicesb
Chicago Unspecified manufacturingc 365.3
El Paso 282.3
Puerto Rican
New York Food stores 877.9
Chicago Food stores 129.6
Philadelphia Food stores 78.8
Newark Agricultureb Auto/gas sales 61.8 Repair servicesb
Jersey City Personal servicesC 55.5
a Italicized sectors are those in which the group members are overrepresented as both owners and workers.
b Overrepresented in MSA only, not in central city c Overrepresented in central city only, not in MSA
These are found among Filipinos in New York, Los Angeles, Chicago, and Philadelphia. They are found among Indians in New York, Los Angeles, Chicago, Philadelphia, and Detroit.
Discussion and Conclusion
Our findings are for 1980, fifteen years after the 1965 Immigration and Nationality Act which reduced barriers to immigration from Asia and Latin America and - through its system of priorities - promoted migration of family members and persons with identifiable skills and job prospects. It is reasonable to expect that research based on the 1990 census, reflecting accelerated immigration during the 1980-90 decade, will reveal some new patterns. These
This content downloaded from 188.72.96.138 on Wed, 11 Jun 2014 08:33:20 AMAll use subject to JSTOR Terms and Conditions
716 / Social Forces 72:3, March 1994
TABLE 8: Filipino and Asian Indian Industry-Sector Overrepresentationsa
Agriculture/Manufacturing Service/Trade Number Industries Industries (in 1,000s)
Metropolitan Area
Filipino
Los Angeles- Long Beach Health services' 100.9
Transportation Honolulu Auto/gas salesb 96.4
San Francisco Personal services 62.5
San Diego 47.1
Chicago Hospitals 41.5 Health services Food stores Repair services'
Asian Indian
New York Hospitals 51.2 Health services Transportation Wholesale Retail
Chicago Hospitals 33.5 Transportation Eating placesb Health services
Los Angeles- Long Beach Health servicesb 18.8
Eating placesb
Washington Eating placesb 15.3
Houston Mining Food stores 11.8 Retail Health services
a Italicized sectors are those in which the group members are overrepresented as both owners and workers.
b Overrepresented in MSA only, not in central city c Overrepresented in central city only, not in MSA
This content downloaded from 188.72.96.138 on Wed, 11 Jun 2014 08:33:20 AMAll use subject to JSTOR Terms and Conditions
Ethnic Economies in Metro Regions / 717
may include, on the one hand, expansion and differentiation of some ethnic economies and growth of new ones, or, on the other hand, trends toward assimilation of minorities into other parts of the economy, or some mix of these two. The present research is a baseline for such a study.
We have provided an overview of the pattern of economic incorporation of various racial and ethnic groups, including non-Hispanic whites and African Americans. Based on a multidimensional definition of the concept of enclave economy and within the constraints of available data, we have identified those cases which appear to meet this definition. Without information on the size of minority-owned firms, the ethnic composition of their labor force, or the use of ethnic ties within and between sectors, we cannot address many of the central issues regarding enclaves. But within these limits, defining an enclave economy in terms of co-ethnicity of owners and workers, spatial concentration in a metropolitan area or central city, sectoral specialization, and inclusion of both agriculture/manufacturing and trade/service sectors, we reach the conclusions summarized below.
ETHNIC ECONOMIES AND ENCLAVES
There are few ethnic economies that meet the minimal definition of an ethnic enclave in the U.S. in 1980. They are found in Miami (Cubans), Houston (Mexicans), New York (Chinese), Los Angeles (Chinese, Koreans, Japanese, Mexicans, and Cubans), San Francisco (Chinese and Japanese), San Jose (Japanese), Anaheim (apanese), Honolulu (apanese), and Jersey City (Cubans). Several of these fourteen cases have already been identified in the literature. The Cubans in Los Angeles and Jersey City, the Mexicans in Houston and Los Angeles, and especially the Japanese in Honolulu, Los Angeles, Anaheim, and San Jose are less well known and merit more attention.
In eight of the seventeen regions studied, ethnic economies do not resemble ethnic enclaves. These include Philadelphia, Detroit, Washington, San Diego, San Antonio, Chicago, Newark, and El Paso, despite the large numbers of members of some minority groups in each of these regions.
VARIATION OF ETHNIC ECONOMIES
There is variation in the breadth of these ethnic economies and in the number of sectors in which owner concentrations are matched by concentrations of workers (our indicator of co-ethnicity). Cubans in Miami fall at the high end of the spectrum, with multiple manufacturing sectors supplemented by many trade and service sectors where both owners and workers are concentrated. Most cases meeting our minimal enclave definition are based on a single productive sector (typically apparel manufacture or agriculture). Among these, however, one might distinguish between cases with many entrepreneurial sectors - the Japanese in Honolulu, Koreans in Los Angeles - and those with relatively sparse representation as owners (the Chinese cases, Cubans in Jersey City and Los Angeles, Mexicans in Houston and Los Angeles).
This content downloaded from 188.72.96.138 on Wed, 11 Jun 2014 08:33:20 AMAll use subject to JSTOR Terms and Conditions
718 / Social Forces 72:3, March 1994
ECONOMIC POSMON OF ETHNIC ECONOMIES
Ethnic economies of most minority communities do not compare favorably with the economic position established by non-Hispanic whites in every metropolitan area. Whites are routinely predominant in ownership of major manufacturing sectors and in both ownership and employment in the key professional and service sectors. Only Miami's Cubans approach such a pattern of dominance. Typically, minority entrepreneurship is concentrated in low-wage, poorly capitalized sectors.
NICHES
There are a few other cases in which a group has established a niche. These include Filipinos and Asian Indians in hospitals and health services in several metropolitan areas, and many groups in eating and drinking places. However, for most groups in most parts of the country, the sectors of overrepresentation are few in number and found in activities that require little investment, provide low returns for employees, and likely offer services to a limited, perhaps ethnic, market. Filipinos and Indians, as well as African Americans and Puerto Ricans, appear to have no enclaves at all.
These findings lead to questions that cannot be answered without further research. If the enclave is a relatively rare phenomenon, what accounts for the existence of this species for a few groups in a few places? We note that concentrations of minority business owners are most common in those metropolitan areas in which a group has the largest numbers. For Cubans, as one example, we identified a specially impressive enclave in Miami (with over 400,000 Cuban residents), more restricted enclaves in New York, Jersey City, and Los Angeles (with 68,900, 46,700, and 46,400 residents respectively), and no enclaves in other regions where Cubans are less numerous (like Newark with 23,000 or Chicago with 18,500). Clearly, however, population size is only part of the story; the absence of enclaves for blacks and Puerto Ricans - with around a million residents in several places - shows this.
We might also ask why some metropolitan areas have multiple enclaves (Los Angeles, where our criteria identify enclaves for five minority groups, is the leading example) while others have none. It is not simply a matter of being a destination for immigrants, as both San Diego and El Paso (with no enclaves) have received large numbers of Mexican immigrants over the years.
Some questions about the enclaves identified here require very different kinds of information than is available to us. To what extent does statistical overrepresentation of both owners and workers indicate that many group members are employed by other group members in the sector? What are the linkages between minority-controlled firms within a single sector, or between sectors? What is the significance of sectors in which a group is overrepresented only as owners: are these typically small or one-person firms, are they tied to minority firms in other sectors? Are there sectors not identified by the methods used here but which nevertheless are important components of the enclave economy?
Our contribution to these questions is in part to define more clearly the universe on which researchers might focus future work. There is a relatively
This content downloaded from 188.72.96.138 on Wed, 11 Jun 2014 08:33:20 AMAll use subject to JSTOR Terms and Conditions
Ethnic Economies in Metro Regions / 719
small number of cases - specific groups in certain metropolitan areas and certain economic sectors - in which fieldwork may be most fertile.
Another contribution, in our view, is to point to the apparent rarity of enclaves and their narrow breadth in most cases. The comparison of enclaves to the situation of the white majority in most metropolitan areas may not be a fair frame of reference. But evidently the diversification found in Miami's Cuban community is not the norm for enclave economies. Rather, if we were to describe the "ideal type" of enclave we would point to the more common instances. The usual form of an enclave, we would propose, is based on low-wage production in a single productive sector with low levels of capitalization (and possibly high levels of female employment), in conjunction with ethnically stereotyped restaurants or food stores and some services oriented to group members. Minorities of all kinds, whether black, Hispanic, or Asian, are most commonly not strongly represented as owners in any but the least attractive zones of the metropolitan economy. This finding is consistent with the characterization of persons engaged in ethnic businesses (including both owners and workers) as "cheap labor" (Light & Bonacich 1991), taking over positions previously held by whites in the "degraded" sectors of urban economies (see Sassen 1988; Waldinger 1986-87). This is not to say that such enclaves cannot perform the positive functions attributed to them by current theories; that is a separate research question. And we emphasize that our findings underline the diversity of enclaves rather than a uniform characterization.
Research on the effects of enclave economies - on income returns to human capital, for example, or on occupational mobility - may benefit from com- parisons among enclaves, between those that are "more like" or "less like" the Miami case. Special attention should also be given to non-Hispanic whites: Is there a racial/ethnic character to sectors in which whites are overrepresented? Are linkages among firms correlated with race and ethnicity? Are there benefits to whites from location in "white" sectors?
How shall we interpret the findings for groups that appear not to have an enclave experience? Our results offer an interesting comparison between the situation of blacks, whose poorest members are understood to constitute the core of the urban underclass, and that of other minorities. Differences between blacks and others may be more apparent in the sectoral distribution of workers, quite aside from the issue of business ownership. We found that in the regions in which blacks are most numerous -places like New York, Chicago, Detroit, and Los Angeles - their business community is concentrated only in such sectors as private household and personal services. This is not obviously different from some other groups: it is like Puerto Ricans in New York (only in food stores), Mexicans in San Antonio and El Paso (no sectors), or Filipinos in Los Angeles (only in health services). And we note that some other groups, which constitute specialized and diversified ethnic economies in places where they are most densely concentrated, may be similar to blacks in places where they are less numerous: for example, Cubans in New York and Newark. Thus, despite the emphasis in some current writings on the weakness of black enterprise in contrast to the entrepreneurial spirit of new immigrants, we conclude that there may be some similarities among the experiences of minority groups that should also be taken into account.
This content downloaded from 188.72.96.138 on Wed, 11 Jun 2014 08:33:20 AMAll use subject to JSTOR Terms and Conditions
720 / Social Forces 72:3, March 1994
Notes
1. We also examined the Vietnamese, whose largest concentration in 1980 was in Los Angeles- Long Beach (27,300 people). In this region, the Vietnamese were overrepresented in wholesale trade as both owners and employees; they were also overrepresented as self-employed in repair services and personal services. Elsewhere, no overrepresented sectors were found. Because the Vietnamese were so small and recent an immigrant group in 1980, we do not include them in the following analyses.
2. Note that we do not compare a group's owners in a given sector to its representation among owners in other sectors, for if we did, we would tend not to identify owner concentrations for groups that have high levels of entrepreneurship in general. Since our analysis is based on a 2.5% sample, implying small numbers of group members and especially of entrepreneurs in some areas, there are instances in which this criterion is met with only one or two sampled group members in the category. We have discarded these cases in the following tables, because they are so evidently subject to sampling variation.
Another issue with respect to ownership is the size of firms. In principle, a single very large minority-owned firm may be equivalent to many small ones. We believe the error introduced by omission of firm sizes is substantial only for white ownership, understating the importance of white-owned firms. In general, however, "entrepreneurs" identified in the PUMS are self-employed persons with no paid employees, unpaid family workers, or owners of firms with less than five employees. This is particularly true of minority entrepreneurs.
3. Twelve of our metropolitan areas (and their central cities) are part of larger metropolitan areas, i.e., CMSAs. Three of these are located in the New York-Northern New Jersey-Long Island CMSA (New York-New York, and Newark and Jersey City, New Jersey); two are situated within the Los Angeles-Anaheim-Riverside CMSA (Anaheim-Santa Ana and Los Angeles-Long Beach); and two within the San Francisco-Oakland-San Jose CMSA (San Francisco and San Jose). The remaining CMSAs from which our place of work samples were drawn include Chicago- Gary Lake County; Philadelphia-Wilmington-Trenton; Detroit-Ann Arbor; Houston-Galveston- Brazoria; and Miami-Fort Lauderdale. In each case, our samples consist of those persons who reside within the larger CMSA and work within the PMSA (or its central cities) selected for analysis. In our other areas (Washington, San Diego, San Antonio, Honolulu, and El Paso), our samples consist of those persons who either reside and work within the MSA, or reside in the MSA and work in its central city.
We do not distinguish between central cities in metropolitan areas with more than one central city (i.e., Los Angeles-Long Beach, Anaheim-Santa Ana, Miami-Hialeah). Detroit City as a place of work cannot be identified in PUMS data. Wayne County, which includes Detroit City, is used as a proxy. El Paso City cannot be uniquely identified in PUMS data.
References
Alba, Richard, and John R. Logan. 1991. "Variations on Two Themes: Racial and Ethnic Patterns in the Attainment of Suburban Residence." Demographiy 28:431-53.
Bailey, Thomas, and Roger Waldinger. 1991. "Primary, Secondary, and Enclave Labor Markets: A Training Systems Approach." American Sociological Review 56:43245.
Blauner, Robert. 1972. Racial Oppression in America. Harper & Row.
Bonacich, Edna. 1973. "A Theory of Middleman Minorities." American Sociological Revieuw 38:583- 94.
Bonacich, Edna, and John Modell. 1980. Thte Economic Basis of Ethinic Solidarity. University of California Press.
Jiobu, Robert M. 1988. "Ethnic Hegemony and the Japanese of California." American Sociological Review 53:353-67.
Light, Ivan. 1972. Ethnic Enterprise in America: Business and Welfare among Ciinese, Japanese, and Blacks. University of California Press.
This content downloaded from 188.72.96.138 on Wed, 11 Jun 2014 08:33:20 AMAll use subject to JSTOR Terms and Conditions
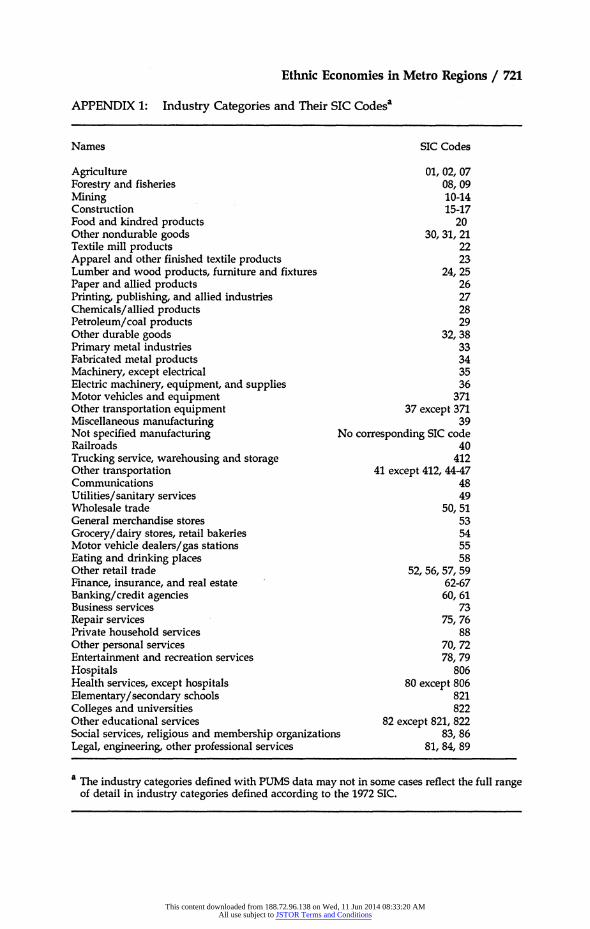
Ethnic Economies in Metro Regions / 721
APPENDIX 1: Industry Categories and Their SIC Codesa
Names SIC Codes
Agriculture 01, 02, 07 Forestry and fisheries 08, 09 Mining 10-14 Construction 15-17 Food and kindred products 20 Other nondurable goods 30, 31, 21 Textile mill products 22 Apparel and other finished textile products 23 Lumber and wood products, furniture and fixtures 24, 25 Paper and allied products 26 Printing, publishing, and allied industries 27 Chemicals/allied products 28 Petroleum/coal products 29 Other durable goods 32, 38 Primary metal industries 33 Fabricated metal products 34 Machinery, except electrical 35 Electric machinery, equipment, and supplies 36 Motor vehicles and equipment 371 Other transportation equipment 37 except 371 Miscellaneous manufacturing 39 Not specified manufacturing No corresponding SIC code Railroads 40 Trucking service, warehousing and storage 412 Other transportation 41 except 412, 44-47 Communications 48 Utilities/sanitary services 49 Wholesale trade 50, 51 General merchandise stores 53 Grocery/dairy stores, retail bakeries 54 Motor vehicle dealers/gas stations 55 Eating and drinking places 58 Other retail trade 52, 56, 57, 59 Finance, insurance, and real estate 62-67 Banking/credit agencies 60, 61 Business services 73 Repair services 75, 76 Private household services 88 Other personal services 70, 72 Entertainment and recreation services 78, 79 Hospitals 806 Health services, except hospitals 80 except 806 Elementary/secondary schools 821 Colleges and universities 822 Other educational services 82 except 821, 822 Social services, religious and membership organizations 83, 86 Legal, engineering, other professional services 81, 84, 89
a The industry categories defined with PUMS data may not in some cases reflect the full range of detail in industry categories defined according to the 1972 SIC.
This content downloaded from 188.72.96.138 on Wed, 11 Jun 2014 08:33:20 AMAll use subject to JSTOR Terms and Conditions
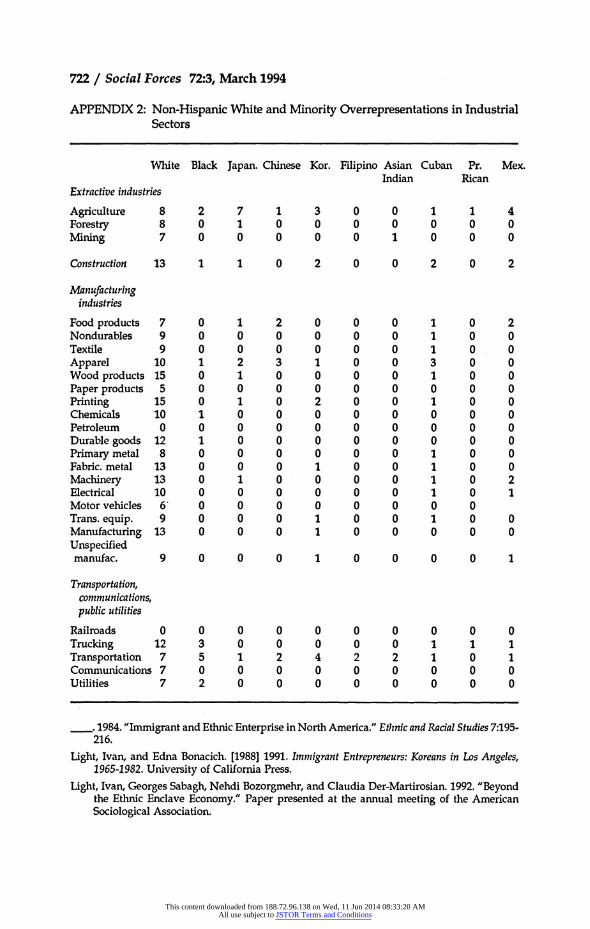
722 / Social Forces 72:3, March 1994
APPENDIX 2: Non-Hispanic White and Minority Overrepresentations in Industrial Sectors
White Black Japan. Chinese Kor. Filipino Asian Cuban Pr. Mex. Indian Rican
Extractive industries
Agriculture 8 2 7 1 3 0 0 1 1 4 Forestry 8 0 1 0 0 0 0 0 0 0 Mining 7 0 0 0 0 0 1 0 0 0
Construction 13 1 1 0 2 0 0 2 0 2
Manufacturing industries
Food products 7 0 1 2 0 0 0 1 0 2 Nondurables 9 0 0 0 0 0 0 1 0 0 Textile 9 0 0 0 0 0 0 1 0 0 Apparel 10 1 2 3 1 0 0 3 0 0 Wood products 15 0 1 0 0 0 0 1 0 0 Paper products 5 0 0 0 0 0 0 0 0 0 Printing 15 0 1 0 2 0 0 1 0 0 Chemicals 10 1 0 0 0 0 0 0 0 0 Petroleum 0 0 0 0 0 0 0 0 0 0 Durable goods 12 1 0 0 0 0 0 0 0 0 Primarymetal 8 0 0 0 0 0 0 1 0 0 Fabric. metal 13 0 0 0 1 0 0 1 0 0 Machinery 13 0 1 0 0 0 0 1 0 2 Electrical 10 0 0 0 0 0 0 1 0 1 Motor vehicles 6 0 0 0 0 0 0 0 0 Trans. equip. 9 0 0 0 1 0 0 1 0 0 Manufacturing 13 0 0 0 1 0 0 0 0 0 Unspecified manufac. 9 0 0 0 1 0 0 0 0 1
Transportation, communications, public utilities
Railroads 0 0 0 0 0 0 0 0 0 0 Trucking 12 3 0 0 0 0 0 1 1 1 Transportation 7 5 1 2 4 2 2 1 0 1 Communications 7 0 0 0 0 0 0 0 0 0 Utilities 7 2 0 0 0 0 0 0 0 0
__. 1984. "Immigrant and Ethnic Enterprise in North America." Ethlnic and Racial Studies 7:195- 216.
Light, Ivan, and Edna Bonacich. [1988] 1991. Immigrant Entrepreneurs: Koreans in Los Angeles, 1965-1982. University of California Press.
Light, Ivan, Georges Sabagh, Nehdi Bozorgmehr, and Claudia Der-Martirosian. 1992. "Beyond the Ethnic Enclave Economy." Paper presented at the annual meeting of the American Sociological Association.
This content downloaded from 188.72.96.138 on Wed, 11 Jun 2014 08:33:20 AMAll use subject to JSTOR Terms and Conditions
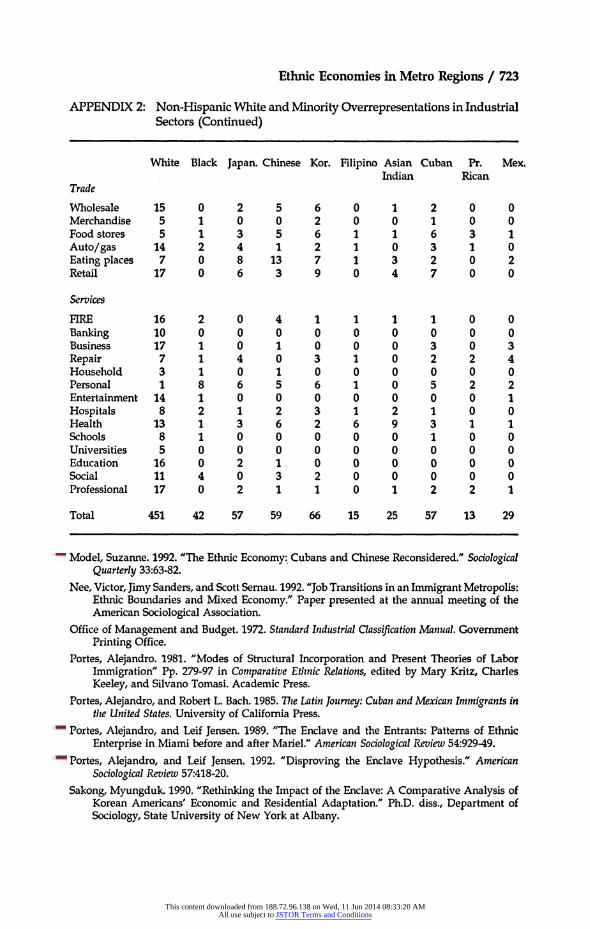
Ethnic Economies in Metro Regions / 723
APPENDIX 2: Non-Hispanic White and Minority Overrepresentations in Industrial Sectors (Continued)
White Black Japan. Chinese Kor. Filipino Asian Cuban Pr. Mex. Indian Rican
Trade
Wholesale 15 0 2 5 6 0 1 2 0 0 Merchandise 5 1 0 0 2 0 0 1 0 0 Food stores 5 1 3 5 6 1 1 6 3 1 Auto/gas 14 2 4 1 2 1 0 3 1 0 Eating places 7 0 8 13 7 1 3 2 0 2 Retail 17 0 6 3 9 0 4 7 0 0
Services
FIRE 16 2 0 4 1 1 1 1 0 0 Banking 10 0 0 0 0 0 0 0 0 0 Business 17 1 0 1 0 0 0 3 0 3 Repair 7 1 4 0 3 1 0 2 2 4 Household 3 1 0 1 0 0 0 0 0 0 Personal 1 8 6 5 6 1 0 5 2 2 Entertainment 14 1 0 0 0 0 0 0 0 1 Hospitals 8 2 1 2 3 1 2 1 0 0 Health 13 1 3 6 2 6 9 3 1 1 Schools 8 1 0 0 0 0 0 1 0 0 Universities 5 0 0 0 0 0 0 0 0 0 Education 16 0 2 1. 0 0 0 0 0 0 Social 11 4 0 3 2 0 0 0 0 0 Professional 17 0 2 1 1 0 1 2 2 1
Total 451 42 57 59 66 15 25 57 13 29
Model, Suzanne. 1992. "The Ethnic Economy: Cubans and Chinese Reconsidered." Sociological Quarterly 33:63-82.
Nee, Victor, Jimy Sanders, and Scott Sernau. 1992. "Job Transitions in an Immigrant Metropolis: Ethnic Boundaries and Mixed Economy." Paper presented at the annual meeting of the American Sociological Association.
Office of Management and Budget. 1972. Standard Industrial Classification Manual. Govemment Printing Office.
Portes, Alejandro. 1981. "Modes of Structural Incorporation and Present Theories of Labor Immigration" Pp. 279-97 in Comparative Ethlnic Relations, edited by Mary Kritz, Charles Keeley, and Silvano Tomasi. Academic Press.
Portes, Alejandro, and Robert L. Bach. 1985. T7he Latin Journey: Cuban and Mexican Immigrants in the United States. University of California Press.
Portes, Alejandro, and Leif Jensen. 1989. "The Enclave and the Entrants: Patterns of Ethnic Enterprise in Miami before and after Mariel." American Sociological Review 54:92949.
Portes, Alejandro, and Leif Jensen. 1992. "Disproving the Enclave Hypothesis." American Sociological Review 57:418-20.
Sakong, Myungduk. 1990. "Rethinking the Impact of the Enclave: A Comparative Analysis of Korean Americans' Economic and Residential Adaptation." Ph.D. diss., Department of Sociology, State University of New York at Albany.
This content downloaded from 188.72.96.138 on Wed, 11 Jun 2014 08:33:20 AMAll use subject to JSTOR Terms and Conditions
724 / Social Forces 72:3, March 1994
Sanders, Jimy, and Victor Nee. 1987. 'Limits of Ethnic Solidarity in the Eniclave Economy." American Sociological Review 52:745-67.
Sassen, Saskia. 1988. The Mobility of Capital and Labour. Cambridge University Press. U.S. Department of Commerce. 1980. The Current Population Survey, May 1980 MRDF.]
Washington D.C.: US. Bureau of the Census [Producer and Distributor]. US. Department of Commerce. 1983. Census of Population and Housing, 1980: Public-Use Microdata
Sample (A), [MRDF.] Washington D.C.: U.S. Bureau of the Census [Producer and Distributor].
U.S. Department of Commerce. 1984a. 1980 Census of Population, Detailed Population Caarac- teristics, U.S. Summary Section A. Government Printing Office.
U.S. Department of Commerce. 1984b. 1982 Census of Retail Trade, Geographlic Area Series, United States (RC82-A-52). Government Printing Office.
US. Department of Commerce. 1984c. 1982 Census of Retail Trade, Industry Series, United States (RC82-I-1). Government Printing Office.
US. Department of Commerce. 1984d. 1982 Census of Service Industries, Geographlic Area Series, United States (SC82-A-52). Government Printing Office.
U.S. Department of Commerce. 1985. 1982 Census of Service Industries, Industry Series, United States (SC82-I-1). Government Printing Office.
U.S. Department of Commerce. 1986. The National Income and Product Accouints of the United States, 1929-1982, Statistical Tables, United States. Govermment Printing Office.
Waldinger, Roger. 1986-87. "Changing Ladders and Musical Chairs: Ethnicity and Opportunity in Post-industrial New York." Politics and Society 15:369401.
Wilson, William J. 1978. 7The Declining Significance of Race: Blacks and Catnging American Institutions. University of Chicago Press.
Wilson, Kenneth, and W. Allen Martin. 1982. "Ethnic Enclaves: A Comparison of the Cuban and Black Economies in Miami." American Journal of Sociology 88:135-60.
Wilson, Kenneth, and Alejandro Portes. 1980. 'Immigrant Enclaves: An Analysis of the Labor Market Experiences of Cubans in Miami." American Journal of Sociology 86:295-319.
Zhou, Mn, and John R. Logan. 1989. "Returns on Human Capital in Ethnic Enclaves: New York City's Chinatown." American Sociological Review 54:809-20.
This content downloaded from 188.72.96.138 on Wed, 11 Jun 2014 08:33:20 AMAll use subject to JSTOR Terms and Conditions