ethnic change in the populations of the developed world. european population conference, barcelona...
TRANSCRIPT

Ethnic change in the populations of the
developed world. European Population Conference, Barcelona
Thursday 10 July 2.30
D.A. Coleman and Sylvie Dubuc with the assistance of M.D. Smith.
Department of Social Policy and Social Work, University of Oxford
http://www.spsw.ox.ac.uk/oxpop

Projecting ‘foreign – origin’ populations: aims, concepts and problems
• Major concerns of projection: decline and ageing, more recently human capital.
• Differential fertility and migration now also transforming population composition.
• Beginnings of a new demographic transition? First demographic transition out of phase in different populations
• Implications for change in identity, culture, religion and politics, provision of services.
• Problems of definition, data and projection.

Should projections assume rapid absorption of immigrant populations, or persistence of demographic and other distinctiveness?
• ‘foreign origin or background’ – projections assume that ‘third generation’ becomes statistically invisible.
• ‘Ethnic’ and ‘racial’ definitions imply potential permanence.
• But mixed origin populations may eventually predominate.

Netherlands 2005 – 2050. Percent of population of foreign origin with and without migration, to show
effect of ‘two-generation’ rule.Netherlands 2005- 2050. Percent of population of foreign orgin ('Western'
and 'non-Western') with and without migration. Source: CBS.
10
15
20
25
30
35
2005 2010 2015 2020 2025 2030 2035 2040 2045 2050
percent foreign-origin with zeromigration, 2003-based
percent foreign-origin 2004-based

Projections of population by origin: a summary of sources.
Projections of foreign-origin populationsend criteria sourceyear
Austria 2050 citizenship only Lebhart and Munz 2003Denmark 2050 'foreign origin' official statisticsGermany 2050 'foreign origin' Ulrich 2001Netherlands 2050 'foreign origin' official statisticsNew Zealand 2021 ethnic origin official statisticsNorway 2060 'foreign origin' official statisticsSweden 2050 'foreign origin' official statisticsSwitzerland 2050 citizenship only official statisticsUSA 2100 race and Hispanic origin official statistics
Australia 2009 aboriginal populations only official statisticsCanada 2017 aboriginal populations only official statisticsNote: 'foreign origin' or 'foreign background' usually taken to include foreign immigrants plus those with one or both parents foreign immigrant Projections of 'foreign origin' usually include 'citizenship' and immigrants.(i.e. two generations). Third generation assumed to be national. Fertility assumed to converge to close to, or same as, national average. Migration usually held constant. Mortality of all groups mostly assumed to follow national projected trend. Individual groups often clustered into 'Western background' and 'non-Western background' or similar classification.

Norway 2005 – 2050. Projection of population of foreign origin, in two major categories (Percent of total population).
Norway 2005-2050. projection of population of foreign origin (percent).
Source: Statistics Norway 2005
0
5
10
15
20
25
2005 2010 2015 2020 2025 2030 2035 2040 2045 2050
Western'
Non-Western'
All foreign origin

United States 1999 – 2100, projection by race and Hispanic origin.
US population 1999 - 2100 Middle Series, by ethnic group. Source; US Bureau of the Census 2000.
0
50
100
150
200
250
1999
2003
2007
2011
2015
2019
2023
2027
2031
2035
2039
2043
2047
2051
2055
2059
2063
2067
2071
2075
2079
2083
2087
2091
2095
2099
Hispanic
White non-Hispanic
Black non-Hispanic
American Indian NH
Asian and Pacific NH

Comparison of results of some European and US ‘foreign-origin’ projections.
Projected growth of population of immigrant or foreign origin 2000-2050,
selected countries, as percent of total population.
5
10
15
20
25
30
35
2000 2005 2010 2015 2020 2025 2030 2035 2040 2045 2050
per
cen
t
Germany medium variant
USA medium variant (excludes black population)
Netherlands base scenario
Denmark 2002- based medium variant
Sweden foreign background 2004 based
Austria 'Compensating' scenario, no naturalisation.

Problems in projecting UK ethnic minority populations
• Base population available from (1971), 1991 and 2001 censuses, Labour Force Survey etc.
• But no vital registration by ethnic origin • Ethnic categories unstable.• Different (indirect) methods of estimating fertility
give different answers.• No life tables available yet.• Migration data weak, no data by ethnic origin.

2.3
1.9
0.8
3.7
2.4
1.0
3.5
2.3
1.1
2.9
2.3
0.9
4.8
4.2
1.3
4.8
4.1
1.7
2.9
1.9
0.5
0
1
2
3
4
5
6
1929-1944 1945-1959 1960-1984
White
Caribbean
Black-African
Indian
Pakistani
Bangladeshi
Chinese
Source: General Household Survey, 1988-2000/01
Completed Family Size by year of Birth and Ethnic Origin: GHS women born 1929 – 1984.
N.B. latest cohort incomplete.

The ‘Own-Child’ Method of reconstructing birth-rates in past and current calendar years: Matching and allocation
process.

TFR, 1965-2001: Comparing UK LFS own-child estimates of TFR with TFR from ONS registration data (total population).
Total Fertility Rate, 1961-2001: from LFS 'Own-child' Estimates and ONS Birth Registration Data.
1.00
1.20
1.40
1.60
1.80
2.00
2.20
2.40
2.60
2.80
3.00
1961 1964 1967 1970 1973 1976 1979 1982 1985 1988 1991 1994 1997 2000
TF
R
LFS Estimate (UK)
Birth Registrations UK

TFR trends of UK ethnic minority populations 1965 – 2006data from Labour Force Survey by own-child method, 7-year moving averages.
NB estimates before 1980 based on small numbers.
TFR ethnic minorities, UK 1965 - 2006 from LFS by own-child method; seven-year moving averages
1.0
2.0
3.0
4.0
5.0
6.0
7.0
19
65
19
67
19
69
19
71
19
73
19
75
19
77
19
79
19
81
19
83
19
85
19
87
19
89
19
91
19
93
19
95
19
97
19
99
20
01
20
03
20
05
White
Black-Caribbean
Black-African
Indian
Pakistani
Bangladeshi
Chinese

UK Pakistani TFR trends 1987 – 2006 unsmoothed, with confidence intervals to show range of error
Pakistani TFR 1987 - 2006. unsmoothed, with 95% upper lower confidence bounds.
0.000
0.500
1.000
1.500
2.000
2.500
3.000
3.500
4.000
4.500
1987
1988
1989
1990
1991
1992
1993
1994
1995
1996
1997
1998
1999
2000
2001
2002
2003
2004
2005
2006
Pakistani TFR 1987-2006
upper bound of 95% confidence interval
lower bound of 95% confidence interval
mean no. of women per year 3368, mean no. of births per year 351

Transition of UK Indian total fertility,1965 – 2006, annual estimates and 7-year moving average.
Source: Labour Force Surveys, own-child method
UK Indian TFR 1965 - 2006 from Labour Force Survey (own-child method)annual data and 7-year moving average
1.2
1.4
1.6
1.8
2.0
2.2
2.4
2.6
2.8
3.0
3.2
3.4
3.6
3.8
4.0
1965
1967
1969
1971
1973
1975
1977
1979
1981
1983
1985
1987
1989
1991
1993
1995
1997
1999
2001
2003
2005
Indian TFR annual estimate
Indian TFR 7 - year moving average

Projection of fertility: UK Indian total fertility 1965 – 2006 and predicted to 2026 (asymptote 1.53)
UK Indian TFR 1965-2006 and predicted to 2026TFR data from own-child calculations
0.0
0.5
1.0
1.5
2.0
2.5
3.0
3.5
4.0
4.5
1965
1967
1969
1971
1973
1975
1977
1979
1981
1983
1985
1987
1989
1991
1993
1995
1997
1999
2001
2003
2005
2007
2009
2011
2013
2015
2017
2019
2021
2023
2025
Indian TFR
Predicted TFRmodel= a+b/(1+exp(k*(t-t0)))
r2 = 0.918Asymptotic predicted TFR = 1.53 Upper bound 95% CI = 1.838, Lower bound 95% CI = 1.192

UK Chinese TFR 1965 – 2006: asymptote 1.29
UK Chinese TFR 1965 - 2006, estimated and predicted values
0.0
0.5
1.0
1.5
2.0
2.5
3.0
3.5
4.0
4.5
1965
1967
1969
1971
1973
1975
1977
1979
1981
1983
1985
1987
1989
1991
1993
1995
1997
1999
2001
2003
2005
Chinese TFR
Predicted Chinese TFR
Model = a+b/(1+exp(k*(t-T0))). R2 = 0.822Asymptotic predicted TFR = 1.29Upper bound 95% confidence interval = 1.487Lower bound 95% confidence interval = 1.084

Convergence in fertility? some persistent differentials in US fertility. Source: US Bureau of the Census.
Total fertility trends by race and Hispanic origin, US 1960-2000. Source: US Bureau of the Census
1.5
2.0
2.5
3.0
3.5
4.0
4.5
1960
1962
1964
1966
1968
1970
1972
1974
1976
1978
1980
1982
1984
1986
1988
1990
1992
1994
1996
1998
2000
Black (mother)
Black (child)
American Indian
Asia/Pacific Islander
Hispanic
Non-Hispanic White
All races

TFR comparisons, UK ethnic groups, various sources
Comparison of TFR estimates for UK ethnic groupsUK UK London England 1 England 2
1996-2000 2001-2005 2002 2003 2004
TFR 95% CI TFR 95% CI TFR TFR TFR
All 1.72 0.015 1.70 0.019 1.64 1.73White 1.72 0.017 1.71 0.020 1.24 1.73 1.56Mixed 1.89 0.197 1.53 0.220 1.72 4.68 Mixed
1.88 0.125 1.94 0.200 1.83 1.55 1.35 Black
2.41 0.127 2.32 0.190 2.52 2.071.87 0.147 2.09 0.180 4.03 1.52
Indian 1.63 0.085 1.64 0.130 1.54 1.50 2.13 Asian
Pakistani 2.91 0.141 2.79 0.200 3.10 2.243.43 0.249 2.97 0.330 3.60 2.06
Chinese 1.23 0.168 1.24 0.220 1.08 1.39 0.93 Chinese
1.94 0.197 1.80 0.220 2.38 1.97Other 1.94 0.147 2.09 0.180 4.52 1.62All non-White 2.22 88388 2.12 16324Sources: England 1:Large and Ghosh, 2004 t 3, London: Klodawski 2004 t.10 p. 14England 2 Rees 2008 t 15.4, UK this paper
Other Asian
Black Caribbean
Black African
Black Other
Bangladeshi

Mortality• Mortality statistics: ASMRs difficult to compute:
small numbers, under-20s deficient. • Chinese probably have lowest death rates.• IMR mostly higher.• For initial projections, England and Wales life
tables used. projected to 2051 according to GAD assumptions.
• Large and Ghosh (2006), and Rees (2008) used differential SMRs derived from geographical areas.

Estimated life table for immigrants born in the West Indies, 2001 (qx)
England and Wales, immigrants born in the West Indies, qx 2001
0.0001
0.001
0.01
0.1
1
Und
er 1
1-4
5-9
10-1
4
15-1
9
20-2
4
25-2
9
30-3
4
35-3
9
40-4
4
45-4
9
50-5
4
55-5
9
60-6
4
65-6
9
70-7
4
75-7
9
80-8
4
85 p
lus
qx WI males UN 1 parameter
qx WI males actual data
WI female real IMR
qx WI males real IMR

Estimating migration by ethnic origin, and the diversity of future trends.
• UK migration data based on small sample, very broad categories only by citizenship, birthplace, country of origin. Ethnic origin inferred indirectly.
• Recent trends and policy suggested further increase except asylum; these and official projections assume current level (unlikely).
• Eastern European flow will fall with A8 growth; Labour migration will fall with recession; return migration to India; persistence of marriage migration; emigration drivers in Africa will continue.

UK population projections 2006-81, 2006-based, GAD Principal Projection and variant migration assumptions.
UK population projected to 2081, GAD Principal Projection, Natural Change and high and low migration variants (millions). Source: Government Actuary's Department 2007
50
55
60
65
70
75
80
85
90
95
2006 2011 2016 2021 2026 2031 2036 2041 2046 2051 2056 2061 2066 2071 2076 2081
Principal projection
Natural change
High migration: 250,000
Low migration: 130,000

Spouse migration to the UK 1973 - 2006 (thousands)
Spouse migration by sex , UK 1973-2006Source: Home Office acceptances for settlement.
0
5000
10000
15000
20000
25000
30000
35000
40000
1973
1975
1977
1979
1981
1983
1985
1987
1989
1991
1993
1995
1997
1999
2001
2003
2005
All husbands All wives

Labour migration by work permit, UK 1973- 2006
Work permits holders and dependants admitted, UK 1973-2006. Source: Home Office Control of Immigration Statistics
0
20000
40000
60000
80000
100000
120000
140000
160000
1973
1974
1975
1976
1977
1978
1979
1980
1981
1982
1983
1984
1985
1986
1987
1988
1989
1990
1991
1992
1993
1994
1995
1996
1997
1998
1999
2000
2001
2002
2003
2004
2005
2006
≥12 months <12 months dependants total

Some UK projections• Choices: to constrain or not to constrain? separate
components or interactive? Migration numbers or rates?
• Various other approaches: Large and Ghosh (2006); Rees (2008) and Bains (2006).
• Diversity in fertility and migration• Mortality assumed to be England and Wales
average• ‘Mixed’ populations begin to predominate.

Projection of UK populations 2001-2051, combined
into three major groups. Assumptions: near-convergent fertility, constant migration, mortality as in GAD 2004-based PP.
Percent of UK population in three major ethnic categories, 2001 - 2051, assuming net annual inflow of 50,000 white non-British population
0
10
20
30
40
50
60
70
80
90
100
2001 2006 2011 2016 2021 2026 2031 2036 2041 2046 2051
British, Scottish, Irish
non-white ethnic minority
white non-British
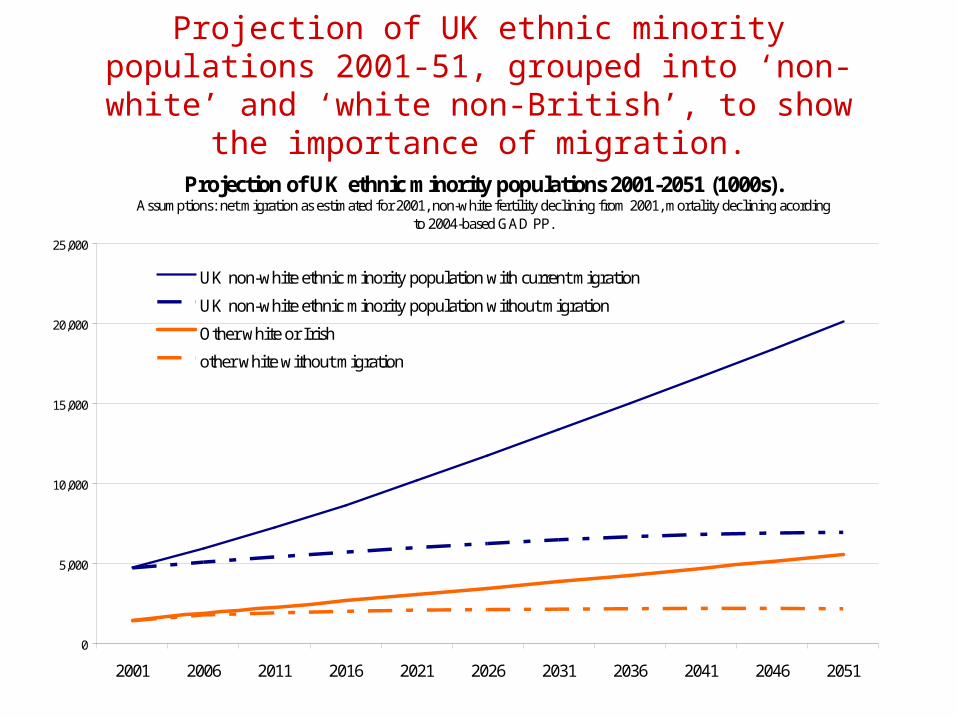
Projection of UK ethnic minority populations 2001-51, grouped into ‘non-white’ and ‘white non-British’, to show the
importance of migration.
Projection of UK ethnic minority populations 2001-2051 (1000s). Assumptions: net migration as estimated for 2001, non-white fertility declining from 2001, mortality declining acording
to 2004-based GAD PP.
0
5,000
10,000
15,000
20,000
25,000
2001 2006 2011 2016 2021 2026 2031 2036 2041 2046 2051
UK non-white ethnic minority population with current migration
UK non-white ethnic minority population without migration
Other white or Irish
other white without migration

UK population projection 2051 by age, sex and foreign /
British ancestry. Assumptions for total population as GAD Principal Projection 2006 (net migration 190K;
TFR 1.85)
UK population 2051 projection by age and origin (1000s).Assumptions for total population: migration, TFR as in GAD Principal Projection 2008.
3,000 2,500 2,000 1,500 1,000 500 0 500 1,000 1,500 2,000 2,500 3,000
0-4
5-9
10-14
15-19
20-24
25-29
30-34
35-39
40-44
45-49
50-54
55-59
60-64
65-69
70-74
75-79
80-84
85-89
90-94
95-99
100+
Males British origin Males foreign originFemales British origin Females foreign origin

Projection of UK Black populations and ‘Mixed’ (without intergenerational transfers) 2001-2051
(1000s).
Population projections, UK 2001-2051, Black groups and Mixed (1000s). Assumes falling fertility, net migration as 2001 and falling death rates according to GAD 2004-based PP. Not
constrained to national population total. Does not include mixed unions.
0
500
1,000
1,500
2,000
2,500
3,000
3,500
4,000
2001 2006 2011 2016 2021 2026 2031 2036 2041 2046 2051
Black African
Black Caribbean
Black Other
Mixed
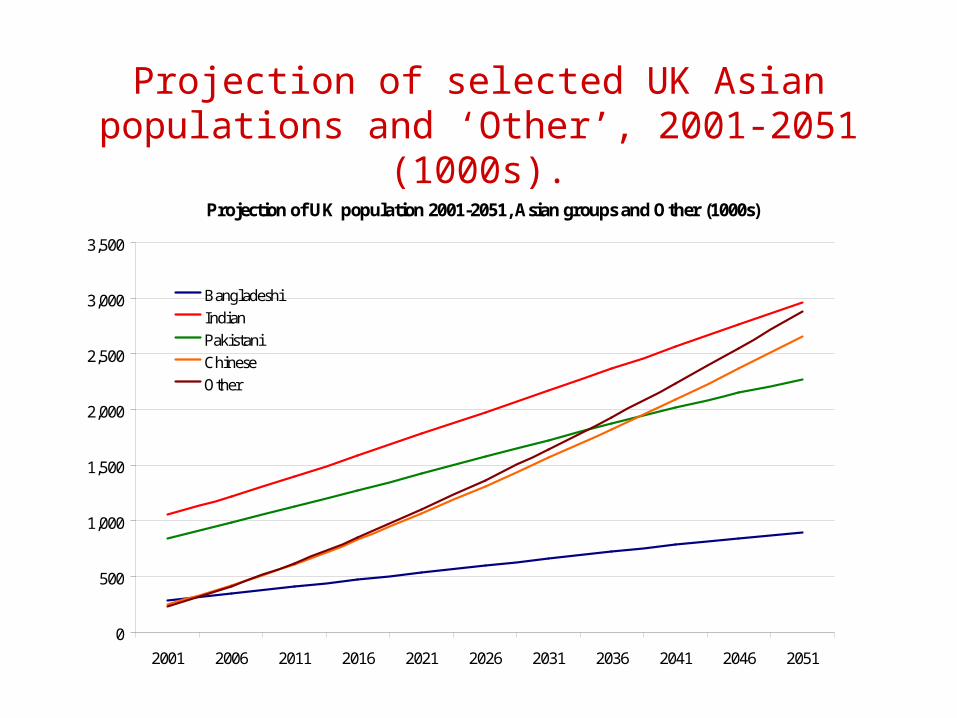
Projection of selected UK Asian populations and ‘Other’, 2001-2051 (1000s).
Projection of UK population 2001-2051, Asian groups and Other (1000s)
0
500
1,000
1,500
2,000
2,500
3,000
3,500
2001 2006 2011 2016 2021 2026 2031 2036 2041 2046 2051
Bangladeshi
Indian
Pakistani
Chinese
Other

Projected rank order of ethnic groups 2001-20512001 2026 2051
1 Indian Indian African2 Pakistani African Indian3 Mixed Pakistani Other4 Caribbean Other Chinese5 African Chinese Pakistani6 Bangladeshi Mixed Mixed7 Other Asian Other Asian Other Asian8 Chinese Caribbean Caribbean9 Other Bangladeshi Bangladeshi
10 Other Black Other Black Other BlackNote: convergent fertility, migration constant at 2001 levels, mortality declining on GAD assumptions, no mixed unions considered.

Births of mixed origin as proportion of all births to mothers of different ethnic groups, UK, 1992-2001
40.7
35.3
16.6
12.8
8.9
4.11.5
0
5
10
15
20
25
30
35
40
45C
hine
se
Car
ibbe
an
Bla
ck-
Afr
ican
Indi
an
Pak
ista
ni
Ban
glad
eshi
Whi
te
% M
ixe
d B
irth
s
Source: Quarterly Labour Force Surveys, 1992-2001 (Autumn Quarters)

Projection of Mixed populations, and Caribbean, with and without inter-generational contributions,
UK 2001 – 2056 (thousands).Growth of mixed populations with fertility contributions from selected other groups, UK 2001 - 2051 (thousands). Fertility contributions from British, African,
Caribbean, Chinese, Other Black, Other.
0
500
1,000
1,500
2,000
2,500
3,000
3,500
4,000
2001 2006 2011 2016 2021 2026 2031 2036 2041 2046 2051 2056
Mixed
Mixed plus British, African, WestIndian, Chinese, Other, Other Black
Black Caribbean
Black Caribbean minus mixed

Probabilistic projection 2001-2100: Mixed populations as a proportion of the
total UK population Uk,Mixed,Both Sexes
0.00
0.05
0.10
0.15
0.20
0.25
0.30
0.35
0.40
0.45
20
00
20
05
20
10
20
15
20
20
20
25
20
30
20
35
20
40
20
45
20
50
20
55
20
60
20
65
20
70
20
75
20
80
20
85
20
90
20
95
21
00
Year
Pro
po
rtio
n
Fra cti les
S er gei 's Offi ce PI II, fil e: D:\I IASA2005\M inorities \resul ts\[ chart s_OK_2100_ok_new2_2_del.x ls] ,01-Mar -05 13:22

Conclusions• Projections of population by ethnic origin in UK are
possible but with difficulty.• Must be regarded as indicators of implications of
assumptions, not prophesies.• Most sensitive and unpredictable variable is migration, not
fertility or mortality.• Migration policy must not be ignored.• Substantial growth, and re-alignment of relative size, of
some groups is very likely.• ‘Mixed’ groups gaining in importance – multiple origins
will eventually make ethnic categories less meaningful.• Next steps must include migration scenarios.

Net migration by citizenship 1967 – 2005 (thousands)
UK net migration by citizenship 1967 - 2005 (thousands). Note: there are discontinuities in this series at 1991. Source: ONS International Migration Statistics Series MN
-200
-100
0
100
200
300
400
1967
1969
1971
1973
1975
1977
1979
1981
1983
1985
1987
1989
1991
1993
1995
1997
1999
2001
2003
2005
UK citizens
Foreign citizens

Logistic curve fitted to UK Chinese TFR data 1965 – 2006. Asymptotic TFR 1.285; 95% confidence intervals 1.084 and 1.487

Projections of UK 'Black African' population, 2001-51 (thousands)
400
800
1200
1600
2000
2400
2001 2006 2011 2016 2021 2026 2031 2036 2041 2046 2051
S1 Low fert, no migration S2 Low fert, migration S3 Constant fert, no migration S4 constant fert, migration

Projections of South Asian populations, 2001-51 (1000s).
Population Projections 2001-2051: UK South Asian Groups - high and low variants
0
250
500
750
1000
1250
1500
1750
2000
2250
2500
2001 2006 2011 2016 2021 2026 2031 2036 2041 2046 2051
Tho
usan
ds
Bangladeshis Zero mig, TFR 3.0 - 1.9
Indians Zero migration, TFR 1.6
Pakistanis Zero Mig, TFR2.97 - 2.05
Bangladeshis Mig 4k, TFR 3.0 - 1.9
Indians Mig13.9k, TFR 1.6
Pakistanis Mig 12k, TFR 2.97 - 2.05,

Population Projections 2001-2051: UK South Asian Groups - Some high and low variants
0
250
500
750
1000
1250
1500
1750
2000
2001 2006 2011 2016 2021 2026 2031 2036 2041 2046 2051
Indians (P ostive Migration at 1991-2000annual average, Fertility held constant at2001 level)
P akistanis (P ostive Migration at 1991-2000 annual average, Fertility heldconstant at 2001 level)
Bangladeshis (P ostive Migration at 1991-2000 annual average, Fertility heldconstant at 2001 level)
Indians (Zero Migration at 1991-2000annual average, Fertilityconverging/declining at projected ratebased on 1980-2001 trend)
P akistanis (Zero Migration at 1991-2000annual average, Fertilityconverging/declining at projected ratebased on 1980-2001 trend)
Bangladeshis (Zero Migration at 1991-2000 annual average, Fertilityconverging/declining at projected ratebased on 1980-2001 trend)

Examples of calculation of asfrs from ‘own-child’ method.
'Other' women. asfrs LFS 'own-child'1998-2002 women babies asfr15-19 98 1 0.010220-24 153 7 0.045825-29 182 16 0.087930-34 186 24 0.129035-39 107 6 0.056140-44 148 3 0.020345-49 92 0 0.0000
sum 966 57 0.3492TFR 1.75
1995-2001 Indian women, LFS 'own-child'.women babies asfr
17.5 3043 12 0.003922.5 2904 177 0.061027.5 3711 434 0.116932.5 3583 356 0.099437.5 3558 153 0.043042.5 2970 21 0.007147.5 2443 0 0.0000
sum 22212 1153 0.3313TFR 1.66

Comparisons of OXPOP projection with GAD 2004-based PP.
UK pop 2006-2056 with migration and SRs 2005-6 etc compared with GAD 2004-based PP.
(thousands)
60,000
62,000
64,000
66,000
68,000
70,000
72,000
2006
2016
2026
2036
2046
2056
This projection using GAD data
GAD 2004-based Principal Projction
UK population 2006-2056 natural change only with SRs 2005-6 etc compared with GAD 20-based PP natural change
(thousands).
54000
55000
56000
57000
58000
59000
60000
61000
62000
2006
2011
2016
2021
2026
2031
2036
2041
2046
2051
2056
This projectionnatural change
GAD 2004based naturalchange

Indian population, England and Wales Census 2001 (percent)
5.00 3.00 1.00 1.00 3.00 5.00
0-4
10-14
20-24
30-34
40-44
50-54
60-64
70-74
80-84
90 +
percent of population
females males
Pakistani population, England and Wales Census 2001 (percent)
7.00 5.00 3.00 1.00 1.00 3.00 5.00 7.00
0-4
10-14
20-24
30-34
40-44
50-54
60-64
70-74
80-84
90 +
percent of population
males females
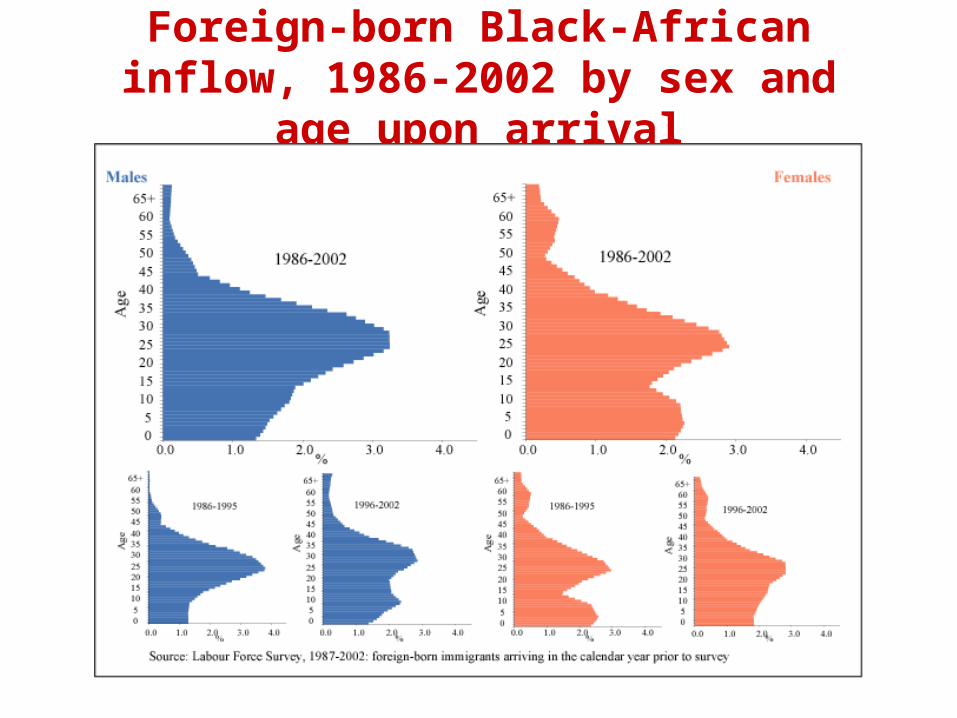
Foreign-born Black-African inflow, 1986-2002 by sex and age upon arrival

Estimated Ethnic Composition of Births in England and Wales, 1993-2002 (n.b. scale)

Probabilistic projection of the UK white population 2001-2100
Uk,White ,Both Sexes
0.00
10 000.00
20 000.00
30 000.00
40 000.00
50 000.00
60 000.00
20
00
20
05
20
10
20
15
20
20
20
25
20
30
20
35
20
40
20
45
20
50
20
55
20
60
20
65
20
70
20
75
20
80
20
85
20
90
20
95
21
00
Year
To
tal p
op
ula
tio
n (
tho
usa
nd
s)
Fra cti les
S er gei 's Office PII I, file: D:\I IASA2005\Mi norities \result s\[ charts _OK_2100_ok_new2_2.x ls] ,01-Mar -05 10:59