ethiopia: overview of selected biodiversity indicators
TRANSCRIPT

… 1970 1975 1980 1985 1990 1995 2000 2005 2010
ETHIOPIAETHIOPIAETHIOPIA
Overview of Selected Biodiversity Overview of Selected Biodiversity Overview of Selected Biodiversity
IndicatorsIndicatorsIndicators
Addis Ababa, 2010

2
… Biodiversity Indicators are integral Parts of
their Ecosystem ...

3
ETHIOPIA:
Overview of Selected Biodiversity Indicators
Addis Ababa, 2010

4
Copyright © 2010. Biodiversity Indicators Development National Task
Force.
Disclaimer:
The opinions expressed in this book do not necessarily reflect the views
of the institutions involved in the National Taskforce, but only that of
the experts involved in the task force representing the institutions.
Financed by: UN Development Account
Project Executant: UNEP-WCMC
Editor: Mengistu Wondafrash
Design and Print Layout: Abiyot Berhanu
Citation:
Biodiversity Indicators Development National Task Force (2010).
Ethiopia: Overview of Selected Biodiversity Indicators. Addis Ababa.
Pp. 48

5
Table of Contents
Acronyms…..…………………………………………………………….....6
1. Introduction (Kahsay G/Tensae)………..…………………………….…....7
1.1 Background……………………………………………………….…...7
1.2 Overview of Ethiopia‟s Biodiversity…………………………………..8
1.3 Overview of Biodiversity Indicators………..………………….….…..9
1.4 Methods and Indicator Development Framework.………………..….10
2. Identification of Key Questions and Selection of Indicators………...12
2.1 Trend in Abundance and Distribution of Ethiopian wolf.…..…..……14 Abiyot Berhanu.
2.2 Trend in Abundance and Distribution of Walia ibex..……………….18 Abiyot Berhanu
2.3 Trend in Abundance and Distribution of White-eared kob.………….22 Kahsay G/Tensae
2.4 Trend in Abundance and Distribution of Liben lark…...…………….26 Yilma Delelegn
2.5 Trend in Abundance and Distribution of Swayne‟s hartebeest……....29 Kahsay G/Tensae
2.6 Trend in Abundance and Distribution of Grevy‟s zebra…...………...32 Yilma Delelegn
3. Trends in Land Use and PAs Coverage in Ethiopia (Dawit Dinku)…..36
3.1 Land Cover…………………………………………………….…....36
3.2 Land Use… ……………………………………………….………...37
3.3 Protected Area Coverage…………………………………………....37
3.4 Agricultural Land Area in Rural Sedentary Private Holdings………39
4. Conclusion and Recommendation…………………………………….41
Acknowledgment ………………………...…………………………….43
Bibliography ...……………………………………………….….…..…44

6
Acronyms
AWR - Allideghe Wildlife Reserve
BICSAfrica - Biodiversity Indicator Capacity Strengthening in Africa
BMNP - Bale Mountains National Park
CBD - Convention on Biological Diversity
CBWR - Chew Bahir Wildlife Reserve
COP6 - Sixth Conference of the Parties
CSA - Central Statistical Agency
EWCA - Ethiopian Wildlife Conservation Authority
EWNHS - Ethiopian Wildlife and Natural History Society
FAO - Food and Agriculture Organization
GEF - Global Environmental Facility
GNP - Gambella National Park
IBC - Institute of Biodiversity Conservation
IUCN - International Union for Conservation of Nature
MDGs - Millennium Development Goals
NGOs - Non Governmental Organizations
NP - National Park
NSNP - Nechsar National Park
PAs - Protected Areas
SMNP - Simien Mountains National Park
SSHS - Senkele Swayne‟s Hartebeest Sanctuary
SSHS - Sinkele Swayne‟s Hartebeest Sanctuary
TFCI - Trans-frontier Conservation Initiative
UNEP - United Nations Environmental Programme
WCMC - World Conservation Monitoring Center

7
1. Introduction
1.1 Background
This book is a national report developed by the Ethiopian National
Taskforce drawn from three government institutions (CSA, EWCA and IBC)
and a local conservation NGO (EWNHS). The book presents examples of
biodiversity indicators developed for selected threatened species and extent
of area coverage of protected areas (PAs) in Ethiopia. It is intended to be
used by protected area managers, educational and research institutions,
conservation based institutions and others.
When producing biodiversity indicators, improving capacity of all partners
of the process is crucial task. To this end, Biodiversity Indicators Capacity
Strengthening in Africa Project (BICSAfrica) was designed by UNEP-
WCMC to build on existing work and assist the eastern and southern Africa
countries, of which Ethiopia is a part, to develop biodiversity indicators of
their choice on a sustainable basis. The BICSAfrica Project, which is aimed
at building capacity for development of national biodiversity indicators, has
been implemented by the UNEP World Conservation Monitoring Center
(UNEP-WCMC) and UNEP, with funding from the UN Development
Account, and is conducted as part of the 2010 Biodiversity Indicators
Partnership (2010 BIP: www.twentyten.net) and the UNEP capacity building
project in Africa. More information about this project is available at
www.bipnational.net.
The project was implemented in Ethiopia through national workshops and a
series of consultative meetings to develop a few biodiversity indicators that
meet national needs and for which there is some appropriate data. Data were
collected from relevant institutions (e.g. CSA, EWCA, EWNHS, IBC) and
online sources (e.g. IUCN). The draft reports were discussed at national
workshops and consultative meetings.

8
1.2 Overview of Ethiopia’s Biodiversity
Ethiopia is a relatively vast country with a land area of 1.12 million square
kilometers and wide variety of topography and climate. There is a great
variation in altitude, ranging from 116 meters below sea level in the Danakil
depression to 4620 masl at the top of Mt Ras Dashen. The great plains of
Ethiopia sit atop two massive highland plateaus, cloven in the middle by the
Great Rift Valley. Although much of the interior of Ethiopia is dominated by
highland plateaus, all of which are home to numerous endemic species of
flora and fauna, these are interrupted by deep gorges and 12 major river
valleys.
The differences in altitude, coupled with topographic variations, has resulted
in wide variations in rainfall, humidity and temperature and thus, the country
comprises of nine ecosystems that range from afroalpine at the highest
elevations to desert and semi-desert ecosystems at the lowest elevations. As
a result, Ethiopia is endowed with a wide variety of fauna and flora and the
extreme ranges have resulted in unique and diverse suite of its biological
resources. However, the rich biodiversity of the country is under serious
threat from overexploitation, overgrazing, expansion of cultivation and
settlements that are accompanied by excessive deforestations, invasions of
alien species and pollution. Despite some cases of improvements, serious
degradation is threatening much of the wild lands of the country. Thus, the
distribution and population of many mammals and birds is dramatically
declining.
Given the vastness of the country and its rich biodiversity resources, the
extent of protected areas in the country is negligible. Even the existing
protected area networks are not being intensively monitored to see trends
and most of them lack management plans. Furthermore, due to limited
understanding of the topic of biodiversity amongst many sectors of society
and insufficient use of science-based information in decision-making, it
seems that there are big challenges in producing national biodiversity
indicators in the country. Other factors that have limited the development of

9
biodiversity indicators include lack of basic data that can be converted into
useful indicators, inadequate skills on development of indicators, absence of
monitoring systems designed to support priority decision-making issues and
constraints of finance. Thus, capacity building assistance is vital to curb the
fundamental constraints seen in this area.
Therefore, the publishing of this book is timely and the indicators considered
in the report are believed to be of vital importance as an eye-opening venture
to assist as model to develop sustainable biodiversity indicators towards
reducing the potential threats and strategize management interventions for
the ecosystems in which the indicators exist.
1.3 Overview of Biodiversity Indicators
An indicator is a measure based on verifiable data that conveys information
about more than itself. Indicators are purpose-dependent and thus the inter-
pretation or meaning given to the data depends on the purpose or issue of
concern. Indicators can lead on to other things and may convey their own
messages but they are not ends in themselves. Generally, a successful indica-
tor is scientifically valid; based on easily available data; responsive to
change in the issue of interest; easily understandable; relevant to user‟s
needs; and it is used for measuring progress, early warning, setting targets,
awareness-raising, etc.
Biodiversity indicators are tools that summarize and simplify information, to
help understand the status of biodiversity and threats to it, and to evaluate
progress towards its conservation and sustainable use. The process of biodi-
versity indicators development stems from the 2010 target of the CBD that
states:
“ . .. to achieve a significant reduction of the current rate of biodiversity loss
at global, national and regional levels as a contribution to poverty alleviation
and to the benefit of all life on Earth.” This was adopted at CoP6 and
incorporated as a new target under MDG7.
The motivations for global-scale biodiversity indicators are usually to

10
provide information and understanding for reporting on global targets such
as CBD and MDGs; as a communication tool to raise awareness of important
issues (e.g. IUCN Red List Index for threatened species) and to support
global-scale strategic planning and prioritisation (eg. GEF).
Indicators are central to effective decision-making and adaptive management
processes at national level. The long-term investment in the production of
biodiversity indicators can only be sustained if they are seen to be useful and
in demand to meet national priorities. The aims of national-scale priorities
for which biodiversity indicators are required commonly include:
reporting on international agreements (e.g. CBD and MDGs),
to communicate and raise understanding on how biodiversity is
important in addressing and sustaining priority development issues such
as poverty reduction and climate change,
to aid the design and monitoring of conservation strategies (e.g.
NBSAPs),
to put in place a sound and sustainable management mechanism for
protected area systems,
to put a system in place for effective conservation, sustainable use and
equitable sharing of biodiversity resources
to raise awareness and actions for topics of importance to interest
groups, including NGOs and academia, (e.g. threatened species or sites,
pollution problems, compliance with international agreements).
to assist the development of policies and management plans for
commercially important biodiversity (e.g. timber production, fisheries,
wildlife tourism);
for inclusion of biodiversity concerns in land use policies for investment
in biofuels, sustainable fisheries management, and land degradation,
to design and monitor national policies on biodiversity, the environment
and sustainable development
1.4 Methods and Indicator Development Framework
This section explains the different steps of the biodiversity indicator
development framework, which has three main thematic areas, including:
defining the purpose in consultation with key stakeholders; producing and
making use of indicators to meet objectives; and making indicators work in

11
sustainable manner. Experience sharing at sub-regional workshops, group
and peer-to-peer discussions and capacity-building exercises were the main
approaches used to dealing with the framework. Besides, some publications
of case studies and reports were also used.
The biodiversity indicators development process is structured around a
“Biodiversity Indicator Development Framework” presented in Fig. 1, which
contains key steps for producing successful biodiversity indicators. It is
highly recommended that the steps in the framework are followed up when
selecting and developing biodiversity indicators.
Figure 1. Indicator development steps

12
2. Identification of Key Questions and Selection of Indicators
The National Taskforce identified biodiversity indicators for Ethiopia,
guided by key questions, from which the indicators stemmed (Table 1). The
selected indicators represent five threatened mammals and one critically
endangered endemic bird and extent of coverage of protected areas (PAs).
The PAs networks and ecosystems represented by the indicators have been
depicted in Table 2. The subsequent sections of the book provide detailed
interpretations about each of the indicator and what it implies in terms of
required conservation and policy measures.
The information contained in the developed indicators will be of vital
importance for achieving protected area objectives and to report on the status
of biodiversity and health of ecosystems, of which the indicators are the
integral part. Such information can also be used by almost any sector of
society within the country. As typical examples, national and regional
governments can use these indicators to help make policies for biodiversity
conservation and sustainable use and to seek support and justification for
their decisions, and to report on the impact of their policies.
Table 1. Key questions and selected indicators
Key question Selected Indicators
1. What is the resource
base (population, range
and diversity) of protect-
ed areas in Ethiopia?
Trends in abundance and distribution of
selected species (key species of protected
areas):
Ethiopian wolf
Walia ibex
Swayne‟s hartebeest
White-eared kob
Liben lark
Grevy‟s zebra
2. What is the extent of
the designated protected
areas (PAs) and the trend
of land use in general in
Ethiopia?
Trend of land use vs extent of designated
protected areas and existing threats
Land use & extent of designated
PAs in terms of area coverage

13
Table 2. Selected indicators and represented PAs and Ecosystems
Indicators PAs Ecosystems
Ethiopian wolf
Walia ibex
SMNP, BMNP Afroalpine and
Subafroalpine
Ecosystem
Swayne‟s
hartebeest
Grevy‟s zebra Liben lark
SSHS, NSNP, AWR, CWR,
Liben Plains
Savanna grassland and
Acacia-Comiphora
woodland Ecosystems
White-eared
kob
GNP Combretum-Terminalia woodland and wetland Ecosystems

14
2.1 Trend in Abundance and Distribution of Ethiopian Wolf
Identification
The Ethiopian wolf (Canis simiensis), also known as the Abyssinian wolf,
Abyssinian fox, Red jackal, Simien fox, or Simien jackal is a canid endemic
to Ethiopia. The numerous names of the Ethiopian wolf reflect previous
uncertainty about its taxonomic position. But now, it is thought to be related
to the wolves rather than the foxes it physically resembles. It weighs 11–19
kilograms. The Ethiopian wolf exhibit sexual size dimorphism, and males
are 20% larger than the females.
The coat color of the Ethiopian wolf ranges from ochre to rusty red on the
face, ears and upper portions of the body, and white to pale ginger on the
under parts. Small white spots are present on the cheeks, as well as a white
ascending crescent below the eyes. The contrast of red and white markings
increases with age and social rank. Females tend to have paler coat colors.
The back of the tail has a short, rufous-colored stripe which ends in a thick
brush of black guard hairs on the tip. The pelt has short guard hairs and thick
under fur which protect the wolf from temperatures as low as −15 °C.
The diet of the Ethiopian wolf is almost exclusively composed of diurnal
Ethiopian wolf

15
rodents. Rodents account for 96% of all the prey, with the endemic
Big-headed Mole Rat (Tachyoryctes macrocephalus) being the main food
item. In areas where the Big-headed Mole Rat is absent, the wolf primarily
subsists on the East African Mole Rat. Other prey species of the Ethiopian
wolf include the Black-clawed Brush-furred Rat, Blick's Grass Rat, various
vlei rats, the Yellow-spotted Brush-furred Rat, young birds, the Ethiopian
Highland Hare, the Cape Hyrax, and young of the Common Duiker,
Mountain Reedbuck and Mountain Nyala.
Habitat and Ecology
Ethiopian wolf is much localized endemic species, confined to isolated
pockets of Afroalpine grasslands and heath lands where they prey on
Afroalpine rodents. Currently, the species is confined to seven isolated
mountain ranges of the Ethiopian highlands, at altitudes ranging from 3,000
to 4,500m. These are Bale Mountains National Park, north of the Rift
Valley, in the Simien Mountains, Mount Guna, North Wollo and South
Wollo highlands and Menz. Attributed to ever increasing agricultural
encroachment, wolves in the northern highland are restricted to areas above
3,500 to 3,800m.
Habitat of Ethiopian Wolf

16
Ethiopian wolf utilizes all Afroalpine habitats, but prefer open areas with
short herbaceous and grassland communities where rodents are most
abundant, along flat or gently sloping areas with deep soils and poor
drainage in parts. Prime habitats in the Bale Mountains are characterized by
short herbs (Alchemilla spp.), and grasses and low vegetation cover: a
community maintained in continuous succession as a result of molerat
(Tachyoryctes macrocephalus) burrowing activity. Other good habitats
include tussock grasslands (Festuca spp., Agrostis spp.), high-altitude scrubs
dominated by Helichrysum spp. and short grasslands in shallow soils. Plant
communities characterized by a matrix of „Guassa‟ tussock grasses (Festuca
spp.), 'cherenfi' bushes (Euryops pinifolius) and giant lobelias (Lobelia
rhynchopetalum) sustain high rodent abundance; thus, are preferred by the
wolves. Ericaceous moorlands (Erica and Phillipia spp.) at 3,200–3,600m
are of marginal value.
Major Threats
Continuous loss of habitat due to high-altitude subsistence agriculture
represents the major threat to the very existence of Ethiopian wolf. Sixty
percent of all land above 3,200m has been converted into farmland.
Attributed to further habitat loses, therefore, all populations of wolves that
exist in areas below 3,700m are particularly vulnerable, especially if the
areas are small and of relatively flat relief. Habitat loss is exacerbated by
overgrazing of highland pastures by livestock, and in some areas habitat is
threatened by development of commercial livestock farms and roads. Land
use for livestock still remains one of the major causes of the habitat losses.
Recent population decline of the Ethiopian wolf in Bale is mostly due to
disease epizootics, with road kills and shooting as secondary threats. Rabies
is a potential threat to all populations. Most of these threats are exacerbated
by the wolves' specialization to life in the Afroalpine ecosystem.
In Bale, the Ethiopian wolf hybridizes with domestic dogs (Canis
familiaris). Hybridization is relatively common in western Bale as a result of
crosses between female wolves and male domestic dogs. There is no

17
indication of hybridization taking place outside western Bale. Hybrids have
shorter muzzles, heavier-built bodies and different coat patterns. Although
hybrids are confined to the Web Valley of western Bale, they may threaten
the genetic integrity of the wolf population. Following hybridization, a
population may be affected by outbreeding depression or reduction in
fitness, although this does not seem to have taken place so far.
Population Trend
More than half of the species' population lives in the Bale Mountains, where
wolf density is high for a social carnivore of its size, and is positively
correlated with density of rodent prey and negatively with vegetation height.
Highest wolf densities are found in short Afroalpine herbaceous
communities (1.0–1.2 adults/km²); lower densities are found in Helichrysum
dwarf-scrub (0.2/km²), and in ericaceous heathlands and barren peaks (0.1/
km²). Wolves are also present at low density (0.1–0.2/km²) in montane
grasslands at lower altitudes.
Figure 2. Population trend of Ethiopian wolf in Bale Mountains NP
Source: IUCN and EWCA
1986 1988 1990 1991 1992 1994 2000 2003 2004 2005 2007 2009
Population 700 525 455 150 238 125 225 258 250 290 300 200
0
100
200
300
400
500
600
700
800
Po
pu
lati
on

18
In other localities, the overall wolf density is relatively lower in Menz; wolf
density was estimated at 0.2 animals/km². Comparison of census transect
data from recent comprehensive surveys indicates higher abundance in
North Wollo (0.20 ± 0.20 sightings per km), intermediate in Arsi and Guna
(0.10 ± 0.11 and 0.10 ± 0.14, respectively), and lower in South Wollo and
Simien (0.08 ± 0.13 and 0.06 ± 0.11, respectively).
The most reliable population estimates are those of Bale and Menz where
research has been more intense. The size of the populations in other
mountain ranges was derived from field maps of current habitat distribution
and extrapolations of wolf densities to the areas of 'optimal' and 'good'
quality wolf habitat in each isolated range.
Time series of count data from a long-term monitoring program in the Bale
Mountains of southern Ethiopia, spanning over 17 years, evidenced marked
variation in wolf abundance in association with disease epizootics affecting
high-density populations in the early 1990s (Fig. 2). Population numbers
returned to previous levels after disruption, evidencing resilience to
catastrophes, but at the lower extreme of densities the population rate of
increase was inversely density-dependent; delays in the formation of new
breeding units appeared to limit the capacity for immediate recovery. IUCN
listed the species as Endangered in 2008, 2004, 1996, 1990, 1988, 1986;
whereas Critically Endangered in 1994.
2.2 Trend in Abundance and Distribution of Walia Ibex
Identification
Walia ibex (Capra walie) is endemic to Ethiopia. It is sometimes considered
as a sub-species of the Alpine ibex. Animals have a chocolate-brown to
chestnut-brown coat coloration, greyish-brown muzzle, and a lighter grey in
the eyes and legs. The belly and insides of the legs are white, and black and
white patterns stretch upon the legs. The males weigh 80-125kg and have
very large horns which curve backwards, reaching lengths up to 110cm. The
horns are used for dominance disputes between males. The males also have

19
distinguished black beards. The length of the Walia ibex beard varies with
age. The older the males the longer and the thicker are the beards. Females
also have horns, but they are shorter and thinner. Females are smaller and
lighter in color. The horns on both males and females are rigid. The overall
size of the Walia ibex is smaller and slimmer than the Alpine Ibex.
Habitat and Ecology
Ethiopia is home to the world‟s only population of Walia ibex, which is
found in and around the Simien Mountains, in the North Gonder
Administrative Zone of the Amhara National Regional State of north-
western Ethiopia only. Formerly more widespread in the Simien Mountains,
most remaining Walia ibex are found within the boundaries of the Simien
Mountains National Park (13,600ha), mainly along 25km of the northern
escarpment between Adarmaz and Chennek Camps. There are also four
small populations outside the protected area: north of Werk Amba west of
the park; between Silki and Walka north-east of the park; between Bwahit
and Mesarerya; and north of Weynobar along the Ras Dejen escarpment to
Walia ibex, adult male

20
the north.
The Simien Mountains are characterized by huge gorges and galleys, both of
which carve out steep and jagged cliffs, with this species inhabiting only in
the high cliffs that rise above the lower elevated plateau. However, ibex may
descend to plateaus in areas where there is less human interference.
Major Threats
Walia ibex has survived two decades of war and its main threat is habitat
destruction, caused by human encroachment. The remaining natural habitat
is extremely limited, even though most of the villagers who lived in the
lowland areas of the Park were resettled outside the Park in 1978. However,
resetllers have returned once again taking advantage of the war that occurred
over the last two decades or so and are residing within the National Park,
creating increasing pressure on the Park and its wildlife. Today, there are
over 30,000 people living within the National Park and its boundaries.
Despite the existence of national and regional legislation, the remoteness of
the area coupled with the existence of people living within and outside of the
Park prior to its establishment as a conservation area makes legislation
Habitat of Walia ibex

21
difficult to enforce. Few Walia ibex also move to the south-east of their
natural range to feed on cultivated crops at places where there is cultivation
of barley and other crops on steep gradients. These incidences occasionally
lead to conflicts between Walia and the local farmers.
Population Trend
Walia ibex is listed as endangered and it is largely confined to the Simien
Mountains National Park and its surroundings. In 2004, the population stood
at around 500, a slight increase over earlier estimates of 200-250 animals
that were made in 1994-1996 (Fig. 3). In 2008, the population has increased
to more than 700 though the species is still listed as endangered. Although
the population has been showing signs of increase over the past decade or so,
the habitat continues to be degraded by human encroachment.
Figure 3. Population trend of Walia ibex in Simien Mountains NP
Source: IUCN and EWCA
IUCN listed the species as Endangered in 2008, 1994, 1988, 1986 and
Critically Endangered in 1996.
1974 1989 1993 1997 2002 2003 2004 2005 2006 2007 2008 2009
Population 300 400 150 400 514 554 573 567 633 659 683 740
0
100
200
300
400
500
600
700
800
Po
pu
latio
n
22
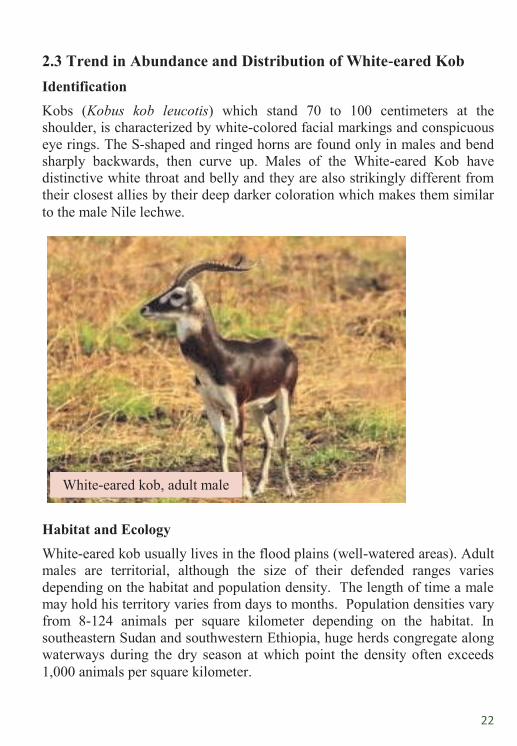
2.3 Trend in Abundance and Distribution of White-eared Kob
Identification
Kobs (Kobus kob leucotis) which stand 70 to 100 centimeters at the
shoulder, is characterized by white-colored facial markings and conspicuous
eye rings. The S-shaped and ringed horns are found only in males and bend
sharply backwards, then curve up. Males of the White-eared Kob have
distinctive white throat and belly and they are also strikingly different from
their closest allies by their deep darker coloration which makes them similar
to the male Nile lechwe.
Habitat and Ecology
White-eared kob usually lives in the flood plains (well-watered areas). Adult
males are territorial, although the size of their defended ranges varies
depending on the habitat and population density. The length of time a male
may hold his territory varies from days to months. Population densities vary
from 8-124 animals per square kilometer depending on the habitat. In
southeastern Sudan and southwestern Ethiopia, huge herds congregate along
waterways during the dry season at which point the density often exceeds
1,000 animals per square kilometer.
White-eared kob, adult male

23
Major Threats
It is evident that until the mid 1980s, the Gambella region in general and the
national park in particular were relatively free area from human interference,
and had abundant wildlife populations. However, following the 1984/85
famine, the then government moved a considerable size of people and settled
them in the eastern parts of the park. The situation was aggravated by
extensive poaching and habitat destruction by the refugees from South
Sudan where settlements were established within the park area. As a result,
the wildlife resources of the park area including the White-eared kob have
been depleted alarmingly for over two decades.
More over, recent observations indicate that extensive poaching, human and
livestock population pressure and inappropriate land use accompanied by
extensive investments have resulted in massive destruction of wildlife
habitat and severe wildlife population decline.
Herds and Habitats of White-eared kob

24
Population Trend
Gambella National Park and its surrounding, which is found in the
confluence point of Congolian-Sudanese and Somali-Masai biomes, is
known to support large herds of White-eared kobs. However, there is no
detailed study conducted on the White-eared kob from the Gambella side
since the region is one of the least assessed and poorly developed areas of
the country. Thus, it is difficult to know the trend of White-eared kob‟s
population and seasonal distribution in the past though this species is
classified as a low risk, near threatened subspecies by IUCN.
The Ethiopian Wildlife Conservation Authority in collaboration with its
partners has been conducting more detailed landscape surveys since the
recent past in order to know wildlife distribution and socio-economic
activities in the Gambella Region. Consequently, dry season aerial survey
was conducted in March 2010, which enabled to know the presence of over
250,000 White-eared kobs. Recent studies have also revealed that over
500,000 individuals counted in South Sudan and thus there is a speculation
that about a million of kobs inhabiting the whole region, moving between
Gambella and South Sudan.
Figure 4. Distribution of White-eared kob in dry season (2010)
Source: TFCI Taskforce Aerial Survey Report (2010)

25
More over, recent surveys have revealed that the herds of Kobs in the
Gambella region have flourished better than usual and expansion of routes
was witnessed as compared to the findings of some studies conducted dec-
ades back from the South Sudan side which show past routes of the wild ani-
mal in question (Fig.4 and 5). This is attributed to the present peace since it
has provided the Kob population the opportunity to freely move between
both regions.
Figure 5. White-eared kob migration routes (1980 compared to 2001)
Source: USAID/IAPUM (2001)

26
2.4 Trend in Abundance and Distribution of Liben Lark
Identification
Liben lark (Heteromirafra sidamoensis) is a small (length 14cm; weight
30gm) large-headed, short-tailed lark endemic to Ethiopia. It has pale buff
stripe down the centre of crown. Upper parts look "scaled" and has a short
thin tail. A similar species, the Singing lark (Mirafra cantillans) is longer
tailed, with rusty wing-patches in flight.
It has an unusual triangular shaped head noticeable from most angles. The
neck is long and has distinctly thin and long legs. The bill is short and
narrow. It has an overall rounded body. It is heavily marked with brown,
rufous and buff upper parts. Under parts especially the breast and belly are
tinged deep buff with streaking on the breast. It also has a broad white
supercillium and narrow whitish central crown stripe. Scaly appearance on
the wing coverts is formed by mid-brown feather centres bordered by
blackish subterminal lines and pale fringes. On disturbance, it prefers to run
swiftly along a zigzag course, than taking flight.
Habitat and Ecology
Liben lark was for some time known only from two specimens collected at
adjacent sites near Neghelle in the former Sidamo Province (now Guji
Liben lark

27
Zone), southern Ethiopia. Since 1994 there have been subsequent sightings
of small numbers (less than 10 on each occasion) in the Neghelle area.
Analysis of these locations on satellite images and recent fieldwork suggests
that the species is restricted to a very specific habitat (tall-grass fields) in the
calcareous plateau east and south of Neghelle. By 2007-08 it appeared to be
restricted to a single grassland patch 30-36 km2 in area .
Major Threats
Most of the problems are associated with habitat loss and degradation
resulting from overgrazing and cultivation. Some of the established threats
are arable cultivation, degradation of habitat and loss of grass cover, scrub
encroachment, disturbance of nesting birds, increase of settlements,
creation of bare areas and insufficient awareness of the bird‟s plight.
Between 1973 and 2002, the area of tall grass fields decreased by about 30%
and in 2003 much of it was being rapidly encroached by agriculture and
shrubs (Acacia drepanalobium and others) probably favored by excessive
grazing pressure and the suppression of seasonal fires (Fig. 6). Remaining
grassland is being heavily degraded by overgrazing.
Figure 6 shows that its habitat has shrunk greatly in a matter of two years
especially to the north, northwest, southwest and northeast. Much of the
problems associated with the loss of habitat are linked to severe overgrazing
that is not allowing the grass a chance of regeneration.
Population Trend
Liben lark was not well documented until coordinated surveys were
conducted in 2008. This and other surveys in succeeding years revealed that
this bird‟s numbers had gone down drastically. Earlier estimates which were
based on available habitat showed that its numbers were in excess of 2,500
birds in a range of 5,400 km2. Surveys in 2008-09 showed that their total
world range did not exceed 40 km2 and that there may not be more than 256
birds. These surveys also confirm that there might be a skew towards
male-female ratio. The species was listed as Critically Endangered in 2009

28
as it has an extremely small range which is decreasing from year to year.
Remaining habitat is rapidly being degraded. The potentially skewed sex
ratio may also mean that the effective population size is getting even
smaller.
Figure 6. Shrinkage of Liben lark occupancy at Liben Plains (2007-2009)
Adapted from Donald et al 2010

29
2.5 Trend in Abundance and Distribution of Swayne’s Hartebeest
Identification
Swayne‟s Hartebeest (Alecephalus buselaphus swaynei) is named after
Brigadier-General Swayne who discovered the wild animal during his visit
to Somaliland in 1891. It is distinguished from its closest races by its
considerably darker body color. It is a deep red chocolate brown or chestnut
with a fawn or cinnamon colored rump, tail and lower half of legs. Adult
specimens sometimes have a silvery appearance as the hairs are tipped with
white. The horns are fully expanded and shaped like those of the tora; and
curve out- wards and slightly downwards from the top of the head and then
sweep upwards at the tips, and are usually, but not always, hooked
backwards and they may or may not turn inwards.
Habitat and Ecology
Swayne's Hartebeests live in open country, light bush, sometimes in tall
savanna woodland. These are social animals and are normally seen in herds
of 4-15, up to thirty. Each herd is under the leader-ship of the master bull
which leads the females with their young. The territory is defended by the
male. They may be often seen grazing peacefully, with the bull on slightly
Swayne‟s hartebeest

30
higher ground acting as sentinel for his herd.
Major Threats
Larger antelopes which constitute the prey population in the savannah
grassland ecosystem are among the vulnerable wild species. Swayne‟s
hartebeest that was formerly distributed throughout open grass and bush
lands, is one of the most threatened ones. It was known to be found in both
Somalia and Ethiopia, is now restricted only to very few areas of Ethiopia
and thus it is an endemic sub-species to and also listed as endangered in
IUCN report. Habitat loss, render pest and poaching are believed to be the
main threats. At present, the largest surviving population is found in
Senekele Swayne's Hartebeest Sanctuary (SSHS).
Population Trend
Since the recent past, progressive measures have been taken towards
rescuing this endangered sub-species where effective management tools and
sound monitoring systems were put in place. Moreover, concrete measures
have been taken towards controlling livestock diseases transmission as well
as poaching through increase programs of awareness creation. As a result,
Habitat of Swayne‟s Hartebeest

31
the remnant population in SSHS has shown considerable increase (Fig. 7).
There is however considerable decline in the case of Nechisar National
Park‟s population of Hartebeest mainly due to poaching.
Figure 7. Population trend of Swayne‟s hartebeest in both PAs
Source: Monthly and annual reports of both PAs
Population trend of SH in Senkele SHS and Nechsar NP
0
100
200
300
400
500
600
700
800
2003 2005 2006 2007 2009 2010
Year
Nu
mb
er
of
SH
Senkele
Nechsar

32
2.6 Trend in Abundance and Distribution of Grevy’s Zebra
Identification
The Grevy‟s zebra (Equus grevyi ) is the largest (and heaviest) of its family
members. It is the most horse-like of the striped Equines. Adults possess
huge heads and prominently large ears. Males are larger than females. In
general males are 10% more heavier than females. This Equid species is best
identified with a combination of large size, close narrow stripes, bolder
stripes on neck and shoulders and unmarked belly (very pale to white), black
ear markings and stripe along spine. The tall erect crest increasing in size
from the shoulders to the top of the head is striking lending the animal a
unique outline. Its ears are prominently ovoid shaped and there is no
marking on its pure whitish belly. Grevy's in general stand up to 145cm at
the shoulder with a range of height from 140-160cm. Males are known to
weigh up to 450kgs while females can weigh up to 380kg.
Grevy‟s do not form permanent herds or migrate in large numbers as the
common zebra, they have a predilection to gather in large herds often in their
Grevy‟s zebra, adult female

33
hundreds especially at water holes. They gather in smaller herds in the dry
season when resources are limited. Females associate in nursing groups and
males in bachelor groups.
Habitat and Ecology
Grévy's inhabits Acacia-Commiphora thorn bush habitat and expanses of dry
short-grass in Somali-Masai Biomes. It rarely migrates if water and feed is
adequate. In extremely dry conditions, it can migrate to watered sites. It has
preference for Bush/grass mosaics and large sections of its habitat can be
waterlogged for some months of the year. It can live on grass species
including Pennisetum spp., which are usually tough for cattle to eat or
digest. It makes use of plains with extensive growth of Pennisetum
schimperi but also subsists on other species of grasses. They are known to
feed on browse composed of leaves and shoots when food is scarce. Grévy's
zebra feed mostly on grasses but they will also eat fruit, shrubs, roots,
leaves, buds, and bark. They may spend 60-80% of their days eating,
depending on the availability of food. Their well adapted digestive system
allows them to subsist on diets of lower nutritional quality than that
necessary for other herbivores
Major Threats
The major threats to Grevy‟s zebra include reduction of available water
sources, habitat degradation and loss due to overgrazing, competition from
resources, hunting and disease. In Ethiopia, killing of this animal is
apparently the primary cause of its decline.
Population Trend
Current estimates put the total population of Grevy's zebra remaining in the
wild in Kenya and Ethiopia at approximately 1,966 to 2,447. From 1988 to
2007, the global population of Grevy‟s zebra declined approximately 55%.
The worst case scenario is a decline from 1980 to 2007 of 68%. The number
of mature individuals is approximately 750, and the largest subpopulation is
approximately 255 mature individuals.

34
In Ethiopia, Grevy‟s Zebra declined from an estimated 1,900 in 1980 to 577
in 1995, to 106 in 2003. In 2006, the population in Ethiopia was estimated to
be 128. The trend from 1980 to 2003 (23 years) is a decline of roughly 94%.
The data for 2006 indicates a potential increase in the population in Ethiopia
(Fig. 8).
The density and area of occupancy of Grevy‟s zebra fluctuates seasonally as
animals move in their search for resources. A sample count of Grevy‟s zebra
at Alldeghi (Fig. 9) shows the effect of resource partition and presence on
the total number seen over a period of time. During the dry season, when
they are dependent on permanent water, animals tend to be more concentrat-
ed. However, given that they can move up to 35 km from water even during
the dry season, their densities are never high.
Figure 8. Dramatic decline of Grevy‟s zebra in Ethiopia
Source: EWCA

35
Figure 9. Grevy‟s zebra count results at Alledeghi plains (2001-2008)
Source: EWCA

36
3. Trends in Land Use and PAs Coverage in Ethiopia
3.1 Land Cover
Ethiopia covers an area of 1,127,127km2, of which water area covers
7,444km2 and land area 1,119,683km2, with a topographic diversity
encompassing high and rugged mountains, flat-topped plateau, deep gorges
with river, and rolling plains.
Nearly half of the total land is (41 percent) is non arable land, which
includes forest, mountains, roads, cities, etc. and about 43 percent of the
total land area is arable that includes temporary crop, permanent crop,
pasture, and fallow land. Since the recent past, protected areas coverage is
increasing in which 15 percent of the land is covered by national parks,
wildlife sanctuaries and reserves, controlled and open hunting areas and
community conservation and about one percent of land shares water surface
(Fig. 10).
Figure 10. Percentage distribution of land cover surface area in km2
Source: CSA

37
3.2 Land Use
Land use refers to activities – such as growing crops, raising livestock or
cultivating fish – carried out on the land making up the holding with the
intention of obtaining products and/or benefits. Land use should be
distinguished from “land cover”, the later being description of the physical
characteristics of the land, such as grassland or forest.
Land use is the function of land what it is used for. It is a description of how
people utilize the land, manipulation of natural ecosystem in order to obtain
benefits, which could be material benefits/products (e.g cereals production,
livestock purpose) and immaterial benefits (erosion prevention) and socio
economic activity (inputs, managements and out puts). Land use information
can be used to study food security at national, regional and global levels, to
develop solution for natural resource management issue such as salinity,
water quality, and deforestation and for planning and policy formulation.
Land use directly affects land and triggers process such as land degradation,
desertification and loss of biodiversity.
3.3 Protected Area Coverage
From the total land area coverage of the country PA shares about 15 percent
only. Figure 11 shows the data of national parks, sanctuaries, controlled
Land use in Ashengie, Tigray

38
hunting, open hunting, wildlife reserves and community conservation areas.
A National Park is a reserve of natural or semi natural land, declared or
owned by a government, set aside for animal safety and/ or human recreation
and enjoyment, and protected from most development activities.
From the total land area coverage of the country PAs share about 15 percent
only. The proportion of different categories of conservation is indicated
below (Fig.11). As pointed out graphically, among the protected land area
which was set aside between the year 1966 and 2010, the largest portion is
covered by open hunting area which is 94,633 (about 55%) and the smallest
one (1%) is the community conservation area.
Figure 11. Protected land area (in km2) in Ethiopia
Source: EWCA and CSA

39
3.4 Agricultural Land Area in Rural Sedentary Private Holdings
Land plays a critical role in the production of food crops. The expansion of
agriculture and intensive exploitation of land by human beings with the
aspiration of increasing the volume of crop production impacts directly or
indirectly on land. Changes taking place in agriculture are drastically
shaping land use patterns and holding sizes.
From agricultural point of view, land is an indispensable factor for
production of crops, raising of livestock and other ancillary agricultural
activities. There is no universally accepted standard of land use
classification. According to the FAO recommendations for the purpose of
agricultural census, the total land use is categorized into six main land use
types, which are land under temporary crops, land under permanent crops,
grazing land, fallow land, forest or other wood land, and land for other
purposes.
Figure 12. Land use of agricultural land (in hectare)
Source: FAO and CSA

40
As indicated in Fig.17, the trend of crop area (temporary and permanent crop
area in hectare) is increasing. Thus, due to the ever-increasing of crop area
coverage, grazing land and wood lands have been declining and this in turn
brings negative impact on biological diversity, and maintenance of the
ecological integrity.

41
4. Conclusion and Recommendation
Biodiversity indicators are currently perhaps the best way of assessing the
status of biodiversity as well as evaluating progress towards its conservation.
One quality that stands out is that biodiversity indicators are purpose-driven
and thus the interpretation or meaning given to the data depends on the
purpose or issue of concern, thus producing information that fulfills the
needs of the user. With precaution and due discretion, they can also be ways
of gauging overall biodiversity trends at various levels including at a global
scale. They also provide a practical and economical way of prioritizing
action for biodiversity when resources including skilled human resource,
funds and time is limiting.
The experiences gained through BICSAfrica project enabled the National
Taskforce established in Ethiopia, one of the 13 participating countries, to
develop national biodiversity indicators utilizing existing data to address
national priority issues. This book presents examples of biodiversity
indicators developed by the taskforce and provides highlights on the
experiences gained and lessons learnt as a result of being involved in the
sub-regional BICSAfrica project, executed by UNEP-WCMC.
The exercise and process of developing selected biodiversity indicators for
Ethiopia has been a successful and eye-opening venture in the way
concerned stakeholders can use selected species for understanding and
assessing biodiversity and associated ecosystems where they are found. The
capacity building part of the training has been a valuable experience that can
be easily transferred to other stakeholders. The process was instrumental in
contributing enormously towards improvement of the poor communications
and collaborations existed in the past among the participating institutions. It
is believed to have paved the way in which the institutions will exchange
information and work together in close collaboration in the future.
Ethiopia has a number of species that can potentially act as indicator species.
The indicator species described in this book are a sample amongst several
others that can show trends and status of biodiversity. All group members
42
who have actively participated in this process fully acknowledge that the
information provided herein is spatially and temporally bounded. That is
with new and updated information, the interpretive scope of indicator
species will also gain value.
The development of the current biodiversity indicators has been possible due
to existing data held by different institutions. One big lesson the taskforce
members learnt was that there are, almost always, some sort of scattered data
somewhere within various institutions, both government and NGOs.
However, the problem lies with absence of clear mechanism to share the
data as required. It is also true that the present understanding is inadequate to
make use of data as indicators to address key biodiversity conservation
issues and to discharge national responsibilities in reporting on international
obligations.
To make use of existing data held by various organizations efficiently and
facilitate further development of successful and sustainable biodiversity
indicators in the future, there is a vital need to establish a centralized
biodiversity database management system. This helps to sustainably produce
and update biodiversity indicators.
The indicators produced in a sustainable manner will be of great use in
national biodiversity monitoring, success measurement, meeting national
objectives in reporting to international agreements like CBD and MDG,
policy formulation, informed decision-making and biodiversity and
environmental management.
It is thus hoped that this work will prompt and give impetus to other
stakeholders involved in biodiversity conservation and charged with
responsibilities of reporting on progress of international conventions to
frame their mind for responsible actions towards mainstreaming the issue of
biodiversity indicators in the country.

43
National Task Force Members
Kahisay G/Tensae (Coordinator)
Ethiopian Wildlife Conservation Authority (EWCA)
Tel. +251-911-742003
E-mail: [email protected] Website: www.ewca.gov.et
Abiyot Berhanu (D/Coordinator)
Institute of Biodiversity Conservation
Tel. +251-911-120725
E-mail: [email protected] Website: www.etflora.net
Mengistu Wondafrash
Ethiopian Wildlife and Natural History Society
Tel. +251-911-242369
E-mail: [email protected] Website: www.ewnhs.org.et
Dawit Dinku
Central Statistical Agency
Tel. +251-917-811849
E-mail: [email protected] Website: www.csa.gov.et
Addis Ababa, Ethiopia
Acknowledgement
The authors would like to acknowledge the UN Development Account,
UNEP-WCMC and Biodiversity Indicators Capacity Strengthening in Africa
Project for their support in the whole process. All data providers, institutions
and individuals who participated in inception workshops and consultative
processes are also given special thanks. The author of 2.1 and 2.2
acknowledges Dr. Misikire Tessema for his support in editing the chapters.

44
Bibliography
Agricultural Census FAO (2010).
Area and production, annual agricultural survey from 2003/04-2009/10,
CSA.
Ash, J. S. & Gullick, T. M. (1989). The present situation regarding the
endemic breeding birds of Ethiopia. Scopus 13: 90-96.
BirdLife International Species factsheet: Heteromirafra sidamoensis.
Downloaded from http://www.birdlife.org on 12/5/2.
Collar N.J. and Stuart S. N. (1985). Threatened Birds of Africa and related
Islands. ICBP/IUCN Red Data Book; Part 1. Cambridge, UK. 374-375.
Erard, C. (1975). Une nouvelle alouette du sud de l' Ethiopie. Alauda 43:
115-124.
Estes, R. D (1993). The Safari Companion: A guide to watching African
mammals. Russel Friedman Books. South Africa. pp 205-207.
Estes, R. D. (1991). The Behavior Guide to African Mammals. The
University of California Press. Berkley, United States of America. pp
240-248.
EWCA, SDPASE and AP (2010). Trans Frontier Conservation Initiative
(TFCI) Task Force Aerial Survey :Reconnaissance and Census Report.
Ethiopia Demographic and Health Survey (2005).
Ethiopia Wildlife conservation Authority (2009).
EWNHS. (1996). Important Bird Areas of Ethiopia: A first inventory.
Ethiopian Wildlife & Natural Histoy Sociey. Addis Ababa, Ethiopia.
169-170.
Fanuel Kebede (undated). Excerpt tabulated data on wildlife counts from
Alledeghi Plains.
Francis, J and Shirihai H. (1999). Ethiopia: In search of endemic birds. Trip
45
report. London, UK. 45pp.
Geberemedhin, B. & Grubb, P. 2008. Capra walie. In: IUCN 2010. IUCN
Red List of Threatened Species. Version 2010.1.
<www.iucnredlist.org>. Downloaded on 26 March 2010.
Hillman, J.C. (1993b). Ethiopia: Compendium of wildlife conservation
information. Vol.2: Information on wildlife conservation areas. NYZS-
The wildlife conservation Society- International, New York.
http://en.wikipedia.org/wiki/national_park National Parks- Wikipedia, the
free encyclopedia.
IBC (2010). CBD 4th Country Report. Addis Ababa, Ethiopia.
IUCN SSC Antelope Specialist Group (2008.) Kobusmegaceros. In: IUCN
2010. IUCN Red List of Threatened Species. Version
2010.1.<www.iucnredlist.org>. Downloaded on 15 May 2010.
Kingdon, J. (1997). Kingdon Field Guide to Mamals of Africa. Academic
Press, London
Kingdon, J. (2004). The Kingdon Pocket Guide to African Mammals. A&Cf
Black Publishers Ltd. London. pp 192-196.
Land use by H. George and F. O. Nachtergaele (2002)
McColaugh, D.W. (1989). Wild Lives: Profiles of East African Mammals.
African Wildlife Foundation. Nairobi, Kenya. 91-92.
NBSAP (2004). Ethiopia National Biodiversity Strategy and Action Plan.
Institute of Biodiversity Conservation, Addis Ababa. Pp. 104
Nigel J. Collar, Yilma Dellelegn Abebe, Lincoln D. C. Fishpool, Merid N.
Gabremichael,Claire N. Spottiswoode & Mengistu Wondafrash. (2008).
Type locality, habitat, behaviour, voice, nest, eggs and plight of the
Sidamo Lark Heteromirafra sidamoensis. Bull ABC Vol 15 No 2.
Paul F. Donald, Graeme M. Buchanan, Nigel J. Collar, Yilma Dellelegn

46
Abebe, Merid N. Gabremichael, M. A. Kiragu Mwangi, Paul Kariuki
Ndang‟ang‟a, Claire N. Spottiswoode and Mengistu Wondafrash
(2010). Rapid declines in habitat quality and population size of the
Liben (Sidamo) Lark Heteromirafra sidamoensis necessitate immediate
conservation action. Bird Conservation International. Birdlife
International. Cambridge, UK. 12pp.
Robertson, I. S. (1995). First field observations on the Liben Lark
Heteromirafra sidamoensis. Bull. Br. Ornithol. Cl. 115: 241-243.
Sanderson, I.T. (1970). Living mammals of the world. Hanover House,
Doubleday Company. New York, USA. p 223.
Sillero-Zubiri, C. & Marino, J. 2008. Canis simensis. In: IUCN 2010. IUCN
Red List of Threatened Species. Version 2010.1.
<www.iucnredlist.org>. Downloaded on 26 March 2010.
Spottiswoode, C. N., M. Wondafrash, M. N. Gabremichael, Y. Dellelegn
Abebe, M. A. K. Mwangi, N. J. Collar & P. M. Dolman (2009).
Rangeland degradation is poised to cause Africa‟s first recorded avian
extinction. Anim. Conserv. 12: 249-257.
UNEP/CBD/SBSTAA (2010). Experiences in the Development of National
Biodiversity Indicators. Subsidiary Body on Scientific, Technical and
Technological Advice. UNEP/CBD (UNEP/CBD/SBSTAA/14/INF/12.
Nairobi, Kenya. 6pp.
Williams, S., Nelson A. and Fanuel Kebede. 2003. Grevy's Zebra Survey,
Ethiopia (2002). Interim report. EWCP. Addis Ababa, Ethiopa. pp1-19.
Williams. S. (2002). Status and Action Plan for Grevy's Zebra (Equus
grevyi) in Equids: Zebras, Asses and Horses: Status survey and
Conservation Action Plan, P.D. Moehlman, Editor: 2002, IUCN/SSC
Equid Specialist Group, Gland, Switzerland. pp 11-27.

47
… Biodiversity Indicators give clue how well the
protected area is functioning ...

48
Biodiversity indicators are tools that summarize and simplify information, to help understand the status of biodiversity and threats to it, and to evaluate progress towards its conservation and sustainable use.
Photo Credits: Land use ©Abiyot B., Walia ibex & inside-cover photos © Patricio Robles Gil, Ethiopian
wolf © IBC, Liben lark © Cagan S., Grevy‟s zebra © danielsanimals.wordpress.com,
Swayne‟s hartebeest © Lakew B., White-eared kob © Ludwig S.