ethanol policy markets u.s. ethanol market outlook · each gallon of eth lthanol they mix with...
TRANSCRIPT

U.S. Ethanol Market OutlookU.S. Ethanol Market OutlookKansas Farm Managers &Kansas Farm Managers &Kansas Farm Managers & Kansas Farm Managers &
Rural Appraisers Annual MeetingRural Appraisers Annual Meeting
February 24, 2012February 24, 2012
Daniel O’Brien, Ph.D.Extension Agricultural Economist
K St t U i itKansas State University
Ethanol Policy & MarketsEthanol Policy & Markets
A. U.S. Ethanol Policy
B. U.S. Ethanol Industry Capacity
C. U.S. Ethanol Prices, Costs & Profits
D. Ethanol’s Impact on U.S. Corn Markets
E. Key Ethanol‐Related Research
F Tho ghts on the F t re of U S EthanolF. Thoughts on the Future of U.S. Ethanol
U.S. Ethanol Policy: U.S. Ethanol Policy: Gasohol & MTBEGasohol & MTBEyy• Gasohol (10% ethanol) available in U.S. since late 1970s
• MTBE & The History of EthanoloDemand for grain based ethanol spurred by the discovery that MTBE (methyl tertiary butyl ether) was contaminating groundwater supplies
• MTBE use as an oxygenate additive was widespread due to mandates• MTBE use as an oxygenate additive was widespread due to mandates of the U.S. Clean Air Act amendments of 1992 intended to reduce carbon monoxide emissions in U.S. cities & elsewhere.
MTBE i li b d i l 20 b 2006oMTBE use in gasoline was banned in almost 20 states by 2006. • U.S. gasoline suppliers worried about widespread, costly litigation
• In 2005 the U S Congress refused to provide legal protection for MTBE• In 2005 the U.S. Congress refused to provide legal protection for MTBE
Concerns re: MTBE Water ContaminationConcerns re: MTBE Water Contamination

U.S. Ethanol Policy: U.S. Ethanol Policy: Ethanol ExpandsEthanol Expands
• Result: Expanding U.S. Ethanol Production Capacity o Corn based‐ethanol is the primary substitute for MTBEo Low U.S. corn prices during 2000‐2006, staying near $2.00 per bu.o Supported by U.S. Energy Policy initiatives
• 2005 U S Energy Policy Act• 2005 U.S. Energy Policy Acto Expansion of ethanol driven by federal legislation aimed to reduce oil consumption & enhance energy security
o Established a nationwide renewable fuels standard (RFS) requiring use of 7.5 billion US gallons of renewable fuel by 2012
2007 E I d d & S it A t• 2007 Energy Independence & Security Acto Raised the RFS to 36 billion gal. of annual renewable fuel use by 2022
o Corn‐based ethanol (conventional biofuel) is essentially capped at 15 ( ) y ppbillion gallons by 2015
U.S. Ethanol: U.S. Ethanol: Import TariffsImport Tariffs
• Ethanol Import Tariffo Since 1980s, U.S. ethanol producers have been protected by a $0.54 / gallon tariff on imports ‐mainly intended to curb Brazilian sugarcane ethanol imports.
o The tariff has been intended to offset the federal tax credit that is applied fto ethanol no matter its country of origin
• Caribbean Basin Initiative (CBI) Import Tariff Exclusiono Several Caribbean countries have been importing Brazilian hydrated ethanol, reprocessing it into anhydrous ethanol, and then re‐exporting it to the United States
• They avoid the 2.5% duty and the $0.54 /gal. tariff
o Quota set at 7% of U.S. ethanol consumption – approved by CBI & free trade agreementstrade agreements
U.S. Ethanol: U.S. Ethanol: Blender’s CreditsBlender’s Credits• Ethanol Blender’s Credit
o Since 2004 blenders of transportation fuel had received a tax credit for h ll f th l th i ith l lieach gallon of ethanol they mix with regular gasoline.
o Blenders received a US$0.45 per gallon tax credit for ethanol that is blended with gasoline, regardless of the feedstock
o Small ethanol producers received an additional US$0.10 on the first 15 million US gallons produced
• U S Policy Regarding Ethanol Tax Credits• U.S. Policy Regarding Ethanol Tax Creditso Current tax credits are based on the 2005 Energy Policy Act, the 2008 Food, Conservation and Energy Act, and the 2008 Energy Improvement & Extension ActExtension Act
o On June 16, 2011, the U.S. Congress approved voted to repeal both the tax credit and the tariff on ethanol, but this bill failed
o The tax credit expired on December 31, 2011
U.S. Ethanol Capacity & Production U.S. Ethanol Capacity & Production p yp ySource: Renewable Fuels AssociationSource: Renewable Fuels Association
18
5.6
5.5 2.11.4
0.5 0.0
13
15
s / y
ear
13.5 14.21.88
10n
gallo
ns
2 7 3 1 3.6 4.35.5
7.9
10.611.9
0.1 0.1 0.10.4 0.5 0.6
0.8
3
5
Bill
ion
1.7 1.7 1.9 2.3 2.7 3.1
0
Plant Capacity Expansion Annual Production
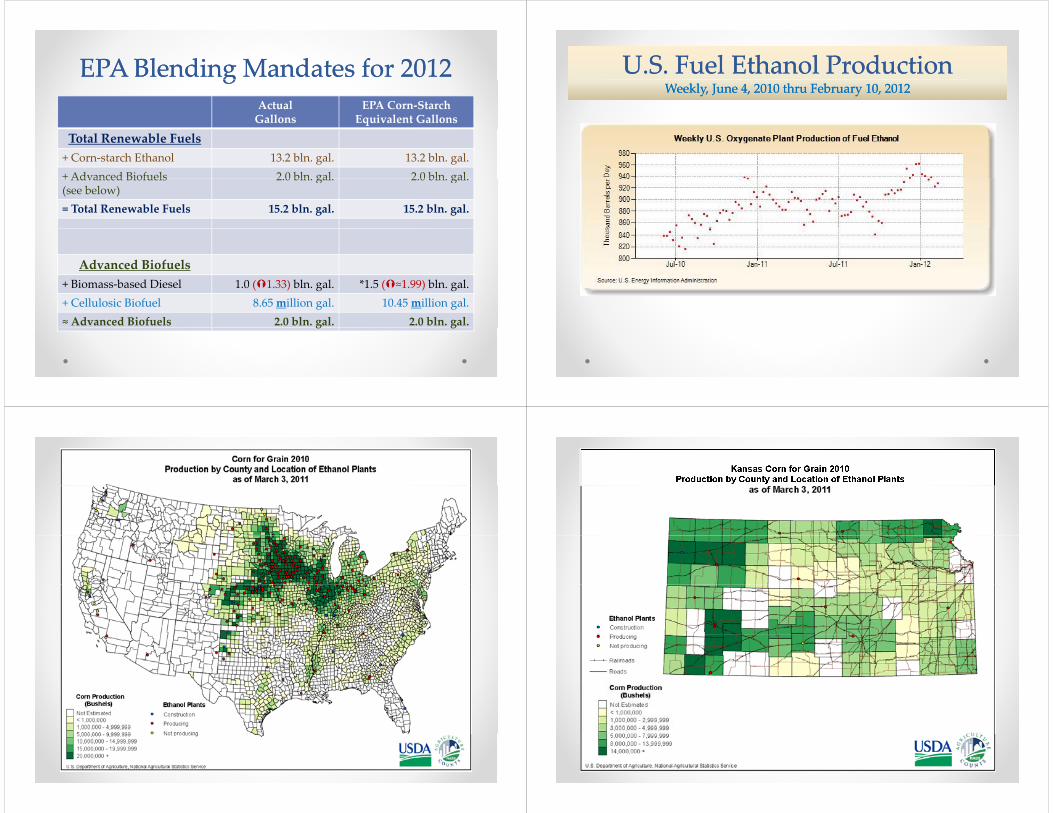
EPA Blending Mandates for 2012EPA Blending Mandates for 2012ggActual Gallons
EPA Corn‐StarchEquivalent Gallons
Total Renewable Fuels+ Corn‐starch Ethanol 13.2 bln. gal. 13.2 bln. gal.+ Advanced Biofuels 2.0 bln. gal. 2.0 bln. gal.+ Advanced Biofuels (see below)
2.0 bln. gal. 2.0 bln. gal.
= Total Renewable Fuels 15.2 bln. gal. 15.2 bln. gal.
Advanced Biofuels+ Biomass‐based Diesel 1.0 ( 1.33) bln. gal. *1.5 ( ≈1.99) bln. gal.+ Cellulosic Biofuel 8.65 million gal. 10.45 million gal.≈ Advanced Biofuels 2.0 bln. gal. 2.0 bln. gal.g g
U.S. Fuel Ethanol ProductionU.S. Fuel Ethanol ProductionWWeekly, June 4, 2010 thru February 10, 2012eekly, June 4, 2010 thru February 10, 2012

Ethanol Price, Cost & ProfitsEthanol Price, Cost & ProfitsISU E h l l d l ( b 1 1 )ISU Ethanol Plant Model (January 2005 – February 17, 2012)
$3.50
Cost$2.26
$2 00
$2.50
$3.00
Eth
anol
Price$2.08
$1.00
$1.50
$2.00
Gal
lon
of E
Net($0.18)
$0.00
$0.50
$ P
er G
($0.50)
Jan‐05
May‐05
Sep‐05
Jan‐06
May‐06
Sep‐06
Jan‐07
May‐07
Sep‐07
Jan‐08
May‐08
Sep‐08
Jan‐09
May‐09
Sep‐09
Jan‐10
May‐10
Sep‐10
Jan‐11
May‐11
Sep‐11
Jan‐12
Profit‐Loss $/gal Ethanol $/gal Ethanol Breakeven $/gal
Ethanol Revenues & Net ReturnsEthanol Revenues & Net ReturnsISU E h l l d l ( b 1 1 )ISU Ethanol Plant Model (January 2005 – February 17, 2012)
$4.50 Preliminary February 2012Ethanol = $2.08 /g
$3.00
$3.50
$4.00
Eth
anol
t a o $ 08 /gDDGS = $0.59 /g
$1.50
$2.00
$2.50
Gal
lon
of E
Net($0.06)
$0.00
$0.50
$1.00
$ P
er G
($0.50)
Jan‐05
May‐05
Sep‐05
Jan‐06
May‐06
Sep‐06
Jan‐07
May‐07
Sep‐07
Jan‐08
May‐08
Sep‐08
Jan‐09
May‐09
Sep‐09
Jan‐10
May‐10
Sep‐10
Jan‐11
May‐11
Sep‐11
Jan‐12
DDGS Revenue$/gal Ethanol Revenue $/gal Profit‐Loss $/gal

Ethanol DDGS & Corn Input PricesEthanol DDGS & Corn Input PricesISU E h l l d l (ISU E h l l d l ( b 1 1 )b 1 1 )ISU Ethanol Plant Model (January 2005 ISU Ethanol Plant Model (January 2005 –– February 17, 2012)February 17, 2012)
Corn$$
$10.00$500
$6.45 $7.21
Feb. '12$6.31 / bu
$7.00
$8.00
$9.00
$350
$400
$450
shel
ton
$186$209
$4.00
$5.00
$6.00
$200
$250
$300
orn
$ / b
us
DD
GS
$ / t
DDGS$Feb. '12$194 /ton
$1.00
$2.00
$3.00
$50
$100
$150 CoD
$194 /ton $0.00$0
Jan‐05
May‐05
Sep‐05
Jan‐06
May‐06
Sep‐06
Jan‐07
May‐07
Sep‐07
Jan‐08
May‐08
Sep‐08
Jan‐09
May‐09
Sep‐09
Jan‐10
May‐10
Sep‐10
Jan‐11
May‐11
Sep‐11
Jan‐12
May‐12
DDGS $/ton Corn $/bu
Monthly CBOT Corn Futures Monthly CBOT Corn Futures Monthly Continuous Chart: December 2002Monthly Continuous Chart: December 2002 January 2012January 2012Monthly Continuous Chart: December 2002 Monthly Continuous Chart: December 2002 –– January 2012January 2012
Monthly CBOT Ethanol Futures Monthly CBOT Ethanol Futures Monthly Continuous Chart: December 2002Monthly Continuous Chart: December 2002 January 2012January 2012Monthly Continuous Chart: December 2002 Monthly Continuous Chart: December 2002 –– January 2012January 2012
2006
CBOT CBOT Ethanol Ethanol FuturesFuturesCl b 1Cl b 1Closes on February 23, 2012Closes on February 23, 2012
2.75Futures projecting a decline in ethanol prices into Fall 2012 corn harvest
$2 23 $2.27 $2.28 $2.31 $2.30$2.25
2.5
$2.21 $2.23 $$2.17
$2.13 $2.12
2
2.25
1.75
1.5
bʹ12 rʹ12
rʹ12
yʹ12
eʹ12
yʹ12
gʹ12
pʹ12 tʹ12
vʹ12 cʹ12
Feb
Mar
Apr
May
June
July
Aug Sep
Oct
Nov Dec

JULY JULY 2012 2012 eCBOTeCBOT Ethanol Ethanol FuturesFuturesJuly 8 2009 through February 22 2012July 8 2009 through February 22 2012July 8, 2009 through February 22, 2012July 8, 2009 through February 22, 2012
High close of $2 765 on Aug 29 2011
High: $2.765 on 8/30/11
High close of $2.765 on Aug. 29, 2011
Up since $1.63 /gal. on April 4, 2010
Low:Low: $2.13 12/15/11
Close of $2.305 on Feb. 22, 2012Low: $1.63
4/5/10
U.S. Corn U.S. Corn SupplySupply‐‐DemandDemandUSDA WASDE Report: USDA WASDE Report: February 9, 2012February 9, 2012
MY 2009/10 MY 2010/11 MY 2011/12 Planted Ac. (mln.) 86.4 88.2 91.9 Harvested Ac (mln ) 79 5 81 4 84 0Harvested Ac (mln.) 79.5 81.4 84.0 Yield (bu./ac.) Record High 164.7 152.8 147.2 Beginning Stocks 1,673 1,708 1,128 Production 13 092 12 447 12 358Production Record 13,092 12,447 12,358
Total Supplies Record 14,774 14,182 13,501 Ethanol 4,591 5,021 5,000 Other Food, Seed, Ind. 1,370 1,407 1,410 Exports 1,980 1,835 1,700 Feed & Residual 5,125 4,793 4,600 ,
Total Use 13,066 13,055 12,705 End Stocks (%S/U) (13.1%) 1,708 (8.6%) 1,128 (6.3%) 801
U.S. Avg. Farm $ $3.55 $5.18 $5.80-$6.60
U.S. Corn Use & End StocksU.S. Corn Use & End StocksMY 2004/05 h MY 2011/12MY 2004/05 h MY 2011/12MY 2004/05 thru MY 2011/12 MY 2004/05 thru MY 2011/12 February 9, 2012 USDA WASDE ReportFebruary 9, 2012 USDA WASDE Report
5 021 5 00012 000 Ethanol
1,323 1,603 2,119 3,049 3,7094,591 5,021 5,000
10,000
12,000
hels
Ethanol
Exports
1,980 1,835 1,7006,000
8,000
illio
n B
us
Feed & Residual
5,125 4,793 4,6002,114 1,967
1,304 1,624 1,673 1,7081,128 801
2,000
4,000Mi Other FSI
End Stocks
0
Marketing Years
U.S. Corn Ethanol U.S. Corn Ethanol ‐‐ FSI UseFSI UseFebruary 9, 2012 USDAFebruary 9, 2012 USDAWASDEWASDE ReportReportFebruary 9, 2012 USDA February 9, 2012 USDA WASDE WASDE ReportReport
6
7Forecast 2011/12 Ethanol Corn Use:5.000 billion bu. (39% of U.S. Corn Use)
4 595.02
5 004
5
ushels 2006/07 Ethanol-related Use of Corn:
2.12 billion bu. (19% of U.S. Corn Use)
1.322.123.053.714.59 5.00
2
3Billion Bu
0.53 0.43 0.52 0.63 1.00 1.32
0
1
2
0
1980
1981
1982
1983
1984
1985
1986
1987
1988
1989
1990
1991
1992
1993
1994
1995
1996
1997
1998
1999
2000
2001
2002
2003
2004
2005
2006
2007
2008
2009
2010
2011
2012
Marketing YearMarketing Year
Other FSI Use (Non‐ethanol) Ethanol Use

U.S. Grain Sorghum U.S. Grain Sorghum SSupplyupply‐‐DDemandemandUSDAWASDE Report:USDAWASDE Report: February 9 2012February 9 2012USDA WASDE Report: USDA WASDE Report: February 9, 2012February 9, 2012
MY 2009/10 MY 2010/11 MY 2011/12 Planted Acres (mln ) 6 6 5 4 5 5Planted Acres (mln.) 6.6 5.4 5.5 Harvested Ac. (mln.) 5.5 4.8 3.9 Yield (bu./ac.) 69.4 71.8 54.6 Beginning Stocks 55 41 27 Production 383 346 214
Total Supplies 438 387 242Total Supplies 438 387 242 Food, Seed, Industrial 90 85 90 Exports 166 150 60 F d & R id l 141 124 65Feed & Residual 141 124 65
Total Use 396 359 215 End Stocks (%S/U) (10.4%) 41 (7.5%) 27 (12.5%) 27 ( ) ( ) ( ) ( )
U.S. Avg. Farm $ $3.22 $5.02 $5.70-$6.50
U.S. Milo Use & End StocksU.S. Milo Use & End StocksMY 2004/05 h MY 2011/12MY 2004/05 h MY 2011/12MY 2004/05 thru MY 2011/12 MY 2004/05 thru MY 2011/12 February 9, 2012 USDA WASDE ReportFebruary 9, 2012 USDA WASDE Report
450
500
277
143
95
9085300
350
400
450
hels
Food, Seed & 143
166150
85
90200
250
300
illio
n B
us Industrial Use
Exports
233141
124 65
60
90
50
100
150Mi
Feed + Residual
End Stocks57 66 32 53 55 41 27 27
0
Marketing Years
Biodiesel Price, Cost & ProfitsBiodiesel Price, Cost & ProfitsISU B d l l d l (A l 1 )ISU Biodiesel Plant Model (April 2007 – January 2012)
$6.50
Price$4.69/g
$4.50
$5.50
Eth
anol
Cost
$2.50
$3.50
Gal
lon
of E
$4.46/g
$0.50
$1.50
$ P
er G
Net$0.23/g
($0.50)
Apr‐07
Jul‐07
Oct‐07
Jan‐08
Apr‐08
Jul‐08
Oct‐08
Jan‐09
Apr‐09
Jul‐09
Oct‐09
Jan‐10
Apr‐10
Jul‐10
Oct‐10
Jan‐11
Apr‐11
Jul‐11
Oct‐11
Jan‐12
Profit‐Loss $/gal Biodiesel $/gal Biodiesel Breakeven $/gal

Biodiesel Input PricesBiodiesel Input PricesISU B d l l d l (A lISU B d l l d l (A l 1 )1 )ISU Biodiesel Plant Model (April 2007 ISU Biodiesel Plant Model (April 2007 –– January 2012)January 2012)
$0.62$0.70
$0.62 $0.56
$0.50 $0.50
$0.60
und
$0.38
$0.21 $0.20$0.30
$0.40
e pe
r P
ou
$ $0.20
$0.10
$0.20
Pri
ce
$0.00
Apr‐07
Jul‐07
Oct‐07
Jan‐08
Apr‐08
Jul‐08
Oct‐08
Jan‐09
Apr‐09
Jul‐09
Oct‐09
Jan‐10
Apr‐10
Jul‐10
Oct‐10
Jan‐11
Apr‐11
Jul‐11
Oct‐11
Jan‐12
Soybean Oil $/lb. Methanol $/lb.
Impact of VEETC Removal Impact of VEETC Removal on Eon E 10 & E10 & E 8585on Eon E‐‐10 & E10 & E‐‐85 85 (Wisner, ISU)(Wisner, ISU)
Likely a small impact on E‐10L i E 8 kLarger impact on E‐85 markets
Brazilian Ethanol Imports / ExportsBrazilian Ethanol Imports / Exportsp pp p• Impact of Brazilian Ethanol Exports on the U.S.
h fl f h l h ( ) f ( ) lo The flow of ethanol either into (imports) or out of (exports) Brazil is a key issue of economic profitability for the U.S. ethanol industry
o Brazilian ethanol exports to the U.S. count against the U.S. RFS (R bl F l St d d) ti di tl ith th U S d ti(Renewable Fuels Standard) – competing directly with the U.S. domestic ethanol production industry for RFS “coverage”
• Brazil has Not Exported Large Amounts of Ethanol p gRecently o Due to high World sugar market prices ‐ It is more profitable for Brazil to
produce sugar for human consumption for the Brazilian sugar caneproduce sugar for human consumption for the Brazilian sugar cane industry than to produce ethanol for domestic & export purposes
• IF Brazilian Ethanol Exports Become Profitable.…o Would likely hurt market prices & profitability of U.S. ethanol industry
The Impact of Ethanol & Ethanol Subsidies The Impact of Ethanol & Ethanol Subsidies on Corn Prices: Revisiting Historyon Corn Prices: Revisiting Historyo Co ices: evisiti g isto yo Co ices: evisiti g isto y
Bruce Babcock & Jacinto Bruce Babcock & Jacinto FabiosaFabiosa, Iowa State University / CARD, Iowa State University / CARD
i f f i iA. The rise & fall of U.S. corn prices during 2006-2009 would have happened even without U S ethanol production expansionU.S. ethanol production expansion
B. The 2005-2007 U.S. ethanol expansion would have occurred even without U.S. ethanol subsidies due to…
L ia. Low corn pricesb. The phase-out of MTBE
Hi h d il ic. High crude oil prices

The Impact of Ethanol & Ethanol Subsidies The Impact of Ethanol & Ethanol Subsidies on Corn Prices: Revisiting Historyon Corn Prices: Revisiting History (more)(more)on Corn Prices: Revisiting History on Corn Prices: Revisiting History (more)(more)
C. U.S. corn prices rose from $2.06 /bu. in 2004 p $by an average of $1.65 /bu in 2006-09
D Of the $1 65 /bu increase in 2006 09 D. Of the $1.65 /bu increase in 2006-09….. a. $0.14 /bu (8%) from ethanol subsidies
b. $0.45 /bu (28%) from market-based expansion in U.S. ethanol industry
c. $1.06 /bu (64%) from all other non-ethanol related market factors
U.S. Biofuels Baseline & Impact of U.S. Biofuels Baseline & Impact of Extending $0.45/gal Blenders CreditExtending $0.45/gal Blenders Creditg gg gMeyer, Meyer, BinfieldBinfield & & WesthoffWesthoff, June 2011, University of Missouri , June 2011, University of Missouri / / FAPRIFAPRI
• 2011 FAPRI (MO) Baseline Grain & Biofuel 2011 FAPRI (MO) Baseline Grain & Biofuel Market Projection
Ass med C rrent U S Biof els Polic ith e piration • Assumed Current U.S. Biofuels Policy, with expiration in January 2012 of….o $0.45 /gallon ethanol tax credit (i.e., “Blenders Credits”)o $0.45 /gallon ethanol tax credit (i.e., Blenders Credits )o $0.54 / gallon special ethanol import tariff o $1.00 / gallon diesel fuel credit
Cellulosic ethanol production creditso Cellulosic ethanol production credits
• Question: Impact of extending ethanol blenders credits & import tariffs??
2011 FAPRI Study Results depend on…..2011 FAPRI Study Results depend on…..1) Macroeconomic conditions
o As of January 2011 in this study
2) How biofuels policies are implemented & market development occurs
3) Annual waivers of cellulosic biofuels mandateo Total and advanced biofuels mandates reduced in concerto Issuance of waiver credits setting price for cellulosic ethanol
RIN certificates
) f i f i i4) Most of U.S. advance biofuels not included in either cellulosic ethanol or bio-based dieselmandates is imported sugarcane ethanolmandates is imported sugarcane ethanol
Impact of Extending Blender’s CreditsImpact of Extending Blender’s CreditsMore results from Study by Meyer, More results from Study by Meyer, BinfieldBinfield & & WesthoffWesthoff, June 2011, June 2011
I. Extending the Blenders Credit & Import Tariffg pleads to …a)Expanded U.S. ethanol production – up 1.2 billion ) p p p
gallons per year, using an addition 440 million bu. annually
b)Higher U.S. corn prices – increased $0.18 / bushel
c)More U.S. corn area – up 1.7 million acres per year
d)Less U S soybean area down 800 000 acres per year d)Less U.S. soybean area – down 800,000 acres per year (biodiesel credits not extended)

Impact of Extending Blender’s CreditsImpact of Extending Blender’s Credits
II. Extending the ethanol Blenders Credit& Import Tariff leads to …& Import Tariff leads to …a)Higher Ethanol Wholesale “Rack” prices
b)L Eth l R t il ib)Lower Ethanol Retail prices
• A share of the blenders credit is passed “back” to bi f l d hil h i d “ ” t biofuel producers, while a share is passed “on” to consumers.o Some of the decline in retail prices is a result of saturation of o Some of the decline in retail prices is a result of saturation of
the low-level ethanol blends markets
o For the E-85 market to expand, the E-85 retail price paid by consumers must move below energy equivalence for a consumers must move below energy equivalence for a period of time
Thoughts: The Future of U.S. EthanolThoughts: The Future of U.S. Ethanolgg• Less U.S. government financial support for domestic ethanol production in the futurepo Tighter federal budgets
o Uncertainty about the U.S. public’s acceptance of /government / EPA environmental & energy regulation in the future
• Expansion of U.S. ethanol production likely to moderate / slow d i h fdown in the futureo Impact of declining financial support & protectionist policy from the
U.S. government in coming years
o U.S. ethanol industry likely to enter a “maturity” phase
• Low cost, efficient producers or those with strategic input/output market advantages survivestrategic input/output market advantages survive
More Thoughts Re: EthanolMore Thoughts Re: Ethanolgg• Future Economics of Ethanol Dependent on Long Term Health of U S EconomyHealth of U.S. Economyo Energy prices & ethanol profits follow +/‐ trends in U.S. economy
o IF a second recessionary phase occurs in the U S in next few yearso IF a second recessionary phase occurs in the U.S. in next few years, THEN demand & price of gasoline would be negatively affected
• Could hurt U.S. ethanol industry profitability as did U S economic problems in later 2008 early 2009U.S. economic problems in later 2008‐early 2009
• The U.S. Ethanol Industry is an “Uber Competitive” Group of “Entrepreneurs”Uber‐Competitive Group of Entrepreneurso Even with likely cutbacks in U.S. government support, U.S. ethanol
industry would be expected to strongly compete & innovate to gain technical efficiencies for the sake of its economic sustainability
QuestionsQuestions??QuestionsQuestions??Daniel M. O’Brien, Ph.D.Daniel M. O Brien, Ph.D.
Extension Agricultural EconomistK-State Research & ExtensionK State Research & Extension
Grain Market Analysis information is available on
www.agmanager.info