ethanol fuel from biomass: a review · journal of scientific & industrial research vol. 64,...
TRANSCRIPT

Journal of Scientific & Industrial Research Vol. 64, November 2005, pp. 809-821
Ethanol fuel from biomass: A review
Edgard Gnansounou1,* and Arnaud Dauriat2
1Laboratory of Energy Systems (LASEN), ICARE-ENAC, Swiss Federal Institute of Technology of Lausanne (EPFL)
2ENERS Energy Concept
This paper presents a general review of biomass-to-ethanol, analysis of conversion pathways from technical, economic and environmental points of view, and estimation of production cost in the Indian context. Due to learning curve and other economic reasons, Brazil and the United States are found to be more competitive worldwide and will maintain their comparative advantage in the next decade. However, the fast growth of the world demand of bio-ethanol fuel as well as the perspectives of the oil market may notably influence the international market price of bio-ethanol fuel and give windows for a wide scale production in other regions such as Europe and Asia. As one of the major producers and consumers of sugars and the second populous country, India gives a high priority to food production. However, Indian production of bio-ethanol can be envisaged successfully and preliminary analyses exhibit a promising avenue. In long term, lignocellulose-to-ethanol is the most viable pathway from environmental point of view. However, its production cost must be reduced for giving this process a chance to drive forward the strategy of biomass-to-ethanol worldwide.
Keywords: Biomass, CO2 emissions reduction, Ethanol, Motor fuels, Renewable energy
IPC Code: C10L1/02
Introduction Ethanol (ethyl alcohol, C2H5OH, m p –114°C,
bp 78.4 °C) is soluble in water and has a density of 789 g/l at 20°C. Catalytic hydration of petroleum products (ethylene) produces synthetic ethanol.
EthanolSteamEthylene
OHCHCHOHHC 23242 →+
Bio-ethanol is derived from alcoholic fermentation of sucrose or simple sugars, which are produced from biomass. Absolute and 95% ethanols are good solvents and are used in many industrial products such as paints, perfumes and tinctures. Solutions of ethanol (70-85 %) are used as disinfectants in medicine. Except for the uses in motor fuels, synthetic ethanol got the largest market share in industrial applications, as it is cheaper than ethanol derived from biomass. Bio-ethanol however captures the alcoholic beverages market and a small share of the vehicle fuels market. Ethanol intended to non-food uses is made unfit for human absorption by addition of small amounts of toxic or unpleasant substances such as methanol or gasoline.
In this paper, the background of bio-ethanol as a fuel for transport is analyzed with the aim of examining the conditions and long term perspectives of its penetration in the motor fuels market. According to the Wikipedia encyclopaedia1, the use of ethanol as a fuel has a long history record, starting in 1826 when Samuel Morey fuelled the first American internal combustion engine prototype with ethanol. In 1899, the German Government supported ethanol through subsidies, equalizing its price with that of gasoline. In 1902, during the Paris alcohol fuel exhibition, ethanol powered cars were presented. In 1908, the Ford model T entered the market and could run on ethanol or gasoline. In 1925, some countries (Brazil, France and Germany) imposed to the retailers of gasoline the blending of ethanol with all gasoline sold. Till the late 1930s, ethanol fuel competed with gasoline. However, with the discovery of many cheap oil fields, ethanol progressively lost its market share during 1940s. The renewal of ethanol fuel dated to 1973. During the first worldwide oil crisis, ethanol became cheaper than gasoline, leading the Brazilian government to launch, in 1975, Pro-alcohol, the largest nation-wide strategic programme for production and use of ethanol as an alternative motor fuel. In the United States, the Energy Tax Act of 1978, exempted E10 (10% of bio-ethanol blends with gasoline, v/v) from excise tax. Later, another US federal programme guaranteed loans for investment in
________
*Author for correspondence
Tel: (+41) 21 693 06 27; Fax: (+41) 21 693 28 63
E-mail: [email protected]
J SCI IND RES VOL 64 NOVEMBER 2005
810
ethanol plants construction. Brazil and the US still are the two main producers and users of bio-ethanol worldwide.
The main reasons of the glory of bio-ethanol are the following: (i) Use as octane enhancer in unleaded gasoline in place of the methyl tertio butyl ether (MTBE); (ii) Use as oxygenated compound for cleaning combustion of the gasoline and improving the air quality; (iii) Use as alternative fuel for reducing CO2 emission and limiting risk of climate change; and (iv) Use as renewable energy to partly substitute oil and increase security of supply.
Conversion Process Pathways Feedstocks
Bio-ethanol can be produced from a large variety of carbohydrates (mono-, di-, polysaccharides). Monosaccharides (glyceraldehydes, xylose, ribose, glucose, fructose) consist of single sugars bound together with a general formula of (CH2O)n, where n = 3-7. The most common monosaccharides in nature are pentoses (n = 5, xylose) and hexoses (n = 6, glucose). When glucose is the most widespread sugar transport form in animal organisms, in the plants, sugar is often transported in the form of disaccharides (sucrose, maltose and lactose). One molecule of disaccharide results from a chemical reaction (dehydration synthesis) in which a new bond is formed between two monosaccharides after removal of one molecule of water. Polysaccharides are often organised as chains of bonded monosaccharides molecules, which result from dehydration syntheses. Polysaccharides composed of similar subunits (monomers) are called polymers. Starch and cellulose are polymers composed of monomers of glucose. Polysaccharides must be decomposed in disaccharides and/or monosaccharides through hydrolysis before fermentation to ethanol.
Large-scale biomass-to-ethanol industry mostly uses sugarcane or sugar beet juice, corn or wheat. Ethanol is also commercially produced in the pulp and paper industry as a by-product. Lignocellulosic biomass is envisaged to provide a significant portion of the feedstocks for bio-ethanol production in the medium and long term due to their low cost and to their high availability. For a given production line, the comparison of feedstocks includes chemical composition of the biomass, cultivation practices, availability of land and land use, use of resources, energy balance, emission of greenhouse gases, acidifying gases, ozone depletion gases, emissions of
minerals to water and soil, emission of pesticides, soil erosion, contribution to biodiversity and landscape value losses, farm-gate price of the biomass, logistic cost (transport and storage of the biomass), direct economic value of the feedstocks taking into account the co-products, creation or maintain of employment. Different authors have proposed criteria and methodologies for assessing the sustainability of energy crops2,3.
Biomass-to-ethanol crops comprise: (i) Multipur-pose crops that are also devoted to food markets; and (ii) Dedicated ethanol crops. While the latter are cultivated especially for ethanol production on non-agricultural lands (fallow or undeveloped lands), the former provide almost all the feedstocks used to date for ethanol production (sugarcane in Brazil and corn in the United States). In most industrialized countries, the development of biomass-to-ethanol conversion emerged as alternative markets for sugar and grain surpluses. As the feedstock cost often represents more than 75 percent of the ethanol production in these cases, the economic viability of multipurpose crops-to-ethanol depends on the food markets situations (sugar and grain markets). This correlation between food and ethanol markets may generate a volatility of the ethanol prices. In developing countries, the possible competition with food is one of the risks when using agricultural crops for ethanol production. Thus this option should be limited to cases where actual and sustainable surplus of crops occurred. Finally, ethanol production cost is scale sensitive. Feedstock and investment cost affect economy of scale in different ways. Marginal costs of feedstock collection and transport increase with the size of the ethanol plant whereas marginal investment cost decreases. Optimal sizes (50-500 million l/y) of ethanol plants depend on the particular context under study (availability of feedstocks, demand of ethanol, cost of transport and storage).
Main Steps in Biomass-to-Ethanol Processes
Once the biomass is delivered to the ethanol plant, it is stored in the warehouse and conditioned to prevent from early fermentation and bacterial contamination (Fig. 1). Through pre-treatment, carbohydrates are extracted or made more accessible for further extraction. During this step, simple sugars may be made available in proportions depending on the biomass and the pre-treatment process. A large portion of fibres may remain for saccharification through hydrolysis reactions or other techniques, in

GNANSOUNOU & DAURIAT: ETHANOL FUEL FROM BIOMASS: A REVIEW
811
order to obtain simple sugars, which are then fermented.
In the batch fermentation, the hydrolysate, the yeasts, nutrients and other ingredients are added from the beginning of the step. In case of a fed batch process, one or more inputs are added as fermentation progresses. Continuous processes, in which ingredients are constantly input and products removed from the fermentation vessels, are also used4. In efficient processes, the cell densities are made high by recycling or immobilising the yeasts in order to improve their activity and increase the fermentation productivity. The fermentation reactions occur at 25-30oC and last 6-72 h depending on the composition of the hydrolysate, the type, the density and activity of the yeasts. The broth typically contains 8-14 % v/v ethanol. Above this concentration, inhibition of yeasts may occur that reduces their activity. Distillation yields an azeotropic mixture (95.5% alcohol, 4.5% water) often termed "hydrous" or “hydrated” ethanol, which is then dehydrated to give "anhydrous" ethanol (99.6% alcohol, 0.4% water).
The remaining flow from the distillation column, known as vinasse or stillage, can be valorised to produce co-products, which may include process steam and electricity, products for feeding animals, more or less concentrated stillage used as fertiliser and other valuable by-products.
Disaccharides-to-Ethanol Process
The most common disaccharide used for bio-ethanol production is sucrose, which is composed of
glucose and fructose. Fermentation of sucrose is performed using commercial yeast such as Saccharomyces ceveresiae. Chemical reaction is composed of enzymatic hydrolysis of sucrose followed by fermentation of simple sugars. First, invertase (an enzyme present in the yeast) catalyzes the hydrolysis of sucrose to convert it into glucose and fructose.
invertase12 22 11 2 6 12 6 6 12 6C H O + H O C H O + C H O
Sucrose Glucose Fructose
→
Then, another enzyme (zymase), also present in the yeast, converts the glucose and the fructose into ethanol and CO2.
zymase6 12 6 3 2 2C H O 2 CH CH OH + 2 CO
Glucose Ethanol
or Fructose
→
Theoretically, 1 ton of hexose (glucose or fructose) yields 511 kg of ethanol. However, practical efficiency of fermentation is about 92 percent of this yield. Sucrose comes mainly from sugarcane and sugar beet. It may be sweet sorghum. Bio-ethanol (> 60%) fuel worldwide comes from sugarcane juice, which is extracted from fibre using either a series of tandem roller mills or a diffuser technology (Fig. 2). The extracted juice contains water (84%) and sugars (14%). Next steps depend on whether ethanol is produced alone or with sugar (Fig. 3). After purification and evaporation, juice passes in the
Fig. 1 — Schematic outline of biomass-to-ethanol process

J SCI IND RES VOL 64 NOVEMBER 2005
812
crystallisation step. In addition to the crystalline sugar, molasses are obtained as a by-product and may then be fermented, distilled and dehydrated to yield anhydrous ethanol.
Starch-to-Ethanol Process
Starch stored in grains is long chains of α-glucose monomers, 1000 or more monomers for one amylose molecule and 1000 to 6000 or more monomers for amylopectin5. To convert starch to ethanol, polymer
of α -glucose is broken into glucose through a hydrolysis reaction with gluco-amylase enzyme.
612625106 )( OHCnOHnOHCamylasegluco
n →+ −
The resulting sugar is known as dextrose or D-glucose that is an isomer of glucose. The enzymatic
hydrolysis is then followed by fermentation, distillation and dehydration to yield anhydrous ethanol. In the bio-ethanol fuel industry, grains (corn, wheat or barley) mainly provide starch. Corn (60-70% starch) is the dominant feedstock in starch-to-ethanol industry worldwide. In dry milling process, grain is grinded to a powder which is hydrolysed and the sugar contained in the hydrolysate is converted to ethanol while the remained flow containing fibre, oil and protein is dried and converted into a by-product known as Distillers Dried Grains (DDG) or DDGS when it is combined to process syrup. DDGS is a very valuable by-product of dry mills sold as animal feed. Another by-product may be the CO2 that can be sold for different applications (carbonated beverages or dry ice). Dry mills are dominant in Grain-to-Ethanol
Fig. 2 — Mass balance of sugarcane juice extraction
Fig. 3 — Joint sugar and ethanol production
GNANSOUNOU & DAURIAT: ETHANOL FUEL FROM BIOMASS: A REVIEW
813
Industry. However, in a number of large facilities, the mills are kinds of bio-refineries in which the grains are wet milled for separating first the different components (i.e. starch, protein, fibre and germ) before converting these intermediates into final co-products.
Lignocellulosic-to-Ethanol Process
Structure of Lignocellulosic Materials
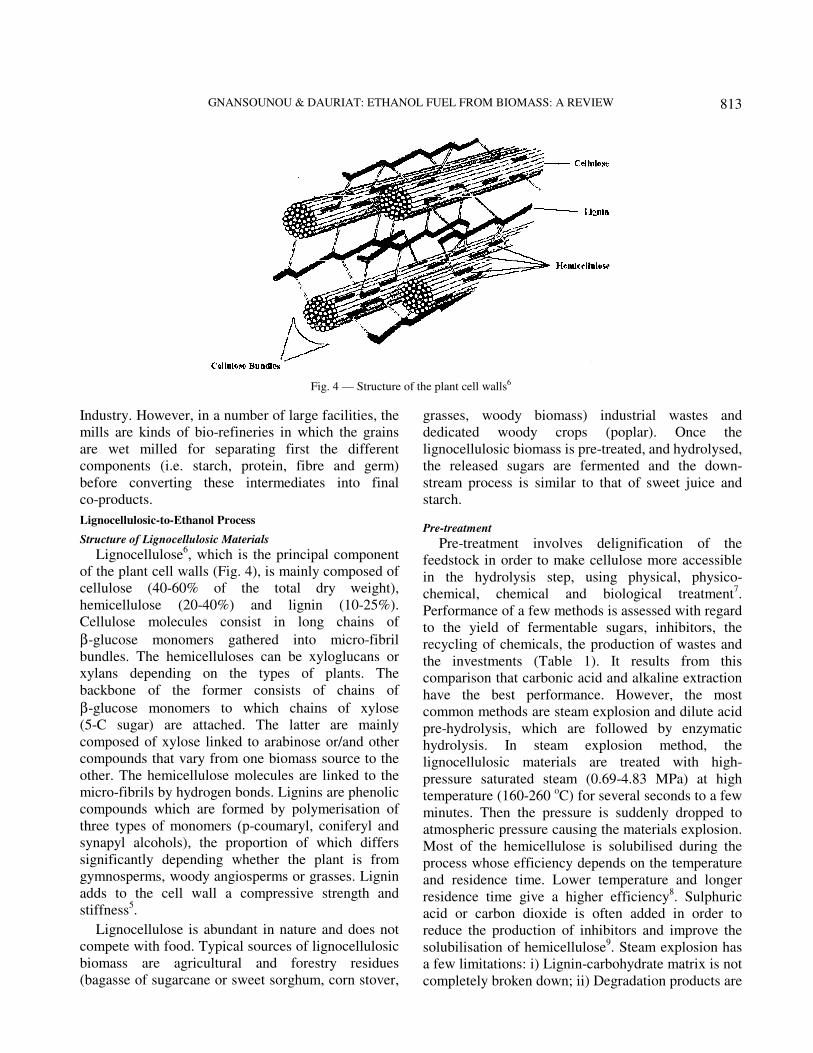
Lignocellulose6, which is the principal component of the plant cell walls (Fig. 4), is mainly composed of cellulose (40-60% of the total dry weight), hemicellulose (20-40%) and lignin (10-25%). Cellulose molecules consist in long chains of
β-glucose monomers gathered into micro-fibril bundles. The hemicelluloses can be xyloglucans or xylans depending on the types of plants. The backbone of the former consists of chains of
β-glucose monomers to which chains of xylose (5-C sugar) are attached. The latter are mainly composed of xylose linked to arabinose or/and other compounds that vary from one biomass source to the other. The hemicellulose molecules are linked to the micro-fibrils by hydrogen bonds. Lignins are phenolic compounds which are formed by polymerisation of three types of monomers (p-coumaryl, coniferyl and synapyl alcohols), the proportion of which differs significantly depending whether the plant is from gymnosperms, woody angiosperms or grasses. Lignin adds to the cell wall a compressive strength and stiffness5.
Lignocellulose is abundant in nature and does not compete with food. Typical sources of lignocellulosic biomass are agricultural and forestry residues (bagasse of sugarcane or sweet sorghum, corn stover,
grasses, woody biomass) industrial wastes and dedicated woody crops (poplar). Once the lignocellulosic biomass is pre-treated, and hydrolysed, the released sugars are fermented and the down-stream process is similar to that of sweet juice and starch.
Pre-treatment
Pre-treatment involves delignification of the feedstock in order to make cellulose more accessible in the hydrolysis step, using physical, physico-chemical, chemical and biological treatment7. Performance of a few methods is assessed with regard to the yield of fermentable sugars, inhibitors, the recycling of chemicals, the production of wastes and the investments (Table 1). It results from this comparison that carbonic acid and alkaline extraction have the best performance. However, the most common methods are steam explosion and dilute acid pre-hydrolysis, which are followed by enzymatic hydrolysis. In steam explosion method, the lignocellulosic materials are treated with high-pressure saturated steam (0.69-4.83 MPa) at high temperature (160-260 oC) for several seconds to a few minutes. Then the pressure is suddenly dropped to atmospheric pressure causing the materials explosion. Most of the hemicellulose is solubilised during the process whose efficiency depends on the temperature and residence time. Lower temperature and longer residence time give a higher efficiency8. Sulphuric acid or carbon dioxide is often added in order to reduce the production of inhibitors and improve the solubilisation of hemicellulose9. Steam explosion has a few limitations: i) Lignin-carbohydrate matrix is not completely broken down; ii) Degradation products are
Fig. 4 — Structure of the plant cell walls6

J SCI IND RES VOL 64 NOVEMBER 2005
814
generated that reduce the efficiency of hydrolysis and fermentation steps; and iii) A portion of xylan fraction is destroyed.
The use of dilute acid has the preference of the US National Renewable Energy Laboratory10,11. In this method, the structure of the lignocellulosic materials is attacked with a solution of sulphuric acid (0.5-1.0%) at about 160-190 oC for approx 10 min. During this reaction, hemicellulose is largely hydrolysed releasing different simple sugars (xylose, arabinose, mannose and galactose) but also other compounds of the cellulosic matrix, a few of which can inhibit the enzymatic hydrolysis and fermentation. The stream is then cooled. Part of the acetic acid, much of the sulphuric acid and other inhibitors produced during the degradation of the materials are removed. Finally, neutralisation is performed and pH is set to 10 before hydrolysis and fermentation.
Enzymatic Hydrolysis of Cellulose and Fermentation of Simple
Sugars
Enzymatic hydrolysis of cellulose is achieved using cellulases, which are usually a mixture of groups of enzymes such as endoglucanases, exoglucanases and
β-glucosidases acting in synergy for attacking the crystalline structure of the cellulose, removing cellobiose from the free chain-ends and hydrolysing cellobiose to produce glucose. Cellulases are produced by fungi, mainly Trichoderma reesei, besides Aspergillus, Schisophyllum and Penicillium. Efficiency of cellulose enzymatic hydrolysis is affected by the substrate to enzyme ratio, cellulase
dosage and the presence of inhibitors. Cellulase loading may vary from 7 to 33 FPU/g (substrate) depending on the substrate structure and concentration7. High concentration of cellobiose and glucose inhibits the activity of cellulase enzymes and reduces the efficiency of the saccharification. One of the methods used to decrease this inhibition is to ferment the reduced sugars along their release. This is achieved by simultaneous saccharification and fermentation (SSF), in which fermentation using yeasts (Saccharomyces cerevisiae) and enzymatic hydrolysis are achieved simultaneously in the same reactor. The fermentation of the xylose released from the pre-hydrolysis process can be carried out in a separate vessel or in SSF reactor using a genetically modified strain from the bacterium Zymomonas
mobilis that can convert both glucose and xylose. The latter method is named simultaneous saccharification and co-fermentation (SSCF).
Compared to the sequential saccharification and fermentation process, SSCF exhibits several advantages like lower requirement of enzyme, shorter process time and cost reduction due to economy in fermentation reactors (only one reactor compared to the three sets). However, a few disadvantages include the difference between optimal temperatures for saccharification (50-60oC) and fermentation (30oC), inhibition of enzymes and yeast to ethanol and the insufficient robustness of the yeast in co-fermenting C5 and C6 sugars. The main co-product of lignocellulose conversion to ethanol is energy. The
Table 1 — Advantages and weaknesses of selected pre-treatment processes
Pre-treatment process Yield of fermentable sugars
Inhibitors Chemical recycling
Wastes Investment
Physical
- Mechanical
-
++
++
++
+
Physico-chemical
- Steam explosion
- Ammonia fiber explosion (AFEX)
- Carbonic Acid
+
+/-
++
--
++
++
++
--
++
+ +
++
-
-
+
Chemical
- Dilute acid
- Concentrated acid
- Alkaline extraction
- Wet oxidation
- Organosolv
++
++
++/+
+/-
++
--
--
++
+
++
--
--
--
++
--
-
-
-
+
+
+/-
-
++
+
--
++: very good with regard to; +: good with regard to; -: bad with regard to; --: very bad with regard to
(Inspired from de Bont J A M & Reith J H, The Netherlands, personal communication)

GNANSOUNOU & DAURIAT: ETHANOL FUEL FROM BIOMASS: A REVIEW
815
effluent from the distillation column that contains most of the lignin and other non-fermentable products is sent to a combined heat and power (CHP) plant to produce process steam and electricity required by the ethanol plant. Depending on the proportion of lignin in the feedstock, excess electricity may be available for export sale.
Development and Deployment
Contrary to the conversion of sweet juice and that of starch to ethanol which are mature technologies, modern lignocellulose-to-ethanol process still is on pilot and demonstration stage. NREL (USA) has built a pilot plant based on SSCF method capable to process one ton of dry material per day12. Iogen Corporation (Canada) built in 2003 a demonstration plant with an annual production of 320,000 litres of ethanol, using wheat straw as feedstock and a sequential steam explosion pre-hydrolysis – cellulose production – enzymatic hydrolysis of cellulose and co-fermentation of xylose and glucose. In 2004, a Sweden company, ETEK, has developed a pilot plant capable to produce 150,000 litres of ethanol per year using soft wood as feedstock13.
Use of Bio-Ethanol in Spark Ignition Internal Combustion
(IC) Engines
Ethanol has good properties for spark ignition IC engines. Its Motor Octane Number (MON) and Research Octane Number (RON) are respectively 90 and 109 leading to an average octane number of 99 compared to 88 for regular gasoline. Lower heating value (LHV) of ethanol (21.2 MJ/l) is two-thirds that of gasoline (30.1 MJ/l). Bio-ethanol fuel is used in IC engines as 5-26 percent anhydrous ethanol blends to gasoline (5% maximum in Europe and in India, 10% in USA, 22-26% mandatory blends in Brazil) or as pure fuel (100%) of hydrated ethanol in dedicated vehicles. When anhydrous bio-ethanol is blended to gasoline in small proportion (up to 15%), influence of lower LHV has no significant effect. For higher blend levels, fuel economy is reduced compared to that with conventional gasoline.
Ethanol dedicated vehicles are optimised so that the engine efficiency is improved by running at higher compression ratios to take advantage of the better octane number of ethanol compared to gasoline. Therefore, for pure hydrated ethanol used in optimised vehicles, ethanol can achieve about 75 percent or more of the range of gasoline on a volume basis.
Finally, special vehicles known as Flexible Fuelled Vehicles (FFV) are equipped with line sensors, which measure ethanol levels and adapt air-fuel ratio to maintain good combustion conditions. These vehicles can burn fuel containing ethanol (0-85%) in gasoline and are becoming more and more frequent in Brazil and Sweden with various manufacturers developing such vehicles on commercial scale. As compression ratio cannot be adapted in case of FFV, the reduction in fuel economy is somewhat proportional to the bio-ethanol content in the fuel blend. Apart from this issue, use of bio-ethanol in IC engines exhibits a few disadvantages: (i) Low levels of ethanol blended with gasoline increases vapour pressure and favour evaporative emissions that contribute to smog formation, and (ii) For higher ethanol blend levels, vapour pressure drops significantly leading to more difficulty in cold weather conditions.
Use of Ethanol in Compression Ignition (CI) Engines
Due to its low cetane number, ethanol does not burn efficiently by compression ignition. Moreover, ethanol is not easily miscible with diesel fuel. Three directions are followed to improve the use of ethanol in CI vehicles. The first that consists in direct blend of ethanol with diesel needs addition of an emulsifier in order to improve ethanol-diesel miscibility. Other additives are used such as ethylhexylnitrate or diterbutyl peroxide in order to enhance the cetane number. Most of blends of ethanol to diesel (E-diesel) limit by up to 15 percent ethanol and up to 5 percent emulsifiers14. The second way is a dual fuel operation in which ethanol and diesel are introduced separately into the cylinder15. Finally, modification of diesel engines has been experienced in order to adapt their characteristics of auto-ignition and make them capable to use high blends such as 95% ethanol.
Economics and Environmental Issues
Production Costs
Production cost (Table 2) of bio-ethanol fuel depends on many factors (conversion pathway, plant size and location, feedstock and co-products markets) that may vary from one country to the other, and in the same country, projects may have different production costs: (i) Ethanol derived from sweet juice is commonly cheaper than the others; (ii) Production in America (Brazil and USA) is less expensive than that in Europe due to learning curve and other differences in expenditures; (iii) Brazil offers the cheapest ethanol worldwide; (iv) Economy of scale

J SCI IND RES VOL 64 NOVEMBER 2005
816
and learning curve are dominant explanation factors of difference in production costs; (v) Possibility to valorise co-products contributes to reduce the production cost of bio-ethanol; and vi) Ethanol derived from lignocellulose is becoming competitive with ethanol from corn and although its production cost is based on engineering estimates as no commercial plant exists, research progress has already decreased significantly the production cost of enzyme and the investment, two major components of the expenditures in case of lignocellulose-to-ethanol.
Competitiveness
Assuming that the production cost of gasoline is 0.20-0.25 US$ (2000) /l, it comes out that on volume basis, apart from Brazil, bio-ethanol is not presently competitive. The situation is worse on an energy basis, as LHV of ethanol is one-third lower than that of gasoline (although at lower incorporation rates, this aspect has little or even no effect). Therefore, in many countries, government grants subsidies and tax reductions in order to promote penetration of bio-ethanol. Another way to promote bio-ethanol introduction in the market is to cross-subsidise ethanol by fossil fuel. This approach increases the price of fuel for consumers and is neutral from a taxation point of view. When the difference between
the production cost of ethanol and fossil fuels is low and the blend level is about 5 percent, the increase in price is not significant as the oil price is very volatile. In case of high ethanol production cost as in Europe, direct incentives are required in order to make ethanol introduction acceptable for most of consumers.
Energy Balance
The net energy balance of biomass-to-ethanol measures (Fig. 5), from a life cycle assessment (LCA) viewpoint, the ratio of the energy content of bio-ethanol to the net non renewable primary energy (allocated to ethanol) consumed in the whole production process from biomass production to its conversion into ethanol. As the approach is LCA oriented, the energy input must be estimated in terms of primary energy. On average, the ratio (output/input) between the produced ethanol and the input of non-renewable energy varies from 1.2 to 3.0 or more. These values depend on the following factors: (i) Allocation between ethanol and the co-products; (ii) The use of renewable energy for fuelling the process; (iii) The agricultural practices for producing the feedstock; (iv) The energy integration within the production plant; (v) The size of the plant; (vi) Transport distances between the plant; and (vii) The area of biomass collection. Recycling the
Table 2 — Synthesis on typical bio-ethanol fuel production cost
Reference Feedstock Country or region Range of sizes Million l/y
Production cost US$ (2000)/l
Waltera
ASIATIC16
ASIATIC
F.O. Lichts17
F.O.Lichts
Sweet juice
Sugarcane
Molasses
Sweet sorghum
Sugar beet
Sugar beet
Brazil
China
China
Germany
Germany
-
125
125
50
200
0.17 – 0.19
0.30
0.27
0.88
0.77
F.O. Lichts
ASIATIC
ASIATIC
F.O. Lichts
F.O. Lichts
Starch
Corn
Corn
Cassava
Wheat
Wheat
USA
China
China
Germany
Germany
53
125
125
50
200
0.32
0.31
0.23
0.55
0.48
NREL (1999)
NREL (2002)
ASIATIC
Lignocellulose
Yellow poplar
Corn stover
Bagasse of sweet sorghum
USA
USA
China
197
262
125
0.38
0.28
0.30
a) Walker A, Experience with large-scale production of sugar cane and plantation wood for the export market in Brazil; impacts and lessons learned (personal communication in Workshop on International bio-energy Trade and Development, Washington DC) March, 2005.
GNANSOUNOU & DAURIAT: ETHANOL FUEL FROM BIOMASS: A REVIEW
817
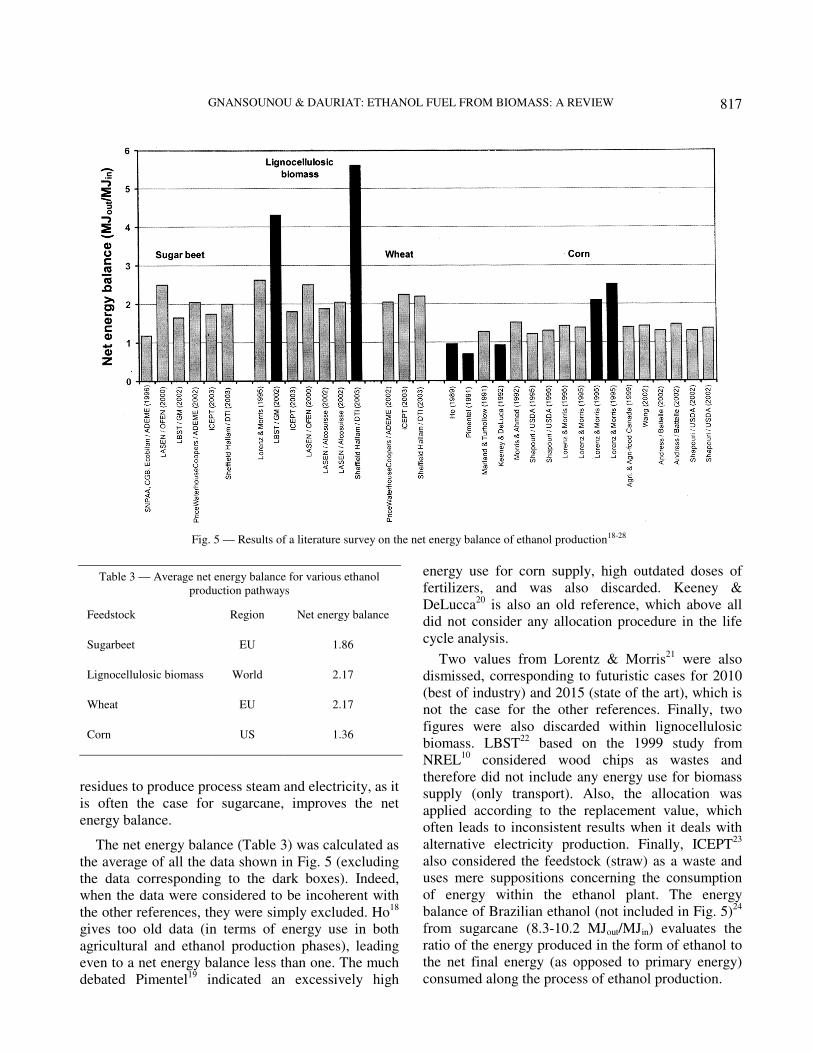
residues to produce process steam and electricity, as it is often the case for sugarcane, improves the net energy balance.
The net energy balance (Table 3) was calculated as the average of all the data shown in Fig. 5 (excluding the data corresponding to the dark boxes). Indeed, when the data were considered to be incoherent with the other references, they were simply excluded. Ho18 gives too old data (in terms of energy use in both agricultural and ethanol production phases), leading even to a net energy balance less than one. The much debated Pimentel19 indicated an excessively high
energy use for corn supply, high outdated doses of fertilizers, and was also discarded. Keeney & DeLucca20 is also an old reference, which above all did not consider any allocation procedure in the life cycle analysis.
Two values from Lorentz & Morris21 were also dismissed, corresponding to futuristic cases for 2010 (best of industry) and 2015 (state of the art), which is not the case for the other references. Finally, two figures were also discarded within lignocellulosic biomass. LBST22 based on the 1999 study from NREL10 considered wood chips as wastes and therefore did not include any energy use for biomass supply (only transport). Also, the allocation was applied according to the replacement value, which often leads to inconsistent results when it deals with alternative electricity production. Finally, ICEPT23 also considered the feedstock (straw) as a waste and uses mere suppositions concerning the consumption of energy within the ethanol plant. The energy balance of Brazilian ethanol (not included in Fig. 5)24 from sugarcane (8.3-10.2 MJout/MJin) evaluates the ratio of the energy produced in the form of ethanol to the net final energy (as opposed to primary energy) consumed along the process of ethanol production.
Fig. 5 — Results of a literature survey on the net energy balance of ethanol production18-28
Table 3 — Average net energy balance for various ethanol production pathways
Feedstock Region Net energy balance
Sugarbeet EU 1.86
Lignocellulosic biomass World 2.17
Wheat EU 2.17
Corn US 1.36

J SCI IND RES VOL 64 NOVEMBER 2005
818
Greenhouse Gas Balance
The average net CO2 balance of bio-ethanol production is not presented here, because of the additional issues of system boundaries and variations of the incorporation rate of ethanol to gasoline. Indeed, if the common practice for comparing the net energy balance of ethanol to that of conventional fossil fuels does not generally include the utilization phase of the fuels (although it should be), it is more often the case as far as the CO2 balance is concerned. In such a case, the incorporation rate of ethanol within gasoline (and thereby the performance of the blend) is of major importance, although often neglected, which makes it even more difficult to compare the results of different studies. The Laboratory of Energy Systems (LASEN) of the Swiss Federal Institute of Technology of Lausanne (EPFL), Switzerland, has conducted various studies concerned with the life cycle assessment of various pathways of ethanol production and use. With an incorporation rate of 5% anhydrous ethanol within gasoline and an equal performance with respect to conventional gasoline, the net savings of greenhouse gas (GHG) emissions were found to vary between 2.0 (agricultural feedstocks) and 2.5 (waste lignocellulosic biomass) kg of CO2 eq. per litre of ethanol incorporated to gasoline. In these evaluations, the life cycle inventory was described in the context of Switzerland with economic allocation, and the reference vehicle was a recent standard 1.6 l light passenger vehicle27,28.
Other Environmental Effects
As ethanol contains more oxygen than gasoline, its use favours more complete combustion and reduces the emissions of particulate matter (PM) and hydrocarbons (HC), which result from incomplete combustion of gasoline. Tailpipe emissions of carbon monoxide (CO) and sulphur dioxide (SO2) are also improved. However, low levels blends of ethanol with gasoline can increase the emissions of volatile compounds (VOCs) and nitrogen oxides (NOx). These emissions favour ozone formation. Emissions of aldehydes (mostly acetaldehydes) and peroxyacetyl nitrate (PAN) also increase to an extent that depends on weather conditions. The use of catalytic converters reduces the emissions of aldehydes. Reducing in refinery the vapour pressure of gasoline, which is blended with ethanol, can prevent VOCs emissions. Experiments about different percentages of ethanol-diesel blends show significant advantages concerning PM, NOx and CO. However, no evidence is given for
improvement of HC emissions29. Ethanol is more corrosive than gasoline and diesel, and at high concentration, can damage fuel system components. For low-levels blends, these concerns are limited and E5 or E10 can operate on existing vehicles without violating most of manufacturers' warranties. For high concentrations of ethanol, compatible materials are used in dedicated designed vehicles.
Outlook of Bio-ethanol Fuel Market Worldwide
and Case of India
Present and Future World Market
In 2004, total production of bio-ethanol fuel worldwide was 32,000 million l (Brazil, 47%). In 2004, about 12,500 million litres of bio-ethanol fuel were consumed in Brazil and 2,500 million l were exported at an average price of 0.21 US$/l. India was the first importer of Brazilian ethanol (23%) followed by US (20%). In US, bio-ethanol fuel production grew from virtually nothing in 1980 to about 12,900 million l in 2004. Although Brazil and US produced bio-ethanol fuel (87%) worldwide in 2004, other countries and regions are emerging and will play a significant role in the future market. The European Union Member States have produced about 500 million l in 2004. Asia is another region where bio-ethanol fuel market is growing up very fast. China has launched bio-ethanol fuel in a few provinces based on corn starch. India and Thailand are also experiencing a bio-ethanol program at a wide scale.
The bio-ethanol demand will grow very fast till 2015. The driving factors of such evolution are the following: (i) Ban of MTBE in gasoline and new legislation favourable to bio-fuels in the US; (ii) Fast growth of Flexible Fuel Vehicles in Brazil and in other countries; (iii) European Directive on motor bio-fuels; and (iv) Introduction of E10 in China and likely in India, Thailand and other Asian countries. The world demand of bio-ethanol fuel in 2015 could amount to about 65,000 million l, about twice the demand in 2004. The US and Brazil would account for 30 percent each followed by European Union (15%), Asia (15%) and rest of the world (10%). For meeting this demand, the international trade would progress with Brazil as the major player. The Brazilian exports could grow from 2,500 million l in 2004 to 6000 million l in 2015.
Background of the Indian Case
Indian demand of fossil motor fuels amounts to 2.3 EJ in 2004 (diesel, 83%; gasoline, 17%). Due to rapid

GNANSOUNOU & DAURIAT: ETHANOL FUEL FROM BIOMASS: A REVIEW
819
growth of the transport sector, this demand could reach 4.0 EJ in 2010. In 2004, India imported 90 million tons of crude oil and imports will continue to increase fast causing a significant burden on the balance of trade and energy security. Wide scale introduction of bio-ethanol as fuel for automotive will improve the diversity of Indian energy supply. In a first step, bio-ethanol should replace MTBE in gasoline and be further blended to diesel at a less extent. Since 2003, India has been experiencing the use of E5. It is assumed in this paper that in 2015, E10 will be generalised and 5 percent of ethanol will be blended with diesel. The estimated ethanol fuel demand in 2015 could be 6,730 million l. Due to the concentration of the production in few countries, it is worthwhile to envisage a large-scale production of bio-ethanol in India.
Economic Viability of Bio-ethanol Production in India
The data for calculating the production cost in the context of India were adapted from data for China (ASIATIC). Operating costs (fixed and variable, including feedstock costs and by-products credit) were derived by applying a currency conversion rate taking into account the purchasing power parity (PPP). Investment costs were considered not to be affected by PPP and were obtained by using standard conversion rates. The costs in Indian Rs (2000) were then expressed in US$ (2000). The data (Table 4) refers to a 125 million l/y (or 100’000 ton/y) ethanol plant.
Production of Bio-ethanol from Sugarcane Molasses
It is assumed that the ethanol production plant is attached to a sugar refinery. Such a configuration, indeed, allows a better synergy between the two plants and an optimization of the existing infrastructure in the sugar refinery (storage, buildings and offices, employees, land, etc.). Furthermore, the flexibility with respect to the ratio of the production of molasses to that of sugar, though limited, may allow the sugar refiner to slightly increase the production of ethanol when conditions turn out to be more favourable for the alcohol than for sugar.
With a total project investment of 21.2 million US$, an interest rate of 5.8 percent and a depreciation period of 15 y, the capital cost amounts to 2.1 million US$ per year. The price of molasses was taken as 82.50 US$/ton, while the main by-product (concentrated syrup, 58% dry matter, obtained by concentration of the stillage) is sold as an animal feed at 41 US$/ton. The plant operates 336 days per year and employs 250-300 people. The net production cost amounts to about 0.26 US$/l and is strongly dependent upon the cost of the feedstock and the price at which the concentrated syrup can be sold on the market. One has to bear in mind, however, that the production of 125 million l of ethanol (as envisaged here) is associated with the production of about 250’000 tons of concentrated syrup, and the development of a large-scale ethanol industry might overwhelm the market of animal feed (which may
Table 4 — Details of ethanol production cost in the context of India
Units Molasses Sweet sorghum juice Sorghum bagasse
Ethanol plant capacity
Annual feed capacity ton/y 405’000 1’795’000 790’000
Annual production capacity Ml/y 125.0 125.0 125.0
Annual cost elements
Feedstock costs US$/y 33.4 22.4 5.9
Variable operating costs US$/y 6.3 3.1 4.7
Fixed operating costs US$/y 1.4 2.8 9.3
Investment costs US$/y 2.1 5.4 28.1
Sales of by-products US$/y -10.3 -2.8 -0.3
Production cost per litre
Gross production cost US$/l 0.35 0.27 0.38
Credit due to by-products US$/l -0.08 -0.02 0.00
Net production cost US$/l 0.26 0.25 0.38

J SCI IND RES VOL 64 NOVEMBER 2005
820
result in a significant drop of the price of the syrup unless export to other regions is envisaged). Such a phenomenon would require a more detailed local economic analysis.
Production of Bio-ethanol from Sweet Sorghum Juice
The present ethanol facility processes whole sorghum stems from which the juice is extracted and separated from the bagasse. With a total project investment of 54.5 million US$ and under the same economic conditions as described above, the capital cost amounts to 5.4 million US$ per year. The price of sorghum stems was taken as 12.50 US$/ton, while the main by-product (sorghum bagasse) is sold at 5 US$/ton. The stillage is returned to the farmers and used as a liquid fertilizer in agricultural fields but was considered to bring zero revenue (large volumes, little added value). The plant operates 100 days per year (due to sorghum storage limitations) and employs 400-450 people. The net production cost amounts to about 0.25 US$/l and again is strongly dependent upon the cost the feedstock and the price at which the bagasse (about 550,000 ton/y) is sold.
Production of Bioethanol from Sweet Sorghum Bagasse
Each ton of sweet sorghum generates (after extraction) approx 640 kg of sweet juice and 360 kg of bagasse. The bagasse (30-35% of the plant’s fresh wt, moisture content 50% wt) consists mainly lignocellulosic residue left after extraction of the sugar. It has a lower heating value (15-18 MJ/kg). For every thousand litre of anhydrous ethanol produced, quantity of bagasse generated amounts to 4.6 ton. This corresponds to about 70-80 MJ (2.2-2.6 kg coal equivalent) per litre of anhydrous ethanol, which would be sufficient to cover all the energy needs (heat and power) of the ethanol production process. The bagasse, however, also represents a significant potential for further alcohol production, with an ethanol yield of 157 l/ton of bagasse (56 l/ton of sweet sorghum). In comparison, the ethanol yield from sweet juice reaches 121 l/ton (77 l/ton of sweet sorghum).
The conversion technology10 is based on enzymatic hydrolysis of cellulose and co-fermentation of glucose and xylose to ethanol. With a total project investment of 280 million US$, the capital cost amounts to 28.1 million US$ per year. The price of sorghum bagasse was taken as 7.40 US$/t (including transport cost), while the main by-product
(excess electricity resulting from the combustion of the lignin contained in the bagasse) is sold at 33 US$/MWh. The plant operates 336 days per year and employs 300-350 people. The net production cost amounts to about 0.38 US$/l and again is strongly dependent upon the cost the feedstock, but also on the total project investment. The present case study would apply almost identically to sugarcane bagasse.
Conclusions
Due to its environmental merits, the share of bio-ethanol in the automotive fuel market will grow fast in the next decade. Having developed long experience with low-level ethanol blends (E10 to E26), as well as with nearly pure ethanol (E85), Brazil and the US benefit from learning curve and particularly favourable conditions with regards to agricultural feedstocks, sugarcane for Brazil and corn for the US. Especially, Brazil exhibits the lowest production costs of bio-ethanol fuel worldwide and is in position to capture a large share of the international market in the future. However, the market price of bio-ethanol fuel will fluctuate as a result of the balance between demand and supply of bio-ethanol, oil and sugar. It is likely that the trend will be for an increase as a consequence of the fast growth of the world demand in the future. India is one of the first producers and consumers of sugar worldwide and it is not envisaged for this country to use sugarcane for producing part of its future requirement of bio-ethanol fuel. However, molasses of sugarcane can be used complementarily to sweet sorghum juice. It is assumed that a portion of grain sorghum is replaced by sweet sorghum without any additional agricultural land. Although the results show that India is not competitive with Brazil, opportunities for Indian production of bio-ethanol must be analysed in more detail in the light of both future oil and ethanol markets. In a longer term, lignocellulose-to-ethanol is very promising due to its independence from food markets. It is expected that the production cost will decrease as a result of the research works undertaken in several countries. Finally, due to the higher potential of CO2 emissions reduction of this pathway, use of Clean Development Mechanism (CDM) should be envisaged to reduce its production cost.
Acknowledgement
Authors thank Prof Charles E Wyman for providing valuable review on ethanol.
GNANSOUNOU & DAURIAT: ETHANOL FUEL FROM BIOMASS: A REVIEW
821
References 1 Timeline of Alcohol Fuel, Wikipedia, the free
encyclopaedia, http://en.wikipedia.org/wiki/Timeline_of_ Alcohol_Fuel
2 Biewinga E E & van der Bijl G, Sustainability of Energy Crops (CLM234 – The Netherlands) 1996.
3 Rasul G & Thapa G B, Sustainability of ecological and conventional agricultural systems in Bangladesh: An assessment based on environmental, economic and social perspectives, Agric Syst, 79 (2004) 327-351.
4 Wyman C E, Ethanol fuel, in Encyclopaedia of Energy, edited by Cuter J Cleveland (Elsevier Inc., New York) OP2176480X, 2004, 541-555.
5 Raven P H, Evert R F & Eichhorn S E, Biology of Plants, 6th edn (Freeman and Company/Worth Publishers, New York) 1999.
6 Shleser R, Ethanol Production in Hawaii (State of Hawaii, Energy Division, Dept. of Business, Economic Development and Tourism, Honolulu, HI, USA) 1994, 5-6.
7 Sun Y & Cheng J, Hydrolysis of lignocellulosic materials for ethanol production: A review, Biores Technol, 83 (2002) 1-11.
8 Wright J D, Ethanol from biomass by enzymatic hydrolysis, Chem Eng Prog, 84 (8) (1998) 62-74.
9 Morjanoff P J & Gray P P, Optimization of steam explosion as method for increasing susceptibility of sugarcane bagasse to enzymatic saccharification, Biotechnol. Bioeng, 29 (1987) 733-741.
10 Wooley R R, Sheehan J & Ibsen K, Lignocellulosic Biomass
to Ethanol Process Design and Economics Utilizing Co-
current Dilute Acid Prehydrolysis and Enzymatic
Hydrolysis: Current and Futuristic Scenarios (National Renewable Energy Laboratory - NREL, Report TP580-26157) 1999.
11 Aden A, Ruth M, Ibsen K & Jechura J, Lignocellulosic
Biomass to Ethanol Process Design and Economics
Utilizing Co-Current Dilute Acid Prehydrolysis and
Enzymatic Hydrolysis for Corn Stover (National Renewable Energy Laboratory -NREL, Report TP510-32438) 2002.
12 The DOE Bioethanol Pilot Plant (DOE leaflet GO-10200-1114) 2000.
13 Lindstedt J, Alcohol production from lignocellulosic feedstock (in FVS Fachtagung 2003), 228-237.
14 MBEP, Fact Sheet (Michigan Biomass Energy Program) 2002. http://www.michiganbioenergy.org/ethanol/edieselfacts.htm
15 SAE, National ethanol vehicle challenge design competition, 2001. http://www.saeindia.org/home/ NEVC.htm
16 Gnansounou E, Dauriat A & Amiguet M, Economic and
Social Profitability (deliverable of WP6 of the EU project ASIATIC, LASEN, Lausanne, Switzerland) 2005.
17 Lichts F O, World Ethanol and Fuels Report, 2003.
18 Ho S P, Global warming impact of ethanol versus gasoline, Presented at 1989 National Conference, Clean Air Issues
and America’s Motor Fuel Business, Washington D C, October 1989.
19 Pimentel D, Ethanol fuels: Energy security, economics, and the environment, J Agric Environ Ethics, 4 (1991) 1-13.
20 Keeney D R & DeLuca T H, Biomass as an energy source for the midwestern US, Amer J Alternative Agric, 7 (1992) 137-143.
21 Lorenz D & Morris D, How Much Energy does it Take to
Make a Gallon of Ethanol? (Revised and Updated, Institute for Local Self-Reliance, Washington, DC) August 1995.
22 LBST, GM well-to-wheel analysis of energy use and
greenhouse gas emissions of advanced fuel/vehicle systems:
A European study (prepared by L-B-Systemtechnik and sponsored by GM, BP, ExxonMobil, Shell, TotalFinaElf) 2002.
23 Woods J & Bauen A, Technology status review and carbon
abatement potential of renewable transport fuels in the UK [Report prepared for the Department of Trade and Industry (UK), Centre for Energy Policy and Technology, Imperial College, London, UK] 2003.
24 Macedo I, Assessment of greenhouse gas emissions in the
production and use of fuel ethanol in Brazil (Report prepared for the Government of the State of São Paulo, Brazil) 2004.
25 PriceWaterhouseCoopers & Ecobilan, Energy balances and
GHG of motor bio-fuels production pathways in France (in French, prepared for ADEME, France) 2002.
26 LASEN, Assessment of ethanol production pathways in the
Swiss context (in French), prepared for the Swiss Federal Office of Energy, 2000.
27 Gnansounou E & Dauriat A, Comparative study of fuels by
analysis of their life cycle [Report in French, prepared for Alcosuisse, Laboratory of Energy Systems (LASEN), EPFL, Switzerland] 2002.
28 Gnansounou E & Dauriat A, Comparative study of fuels by
analysis of their life cycle [Report in French, prepared for Alcosuisse, Laboratory of Energy Systems (LASEN), EPFL, Switzerland] 2004.
29 Ahmed I, Oxygenated diesel: Emissions and performance characteristics of ethanol-diesel blends in CI engines (SAE report No 2001-01-2475) 2001.