etf landscape: celebrating 10 years of etfs in australia ... · etf landscape celebrating 10 years...
TRANSCRIPT

FOR PROFESSIONAL INVESTORS. NOT FOR INVESTORS IN THE US OR CANADA.
ETF Landscape
Celebrating 10 Years of ETFs in Australia
June 2011
ETF Landscape June 2011 Celebrating 10 Years of ETFs in Australia from BlackRock
Global ETF Research and Implementation Strategy Team
Deborah Fuhr Managing Director Global Head of ETF Research and Implementation Strategy +44 20 7668 4276 [email protected]
Shane Kelly Vice President Global ETF Research and Implementation Strategy +44 20 7668 8426 [email protected]
Publication date: 8 June 2011.
1 This document is not an offer to buy or sell any security or to participate in any trading strategy. Please refer to important information and qualifications at the end of this material.
Table of contents
Celebrating 10 Years of ETFs in Australia ..................................................................................................................................... 2
Australian industry statistical update ........................................................................................................................................... 2
Australian ETF regulatory and tax updates ................................................................................................................................... 4
Global ETF/ETP industry highlights .............................................................................................................................................. 4
ETF background .......................................................................................................................................................................... 5
ETFs/ETPs listed in Australia ........................................................................................................................................................ 11
Australian listed ETFs/ETPs asset growth .................................................................................................................................... 11
ETF/ETP providers by average daily US dollar turnover ................................................................................................................ 11
ETFs/ETPs listed in Australia ...................................................................................................................................................... 12
ETFs/ETPs listed in Australia by provider, exposure and index provider ........................................................................................ 12
Australian institutions reported holding ETFs ............................................................................................................................... 14
Top 10 ETFs/ETPs listed in Australia by assets, trading volume and net flows ............................................................................... 15
Australia’s managed funds .......................................................................................................................................................... 16
The history of ETFs ........................................................................................................................................................................ 17
Original ETF ecosystem ............................................................................................................................................................... 18
2011 ETF ecosystem .................................................................................................................................................................. 19
The future for ETFs ..................................................................................................................................................................... 21
Understanding the definitions of an ‘ETF’ .................................................................................................................................... 23
ETFs/ETPs listed in Asia Pacific (ex-Japan) .................................................................................................................................. 34
ETFs listed in Asia Pacific (ex-Japan) and ETFs/ETPs asset growth ............................................................................................... 34
Implementing asset allocation with ETFs ..................................................................................................................................... 36
Macro asset allocation strategies and index performance ............................................................................................................ 39
Core/satellite applications ......................................................................................................................................................... 41
How and why ETFs are used? ...................................................................................................................................................... 42
ETF/ETP toolbox ........................................................................................................................................................................ 45
Commodities in your portfolio ..................................................................................................................................................... 50
Key tax considerations ................................................................................................................................................................ 56
ETFs and ETPs listed in Australia .................................................................................................................................................. 57
ETFs and ETPs listed outside of Australia providing exposure to Australia ................................................................................. 58
New ETFs listed in Australia in 2011 ............................................................................................................................................ 59
Subscribe to ETF Landscape reports ............................................................................................................................................ 60

ETF Landscape June 2011 Celebrating 10 Years of ETFs in Australia from BlackRock
This document is not an offer to buy or sell any security or to participate in any trading strategy. Please refer to important information and qualifications at the end of this material. 2
Celebrating 10 Years of ETFs in Australia1
This special edition of ETF Landscape is BlackRock’s comprehensive report on the history and outlook for the ETF industry in Australia. The report covers Exchange Traded Funds (ETFs) and Exchange Traded Products (ETPs). ETFs are open-end index funds that provide daily portfolio transparency, are listed and traded on exchanges like stocks on a secondary basis as well as utilising a unique creation and redemption process for primary transactions. ETPs are products that have similarities to ETFs in the way they trade and settle but they do not use a mutual fund structure. The use of other structures including grantor trusts, partnerships, notes and commodity pools by ETPs can create different tax and regulatory implications for investors when compared to ETFs, which are funds. This commentary should not be regarded as a research report2.
August 2011 marks the 10th anniversary of the launch of the first ETFs in Australia
We take this opportunity to reflect on the history of ETFs as well as consider the outlook for the future of ETFs in Australia.
The first ETFs to list in Australia were the SPDR S&P/ASX 50 Fund (SFY AU) and SPDR S&P/ASX 200 Fund (STW AU) on the Australian Securities Exchange (ASX) on 27 August 2001.
By the end of 2013, we expect Australian ETF/ETP assets to exceed US$10 Bn. This is based on an expectation of 20–30% CAGR in Australian ETF AUM over the next few years.
Australian industry statistical update
At the end of April 2011, there were 29 locally domiciled ETFs/ETPs listed in Australia and 21 cross-listings with assets of US$6 Bn from seven providers on one exchange.
In Australia, unlike many other markets, the assets invested in the cross-listed shares are held locally in CHESS rather than only the primary listing. This difference enables us to track the AUM in the cross-listed ETFs.
Assets in ETFs/ETPs listed in Australia have increased by 11.4% YTD to US$5,952.1 Mn, which is greater than the 9.4% increase in the MSCI Australia Index in US dollar terms over the same period.
State Street Global Advisors (SSgA) is the largest provider in terms of assets with US$3,253.5 Mn in seven locally domiciled ETFs/ETPs, reflecting 54.7% market share; iShares is second with four locally domiciled ETFs/ETPs and 19 cross-listed ETFs/ETPs, assets of US$1,281.8 Mn, and 21.5% market share; at the end of April 2011.
Standard & Poor’s (S&P) ranks first in terms of ETF/ETP assets tied to its benchmarks with assets of US$4,363.0 Mn and 28 listings, while MSCI ranks second with US$538.5 Mn and 11 listings.
The number of listed products has increased 11.1% YTD, from 45 in 2010 to 50 at end April 2011.
YTD, US$161.2 Mn of net new assets went into ETFs/ETPs listed in Australia, of which US$159.8 Mn went into ETFs/ETPs tracking United States equity indices, while ETFs/ETPs tracking Australian equity indices saw net outflows of US$253.9 Mn.
In 2010, US$1,401.2 Mn of net new assets went into ETFs/ETPs listed in Australia, of which US$1,061.6 Mn went into ETFs/ETPs tracking Australian equity indices, and US$163.7 Mn went into ETFs/ETPs tracking global equity indices.
The MSCI Australia Index, a benchmark of equity market performance in Australia, increased 9.4% in US dollar terms, by comparison, the MSCI World benchmark of equity performance in 24 developed market countries increased by 8.5% YTD in US dollar terms over the same period.
Forecast
By the end of 2013, we expect Australian ETF/ETP assets to exceed US$10 Bn. This is based on an expectation of 20–30% CAGR in Australian ETF AUM over the next few years.
Retail use of ETFs is expected to grow based on regulatory changes such as Australia’s Future of Financial Advice Reform. In Australia, professional investors increasingly mentioned their use of ETFs in their own Self Managed Super Funds (SMSFs). The future of financial advice reforms is similar to the Retail Distribution Review (RDR) in the United Kingdom. In both, markets we expect these changes will cause financial advisers to embrace ETFs.
The SMSF segment with assets of around $400 Bn is Australia’s largest wealth segment. SMSFs have been early adopters of ETFs and also seem to be increasingly favouring ETFs over managed funds in their investment strategies.
A study by Tria Investment Partners found that 30–40% of all investors in Australian ETFs were DIY super funds (SMSFs). The attraction is explained as being due to lower entry prices, transparency from being listed, and an increased ability to control tax liabilities.
The number of institutional users embracing ETFs will continue to grow with asset managers, private banks, and family offices increasing their use of ETFs as building blocks in new life style and model portfolios offered as separately managed accounts and as funds of ETFs.
Traditionally financial advisers have been remunerated through commission products carrying upfront entry fees and trailing commissions. Proposed reforms, effectively banning upfront and trailing commissions, will mean that as advisers move to a fee for service model they will need to deliver solutions that do not carry these types of fees.
1. Data as at end of April 2011 2. Certain terms used in this publication may differ from those applied by other industry participants. Source: BlackRock, ASIC, ASX, Australian Bureau of Statistics (ABS), Tria Investment Partners, Minter Ellison Lawyers, Australian Tax Office (ATO).

ETF Landscape June 2011 Celebrating 10 Years of ETFs in Australia from BlackRock
3 This document is not an offer to buy or sell any security or to participate in any trading strategy. Please refer to important information and qualifications at the end of this material.
Background
The locally domiciled ETFs in Australia are Managed Investment Schemes (MIS), also known as ‘managed funds’, ‘pooled investments’ or ‘collective investments’, often created in the form of a unit trust, registered with ASIC (Australian Securities and Investments Commission), and regulated by the Corporations Act 2001.
In 2008, the ASX, in agreement with ASIC, added a new listing framework called the ASX AQUA Rules (AQUA rules), designed to offer greater flexibility for issuers in designing products and having them quoted on ASX. The AQUA rules were specifically designed for ETFs, managed funds and structured products, recognising that the initial listing and ongoing obligations of ETFs are very different to that of a traditional listed company. The rules were drafted and approved with equities, commodities and currencies specified as the asset classes upon which a product could invest or be based on. Fixed income was omitted from the original submission and as a result, there are currently no fixed income ETFs in Australia for this reason.
The ASX has submitted rule changes to ASIC to allow fixed income ETFs to launch in Australia for the first time, however ASIC has yet to approve the changes.
In 2010, an application was made to launch leveraged and inverse ETFs via the AQUA listing rules; however, after considering the submission for nine months, ASIC eventually rejected the application having concerns over the entire framework being too flexible.
A recent development in Australia has been the introduction of synthetic ETFs, where the provider uses derivatives (typically swaps) to generate the performance of the underlying index, and posts collateral against the position as security.
ASIC has imposed a maximum 10% counterparty exposure limit, the swap counterparty must be an APRA (Australian Prudential Regulation Authority) regulated institution, and the securities posted as collateral must be consistent with the investment objective of the ETF.
Market commentators continue to voice concern as to whether Australian ETFs are subject to effective safeguards to protect investors from the risks of ETFs. Although ASIC and the ASX are comfortable with the current regulatory settings and are monitoring overseas trends and issues in ETF markets, there are concerns that as more complex ETF products become available, regulation may not develop accordingly.
Short selling provisions
A short sale is where an investor sells a security that they do not own, intending to repurchase it later at a lower price. This mechanism is typically facilitated via securities lending arrangements, where the investor first borrows a security in order to sell it on exchange (this is known as a “covered short sale”), and then buys the security back on exchange at a later date to return it to the lender. Covered short sales are permitted in Australia under the Corporations Act (provided that certain reporting requirements are satisfied) as ASIC recognises covered short selling as a legitimate mechanism for price discovery and liquidity.
However, a security being sold short without a securities lending arrangement in place is known as “naked short selling”. A naked short sale tends to have a higher risk of settlement failure, and is prohibited where the seller has not sourced a security to deliver to the buyer at the time of sale in order to settle the trade.
There are exceptions which are only provided to facilitate the orderly operation of markets. One of the exceptions is for certain market makers of ETFs, where they are permitted to engage in naked short selling to hedge their risks in the course of making a market in the ETF, where as soon as possible after the sale, the ETF market maker purchases or applies for the issue of equivalent ETFs to settle the sale.
Given that ETFs are supported by multiple liquidity providers in addition to market makers, the current regime for naked short selling does not provide consideration to those institutions that also require the exemption in order to provide liquidity to the market through hedging, index arbitrage and dual listed arbitrage transactions – activities which, in other ETF markets outside of Australia, help to facilitate price discovery, keeping the ETF trading close to its underlying net asset value.
Cross-listed ETFs
There are also 21 United States-domiciled ETFs cross-listed on the ASX. Cross listing occurs via ASX’s CHESS (Clearing House Electronic Subregister System) Depositary Interests (CDI). A CDI confers a beneficial interest in the corresponding overseas ETF, rather than legal interest. There are some tax issues for Australian investors which arise from using CDI’s compared to local ETFs, where the withholding taxes apply to dividend payments out of the ETF, however investors can file a W8-BEN form to lower the rate, and Australian investors typically receive a foreign tax credit for withholding taxes, so the overall impact can be minor.
Cross listings from the United States are an important part of the ETF industry in Australia as the local market operates on a much smaller scale. Using an existing United States ETF that has already raised significant assets allowing it to buy more of the securities in the benchmark, with operations, portfolio management, marketing, websites, etc. already setup can keep costs down, potentially making it a more efficient model than re-creating funds locally, especially for international exposures.
The Foreign Investment Fund (FIF) rules in Australia, introduced in 1993, addressed the offshore tax issue where investors could potentially use a foreign/offshore fund that accumulates income it receives, instead of paying it out in the form of a dividend, allowing the unit holders to realise their profit entirely in the form of a capital gain, effectively converting taxable income (taxed at higher rates) to taxable gains (taxed at lower rates).
To prevent this situation from being exploited, the FIF rules add the annual growth of a foreign fund to assessable income for tax purposes, and upon disposal, capital gains tax applies with the assessable value reduced in accordance with amounts previously attributed to income.
The United States-domiciled ETFs cross-listed in Australia are considered to be FIFs; however they qualify as Regulated Investment Companies (RICs) under the United States Internal Revenue Code, which are required to distribute income to investors at least annually, allowing them to qualify for an exemption from the FIF rules.
Source: BlackRock, ASIC, ASX, Australian Bureau of Statistics (ABS), Tria Investment Partners, Minter Ellison Lawyers, Australian Tax Office (ATO).
ETF Landscape June 2011 Celebrating 10 Years of ETFs in Australia from BlackRock
This document is not an offer to buy or sell any security or to participate in any trading strategy. Please refer to important information and qualifications at the end of this material. 4
In July 2010, the FIF rules were repealed and are being replaced with a specific anti-avoidance rule (currently only in draft format) to ensure that Australian residents cannot defer or avoid tax a liability for income held in foreign accumulation funds.
Other tax considerations
Foreign residents are subject to withholding tax on capital gains made in relation to ‘taxable Australian property’. Reduction in withholding tax rates from up to 48.5% down to 7.5% applicable to certain distributions from a Managed Investment Trust (MIT) to a foreign resident, who is a tax resident of a country that has a tax information exchange agreement with Australia. As a listed vehicle, an ETF should qualify as a MIT. The combination of these two points mean Australian domiciled ETFs are becoming increasingly appealing to foreign residents.
A MIT can elect to statutorily deem to hold eligible assets, including shares in a company or units in a trust, on capital account. This makes certain the capital treatment of these holdings. In addition, under the capital gains tax law, a MIT may be eligible to a discount on gains made from disposing an asset held for more than 12 months.
Furthermore, proposed tax reforms that have been announced –new trust taxation regime; new MIT taxation regime; and investment manager regime – are all designed to enhance Australia’s competitiveness internationally.
There are a number of taxation reforms currently in progress by the Australian Government that may impact ETFs operating as trusts. These reforms are mainly positive and include proposals to confirm the ability to pass 'capital gains' and franked dividends (including the attached franking credits) to the underlying investors that are specifically entitled to such amounts.
An attribution model of taxation for ETFs that qualify as managed investment trusts is also expected to commence from 1 July 2012, which may result in investors being taxed on an amount of taxable income without a corresponding cash distribution from the fund.
Source: BlackRock, ASIC, ASX, Australian Bureau of Statistics (ABS), Tria Investment Partners, Minter Ellison Lawyers, Australian Tax Office (ATO).
Australia’s Future of Financial Advice (FOFA) reform
The Minister for Financial Services, Superannuation and Corporate Law, Chris Bowen MP, said that the ‘Future of Financial Advice’ reforms are designed to tackle conflicts of interest that have threatened the quality of financial advice that has been provided to Australian investors, and the mis-selling of financial products.
No more new commissions from 2012. Ban on commissions and volume-based payments and any other type of remuneration structure that creates a conflict of interest for the adviser. The ban applies to all retail investment products including managed investments, superannuation and margin loans but the ban won’t apply to risk insurance products.
Must act in the best interests of clients. From 1 July 2012, all financial advisers will be subject to a statutory fiduciary duty to act in the best interests of clients. Under no circumstances will financial advisers be allowed to place their own interests ahead of a client’s interests.
Simpler disclosure information for clients. Financial Services Guides (FSGs) must be more effective at disclosing any restrictions on the adviser when providing advice, any potential conflicts of interest and how the adviser is remunerated.
Introduction of ‘product neutral’ adviser charging regime. The details on this change are yet to be determined, but basically any fee must be paid by the client rather than the product provider, although the financial adviser and client can choose to deduct the fee from the amount being invested. Also, each year, the client has to consent to continuing the client/adviser arrangement before another fee can be charged. The new charging regime should be operating by 1 July 2012.
Advisers can charge asset-based fees, but not on borrowed money. The client must agree with the asset-based fee. One of the greediest tactics used by some commission-based advisers was to recommend that a client borrow money to invest, and then charge a commission on the borrowed money as well.
Remove exemption for accountants to provide advice on SMSFs. This change will cause quite a few ripples in the accounting profession, but there is positive news for this sector: the Government also mentions introducing a streamlined licensing regime for accountants advising on SMSFs.
ASIC to be given more powers to ban individuals from providing advice.
Review definitions of retail (unsophisticated) or wholesale (sophisticated) clients.
Review of professional standards for financial advisers. The Government will appoint a panel to review professional standards, including conduct and competency standards, and potentially a code of ethics.
Consider possibility of introducing a statutory compensation scheme to compensate clients of financial advisers.
Source: Super Guide, Treasury Ministers Portal, The Future of Financial Advice, Information Pack, 26 April 2010.
Global ETF/ETP industry highlights
At the end of April 2011, the global ETF industry had 2,670 ETFs with 6,021 listings and assets of US$1,469.8 Bn, from 140 providers on 48 exchanges around the world. This compared to 2,189 ETFs with 4,354 listings and assets of US$1,113.1 Bn from 122 providers on 42 exchanges at the end of April 2010.
Additionally, there were 1,149 other ETPs with 1,872 listings and assets of US$201.1 Bn from 57 providers on 23 exchanges. This compared to 778 ETPs with 1,099 listings and assets of US$182.0 Bn from 45 providers on 18 exchanges, at the end of April 2010.
Combined, there were 3,819 products with 7,893 listings, assets of US$1,670.9 Bn from 176 providers on 52 exchanges around the world. This compared to 2,967 products with 5,453 listings, assets of US$1,295.1 Bn from 150 providers on 44 exchanges, at the end of April 2010.

ETF Landscape June 2011 Celebrating 10 Years of ETFs in Australia from BlackRock
5 This document is not an offer to buy or sell any security or to participate in any trading strategy. Please refer to important information and qualifications at the end of this material.
We expect global AUM in ETFs and ETPs to increase by 20–30% annually over the next few years, taking the global ETF/ETP industry to approximately US$2 trillion in AUM by early 2012. Considering ETFs separately, AUM should reach US$2 trillion globally by the end of 2012, US$1 trillion in the United States in 2011 and US$500 Bn in Europe in 2013.
Taking ETFs and ETPs together, United States AUM should reach US$2 trillion in 2013, with European AUM reaching US$500 Bn in 2012.
April 2011 saw record net inflows of US$25.3 Bn and record YTD net inflows of US$67.2 Bn in the first four months of 2011.
Assets have increased by 5.0% from US$1,399.4 Bn in March 2011 to US$1,469.8 Bn in April 2011, which is greater than the 4.0% increase in the MSCI World Index in US dollar terms.
US$25.3 Bn of net new assets went into ETFs/ETPs in April 20111. US$18.9 Bn net inflows went into equity ETFs/ETPs, of which US$13.7 Bn went into ETFs/ETPs tracking developed market indices and US$5.2 Bn went into ETFs/ETPs tracking emerging market indices.
Fixed income ETFs/ETPs saw net inflows of US$2.7 Bn, of which ETFs/ETPs providing corporate bond exposure saw US$0.8 Bn net inflows while money market ETFs/ETPs saw net outflows of US$0.3 Bn. US$2.8 Bn net inflows went into ETFs/ETPs with commodity exposure, of which ETFs/ETPs with exposure to precious metals saw US$2.9 Bn net inflows while ETFs/ETPs providing exposure to energy experienced net outflows of US$1.0 Bn.
Leveraged and inverse ETFs/ETPs experienced US$0.3 Bn net outflows in April 2011, of which leveraged ETFs/ETPs experienced US$1.0 Bn net outflows and inverse ETFs/ETPs experienced US$0.1 Bn net outflows, while US$0.9 Bn net inflows went into leveraged inverse ETFs/ETPs.
2011 YTD, assets have increased by 12.1% from US$1,311.3 Bn to US$1,469.8 Bn, which is greater than the 8.5% increase in the MSCI World Index in US dollar terms. This compared to a 7.4% increase in assets over the same period in 2010.
US$67.2 Bn of net new assets went into ETFs/ETPs in the first four months of 2011. US$45.1 Bn net inflows went into equity ETFs/ETPs, of which US$46.8 Bn went into ETFs/ETPs tracking developed market indices while ETFs/ETPs tracking emerging market indices saw net outflows of US$1.7 Bn.
Fixed income ETFs/ETPs saw net inflows of US$10.5 Bn, of which ETFs/ETPs providing high yield exposure saw US$3.1 Bn net inflows while Government bond ETFs/ETPs experienced net outflows of US$0.7 Bn. US$9.0 Bn net inflows went into ETFs/ETPs with commodity exposure, of which ETFs/ETPs providing broad commodity exposure saw US$3.7 Bn net inflows while ETFs/ETPs providing exposure to energy saw net outflows of US$0.5 Bn.
2011 YTD, US$2.7 Bn net inflows went into leveraged and inverse ETFs/ETPs, of which US$3.6 Bn net inflows went into leveraged inverse ETFs/ETPs and US$0.9 Bn net inflows went into inverse ETFs/ETPs, while leveraged ETFs/ETPs experienced US$1.8 Bn net outflows.
Globally, iShares is the largest ETF provider in terms of both number of products and assets, 467 ETFs and US$636.9 Bn respectively, reflecting 43.3% market share; State Street Global Advisors is second with 123 ETFs, assets of US$210.2 Bn, and 14.3% market share; followed by Vanguard with 66 ETFs, assets of US$173.1 Bn and 11.8% market share; at the end of April 2011.
The top three ETF providers, out of 140, account for 69.4% of global ETF AUM, while the remaining 137 providers each have less than 4.0% market share.
In April 2011, the number of ETFs increased by 2.5% with 73 new ETFs launched, while seven ETFs delisted and one ETF merged.
YTD, the number of ETFs have increased by 8.5% with 236 new ETFs launched, while seven ETFs have delisted and 19 ETFs have merged. This compared to a 12.4% increase in the number of ETFs over the same period in 2010, when 253 new ETFs launched, while 12 ETFs delisted.
There are currently plans to launch 1,055 new ETFs in the future compared to the planned launch figure of 872 at the end of April 2010.
The top 100 ETFs, out of 2,670, account for 62.0% of global ETF AUM. 247 ETFs have greater than US$1.0 Bn in assets, while 1,635 ETFs have less than US$100.0 Mn in assets, 1,314 ETFs have less than US$50.0 Mn in assets and 462 ETFs have less than US$10.0 Mn in assets.
The five and ten year CAGRs of global ETF AUM at the end of 2010 were 26.1% and 33.2% respectively, compared to the United States with five and ten year ETF AUM CAGRs of 24.4% and 29.8% respectively, while Europe’s ETF AUM was growing at faster rates of 38.9% (five year CAGR) and 83.0% (ten year CAGR).
Anniversaries
29 January 2011 marked the 18th anniversary of ETFs in the United States.
9 March 2011 marked the 21st anniversary of the first ETF globally, which listed in Canada in 1990.
11 April 2011 marked the 11th anniversary of ETFs in Europe.
27 August 2011 will mark the 10th anniversary of ETFs in Australia.
ETF background
ETFs have become popular and widely used investment vehicles. In a world where investment products come and go with the blink of an eye, ETFs might be considered one of the most innovative financial products in the last two decades. They have fundamentally changed how both institutional and retail investors construct their investment portfolios.
ETFs have opened a new panorama of investment opportunities. Essentially, ETFs are index funds that are listed and traded on exchanges like stocks, allow investors to gain broad exposure to specific segments of equity, fixed income, and commodity markets with relative ease, on a real-time basis, and at a lower cost than many other forms of investing.
1. Global ETF/ETP flows are approximated by combining flows available for the US, Europe, Canada and Latin America. Product level assets for ETPs listed in Israel are not
currently available. An aggregate value has been included in the total assets. Latest data for Israel ETP assets sourced from Bank of Israel, March 2011.

ETF Landscape June 2011 Celebrating 10 Years of ETFs in Australia from BlackRock
This document is not an offer to buy or sell any security or to participate in any trading strategy. Please refer to important information and qualifications at the end of this material. 6
ETFs are based on sector, large-cap, mid-cap, small-cap, value, growth, domestic, international country and regional equity indices, commodities and currencies as well as on corporate, credit, inflation and government fixed income indices. ETFs typically can be used to short indices, are lendable, and are purchased on a commission basis just like other equities.
ETFs offer many advantages. We believe that growth in the use of ETFs reflects their many advantages. They trade throughout the day on major securities exchanges and can be bought and sold using market, limit, or stop orders. ETFs are funds, not derivatives, which allow investors to quickly react to short and long-term needs or opportunities.
As such, they may serve as an alternative to futures, trading baskets of stocks and traditional mutual funds. ETFs do not have any sales loads, although they do, like mutual funds, have annual expense ratios, albeit less than traditional funds, ranging from zero to 1.81%. In fact, ETFs have some of the lowest expense ratios among registered investment products. Recent interest from investors has been partially fuelled by attempts to avoid accounting, earnings, and other stock-specific risks.
ETFs are index-based1 open-ended funds that can be bought and sold as quickly and easily as ordinary shares on a stock exchange – they have become popular and widely used investment vehicles to achieve many investment strategies:
To gain diversified exposure to a market.
For core/satellite investing.
For buy and hold investing.
For active traders who wish to take advantage of market movements.
For investors wishing to hedge the market.
As an alternative to futures and other institutional investment tools.
In the recent market turmoil many investors have become concerned about counterparty risk, transparency, liquidity, product structure, cost, the use of derivatives and structured products. As a result, many investors believe ETFs offer significant advantages due to their fund structure, trading flexibility, diversification, relatively low cost, tax efficiency primarily for United States investors, and transparency.
As with any investment, ETFs have risks including the general risks associated with investing in securities, potential tracking error, non-concurrent trading hours between the ETF exchange listing and the underlying basket of equities. ETFs investing in emerging and international equity markets also have political, economic and currency risks.
Source: Global ETF Research and Implementation Strategy Team, BlackRock, Bloomberg.
Physical and synthetic ETFs
There are two common strategies employed by ETFs to achieve the target return: physical and synthetic. Physical ETFs hold the assets underlying a particular benchmark. For example, an equity-based ETF can hold all or a sample of the stocks underlying a benchmark equity index.
The advantages of a physical replication strategy include greater transparency of the ETFs asset holdings and more certainty of entitlement for investors should the ETF be liquidated. Restrictions on the use of derivatives in some regions, particularly in the United States, have also contributed to the continued dominance of physical replication. Most ETFs in the United States and Asia Pacific region use physical replication to track their underlying benchmark. In Europe, however, regulatory changes have seen the use of synthetic ETFs grow rapidly, with such funds accounting for almost half of total ETF assets under management.
The advantages of a synthetic strategy can include lower cost, improved accessibility to particular asset classes and investments (including emerging market shares) and greater accuracy in delivering the targeted return. That is, a synthetic strategy can reduce tracking error as the ETF is contractually guaranteed to receive the same return as the underlying asset. For example, physical equity ETFs must rebalance their constituent holdings each time the target index is reweighted, while for a synthetic ETF using swaps, this becomes the responsibility of the swap counterparty.
A synthetic strategy may also be necessary when physical replication is not possible (e.g. an ETF may be unable to directly access Chinese A-Shares). However, the structure of synthetic ETFs can be complex and may lack transparency, with the use of derivatives also exposing the ETF to counterparty risk.
Source: RBA Bulletin – March Quarter 2011.
Institutional demand for ETFs continues to climb
A new Greenwich Associates study2 reveals that institutional investors in the United States are increasingly bullish on using ETFs in their portfolios. Nearly half of the asset management firms and a third of the institutional funds taking part in the study of current institutional ETF users plan to increase the share of portfolio assets they invest in ETFs over the next two years.
Institutional use of ETFs has increased steadily over the past several years. The results of the study indicate a continuation of that trend. 48% of asset management firms interviewed for the study expect to increase portfolio allocations to ETFs between now and 2013. Of those, slightly more than half expect to increase ETF allocations by 5% or more. Perhaps more telling, not a single asset manager reported plans to cut ETF allocations in the coming two years.
Among institutional funds, approximately one-third of study participants expect to increase ETF allocations by 2013. Those institutional funds were about evenly divided with roughly half planning to increase allocations by 1-4% and half planning increases by 5% or more.
Less than one in 10 institutional funds that currently use ETFs plan to reduce allocations to these funds over the next two years. These institutional funds tend to use ETFs during manager transitions and expect greater stability of managers in their portfolio moving forward. Though the percentage of total fund assets allocated to ETFs is small, the amount of money invested is not small and is growing. Respondents report ETF investments ranging from US$10 Mn to US$200 Mn. In a separate study conducted in late 2010, Greenwich Associates research indicated that 15% of large institutional funds in the United States currently used ETFs in their portfolios.
1. Most are index-based, but some are active. 2. Greenwich Associates surveyed United States pension funds, endowments, foundations, and asset managers that identified themselves as ETF users. 70 institutions
participated in the survey, including 45 institutional funds and 25 asset managers. The survey was conducted between February and April 2011.

ETF Landscape June 2011 Celebrating 10 Years of ETFs in Australia from BlackRock
7 This document is not an offer to buy or sell any security or to participate in any trading strategy. Please refer to important information and qualifications at the end of this material.
Figure 1: Expected change in ETF allocations
17%
21%
10%
16%
5%
11%
-5%-2%-2%
-10% 0% 10% 20% 30% 40% 50%
Asset managers
Institutional funds
42%
49%
Expect no change
Increase 1–4% Increase 5–10% Increase >10%
Decrease 1–4%Decrease 5–10%Decrease >10%
17%
21%
10%
16%
5%
11%
-5%-2%-2%
-10% 0% 10% 20% 30% 40% 50%
Asset managers
Institutional funds
42%
49%
Expect no change
Increase 1–4% Increase 5–10% Increase >10%
Decrease 1–4%Decrease 5–10%Decrease >10%
Increase 1–4% Increase 5–10% Increase >10%
Decrease 1–4%Decrease 5–10%Decrease >10%
Base: 41 institutional funds, 19 asset managers. “Uncertain” responses not shown. Source: 2011 US Exchange-Traded Funds Study, Greenwich Associates: Institutional Demand for Exchange-Traded Funds Continues to Climb, May 2011.
Institutional priorities: products and providers
Liquidity is the most important factor for both asset managers and institutional funds when it comes to selecting an ETF provider. After liquidity, institutional funds focus on providers’ expense ratios and tracking error, followed by the strength and reputation of the fund company behind the funds, as well as the track record of the fund itself. Asset managers focus on many of the same factors when picking an ETF provider. However, asset managers place less of an emphasis on the track record of the specific fund and pay more attention to the benchmarks used by competing providers in their funds. Institutional investors apply similar criteria when selecting specific ETF products.
Figure 2: ETF applications in institutional portfolios
30%
75%
10%
12%
22%
24%
44%
51%
63%45%
40%
20%
5%
40%
10%
15%
44%
7%
0% 20% 40% 60% 80%
Asset managers Institutional funds
Transitions
Cash equitisation/interim beta
Rebalancing
Tactical adjustments
Core/satellite
Portfolio completion
Hedging
ETF overlay/liquidity sleeve
Other
Base: 41 Institutional funds, 20 asset managers. Source: 2011 US Exchange-Traded Funds Study, Greenwich Associates: Institutional Demand for Exchange-Traded Funds Continues to Climb, May 2011.
Top ETF providers to United States institutional investors
Given the importance of scale and trading volume in the ETF business, a few very large providers dominate the institutional market. Chief of them is iShares/BlackRock, with 85% of participating asset managers and 78% of participating institutional funds obtaining ETFs from the firm. Among asset managers, 55% of participants use SPDRs/State Street, 45% use Vanguard, and 35% use BLDRs/Powershares/INVESCO. Among institutional funds, 44% use SPDRs/State Street, 29% use Vanguard, and 7% use BLDRs/ Powershares/INVESCO.
Figure 3: ETF leaders: institutional funds
83%
79%
73%
63%
62%
42%
35%
43%
44%
61%
23%
15%
27%
29%
24%
31%29%
15%
0% 20% 40% 60% 80% 100%
iShares/BlackRock SPDRs/State Street Vanguard
Providing liquid products
Best range of products
Strong servicing platform
Is a safe choice
Strong index tracking
Good value
Base: 41 asset managers. Source: 2011 US Exchange-Traded Funds Study, Greenwich Associates: Institutional Demand for Exchange-Traded Funds Continues to Climb, May 2011.
Figure 4: ETF leaders: asset managers
78%
76%
71%
57%
53%
33%
58%
50%
40%
25%
50%
47%
22%
29%
29%
20%
35%
22%
0% 20% 40% 60% 80% 100%
iShares/BlackRock SPDRs/State Street Vanguard
Providing liquid products
Best range of products
Strong servicing platform
Is a safe choice
Strong index tracking
Good value
Base: 19 asset managers. Source: 2011 US Exchange-Traded Funds Study, Greenwich Associates: Institutional Demand for Exchange-Traded Funds Continues to Climb, May 2011.

ETF Landscape June 2011 Celebrating 10 Years of ETFs in Australia from BlackRock
This document is not an offer to buy or sell any security or to participate in any trading strategy. Please refer to important information and qualifications at the end of this material. 8
Although all of the leading providers are well regarded in certain aspects of their business, iShares/BlackRock is most frequently cited for providing liquid products, a wide range of products, precise index tracking, a strong service platform, and overall safety as a choice for an ETF provider. Vanguard and SPDRs/State Street are also well regarded for index tracking and overall good value for the management fees.
Conclusion
ETFs are clearly no longer simply a retail product. They have slowly, but steadily, gained acceptance as an important multi-purpose tool in institutional portfolios. Institutional investors are using ETFs for both strategic and tactical purposes, as well as for gaining passive and active exposures.
As this research makes clear, institutional investors with experience using ETFs in their portfolios are planning to do more of it in the next few years, a trend that all institutional investors should note.
Source: Greenwich Associates: Institutional Demand for Exchange-Traded Funds Continues to Climb, May 2011.
Asian institutions build out investment capabilities
Asian institutions1 appetite for using external asset managers is growing slowly with the recovery in global markets.
Although a recent flurry of Request for Proposals (RFPs) marked a resumption in manager hiring after a near dead-stop during the market crisis, institutional investors in Asia continue to build out their own investment management capabilities with an eye towards internalising assets for specific investment strategies.
In addition, Asian institutions are not planning to limit their internal management to passive strategies; many are looking to go toe to toe with external managers in active strategies with the goal of generating alpha.
These conclusions are drawn from the results of Greenwich Associates’ 2010 Asian Investment Management Study1, in which 84 of the largest institutional investors in Hong Kong, Macau, China, Taiwan, South Korea, Singapore and other Asian countries were interviewed.
These institutions together manage some US$5 trillion in assets, a sum that was roughly unchanged from 2009 to 2010.
About one third of Asian institutions use ETFs as part of their investment strategies.
ETFs are most widely employed due to their relatively high levels of liquidity and flexibility, and for their ability to provide institutions with a means of accessing specific investment strategies or exposures.
Source: Greenwich Associates: Asian Institutions Build Out Internal Investment Capabilities, Asian Investment Management June 2010.
We expect ETF assets to grow by 20–30% in 2011
The landscape will continue to evolve during 2011 and beyond as we see more products from traditional active asset managers and alternative asset class exposures becoming available to ‘mainstream’ retail and institutional investors through standardised and regulated fund structures such as the Undertakings for Collective Investment in Transferable Securities (UCITS) in Europe.
Hedge funds have historically been difficult for many investors to access with the high minimum subscription levels and maximum investor limits, but hedge funds are now noticing the growth and appeal of ETFs which are easy to access, but have powerful distribution networks. So we expect to see more hedge funds looking to create ETFs, with their own funds as the underlying exposure, in an effort to broaden their distribution capabilities.
This will, on one hand, give more investors access to the asset class and the ability to do so in small sizes, with daily liquidity, but also make it challenging for them to understand what they are investing in compared to the historical daily transparency of the underlying portfolio in low-cost index based exposures which ETFs have become known for.
It will be important in the coming years to ensure that as new generations of ETFs come to market, investors are educated on their structures and mechanics when they deviate from the traditional definition of ETFs as exchange listed, open-ended, liquid with secondary and primary in-kind creation and redemption (with support from market-makers and other liquidity providers), with real time indicative Net Asset Value (NAV), and transparent where the underlying portfolio is disclosed on a daily basis.
One of the reasons larger institutions are embracing ETFs is due to the fact that many have indicated in various surveys that one of their focuses for product development is multi-asset class investing, and given this focus, many firms are embracing the fact that the ability to deliver alpha across all segments of all asset classes (equities, fixed income, commodities) is not achieved by most firms.
It has become hard for participants in the financial markets to ignore a product category which broke through the US$1 trillion AUM milestone for the first time at the end of December 2009. Today there is a growing fan club that cites ETFs as one of the greatest financial innovations in the past two decades.
1. Greenwich Associates conducted interviews with 84 of the largest institutions in Brunei, China, Hong Kong/Macau, India, Indonesia, Malaysia, the Philippines, Singapore, South
Korea, Taiwan and Thailand. Interview topics included asset allocation, product fees paid and compensation.

ETF Landscape June 2011 Celebrating 10 Years of ETFs in Australia from BlackRock
9 This document is not an offer to buy or sell any security or to participate in any trading strategy. Please refer to important information and qualifications at the end of this material.
Figure 5: Global ETF and ETP net new assets by type of exposure, as at end April 2011
Apr-11
Exposure # ETFs /ETPs
ADV (US$ Mn)
Assets(US$ Mn)
NNA (US$ Mn)
YTD-11 NNA (US$ Mn)
2010 NNA (US$ Mn)
Equity 2,275 51,533.1 1,192,973.0 18,882.6 45,126.2 105,540.6 Developed markets 1,748 43,974.6 944,397.3 13,700.9 46,811.4 65,086.4
North America 694 38,984.6 607,398.2 10,103.4 29,061.8 42,852.5 Broad 10 14.1 2,237.0 (62.6) 81.1 669.5 Canada 54 594.2 31,471.0 (568.6) 3,043.5 1,803.7 United States 630 38,376.3 573,690.2 10,734.6 25,937.2 40,379.3
United States sectors 245 8,064.9 129,524.7 685.6 8,343.0 10,786.8 Consumer goods/services 29 1,018.8 11,004.9 (56.2) (254.2) 2,283.4 Energy 38 2,304.5 29,377.7 (610.5) 4,046.9 2,754.7 Financials 34 1,675.0 18,842.1 (767.4) (930.8) 1,334.6 Healthcare 25 312.9 9,997.2 449.9 585.2 (582.1)Industrials 17 578.9 6,949.4 313.6 546.5 1,035.2 Materials 13 827.7 7,581.1 354.6 529.3 859.8 Other 13 20.5 3,121.7 29.1 129.1 215.0 Real estate 23 537.9 18,816.0 328.3 1,133.7 1,157.1 Technology 34 617.4 16,785.9 386.1 2,252.3 1,401.1 Telecommunications 7 10.4 1,247.6 57.6 (34.3) 88.6 Utilities 12 161.0 5,801.0 200.5 339.3 239.3
United States non-sector 385 30,311.3 444,165.4 10,049.0 17,594.2 29,592.5 Europe 513 2,666.5 147,348.4 1,284.4 6,920.9 8,683.0
Broad 174 653.1 62,357.0 (759.4) (1,977.8) 1,770.7 Country 177 1,553.8 68,136.3 1,558.8 7,069.2 6,588.5 Sectors 162 459.6 16,855.1 485.0 1,829.4 323.8
STOXX 600 sectors 97 406.3 11,679.3 335.1 777.5 (119.9)Automobiles and parts 5 41.2 380.8 70.7 (60.1) 75.7 Banks 6 57.4 1,795.2 (160.3) 309.4 78.0 Basic resources 6 70.2 1,224.0 (161.5) (186.4) (223.1)Chemicals 4 10.4 289.4 92.5 (23.3) 18.2 Construction and materials 5 8.4 385.4 (10.1) 53.2 89.1 Financial services 4 10.4 233.2 (3.9) 122.3 3.4 Food and beverage 5 16.1 527.9 157.9 107.3 (179.2)Healthcare 6 14.4 1,096.5 113.2 127.3 (121.4)Industrial goods and services 5 43.1 571.8 90.8 (60.8) 25.9 Insurance 6 33.8 681.0 (45.6) (35.6) (72.2)Media 5 3.0 145.9 (7.1) (29.3) 15.3 Oil and gas 7 24.3 1,687.6 75.9 510.4 11.0 Personal and household goods 4 1.1 281.4 12.9 (72.6) 122.7 Real estate 2 0.8 98.5 7.9 22.9 (21.8)Retail 4 24.3 218.9 45.5 (57.0) 78.2 Technology 6 3.1 322.7 18.9 59.1 (1.7)Telecommunications 6 19.0 879.2 (46.4) 83.2 (153.6)Travel and leisure 4 5.9 152.5 44.1 1.0 41.1 Utilities 7 19.4 707.4 39.7 (93.4) 94.8
Other sectors 65 53.3 5,175.9 149.9 1,052.0 443.7 Asia Pacific 219 1,017.2 84,327.8 742.4 3,201.5 4,913.3 Israel 87 70.1 130.4 3.0 (16.7) (28.3)Global 159 216.7 30,757.7 444.9 2,878.9 3,929.5 Global (ex-US) 76 1,019.3 74,434.9 1,122.8 4,764.9 4,736.5
Emerging markets 527 7,558.5 248,575.7 5,181.7 (1,685.2) 40,454.2 Broad 75 3,665.4 121,243.2 3,408.6 (6,182.0) 32,957.4
Global emerging markets 36 3,579.9 110,638.5 3,160.4 (5,653.7) 28,767.6 Frontier 3 1.8 396.6 4.5 22.1 285.4 Sector 10 7.4 894.2 (53.8) 82.9 426.0 Other 26 76.3 9,313.9 297.6 (633.3) 3,478.3
Regional 48 139.9 9,641.9 251.0 (265.1) 1,451.2 Asia emerging markets 7 18.0 2,297.7 25.2 26.5 621.9 Eastern Europe 13 33.7 2,268.9 255.6 484.5 309.5 Middle East and Africa 10 3.2 620.0 (15.5) 2.3 284.2 Latin America 18 85.0 4,455.3 (14.3) (778.5) 235.6
continued… Note: Global ETF/ETP flows are approximated by combining flows available for the United States, Europe, Canada and Latin America. Product level assets for ETPs listed in Israel are not currently available. An aggregate value has been included in the total assets. Latest data for Israel ETP assets sourced from Bank of Israel, March 2011. NNA – Net New Assets. Data as at end April 2011.

ETF Landscape June 2011 Celebrating 10 Years of ETFs in Australia from BlackRock
This document is not an offer to buy or sell any security or to participate in any trading strategy. Please refer to important information and qualifications at the end of this material. 10
Figure 5: Global ETF and ETP net new assets by type of exposure, as at end April 2011 (continued)
Apr-11
Exposure # ETFs /ETPs
ADV (US$ Mn)
Assets(US$ Mn)
NNA (US$ Mn)
YTD-11 NNA (US$ Mn)
2010 NNA (US$ Mn)
Emerging markets (continued) Country 404 3,753.2 117,690.6 1,522.0 4,761.9 6,045.7
Argentina 1 0.1 3.8 - 3.8 -Brazil 37 1,004.2 20,677.1 126.2 952.7 2,647.0 Chile 2 15.3 980.8 - (52.1) 528.1 China 109 1,143.9 40,511.0 201.7 (457.7) (1,140.6)Colombia 2 3.0 154.1 9.5 (15.9) 158.2 Egypt 1 1.5 67.6 12.4 63.7 (0.2)Hungary 1 0.1 21.2 0.1 (0.3) (0.6)India 47 125.0 8,414.0 (33.3) (235.7) 1,745.0 Indonesia 5 15.6 851.0 20.1 428.8 600.7 Kuwait 1 0.0 51.9 - - 14.6 Malaysia 6 20.5 1,345.3 4.4 (79.1) 324.8 Mexico 18 305.0 8,801.1 85.9 210.8 (2,961.8)Peru 1 30.0 422.6 (84.5) (19.8) 299.8 Philippines 2 1.7 52.3 12.4 23.6 16.0 Poland 4 12.5 451.1 132.9 162.4 209.8 Russia 15 276.2 8,563.8 442.7 2,789.6 1,911.7 Saudi Arabia 2 0.1 29.1 - - -South Africa 28 41.9 3,380.6 (28.3) (73.3) 123.1 South Korea 75 463.7 12,601.2 341.8 807.9 825.7 Taiwan 25 204.3 7,168.5 43.8 203.2 (396.2)Thailand 5 18.7 821.4 62.8 (51.3) 280.0 Turkey 14 61.3 1,635.7 141.0 (68.3) 516.6 UAE 1 0.0 5.1 - - (13.2)Vietnam 2 8.4 680.4 30.3 168.8 357.2
Fixed income 523 2,704.7 225,755.4 2,657.2 10,509.8 40,054.1 Active 13 27.2 1,775.9 (187.1) 525.2 1,119.6 Broad/aggregate 9 110.9 21,430.3 56.3 137.0 2,831.3 Convertible 1 14.1 898.0 109.3 328.9 271.7 Corporate 76 312.6 43,200.8 836.0 2,610.8 7,943.2 Covered 8 9.0 1,097.8 (32.0) (21.1) 360.3 Credit spreads 13 4.1 849.8 (78.3) (137.1) (25.3)Emerging markets 33 94.2 8,511.9 523.0 921.8 3,317.6 Government 289 1,557.4 77,052.9 283.8 (708.3) 14,828.1 Govt/corp 13 57.0 9,699.4 116.8 647.5 2,726.2 High yield 18 219.5 18,802.2 627.6 3,059.4 6,469.7 Inflation 24 143.4 28,936.5 579.0 1,839.8 738.1 Money market 22 133.5 9,019.8 (342.4) 929.5 (1,026.9)Mortgage 4 21.8 4,480.1 165.4 376.3 500.6
Commodities 768 8,957.1 220,662.1 2,763.0 9,039.9 21,620.1 Broad 118 316.7 27,930.3 671.2 3,765.8 2,809.7 Alternative 2 0.1 6.1 0.8 0.0 (0.9)Agriculture 148 260.4 16,036.3 10.7 3,569.5 (45.8)Energy 151 1,028.3 14,259.0 (1,062.6) (532.8) (1,183.6)Industrial metals 115 81.8 5,804.0 287.3 1,372.8 788.9 Livestock 26 3.6 249.8 (0.1) 45.4 (21.9)Precious metals 208 7,266.2 156,376.6 2,855.7 819.2 19,273.8
Currency 142 382.6 7,835.7 389.7 935.2 (1,835.2)Alternative 42 560.7 4,931.1 578.5 1,199.6 4,438.1 Mixed 69 15.6 1,586.5 48.6 343.2 502.5 Total 3,819 64,153.8 1,670,916.2 25,319.5 67,153.8 170,320.3
Note: Global ETF/ETP flows are approximated by combining flows available for the United States, Europe, Canada and Latin America. Product level assets for ETPs listed in Israel are not currently available. An aggregate value has been included in the total assets. Latest data for Israel ETP assets sourced from Bank of Israel, March 2011. NNA – Net New Assets. Data as at end April 2011. Source: Global ETF Research and Implementation Strategy Team, BlackRock, National Stock Exchange (NSX), Bloomberg.
ETF Landscape June 2011 Celebrating 10 Years of ETFs in Australia from BlackRock
11 This document is not an offer to buy or sell any security or to participate in any trading strategy. Please refer to important information and qualifications at the end of this material.
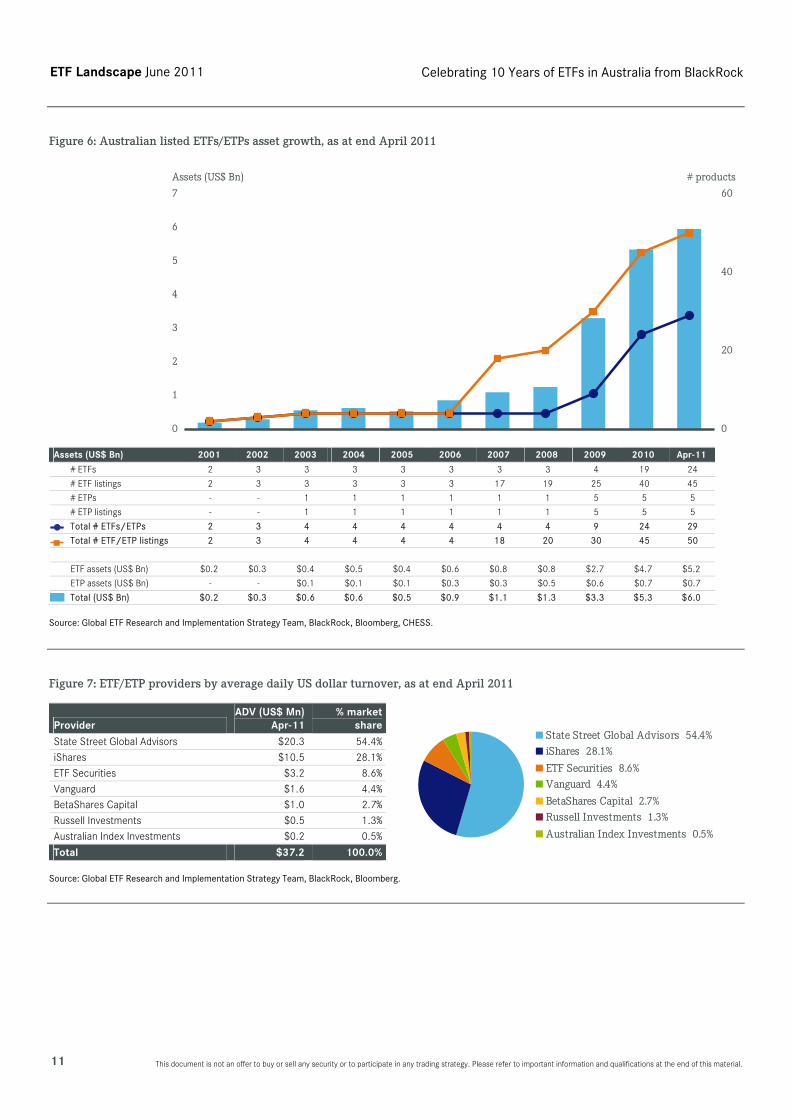
Figure 6: Australian listed ETFs/ETPs asset growth, as at end April 2011
0
1
2
3
4
5
6
7
Assets (US$ Bn)
0
20
40
60
# products
Assets (US$ Bn) 2001 2002 2003 2004 2005 2006 2007 2008 2009 2010 Apr-11
# ETFs 2 3 3 3 3 3 3 3 4 19 24
# ETF listings 2 3 3 3 3 3 17 19 25 40 45
# ETPs - - 1 1 1 1 1 1 5 5 5
# ETP listings - - 1 1 1 1 1 1 5 5 5
Total # ETFs/ETPs 2 3 4 4 4 4 4 4 9 24 29
Total # ETF/ETP listings 2 3 4 4 4 4 18 20 30 45 50
ETF assets (US$ Bn) $0.2 $0.3 $0.4 $0.5 $0.4 $0.6 $0.8 $0.8 $2.7 $4.7 $5.2
ETP assets (US$ Bn) - - $0.1 $0.1 $0.1 $0.3 $0.3 $0.5 $0.6 $0.7 $0.7
Total (US$ Bn) $0.2 $0.3 $0.6 $0.6 $0.5 $0.9 $1.1 $1.3 $3.3 $5.3 $6.0 Source: Global ETF Research and Implementation Strategy Team, BlackRock, Bloomberg, CHESS.
Figure 7: ETF/ETP providers by average daily US dollar turnover, as at end April 2011
Provider ADV (US$ Mn)
Apr-11 % market
share State Street Global Advisors $20.3 54.4%
iShares $10.5 28.1%
ETF Securities $3.2 8.6%
Vanguard $1.6 4.4%
BetaShares Capital $1.0 2.7%
Russell Investments $0.5 1.3%
Australian Index Investments $0.2 0.5%
Total $37.2 100.0%
State Street Global Advisors 54.4%iShares 28.1%
ETF Securities 8.6%Vanguard 4.4%
BetaShares Capital 2.7%Russell Investments 1.3%
Australian Index Investments 0.5%
Source: Global ETF Research and Implementation Strategy Team, BlackRock, Bloomberg.
ETF Landscape June 2011 Celebrating 10 Years of ETFs in Australia from BlackRock
This document is not an offer to buy or sell any security or to participate in any trading strategy. Please refer to important information and qualifications at the end of this material. 12
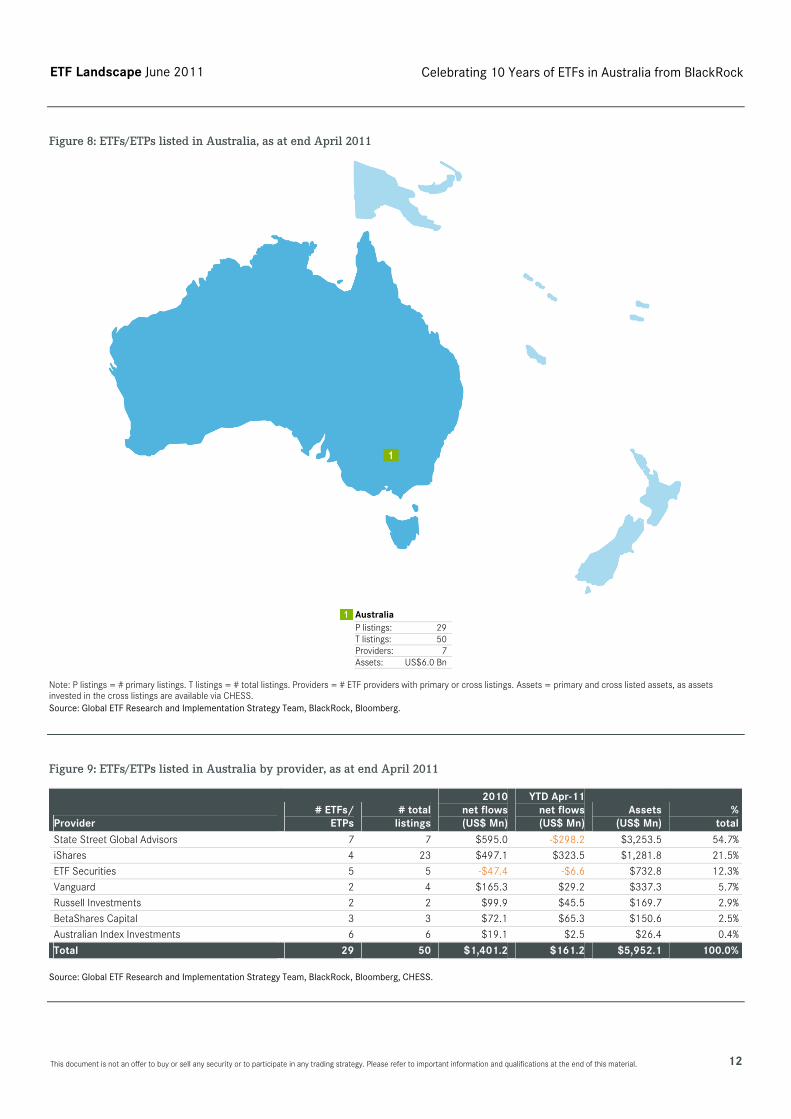
Figure 8: ETFs/ETPs listed in Australia, as at end April 2011
11
Australia P listings: 29 T listings: 50 Providers: 7 Assets: US$6.0 Bn
Note: P listings = # primary listings. T listings = # total listings. Providers = # ETF providers with primary or cross listings. Assets = primary and cross listed assets, as assets invested in the cross listings are available via CHESS. Source: Global ETF Research and Implementation Strategy Team, BlackRock, Bloomberg.
Figure 9: ETFs/ETPs listed in Australia by provider, as at end April 2011
Provider # ETFs/
ETPs# total
listings
2010net flows(US$ Mn)
YTD Apr-11 net flows (US$ Mn)
Assets(US$ Mn)
%total
State Street Global Advisors 7 7 $595.0 -$298.2 $3,253.5 54.7%
iShares 4 23 $497.1 $323.5 $1,281.8 21.5%
ETF Securities 5 5 -$47.4 -$6.6 $732.8 12.3%
Vanguard 2 4 $165.3 $29.2 $337.3 5.7%
Russell Investments 2 2 $99.9 $45.5 $169.7 2.9%
BetaShares Capital 3 3 $72.1 $65.3 $150.6 2.5%
Australian Index Investments 6 6 $19.1 $2.5 $26.4 0.4%
Total 29 50 $1,401.2 $161.2 $5,952.1 100.0% Source: Global ETF Research and Implementation Strategy Team, BlackRock, Bloomberg, CHESS.
1

ETF Landscape June 2011 Celebrating 10 Years of ETFs in Australia from BlackRock
13 This document is not an offer to buy or sell any security or to participate in any trading strategy. Please refer to important information and qualifications at the end of this material.
Figure 10: ETFs/ETPs listed in Australia by exposure, as at April 2011
Asset class/exposure # ETFs/
ETPs # total
listings
2010net flows(US$ Mn)
YTD Apr-11 net flows (US$ Mn)
Assets (US$ Mn)
%total
Equity 23 44 $1,448.6 $102.4 $5,152.0 86.6%Broad exposure - 8 $203.2 $125.5 $571.5 9.6%
Global (ex-US) - 2 $30.1 $7.0 $88.8 1.5%
Global - 5 $163.7 $111.6 $446.8 7.5%
Other - 1 $9.5 $6.9 $35.9 0.6%
Regional exposure - 2 $37.0 $17.9 $93.7 1.6%
Europe - 1 $13.7 $3.4 $34.5 0.6%
Asia Pacific - 1 $23.3 $14.5 $59.2 1.0%
Single country exposure 23 34 $1,208.3 -$41.0 $4,486.8 75.4%
Australia 23 23 $1,061.6 -$253.9 $3,947.8 66.3%
Japan - 1 $9.2 $45.8 $57.0 1.0%
Taiwan - 1 $2.9 $4.4 $25.5 0.4%
South Korea - 1 $2.6 $1.3 $14.3 0.2%
China - 1 $6.6 $1.5 $42.6 0.7%
Hong Kong - 1 -$0.6 $0.0 $7.5 0.1%
Singapore - 1 -$0.4 $0.0 $4.7 0.1%
United States - 5 $126.4 $159.8 $387.3 6.5%
Commodities 5 5 -$47.4 -$6.6 $732.8 12.3%Precious metals 5 5 -$47.4 -$6.6 $732.8 12.3%
Broad – precious metals 1 1 $0.7 $0.0 $8.0 0.1%
Gold 1 1 -$56.8 -$25.5 $650.4 10.9%
Platinum 1 1 -$2.0 $0.0 $4.5 0.1%
Palladium 1 1 -$1.5 $0.0 $1.8 0.0%
Silver 1 1 $12.3 $19.0 $68.0 1.1%
Currency 1 1 $0.0 $65.3 $67.3 1.1%Single country exposure 1 1 $0.0 $65.3 $67.3 1.1%
United States 1 1 $0.0 $65.3 $67.3 1.1%
Total 29 50 $1,401.2 $161.2 $5,952.1 100.0%
Asset class Exposure
Equity 86.6%
Commodities 12.3%
Currency 1.1%
Australia 66.3% Broad - other 0.6%
Gold 10.9% Europe 0.6%
United States 7.6% Taiwan 0.4%
Broad - global 7.5% South Korea 0.2%
Broad - global (ex-US) 1.5% Broad - precious metals 0.1%
Silver 1.1% Hong Kong 0.1%
Asia Pacific 1% Platinum 0.1%
Japan 1% Singapore 0.1%
China 0.7% Palladium 0%
Source: Global ETF Research and Implementation Strategy Team, BlackRock, Bloomberg, CHESS.

ETF Landscape June 2011 Celebrating 10 Years of ETFs in Australia from BlackRock
This document is not an offer to buy or sell any security or to participate in any trading strategy. Please refer to important information and qualifications at the end of this material. 14
Figure 11: ETFs/ETPs listed in Australia by index provider, as at end April 2011
Index provider # ETFs/
ETPs # total
listings
2010net flows(US$ Mn)
YTD Apr-11 net flows (US$ Mn)
Assets(US$ Mn)
%total
S&P 19 28 $1,124.1 -$65.1 $4,363.0 73.3%
MSCI 2 11 $203.1 $113.4 $538.5 9.0%
Russell 2 3 $100.6 $46.5 $175.0 2.9%
FTSE - 2 $20.8 $7.7 $75.4 1.3%
Other 6 6 -$47.4 $58.8 $800.1 13.4%
Total 29 50 $1,401.2 $161.2 $5,952.1 100.0%
S&P 73.3%
MSCI 9%Russell 2.9%FTSE 1.3%Other 13.4%
Source: Global ETF Research and Implementation Strategy Team, BlackRock, Bloomberg, CHESS.
Figure 12: Australian institutions reported holding ETFs
0
2
4
6
8
10# institutions
Region ETF listed 2004 2005 2006 2007 2008
Any ETF 1 2 8 7 8
United States listed ETF 1 2 3 3 7
Europe listed ETF - - 1 1 1
ROW listed ETF - - 4 4 - Source: Global ETF Research and Implementation Strategy Team, BlackRock, Thomson Reuters.

ETF Landscape June 2011 Celebrating 10 Years of ETFs in Australia from BlackRock
15 This document is not an offer to buy or sell any security or to participate in any trading strategy. Please refer to important information and qualifications at the end of this material.
Figure 13: Top 10 ETFs/ETPs listed in Australia by assets, as at end April 2011
Name TickerAssets
(US$ Mn)ADV
(US$ Mn) YTD net flows
(US$ Mn)SPDR S&P/ASX 200 Fund STW AU $2,529.9 $18.1 -$347.8
ETFS Physical Gold GOLD AU $650.4 $2.0 -$25.5
SPDR S&P/ASX 200 Listed Property Fund SLF AU $332.0 $1.2 $7.2
iShares S&P 500 Index Fund IVV AU $313.3 $2.5 $127.1
SPDR S&P/ASX 50 Fund SFY AU $304.5 $0.9 $9.8
Vanguard Australian Shares Index ETF VAS AU $242.3 $0.9 -$2.1
iShares S&P Global 100 Index Fund IOO AU $218.8 $1.0 $72.5
iShares MSCI Emerging Markets Index Fund IEM AU $188.3 $0.8 $28.0
Russell High Dividend Australian Shares ETF RDV AU $156.5 $0.4 $34.4
ETFS Physical Silver ETPMAG AU $68.0 $1.2 $19.0 Source: Global ETF Research and Implementation Strategy Team, BlackRock, Bloomberg, CHESS.
Figure 14: Top 10 ETFs/ETPs listed in Australia by average daily US dollar trading volume, as at end April 2011
Name TickerADV
(US$ Mn)Assets
(US$ Mn) YTD net flows
(US$ Mn)SPDR S&P/ASX 200 Fund STW AU $18.1 $2,529.9 -$347.8
iShares S&P Asia 50 Index Fund IAA AU $2.7 $59.2 $14.5
iShares S&P 500 Index Fund IVV AU $2.5 $313.3 $127.1
ETFS Physical Gold GOLD AU $2.0 $650.4 -$25.5
ETFS Physical Silver ETPMAG AU $1.2 $68.0 $19.0
SPDR S&P/ASX 200 Listed Property Fund SLF AU $1.2 $332.0 $7.2
iShares MSCI Australia 200 Index Fund IOZ AU $1.0 $45.1 -$1.5
iShares S&P Global 100 Index Fund IOO AU $1.0 $218.8 $72.5
BetaShares US Dollar ETF USD AU $1.0 $67.3 $65.3
SPDR S&P/ASX 50 Fund SFY AU $0.9 $304.5 $9.8 Source: Global ETF Research and Implementation Strategy Team, BlackRock, Bloomberg, CHESS.
Figure 15: Top 10 ETFs/ETPs listed in Australia by YTD net inflows, as at end April 2011
Name TickerYTD net flows
(US$ Mn)Assets
(US$ Mn) ADV
(US$ Mn)iShares S&P 500 Index Fund IVV AU $127.1 $313.3 $2.5
iShares S&P Global 100 Index Fund IOO AU $72.5 $218.8 $1.0
BetaShares US Dollar ETF USD AU $65.3 $67.3 $1.0
iShares MSCI Japan Index Fund IJP AU $45.8 $57.0 $0.2
Russell High Dividend Australian Shares ETF RDV AU $34.4 $156.5 $0.4
iShares MSCI Emerging Markets Index Fund IEM AU $28.0 $188.3 $0.8
Vanguard Total Stock Market ETF VTS AU $25.2 $48.1 $0.4
ETFS Physical Silver ETPMAG AU $19.0 $68.0 $1.2
iShares S&P Asia 50 Index Fund IAA AU $14.5 $59.2 $2.7
SPDR S&P/ASX 200 Financials Ex A-REIT Fund OZF AU $11.1 $11.7 $0.0 Source: Global ETF Research and Implementation Strategy Team, BlackRock, Bloomberg, CHESS.

ETF Landscape June 2011 Celebrating 10 Years of ETFs in Australia from BlackRock
This document is not an offer to buy or sell any security or to participate in any trading strategy. Please refer to important information and qualifications at the end of this material. 16
The continued strong growth in Australia’s managed funds assets has been underpinned by Australia’s mandatory retirement income system, reaching US$1.8 trillion at the end of 2010. Australia’s managed funds assets are equivalent to over 130% of the country’s nominal GDP and represents around 126% of domestic equity market capitalisation.
Australia’s managed funds assets under management continues to rank fourth largest in the world according to the Investment Company Institute (ICI).
Superannuation funds continue to drive growth in the Australian Funds Management Industry, with the total market share of 80%, once incorporating pension funds held by life insurance offices.
In terms of total funds management, funds from wholesale (institutional) sources accounted for 69% of AUM in December 2010.
Foreign-owned fund managers have been active, with 12 out of the 20 largest fund managers headquartered overseas. Total managed fund assets of these foreign companies account for around 42% of the wholesale market.
The retail market has been dominated by domestic large institutions with 15 out of the 20 largest fund managers of local origin. Total managed fund assets of these domestic companies accounted for 85% of the entire retail market.
Source: Australian Trade Commission, Data Alert March 2011.
Figure 16: Australia’s managed funds, as at year end 2010
0
500
1,000
1,500
2,000
Assets (US$ Bn)
Assets (US$ Bn) 2005 2006 2007 2008 2009 2010
Managed funds industry consolidated assets $940 $1,182 $1,596 $1,062 $1,544 $1,835
Unconsolidated assets: Total managed funds institutions $984 $1,243 $1,618 $1,082 $1,573 $1,881
Superannuation (pension) funds $582 $761 $1,033 $686 $1,061 $1,308
Public offer (retail) unit trusts $186 $237 $295 $200 $257 $293
Life insurance corporations $175 $198 $230 $150 $207 $238
Other $42 $47 $60 $46 $49 $42 Source: Australian Trade Commission, Data Alert March 2011, Australian Bureau of Statistics (ABS) Cat. No. 5655.0 Managed Funds, Australia, Dec 2010, Tables 1 and 2 (released 25 Feb 2011), ABS Cat No. 5206.0 Australian National Accounts: National Income, Expenditure and Product, Table 3 (released 2 Mar 2011); Australian Securities Exchange, Market Statistics; Austrade.

ETF Landscape June 2011 Celebrating 10 Years of ETFs in Australia from BlackRock
17 This document is not an offer to buy or sell any security or to participate in any trading strategy. Please refer to important information and qualifications at the end of this material.
The history of ETFs
The first stock market index was created in 1896 by Charles Dow, which became the Dow Jones Industrial Average. In 1975 Charles Ellis highlighted the shortfall of active managers in his often referenced article ‘The Loser's Game’ published in the Financial Analysts Journal, July/August 1975. He reported that over the prior decade 85% of all institutional investors who tried to beat the stock market underperformed the S&P 500 Index. The first indexed mutual fund was launched in the United States in 1976.
Beta is the ‘market return’ associated with an asset class and is most commonly accessed through index tracking funds.
The indexing concept began to gain acceptance from investors seeking exposure to the broad equity market – something not delivered by traditional funds. The costs associated with these traditional strategies were also causing concern and indexing was seen as a very cost-effective alternative.
Products were concentrated in United States equities, and by the middle of the decade both institutional and retail investors had access to index funds. The key innovation during this time was overcoming the practical complexity of managing such large portfolios. Much of the analysis that can be done at the click of a button today would have taken hours of meticulous examination using ledgers and notebooks.
Moving on to the 1980s we witnessed indexing crossing the Atlantic and the first United Kingdom equity index funds were created. The drivers behind the spread of indexing remained unchanged but products began to expand beyond larger cap domestic equities to cover smaller cap stocks, overseas equities and fixed income. Key developments came in risk management systems that made it possible to manage even broader benchmarks. By the end of the 1980s, a number of pooled or commingled funds were available offering simplicity, flexibility and the benefits of scale.
The 1990s saw a very pronounced phase of growth for index funds with assets under management increasing fourfold. Growth was fuelled by poor active fund performance, while investors continued to find the combination of lower costs and diversification attractive. Further product developments saw emerging market index funds created as well as products offering exposure to particular market segments, such as size, style and duration. Perhaps the biggest innovation came in the creation of ETFs.
The Canadian ETF market
9 March 2011 marked the 21st anniversary of the first ETF globally, which listed in Canada in 1990. Twenty one years ago on 9 March 1990, the first ETF was listed in Canada on the Toronto Stock Exchange (TSX): the TIPs (Toronto 35 Index Participation Fund) tracking the TSX 35 Index.
It was followed by the HIPs (Hundred Index Participation Fund) tracking the TSX 100 Index on 26 September 1995. 11 years ago on 7 March 2000, the TIPs and HIPs ETFs were merged into the iUnits S&P/TSE Index Participation Fund (XIU CN): an ETF that was originally listed on 4 October 1999.
At the end of April 2011, the Canadian ETF industry had 180 ETFs, 211 exchange listings, and assets of US$43.1 Bn from four providers on one exchange. This compares to 134 ETFs and assets of US$33.0 Bn from four providers on one exchange at the end of April 2010.
The United States ETF market
29 January 2011 marked the 18th anniversary of the first ETF to list in the United States. The SPDR (‘Spider’) or Standard and Poor’s Depository Receipt (SPY US) was listed on the American Stock Exchange (AMEX) by State Street Global Advisors (SSgA) on 29 January 1993.
Barclays Global Investors (BGI) worked with Morgan Stanley to list the first family of ETFs in 1996: WEBS (World Equity Benchmark Shares) providing investors with 17 foreign country index portfolios ranging from Austria to Australia tracking MSCI indices.
On 9 May, 2000, BGI rebranded WEBS to ‘iShares’. While SPDRs were organised as unit investment trusts, WEBS were set up as open-ended investment companies, the first of their kind. In 1999, BGI, SSgA and Vanguard each announced that they planned to launch families of ETFs in the United States.
ETFs in the United States are typically equity or fixed income index tracking funds (a few ETFs have been launched which are not designed to track an index) registered under the 1940 Investment Company Act. These ETFs hold securities using either a ‘fully replicated’ or an ‘optimised’ basket of securities which are designed to track the index and distribute dividends.
The term ETPs is used to describe products which are structured as grantor trusts, commodity pools or partnerships which are registered under the Securities Act of 1933 and are not 1940 Act funds.
By the end of 1999, the ETF industry had grown to 33 products with US$40 Bn in assets under management. The early users of ETFs were mostly institutional investors from around the world. Many were using the ETFs listed in the United States typically to equitise cash as many long only fund managers could not or did not want to use futures or because futures did not exist.
ETFs were also used for difficult to access markets such as Korea or Taiwan and as a way to implement shorts or hedges as ETFs listed in the United States were until July 2007 one of a few products which had an exemption to the uptick rule (which allows investors to short even when the last price is ticking down).
At the end of April 2011, the ETF industry in the United States had 972 ETFs and assets of US$997.3 Bn, from 29 providers on two exchanges. iShares is the largest ETF provider in terms of both number of products and assets, 218 ETFs and US$472.2 Bn respectively, reflecting 47.3% market share, followed by State Street Global Advisors with 99 ETFs, assets of US$195.6 Bn and 19.6% market share.
The European ETF market
11 April 2011 marked the 11th anniversary of ETFs in Europe. The first ETFs to launch in Europe were the iShares DJ STOXX 50 (EUN1 GY) and iShares DJ Euro STOXX 50 (EUN2 GY) on 11 April 2000 on the Deutsche Boerse, followed by the iShares FTSE 100 (ISF LN) on the LSE extraMARK segment on 28 April 2000. The first two ETFs were originally branded as ‘LDRS’, sponsored by Merrill Lynch International and later acquired by iShares in September 2003.
The rate of growth in terms of assets, number of products and providers has been greater in Europe than the experience of ETFs in the early years in the United States.

ETF Landscape June 2011 Celebrating 10 Years of ETFs in Australia from BlackRock
This document is not an offer to buy or sell any security or to participate in any trading strategy. Please refer to important information and qualifications at the end of this material. 18
Projects to launch ETFs in Europe were undertaken by teams at a number of firms and exchanges in Europe in 1999. At the time there were over 60 institutions in Europe, which reported using ETFs listed in the United States1. Many European institutional investors were asking for ETFs that were listed on exchanges in Europe and structured as European UCITS funds (Undertakings for Collective Investment in Transferable Securities) – a set of mutual fund regulations set out in 1985.
Bringing an ETF to market requires an ‘ETF consortium’ or ‘ETF ecosystem’ which is composed of the ETF provider/manager, index manager, stock exchange, market maker/brokers and investors. ETFs in Europe originally tried to copy United States listed ETFs as closely as possible. The first ETFs were structured as UCITS which are open-ended funds (the same structure used by mutual funds), holding securities using either a fully replicated or optimised baskets of securities which are designed to track the index with distribution of dividends.
The competition to create and the race to list and cross list ETFs on exchanges across Europe began. By the end of October 2000, the first ETF was listed on the Stockholm Stock Exchange (now known as NASDAQ OMX Nordic). Trading began on NYSE Euronext in January 2001 when NextTrack began trading ‘Trackers’ (NextTrack did not call them ETFs to avoid confusion with open end funds that had been listed on the NYSE Euronext for years) first in Paris and Amsterdam followed by Brussels in October 2002.
The Swiss Stock Exchange (now known as SIX Swiss Exchange) listed its first ETF in March 2001, the Helsinki Stock Exchange listed the HEX25 in February of 2002 and Borsa Italiana opened the MTF segment dedicated to ETFs in September 2002.
ETFs were launched on the Iceland Stock Exchange in December 2004, the Norwegian Stock Exchange in March 2005, the Irish Stock Exchange in April 2005, the Austrian Stock Exchange in November 2005, the Spanish Stock Exchange in July 2006, the Athens Exchange (ATHEX) in January 2008 and the NYSE Euronext Lisbon in September 2008. Boerse Stuttgart introduced their ETF segment called ‘ETF Bestx’ in October 2009. At the end of April 2011 there were 1,128 ETFs with 3,952 listings on 23 exchanges in Europe.
Stock exchanges typically earn revenues from initial administration and admission/listing fees (London Stock Exchange: €5,550, Deutsche Boerse: €3,500, NYSE Euronext: €7,500), plus an annual fee (London Stock Exchange: €970, Deutsche Boerse: Zero, NYSE Euronext: €3,000 – €20,000)2, and transaction costs.
In 2005, the move to UCITS III mutual fund regulations in Europe was significant, allowing increased flexibility in terms of holdings within and across funds and also in the use of derivatives. Specifically, it allowed larger and more investment into ETFs that are UCITS. Prior to UCITS III, a UCITS fund could only at most, invest 5% of its assets into other UCITS funds. Under UCITS III guidelines a fund can invest up to 20% of its assets into another UCITS fund as long as its investment does not account for more than 25% of the NAV of the fund it is investing into. The fund can invest into other UCITS funds following similar guidelines.
UCITS III also allowed, for the first time, the use of listed and OTC derivatives as part of the way a fund is managed – rather than for efficient portfolio management only. This regulatory change in 2005 triggered the trend towards creating swap based ETFs.
Figure 17: Original ETF ecosystem
ETF provider
ExchangeInvestor
Broker/bank/market maker/liquidity providers/APs
Indexprovider
ETF provider
ExchangeInvestor
Broker/bank/market maker/liquidity providers/APs
Indexprovider
Source: Global ETF Research and Implementation Strategy Team, BlackRock.
Over the past few years, many of the major brokerage firms/banks have decided to become providers of ETFs utilising the swap as opposed to security or physical ETF structure. Two models for swap-based ETFs have developed: one model has a single-swap counterparty to the ETF while in the second, the ETF has multiple-swap counterparties.
UCITS III has led to a blurring of the lines of the roles of the firms in the original ETF ecosystem. In the United States, asset managers are managers of ETFs working with banks and brokers which trade and distribute ETFs. In Europe, banks and brokers are more often trading and distributing ETFs and also more often manufacturers of ETFs.
This means they are often both a competitor and a partner (as market makers to other ETF providers). This competitor/partner dilemma is not the case in the United States where ETFs are still physically backed with securities (except in the case of leveraged and inverse ETFs where swaps and other derivatives are used) and therefore banks/brokers have not become managers of ETFs.
Large online brokers and fund platforms in the United States have been embracing ETFs as a competitive marketing tool in the recent months. Charles Schwab has started to offer its own ETFs and commission free trading while Fidelity has partnered with iShares to offer commission free trading on 30 specific iShares. Based on the FSA’s review of platforms, these types of trends are also likely to develop in the United Kingdom and Europe.
We estimate that the trading commissions earned from secondary market trading of United States listed ETFs in 2009 were US$13.2 Bn and US$870.2 Mn in European listed ETFs for the full year 20093.
1. Source ETF Landscape: Annual Review of Institutional Users of ETFs in 2008, BlackRock. 2. Source: ETF Radar magazine. 3. Assumes average trading commission of US$0.03 per share in United States listed ETFs, and 15bps per trade for European listed ETFs. Trading volumes sourced
from Bloomberg.
ETF Landscape June 2011 Celebrating 10 Years of ETFs in Australia from BlackRock
19 This document is not an offer to buy or sell any security or to participate in any trading strategy. Please refer to important information and qualifications at the end of this material.
Trade reporting for ETFs is currently not required under the Markets in Financial Instruments Directive (MiFID). It is estimated that about only one-third of trades are reported in Europe which means that even secondary market trading is more robust than what can be seen ‘on-screen’. We hope that MiFID II will require ETF trade reporting and a consolidated tape for Europe which is already the case in the United States.
At about the same time, investors were increasingly requesting exposure to commodities via ETFs. For an ETF to be UCITS compliant its index and portfolio must meet diversification requirements. Since many commodity indices only include one or a limited set of commodities they are not considered to be diversified.
This pushed product providers to look at alternative wrappers/structures that are similar to ETFs in the way the trade and settle and have the daily creation/redemption mechanism but are not funds and thus do not need to meet UCITS diversification requirements.
This led to the introduction of Exchange Traded Notes (ETNs) or Exchange Traded Commodities (ETCs) which are unsubordinated debt securities issued by a financial institution. ETNs/ETCs have a maturity date and are backed by the credit of the issuer, while some are backed by physical commodities such as gold, silver, platinum and palladium; others may be issued by special purpose vehicles and may be collateralised by assets that are not related to the reference index.
The index provider STOXX surprised many market participants by announcing that it had awarded multiple licences for STOXX 50 and Euro STOXX 50 indices rather than using the single licence model that had been used so far in the United States. In Europe there are multiple ETFs tracking each major index with official listings on 23 different exchanges, as at the end of April 2011.
This model of multiple ETFs on the same index in Europe has caused fragmentation in liquidity and investor confusion about the difference in the ETFs on the same benchmark offered by multiple firms as well as benefits/differences in using the various exchange listings for the same ETF.
At the end of April 2011, there were 38 different ETFs with 176 listings and assets of US$28.8 Bn in Europe tracking the Euro STOXX 50 Index. Based on feedback from investors, this number of products and listings on a single benchmark has gone beyond the number that is beneficial for them and is only at this point causing confusion and fragmenting liquidity.
The differences between the United States and Europe are numerous and substantial. The United States is one large homogeneous market while Europe is fragmented due to: multiple exchanges, multiple tax and regulatory regimes (each jurisdiction can modify the EU guidelines for UCITS), languages, currencies, home country bias, and captive and tied distribution models. Retail investors account for 40-50% of ETF investors in the United States but only 10-15% in Europe.
The use of ETFs is likely to increase significantly by Independent Financial Advisers (IFAs) in the United Kingdom based on the regulatory proposals outlined on 25 November 2008 in the Retail Distribution Review (RDR) feedback statement by the United Kingdom’s Financial Services Authority (FSA).
In the United States, fee-based advisers (paid by the consumer) have embraced the use of ETFs to a greater degree than commission-based advisers (paid by the product provider). In the United Kingdom the use of ETFs among IFAs is very limited as they are typically multi-tied and tied.
ETFs are not currently included in the tied or multi-tied product sets. The proposals outline the changes the FSA plans to make for the retail investment market to establish a new level of consumer trust and confidence by distinguishing between independent advice and sales advice to create better clarity for consumers (for further information on the United Kingdom Retail Distribution (RDR) review please refer to page 28).
Challenges
ETFs have been embraced because we are in a ‘back to basic’ environment where they provide transparency on the portfolio’s holdings, offer daily creation/redemption, have multiple market makers, have real-time indicate NAVs etc. We risk moving away from this product and description that has been increasingly embraced by retail and institutional investors and find ourselves at an important crossroads.
This new and growing awareness of ETFs is causing more people in various types of firms and regulators to look at ETFs. Many firms are hoping to find a way to make money from the growing ETF industry such as fund ratings firms, consultants, websites, fund platforms, fund research firms to name a few. These new participants and potential tax and regulatory changes are the new forces impacting the traditional ETF ecosystem in 2011.
Investors need to be aware of the various biases that are inherent in many of these new services. Many are focused on the United States listed ETFs, others require the ETF manager/provider to pay to have their ETFs represented/rated, some will require the ETF to be over a specific size and/or be at least a certain age. These biases miss factoring in basic requirements for investors such as ETF structure, domicile, registration and tax reporting to name a few important criteria.
The impact of regulatory changes such as MiFID II, UCITS IV, RDR, AIFM, QII, PRIPs, FATCA, KIID, etc. is an area of considerable uncertainty at this time. Many regulators around the world are looking at rules regarding short selling, the use of derivatives, the use of commodity futures, and transparency of fees to name a few. Many of these documents are in the consultation phase and/or the specific guidelines for implementation have not yet been defined.
We are at an important crossroads in the ETF industry. We are seeing funds calling themselves ETFs which 1) do not provide transparency on their underlying portfolios, 2) do not offer in-kind creation/redemption and 3) do not have real time indicative NAVs (Net Asset Values). Products which are not even funds are being called ETFs.
Now that the industry accounts for over US$1 trillion, product developers are working hard to find ways to put structured products, hedge funds and active funds into and ETF wrapper without maintaining the above basic features of an ETF. If this is allowed to continue we risk confusion, disappointment and disillusionment among investors which would be very negative for the ETF industry.
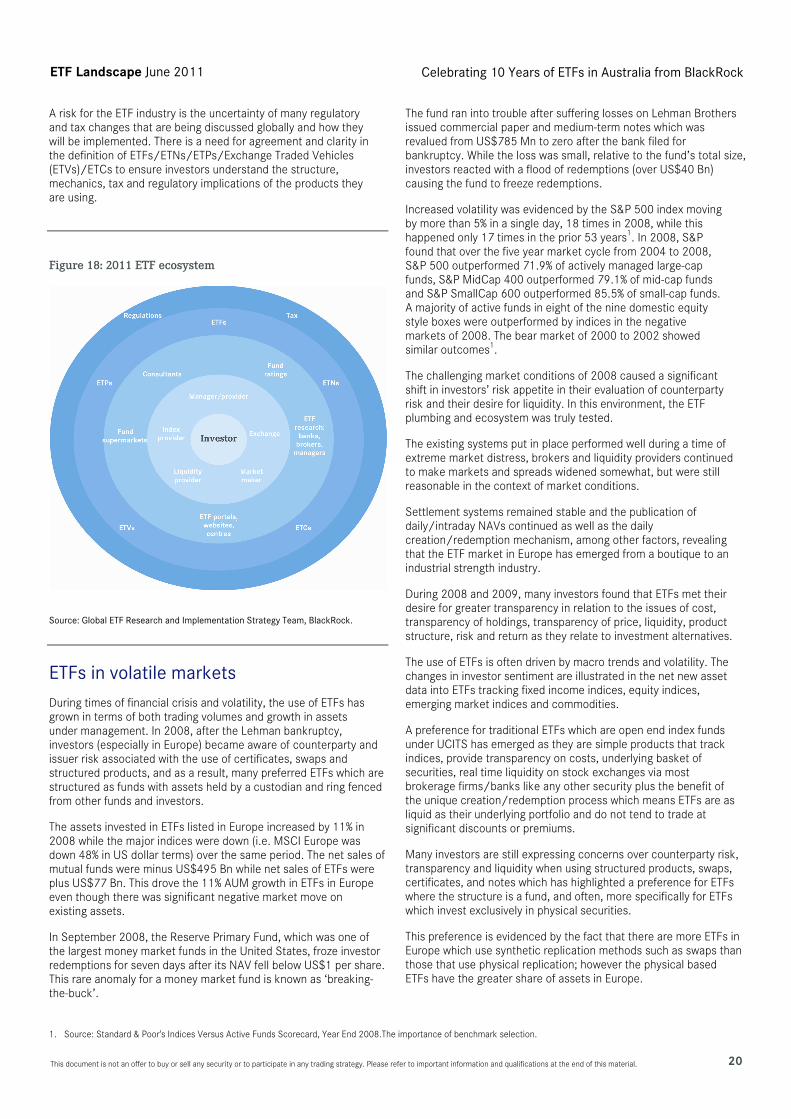
ETF Landscape June 2011 Celebrating 10 Years of ETFs in Australia from BlackRock
This document is not an offer to buy or sell any security or to participate in any trading strategy. Please refer to important information and qualifications at the end of this material. 20
A risk for the ETF industry is the uncertainty of many regulatory and tax changes that are being discussed globally and how they will be implemented. There is a need for agreement and clarity in the definition of ETFs/ETNs/ETPs/Exchange Traded Vehicles (ETVs)/ETCs to ensure investors understand the structure, mechanics, tax and regulatory implications of the products they are using.
Figure 18: 2011 ETF ecosystem
Source: Global ETF Research and Implementation Strategy Team, BlackRock.
ETFs in volatile markets
During times of financial crisis and volatility, the use of ETFs has grown in terms of both trading volumes and growth in assets under management. In 2008, after the Lehman bankruptcy, investors (especially in Europe) became aware of counterparty and issuer risk associated with the use of certificates, swaps and structured products, and as a result, many preferred ETFs which are structured as funds with assets held by a custodian and ring fenced from other funds and investors.
The assets invested in ETFs listed in Europe increased by 11% in 2008 while the major indices were down (i.e. MSCI Europe was down 48% in US dollar terms) over the same period. The net sales of mutual funds were minus US$495 Bn while net sales of ETFs were plus US$77 Bn. This drove the 11% AUM growth in ETFs in Europe even though there was significant negative market move on existing assets.
In September 2008, the Reserve Primary Fund, which was one of the largest money market funds in the United States, froze investor redemptions for seven days after its NAV fell below US$1 per share. This rare anomaly for a money market fund is known as ‘breaking-the-buck’.
The fund ran into trouble after suffering losses on Lehman Brothers issued commercial paper and medium-term notes which was revalued from US$785 Mn to zero after the bank filed for bankruptcy. While the loss was small, relative to the fund’s total size, investors reacted with a flood of redemptions (over US$40 Bn) causing the fund to freeze redemptions.
Increased volatility was evidenced by the S&P 500 index moving by more than 5% in a single day, 18 times in 2008, while this happened only 17 times in the prior 53 years1. In 2008, S&P found that over the five year market cycle from 2004 to 2008, S&P 500 outperformed 71.9% of actively managed large-cap funds, S&P MidCap 400 outperformed 79.1% of mid-cap funds and S&P SmallCap 600 outperformed 85.5% of small-cap funds. A majority of active funds in eight of the nine domestic equity style boxes were outperformed by indices in the negative markets of 2008. The bear market of 2000 to 2002 showed similar outcomes1.
The challenging market conditions of 2008 caused a significant shift in investors’ risk appetite in their evaluation of counterparty risk and their desire for liquidity. In this environment, the ETF plumbing and ecosystem was truly tested.
The existing systems put in place performed well during a time of extreme market distress, brokers and liquidity providers continued to make markets and spreads widened somewhat, but were still reasonable in the context of market conditions.
Settlement systems remained stable and the publication of daily/intraday NAVs continued as well as the daily creation/redemption mechanism, among other factors, revealing that the ETF market in Europe has emerged from a boutique to an industrial strength industry.
During 2008 and 2009, many investors found that ETFs met their desire for greater transparency in relation to the issues of cost, transparency of holdings, transparency of price, liquidity, product structure, risk and return as they relate to investment alternatives.
The use of ETFs is often driven by macro trends and volatility. The changes in investor sentiment are illustrated in the net new asset data into ETFs tracking fixed income indices, equity indices, emerging market indices and commodities.
A preference for traditional ETFs which are open end index funds under UCITS has emerged as they are simple products that track indices, provide transparency on costs, underlying basket of securities, real time liquidity on stock exchanges via most brokerage firms/banks like any other security plus the benefit of the unique creation/redemption process which means ETFs are as liquid as their underlying portfolio and do not tend to trade at significant discounts or premiums.
Many investors are still expressing concerns over counterparty risk, transparency and liquidity when using structured products, swaps, certificates, and notes which has highlighted a preference for ETFs where the structure is a fund, and often, more specifically for ETFs which invest exclusively in physical securities.
This preference is evidenced by the fact that there are more ETFs in Europe which use synthetic replication methods such as swaps than those that use physical replication; however the physical based ETFs have the greater share of assets in Europe.
1. Source: Standard & Poor's Indices Versus Active Funds Scorecard, Year End 2008.The importance of benchmark selection.
ETF Landscape June 2011 Celebrating 10 Years of ETFs in Australia from BlackRock
21 This document is not an offer to buy or sell any security or to participate in any trading strategy. Please refer to important information and qualifications at the end of this material.
At the end of April 2011, there were 718 swap based ETFs with US$146.8 Bn in AUM, compared to 407 physical based ETFs with US$181.0 Bn in AUM.
ETF providers have continued to expand their product ranges in more specialised areas to cater for the growing number of professional and retail investors using ETFs as advanced portfolio construction tools.
The increasing availability of these highly-specialised ETFs across the full spectrum of equities, fixed income and alternative investments now ensures that investors can use ETFs to instantly reallocate capital to take advantage of new investment opportunities.
Capital flows in 2009, within ETFs also demonstrate how these innovative investment products have become important bellwethers to gauge shifts in investor sentiment between asset classes. During 2009, fixed income, equity and commodity-based ETFs enjoyed heavy inflows as some investors adjusted their risk profiles.
At the start of 2009, given rising levels of risk aversion, ETFs tracking equity markets perceived as higher risk suffered much of the capital outflow, notably Asian and global (excluding United States) equities.
The future for ETFs
We expect ETFs to continue to be one of the preferred investment vehicles for low cost beta exposure. Several factors driving this growth include:
Growth in the number of institutional and retail investors who use ETFs and view them as useful tools.
Regulatory changes in the United States and Europe and many emerging markets that allow funds to make larger allocations to ETFs.
The number and types of equity, fixed income, commodity and other indices covered.
Development and growth of investment styles that employ products like ETFs that deliver low cost beta.
The growing number of exchanges, which plan to launch new ETF trading segments.
The expectation that there will be a number of new issuers/managers of ETFs.
Growth in users of ETFs
An analysis of the use of ETFs listed globally by institutional investors around the world, who have reported in their different filing sources including 13F, 13D and 13G, proxy and other declarable stakes from 1997 through the end of 2008 we have seen an increase of 1,673%. This represents a CAGR of 29.9% over the 11 year period.
During 2008, 2,926 investment institutions worldwide reported using one or more ETFs listed on exchanges around the world, these investors were located in 42 countries. The United States, the United Kingdom, Canada, Spain and Switzerland have the largest number of institutional users and account for 83%.
Investment Advisors are the largest category of users accounting for 74% of institutional users. The CAGR for this category over the past 11 years is 31.1%.
Use by hedge funds increased and they were the second largest category representing 15%. Over the past 11 years the CAGR of hedge funds has been 42.4%.
As there is no data source for the number of retail (individual) investors using ETFs, we can only approximate their usage patterns. In the United States, it is estimated that retail investors account for 40-50% of the use of ETFs.
While in the rest of the world (except South Africa – which does have a significant use by retail), consensus feels the use by retail investors is typically less than 10%. We expect the use by retail as well as institutional investors to continue to grow.
Portfolio management, whether index or traditional active, has always involved a deep level of analysis, but while traditional portfolio management is oriented towards stock selection based on fundamentals, modern portfolio theory provides the necessary tools to construct portfolios in a more scientific way.
Benchmarks have been at the centre of the transformation of the portfolio construction process from art to science. The importance of benchmarks can be illustrated through four key uses:
Accurate gauge of ‘the market’ and investor sentiment. Since their inception, market indices have been widely used to monitor overall market sentiment, giving investors the ability to follow global market moves. Condensing the prices of diverse securities in a market to a single statistic is useful because it reveals the net effect of all factors at work in a market. These include not only idiosyncratic factors specific to companies in the index but also broader factors like war, peace, economic expansion (or recession) that can potentially have an impact on share values. Thus, a frequently updated stock market index gives an indication of a country’s economic outlook.
Performance measurement. The performance of a security or a fund cannot be judged unless it is first measured, and measurement is not possible without an objective frame of reference. A benchmark serves as a reliable and consistent gauge of the multiple dimensions of performance: return, risk and correlation. The benchmark not only needs to be theoretically sound, it should also be a fair target for investment managers and representative of the relevant opportunity set.
Asset allocation. It is generally accepted that asset allocation policy is a key driver of investment performance. The weight that different asset classes have in the final policy mix is typically based on the expected return, risk and correlation of each asset class. Benchmarks play a critical role in framing these expectations by providing the historical record for each asset class on these dimensions, and they serve as guidelines for portfolio managers, helping to ensure that investors receive their intended asset class returns.
Investment vehicle. While benchmarks can be seen as theoretical portfolio constructs designed to represent a particular market, the fact that they can be mirrored by an ETF designed to replicate its performance, further validates the concept of the benchmark.

ETF Landscape June 2011 Celebrating 10 Years of ETFs in Australia from BlackRock
This document is not an offer to buy or sell any security or to participate in any trading strategy. Please refer to important information and qualifications at the end of this material. 22
What makes a good benchmark?
Selecting a specific benchmark is an individual decision, but there are some minimum standards that any benchmark under consideration should meet. An effective benchmark should meet most, if not all, of the following criteria:
Unambiguous and transparent: the names and weights of securities comprising a benchmark should be clearly defined.
Investable: the benchmark should contain securities that an investor can purchase in the market or easily replicate.
Priced daily: the benchmark’s return should be calculated regularly.
Availability of historical data: past returns of the benchmark should be available in order to measure historical returns.
Low turnover: an index with high turnover can make it difficult for a portfolio manager to effectively track when the underlying securities are frequently changing.
Published risk characteristics: the benchmark provider should regularly publish detailed risk metrics of the benchmark so that investment managers can compare the actively managed portfolio risks to the passive benchmark risks.
Why are investors using ETFs?
The motivations for using ETFs have expanded, including the ever-relevant cost advantage and broad market access, as well as themes that have emerged over the past year.
Examples of strategies being implemented include managing asset allocation, taking tactical positions and increasing diversification. Investors are also using ETFs to take negative positions in asset classes, either to remove existing unwanted exposure or to express a negative view.
This expansion has been fuelled by the increase in the range of asset classes accessible through ETFs. Moreover, the introduction of ETFs covering emerging markets, commodities and property has allowed investors to access some of the best performing asset classes of the past few years. On top of greater asset breadth, the range of instruments has also grown. This expansion in usage, breadth and product flexibility has driven steady growth in the use of ETFs over the past decade.
The growth in beta investments in recent years has been driven by a number of factors. While market conditions have had a noteworthy influence, some other key factors are driving a more permanent shift towards beta, including:
Access: beta products are providing access to an expanding range of market and asset classes, and through a much wider range of instruments.
Diversification: increasingly investors are widening the scope of their investments and looking for exposure to new asset classes and markets.
The changing role of beta: as investors are altering the way they view their investment objectives, alpha and beta decisions are being combined in different ways.
The range of beta tools available to investors has also grown with traditional index funds, index futures, OTC derivatives and ETFs. ETFs share many characteristics with traditional index funds. Importantly, they also offer intra-day liquidity and enhanced flexibility, allowing investors to take both long and short positions.
ETFs are bought on a commission basis, just like shares. They do not have any sales loads, although they do have annual expenses that range from zero to 1.81%. ETFs have some of the lowest expense ratios among registered investment products. The annual expenses are usually deducted from dividend payments, which are typically paid on a semi-annual basis.
ETFs possess characteristics that make them an alternative to futures and portfolios of shares for investors who are seeking to gain or reduce country, regional, sector and style as well as fixed income and commodity exposure.
ETFs are index funds and not synthetic derivatives. They trade and settle like single shares and are typically backed by baskets of securities designed to track indices. On most exchanges ETFs can be used to go long and short. ETFs offer diversified exposure and lower expense ratios than traditional active and index funds.
A key benefit of the in-kind distribution of securities is that it does not create a tax event in the United States, which could occur if the fund sold securities and delivered cash. This is a special advantage of ETFs versus an open-end indexed mutual fund, which would have to sell securities to meet cash redemptions.
Major players in the ETF market have traditionally been large institutional investors. Historically, institutions have used ETFs to index core holdings or pursue more aggressive market timing and sector rotation strategies.
However, since smaller institutions and retail investors can trade in small lots, they also can invest on the same terms as larger investors. Investors now have a nearly complete toolkit given the array of over 2,000 ETFs that are now available to track indices on a regional, country, sector, or industry basis. ETFs can be used to follow overall movements in particular market segments rather than risk exposure to individual stocks. Institutional use of ETFs is growing.
As the job of most portfolio managers has become broader and deeper, covering developed, emerging markets and frontier markets as well as looking at sectors and countries, we have found that many are admitting that they do not have the time nor resources to try to add value in all markets and are embracing the use of ETFs to gain international market exposure.
This allows them to pick stocks in the markets that they feel they can add value in. In other cases, these ETFs are used to equitise cash or to establish an over or underweight position. ETFs make it easier for investors to participate in all domestic asset classes, global regions and industry sectors. Most importantly, ETFs give investors the opportunity to participate where markets have been showing promise.
ETFs can be effective tools for both active and passive institutional managers and for retail investors. They are a flexible tool that is not a derivative that enables investors to react quickly to short and long term needs or opportunities. As such, they are an alternative to futures, trading baskets of shares trades and the use of traditional active and passive funds.

ETF Landscape June 2011 Celebrating 10 Years of ETFs in Australia from BlackRock
23 This document is not an offer to buy or sell any security or to participate in any trading strategy. Please refer to important information and qualifications at the end of this material.
Understanding the definitions of an ‘ETF’
Many market participants call different types of products ETFs which raises the question of the definition of ETFs. ETFs are index funds that are bought and sold like common stocks on stock exchanges. This flexibility enables investors to purchase and sell shares through any brokerage firm, financial advisor, or online broker, and hold the funds in any type of brokerage account.
Similar to many index funds, ETFs have low portfolio turnover -- which reduces transaction costs incurred by the fund and minimises capital gains distributions to investors in the United States. Similar to common stocks, ETFs can be traded anytime during normal market hours and are priced intra-day, so investors know the value of their investments. In many ways, ETFs are similar to mutual funds although they have many significant differences. Mutual funds are priced once a day after the close of trading once the fund has priced its assets and hence created its NAV for that day.
Once the fund has been priced, all fund unit buy and sell orders that have been accumulated throughout the day are transacted by the mutual fund company. The mutual fund company does all the redeeming and selling of the fund units. This pricing system does not allow you to know beforehand at what price you are going to transact when you place an order to buy or sell a mutual fund. Mutual funds will often charge front load fees, pay rebates and often back end loads.
ETFs, on the other hand, trade on an exchange at real time prices throughout the day like a stock. They are priced continuously based on the value of their underlying portfolio and can be bought and sold any time the market is open. This means you know the price you will receive when you place your order to trade. It also means you can use all of the trading strategies which apply to trading stocks such as limit orders, stop loss orders, short selling, margining, and in some cases even option strategies.
ETFs may prove as liquid as the underlying basket of securities as they have a unique daily creation and redemption process. The ability to continually create or redeem shares helps keep an ETF’s market price in line with its underlying NAV.
A key feature that distinguishes ETFs is that the shares are created by Authorised Participants (APs) or creation/redemption brokers in block-size ‘creation units’.
ETFs tend to trade at, or close to, their underlying NAVs. This is because there are arbitrageurs waiting to take advantage of a significant premium or discount relative to the underlying index. An arbitrageur will buy/sell the ETF and place an offsetting buy/sell transaction in the underlying basket of component securities.
In the United States, most ETFs are structured as open-end management investment companies (the same structure used by mutual funds), although a few ETFs are structured as unit investment trusts.
ETFs have received exemptive orders from the United States Securities and Exchange Commission (SEC), giving it relief from provisions of the Investment Company Act of 1940 that would otherwise not allow the ETF structure. ETFs in the United States typically hold securities using either a ‘fully replicated’ or an ‘optimised’ basket of shares, which are designed to track the index.
The SEC defines an ETF as investment companies that are legally classified as open-end companies or Unit Investment Trusts (UITs) that differ from traditional open-end companies and UITs in the following respects1:
ETFs do not sell individual shares directly to investors and only issue their shares in large blocks (blocks of 50,000 shares, for example) that are known as ‘creation units.’
Investors generally do not purchase creation units with cash. Instead, they buy creation units with a basket of securities that generally mirrors the ETF’s portfolio. Those who purchase creation units are frequently institutions.
After purchasing a creation unit, an investor often splits it up and sells the individual shares on a secondary market. This permits other investors to purchase individual shares (instead of creation units).
Investors who want to sell their ETF shares have two options: (1) they can sell individual shares to other investors on the secondary market, or (2) they can sell the creation units back to the ETF. In addition, ETFs generally redeem creation units by giving investors the securities that comprise the portfolio instead of cash. So, for example, an ETF invested in the stocks contained in the Dow Jones Industrial Average (DJIA) would give a redeeming shareholder the actual securities that constitute the DJIA instead of cash. Because of the limited redeemability of ETF shares, ETFs are not considered to be – and may not call themselves – mutual funds.
An ETF should:
Identify itself as an ETF in any sales literature; issues shares that are approved for listing and trading on a securities exchange.
Disclose each business day on its publicly available web site the prior business day's net asset value and closing market price of the fund's shares, and the premium or discount of the closing market price against the net asset value of the fund's shares as a percentage of net asset value; and
Disclose each business day on its publicly available web site the identities and weighting of the component securities and other assets held by the fund
Response to the Financial Stability Board’s (FSB’s) report on ETFs
Recent efforts by the FSB, the Bank for International Settlements (BIS) and the International Monetary Fund (IMF) have sought to increase the understanding of the ETFs and ETPs (notes, partnerships, grantor trusts, commodity pools and other non-fund structures). The original ETF structure in the United States and what followed originally in London was very simple for investors to understand. The first generation ETFs were funds that held an underlying basket of securities designed to track the benchmark of the fund.
They offered daily transparency of the list of securities and their weights, cost efficient, liquidity was supported by multiple market makers and brokers who are authorised to do creation/redemptions brokers allowing all investors access to a diverse tool box of useful exposures. After UCITS III introduced greater flexibility in the ability to use derivatives in the way funds and ETFs are managed, many ETF providers along with mutual funds in Europe embraced the use of listed and OTC derivatives as the way they run the funds.
1. Source: U.S. Securities and Exchange Commission (SEC), www.sec.gov/answers/etf.htm.

ETF Landscape June 2011 Celebrating 10 Years of ETFs in Australia from BlackRock
This document is not an offer to buy or sell any security or to participate in any trading strategy. Please refer to important information and qualifications at the end of this material. 24
The move to synthetic ETFs (generation two ETFs) has created many different models of ETFs being offered by various providers. This has changed the level of transparency of the underlying holdings, understanding of the costs and transparency on costs of synthetic ETFs.
A greater area of concern for me is the practice of many to call products that are not funds ETFs. This is true even in the United States where the SEC provides a definition of ETFs as open-end companies or Unit Investment Trusts. There is a growing array of notes, partnerships, grantor trusts, and commodity pools (ETNs, ETCs, ETVs, and ETPs) that are often confused with ETFs. These products often carry very different, counterparty, regulatory and tax implications for investors. Consistency in definitions, clarity and transparency on these products is also vitally important for regulators and investors.
Greater transparency of ETF trades is also needed. Today, under the Markets in Financial Instruments Directive, ETF trade reporting is not required for most trades. MiFID II should require all ETF trades to be reported and provide for a consolidated tape. This will provide a greater level of price discovery, tighter spreads and give all investors better transparency into the real secondary liquidity in ETFs.
Given the significant success of ETFs and ETPs over the past few years and the expectation that this growth will continue it is important that the regulators and investors understand and consider the risks. The Financial Stability report focused on:
Risks posed by financial innovation.
The inherent conflicts in swap based ETFs entering derivative contracts with their promoters’ investment banking arm.
Securities lending.
The distinction between fund and note structures.
This report is the successor to a number of papers that have raised concerns around the types of exposures available through ETPs and fears around systemic risk. While echoing the calls for transparency and disclosure it goes further and calls for promoters to make publically available detailed information around product composition, risk characteristics and the collateral and supporting frameworks for synthetic ETFs and securities lending programmes.
Holding out the prospect that this may come through regulation it is interesting to note that one provider has already seen the writing on the wall and announced its intention to publish its collateral holdings going forward.
The report perhaps missed a trick in not focusing in more depth on the risks posed by ETNs and certificates. Certainly it was the realisation that investors had 100% counterparty exposure to AIG that focused many minds in 2008 that, while an ETN might trade and settle like an ETF, it did not have the same type of risks as the latter structure. While many available ETNs are now collateralised, and the arguments about disclosure of collateral apply equally to them, it remains the case that neither the investment exposures they offer nor the robustness – or not – of the delivery structure are anything other than very lightly regulated.
There is then rightly, as the reports identify, a debate to be had about the type of exposures that a retail investor can access through an ETF. However, it is important that any reform captures also ETNs both in terms of investment exposure but also regulation of the delivery vehicle. The report also omits to draw out the distinction between funds using a basket swap construction and those that utilise fully funded swaps.
This is important in as much as the latter requires an over collateralisation of securities which, if properly structured, will be held in the name of the fund under a tripartite arrangement allowing for immediate sell-down if required. The basket model means that the fund holds securities at the direction of the investment bank but without any over collateralisation or requirement that the securities meet minimum collateral requirements as to quality.
This does not, as the report suggests, present liquidity issues as in the correctly structured framework the investment bank has to buy back these securities to meet redemptions, however the fund holding less liquid securities should the counterparty default might lead to liquidity concerns.
Overall the thrust of this report and those issued by the BIS and IMF last week points to a significant concern around systemic risk posed especially by synthetic ETFs of the “in house” model and to a lesser extent securities lending.
As ever the solution to these fears is full disclosure and transparency to eliminate any conflicts of interest or perceived conflict of interest. Clarity, consistency, transparency of product structures, domiciles, underlying holdings, costs, swap counterparties and authorised participants are essential for the future success.
Education is very important. We have embraced the need for clarity on these issues by providing free of charge the ETF Landscape monthly industry reports and ETF Landscape quarterly handbook which provides details including structure, underlying holdings, AUM etc of all ETFs, ETNs, ETCs, ETVs, ETPs from all providers at no cost to professional investors.
2010 was noted for:
Trillion dollar milestones
The global ETF industry broke through the US$1 trillion milestone at the start of 2010, starting the year with US$1 trillion (US$1,032 Bn); 45.2% above US$710.9 Bn at the beginning of 2009, while the United States ETF/ETP industry broke through the US$1 trillion milestone at the end of 2010, reaching US$1.003 trillion for the first time on 16 December 2010.
The first modern open-end mutual fund was the Massachusetts Investors' Trust which launched in 1924. Assets in United States mutual funds reached US$1 trillion in January 1990.
This means that it took the United States mutual fund industry approximately 66 years to reach US$1 trillion in assets, compared to the United States ETF industry which was only conceived in 1993 and reached US$1 trillion in 2010, taking just 18 years to reach the US$1 trillion milestone.
Key 2010 anniversaries
In 2010, we celebrated the 20th anniversary since the launch of the very first ETF globally. On 9 March 1990, the first ETF was listed in Canada on the Toronto Stock Exchange (TSX): the Toronto 35 Index Participation Fund (TIPs) tracking the TSX 35 Index.
It was followed by the Hundred Index Participation Fund (HIPs) tracking the TSX 100 Index on 26 September 1995. On 7 March 2000, the TIPs and HIPs ETFs were merged into the iUnits S&P/TSE Index Participation Fund (XIU CN): an ETF that was originally listed on 4 October 1999. This ETF has since been renamed iShares CDN S&P/TSX 60 Index Fund (XIU CN).
ETF Landscape June 2011 Celebrating 10 Years of ETFs in Australia from BlackRock
25 This document is not an offer to buy or sell any security or to participate in any trading strategy. Please refer to important information and qualifications at the end of this material.
April 2010 marked the 10th anniversary of the first ETFs to be launched in Europe. The iShares DJ STOXX 50 (EUN1 GY) and iShares DJ Euro STOXX 50 (EUN2 GY) were listed on 11 April 2000 on the Deutsche Boerse, followed by the iShares FTSE 100 (ISF LN) on the London Stock Exchange (LSE) extraMARK segment, on 28 April 2000. The first two ETFs were originally branded as ‘LDRS’, sponsored by Merrill Lynch International and later acquired by iShares in September 2003.
Education
The need for education amongst both institutional and retail investors was highlighted in the findings from a number of surveys during 2010, whereby investors cited that they were not familiar enough with ETFs to use them. Findings also demonstrated a need for more education with regards to how ETFs really work, their impact on investors and markets, and their size relative to the mutual fund industry.
Growth in the utilisation of ETFs and ETPs, as well as the expanding diversity of the product set, is leading to a greater urgency of market wide educational needs. Investors should understand that under the overall ETF/ETP umbrella, many different product structures, underlying investments (securities, futures, physical commodities, etc.), regulatory regimes and tax treatments are represented.
Within the ‘gold’ category for example, an investor can find funds and notes based on physical gold, gold futures or gold mining stocks – each with quite different performance, regulatory and tax implications.
As market growth and product innovation proceeds, it will become more essential for all kinds of investors to thoroughly understand the full range of ETF and ETP structures, benchmarks, and underlying features and applications, if they are to effectively realise all the many potential benefits of the ETF/ETP approach.
The risk of confusion, disappointment and disillusionment among investors would be very negative for the ETF industry. We are at an important crossroads in the ETF industry since we are seeing funds calling themselves ETFs which: 1) do not provide transparency on their underlying portfolios; 2) do not offer in-kind creation/ redemption; and 3) do not have real-time indicative Net Asset Values (NAVs). There are also products that are not even funds which are being called ETFs.
Now that the industry accounts for over US$1 trillion, product developers are working hard to find ways to put structured products, hedge funds and active funds into an ETF wrapper without maintaining the above basic features of an ETF.
As mentioned above, if this pattern is allowed to continue, this could be very negative for the ETF industry. Greater transparency around product structure, mechanics, tax and regulatory implications, index replication methodology and pricing would prove vital to helping investors make informed investment decisions when considering ETFs.
ETFs are one of the greatest financial innovations of the last decade in Europe and we expect a bright future but the industry is at a critical crossroads. Agreeing definitions for the various product structures is one of the pressing needs of the industry in 2011.
Regulation
Regulators and exchanges are taking steps to improve transparency on the structures by creating special segments for ETPs. In Hong Kong recently, they required any ETF using synthetic replication to have a “*” after the product’s name with a footnote in all marketing documents.
The RDR review proposals outline the changes the FSA plans to make to enable the retail investment market to establish a new level of consumer trust and confidence by distinguishing between independent advice and sales advice to create better clarity for consumers.
Funds registered under the Investment Company Act of 1940 and structured for tax purposes as Regulated Investment Companies (RICs) under the United States Tax Code were previously allowed a package of United States tax benefits to non-United States shareholders (generally called ‘flow-through’ benefits) as a result of the 2004 American Jobs Creation Act. These flow-through benefits generally expired as of 31 December 2009.
Product development
Development and growth of investment styles that employ products like ETFs will be used as building blocks for delivering low cost beta. Product ranges are beginning to emerge in more specialised areas to cater for the growing number of professional and retail investors who want the advantages of ETFs but in a managed investment solution such as a funds of ETFs solution.
ETF providers have continued to expand their product ranges in more specialised areas to cater for the growing number of professional and retail investors using ETFs as advanced portfolio construction tools. The increasing availability of these highly-specialised ETFs across the full spectrum of equities, fixed income and alternative investments now ensures that investors can use ETFs to instantly reallocate capital to take advantage of new investment opportunities.
A preference for traditional ETFs which are open-end index funds under UCITS has emerged. These are simple products that track indices; provide transparency on costs, underlying basket of securities, real time liquidity on stock exchanges via most brokerage firms/banks like any other equity security plus the benefit of the unique creation/ redemption process. This means ETFs are as liquid as their underlying portfolio and do not tend to trade at significant discounts or premiums.
Many investors are still expressing concerns over counterparty risk, transparency and liquidity when using structured products, swaps, certificates, and notes which has highlighted a preference for ETFs where the structure is a fund, and often, more specifically for ETFs which invest exclusively in physical securities.
This preference is evidenced by the fact that there are more ETFs in Europe which use synthetic replication methods such as swaps than those that use physical replication. However, the physical based ETFs have the greater share of assets in Europe. At the end of Q1 2011, there were 714 synthetic based ETFs with US$138.0 Bn in AUM, compared to 405 physical based ETFs with US$169.1 Bn in AUM.
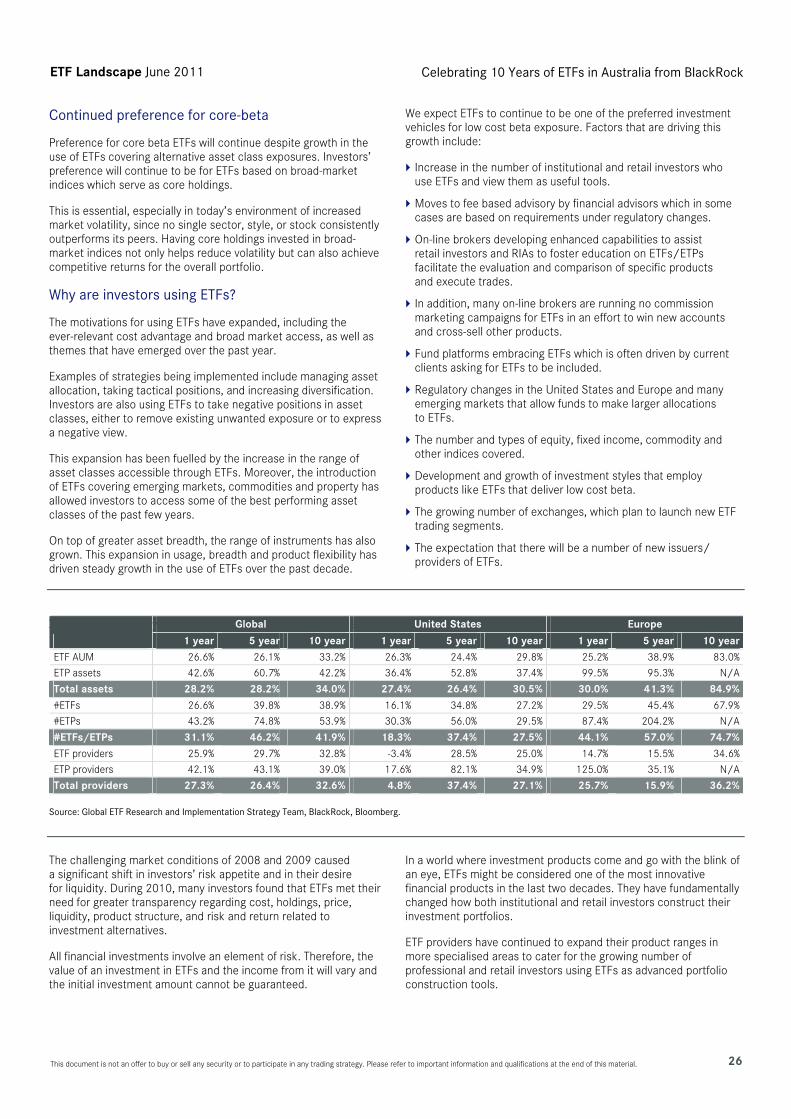
ETF Landscape June 2011 Celebrating 10 Years of ETFs in Australia from BlackRock
This document is not an offer to buy or sell any security or to participate in any trading strategy. Please refer to important information and qualifications at the end of this material. 26
Continued preference for core-beta
Preference for core beta ETFs will continue despite growth in the use of ETFs covering alternative asset class exposures. Investors’ preference will continue to be for ETFs based on broad-market indices which serve as core holdings.
This is essential, especially in today’s environment of increased market volatility, since no single sector, style, or stock consistently outperforms its peers. Having core holdings invested in broad-market indices not only helps reduce volatility but can also achieve competitive returns for the overall portfolio.
Why are investors using ETFs?
The motivations for using ETFs have expanded, including the ever-relevant cost advantage and broad market access, as well as themes that have emerged over the past year.
Examples of strategies being implemented include managing asset allocation, taking tactical positions, and increasing diversification. Investors are also using ETFs to take negative positions in asset classes, either to remove existing unwanted exposure or to express a negative view.
This expansion has been fuelled by the increase in the range of asset classes accessible through ETFs. Moreover, the introduction of ETFs covering emerging markets, commodities and property has allowed investors to access some of the best performing asset classes of the past few years.
On top of greater asset breadth, the range of instruments has also grown. This expansion in usage, breadth and product flexibility has driven steady growth in the use of ETFs over the past decade.
We expect ETFs to continue to be one of the preferred investment vehicles for low cost beta exposure. Factors that are driving this growth include:
Increase in the number of institutional and retail investors who use ETFs and view them as useful tools.
Moves to fee based advisory by financial advisors which in some cases are based on requirements under regulatory changes.
On-line brokers developing enhanced capabilities to assist retail investors and RIAs to foster education on ETFs/ETPs facilitate the evaluation and comparison of specific products and execute trades.
In addition, many on-line brokers are running no commission marketing campaigns for ETFs in an effort to win new accounts and cross-sell other products.
Fund platforms embracing ETFs which is often driven by current clients asking for ETFs to be included.
Regulatory changes in the United States and Europe and many emerging markets that allow funds to make larger allocations to ETFs.
The number and types of equity, fixed income, commodity and other indices covered.
Development and growth of investment styles that employ products like ETFs that deliver low cost beta.
The growing number of exchanges, which plan to launch new ETF trading segments.
The expectation that there will be a number of new issuers/ providers of ETFs.
Figure 19: Summary of compound annual growth rates, as at year end 2010 Global United States Europe 1 year 5 year 10 year 1 year 5 year 10 year 1 year 5 year 10 year
ETF AUM 26.6% 26.1% 33.2% 26.3% 24.4% 29.8% 25.2% 38.9% 83.0%
ETP assets 42.6% 60.7% 42.2% 36.4% 52.8% 37.4% 99.5% 95.3% N/A
Total assets 28.2% 28.2% 34.0% 27.4% 26.4% 30.5% 30.0% 41.3% 84.9%#ETFs 26.6% 39.8% 38.9% 16.1% 34.8% 27.2% 29.5% 45.4% 67.9%
#ETPs 43.2% 74.8% 53.9% 30.3% 56.0% 29.5% 87.4% 204.2% N/A
#ETFs/ETPs 31.1% 46.2% 41.9% 18.3% 37.4% 27.5% 44.1% 57.0% 74.7%ETF providers 25.9% 29.7% 32.8% -3.4% 28.5% 25.0% 14.7% 15.5% 34.6%
ETP providers 42.1% 43.1% 39.0% 17.6% 82.1% 34.9% 125.0% 35.1% N/A
Total providers 27.3% 26.4% 32.6% 4.8% 37.4% 27.1% 25.7% 15.9% 36.2% Source: Global ETF Research and Implementation Strategy Team, BlackRock, Bloomberg.
The challenging market conditions of 2008 and 2009 caused a significant shift in investors’ risk appetite and in their desire for liquidity. During 2010, many investors found that ETFs met their need for greater transparency regarding cost, holdings, price, liquidity, product structure, and risk and return related to investment alternatives.
All financial investments involve an element of risk. Therefore, the value of an investment in ETFs and the income from it will vary and the initial investment amount cannot be guaranteed.
In a world where investment products come and go with the blink of an eye, ETFs might be considered one of the most innovative financial products in the last two decades. They have fundamentally changed how both institutional and retail investors construct their investment portfolios.
ETF providers have continued to expand their product ranges in more specialised areas to cater for the growing number of professional and retail investors using ETFs as advanced portfolio construction tools.
ETF Landscape June 2011 Celebrating 10 Years of ETFs in Australia from BlackRock
27 This document is not an offer to buy or sell any security or to participate in any trading strategy. Please refer to important information and qualifications at the end of this material.
The increasing availability of these highly-specialised ETFs across the full spectrum of equities, fixed income and alternative investments now ensures that investors can use ETFs to instantly reallocate capital to take advantage of new investment opportunities.
Over the past decade, through to year end 2010, the compound annual growth rate for ETF assets was 33.2% globally, 29.8% in the United States, 25.3% in Canada and 83.0% in Europe. There are no signs that investor interest in ETFs is fading since investors are finding that they are products which can work well in every market environment. Capital flows in 2010 within ETFs demonstrated that the products are becoming key indicators for shifts in investor sentiment between asset classes.
During 2010, developed and emerging equity ETFs enjoyed heavy inflows. On the other hand, fixed income and commodity ETFs/ETPs received smaller net new asset flows than in 2009 as some investors adjusted their risk profiles. The use of ETFs is often driven by macro trends and volatility. The changes in investor sentiment are illustrated in the net new asset data into ETFs tracking fixed income indices, equity indices, emerging market indices and commodities.
At year end 2010, just 100 ETFs out of 2,460 accounted for US$828.1 Bn or 63.1% of the US$1,311.3 Bn total. ETFs providing exposure to key portfolio building blocks accounted for approximately a quarter of assets. There were 1,516 ETFs with assets below US$100.0 Mn, 1,222 ETFs with assets below US$50.0 Mn and 418 ETFs with less than US$10.0 Mn in assets, while the top three providers out of 136 account for 70.0% of assets: iShares with 44.1%, SSgA with 14.5% and Vanguard with 11.3% market share.
Additionally, there were 1,083 other ETPs with assets of US$171.3 Bn from 56 providers on 22 exchanges. Combined, there were 3,543 products with 7,351 listings, assets of US$1,482.7 Bn from 170 providers on 50 exchanges around the world, as at year end 2010.
Source: Global ETF Research and Implementation Strategy Team, BlackRock, Bloomberg.
FSB note on ETFs
The FSB published a note on potential financial stability issues arising from recent trends in ETFs. The note highlights recent developments in the ETF market, which has experienced strong growth and rapid innovation. Although most of the ETF market remains plain-vanilla, there has been an increase in product variety and, in some cases, complexity. The note aims at improving understanding of the possible emerging issues for financial stability, and encouraging the financial industry, early in the product cycle, to adapt risk management practices, disclosure and transparency to the pace of innovation in this market.
The FSB has been established to coordinate at the international level the work of national financial authorities and international standard setting bodies and to develop and promote the implementation of effective regulatory, supervisory and other financial sector policies. It brings together national authorities responsible for financial stability in significant international financial centres, international financial institutions, sector-specific international groupings of regulators and supervisors, and committees of central bank experts.
Source: Press release, Financial Stability Board publishes a note on financial stability issues from exchange-traded funds (ETFs), 12-April-2011, Financial Stability Board.
IMF note on ETFs
The IMF recently issued their bi-annual Global Financial Stability Report and included a section on the mechanics and risks of ETFs. The report notes that ETFs have become increasingly popular over the past few years. They give investors increased access to emerging market assets while also offering flexibility and leverage to specialised investors.
Traditionally, ETFs have physically held underlying assets, but a new breed of ETFs have emerged in Europe that use synthetic replication techniques and derivatives to reduce costs and thereby boost returns. A small percentage of these funds also use leverage to cater to the hedging needs and speculative positions of their nonretail client base.
While these enhancements have reduced costs, they add a layer of complexity and increase counterparty and liquidity risks. The disproportionately large size of some ETFs compared with the market capitalization of the underlying reference indices poses a risk of disruptions in some markets from heavy ETF trading.
The report surveys the growth and mechanics of ETFs and highlights some of the key risks pertaining to synthetic replication and the use of leverage and derivatives in ETFs.
The IMF oversees the international monetary system and monitors the financial and economic policies of its members. It keeps track of economic developments on a national, regional, and global basis, consulting regularly with member countries and providing them with macroeconomic and financial policy advice.
Source: Global Financial Stability Report, Durable Financial Stability, Getting There from Here, April 2011, International Monetary Fund.
Bank for International Settlements note on ETFs
The Bank for International Settlements (BIS) recently issued a paper on the market structures and system risks of ETFs, noting that crisis experience has shown that as the financial intermediation chain lengthens, it becomes complicated to assess the risks of financial products due to a lack of transparency as to how risks are managed at different levels of the intermediation chain.
ETFs, which have become popular among investors seeking exposure to a diversified portfolio of assets, share this characteristic, especially when their returns are replicated using derivative products. As the volume of such products grows, such replication strategies can lead to a build-up of systemic risks in the financial system. The article examines the operational frameworks of exchange-traded funds and identifies potential channels through which risks to financial stability can materialise.
The Bank for International Settlements (BIS) is an international organisation which fosters international monetary and financial cooperation and serves as a bank for central banks. The economic, monetary, financial and legal research of the BIS supports its meetings and the activities of the Basel-based committees. The BIS is also a hub for sharing statistical information amongst central banks, and for publishing statistics on global banking, securities, foreign exchange and derivatives markets.
Source: BIS Working Papers, No 343, Market structures and systemic risks of exchange-traded funds, April 2011, Bank for International Settlements.

ETF Landscape June 2011 Celebrating 10 Years of ETFs in Australia from BlackRock
This document is not an offer to buy or sell any security or to participate in any trading strategy. Please refer to important information and qualifications at the end of this material. 28
RDR review
In the United Kingdom, as is the trend globally, all types of institutional and retail investors including advisers are increasingly embracing ETFs as a tool which should be considered and used when implementing asset allocation. An added impetus encouraging advisers in the United Kingdom to embrace ETFs was the FSA’s RDR regulatory proposals outlined on 25 November 2008.
The proposals outline the changes the FSA plans to make for the retail investment market to establish a new level of consumer trust and confidence by distinguishing between independent advice and sales advice to create better clarity for consumers. Financial firms will need to implement changes prior to the 31 December 2012 deadline for industry compliance.
ETFs have been cited by the FSA as one of the packaged products that advisers, which consider themselves as independent, should become educated on which will enable them to consider ETFs in their reviews prior to recommending products to their clients. ETFs are noted as an investment tool which can be suitable for retail investment products as they can be a cost efficient and transparent way to access the market.
The structure of ETFs does not support commission remuneration, which is one of the reasons for slow adoption to date among advisers in the United Kingdom.
In the United States, fee-based advisers (paid by the consumer) have embraced the use of ETFs to a greater degree than commission-based advisers (paid by the product provider).
In the United Kingdom, the use of ETFs among advisers is very limited as they are typically multi-tied and tied (meaning that they can only advise on products from one or a limited range of product providers). ETFs are not currently included in the tied or multi-tied product sets.
ETFs are RDR ready and fit into the new adviser charging model proposed by the FSA. As such, we have seen an increasing number of requests for information on ETFs which are both listed and registered for sale in the United Kingdom as well as having United Kingdom tax status which can make them more efficient for United Kingdom domiciled investors1. The good news is that the LSE was one of the first exchanges to list ETFs in Europe over ten years ago.
ETFs can be eligible investments for Individual Savings Accounts (ISAs), Self Invested Personal Pensions (SIPPs), Child Trust Funds (CTFs) and offshore bonds.
The use of ETFs within assembled products such as Fund of Funds/ Fund of ETFs is growing as product providers see value in using ETFs as low cost beta building blocks to deliver asset allocation. A popular approach has been to create a series of fund of funds with ranging risk/return objectives, i.e. conservative, balanced, growth and dynamic portfolios by strategically allocating among asset classes allowing their clients to switch between products as their broad market views and attitudes to risk change.
Creating portfolios built around an asset allocation framework without specific active investment decisions (security selection and/or market timing) has been a topic of some debate for many years.
Most notably, the study published in 1986 entitled “Determinants of Portfolio Performance” by Brinson, Hood and Beebower concluded that asset allocation is the primary determinant of a portfolio’s return variability, with security selection and market-timing playing minor roles.
The majority of ETFs registered for sale in the United Kingdom are regulated collective investment schemes and as such fall under the definition of packaged investment products.
We have a very large and diverse tool box available with 239 different ETFs on the LSE providing exposure to equity, fixed income and commodity indices at the end of Q1 2010. Of this, 183 had United Kingdom Distributor Status (UKDS). In total there were 363 ETF listings on the LSE as the multi-currency platform on the LSE allows a single ETF to be listed in multiple currencies.
The use of ETFs is likely to increase significantly by Independent Financial Advisors (IFAs) in the United Kingdom based on the regulatory proposals outlined in RDR feedback statement by the United Kingdom’s FSA.
In January 2011, the FSA published the final rules on professional standards (PS11/1). This paper completes the rules on RDR along with those on advisor charging and the labelling of services, which were finalised in March 2010. The new framework will come into effect at the end of 2012.
The four key aims of this FSA policy are to:
Improve the clarity with which firms describe their services to consumers.
Make sure the cost of advisor services is agreed between adviser and client, rather than determined by product providers.
Increase the professional standards of investment advisors.
Ensure Personal Investment Firms (PIFs) have adequate capital resources for complaint redress.
The RDR is designed to provide a clean and sustainable market for the future. It will ensure that customers get good quality advice, products and services suited to their needs, from advisors displaying higher standards of professionalism and expertise.
The regime needs to change and this change will be supported by the FSA’s intensive supervisory approach which will include a greater focus on individuals.
Source: Policy Statement 11/1, Distribution of retail investments: Delivering the RDR – professionalism – feedback to CP10/14 and CP10/22 and final rules, Financial Services Authority, BlackRock.
Clarity of advice services
On 26 March 2010, the FSA published its feedback statement (Policy Statement 10/6) to its Consultation Paper of June 2009 (CP09/18) relating to proposals to improve the clarity with which advisor firms describe their services to consumers.
The FSA proposals required that firms describe their advice services as either ‘independent’ or ‘restricted’. Firms offering independent advice would need to demonstrate that their recommendations were based on a comprehensive and unbiased analysis of the market and that any products selected were made in the interests of clients.
1. BlackRock does not and cannot provide tax advice. Tax treatment of ETFs including rates and reliefs may change and will depend upon an investor’s own tax circumstances.
BlackRock recommends that all clients seek specialist tax advice from their own tax advisers.

ETF Landscape June 2011 Celebrating 10 Years of ETFs in Australia from BlackRock
29 This document is not an offer to buy or sell any security or to participate in any trading strategy. Please refer to important information and qualifications at the end of this material.
If a firm elected to limit its product range to certain investments or strategies, it needed to describe the services it offered as ‘restricted’ and this fact must needed to be clearly disclosed to the consumer.
The FSA also noted that it may be possible for certain advisors servicing specialist client groups to retain the independence ‘label’ even where certain products were excluded from the scope of their advice, although the firm would have to demonstrate that the product or strategy was not appropriate for their clients.
In addition, the FSA observed that this exception was unlikely to be of benefit to most firms since most retail investment products were likely to be appropriate for the vast majority of retail investors.
Separately, the FSA noted it was clear from responses received that it was not widely understood that ETFs already fell within the current definition of packaged products and for the avoidance of doubt, it made clear that any products which might achieve similar outcomes as more traditional retail investment products were potentially caught by the new rules.
Remuneration
On 26 March 2010, the FSA published its feedback statement (Policy Statement 10/6) to its Consultation Paper of June 2009 (CP09/18) relating to the introduction of a system of ‘adviser-charging’ to remove the potential commission-bias through the influence of product providers.
The FSA stated they would modernise the way that advice was paid for by requiring advisers to agree the cost of financial advice with customers up-front, removing the possibility of commission bias and ensuring the cost of all advice was clear to consumers whenever it was given.
The FSA also noted that it wanted adviser firms to have charging structures that were product neutral in that the charges reflected the services provided to the client, not the particular product provider or type of product.
The Policy Statement contained final rules in relation to ‘adviser-charging’ and ‘service-labelling’ and the FSA stated that they would proceed with the proposals set out in the consultation. As a result of this, it was expected that with effect from 1 January 2013, advisers would be prevented from receiving commissions paid by product providers.
Product providers are no longer required to monitor ‘appropriate adviser-charging’ (with reference to so-called ‘decency limits’) though there remains a requirement to obtain and validate instructions from the client if the charge is deducted (by the provider) from the client’s investment.
This creates a significant challenge for providers as due to a result of increasing disintermediation, in part due to the growth of platforms, the end-consumer will not be a direct client of the firm.
The FSA accepts that bespoke share classes to provide for a full range of possible adviser charges (when taken from funds) is impractical and recognises the value of cash accounts provided by platforms or other third-parties to collect adviser charges.
These changes would be significant as many IFAs were ‘tied’ and ‘multi-tied’, which respectively described those selling only the products of one provider, such as in a bank, and those selling products from a limited range of providers.
This is a particularly important development for factory-gate priced products such as most ETFs, however, it is uncertain whether the current practice of rebating a proportion of the annual management charge (if this is used to fund the consumer cash account) will be acceptable and the FSA states that it intends to consult further on whether any rebates should be prohibited.
In addition, the FSA will proceed with proposals for advisers to describe the advice provided as either independent or ‘restricted’.
Source: Policy Statement 10/6, Distribution of retail investments: Delivering the RDR – feedback to CP09/18 and final rules, Financial Services Authority, BlackRock.
Professional standards of advisers
On 20 January 2011, the FSA published its feedback statement and final rules (Policy Statement 11/1) relating to the professional standards of investment advisers. The scope of the changes set out in the paper covers all investment advisers, whether they will offer independent or restricted advice, covering advisers within all types of firms (e.g. banks, product providers, and Independent Financial Advisers or wealth managers).
The FSA confirmed that, after extensive consultation, retail investment advisers will need to hold a Statement of Professional Standing (SPS) if they want to give independent or restricted advice after January 2013. The statement will provide customers with evidence that the adviser subscribes to a code of ethics, is qualified, and has kept their knowledge up to date.
When the RDR comes into force in January 2013, the FSA will start collecting information about individual advisers, such as the qualifications they hold and which accredited body they use. However, in preparation for 2013, the first of the Professionalism rules will come into force in July 2011, and from this point firms will be obliged to notify the FSA if any adviser falls below the required standard of competence or ethical behaviour.
Initial and ongoing knowledge
Advisers deemed competent on or before 30 June 2009 will need to attain an appropriate qualification by the end of 2012. Advisers who are assessed as competent after June 2009 must attain an appropriate qualification within 30 months of starting.
Advisers holding certain appropriate qualifications do not need to take further exams to meet RDR standards, but are likely to need to carry out qualifications gap-fill using relevant structured Continuing Professional Development (CPD).CPD activity carried out in the past can be used towards this gap filling, where it meets a learning outcome set out in the gap fill template. Advisers will need to have this qualification gap fill verified by an accredited body.
Statement of Professional Standing (SPS)
From 1 January 2013, advisers will be required to have obtained an annual SPS from an accredited body. The statement will provide customers with evidence that the adviser has subscribed to a code of ethics, is qualified, and has kept their knowledge up-to-date.
The FSA has not introduced a rule requiring firms or advisers to present the adviser’s SPS to consumers, but expects that some advisers will choose to do this to help raise consumers’ awareness of the profession.
Source: Retail Distribution Review Newsletter, February 2011, Financial Services Authority. Policy Statement 11/1, Distribution of retail investments: Delivering the RDR – professionalism, Feedback to CP10/14 and CP10/22 and final rules, Financial Services Authority, BlackRock.

ETF Landscape June 2011 Celebrating 10 Years of ETFs in Australia from BlackRock
This document is not an offer to buy or sell any security or to participate in any trading strategy. Please refer to important information and qualifications at the end of this material. 30
RDR timetable
2011 publications
Consultation Paper – RDR-related changes to complaints reporting.
Consultation Paper – product disclosure changes to reflect adviser charging.
Policy Statement – platforms.
Consultation Paper – capital requirements: how to apply a consistent approach to the Expenditure Based Requirements (EBR).
Actions for firms, advisers and providers
End 2011 –PIFs should hold a minimum of one-month EBR (minimum £15,000).
End 2012 – advisers should hold an appropriate qualification including gap-filling, where required.
End 2012 – all advisers and product providers must be ready to operate adviser charging and consultancy charging and meet the associated requirements.
End 2012 – all advisers should describe their services as either independent or restricted.
End 2013 – PIFs should hold a minimum of three-months EBR (minimum £20,000).
Source: Retail Distribution Review Newsletter, February 2011, Financial Services Authority.
In the United States, fee-based advisers (paid by the consumer) have embraced the use of ETFs to a greater degree than commission-based advisers (paid by the product provider).
In the United Kingdom the use of ETFs among IFAs is very limited as they are typically tied and multi-tied. ETFs are not currently included in the tied or multi-tied product sets.
Investors who are expressing concerns over counterparty risk, transparency and liquidity when using structured products, swaps, certificates, and notes are showing a preference for ETFs where the structure is a fund, and often, more specifically for ETFs which invest exclusively in physical securities.
The role of platforms in a RDR world
One area of growing importance is the platforms market. In November 2010 the FSA published a Consultation Paper (CP10/29) on this topic.
The FSA’s aim is to:
Prevent product providers from making payments that advisers could use to disguise the charge the customer is paying for advice, which could influence advisers in recommending one product over another. Allowing such payments could undermine what the FSA has set out to achieve for consumers by removing commission bias and could leave product charges at an artificially high level.
Ensure platforms and other nominee services allow their customers to transfer their investments elsewhere without having to cash them in first (re-registration).
Require platforms to be upfront about the income they receive from fund managers or product providers. This will make it easier for advisers and consumers to compare different types of platform and the services provided.
Make sure that customers who invest in funds through platforms and other nominee services are provided with information about the fund from their fund managers, and maintain their voting rights.
The consultation period closed on 17 February 2011 and the FSA plans to issue a Policy Statement later this year.
Source: Retail Distribution Review Newsletter, February 2011, Financial Services Authority.
FINRA Regulatory Notice 09-31
The Financial Industry Regulatory Authority (FINRA) which regulates all securities firms doing business in the United States issued a regulatory notice in June 2009 to provide guidance on leveraged and inverse ETFs.
The notice stated that “...inverse and leveraged ETFs that are reset daily typically are unsuitable for retail investors who plan to hold them for longer than one trading session, particularly in volatile markets...”.
The following paragraphs are also taken from the notice:
“Exchange-traded funds (ETFs) that offer leverage or that are designed to perform inversely to the index or benchmark they track – or both – are growing in number and popularity. While such products may be useful in some sophisticated trading strategies, they are highly complex financial instruments that are typically designed to achieve their stated objectives on a daily basis. Due to the effects of compounding, their performance over longer periods of time can differ significantly from their stated daily objective.
Therefore, inverse and leveraged ETFs that are reset daily, typically, are unsuitable for retail investors who plan to hold them for longer than one trading session, particularly in volatile markets.
This notice reminds firms of their sales practice obligations in connection with leveraged and inverse ETFs. In particular, recommendations to customers must be suitable and based on a full understanding of the terms and features of the product recommended; sales materials related to leveraged and inverse ETFs must be fair and accurate; and firms must have adequate supervisory procedures in place to ensure that these obligations are met.
Most leveraged and inverse ETFs ‘reset’ daily, meaning that they are designed to achieve their stated objectives on a daily basis. Due to the effect of compounding, their performance over longer periods of time can differ significantly from the performance (or inverse of the performance) of their underlying index or benchmark during the same period of time. For example, between 1 December 2008 and 30 April 2009:
The Dow Jones U.S. Oil & Gas Index gained 2%, while an ETF seeking to deliver twice the index's daily return fell 6% and the related ETF seeking to deliver twice the inverse of the index's daily return fell 26%.
ETF Landscape June 2011 Celebrating 10 Years of ETFs in Australia from BlackRock
31 This document is not an offer to buy or sell any security or to participate in any trading strategy. Please refer to important information and qualifications at the end of this material.
An ETF seeking to deliver three times the daily return of the Russell 1000 Financial Services Index fell 53% while the index actually gained around 8%. The related ETF seeking to deliver three times the inverse of the index's daily return declined by 90% over the same period.
This effect can be magnified in volatile markets. Using a two-day example, if the index goes from 100 to close at 101 on the first day and back down to close at 100 on the next day, the two-day return of an inverse ETF will be different than if the index had moved up to close at 110 the first day but then back down to close at 100 on the next day.
In the first case with low volatility, the inverse ETF loses 0.02%; but in the more volatile scenario the inverse ETF loses 1.82%. The effects of mathematical compounding can grow significantly over time, leading to scenarios such as those noted above.”
Source: Regulatory Notice 09-31, Financial Industry Regulatory Authority.
SEC-FINRA investor alert on leveraged and inverse ETFs
The SEC and the FINRA issued an investor alert on Tuesday 18 August 2009 entitled ‘Leveraged and Inverse ETFs: Specialized Products with Extra Risks for Buy-and-Hold Investors’:
“The SEC staff and FINRA are issuing this Alert because we believe individual investors may be confused about the performance objectives of leveraged and inverse ETFs. Leveraged and inverse ETFs typically are designed to achieve their stated performance objectives on a daily basis.
Some investors might invest in these ETFs with the expectation that the ETFs may meet their stated daily performance objectives over the long term as well. Investors should be aware that performance of these ETFs over a period longer than one day can differ significantly from their stated daily performance objectives.”
Source: Leveraged and Inverse ETFs: Specialized Products with Extra Risks for Buy-and-Hold Investors, Financial Industry Regulatory Authority.
United States Commodity Futures Trading Commission (CFTC) hearings on energy position limits and hedge exemptions
The CFTC held hearings regarding Energy Position Limits and Hedge Exemptions on 28 July 2009, 29 July 2009 and 5 August 2009, discussing whether federal position limits should be set on the energy markets.
The hearings provided critical input from a wide range of industry participants and academics to the CFTC’s efforts to examine different approaches to regulate energy markets.
The Commodity Exchange Act states that the CFTC shall impose limits on trading and positions as necessary to eliminate, diminish or prevent the undue burdens on interstate commerce that may result from excessive speculation.
The CFTC’s hearings examined the role of position limits in energy markets in fulfilling the CFTC’s mission to ensure the fair, open and efficient functioning of futures markets.
Goldman Sachs, JPMorgan Chase and other leading banks are exempt from most commodity-trading limits in order to manage risks as they serve as market makers.
The CFTC is looking into whether those exemptions should stand, as it considers blanket limits on a variety of commodity markets. As a result of this, a number of ETPs/ETFs providing exposure to commodities issued notices stating that they suspended their creation process.
Source: Hearings on Energy Position Limits and Hedge Exemptions, U.S. Commodity Futures Trading Commission.
SEC evaluating the use of derivatives by funds
The following paragraphs are taken from the SEC’s press release that was released on 25 March 2010:
“The SEC staff is conducting a review to evaluate the use of derivatives by mutual funds, ETFs and other investment companies. The review will examine whether and what additional protections are necessary for those funds under the Investment Company Act of 1940.
Pending the review’s completion, the SEC has determined to defer consideration of exemptive requests under the Investment Company Act to permit ETFs that would make significant investments in derivatives.
The staff’s decision will affect new and pending exemptive requests from certain actively-managed and leveraged ETFs that particularly rely on swaps and other derivative instruments to achieve their investment objectives. The deferral does not affect any existing ETFs or other types of fund applications.
“It’s appropriate to engage in a more thorough review of the use of derivatives by ETFs and mutual funds given the questions surrounding the risks associated with the derivative instruments underlying many funds,” said SEC Chairman Mary Schapiro.”
Source: Press Release: SEC Staff Evaluating the Use of Derivatives by Funds, 2010-45, U.S. Securities and Exchange Commission.
SEC approves rules expanding stock-by-stock circuit breakers and clarifying process for breaking erroneous trades
On 10 September 2010, the SEC approved new rules submitted by the national securities exchanges and FINRA to expand a recently-adopted circuit breaker program to include all stocks in the Russell 1000 Index and certain exchange-traded funds. The SEC also approved new exchange and FINRA rules that clarify the process for breaking erroneous trades.
The circuit breaker pilot program was approved in June in response to the market disruption of 6 May 2010 and applied to stocks listed in the S&P 500 Index. Trading in a security included in the program was paused for a five-minute period if the security experienced a 10 % price change over the preceding five minutes.
The pause gave the markets a opportunity to attract new trading interest in an affected stock, establish a reasonable market price, and resume trading in a fair and orderly fashion. The circuit breaker program was in effect on a pilot basis through to 10 December 2010.
Source: Press Release: SEC Approves Rules Expanding Stock-by-Stock Circuit Breakers and Clarifying Process for Breaking Erroneous Trades, 2010-167, U.S. Securities and Exchange Commission.

ETF Landscape June 2011 Celebrating 10 Years of ETFs in Australia from BlackRock
This document is not an offer to buy or sell any security or to participate in any trading strategy. Please refer to important information and qualifications at the end of this material. 32
SEC announces proposal on limit-up, limit-down
The SEC announced on 6 April 2011 the coordinated filing of a limit up-limit down proposal to address extraordinary market volatility. The national securities exchanges, including NYSE Arca, and the Financial Industry Regulatory Authority (FINRA) filed to establish a plan pursuant to Rule 608 of Regulation NMS to adopt a limit up-limit down mechanism that seeks to address extraordinary volatility in equity securities, including ETPs.
As proposed, the new market-wide limit up-limit down requirements will prevent trades in equity securities from occurring outside specified price bands and are designed to work in conjunction with single stock circuit breakers.
The proposed plan is currently available on the SEC’s website, and the SEC will be publishing a release that will open the plan to a 21-day public comment period, after which the SEC will decide whether or not to approve the plan.
Once approved, Phase I of the plan will be applicable to the securities currently included in the single stock circuit breaker pilot program, including all securities in the S&P 500 Index, the Russell 1000 Index and 344 specified ETPs.
In Phase II of the plan, the limit up-limit down requirements will be applicable to all equity securities, including all ETPs. Pending approval of the plan, the current single stock circuit breaker pilot has been extended to 11 August 2011 (or earlier if the limit up-limit down mechanism is implemented prior to 11 August 2011).
Source: ETP Landscape, NYSE Euronext, 7 April, 2011.
The legal and structural strength of ETFs
The Financial Times Alphaville blog posting, ‘Can ETFs Collapse?’ and subsequent media coverage on CNBC explored a theory that BlackRock had researched and addressed many times in the past.
It is our assessment that the blog's conclusions regarding the ‘unfunded liability’ caused by ETF short selling is incorrect and does not take into account the general mechanics of the ETF structure and marketplace. The primary reasons for their inaccuracies are as follows:
The legal and structural design of ETFs protects ETF shareholders
All orders for creation and redemption of shares of a fund must be in proper form when placed to ensure that such orders will be settled. The requirements for proper form are addressed in each ETF’s prospectus and Statement of Additional Information (SAI) and provide the funds with the right to refuse any order (creation or redemption) that is deemed to be placed in improper form.
Requirements for proper form may be impacted based on size of the order, market and volatility conditions. Any concern regarding the form of an AP’s order may cause the ETF provider to request additional information from the AP to validate the AP’s ability to settle an order prior to accepting that order.
Differences in ‘naked’ and bona fide short selling
Naked short selling is when the seller does not borrow or arrange to borrow for the securities in time to make delivery to the buyer within the standard three-day settlement period. While naked shorting may occur for bona fide market making, it is not legal to sell securities short and fail to deliver shares at the time of settlement with the purpose of driving down a security’s price.
Bona fide short selling is a necessary part of functioning market making practices. This activity improves secondary market liquidity for an ETF represented through tighter bid/ask spreads, which benefit all investors seeking to buy or sell a fund.
Counter party risk is minimised in ETFs
The assets in an ETF are separate and distinct from the assets of the various service providers such as asset managers, index providers, custodians, etc. Generally, the ETF is not directly subject to the credit risk of a service provider.
Source: BlackRock: The Legal and Structural Strengths of ETFs, September 2010.
Changes to the United States tax law may affect non-United States resident holders of United States ETFs
Flow-through benefits
Funds registered under the Investment Company Act of 1940 and structured for tax purposes as Regulated Investment Companies (RICs) under the United States Tax Code were previously allowed a package of United States tax benefits to non-United States shareholders (generally called ‘flow-through’ benefits) as a result of the 2004 American Jobs Creation Act. These flow-through benefits generally expired as of 31 December 2009.
The three affected flow-through benefits are:
Exemption from United States withholding tax (30% or lower treaty rate) on fund distributions where such distributions represent Qualified Interest Income (QII). QII is certain fund income derived from interest income on debt of United States resident issuers (i.e., obligations issued by Treasury and United States corporations). This applied to fixed income ETFs.
Exemption from United States withholding tax on any short-term capital gains included in fund distributions. This applied to fixed income and equity ETFs.
Relief from United States Estate Tax on fund holdings by non-United States resident persons, where the underlying assets would have been exempt from Estate Tax if held directly by the non-United States resident person.
The purpose of these three flow-through benefits was to allow a non-United States resident RIC shareholder the same treatment on a flow-through basis as if the investments were owned directly by the non-United States resident RIC shareholder.
On 17 December 2010, the United States President signed the Tax Relief, Unemployment Insurance Reauthorization, and Job Creation Act of 2010 into law.
ETF Landscape June 2011 Celebrating 10 Years of ETFs in Australia from BlackRock
33 This document is not an offer to buy or sell any security or to participate in any trading strategy. Please refer to important information and qualifications at the end of this material.
According to this legislation, the items mentioned in first two bullets above have been extended with respect to financial years of the fund beginning before 1 January 2012. The estate tax flow-through mentioned in the final bullet has been extended to apply to estates of descendants dying before 1 January 2012.
Source: BlackRock.
FATCA (foreign account withholding provisions in the HIRE Act)
On 18 March 2010, the United States Congress passed the Hiring Incentives to Restore Employment Act of 2010 (the HIRE Act). This Act contains provisions still commonly known as the FATCA (the Foreign Account Tax Compliance Act).
The FATCA is a system designed to request financial institutions of all descriptions around the world to identify United States investors – even where they hold indirectly via non-United States entities – and report details of these to the United States Internal Revenue Service (IRS).
This initiated in response to high levels of political concern in the United States with regards to tax evasion, particularly by wealthy individuals.
In order to encourage compliance with this legislation, from 1 January 2013, the United State will impose a 30% withholding tax on the gross sales proceeds (as well as income) derived by any part of that financial institution from holdings of United States financial assets, unless that institution agrees to enter the reporting regime.
Funds and fund managers are included in the definition of ‘Foreign Financial Institutions’ (FFIs), therefore the FATCA goes much wider in reach than the existing ‘Qualified Intermediary’ system, with which it will coexist.
The impacts on the financial world will undoubtedly be complex and potentially far reaching. The basic wording of the HIRE Act still leaves many questions unanswered and the financial institutions are keenly waiting for draft regulations to be issued by the United States Treasury.
However, it does appear that holdings of United States ETFs by non-United States investors would be subject to the 30% withholding from gross sales proceeds, where held through a non-United States financial intermediary who does not become FATCA compliant when the regime goes live in 2013.
Source: BlackRock, April 2010.
SEC proposal to replace rule 12b-1
The SEC is proposing a new rule and rule amendments that would replace rule 12b–1 under the Investment Company Act, the rule that has permitted registered open-end management investment companies (‘mutual funds’ or ‘funds’) to use fund assets to pay for the cost of promoting sales of fund shares.
The new rule and amendments would continue to allow funds to bear promotional costs within certain limits, and would also preserve the ability of funds to provide investors with alternatives for paying sales charges. Unlike the current rule 12b–1 framework, the proposed rules would limit the cumulative sales charges each investor pays, no matter how they are imposed.
To help investors make better-informed choices when selecting a fund that imposes sales charges, the Commission is also proposing to require clearer disclosure about all sales charges in fund prospectuses, annual and semi-annual reports to shareholders, and in investor confirmation statements.
As part of the new regulatory framework, the Commission is proposing to give funds and their underwriters the option of offering classes of shares that could be sold by dealers with sales charges set at competitively established rates – rates that could better reflect the services offered by the particular intermediary and the value investors place on those services. For funds electing this option, the proposal would provide relief from restrictions that currently limit retail price competition for distribution services.
The proposed rule and rule amendments are designed to protect individual investors from paying disproportionate amounts of sales charges in certain share classes, promote investor understanding of fees, eliminate outdated requirements, provide a more appropriate role for fund directors, and allow greater competition among funds and intermediaries in setting sales loads and distribution fees generally.
Source: Federal Register, Mutual Fund Distribution Fees; Confirmations; Proposed

ETF Landscape June 2011 Celebrating 10 Years of ETFs in Australia from BlackRock
This document is not an offer to buy or sell any security or to participate in any trading strategy. Please refer to important information and qualifications at the end of this material. 34
Asia Pacific (ex-Japan)
At the end of April 2011, the Asia Pacific (ex-Japan) ETF/ETP industry had 275 ETFs/ETPs, 390 exchange listings, and assets of US$61.6 Bn from 69 providers on 13 exchanges. This compared to 175 ETFs/ETPs with 277 listings and assets of US$43.0 Bn, from 53 providers on 13 exchanges, at the end of April 2010.
In the first four months of 2011, assets increased by 11.4%, greater than the 5.7% increase in the MSCI AC Asia Pacific ex-Japan Index in US dollar terms. This compared to an increase in assets of 7.2% over the same period in 2010.
2011 YTD, the number of ETFs/ETPs increased by 23.3% with 52 new ETFs/ETPs launched. This compared to a 25.0% increase over the same period in 2010, when 39 new ETFs/ETPs launched.
In the first four months of 2011, the ETF/ETP average daily trading volume in US dollars increased by 16.8% to US$1.0 Bn in April 2011. This compares to the average daily trading volume of US$0.9 Bn in April 2010.
State Street Global Advisors is the largest ETF/ETP provider in terms of assets with US$13.3 Bn, in 11 ETFs, reflecting 21.7% market share; iShares is second with 19 ETFs, assets of US$11.7 Bn, and 19.0% market share; followed by HSBC/Hang Seng with eight ETFs, assets of US$7.2 Bn and 11.6% market share, at the end of April 2011.
Figure 20: ETFs/ETPs listed in Asia Pacific (ex-Japan), as at end April 2011
1
2
3
4
5
6
7
8
9
10
11
1
2
3
4
5
6
7
8
9
10
11
1 Australia 4 India 7 New Zealand 10 Taiwan P listings: 29 P listings: 28 P listings: 6 P listings: 14 T listings: 50 T listings: 28 T listings: 6 T listings: 17 Providers: 7 Providers: 11 Providers: 2 Providers: 4 AUM: US$6.0 Bn AUM: US$1.6 Bn AUM: US$0.4 Bn AUM: US$3.0 Bn
2 China 5 Indonesia 8 Singapore 11 Thailand P listings: 22 P listings: 1 P listings: 23 P listings: 4 T listings: 22 T listings: 1 T listings: 83 T listings: 4 Providers: 16 Providers: 1 Providers: 9 Providers: 3 AUM: US$11.7 Bn AUM: US$0.0 Bn AUM: US$3.7 Bn AUM: US$0.1 Bn
3 Hong Kong 6 Malaysia 9 South Korea P listings: 53 P listings: 4 P listings: 91 T listings: 83 T listings: 5 T listings: 91 Providers: 13 Providers: 3 Providers: 13 AUM: US$28.0 Bn AUM: US$0.4 Bn AUM: US$6.8 Bn
Note: P listings = # primary listings. T listings = # total listings. Providers = # ETF/ETP providers with primary or cross listings. Assets = Assets Under Management in primary listings only, except for Australia where assets invested in the cross listings are available via CHESS. Source: Global ETF Research and Implementation Strategy Team, BlackRock, Bloomberg, CHESS.

ETF Landscape June 2011 Celebrating 10 Years of ETFs in Australia from BlackRock
35 This document is not an offer to buy or sell any security or to participate in any trading strategy. Please refer to important information and qualifications at the end of this material.
Figure 21: Asia Pacific (ex-Japan) listed ETFs/ETPs asset growth, as at end April 2011
0
10
20
30
40
50
60
70
Assets (US$ Bn)
0
50
100
150
200
250
300
# products
Assets (US$ Bn) 2001 2002 2003 2004 2005 2006 2007 2008 2009 2010 Apr-11
ETF assets $3.7 $3.8 $6.6 $8.6 $10.5 $18.1 $27.1 $23.8 $38.9 $54.1 $59.8
ETP assets $0.1 $0.5 $0.8 $1.5 $1.8
ETF/ETP total $3.7 $3.8 $6.6 $8.6 $10.5 $18.1 $27.3 $24.3 $39.7 $55.5 $61.6
# ETFs 4 11 20 27 32 49 67 97 128 200 250
# ETPs 4 11 16 23 25
# ETFs/ETPs total 4 11 20 27 32 49 71 108 144 223 275
Note: Assets Under Management in primary listings only, except for Australia where assets invested in the cross listings are available via CHESS (the cross listed assets are not typically added to the data we report for Asia Pacific as the figures is not released in time, which would account for any discrepancy to previous publications). Source: Global ETF Research and Implementation Strategy Team, BlackRock, Bloomberg, CHESS.

ETF Landscape June 2011 Celebrating 10 Years of ETFs in Australia from BlackRock
This document is not an offer to buy or sell any security or to participate in any trading strategy. Please refer to important information and qualifications at the end of this material. 36
Implementing asset allocation with ETFs
Investment applications
ETFs have many investment applications. ETFs on broad-based indices can serve as diversified core holdings, while style and sector ETFs can be used to complete parts of a portfolio or for tactical strategies.
Due to their targeted exposure to specific market segments, ETFs generally work well within the macro asset allocation and sector emphasis models developed by equity strategists. They also help provide efficient ways to gain international diversification. Another benefit of ETFs is that they are complimentary to many other investment products. They can be used together with common stocks, private asset managers, and other fund products.
Investors may buy ETFs to diversify their assets. Most ETFs are passively managed portfolios designed to provide relatively low-cost investments in broad-based or proprietary indices. Some ETFs offer relatively low-risk, broadly diversified portfolios, which many investors may find attractive as the core equity components of their portfolios. Others offer diversified investments in particular styles, sectors, industries, regions, or countries.
ETFs based on broad-market indices serve as core holdings, which is essential, especially in today’s environment of increased market volatility. Since no single sector, style, or stock consistently outperforms its peers, having core holdings invested in broad-market indices not only helps reduce volatility but also can achieve competitive returns for the overall portfolio.
ETFs work well with strategic asset-allocation models. In our view, asset-allocation models have two primary applications for investors:
As the framework for an entire portfolio. Investors desiring a complete asset allocation strategy may find this appealing, as they merely have to purchase appropriate investments for each market segment in their proper weightings and occasionally rebalance their portfolios.
As the core portion of a portfolio. Those seeking an approach with more active trading may find a core/satellite investment strategy appropriate. In this case, the model can serve as a core. In an effort to increase returns, shorter-term tactical strategies, such as stock, sector, style or country overweights may then be employed as satellite investments. Core holdings can help ensure that a portfolio’s performance does not deviate widely from established benchmarks, while satellite investments constitute active plays in an effort to increase returns.
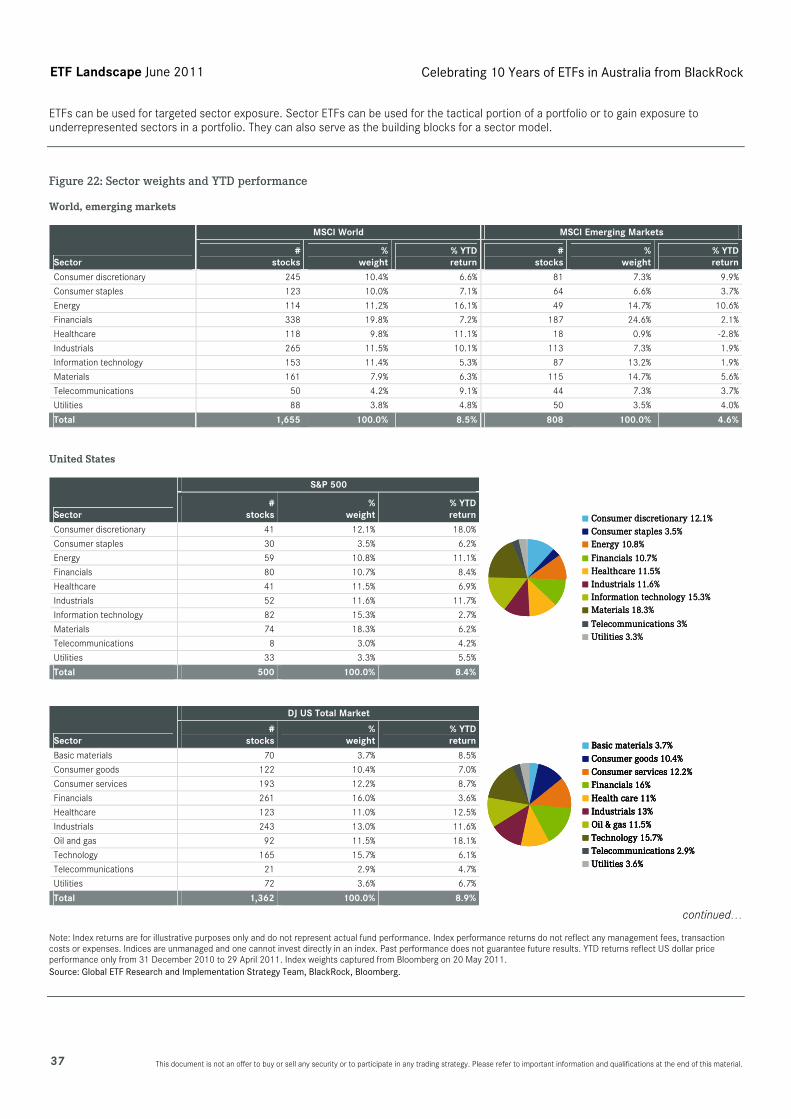
ETF Landscape June 2011 Celebrating 10 Years of ETFs in Australia from BlackRock
37 This document is not an offer to buy or sell any security or to participate in any trading strategy. Please refer to important information and qualifications at the end of this material.
ETFs can be used for targeted sector exposure. Sector ETFs can be used for the tactical portion of a portfolio or to gain exposure to underrepresented sectors in a portfolio. They can also serve as the building blocks for a sector model.
Figure 22: Sector weights and YTD performance
World, emerging markets
MSCI World MSCI Emerging Markets
Sector #
stocks %
weight% YTDreturn
# stocks
% weight
% YTDreturn
Consumer discretionary 245 10.4% 6.6% 81 7.3% 9.9%
Consumer staples 123 10.0% 7.1% 64 6.6% 3.7%
Energy 114 11.2% 16.1% 49 14.7% 10.6%
Financials 338 19.8% 7.2% 187 24.6% 2.1%
Healthcare 118 9.8% 11.1% 18 0.9% -2.8%
Industrials 265 11.5% 10.1% 113 7.3% 1.9%
Information technology 153 11.4% 5.3% 87 13.2% 1.9%
Materials 161 7.9% 6.3% 115 14.7% 5.6%
Telecommunications 50 4.2% 9.1% 44 7.3% 3.7%
Utilities 88 3.8% 4.8% 50 3.5% 4.0%
Total 1,655 100.0% 8.5% 808 100.0% 4.6%
United States
S&P 500
Sector #
stocks %
weight% YTDreturn
Consumer discretionary 41 12.1% 18.0%
Consumer staples 30 3.5% 6.2%
Energy 59 10.8% 11.1%
Financials 80 10.7% 8.4%
Healthcare 41 11.5% 6.9%
Industrials 52 11.6% 11.7%
Information technology 82 15.3% 2.7%
Materials 74 18.3% 6.2%
Telecommunications 8 3.0% 4.2%
Utilities 33 3.3% 5.5%
Total 500 100.0% 8.4%
Consumer discretionary 12.1%Consumer staples 3.5%Energy 10.8%
Financials 10.7%Healthcare 11.5%Industrials 11.6%Information technology 15.3%Materials 18.3%
Telecommunications 3%Utilities 3.3%
Consumer discretionary 12.1%Consumer staples 3.5%Energy 10.8%
Financials 10.7%Healthcare 11.5%Industrials 11.6%Information technology 15.3%Materials 18.3%
Telecommunications 3%Utilities 3.3%
DJ US Total Market
Sector #
stocks %
weight% YTD return
Basic materials 70 3.7% 8.5%
Consumer goods 122 10.4% 7.0%
Consumer services 193 12.2% 8.7%
Financials 261 16.0% 3.6%
Healthcare 123 11.0% 12.5%
Industrials 243 13.0% 11.6%
Oil and gas 92 11.5% 18.1%
Technology 165 15.7% 6.1%
Telecommunications 21 2.9% 4.7%
Utilities 72 3.6% 6.7%
Total 1,362 100.0% 8.9%
Basic materials 3.7%Consumer goods 10.4%Consumer services 12.2%Financials 16%Health care 11%Industrials 13%Oil & gas 11.5%Technology 15.7%Telecommunications 2.9%Utilities 3.6%
Basic materials 3.7%Consumer goods 10.4%Consumer services 12.2%Financials 16%Health care 11%Industrials 13%Oil & gas 11.5%Technology 15.7%Telecommunications 2.9%Utilities 3.6%
Basic materials 3.7%Consumer goods 10.4%Consumer services 12.2%Financials 16%Health care 11%Industrials 13%Oil & gas 11.5%Technology 15.7%Telecommunications 2.9%Utilities 3.6%
continued… Note: Index returns are for illustrative purposes only and do not represent actual fund performance. Index performance returns do not reflect any management fees, transaction costs or expenses. Indices are unmanaged and one cannot invest directly in an index. Past performance does not guarantee future results. YTD returns reflect US dollar price performance only from 31 December 2010 to 29 April 2011. Index weights captured from Bloomberg on 20 May 2011. Source: Global ETF Research and Implementation Strategy Team, BlackRock, Bloomberg.

ETF Landscape June 2011 Celebrating 10 Years of ETFs in Australia from BlackRock
This document is not an offer to buy or sell any security or to participate in any trading strategy. Please refer to important information and qualifications at the end of this material. 38
Figure 22: Sector weights and YTD performance (continued)
Europe
STOXX Europe 600 EURO STOXX
Sector #
stocks %
weight % YTDreturn
#stocks
%weight
% YTDreturn
Automobiles and parts 14 2.4% 17.9% 13 5.0% 18.0%
Banks 51 13.7% 14.6% 34 13.4% 20.5%
Basic resources 31 5.1% 4.3% 14 2.2% 6.6%
Chemicals 23 4.6% 20.5% 16 8.0% 22.5%
Construction and materials 24 2.7% 18.3% 17 4.0% 22.6%
Financial services 30 1.6% 14.8% 9 1.1% 25.5%
Food and beverage 27 7.2% 9.3% 15 5.6% 12.4%
Healthcare 34 10.0% 12.3% 13 4.3% 26.0%
Industrial goods and services 96 10.4% 15.8% 44 10.9% 17.3%
Insurance 32 5.6% 23.9% 14 6.8% 28.7%
Media 30 2.3% 11.7% 19 2.7% 11.7%
Oil and gas 33 8.8% 16.9% 14 7.3% 21.1%
Personal and household goods 29 5.4% 9.3% 13 4.2% 8.5%
Real estate 21 1.2% 17.8% 10 1.2% 16.8%
Retail 25 3.4% 8.6% 11 2.9% 12.1%
Technology 26 3.4% 19.5% 16 4.7% 16.9%
Telecommunications 21 5.4% 13.6% 11 6.5% 17.8%
Travel and leisure 21 1.2% 5.0% 7 1.0% 6.9%
Utilities 32 5.5% 16.1% 22 8.2% 17.5%
Total 600 100.0% 14.1% 312 100.0% 18.5%
MSCI Europe
Sector #
stocks %
weight% YTDreturn
Consumer discretionary 66 8.8% 12.6%
Consumer staples 38 12.4% 9.0%
Energy 26 10.8% 16.4%
Financials 102 21.2% 16.8%
Healthcare 28 10.2% 12.8%
Industrials 86 11.5% 15.3%
Information technology 19 3.1% 19.7%
Materials 49 10.3% 10.7%
Telecommunications 22 6.4% 13.9%
Utilities 29 5.3% 16.4%
Total 465 100.0% 14.1%
Note: Index returns are for illustrative purposes only and do not represent actual fund performance. Index performance returns do not reflect any management fees, transaction costs or expenses. Indices are unmanaged and one cannot invest directly in an index. Past performance does not guarantee future results. YTD returns reflect US dollar price performance only from 31 December 2010 to 29 April 2011. Index weights captured from Bloomberg on 20 May 2011. Source: Global ETF Research and Implementation Strategy Team, BlackRock, Bloomberg.

ETF Landscape June 2011 Celebrating 10 Years of ETFs in Australia from BlackRock
39 This document is not an offer to buy or sell any security or to participate in any trading strategy. Please refer to important information and qualifications at the end of this material.
Figure 23: Macro asset allocation strategies
ETFs can be used to implement the country and regional allocations suggested by strategists and analysts.
MSCI World #
stocks %
weight % YTDreturn
Australia 71 3.9% 9.4%
Austria 8 0.1% 9.9%
Belgium 13 0.4% 17.2%
Canada 100 5.3% 8.5%
Denmark 12 0.5% 13.2%
Finland 17 0.5% 7.7%
France 75 4.6% 19.2%
Germany 53 3.9% 19.8%
Greece 8 0.1% 10.3%
Hong Kong 40 1.3% 1.4%
Ireland 5 0.1% 19.6%
Israel 14 0.3% -5.9%
Italy 30 1.3% 24.2%
Japan 339 8.8% -5.3%
Netherlands 21 1.2% 12.9%
New Zealand 5 0.1% 11.3%
Norway 10 0.4% 14.5%
Portugal 9 0.1% 13.2%
Singapore 32 0.8% 4.3%
Spain 28 1.6% 22.9%
Sweden 33 1.5% 13.5%
Switzerland 37 3.7% 9.9%
United Kingdom 106 9.6% 10.0%
United States 589 49.8% 8.6%
Total 1,655 100.0% 8.5%
MSCI Europe #
stocks %
weight % YTDreturn
Austria 8 0.5% 9.9%
Belgium 13 1.4% 17.2%
Denmark 12 1.6% 13.2%
Finland 17 1.6% 7.7%
France 75 15.5% 19.2%
Germany 53 13.2% 19.8%
Greece 8 0.3% 10.3%
Ireland 5 0.4% 19.6%
Italy 30 4.4% 24.2%
Netherlands 21 3.9% 12.9%
Norway 10 1.4% 14.5%
Portugal 9 0.4% 13.2%
Spain 28 5.3% 22.9%
Sweden 33 5.0% 13.5%
Switzerland 37 12.5% 9.9%
United Kingdom 106 32.5% 10.0%
Total 465 100.0% 14.1%
MSCI GCC Countries ex SA #
stocks %
weight % YTDreturn
Bahrain 3 1.0% -25.0%
Kuwait 15 54.0% 26.9%
Oman 9 5.6% 3.5%
Qatar 14 23.0% 27.6%
UAE 13 16.4% -2.2%
Total 54 100.0% 18.6%
MSCI Emerging Markets #
stocks %
weight% YTDreturn
Brazil 83 15.1% 0.8%
Chile 17 1.6% 0.0%
China 141 17.8% 4.2%
Colombia 9 0.8% 4.2%
Czech Republic 3 0.4% 29.3%
Egypt 11 0.3% -29.9%
Hungary 4 0.4% 35.0%
India 66 7.0% -6.3%
Indonesia 24 2.6% 9.5%
Malaysia 40 3.0% 5.2%
Mexico 24 4.3% 1.8%
Morocco 3 0.2% 4.5%
Peru 3 0.6% -19.1%
Philippines 15 0.6% 1.3%
Poland 22 1.7% 18.2%
Russia 27 6.7% 16.6%
South Africa 48 7.3% 1.6%
South Korea 102 14.7% 13.3%
Taiwan 125 11.6% 2.3%
Thailand 22 1.8% 9.2%
Turkey 19 1.4% 3.5%
Total 808 100.0% 4.6%
MSCI Frontier Markets #
stocks %
weight% YTDreturn
Argentina 6 7.3% -14.9%
Bahrain 3 0.6% -4.5%
Bangladesh 26 4.2% -32.1%
Bulgaria 2 0.2% 40.0%
Croatia 4 2.5% 14.4%
Estonia 2 0.4% 6.4%
Jordan 4 0.9% -8.7%
Kazakhstan 3 2.8% 10.4%
Kenya 8 2.6% -3.2%
Kuwait 15 29.2% -6.7%
Lebanon 4 1.9% -6.2%
Lithuania 3 0.3% 1.2%
Mauritius 3 1.2% 18.8%
Nigeria 8 6.9% -0.6%
Oman 9 3.0% -8.9%
Pakistan 12 4.1% 2.7%
Qatar 14 12.5% 1.5%
Romania 3 0.9% 44.0%
Serbia 2 0.4% 30.7%
Slovenia 4 2.4% 5.5%
Sri Lanka 8 2.0% -3.2%
Trinidad 2 0.9% 10.5%
Tunisia 4 0.8% -10.4%
UAE 13 8.8% 1.2%
Ukraine 8 0.9% 22.8%
Vietnam 12 2.1% -3.1%
Total 182 100.0% -4.0%
Note: Index returns are for illustrative purposes only and do not represent actual fund performance. Index performance returns do not reflect any management fees, transaction costs or expenses. Indices are unmanaged and one cannot invest directly in an index. Past performance does not guarantee future results. YTD returns reflect US dollar price performance only from 31 December 2010 to 29 April 2011. Index weights captured from Bloomberg on 20 May 2011. Source: Global ETF Research and Implementation Strategy Team, BlackRock, Bloomberg.

ETF Landscape June 2011 Celebrating 10 Years of ETFs in Australia from BlackRock
This document is not an offer to buy or sell any security or to participate in any trading strategy. Please refer to important information and qualifications at the end of this material. 40
Figure 24: Index performance (annual US dollar price performance)
Index Ticker #
members 1999 2000 2001 2002 2003 2004 2005 2006 2007 2008 2009 2010 Apr-11
MSCI World MXWO 1,656 23.6% -14.1% -17.8% -21.1% 30.8% 12.8% 7.6% 18.0% 7.1% -42.1% 27.0% 9.6% 8.5%
MSCI Emerging Markets MXEF 810 63.7% -31.8% -4.9% -8.0% 51.6% 22.4% 30.3% 29.2% 36.5% -54.5% 74.5% 16.4% 4.6%
MSCI Europe MXEU 466 15.3% -9.9% -21.3% -20.0% 34.1% 18.0% 7.2% 29.8% 10.6% -47.9% 30.6% 0.8% 14.1%
MSCI Pacific ex Japan MXPCJ 148 39.3% -17.5% -12.2% -9.0% 41.3% 24.6% 10.2% 28.0% 27.2% -52.2% 65.9% 12.7% 6.9%
MSCI Japan MXJP 339 61.9% -28.9% -29.9% -10.7% 34.3% 15.0% 24.2% 5.1% -6.4% -29.6% 4.9% 11.6% -5.3%
S&P 500 SPX 500 19.5% -10.1% -13.0% -23.4% 26.4% 9.0% 3.0% 13.6% 3.5% -38.5% 23.5% 12.8% 8.4%
MSCI EAFE MXEA 967 25.3% -15.2% -22.6% -17.5% 35.3% 17.6% 10.9% 23.5% 8.6% -45.1% 27.7% 4.9% 8.4%
S&P GSCI SPGCCI - 46.2% 26.9% -31.5% 39.0% 10.8% 19.2% 39.1% 0.4% 40.7% -42.8% 50.3% 20.4% 20.1%
DJ-UBS Commodity DJUBS - 18.6% 24.2% -22.3% 23.9% 22.7% 7.6% 17.5% -2.7% 11.1% -36.6% 18.7% 16.7% 8.0%
Barclays Capital Global Aggreg. Bond Index LEGATRUU 13,727 -5.1% 3.1% 1.6% 16.5% 12.5% 9.1% -4.4% 6.6% 9.5% 4.8% 6.9% 5.5% 4.4%
-100%
-50%
0%
50%
100%
150%
200%
250%
300%
350%
400%
Jul-95 Apr-97 Jan-99 Oct-00 Jul-02 Apr-04 Jan-06 Oct-07 Jul-09 Apr-11
-100%
-50%
0%
50%
100%
150%
200%
250%
300%
350%
400%
MSCI Emerging MarketsMSCI JapanMSCI EAFE
MSCI EuropeS&P 500Barclays Capital Global Aggregate Bond Index
MSCI WorldMSCI Pacific ex JapanS&P GSCIDJ-UBS Commodity
% accumulated US$ price return % accumulated US$ price return
-100%
-50%
0%
50%
100%
150%
200%
250%
300%
350%
400%
Jul-95 Apr-97 Jan-99 Oct-00 Jul-02 Apr-04 Jan-06 Oct-07 Jul-09 Apr-11
-100%
-50%
0%
50%
100%
150%
200%
250%
300%
350%
400%
MSCI Emerging MarketsMSCI JapanMSCI EAFE
MSCI Emerging MarketsMSCI JapanMSCI EAFE
MSCI EuropeS&P 500Barclays Capital Global Aggregate Bond Index
MSCI EuropeS&P 500Barclays Capital Global Aggregate Bond Index
MSCI WorldMSCI Pacific ex JapanS&P GSCIDJ-UBS Commodity
MSCI WorldMSCI Pacific ex JapanS&P GSCIDJ-UBS Commodity
% accumulated US$ price return % accumulated US$ price return
Note: Index returns are for illustrative purposes only and do not represent actual fund performance. Index performance returns do not reflect any management fees, transaction costs or expenses. Indices are unmanaged and one cannot invest directly in an index. Past performance does not guarantee future results. Source: Global ETF Research and Implementation Strategy Team, BlackRock, Bloomberg. Number of constituents captured from Bloomberg on 20 May 2011.
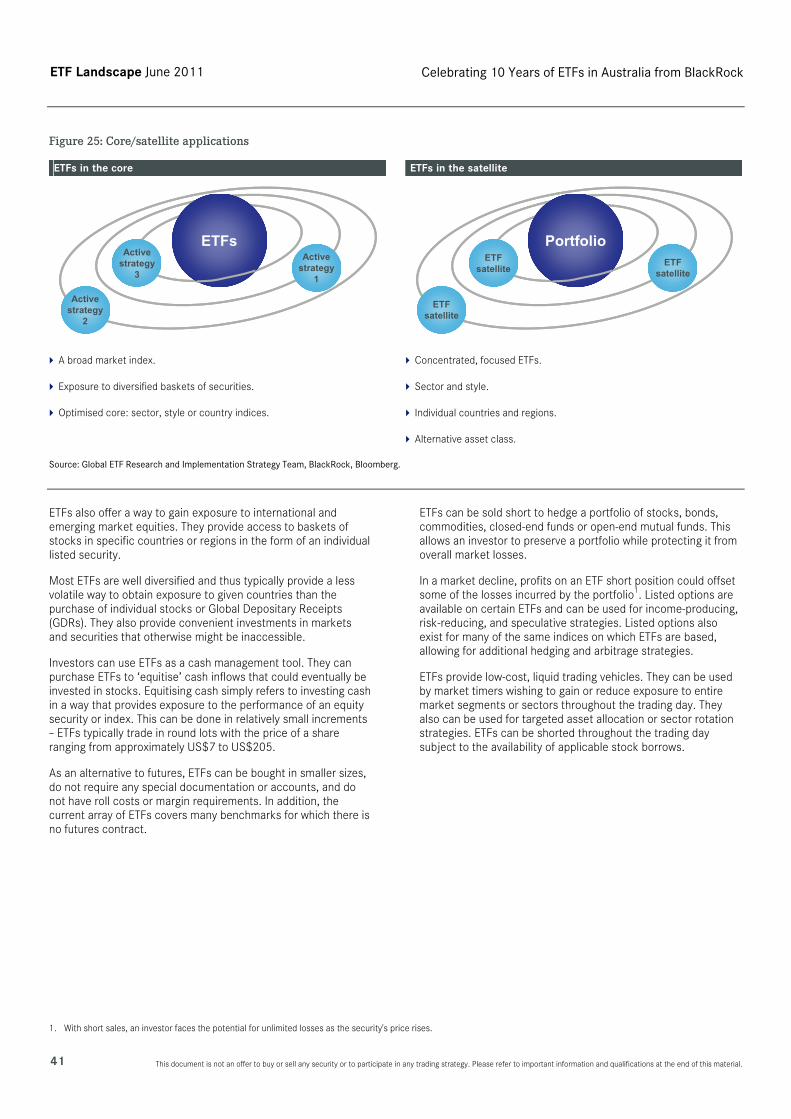
ETF Landscape June 2011 Celebrating 10 Years of ETFs in Australia from BlackRock
41 This document is not an offer to buy or sell any security or to participate in any trading strategy. Please refer to important information and qualifications at the end of this material.
Figure 25: Core/satellite applications
ETFs in the core
Activestrategy
1
Activestrategy
2
Activestrategy
3
ETFsActivestrategy
1
Activestrategy
2
Activestrategy
3
ETFs
A broad market index.
Exposure to diversified baskets of securities.
Optimised core: sector, style or country indices.
ETFs in the satellite
ETFsatellite
ETFsatellite
ETFsatellite
PortfolioETF
satellite
ETFsatellite
ETFsatellite
Portfolio
Concentrated, focused ETFs.
Sector and style.
Individual countries and regions.
Alternative asset class.
Source: Global ETF Research and Implementation Strategy Team, BlackRock, Bloomberg.
ETFs also offer a way to gain exposure to international and emerging market equities. They provide access to baskets of stocks in specific countries or regions in the form of an individual listed security.
Most ETFs are well diversified and thus typically provide a less volatile way to obtain exposure to given countries than the purchase of individual stocks or Global Depositary Receipts (GDRs). They also provide convenient investments in markets and securities that otherwise might be inaccessible.
Investors can use ETFs as a cash management tool. They can purchase ETFs to ‘equitise’ cash inflows that could eventually be invested in stocks. Equitising cash simply refers to investing cash in a way that provides exposure to the performance of an equity security or index. This can be done in relatively small increments – ETFs typically trade in round lots with the price of a share ranging from approximately US$7 to US$205.
As an alternative to futures, ETFs can be bought in smaller sizes, do not require any special documentation or accounts, and do not have roll costs or margin requirements. In addition, the current array of ETFs covers many benchmarks for which there is no futures contract.
ETFs can be sold short to hedge a portfolio of stocks, bonds, commodities, closed-end funds or open-end mutual funds. This allows an investor to preserve a portfolio while protecting it from overall market losses.
In a market decline, profits on an ETF short position could offset some of the losses incurred by the portfolio1. Listed options are available on certain ETFs and can be used for income-producing, risk-reducing, and speculative strategies. Listed options also exist for many of the same indices on which ETFs are based, allowing for additional hedging and arbitrage strategies.
ETFs provide low-cost, liquid trading vehicles. They can be used by market timers wishing to gain or reduce exposure to entire market segments or sectors throughout the trading day. They also can be used for targeted asset allocation or sector rotation strategies. ETFs can be shorted throughout the trading day subject to the availability of applicable stock borrows.
1. With short sales, an investor faces the potential for unlimited losses as the security's price rises.

ETF Landscape June 2011 Celebrating 10 Years of ETFs in Australia from BlackRock
This document is not an offer to buy or sell any security or to participate in any trading strategy. Please refer to important information and qualifications at the end of this material. 42
Figure 26: ETF portfolios
Conservative
Balanced
Growth
Dynamic
Fixed incomeBarCap € Government Bond 1–3BarCap € Government Bond 3–5BarCap € Government Bond 7–10iBoxx € Liquid Corporate Bond
Fixed incomeBarCap € Government Bond 1–3BarCap € Government Bond 3–5BarCap € Government Bond 7–10iBoxx € Liquid Corporate Bond
PropertyFTSE EPRA/NAREIT Global Property Yield
AlternativesFTSE/Macquarie Global Infrastructure 100S&P Listed Private EquityDow-Jones-UBS Commodity
PropertyFTSE EPRA/NAREIT Global Property Yield
AlternativesFTSE/Macquarie Global Infrastructure 100S&P Listed Private EquityDow-Jones-UBS Commodity
EquitiesMSCI Europe ex-UKFTSE 100S&P 500MSCI North AmericaNikkei 225MSCI Emerging Markets
EquitiesMSCI Europe ex-UKFTSE 100S&P 500MSCI North AmericaNikkei 225MSCI Emerging Markets
Lower
Lower
Higher
Higher
Expected risk
Expected return
Note: Sample portfolios are for illustrative purposes only and should not be construed as a recommendation to purchase or sell, or an offer to sell, or a solicitation of an offer to buy any security. Source: BlackRock.
Figure 27: Why use ETFs?
Transparency Investors can generally see the ETF composition at any given time.
Liquidity ETFs offer two sources of liquidity: Traditional liquidity measured by secondary market trading volume. The liquidity of the underlying assets via the creation and redemption process.
Diversification ETFs offer immediate exposure to a basket or group of securities for instant diversification. Broad range of asset classes including equities, bonds, commodities, investment themes etc.
Flexibility ETFs are listed on exchanges and can be traded at any time the market is open. Pricing is continuous throughout the day.
Cost effectiveness ETFs offer a cost effective route to diversified market exposure. The average (Total Expense Ratio) TER for equity ETFs in Europe is 41 bps versus 96 bps per annum for the average equity
index tracking fund and 187 bps per annum for the average active equity fund1.
Securities lending ETF units and underlying assets can be lent out to potentially offset holding costs.
1. Source: Strategic Insight Simfund Global, Global ETF Research and Implementation Strategy Team, BlackRock, data as at end January 2011.

ETF Landscape June 2011 Celebrating 10 Years of ETFs in Australia from BlackRock
43 This document is not an offer to buy or sell any security or to participate in any trading strategy. Please refer to important information and qualifications at the end of this material.
Figure 28: How can ETFs be used?
Strategic
Market exposure: Implement a wide variety of investment strategies using a broad range of market exposures.
Directional views: Establish broad directional market position, use long and short trades to implement market view(s).
Core satellite: Achieve strategic focus.
Rebalancing: Adjust drift in a portfolio’s asset allocation or style.
Completion: Add uncorrelated instruments and/or asset classes to strategy.
Tactical
Interim beta: Maintain exposure to given market while searching for specific market opportunity.
Cash management: Invest cash rapidly and cost effectively to gain desired market exposures.
Derivatives alternative: Broad opportunity set of Delta 1 exposures with single line cash-based settlement.
Exposure management: Shift portfolio emphasis by adjusting exposures (e.g. duration, credit).
Thematic: Implement thematic exposures (e.g. dividends, alternatives).
Figure 29: ETFs can offer solutions for a range of portfolio strategies1
Portfolio construction
Fill allocations required by investment strategy.
Improve diversification.
Gain exposure to size, style, yield, sector, geography.
Portfolio management
Implement short-/long-term and/or neutral market views:
Hard to access asset classes, themes, sector, country.
Tactical asset allocations.
Strategic asset allocations
Establish core holdings.
Establish single country or sector satellites.
Risk management Active risk budgeting.
Combine ETFs in managing total portfolio volatility or duration adjustments in fixed income portfolios.
Cash equitisation Manage inflows, outflows, transitions.
Obtain a wider exposure than offered by other Delta 1 products.
Exposure Exposures to markets or asset classes where one has no expertise or operational capabilities.
1. The strategies discussed are strictly for illustrative and educational purposes and should not be construed as a recommendation to purchase or sell, or an offer to sell or a
solicitation of an offer to buy any security. There is no guarantee that any strategies discussed will be effective.

ETF Landscape June 2011 Celebrating 10 Years of ETFs in Australia from BlackRock
This document is not an offer to buy or sell any security or to participate in any trading strategy. Please refer to important information and qualifications at the end of this material. 44
ETFs afford investors two forms of liquidity. The first is through trading the shares on a secondary basis on the exchange. The second is on a primary basis via the unique ‘creation’ process, whereby an AP purchases the underlying basket of securities in the local market and deposits the basket ‘in kind’ into the ETF, creating more shares in that ETF. The unique creation/redemption process means that the liquidity in the ETF is driven by the liquidity in the underlying securities.
ETFs tend to trade at, or close to, their underlying NAVs. This is because there are usually arbitrageurs waiting to take advantage of a significant premium or discount relative to the underlying index. An arbitrageur will buy/sell the ETF and place an offsetting buy/sell transaction in the underlying basket of component securities.
Divergence in the performance of an ETF, relative to the index it tracks, is possible. Differences tend to be caused by fund fees and expenses, tracking error when optimisation strategies are used to track the index, rebalancing due to corporate actions and index changes, or the dividend reinvestment policy of the fund.
Figure 30: Typical ETF trading process (physical replication)
Secondary marketPrimary market
ETF manager Investor
Exchange
ETF market makers/broker
Securities
ETF
Cash (OTC)
ETF
Cash
ETF¹
Secondary marketPrimary market
ETF manager Investor
Exchange
ETF market makers/broker
Securities
ETF
Securities
ETF
Cash (OTC)
ETF
Cash (OTC)
ETF
Cash
ETF¹
Cash
ETF¹
Shorting and hedging with ETFs2
ETFs can be sold short to hedge a portfolio of stocks, bonds, commodities or funds. This allows an investor to potentially preserve a portfolio while protecting it from overall market losses. In a market decline, profits on an ETF short position could offset some of the losses incurred by the portfolio. Options are available on most ETFs in the United States which can be used for a number of strategies.
Securities lending revenue on ETFs can be attractive for investors who own ETF shares. The lending revenue that can be earned on ETFs, may at times and for some ETFs, more than cover the annual TER. Investors can also use inverse (short) and leverage inverse ETFs to implement hedges and short economic exposure.
There are currently 83 inverse/inverse leveraged ETFs in the United States and 116 inverse/inverse leveraged ETFs listed on exchanges outside the United States. Short interest is often considered an indication of the level of scepticism in the market3.
Short interest data is captured for United States listed securities on the 15th of each month, or the next business day, and reflects the number of shares that have yet to be repurchased to give back to lenders. The higher the short interest, the more investors are expecting a downturn. Short positions fall in value as stocks rise, and vice versa.
The rules on shorting ETFs on financial indices and the use of inverse and leveraged inverse ETFs on financial indices in the various markets are continually being updated as regulators react to market conditions and the actions of other regulators – so the position is quite fluid.
1. ETF or Creation Basket. 2. With short sales, the investor risks paying more for a security than the investor received from the sale. 3. Data as at end Q1 2011. Source: Global ETF Research and Implementation Strategy Team, BlackRock, Bloomberg.

ETF Landscape June 2011 Celebrating 10 Years of ETFs in Australia from BlackRock
45 This document is not an offer to buy or sell any security or to participate in any trading strategy. Please refer to important information and qualifications at the end of this material.
Today the ETF toolbox is well stocked with a wide array of products:
Figure 31: ETF/ETP toolbox
Equity Fixed income Cash Currency
EONIA, SONIA
Fed funds
Alternatives
Developed currencies
Emerging market currencies
Inverse/leveraged
Strategy
e.g. carry, momentum…
Commodities
Government
Corporate
Credit
Inflation
High yield
Mortgage backed
Emerging markets
Hedge funds
Carbon
Volatility
Global
Capitalisation
e.g. large, mid, small…
Sectors
Broad markets
Emerging markets
Countries
Inverse/leveraged
Styles
Active
Dividend
Fundamental
Infrastructure
Real estate
Shariah
Thematic
Private equity
Value
Growth
2,670 ETFs with 6,021 ETF listings
1,149 ETPs1 with 1,872 listings
Total: 3,819 products with 7,893 listings
Broad
e.g. S&P, GSCI, DJUBS, RICI, CRB…
Sub-indices
e.g. energy, livestock, precious metals, industrial metals, agriculture…
Individual commodities
Based on physically held assets
e.g. gold, silver, platinum, palladium…
Based on futures
Based on forwards
Inverse/leveraged 1. ETPs include HOLDRs, ETCs, Exchange Traded Currency Products, and ETNs, as at end April 2011. Source: Global ETF Research and Implementation Strategy Team, BlackRock, Bloomberg.
ETFs cover many well known blue-chip indices such as S&P 500, CAC, DAX, FTSE 100, Hang Seng, Nikkei etc. Recently there has been a proliferation of new indices from index providers which they hope will form the basis of new ETFs. Many of the new indices use diverse weighting methodologies, including market capitalisation, equal weight, price, dividend and other fundamental factors.
As an example the FTSE RAFI Index Series is weighted using four fundamental factors; total cash dividends, free cash flow, total sales and book equity value rather than traditional market capitalisation. WisdomTree has created dividend-weighted indices where the stock’s weight is based on either the amount of cash dividend or the dividend yield of the companies in each index.
Commodity ETFs: the first commodity ETF was launched in Canada in March 2001. Commodities as an asset class typically exhibit low correlation to equity indices, and the advent of commodity ETFs allows investors to satisfy asset allocation and diversification requirements, hedge inflation or speculate on commodity indices such as the S&P GSCI. Trading commodity indices as a single ETP avoids the need to manage futures rolls, provides investors with deep underlying liquidity pools, and allows investors who are restricted from using derivatives or other commodity vehicles to gain exposure in an equity vehicle.
Dividend ETFs: the first dividend weighted ETF was launched in November 2003. Several ETF providers have structured ETFs by selecting and weighting the constituents based on dividend yield or absolute dividend payments. Some research suggests that dividend weighted indices generate higher cumulative returns with lower volatility than comparable standard market cap weighted indices over the long term. There are many ETFs providing dividend weighted global, regional, single country and emerging markets exposure with TERs ranging from 0.20% to 0.88%.
Source: Various ETF providers, exchanges, Global ETF Research and Implementation Strategy Team, BlackRock, as at year end 2010.
ETF Landscape June 2011 Celebrating 10 Years of ETFs in Australia from BlackRock
This document is not an offer to buy or sell any security or to participate in any trading strategy. Please refer to important information and qualifications at the end of this material. 46
Emerging market ETFs: the first emerging market ETF was launched in March 1996. Emerging market countries are typically characterised by rapid economic growth, volatility, immature institutions and political instability. ETFs that track global emerging market indices such as the MSCI Emerging Markets Index provide investors with diversified exposure to 21 emerging market countries. There are many ETFs providing global, regional, and single country emerging market exposure with TERs ranging from 0.06% to 1.90%.
Fixed income ETFs: the first fixed income ETF was launched in Canada in November 2000. A broad array of government, corporate, credit, high yield, emerging market, inflation protected and money market fixed income products are available to investors within the flexibility of an ETF wrapper, allowing investors to implement income generating strategies, fund future liabilities, hedge inflation and enhance portfolio risk-adjusted returns. There are global, regional and single country fixed income ETFs with TERs ranging from 0.05% to 1.35%.
Fundamental ETFs: the first fundamental factor weighted ETF was launched in May 2000. Fundamental factors such as sales, cash flow, book value, dividends, earnings, and employees, are increasingly being used to create new indices. It has been argued that traditional market cap weighted indices are systematically inefficient by overweighting overvalued stocks and underweighting undervalued stocks.
Global ETFs: the first global ETF was launched in August 1997 in New Zealand. Global ETFs allow investors to gain diversified exposure to broad developed markets such as MSCI World which tracks the performance of 24 developed countries. International diversification can minimise the impact of economic downturns within individual countries or regions and reduce overall risk. There are global ETFs with TERs ranging from 0.20% to 1.14%.
Infrastructure ETFs: the first infrastructure ETF was launched in January 2007. Infrastructure indices provide diversified exposure to three infrastructure clusters: energy (oil and gas, storage and transportation), transportation (airport services, highways and railroads, marine ports and services) and utilities (electric, gas, water, multi-utilities).
Inverse/leveraged ETFs: the first inverse or leveraged ETF was launched in February 2005. Leveraged ETFs are designed to provide up to 300% daily upside performance while the inverse range of ETFs provide one, two or three times daily reverse (short) index performance. These ETFs can be used to magnify returns, hedge portfolios and manage risk without the need for a margin account or margin calls. TERs for these ETFs range from 0.14% to 1.90%.
Private equity ETFs: the first private equity ETF was launched in October 2006. Private equity firms raise capital primarily from institutional investors such as pension funds, banks, insurance companies, endowments, family offices, funds of funds and foundations to invest in venture capital, buy-outs and special situations (distressed companies). Typically, private equity companies invest in high growth, start-up companies or acquire businesses where superior efficiencies could be achieved.
Real estate ETFs: the first real estate ETF was launched in the United States in June 2000. The existing range of real estate ETFs include listed real estate companies and Real Estate Investment Trusts (REITs) which own and usually actively manage income-producing commercial real estate. REITs are typically required to pay out at least 90% of all taxable income, providing dividend income to investors, along with the potential for long term share price appreciation. There are several ETFs available allowing investors to gain global, regional or single country REIT exposure.
Sector ETFs: the first sector ETFs were launched in December 1998. These covered nine United States economic sectors and allowed investors to gain United States sector exposure or implement sector rotation strategies. Certain sectors outperform in particular stages of the economic cycle. Sector rotation strategies are designed to beat the market by rotating the investment into the sector which is expected to outperform in the given stage of the economic cycle. There are many ETFs providing global, regional, and single country sector exposure with TERs ranging from 0.15% to 1.49%.
Shari’ah ETFs: the first Shari’ah compliant ETF was launched in January 2007. Shari’ah compliance means compliance with certain Shari’ah principles that are derived from the Qur'an and other sources of Islamic law, as determined by Shari’ah scholars. Methodologies exclude representation in the index by shares issued by producers of alcohol and pork-related products, providers of conventional financial services and providers of entertainment services (e.g. hotels, casinos/gambling, cinema etc.). Tobacco manufacturers, defence and weapons companies, although not strictly forbidden under Shari’ah law, are also excluded. In addition to excluding companies from certain sectors, Shari’ah compliant indices also exclude companies that employ excessive leverage or generate excessive interest income.
Source: Various ETF providers, exchanges, Global ETF Research and Implementation Strategy Team, BlackRock, as at year end 2010.

ETF Landscape June 2011 Celebrating 10 Years of ETFs in Australia from BlackRock
47 This document is not an offer to buy or sell any security or to participate in any trading strategy. Please refer to important information and qualifications at the end of this material.
Figure 32: Comparison of fixed income index trading characteristics
Understanding index methodology is the key to selecting and using ETFs.
Investors must understand the differences in pricing sources1, frequency of pricing updates and what prices are being captured:
Where (one bank or consortium...)
When (intraday, daily, weekly...)
What (bid, mid, dirty…)
Government
BarclaysCapital
Government
Citigroup
Government
eb.rexx
Government
EuroMTS
Gilt
FTSE
Emerging market
JPMorgan
Government
Markit
Aggregate Corporate Inflation-linked Corporate
Corporate Asset backed Asset backed
Inflation-linked Inflation-linked
Emerging market
Credit
Government
BarclaysCapital
Government
Citigroup
Government
eb.rexx
Government
EuroMTS
Gilt
FTSE
Emerging market
JPMorgan
Government
Markit
Aggregate Corporate Inflation-linked Corporate
Corporate Asset backed Asset backed
Inflation-linked Inflation-linked
Emerging market
Credit
Index family Exposure
Index calculation Price source Price contribution Price type
Barclays Capital Aggregate Barclays Capital About 80% comes from Barclays Capital traders Daily Bid prices (non-government bonds)Mid prices (government bonds)
Government – term Barclays Capital Barclays Capital traders Daily Mid prices
Government – short treasury
Barclays Capital About 80% comes from Barclays Capital traders. The rest comes from third party vendors
Daily Mid prices
Corporate Barclays Capital About 80% comes from Barclays Capital traders Daily Bid prices
Inflation-linked Barclays Capital Barclays Capital traders Daily Mid prices
Inflation-linked world Barclays Capital Euro government, United States TIPS, United Kingdom linkers and Japanese linkers come from Barclays Capital. Prices for Australian linkers are taken from ABN Amro. Canadian linker prices are taken from RBC Dominion and Swedish linker prices are taken from PMI Exchange
Daily Mid prices
Citigroup Citigroup Individual Citigroup trader pricing Daily Bid prices (Japan mid prices)
eb.rexx Deutsche Börse Eurex Bonds Intraday 9:00 am – 5:00 pm CET
Traded price data
EuroMTS EuroMTS MTS Markets Intraday 9:00 am – 5:30 pm CET
Bid prices
FTSE FTSE Gilt-Edged Market Makers Association (GEMMA) via Reuters
Daily Mid prices
JP Morgan JP Morgan JP Morgan traders Daily Bid prices
Markit iBoxx Covered Markit Indices Markit iBoxx consortium of up to 10 dealers Intraday for EUR and GBP indices, all others are end of day
Bid prices
Government – liquid capped and corporate
Markit Indices Markit iBoxx consortium of up to 10 dealers Intraday for EUR and GBP indices, all others are end of day
Bid prices
$ corporate Markit Indices Markit iBoxx consortium of up to 10 dealers Intraday for EUR and GBP indices, all others are end of day
Bid prices
1. A fund may price a security using a different pricing source than used by the index provider itself. Source: Fixed Income Index Guide, BlackRock, Markit.
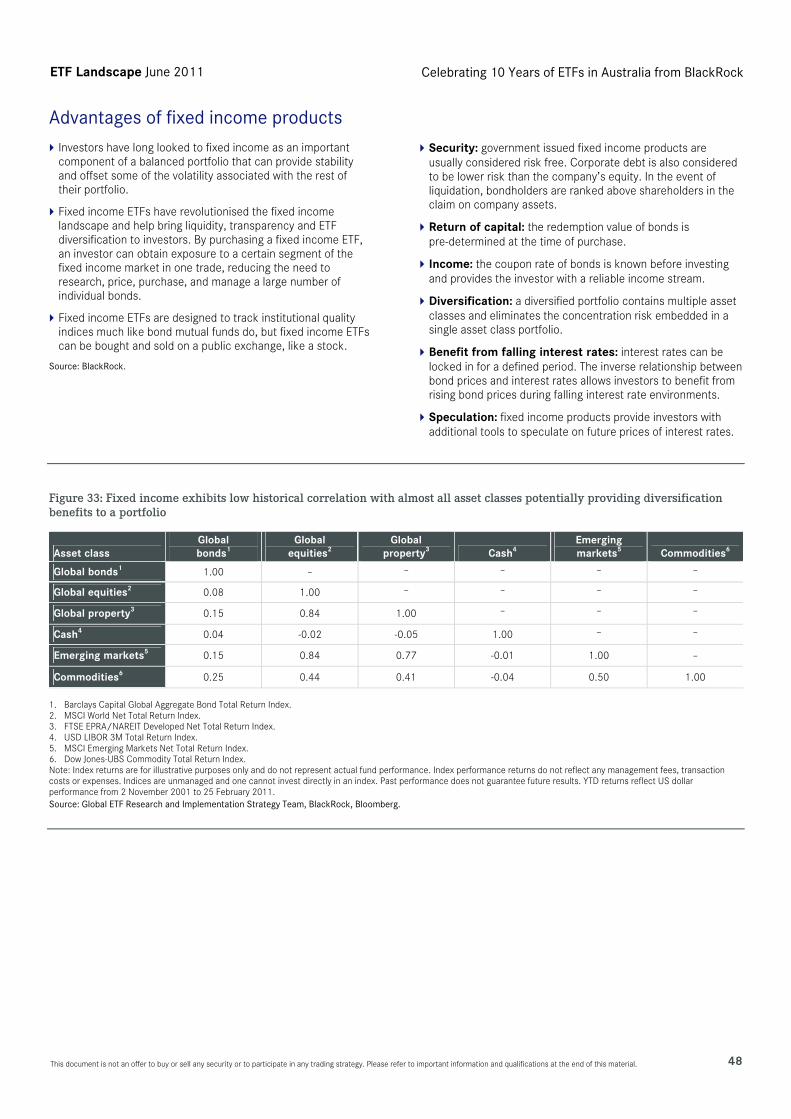
ETF Landscape June 2011 Celebrating 10 Years of ETFs in Australia from BlackRock
This document is not an offer to buy or sell any security or to participate in any trading strategy. Please refer to important information and qualifications at the end of this material. 48
Advantages of fixed income products
Investors have long looked to fixed income as an important component of a balanced portfolio that can provide stability and offset some of the volatility associated with the rest of their portfolio.
Fixed income ETFs have revolutionised the fixed income landscape and help bring liquidity, transparency and ETF diversification to investors. By purchasing a fixed income ETF, an investor can obtain exposure to a certain segment of the fixed income market in one trade, reducing the need to research, price, purchase, and manage a large number of individual bonds.
Fixed income ETFs are designed to track institutional quality indices much like bond mutual funds do, but fixed income ETFs can be bought and sold on a public exchange, like a stock.
Source: BlackRock.
Security: government issued fixed income products are usually considered risk free. Corporate debt is also considered to be lower risk than the company’s equity. In the event of liquidation, bondholders are ranked above shareholders in the claim on company assets.
Return of capital: the redemption value of bonds is pre-determined at the time of purchase.
Income: the coupon rate of bonds is known before investing and provides the investor with a reliable income stream.
Diversification: a diversified portfolio contains multiple asset classes and eliminates the concentration risk embedded in a single asset class portfolio.
Benefit from falling interest rates: interest rates can be locked in for a defined period. The inverse relationship between bond prices and interest rates allows investors to benefit from rising bond prices during falling interest rate environments.
Speculation: fixed income products provide investors with additional tools to speculate on future prices of interest rates.
Figure 33: Fixed income exhibits low historical correlation with almost all asset classes potentially providing diversification benefits to a portfolio
Asset class Global bonds1
Global equities2
Global property3 Cash4
Emerging markets5 Commodities6
Global bonds1 1.00 – – – – –
Global equities2 0.08 1.00 – – – –
Global property3 0.15 0.84 1.00 – – –
Cash4 0.04 -0.02 -0.05 1.00 – –
Emerging markets5 0.15 0.84 0.77 -0.01 1.00 –
Commodities6 0.25 0.44 0.41 -0.04 0.50 1.00
1. Barclays Capital Global Aggregate Bond Total Return Index. 2. MSCI World Net Total Return Index. 3. FTSE EPRA/NAREIT Developed Net Total Return Index. 4. USD LIBOR 3M Total Return Index. 5. MSCI Emerging Markets Net Total Return Index. 6. Dow Jones-UBS Commodity Total Return Index. Note: Index returns are for illustrative purposes only and do not represent actual fund performance. Index performance returns do not reflect any management fees, transaction costs or expenses. Indices are unmanaged and one cannot invest directly in an index. Past performance does not guarantee future results. YTD returns reflect US dollar performance from 2 November 2001 to 25 February 2011. Source: Global ETF Research and Implementation Strategy Team, BlackRock, Bloomberg.
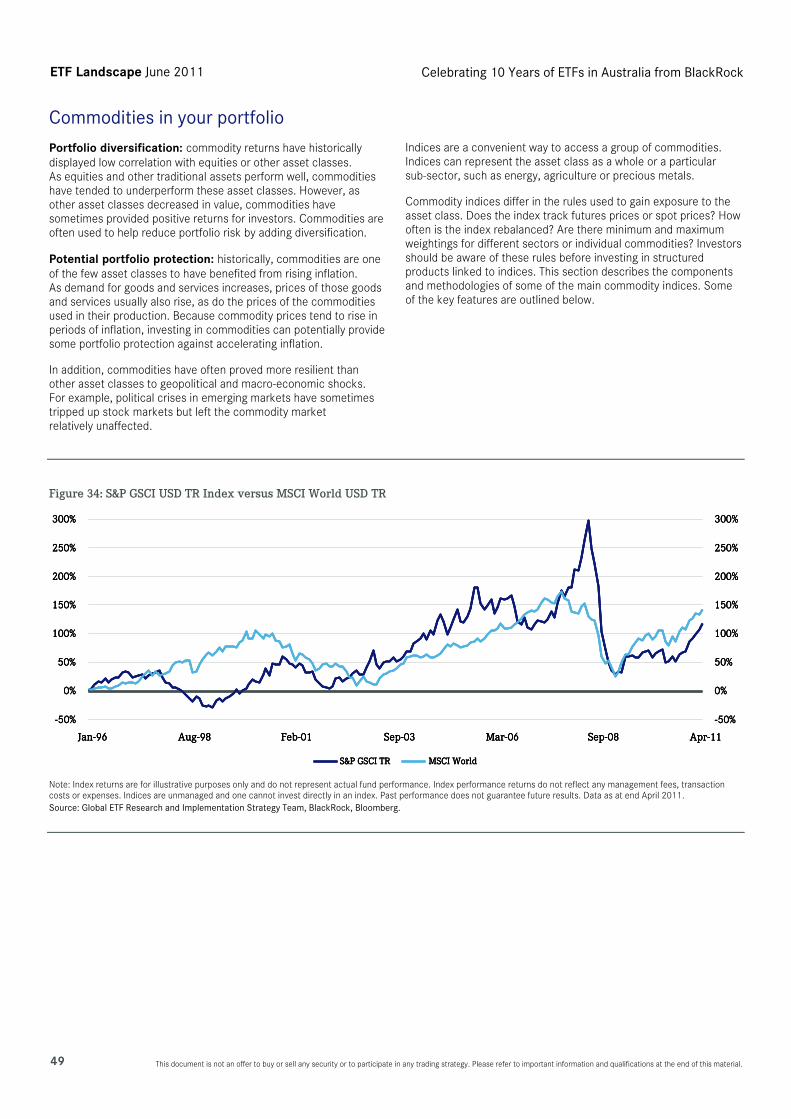
ETF Landscape June 2011 Celebrating 10 Years of ETFs in Australia from BlackRock
49 This document is not an offer to buy or sell any security or to participate in any trading strategy. Please refer to important information and qualifications at the end of this material.
Commodities in your portfolio
Portfolio diversification: commodity returns have historically displayed low correlation with equities or other asset classes. As equities and other traditional assets perform well, commodities have tended to underperform these asset classes. However, as other asset classes decreased in value, commodities have sometimes provided positive returns for investors. Commodities are often used to help reduce portfolio risk by adding diversification.
Potential portfolio protection: historically, commodities are one of the few asset classes to have benefited from rising inflation. As demand for goods and services increases, prices of those goods and services usually also rise, as do the prices of the commodities used in their production. Because commodity prices tend to rise in periods of inflation, investing in commodities can potentially provide some portfolio protection against accelerating inflation.
In addition, commodities have often proved more resilient than other asset classes to geopolitical and macro-economic shocks. For example, political crises in emerging markets have sometimes tripped up stock markets but left the commodity market relatively unaffected.
Indices are a convenient way to access a group of commodities. Indices can represent the asset class as a whole or a particular sub-sector, such as energy, agriculture or precious metals.
Commodity indices differ in the rules used to gain exposure to the asset class. Does the index track futures prices or spot prices? How often is the index rebalanced? Are there minimum and maximum weightings for different sectors or individual commodities? Investors should be aware of these rules before investing in structured products linked to indices. This section describes the components and methodologies of some of the main commodity indices. Some of the key features are outlined below.
Figure 34: S&P GSCI USD TR Index versus MSCI World USD TR
-50%
0%
50%
100%
150%
200%
250%
300%
Jan-96 Aug-98 Feb-01 Sep-03 Mar-06 Sep-08 Apr-11
-50%
0%
50%
100%
150%
200%
250%
300%
S&P GSCI TR MSCI World
-50%
0%
50%
100%
150%
200%
250%
300%
Jan-96 Aug-98 Feb-01 Sep-03 Mar-06 Sep-08 Apr-11
-50%
0%
50%
100%
150%
200%
250%
300%
-50%
0%
50%
100%
150%
200%
250%
300%
Jan-96 Aug-98 Feb-01 Sep-03 Mar-06 Sep-08 Apr-11
-50%
0%
50%
100%
150%
200%
250%
300%
S&P GSCI TR MSCI WorldS&P GSCI TR MSCI World Note: Index returns are for illustrative purposes only and do not represent actual fund performance. Index performance returns do not reflect any management fees, transaction costs or expenses. Indices are unmanaged and one cannot invest directly in an index. Past performance does not guarantee future results. Data as at end April 2011. Source: Global ETF Research and Implementation Strategy Team, BlackRock, Bloomberg.
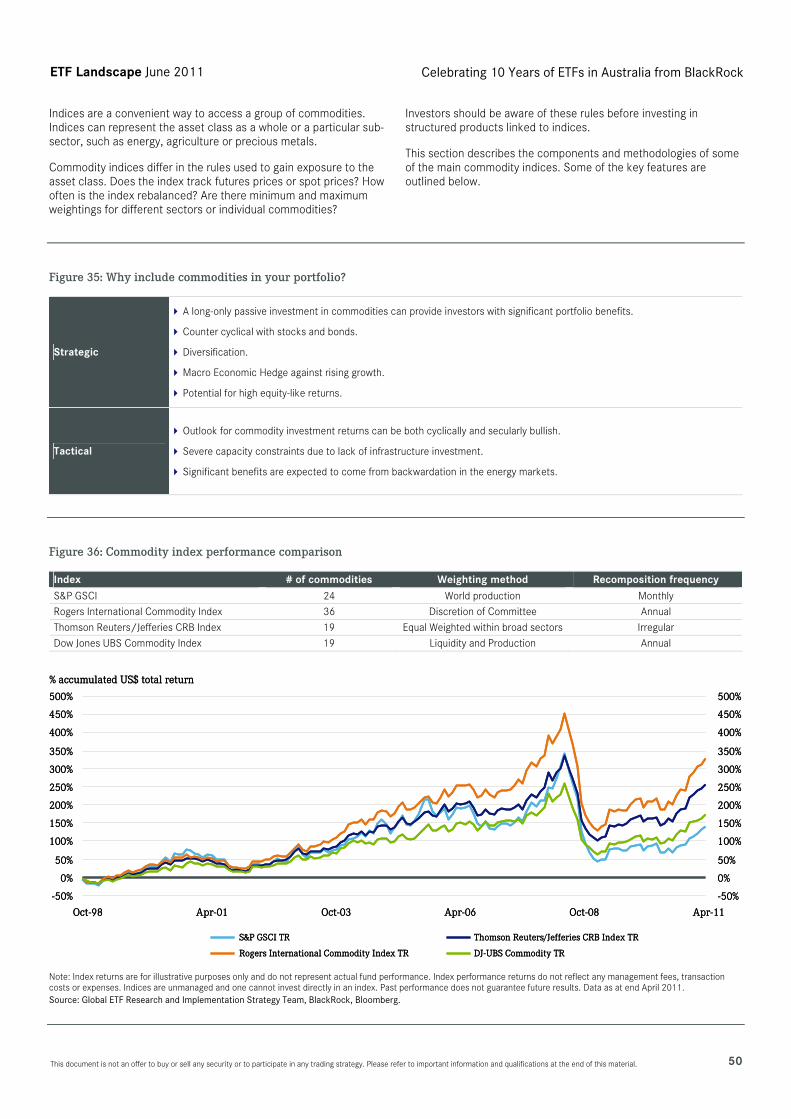
ETF Landscape June 2011 Celebrating 10 Years of ETFs in Australia from BlackRock
This document is not an offer to buy or sell any security or to participate in any trading strategy. Please refer to important information and qualifications at the end of this material. 50
Indices are a convenient way to access a group of commodities. Indices can represent the asset class as a whole or a particular sub-sector, such as energy, agriculture or precious metals.
Commodity indices differ in the rules used to gain exposure to the asset class. Does the index track futures prices or spot prices? How often is the index rebalanced? Are there minimum and maximum weightings for different sectors or individual commodities?
Investors should be aware of these rules before investing in structured products linked to indices.
This section describes the components and methodologies of some of the main commodity indices. Some of the key features are outlined below.
Figure 35: Why include commodities in your portfolio?
Strategic
A long-only passive investment in commodities can provide investors with significant portfolio benefits.
Counter cyclical with stocks and bonds.
Diversification.
Macro Economic Hedge against rising growth.
Potential for high equity-like returns.
Tactical
Outlook for commodity investment returns can be both cyclically and secularly bullish.
Severe capacity constraints due to lack of infrastructure investment.
Significant benefits are expected to come from backwardation in the energy markets.
Figure 36: Commodity index performance comparison
Index # of commodities Weighting method Recomposition frequency S&P GSCI 24 World production Monthly
Rogers International Commodity Index 36 Discretion of Committee Annual
Thomson Reuters/Jefferies CRB Index 19 Equal Weighted within broad sectors Irregular
Dow Jones UBS Commodity Index 19 Liquidity and Production Annual
-50%
0%
50%
100%
150%
200%
250%
300%
350%
400%
450%
500%
Oct-98 Apr-01 Oct-03 Apr-06 Oct-08 Apr-11
% accumulated US$ total return
-50%
0%
50%
100%
150%
200%
250%
300%
350%
400%
450%
500%
S&P GSCI TR Thomson Reuters/Jefferies CRB Index TR
Rogers International Commodity Index TR DJ-UBS Commodity TR
-50%
0%
50%
100%
150%
200%
250%
300%
350%
400%
450%
500%
Oct-98 Apr-01 Oct-03 Apr-06 Oct-08 Apr-11
% accumulated US$ total return
-50%
0%
50%
100%
150%
200%
250%
300%
350%
400%
450%
500%
S&P GSCI TR Thomson Reuters/Jefferies CRB Index TR
Rogers International Commodity Index TR DJ-UBS Commodity TR Note: Index returns are for illustrative purposes only and do not represent actual fund performance. Index performance returns do not reflect any management fees, transaction costs or expenses. Indices are unmanaged and one cannot invest directly in an index. Past performance does not guarantee future results. Data as at end April 2011. Source: Global ETF Research and Implementation Strategy Team, BlackRock, Bloomberg.

ETF Landscape June 2011 Celebrating 10 Years of ETFs in Australia from BlackRock
This document is not an offer to buy or sell any security or to participate in any trading strategy. Please refer to important information and qualifications at the end of this material. 51
Figure 37: Types of commodity exposure
ETFs providing exposure to ‘Commodities’ can be based on different types of underlying investments/vehicles which can lead to significant difference in performance:
Shares Price is based on the exchange traded share price of listed companies.
For example: gold miners, steel product producers, coal miners, and companies engaged in agriculture/farming activities.
Physical commodities
Price is based on the traded price of the physical underlying commodity.
The commodity is typically stored in a vault.
For example: gold, silver, platinum, and palladium.
Futures
Price is based on an index level which is derived from underlying futures contracts.
Typically used for exposures that cannot be physically stored or represent a basket of commodities.
For example: agriculture, energy, industrial metals, and livestock.
Source: Global ETF Research and Implementation Strategy Team, BlackRock.
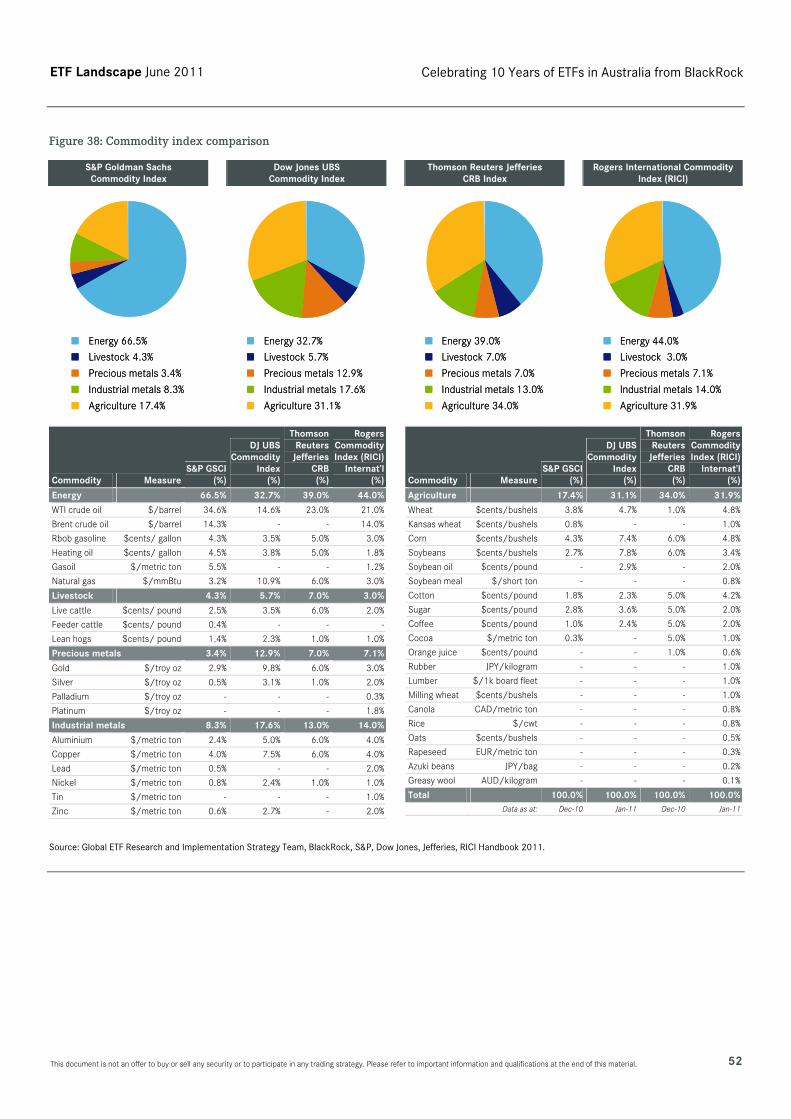
ETF Landscape June 2011 Celebrating 10 Years of ETFs in Australia from BlackRock
This document is not an offer to buy or sell any security or to participate in any trading strategy. Please refer to important information and qualifications at the end of this material. 52
Figure 38: Commodity index comparison
S&P Goldman Sachs Commodity Index
Energy 66.5%
Livestock 4.3%
Precious metals 3.4%
Industrial metals 8.3%
Agriculture 17.4%
Energy 66.5%
Livestock 4.3%
Precious metals 3.4%
Industrial metals 8.3%
Agriculture 17.4%
Dow Jones UBS Commodity Index
Energy 32.7%
Livestock 5.7%
Precious metals 12.9%
Industrial metals 17.6%
Agriculture 31.1%
Energy 32.7%
Livestock 5.7%
Precious metals 12.9%
Industrial metals 17.6%
Agriculture 31.1%
Thomson Reuters Jefferies CRB Index
Energy 39.0%
Livestock 7.0%
Precious metals 7.0%
Industrial metals 13.0%
Agriculture 34.0%
Energy 39.0%
Livestock 7.0%
Precious metals 7.0%
Industrial metals 13.0%
Agriculture 34.0%
Rogers International Commodity Index (RICI)
Energy 44.0%
Livestock 3.0%
Precious metals 7.1%
Industrial metals 14.0%
Agriculture 31.9%
Energy 44.0%
Livestock 3.0%
Precious metals 7.1%
Industrial metals 14.0%
Agriculture 31.9%
Commodity Measure S&P GSCI
(%)
DJ UBS Commodity
Index (%)
ThomsonReutersJefferies
CRB(%)
RogersCommodityIndex (RICI)
Internat’l(%)
Energy 66.5% 32.7% 39.0% 44.0%WTI crude oil $/barrel 34.6% 14.6% 23.0% 21.0%
Brent crude oil $/barrel 14.3% - - 14.0%
Rbob gasoline $cents/ gallon 4.3% 3.5% 5.0% 3.0%
Heating oil $cents/ gallon 4.5% 3.8% 5.0% 1.8%
Gasoil $/metric ton 5.5% - - 1.2%
Natural gas $/mmBtu 3.2% 10.9% 6.0% 3.0%
Livestock 4.3% 5.7% 7.0% 3.0%
Live cattle $cents/ pound 2.5% 3.5% 6.0% 2.0%
Feeder cattle $cents/ pound 0.4% - - -
Lean hogs $cents/ pound 1.4% 2.3% 1.0% 1.0%
Precious metals 3.4% 12.9% 7.0% 7.1%
Gold $/troy oz 2.9% 9.8% 6.0% 3.0%
Silver $/troy oz 0.5% 3.1% 1.0% 2.0%
Palladium $/troy oz - - - 0.3%
Platinum $/troy oz - - - 1.8%
Industrial metals 8.3% 17.6% 13.0% 14.0%
Aluminium $/metric ton 2.4% 5.0% 6.0% 4.0%
Copper $/metric ton 4.0% 7.5% 6.0% 4.0%
Lead $/metric ton 0.5% - - 2.0%
Nickel $/metric ton 0.8% 2.4% 1.0% 1.0%
Tin $/metric ton - - - 1.0%
Zinc $/metric ton 0.6% 2.7% - 2.0%
Commodity MeasureS&P GSCI
(%)
DJ UBS Commodity
Index (%)
ThomsonReutersJefferies
CRB(%)
RogersCommodityIndex (RICI)
Internat’l(%)
Agriculture 17.4% 31.1% 34.0% 31.9%Wheat $cents/bushels 3.8% 4.7% 1.0% 4.8%
Kansas wheat $cents/bushels 0.8% - - 1.0%
Corn $cents/bushels 4.3% 7.4% 6.0% 4.8%
Soybeans $cents/bushels 2.7% 7.8% 6.0% 3.4%
Soybean oil $cents/pound - 2.9% - 2.0%
Soybean meal $/short ton - - - 0.8%
Cotton $cents/pound 1.8% 2.3% 5.0% 4.2%
Sugar $cents/pound 2.8% 3.6% 5.0% 2.0%
Coffee $cents/pound 1.0% 2.4% 5.0% 2.0%
Cocoa $/metric ton 0.3% - 5.0% 1.0%
Orange juice $cents/pound - - 1.0% 0.6%
Rubber JPY/kilogram - - - 1.0%
Lumber $/1k board fleet - - - 1.0%
Milling wheat $cents/bushels - - - 1.0%
Canola CAD/metric ton - - - 0.8%
Rice $/cwt - - - 0.8%
Oats $cents/bushels - - - 0.5%
Rapeseed EUR/metric ton - - - 0.3%
Azuki beans JPY/bag - - - 0.2%
Greasy wool AUD/kilogram - - - 0.1%
Total 100.0% 100.0% 100.0% 100.0%Data as at: Dec-10 Jan-11 Dec-10 Jan-11
Source: Global ETF Research and Implementation Strategy Team, BlackRock, S&P, Dow Jones, Jefferies, RICI Handbook 2011.
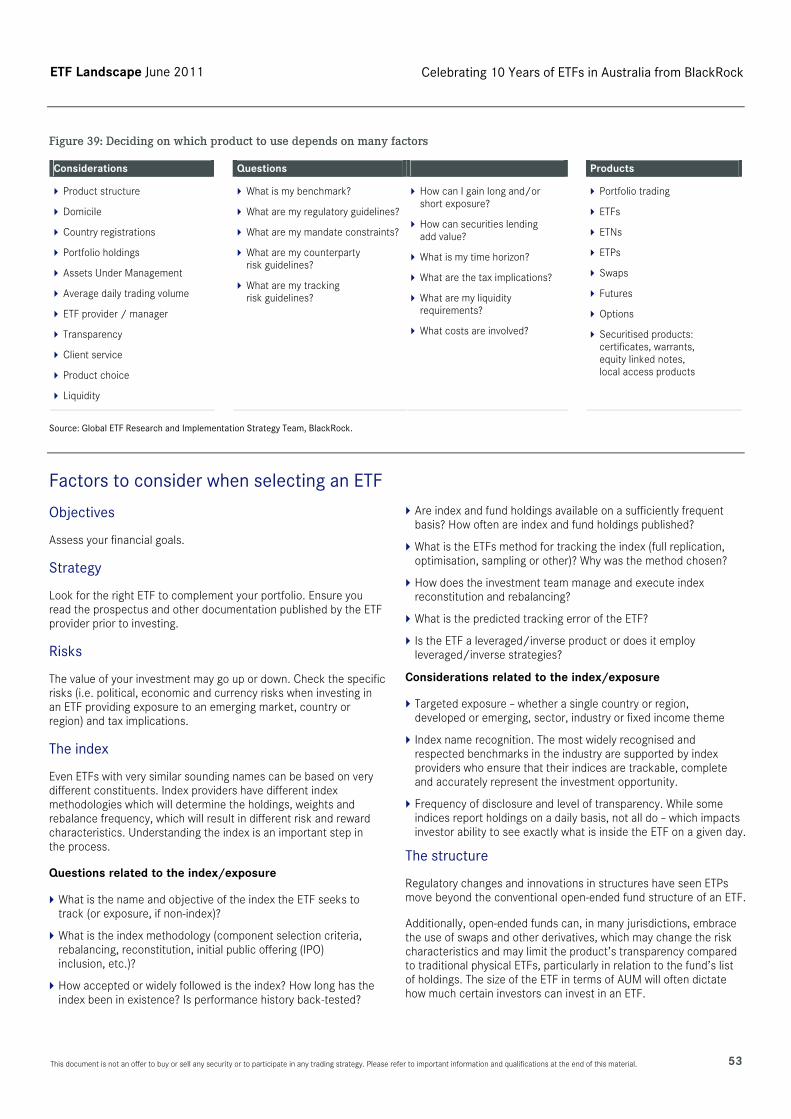
ETF Landscape June 2011 Celebrating 10 Years of ETFs in Australia from BlackRock
This document is not an offer to buy or sell any security or to participate in any trading strategy. Please refer to important information and qualifications at the end of this material. 53
Figure 39: Deciding on which product to use depends on many factors
Considerations Questions Products
Product structure
Domicile
Country registrations
Portfolio holdings
Assets Under Management
Average daily trading volume
ETF provider / manager
Transparency
Client service
Product choice
Liquidity
What is my benchmark?
What are my regulatory guidelines?
What are my mandate constraints?
What are my counterparty risk guidelines?
What are my tracking risk guidelines?
How can I gain long and/or short exposure?
How can securities lending add value?
What is my time horizon?
What are the tax implications?
What are my liquidity requirements?
What costs are involved?
Portfolio trading
ETFs
ETNs
ETPs
Swaps
Futures
Options
Securitised products: certificates, warrants, equity linked notes, local access products
Source: Global ETF Research and Implementation Strategy Team, BlackRock.
Factors to consider when selecting an ETF
Objectives
Assess your financial goals.
Strategy
Look for the right ETF to complement your portfolio. Ensure you read the prospectus and other documentation published by the ETF provider prior to investing.
Risks
The value of your investment may go up or down. Check the specific risks (i.e. political, economic and currency risks when investing in an ETF providing exposure to an emerging market, country or region) and tax implications.
The index
Even ETFs with very similar sounding names can be based on very different constituents. Index providers have different index methodologies which will determine the holdings, weights and rebalance frequency, which will result in different risk and reward characteristics. Understanding the index is an important step in the process.
Questions related to the index/exposure
What is the name and objective of the index the ETF seeks to track (or exposure, if non-index)?
What is the index methodology (component selection criteria, rebalancing, reconstitution, initial public offering (IPO) inclusion, etc.)?
How accepted or widely followed is the index? How long has the index been in existence? Is performance history back-tested?
Are index and fund holdings available on a sufficiently frequent basis? How often are index and fund holdings published?
What is the ETFs method for tracking the index (full replication, optimisation, sampling or other)? Why was the method chosen?
How does the investment team manage and execute index reconstitution and rebalancing?
What is the predicted tracking error of the ETF?
Is the ETF a leveraged/inverse product or does it employ leveraged/inverse strategies?
Considerations related to the index/exposure
Targeted exposure – whether a single country or region, developed or emerging, sector, industry or fixed income theme
Index name recognition. The most widely recognised and respected benchmarks in the industry are supported by index providers who ensure that their indices are trackable, complete and accurately represent the investment opportunity.
Frequency of disclosure and level of transparency. While some indices report holdings on a daily basis, not all do – which impacts investor ability to see exactly what is inside the ETF on a given day.
The structure
Regulatory changes and innovations in structures have seen ETPs move beyond the conventional open-ended fund structure of an ETF.
Additionally, open-ended funds can, in many jurisdictions, embrace the use of swaps and other derivatives, which may change the risk characteristics and may limit the product’s transparency compared to traditional physical ETFs, particularly in relation to the fund’s list of holdings. The size of the ETF in terms of AUM will often dictate how much certain investors can invest in an ETF.

ETF Landscape June 2011 Celebrating 10 Years of ETFs in Australia from BlackRock
This document is not an offer to buy or sell any security or to participate in any trading strategy. Please refer to important information and qualifications at the end of this material. 54
Questions related to structure
What is the regulatory designation of the ETF?
Is the ETF an independent fund, trust, unit investment trust (UIT) or a share class of a traditional mutual fund?
What is the AUM of the ETF?
How does the regulatory designation affect the ETFs structure and methodology?
What type of securities does the ETF hold?
What are the diversification guidelines?
What is the creation/redemption process?
What are the tax implications of the structure?
Is securities lending utilized? If so, what are the collateralization process, performance impact and risk management techniques?
Considerations related to structure
A structure that provides transparent benefits to the shareholder, minimising unintended risks or costs.
Product design that balances desired exposure and helps to ensure cost and tax efficiency and liquidity.
An independent, dedicated ETF structure that helps insulate ETF shareholders from unintended tax consequences and inherent conflicts of interest.
Total costs
The fund’s TER, not just the Management Expense Ratio (MER), is a major consideration when comparing costs between ETFs. Trading costs, tracking risk, registrations, trading currency, dividend withholding rates and securities lending within the fund and lending of the ETF should all be considered.
Questions related to costs
What is the total annual expense ratio?
What are the trading costs?
What is the average spread?
How do the spread and volume factor into overall cost on a trade and per-annum basis?
How are internal transaction costs (including rebalancing costs) minimised?
How tax efficient is the ETF?
What are the historical capital gains distribution (if any)?
Considerations related to costs
TERs are important however all implicit costs – trading, market impact, rebalancing – should be factored in to determine the true total cost.
Tight bid/offer spreads, which lower the cost for investors to enter and exit positions.
Institutional grade ETFs focused on maximising liquidity, tax efficiency and transparency while minimising transaction costs for investors.
Liquidity
ETFs afford investors two forms of liquidity. The first is through trading the shares on a secondary basis on-exchange. The second is on a primary basis via the unique ‘creation’ process, whereby an AP purchases the underlying basket of securities in the local market and deposits the basket ‘in kind’ into the ETF, creating more shares in that ETF.
The unique creation/redemption process means that the liquidity in the ETF is driven by the liquidity in the underlying securities. Similar indices can have different liquidity profiles based on their index methodology.
Questions related to liquidity
What is the average daily volume of both the ETF and underlying basket of securities?
How is liquidity maintained in the ETF?
How is liquidity enhanced in the ETF?
How has liquidity been affected in past stressed market conditions?
Are options available on the ETF?
What is the options’ liquidity?
Does the ETF provider offer resources to help advisors achieve the best possible execution for clients?
Considerations related to liquidity
Critical to examine the real liquidity of the ETF through both its market volume and the liquidity of the underlying securities.
Liquidity and access in volatile market conditions. Liquidity is like oxygen: you don’t notice it until it’s gone.
ETF provider support for liquidity – strong relationships with index providers and market participants to help provide deeper, more liquid products and the insights to access and exit them.
ETF provider
The type and amount of information provided on their ETFs, index construction and methodology, tax and index management knowledge, as well as the level and type of support provided to investors, intermediaries and brokers varies based on the size, scale and expertise of the provider.
Divergence in the performance of an ETF, relative to the index it tracks, is possible. Differences tend to be caused by fund fees and expenses, tracking error when optimisation strategies are used to track the index, rebalancing due to corporate actions and index changes, or the dividend reinvestment policy of the fund.
Questions related to ETF provider
What is the level of the firm’s investment professional expertise and experience?
How experienced is the firm in developing, managing and supporting ETFs?
What are the firm’s total AUM and total ETF AUM? What is the competitive market share of each?
What are the firm’s risk management processes?
What is the firm’s service model?
ETF Landscape June 2011 Celebrating 10 Years of ETFs in Australia from BlackRock
This document is not an offer to buy or sell any security or to participate in any trading strategy. Please refer to important information and qualifications at the end of this material. 55
Considerations related to provider
Experience in the ETF market.
Size, scale, expertise, track record and level of commitment to the ETF industry.
Experience and relationships with market participants and index providers.
A business model that supports and advocates the role of the advisor as the key to investor success (education, consulting and solutions to investment professionals and market participants).
Source: BlackRock
Investment concerns
ETFs possess risks related to the securities in their underlying indices. ETFs are subject to risks applicable to any investment in portfolios of common stocks or bonds, including that of generally lower prices and the chance that they may underperform more concentrated or actively managed portfolios. By targeting performance in line with indices, investors are also foregoing opportunities to outperform.
ETFs are subject to ‘tracking error’ risks. Factors such as expenses, imperfect correlation between an ETF’s stocks and those in its underlying index and regulatory policies may cause an ETF’s return to deviate from its underlying index. Six major sources of tracking error are summarised below:
Fees and expenses: expenses of all fund products reduce total return. Although ETFs have the low expense ratios, fees will cause an ETF to underperform its index over time.
Premiums/discounts: on any date, the closing price of an ETF may be at a premium or discount to its Net Asset Value (NAV) due to supply and demand factors. This will affect reported performance of the ETF versus its index.
Dividend reinvestment: some ETFs hold dividends in cash and only pay them out to investors on a periodic basis. In contrast, some ETFs can reinvest dividends daily. A lag in dividend reinvestment can cause small underperformance in rising markets.
Optimised replication: many ETFs use computer optimisation techniques to design portfolios to closely track the index while minimising transaction costs. Under this technique, the ETF omits or underweights some stocks (usually the less liquid or smaller-cap stocks). This technique, if properly used, should have only a minor effect on tracking.
Rebalancing: ETFs are required to make changes in the composition of their portfolios when stocks are added to or dropped from the index. The timing, market impact, and transaction costs of the changes can affect performance.
Nonconcurrent trading hours: some ETFs trade in the United States when their underlying markets are closed. For example, the Japanese market is closed while an ETF tracking the Japanese market is trading on NYSE Arca. Given increased correlation between markets, ETFs based on the Japanese market may appear to be at a premium prior to the start of the trading day in Japan when the United States’ market is up in anticipation that the Japanese market will rally. Similarly, on a down day in the United States, the ETFs on the Japanese market may appear to trade at a discount.
Many European investors prefer ETFs that are UCITS funds from a regulatory and dividend withholding point of view. Some European investors are only allowed to invest in UCITS funds. For European and Asian investors, dividend withholding may be higher when investing in United States listed ETFs as they may suffer dividend withholding within the ETFs as well as on dividends paid out of the ETF.
Basic ETF structures
ETFs have distinctive features. Each ETF is designed to track a specific index. They provide access to investment styles, asset classes, markets, and different sectors. They are structured as open-end funds which are domiciled and registered in many countries around the world. The assets of ETFs are held by custodians in a ring fenced structure.
Most ETFs purchase the underlying securities in the index with the majority fully replicating their underlying index, many have the capacity to employ optimisation and sampling techniques. These ETFs may exclude certain securities and deviate from their benchmark constituent weights, which could lead to tracking error.
The open-end structure typically allows funds to lend stock, which may generate extra income. In addition, these funds can hold other securities and financial instruments, including cash and equivalents and futures. Dividends are typically paid out quarterly, semi-annually or annually, although some ETFs do reinvest dividends in the fund.
In Europe, a new approach is being used to create funds and ETFs which utilise a total return swap plus a basket of securities to comply with the diversification rules under Undertakings for Collective Investments in Transferable Securities (UCITS III) to deliver index performance rather than purchasing the underlying securities in the index.
Investors who are expressing concerns over counterparty risk, transparency and liquidity when using structured products, swaps, certificates, and notes are showing a preference for ETFs where the structure is a fund, and often, more specifically for ETFs which purchase the underlying securities in the index.
ETFs tend to trade at or close to the NAV of the underlying basket of shares. Arbitrageurs would take advantage of significant premium or discount relative to the underlying index. An arbitrageur would typically buy or sell the ETF and place an offsetting buy or sell transaction in the underlying basket of component stocks or futures.
ETF providers have continued to expand their product ranges in more specialised areas to cater for the growing number of professional and retail investors using ETFs as advanced portfolio construction tools.
The increasing availability of these highly-specialised ETFs across the full spectrum of equities, fixed-income and alternative investments now ensures that investors can use ETFs to instantly reallocate capital to take advantage of new investment opportunities as market conditions stabilise.

ETF Landscape June 2011 Celebrating 10 Years of ETFs in Australia from BlackRock
This document is not an offer to buy or sell any security or to participate in any trading strategy. Please refer to important information and qualifications at the end of this material. 56
Figure 40: Key tax considerations
Example: iShares MSCI Emerging Markets: European versus United States listed funds
European listed ETF
(Irish domiciled)
Non-United Statesbased investor
Local shares
(2.15% gross dividends)
Net dividends (9.89% withholding
[blended rate])
Gross dividends (no withholding out
of the ETF)
1.94% 1.94%European listed ETF
(Irish domiciled)
Non-United Statesbased investor
Local shares
(2.15% gross dividends)
Net dividends (9.89% withholding
[blended rate])
Gross dividends (no withholding out
of the ETF)
1.94% 1.94%
United states listed ETF
(United states domiciled)
Non-United Statesbased investor
Local shares
(2.15% gross dividends)
Net dividends (9.99% withholding
[blended rate])
Net dividends (up to 30%2 withholding)
1.94% 1.36%1United states listed ETF
(United states domiciled)
Non-United Statesbased investor
Local shares
(2.15% gross dividends)
Net dividends (9.99% withholding
[blended rate])
Net dividends (up to 30%2 withholding)
1.94% 1.36%1
United states listed ETF
(United states domiciled)
United Statesbased investor
Local shares
(2.15%gross dividends)
Net dividends (9.99% withholding
[blended rate])
Gross dividends (no withholding out
of the ETF)
1.94% 1.94%United states listed ETF
(United states domiciled)
United Statesbased investor
Local shares
(2.15%gross dividends)
Net dividends (9.99% withholding
[blended rate])
Gross dividends (no withholding out
of the ETF)
1.94% 1.94%
1. Assumes impact of maximum rate. 2. Maximum rate, lower rate may apply based on local tax treaties with United States. Note: The information given does not constitute tax or legal advice and prospective investors should consult their own professional advisers as to the implications of their subscribing for, purchasing, holding, switching or disposing of shares under the laws of the jurisdiction in which they may be subject to tax. Tax legislation may change. Source: BlackRock, February 2011.
Figure 41: Alternative and passive products are expected to keep growing faster than traditional active products
CAGR, 2009-2013 (%)
Traditional active Passive Alternative Estimated size, 2009 ($trillions). Scale = $1 trillion
Fixedincome Active
equity
Net revenue margin (basis points)1
ETFs
Passive fixed income
Passive equity
Real estate(including REITs)
CommoditiesQuantitative
Absolute return
Infrastructure
LDI
Hedge fundsPrivate equity
Structured
Traditionalactive products
Alternative products
Passiveproducts/ETFs
Moneymarket
30
25
20
15
10
5
0 50 100 200
CAGR, 2009-2013 (%)
Traditional activeTraditional active PassivePassive AlternativeAlternative Estimated size, 2009 ($trillions). Scale = $1 trillionEstimated size, 2009 ($trillions). Scale = $1 trillion
Fixedincome Active
equity
Net revenue margin (basis points)1
ETFs
Passive fixed income
Passive equity
Real estate(including REITs)
CommoditiesQuantitative
Absolute return
Infrastructure
LDI
Hedge fundsPrivate equity
Structured
Traditionalactive products
Alternative products
Passiveproducts/ETFs
Moneymarket
30
25
20
15
10
5
0 50 100 200
1. Management fees net of distribution costs. Note: This analysis assumes a conservative scenario of 5% annual growth of equity markets. Source: BCG Global Asset Management 2010, ‘In Search of Stable Growth’ report, July 2010, Projections 2009–2013.
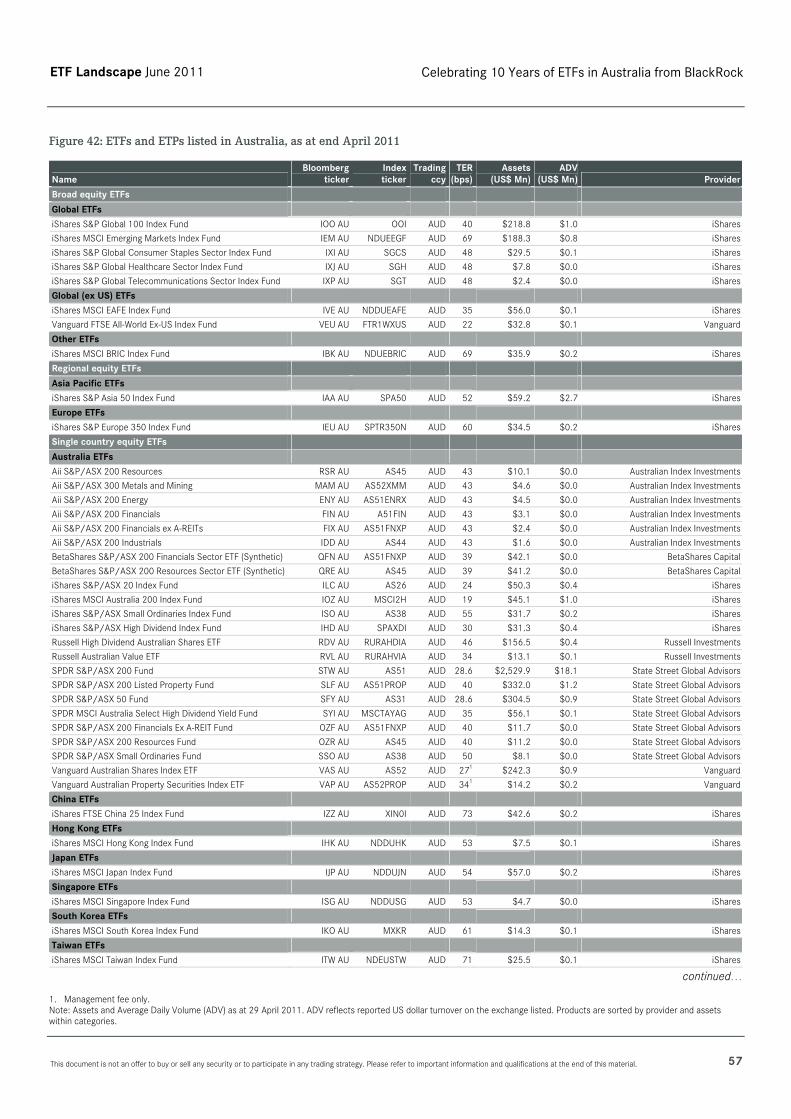
ETF Landscape June 2011 Celebrating 10 Years of ETFs in Australia from BlackRock
This document is not an offer to buy or sell any security or to participate in any trading strategy. Please refer to important information and qualifications at the end of this material. 57
Figure 42: ETFs and ETPs listed in Australia, as at end April 2011
Name Bloomberg
tickerIndexticker
Trading ccy
TER(bps)
Assets(US$ Mn)
ADV (US$ Mn) Provider
Broad equity ETFs
Global ETFs
iShares S&P Global 100 Index Fund IOO AU OOI AUD 40 $218.8 $1.0 iShares
iShares MSCI Emerging Markets Index Fund IEM AU NDUEEGF AUD 69 $188.3 $0.8 iShares
iShares S&P Global Consumer Staples Sector Index Fund IXI AU SGCS AUD 48 $29.5 $0.1 iShares
iShares S&P Global Healthcare Sector Index Fund IXJ AU SGH AUD 48 $7.8 $0.0 iShares
iShares S&P Global Telecommunications Sector Index Fund IXP AU SGT AUD 48 $2.4 $0.0 iShares
Global (ex US) ETFs
iShares MSCI EAFE Index Fund IVE AU NDDUEAFE AUD 35 $56.0 $0.1 iShares
Vanguard FTSE All-World Ex-US Index Fund VEU AU FTR1WXUS AUD 22 $32.8 $0.1 Vanguard
Other ETFs
iShares MSCI BRIC Index Fund IBK AU NDUEBRIC AUD 69 $35.9 $0.2 iShares
Regional equity ETFs
Asia Pacific ETFs
iShares S&P Asia 50 Index Fund IAA AU SPA50 AUD 52 $59.2 $2.7 iShares
Europe ETFs
iShares S&P Europe 350 Index Fund IEU AU SPTR350N AUD 60 $34.5 $0.2 iShares
Single country equity ETFs
Australia ETFs
Aii S&P/ASX 200 Resources RSR AU AS45 AUD 43 $10.1 $0.0 Australian Index Investments
Aii S&P/ASX 300 Metals and Mining MAM AU AS52XMM AUD 43 $4.6 $0.0 Australian Index Investments
Aii S&P/ASX 200 Energy ENY AU AS51ENRX AUD 43 $4.5 $0.0 Australian Index Investments
Aii S&P/ASX 200 Financials FIN AU A51FIN AUD 43 $3.1 $0.0 Australian Index Investments
Aii S&P/ASX 200 Financials ex A-REITs FIX AU AS51FNXP AUD 43 $2.4 $0.0 Australian Index Investments
Aii S&P/ASX 200 Industrials IDD AU AS44 AUD 43 $1.6 $0.0 Australian Index Investments
BetaShares S&P/ASX 200 Financials Sector ETF (Synthetic) QFN AU AS51FNXP AUD 39 $42.1 $0.0 BetaShares Capital
BetaShares S&P/ASX 200 Resources Sector ETF (Synthetic) QRE AU AS45 AUD 39 $41.2 $0.0 BetaShares Capital
iShares S&P/ASX 20 Index Fund ILC AU AS26 AUD 24 $50.3 $0.4 iShares
iShares MSCI Australia 200 Index Fund IOZ AU MSCI2H AUD 19 $45.1 $1.0 iShares
iShares S&P/ASX Small Ordinaries Index Fund ISO AU AS38 AUD 55 $31.7 $0.2 iShares
iShares S&P/ASX High Dividend Index Fund IHD AU SPAXDI AUD 30 $31.3 $0.4 iShares
Russell High Dividend Australian Shares ETF RDV AU RURAHDIA AUD 46 $156.5 $0.4 Russell Investments
Russell Australian Value ETF RVL AU RURAHVIA AUD 34 $13.1 $0.1 Russell Investments
SPDR S&P/ASX 200 Fund STW AU AS51 AUD 28.6 $2,529.9 $18.1 State Street Global Advisors
SPDR S&P/ASX 200 Listed Property Fund SLF AU AS51PROP AUD 40 $332.0 $1.2 State Street Global Advisors
SPDR S&P/ASX 50 Fund SFY AU AS31 AUD 28.6 $304.5 $0.9 State Street Global Advisors
SPDR MSCI Australia Select High Dividend Yield Fund SYI AU MSCTAYAG AUD 35 $56.1 $0.1 State Street Global Advisors
SPDR S&P/ASX 200 Financials Ex A-REIT Fund OZF AU AS51FNXP AUD 40 $11.7 $0.0 State Street Global Advisors
SPDR S&P/ASX 200 Resources Fund OZR AU AS45 AUD 40 $11.2 $0.0 State Street Global Advisors
SPDR S&P/ASX Small Ordinaries Fund SSO AU AS38 AUD 50 $8.1 $0.0 State Street Global Advisors
Vanguard Australian Shares Index ETF VAS AU AS52 AUD 271 $242.3 $0.9 Vanguard
Vanguard Australian Property Securities Index ETF VAP AU AS52PROP AUD 341 $14.2 $0.2 Vanguard
China ETFs
iShares FTSE China 25 Index Fund IZZ AU XIN0I AUD 73 $42.6 $0.2 iShares
Hong Kong ETFs
iShares MSCI Hong Kong Index Fund IHK AU NDDUHK AUD 53 $7.5 $0.1 iShares
Japan ETFs
iShares MSCI Japan Index Fund IJP AU NDDUJN AUD 54 $57.0 $0.2 iShares
Singapore ETFs
iShares MSCI Singapore Index Fund ISG AU NDDUSG AUD 53 $4.7 $0.0 iShares
South Korea ETFs
iShares MSCI South Korea Index Fund IKO AU MXKR AUD 61 $14.3 $0.1 iShares
Taiwan ETFs
iShares MSCI Taiwan Index Fund ITW AU NDEUSTW AUD 71 $25.5 $0.1 iShares
continued… 1. Management fee only. Note: Assets and Average Daily Volume (ADV) as at 29 April 2011. ADV reflects reported US dollar turnover on the exchange listed. Products are sorted by provider and assets within categories.

ETF Landscape June 2011 Celebrating 10 Years of ETFs in Australia from BlackRock
This document is not an offer to buy or sell any security or to participate in any trading strategy. Please refer to important information and qualifications at the end of this material. 58
Figure 42: ETFs and ETPs listed in Australia, as at end April 2011 (continued)
Name Bloomberg
tickerIndexticker
Trading ccy
TER(bps)
Assets(US$ Mn)
ADV (US$ Mn) Provider
Single country equity ETFs (continued)
United States ETFs
iShares S&P 500 Index Fund IVV AU SPTR AUD 9 $313.3 $2.5 iShares
iShares S&P SmallCap 600 Index Fund IJR AU SML AUD 20 $12.6 $0.1 iShares
iShares S&P MidCap 400 Index Fund IJH AU MID AUD 22 $8.0 $0.1 iShares
iShares Russell 2000 Index Fund IRU AU RTY AUD 28 $5.4 $0.0 iShares
Vanguard Total Stock Market ETF VTS AU MSCIBM AUD 7 $48.1 $0.4 Vanguard
Commodity ETPs
Precious metals ETPs
ETFS Physical Gold GOLD AU GOLDLNPM AUD 39 $650.4 $2.0 ETF Securities
ETFS Physical Silver ETPMAG AU SLVRLN AUD 49 $68.0 $1.2 ETF Securities
ETFS Physical PM Basket ETPMPM AU AUD 43 $8.0 $0.0 ETF Securities
ETFS Physical Platinum ETPMPT AU PLTMLNPM AUD 49 $4.5 $0.0 ETF Securities
ETFS Physical Palladium ETPMPD AU PLDMLNPM AUD 49 $1.8 $0.0 ETF Securities
Currency ETFs
United States ETFs
BetaShares US Dollar ETF USD AU AUD 45 $67.3 $1.0 BetaShares Capital Note: Assets and Average Daily Volume (ADV) as at 29 April 2011. ADV reflects reported US dollar turnover on the exchange listed. Products are sorted by provider and assets within categories. Source: Various ETF providers, exchanges, Global ETF Research and Implementation Strategy Team, BlackRock, Bloomberg, CHESS.
Figure 43: ETFs and ETPs listed outside of Australia providing exposure to Australia, as at end April 2011
Name Bloomberg
tickerIndexticker
Trading ccy
TER(bps)
Assets(US$ Mn)
ADV (US$ Mn) Provider
Equity ETFs
CS ETF (IE) on MSCI Australia CSAU SW NDDUAS USD 50 $78.1 $0.1 Credit Suisse Asset Management
Borsa Italiana CSAU IM NDDUAS EUR 50 $0.3 Credit Suisse Asset Management
Deutsche Boerse CEBM GY NDDUAS EUR 50 $0.1 Credit Suisse Asset Management
London Stock Exchange CSAU LN NDDUAS USD 50 $0.0 Credit Suisse Asset Management
London Stock Exchange CAU1 LN NDDUAS GB-p 50 $0.0 Credit Suisse Asset Management
NYSE Euronext Paris CSAU FP NDDUAS EUR 50 $0.1 Credit Suisse Asset Management
db x-trackers S&P/ASX 200 XAUS GY AS51 EUR 50 $226.4 $1.0 db x-trackers
London Stock Exchange XAUS LN AS51 GB-p 50 $0.1 db x-trackers
Borsa Italiana XAUS IM AS51 EUR 50 $0.7 db x-trackers
NYSE Euronext Paris XAX FP AS51 EUR 50 $0.3 db x-trackers
Boerse Stuttgart XAUS GS AS51 EUR 50 $0.0 db x-trackers
Singapore Stock Exchange LF1 SP AS51 USD 50 $0.1 db x-trackers
IQ Australia Small Cap ETF KROO US IQSMAUST USD 69 $43.7 $0.4 IndexIQ Advisors
iShares MSCI Australia Index Fund EWA US NDDUAS USD 53 $3,573.3 $93.4 iShares
Bolsa Comercio Santiago EWA CI NDDUAS USD 53 $0.0 iShares
Mexican Stock Exchange EWA* MM NDDUAS MXN 53 $0.0 iShares
iShares MSCI Australia SAUS LN NDDUAS GB-p 59 $46.7 $0.3 iShares
London Stock Exchange IAUS LN NDDUAS USD 59 $0.6 iShares
Deutsche Boerse IBC6 GY NDDUAS EUR 59 $0.0 iShares
Lyxor ETF S&P ASX 200 Australia LAUU LN AS51 USD 45 $47.4 $0.0 Lyxor Asset Management
London Stock Exchange LAUS LN AS51 GB-p 45 $0.0 Lyxor Asset Management
SIX Swiss Exchange LYAU2 SW AS51 USD 45 $0.1 Lyxor Asset Management
Lyxor ETF S&P ASX 200 - A LYPU GY AS51 EUR 45 $0.2 Lyxor Asset Management
Borsa Italiana AUST IM AS51 EUR 45 $0.2 Lyxor Asset Management
NYSE Euronext Paris AU2 FP AS51 EUR 45 $0.1 Lyxor Asset Management
Nikko Listed Index Fund Australian REIT S&P/ASX200 A-REIT 1555 JP AS51PROP JPY 35 $6.6 $0.1 Nikko Asset Management
continued… Note: Assets and Average Daily Volume (ADV) as at 29 April 2011. ADV reflects reported US dollar turnover on the exchange listed. Products are sorted by provider within categories.
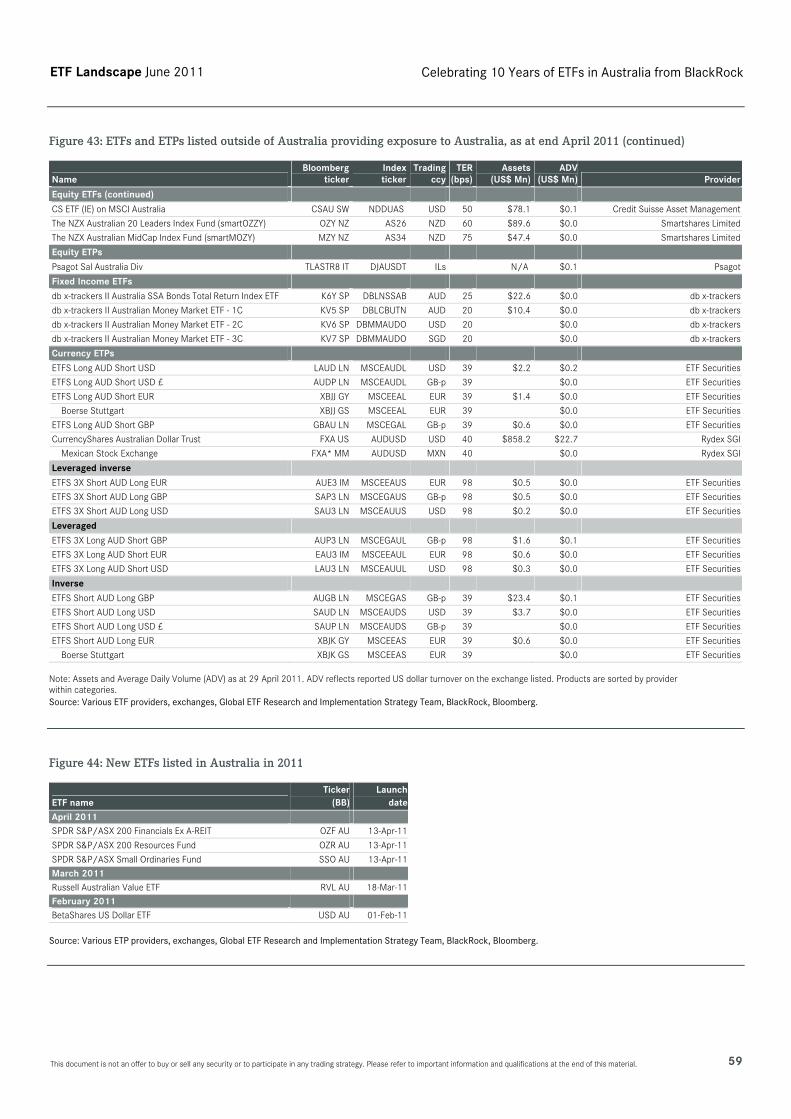
ETF Landscape June 2011 Celebrating 10 Years of ETFs in Australia from BlackRock
This document is not an offer to buy or sell any security or to participate in any trading strategy. Please refer to important information and qualifications at the end of this material. 59
Figure 43: ETFs and ETPs listed outside of Australia providing exposure to Australia, as at end April 2011 (continued)
Name Bloomberg
tickerIndexticker
Trading ccy
TER(bps)
Assets(US$ Mn)
ADV (US$ Mn) Provider
Equity ETFs (continued)
CS ETF (IE) on MSCI Australia CSAU SW NDDUAS USD 50 $78.1 $0.1 Credit Suisse Asset Management
The NZX Australian 20 Leaders Index Fund (smartOZZY) OZY NZ AS26 NZD 60 $89.6 $0.0 Smartshares Limited
The NZX Australian MidCap Index Fund (smartMOZY) MZY NZ AS34 NZD 75 $47.4 $0.0 Smartshares Limited
Equity ETPs
Psagot Sal Australia Div TLASTR8 IT DJAUSDT ILs N/A $0.1 Psagot
Fixed Income ETFs db x-trackers II Australia SSA Bonds Total Return Index ETF K6Y SP DBLNSSAB AUD 25 $22.6 $0.0 db x-trackers
db x-trackers II Australian Money Market ETF - 1C KV5 SP DBLCBUTN AUD 20 $10.4 $0.0 db x-trackers
db x-trackers II Australian Money Market ETF - 2C KV6 SP DBMMAUDO USD 20 $0.0 db x-trackers
db x-trackers II Australian Money Market ETF - 3C KV7 SP DBMMAUDO SGD 20 $0.0 db x-trackers
Currency ETPs
ETFS Long AUD Short USD LAUD LN MSCEAUDL USD 39 $2.2 $0.2 ETF Securities
ETFS Long AUD Short USD £ AUDP LN MSCEAUDL GB-p 39 $0.0 ETF Securities
ETFS Long AUD Short EUR XBJJ GY MSCEEAL EUR 39 $1.4 $0.0 ETF Securities
Boerse Stuttgart XBJJ GS MSCEEAL EUR 39 $0.0 ETF Securities
ETFS Long AUD Short GBP GBAU LN MSCEGAL GB-p 39 $0.6 $0.0 ETF Securities
CurrencyShares Australian Dollar Trust FXA US AUDUSD USD 40 $858.2 $22.7 Rydex SGI
Mexican Stock Exchange FXA* MM AUDUSD MXN 40 $0.0 Rydex SGI
Leveraged inverse
ETFS 3X Short AUD Long EUR AUE3 IM MSCEEAUS EUR 98 $0.5 $0.0 ETF Securities
ETFS 3X Short AUD Long GBP SAP3 LN MSCEGAUS GB-p 98 $0.5 $0.0 ETF Securities
ETFS 3X Short AUD Long USD SAU3 LN MSCEAUUS USD 98 $0.2 $0.0 ETF Securities
Leveraged
ETFS 3X Long AUD Short GBP AUP3 LN MSCEGAUL GB-p 98 $1.6 $0.1 ETF Securities
ETFS 3X Long AUD Short EUR EAU3 IM MSCEEAUL EUR 98 $0.6 $0.0 ETF Securities
ETFS 3X Long AUD Short USD LAU3 LN MSCEAUUL USD 98 $0.3 $0.0 ETF Securities
Inverse
ETFS Short AUD Long GBP AUGB LN MSCEGAS GB-p 39 $23.4 $0.1 ETF Securities
ETFS Short AUD Long USD SAUD LN MSCEAUDS USD 39 $3.7 $0.0 ETF Securities
ETFS Short AUD Long USD £ SAUP LN MSCEAUDS GB-p 39 $0.0 ETF Securities
ETFS Short AUD Long EUR XBJK GY MSCEEAS EUR 39 $0.6 $0.0 ETF Securities
Boerse Stuttgart XBJK GS MSCEEAS EUR 39 $0.0 ETF Securities Note: Assets and Average Daily Volume (ADV) as at 29 April 2011. ADV reflects reported US dollar turnover on the exchange listed. Products are sorted by provider within categories. Source: Various ETF providers, exchanges, Global ETF Research and Implementation Strategy Team, BlackRock, Bloomberg.
Figure 44: New ETFs listed in Australia in 2011
ETF name Ticker
(BB)Launch
dateApril 2011 SPDR S&P/ASX 200 Financials Ex A-REIT OZF AU 13-Apr-11
SPDR S&P/ASX 200 Resources Fund OZR AU 13-Apr-11
SPDR S&P/ASX Small Ordinaries Fund SSO AU 13-Apr-11
March 2011 Russell Australian Value ETF RVL AU 18-Mar-11
February 2011 BetaShares US Dollar ETF USD AU 01-Feb-11
Source: Various ETP providers, exchanges, Global ETF Research and Implementation Strategy Team, BlackRock, Bloomberg.

ETF Landscape June 2011 Celebrating 10 Years of ETFs in Australia from BlackRock
This document is not an offer to buy or sell any security or to participate in any trading strategy. Please refer to important information and qualifications at the end of this material. 60
Subscribe to ETF Landscape reports
Subscribe
The Global ETF Research and Implementation Strategy Team publish a number of regular reports.
If you or your colleagues would like to receive the ETF Landscape series of reports at no cost, please subscribe via our website at www.blackrockinternational.com/etflsubscribe.
Alternatively, please email your/their business contact details to the team at: [email protected].
Bloomberg
You can also access and subscribe to our reports via the ETF Landscape Bloomberg page at: ETFP <GO>.
Join the ETF Network on LinkedIn at: http://www.linkedin.com/groups?mostPopular=&gid=110203
Monthly Global Industry Highlights
Monthly snapshot of the latest key global and regional ETF and ETP industry trends produced in the second week of the month showing data as at end of previous month.
Quarterly Global Handbook
Quarterly comprehensive guidebook to all ETFs and ETPs from all providers listed around the world. Includes the price tickers, index tickers, annual TER, dividend policy, fund structure, (AUM) as well as ETF provider websites, exchanges, and index providers to assist in comparing the various products available.
Weekly STOXX 600 European Sector ETF Net Flows
Weekly report covering the seven families of European Sector ETF Net Flows, analysing all ETFs listed in Europe tracking the STOXX 600 sectors. Data reported in this analysis includes index weights, tickers, performance, futures open interest, ETF AUM, trading volumes and net inflows/outflows. The report is produced every Wednesday showing data as at end of previous week.
Annual Review of Institutional Users of ETFs
Review of the use of ETFs listed globally by institutional investors globally who have reported holding one or more ETFs in their mutual fund holding disclosures, or in different filing sources including 13F, 13D and 13G, proxy and other declarable stakes during any of the four quarters of the year based on data compiled by Thomson Reuters.
Special Editions
Special edition reports covering the history and outlook for the ETF industry in the following regions:
Europe: 10 Year Anniversary of ETFs
Exposure Industry Reviews
Review of all ETFs listed around the world including exposure breakdowns, assets, products, flows, index performance and correlation comparison and key tax considerations:
China
Commodity
Emerging Market ETFs
Fixed Income ETFs
Real Estate
Regional Industry Reviews
Review of all ETFs listed providing exposure and/or listed in the region covered. Includes a comparison to the local mutual fund flows and index performance:
Asia Pacific
Canada
Latin America
Spain
United Kingdom

ETF Landscape June 2011 Celebrating 10 Years of ETFs in Australia from BlackRock
This document is not an offer to buy or sell any security or to participate in any trading strategy. Please refer to important information and qualifications at the end of this material. 61
About BlackRock
BlackRock is a leader in investment management, risk management and advisory services for institutional and retail clients worldwide. As at 31 March 2011, BlackRock's AUM was US$3.648 trillion.
BlackRock offers products that span the risk spectrum to meet clients' needs, including active, enhanced and index strategies across markets and asset classes. Products are offered in a variety of structures including separate accounts, mutual funds, iShares ETPs, and other pooled investment vehicles.
BlackRock also offers risk management, advisory and enterprise investment system services to a broad base of institutional investors through BlackRock Solutions.
Headquartered in New York City, 31 March 2011, the firm has approximately 9,300 employees in 26 countries and a major presence in key global markets, including North and South America, Europe, Asia, Australia and the Middle East and Africa. For additional information, please visit BlackRock's website at www.blackrock.com.
About BlackRock’s Global ETF Research and Implementation Strategy Team
BlackRock's Global ETF Research and Implementation Strategy Team is regarded as the industry's pre-eminent source of data, analysis and perspective on the ETF/ETP marketplace worldwide.
While the team's focus is ETFs/ETPs, the team operates independently from the iShares business and provides an independent source of marketplace research and advice to clients on the implementation of asset allocation strategies using ETFs and ETPs.
Led by Deborah Fuhr, Managing Director, the team produces the 'ETF Landscape' reports, a comprehensive series of weekly, monthly, and quarterly ETF market commentaries as well as handbooks covering all ETFs and ETPs from all 178 providers (as at 31 March 2011).
The scope of research is unequalled industry-wide, covering the world as well as all major regional markets and ETF genres, with a focus on North America, Latin America, Europe, the Middle East, Asia, and Japan.
The research produced is a key source of expertise and comment for representatives of global exchanges, regulatory bodies and the financial media.
Through the team's timely and comprehensive research and market insight, BlackRock demonstrates its dedication to the industry by building greater market understanding of the dynamic ETF vehicle and supporting the efforts of all market participants to realise optimal investment value from the ETF approach.

ETF Landscape June 2011 Celebrating 10 Years of ETFs in Australia from BlackRock
This document is not an offer to buy or sell any security or to participate in any trading strategy. Please refer to important information and qualifications at the end of this material. 62
This page has been left blank intentionally.

ETF Landscape June 2011 Celebrating 10 Years of ETFs in Australia from BlackRock
63 This document is not an offer to buy or sell any security or to participate in any trading strategy. Please refer to important information and qualifications at the end of this material.
This page has been left blank intentionally.

ETF Landscape June 2011 Celebrating 10 Years of ETFs in Australia from BlackRock
This document is not an offer to buy or sell any security or to participate in any trading strategy. Please refer to important information and qualifications at the end of this material. 64
This page has been left blank intentionally.

ETF Landscape June 2011 Celebrating 10 Years of ETFs in Australia from BlackRock
65 This document is not an offer to buy or sell any security or to participate in any trading strategy. Please refer to important information and qualifications at the end of this material.
AMERICAS EMEA ASIA/PACIFIC
ATLANTA BlackRock Investment Management LLC Suite 750, 3455 Peachtree Road N.E., Atlanta, 30326, GA +1.404.237.5386 BLOOMFIELD HILLS BlackRock Investment Management LLC Suite 100, 39533 Woodward Avenue, Bloomfield Hills, 48304, MI +1.248.988.8700 BOSTON BlackRock Capital Management Inc One Financial Center, 10 Dewey Square, Boston, 02111, MA +1.617.357.1200 CHARLOTTE BlackRock Investment Management LLC The Carillon Building, 6th Floor, 227 West Trade Street, Charlotte, 28202, NC +1.704.350.8400 CHICAGO BlackRock Financial Management, Inc. Franklin Corporate Center, 227 West Monroe Street, Chicago, 60606, IL +1.312.395.9300 CINCINNATI BlackRock Investment Management LLC U.S. Bank Tower, 23rd Floor, 425 Walnut Street, Cincinnati, 45202, OH +1.248.988.8707 DALLAS BlackRock Investment Management LLC Premier Place, 5910 North Central Expressway, Dallas, 75206, TX +1.214.346.7340 DURHAM BlackRock Investment Management LLC 2200 West Main Street, Durham, 27705, NC +1.919.416.6860 HOUSTON BlackRock Investment Management LLC One Houston Center, 1221 McKinney Street, Houston, 77010, TX +1.713.739.0679 JACKSONVILLE BlackRock Investment Management LLC Bank of America Tower, 50 North Laura Street, Jacksonville, 32202, FL +1.904.359.8824 JERSEY CITY BlackRock, Inc. 525 Washington Boulevard, Jersey City, 07310, NJ +1.201.942.8737 LA JOLLA BlackRock Investment Management LLC 7825 Fay Avenue, La Jolla, 92037, CA +1.858.456.5736 LOS ANGELES BlackRock Financial Management, Inc. 37TH Floor, 350 South Grand Avenue, Los Angeles, 90071, CA +1.213.613.3800 MEXICO CITY Impulsora y Promotora BlackRock Torre Mayor, Paseo de la Reforma 505, Piso 30, 06500 Mexico City, Mexico +52.55.5241.4300 MIAMI BlackRock Investment Management LLC 701 Brickell Avenue, Miami, 33131, FL +1.305.358.1171 MINNEAPOLIS BlackRock Investment Management LLC IDS Center, 80 South Eighth Street, Minneapolis, 55402, MN +1.612.371.2064 MONTREAL BlackRock Asset Management Canada Limited 1000 Rue Sherbrooke Ouest, Ville-Marie, Montréal, Québec, H3A 3R7, Canada +1.514.843.5128 NEW YORK BlackRock, Inc. Park Avenue Plaza, 55 East 52nd Street, New York, 10055, NY +1.212.810.5300 40 East 52nd Street, New York, 10022, NY +1.212.810.3500 49 East 52nd Street, New York, 10022, NY
NEWPORT BEACH BlackRock Realty Advisors, Inc. 4400 MacArthur Boulevard, Newport Beach, 92660, CA +1.949.623.0700 PALM BEACH BlackRock Investment Management LLC Plaza Center, 1st Floor, 249 Royal Palm Way, Palm Beach, 33480, FL +1.561.366.8349 PHILADELPHIA BlackRock Financial Management, Inc. 16th Floor, 2929 Arch Street, Philadelphia, 19104, PA +1.215.349.9700 PHOENIX BlackRock Investment Management LLC 2525 East Camelback Road, Phoenix, 85016, AZ +1.602.224.5487 PITTSBURGH BlackRock Financial Management, Inc. 19th Floor, One PNC Plaza, 249 Fifth Avenue, Pittsburgh, 15222, PA +1.412.762.7147 PRINCETON BlackRock Investment Management LLC Princeton Corporate Campus, 800 Scudders Mill Road, Plainsboro, 08536, NJ +1.609.853.5600 RANCHO CORDOVA BlackRock Institutional Trust Company NA 10850 Gold Center Drive, Rancho Cordova, 95670, CA +916.463.6366 SAN FRANCISCO BlackRock Corporation US, Inc. 400 Howard Street, San Francisco, 94105, CA +1.415.670.2000 405 Howard Street, San Francisco, 94105, CA +1.415.670.2000 SANTIAGO iShares Chile Inversiones Limitada Alcantara 200, Piso 6, Las Condes, Santiago, CP 755-0159, Chile +56.2.369.5693 SÃO PAULO BlackRock Brasil Gestora de Investimentos Ltda. 16 Floor, Praca Jose Lannes 40, Sao Paulo, 04571-100, Brazil +55.11.3028.4119/4102 SEATTLE BlackRock Financial Management, Inc. Two Union Square, 601 Union Street, Seattle, 98101, WA +1.206.613.6700 ST LOUIS BlackRock Investment Management LLC Suite 260, 1001 Craig Road, St. Louis, 63146, MO +1.314.569.9869 ST PETERSBURG BlackRock Investment Management LLC Suite 302, 100 Second Avenue South, St. Petersburg, 33701, FL +1.727.823.8810 STAMFORD BlackRock Investment Management LLC Three Stamford Plaza, 301 Tresser Boulevard, Stamford, 06904, CT TORONTO BlackRock Asset Management Canada Limited 161 Bay Street, Suite 2500, PO Box 614, Toronto, Ontario, M5J 2S1, Canada +1.416.643.4000 WASHINGTON BlackRock Investment Management LLC Suite 1120, 1800 K Street N.W., Washington, 20006, DC +1.202.955.4532 WILMINGTON BlackRock Advisors LLC 100 Bellevue Parkway, Wilmington, 19809, DE +1.302.797.2000 Bellevue Park Corporate Center, 400 Bellevue Parkway, Wilmington, 19809, DE +1.302.797.2000
AMSTERDAM BlackRock Investment Management (UK) Limited – Amsterdam Branch 17th Floor, Rembrandt Tower, Amstelplein 1, 1096 HA, Amsterdam, Netherlands +31.20.549.5200 BRUSSELS BlackRock Investment Management (UK) Limited – Brussels Branch Regus Park Atrium, Rue des Colonies 11, 1000 Brussels, Belgium +32.2.517.6133 DUBAI BlackRock Advisors (UK) Limited – Dubai Branch DIFC, Al-Fattan Currency House Building, Level 1, PO Box 506661, Dubai, United Arab Emirates +971.4.450.0700 DUBLIN BlackRock Investment Management (Dublin) Limited FitzWilliam Business Centre, 77 John Rogerson's Quay, Dublin City, Dublin 2, Ireland EDINBURGH BlackRock (International) Limited 40 Torphichen Street, Edinburgh, EH3 8JB, Scotland +44.131.472.7200 FRANKFURT BlackRock Investment Management (UK) Limited – Frankfurt Branch Opera Tower, Bockenheimer Landstraße 2-4, 23rd floor, D-60306 Frankfurt, Germany +49.69.50.500.3111 GENEVA BlackRock Asset Management (Schweiz) AG 2nd Floor, Rue de Contamines 18, Case postale 3467, 1211 Genève 3, Switzerland +41.22.703.1970 ISLE OF MAN BlackRock (Isle of Man) Limited 3rd Floor, Atlantic House, 4-8 Circular Road, Douglas, IM1 1AG, Isle of Man +44.162.466.2255 LONDON BlackRock Advisors (UK) Limited 33 King William Street, London, EC4R 9AS, UK +44.20.7743.3000 Murray House, 1 Royal Mint Court, London, EC3N 4HH, UK +44.20.7668.8000 MADRID BlackRock Investment Management (UK) Limited – Madrid Branch Plaza Pablo Ruiz Picasso, Nº1, Torre Picasso, Planta 14ª, 28020-Madrid, Spain +34.91.788.9400 MILAN BlackRock Investment Management (UK) Limited – Milan Branch Via Brera, Nº 3-5, Milan, 20121 Italy +39.0291.5971 MUNICH BlackRock Asset Management Deutschland AG Max-Joseph-Strasse 6, D-80333, Munich, Germany +49.89.42729.5899 PARIS BlackRock Investment Management (UK) Limited – French Branch Washington Plaza – Bâtiment Artois, 44 rue de Washington, 75008 Paris, France +33.156.43.2900 SENNINGERBERG BlackRock Operations (Luxembourg) S.à r.l. 6D Route de Treves, Senningerberg, L-2633, Luxembourg +35.2342.0101 ST HELIER BlackRock (Channel Islands) Limited Forum House, Greenville Street, St. Helier, JE1 0BR, Jersey +44.153.460.0800 STOCKHOLM BlackRock Investment Management (UK) Limited – Stockholm Branch Master Samuelsgatan 1, Box 609, 114 11Stockholm, Sweden +46. 85057.2600 VIENNA BlackRock Investment Management (UK) Limited – Vienna Branch Graben 19/9, Vienna, 1010, Austria +43.1230.60.6070 WARSAW BlackRock Investment Management (UK) Limited – Warsaw Branch 2nd Floor, DAGO Centrum, Rondo Onz 1, Warsaw, 00-124, Poland +48.22.544.9265 ZURICH BlackRock Investment Management (UK) Limited – Zurich Branch Claridenstrasse 25, 8002, Zurich, Switzerland +41.44.297.7373
BEIJING BlackRock Investment Management (UK) Limited – Beijing Representative Office Suite 1907, Excel Centre, 6 Wudinghou Street, Xi Cheng District, Beijing 100140, China +86.106.619.0500 BRISBANE BlackRock Investment Management (Australia) Limited Level 2, Waterfront Place, 1 Eagle Street, Brisbane, QLD 4000, Australia +61.7.3234.7000 HONG KONG BlackRock Asset Management North Asia Limited 16/F Cheung Kong Center, 2 Queen’s Road Central, Hong Kong, China +852.3903.2800 MELBOURNE BlackRock Investment Management (Australia) Limited Level 18, 120 Collins Street, Melbourne, VIC 3000, Australia +61.3.9657.3000 MUMBAI DSP BlackRock Investment Managers Private Limited Maker Chamber VI, Office No. 126/127, 12th Floor, Jamnalal Bajaj Road, Nariman Point, Mumbai 400 021, India +91.44.3091.5400 PERTH BlackRock Investment Management (Australia) Limited Suite 4, Level 3, 1292 Hay Street, West Perth, WA 6005, Australia +61.8.9229.2800 SEOUL BlackRock Investment Management (Korea) Limited 23/F Seoul Finance Center, 84 Taepyungno 1-GA, Jung-Ga, Seoul, Korea +822.751.0500 SINGAPORE BlackRock (Singapore) Limited 20 Anson Road, #18-01, 079912 Singapore +65.6411.3000 SYDNEY BlackRock Asset Management Australia Limited Level 43/44, Grosvenor Place, 225 George Street, Sydney, NSW 2000, Australia +61.2.9272.2200 TAIPAI BlackRock (Taiwan) Limited 28th Floor, No. 95 Tun Hwa South Road, Section 2, 106 Taipei +886.2.2326.1600 TOKYO BlackRock Japan Company Limited Maranouchi Trust Tower Main, 1-8-3 Marunouchi Chiyoda-ku Tokyo, 100-8217 Japan +81.3.6703.4100
Regulatory Information
BlackRock Advisors (UK) Limited (‘BlackRock’), which is authorised and regulated by the Financial Services Authority in the United Kingdom, has issued this document for access by professional clients and for information purposes only. This document or any portion hereof may not be reprinted, sold or redistributed without authorisation from BlackRock.
This communication is being made available to persons who are investment professionals as that term is defined in Article 19 of the Financial Services and Markets Act 2000 (Financial Promotion Order) 2005 or its equivalent under any other applicable law or regulation in the relevant jurisdiction. It is directed at persons who have professional experience in matters relating to investments.
This document is an independent market commentary document based on publicly available information and is produced by the ETF Research and Implementation Strategy team. Specifically, this is not marketing nor is it an offer to buy or sell any security or to participate in any trading strategy. Affiliated companies of BlackRock may make markets in the securities of ETFs and provide ETFs in the form of iShares. Further, BlackRock and/or its affiliated companies and/or their employees may from time to time hold shares or holdings in the underlying shares of, or options on, any security of ETFs and may as principal or agent buy securities in ETFs.
The opinions expressed are those of BlackRock as of April 2011, and are subject to change at any time due to changes in market or economic conditions. They should not be construed as a recommendation, investment advice, offer or solicitation to buy or sell any securities or to adopt any investment strategy. In particular, BlackRock has not performed any due diligence on products which are not managed by BlackRock and accordingly does not make any remark on their suitability. Prospective investors should take their own independent advice prior to making an investment decision.
This document does not provide investment advice and the information contained within should not be relied upon in assessing whether or not to invest in the products mentioned. It has been prepared without regard to the individual financial circumstances and objectives of persons who receive it. The securities discussed in this commentary may not be suitable for all investors. BlackRock recommends that investors independently evaluate each issuer, security or instrument discussed in this publication and encourages investors to seek the advice of a financial adviser. The appropriateness of a particular investment or strategy will depend on an investor’s individual circumstances and objectives.
The value of and income from any investment may go up or down and an investor may not get back the amount invested. The value of the investment involving exposure to foreign currencies can be affected by exchange rate movements. We also remind you that the levels and bases of, and reliefs from, taxation can change and is dependent upon individual circumstances.
Although BlackRock endeavours to update and ensure the accuracy of the content of this document BlackRock does not warrant or guarantee its accuracy or correctness. Despite the exercise of all due care, some information in this document may have changed since publication. Investors should obtain and read the ETF prospectuses from the ETF Providers and confirm any relevant information with ETF Providers before investing. Neither BlackRock, nor any affiliate, nor any of their respective, officers, directors, partners, or employees accepts any liability whatsoever for any direct or consequential loss arising from any use of this publication or its contents.
Notice to Australian residents:
Issued in Australia by BlackRock Investment Management (Australia) Limited ABN 13 006 165 975, AFSL 230523 ("BIMAL"). iShares® exchange traded funds (“ETFs”) that are madeavailable in Australia are issued by BIMAL, iShares, Inc. ARBN 125 632 279 and iShares Trust ARBN 125 632 411. BlackRock Asset Management Australia Limited ("BAMAL") ABN 33001 804 566, AFSL 225 398 is the local agent and intermediary for iShares ETFs that are issued by iShares, Inc. and iShares Trust. BIMAL and BAMAL are wholly-owned subsidiaries of BlackRock, Inc. (collectively “BlackRock”). A Product Disclosure Statement (“PDS”) or prospectus for each iShares ETF that is offered in Australia is available at iShares.com.au. Youshould read the PDS or prospectus and consider whether an iShares ETF is appropriate for you before deciding to invest.
iShares securities trade on ASX at market price (not, net asset value ("NAV")). iShares securities may only be redeemed directly by persons called “Authorised Participants”.
This information is general in nature, and has been prepared without taking into account any individual's objectives, financial situation, or needs. You should seek independentprofessional legal, financial, taxation, and/or other professional advice before making an investment decision regarding the iShares funds."
For investors in Hong Kong:
Some of the funds mentioned herein have not been registered with the Securities and Futures Commission for offering or distribution in Hong Kong. Accordingly, this material may not be circulated or distributed, nor may the funds be offered or sold whether directly or indirectly, to any person in Hong Kong other than to a Professional Investor as defined in the Securities and Futures Ordinance ("SFO") (Cap. 571 of the laws of Hong Kong) and any regulations there under.
Notice to residents in Singapore:
This document is provided by BlackRock (Singapore) Limited (company registration number: 200010143N) for use with institutional investors only. This document has not been registered as a prospectus with the Monetary Authority of Singapore (MAS). Some of the funds mentioned herein have not been registered with the MAS for distribution in Singapore. Accordingly, this and any other document or material in connection with the offer or sale of the Shares may not be circulated or distributed, nor may the Shares be offered or sold, whether directly or indirectly, to any person in Singapore other than (i) to an institutional investor pursuant to Section 304 of the Securities and Futures Act (SFA) or (ii) otherwise pursuant to, and in accordance with the conditions of, any other applicable provision of the SFA. First sales of the Shares acquired pursuant to Section 304 of the SFA are subject to the requirements under Section 304A of the SFA.
Notice to residents in Thailand:
This document is intended for information purposes only and does not constitute investment advice or an offer to sell or solicitation of an offer to buy the funds described herein. This document has been provided by BlackRock in a private and confidential manner to institutional investors only upon their request. The funds mentioned herein have not been registered with any authorities in Thailand, and accordingly, this document may not be circulated or distributed, nor may the shares of these funds be offered or sold whether directly or indirectly, to any person in Thailand.
Notice to residents in India:
This document is intended for information purposes only and does not constitute investment advice or an offer to sell or solicitation of an offer to buy the funds described herein. This document has been provided by BlackRock in a private and confidential manner to financial intermediaries only upon their request. The funds mentioned herein have not been registered with any authorities in India.
Notice to residents in Vietnam:
This document is intended for information purposes only and does not constitute investment advice or an offer to sell or solicitation of an offer to buy the funds described herein. This document has been provided by BlackRock in a private and confidential manner to institutional investors only upon their request. The funds mentioned herein have not been registered with any authorities in Vietnam, and accordingly, this document may not be circulated or distributed, nor may the shares of these funds be offered or sold whether directly or indirectly, to any person in Vietnam.
The trademarks and service marks contained herein are the property of their respective owners. Third-party data providers make no warranties or representations of any kind relating to the accuracy, completeness, or timeliness of the data they provide and shall not have liability for any damages of any kind relating to such data.
© 2011 BlackRock Advisors (UK) Limited. Registered Company No 00796793. All rights reserved. Calls may be monitored or recorded.

This publication was produced by the Global ETF Research and Implementation Strategy Team at BlackRock.
If you or your colleagues would like to sign up to receive future copies of BlackRock’s ETF Landscape series including our Monthly Industry Review, Quarterly Global Handbook and Annual Review of Institutional Users, please subscribe via our website at www.blackrockinternational.com/etflsubscribe. Alternatively, please email your/their business contact details to: [email protected]. We also welcome any comments or suggestions.
www.blackrock.com
B-ETFLA10YA-I-JUN11-EN