estimation of the relative value of compositions and ... · performances in popular concerts and...
TRANSCRIPT
200 Aldersgate | Aldersgate Street | London EC1A 4HD
T: +44 (0)20 3727 1000 | F: +44 (0)20 3727 1007 | fticonsulting.com
FTI Consulting LLP. Registered in England and Wales at the above address.
Registered number OC372614, VAT number GB 815 0575 42.
A full list of Members is available for inspection at the registered address.
Estimation of the relative value of compositions and
performances in popular concerts and festivals based on
survey evidence
i
Table of contents
Section
1. Introduction and summary 1
2. How a survey can be used to assess relative value 6
3. Choice modelling results 11
4. Reasons for attending a festival 15
Appendix 1 Econometric methodology 17
Appendix 2 Survey sample and design 23
Appendix 3 Survey questions 29
Appendix 4 Estimation results 42
Appendix 5 Relative value calculations 49
1
1. Introduction and summary
In 1988 the Copyright Tribunal stated that the music works (i.e. the songs or
compositions) at live popular music events are significantly less important than the
performance. This statement appears to have been based upon the opinions of the
Tribunal members rather than an empirical analysis.
There is no market data about the prices of concerts with and without these two
attributes and so we have used a technique known as choice modelling to infer their
relative values.
Choice modelling is an econometric survey method that simulates consumers’
purchasing decisions and allows us to estimate the value that consumers place on the
different attributes of a product or service. This approach has been widely used from
aiding decision making in the design of optimal pricing policies and the valuation of
intellectual property rights, to estimating demand for new services and defining
relevant markets.
The results of the choice modelling allow us to estimate consumers’ preferences when
attending popular concerts and festivals and, in particular, to assess the relative
contribution of the composition/song and the performance to the value of a concert
and a festival. The survey also allows us to estimate the relative contribution of the
music and other entertainment types to the value of a festival to consumers.
In August 2014, we commissioned an online survey of consumers who have attended
popular music concerts and/or popular music festivals in the UK in the last year. The
survey consisted of two parts:
(1) An initial questionnaire on the respondents’ socio-demographic characteristics
and their recent experience when attending concerts and festivals; and
(2) A series of choice experiments where respondents had to choose their most
preferred concert or festival from a choice of events with varying attributes.
In particular, our survey included three choice exercises incorporating multiple choices
to be made by the respondents. In each choice exercise, respondents were presented
with a number of concert or festival alternatives, each one defined by a different
combination of attributes (such as a festival with the music they like and other
entertainment activities, such as, comedy, theatre, cabaret and poetry, and the ticket
price). The respondents were then asked to choose their preferred alternative.
2
By analysing the responses to the choice exercises, we have calculated the relative
value of the composition (measured through the incremental value of the songs) and
the performance (measured through the incremental value of the artists’
performances) in concerts and festivals. We have also calculated the incremental value
of music relative to the incremental value of other entertainment types in festivals.
How to use the results of the choice modelling
The responses to a choice exercise allow us to calculate consumers’ willingness to pay
(“WTP”) for the different attributes that characterise the product. By WTP, we mean the
maximum amount that each individual consumer is willing to spend to buy a product or
service with certain given attributes. An example of such a characteristic is the type of
music at a festival. The incremental WTP for an attribute is the difference between the
WTP of the product with and without that particular attribute. We are interested in the
WTP for the composition (songs) and the performance (the artists’ performance) in
concerts and festivals, and the music (the combination of composition and
performance) and other entertainment types in festivals.
The challenge in this case is that it is not possible to make a comparison between a
concert or festival with music and a concert of festival without music. We therefore
estimate, for instance, the incremental value of the music in a festival, as the
difference between the WTP for a festival with the music that respondents like and the
WTP for a festival with other music, which act as baselines for where the attribute is not
important to the respondent rather than being absent
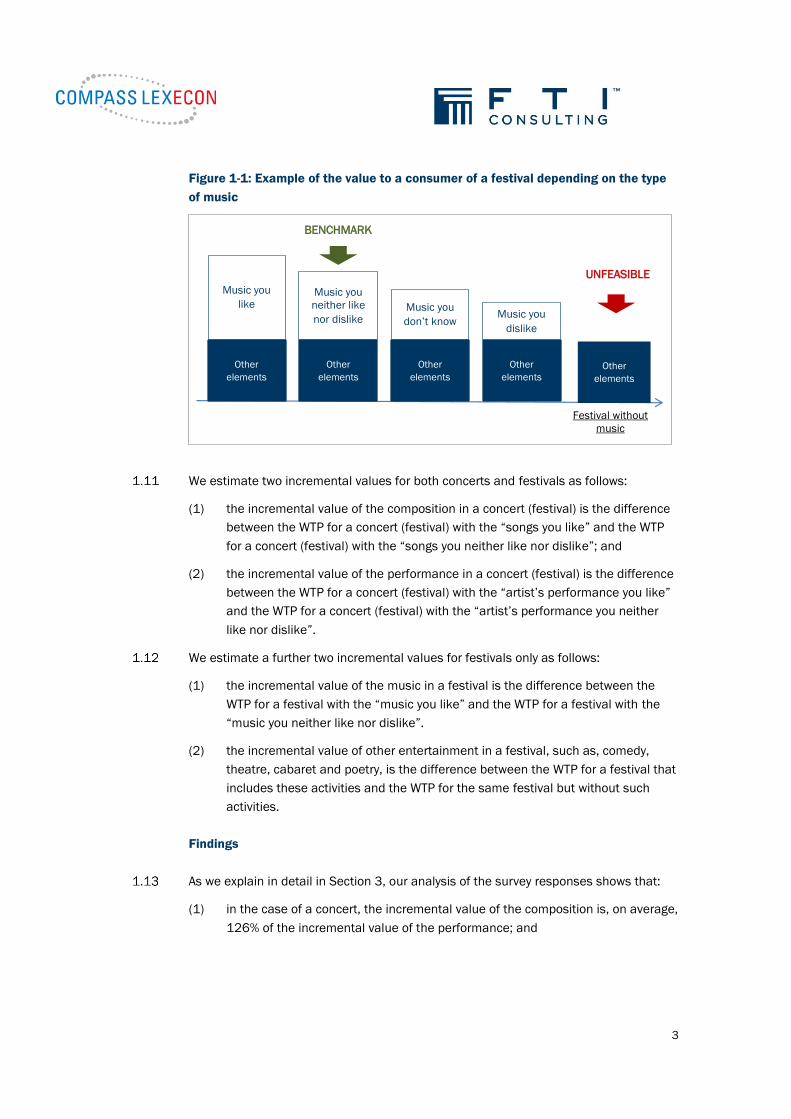
We have considered three potential baselines to use in respect of ‘other music’, being
the music/songs/artists’ performances that respondents (1) neither like nor dislike, (2)
do not know, and (3) dislike. Figure 1-1 below illustrates these benchmarks. We use
the first of these benchmarks in our analysis, but our conclusions are not particularly
sensitive to the choice of benchmark.
3
Figure 1-1: Example of the value to a consumer of a festival depending on the type
of music
We estimate two incremental values for both concerts and festivals as follows:
(1) the incremental value of the composition in a concert (festival) is the difference
between the WTP for a concert (festival) with the “songs you like” and the WTP
for a concert (festival) with the “songs you neither like nor dislike”; and
(2) the incremental value of the performance in a concert (festival) is the difference
between the WTP for a concert (festival) with the “artist’s performance you like”
and the WTP for a concert (festival) with the “artist’s performance you neither
like nor dislike”.
We estimate a further two incremental values for festivals only as follows:
(1) the incremental value of the music in a festival is the difference between the
WTP for a festival with the “music you like” and the WTP for a festival with the
“music you neither like nor dislike”.
(2) the incremental value of other entertainment in a festival, such as, comedy,
theatre, cabaret and poetry, is the difference between the WTP for a festival that
includes these activities and the WTP for the same festival but without such
activities.
Findings
As we explain in detail in Section 3, our analysis of the survey responses shows that:
(1) in the case of a concert, the incremental value of the composition is, on average,
126% of the incremental value of the performance; and
Other
elements Other
elements
Festival without
music
UNFEASIBLE
Music you
dislike
Music you
don’t know
Music you
neither like
nor dislike
Music you
like
Other
elements Other
elements Other
elements
BENCHMARK
4
(2) in the case of a festival, the incremental value of the composition is, on average,
around 92% of the incremental value of the performance.
We also considered the incremental value of music at festivals (including both the
value of compositions and the performance) compared to the incremental value of
other entertainment. Our analysis of the survey responses shows that the incremental
value of music is, on average, 284% of the incremental value of other activities.
To further understand the value of music at festivals, we included questions in the
initial questionnaire where we asked respondents to rank the factors they consider
when deciding whether to attend a festival in the UK. The top three responses were:
(1) The music (51% indicated this as the most important factor);
(2) Competitive pricing of tickets (15% indicated this as the most important factor);
and
(3) The presence of like-minded people and friends at the festival (10% indicated
this as the most important factor).
We also asked about the most important factors in respondents’ decisions to attend
the last festival they attended. The top three responses were:
(1) The music (54% indicated this as the most important factor);
(2) “Social & Relaxation” reasons (e.g. spend time with friends, escape from normal
life, to reminisce) (23% indicated this as the most important factor); and
(3) To experience something new (8% indicated this as the most important factor).
Only 4% of respondents said that the most important factor in their decision was the
availability of other entertainment activities within the festival, such as, comedy,
theatre, cabaret and poetry.
The questionnaire therefore indicates that consumers consider the music to be by far
the most important factor when deciding whether to attend a festival in the UK.
Structure of this report
The structure of the remainder of this report is as follows:
In Section 2, we explain how a survey can be used to assess the relative values of
(1) compositions and performances at concerts and festivals, and (2) music and
other types of entertainment at festivals.
In Section 3, we summarise the results of our choice modelling analysis.
In Section 4, we set out the reasons stated by respondents for attending a festival.

5
About FTI Consulting
FTI Consulting is a global advisory business of which Compass Lexecon is a wholly
owned subsidiary. The FTI Consulting team is led by Greg Harman, Andrew Wynn,
Alejandro Requejo and Patricia Lorenzo. Alejandro Requejo specialises in the
application of discrete choice models and other econometric techniques to competition
policy and strategic problems.
6
2. How a survey can be used to assess relative value
Introduction
In this section, we explain how we have used the economic tool of choice modelling to
estimate:
(1) the relative value that consumers place upon the compositions at concerts and
festivals as compared to the artist’s performance; and
(2) the relative value that consumers place upon the music at festivals as compared
to the provision of other types of entertainment.
Choice modelling
In order to determine the relative values above, we estimated the WTP (willingness to
pay) of UK consumers to attend concerts and festivals with different attributes. To do
this, we used a stated preference (“SP”) method.
The SP methods allow us to estimate the WTP for goods that are not available in the
market. Within the SP family we used the discrete choice experiment ("DCE") a choice
modelling method. Choice modelling is a popular and economically sound tool and has
been widely used from aiding decision making in the design of optimal pricing policies
and valuing intellectual property rights, to estimating demand for new services and
defining relevant markets.
To perform choice modelling, a sample of respondents are presented with a number of
alternatives, each one described by a different combination of attributes, and asked to
choose their preferred alternative. The choices made by the respondents can be used
to understand trade-offs and to calculate each individual’s WTP for a single
characteristic of a product or service. In our case, we were able to use the results of the
survey to estimate the demand for concerts and festivals with different attributes.
We base our calculations upon survey data collected online between 15 and 18 August
2014. The survey invite was randomly sent to a nationally representative cross-section
of the UK population, which is representative of the target population in terms of age,
gender and place of residence. 811 respondents took part in our survey. Of these, 780
respondents had attended at least one concert in the last 12 months and 402
respondents had attended at least one festival in the same period. Each of these
respondents completed multiple choice exercises.

7
We asked respondents to make four choices in each choice exercise. Therefore, we
have over 3,000 responses for the choice exercise on concerts and over 1,500
responses for the choice exercises on festivals.
The survey consisted of two parts: (1) an initial questionnaire on the respondents’
socio-demographic characteristics and their attendance at concerts and festivals, and
(2) a series of choice experiments where respondents had to choose their most
preferred product from a choice of hypothetical concerts/festivals with varying
attributes. We asked each respondent to complete three choice modelling exercises of
four questions each.
First exercise: relative value of compositions and performances at concerts
The first choice exercise was shown to the respondents that had attended at least one
concert in the last 12 months in the UK.
In this exercise we asked respondents to assume that they had decided to attend a
concert at a medium-sized indoor concert venue where there will be a headline
performer and a support act. Respondents were presented with four options: three
different concerts and the possibility of not choosing any of these options. Each concert
was characterised by the songs performed, the artist’s live performance and the ticket
price.
In the case of the songs performed and the artist’s performance, these attributes were
described as those the respondent (1) likes, (2) neither likes nor dislikes, (3) dislikes,
or (4) does not know.
Figure 2-1 shows an example choice card from this exercise. Each respondent was
shown four cards from 100 potential cards. Given that there were 780 respondents
who have attended at least one concert we have over 3,000 responses for this choice
exercise.
The prices shown in this and the following example exercises do not cover the full
range of prices included in our choice exercises. The full range of levels for each
attribute is set out in Appendix 3.

8
Figure 2-1: Example of an experiment of the first choice exercise
We estimate:
(1) the incremental value of compositions as the additional amount that
respondents will pay to attend a concert with songs that they like as compared
to those that they neither like nor dislike; and
(2) the incremental value of the performance as the additional amount that
respondents will pay attend a concert with an artist whose performance they like
as compared to one whose performance they neither like nor dislike.
The ratio of these values represents the relative value that consumers ascribe to
compositions and to performances at a concert.
Second exercise: relative value of compositions and performances at festivals
The second choice exercise was broadly similar to the first except that it related to
festivals rather than concerts. We asked respondents to assume that they had decided
to attend a three day festival at a large outdoor space where there is a large main
stage and several smaller stages that will feature music for ten hours per day. It was
shown to all respondents that have attended at least one festival in the last 12 months
in the UK.
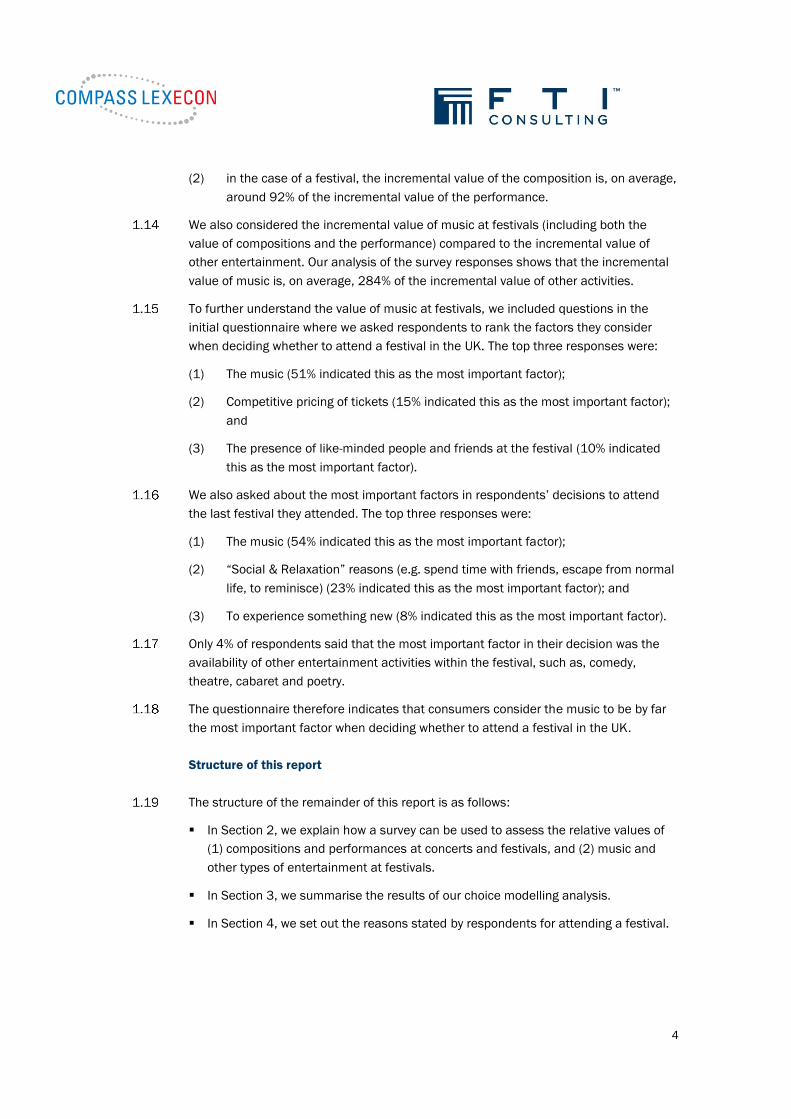
Figure 2-2 shows an example choice from this exercise. Each respondent was shown
four cards from 100 potential cards. Given that there were 402 respondents who have
attended at least one concert we have over 1,500 responses for this.
9
Figure 2-2: Example of an experiment of the second choice exercise
Following the same approach as with the first exercise, we calculate the relative value
that consumers ascribe to compositions and to performances at a festival.
Third exercise: relative value of music and other entertainment at festivals
The third choice exercise was shown to the respondents that had attended at least one
festival in the last 12 months in the UK.
We asked respondents again to assume that they had decided to attend a three day
festival. The options available to them differed in the type of music performed
(meaning songs and performances together), whether or not other types of
entertainment were available and the ticket price.
Figure 2-3 shows an example choice from this exercise. Each respondent was shown
four cards from 100 potential cards. Given that there were 402 respondents who have
attended at least one concert we have over 1,500 responses for this.

10
Figure 2-3: Example of an experiment of the third choice exercise
This exercise was designed to calculate UK consumers’ WTP to attend festivals with
music that they like to varying extents with and without other types of entertainment.
We estimate:
(1) the incremental value of music as the additional amount that respondents will
pay to attend a festival with music that they like as compared to music that they
neither like nor dislike; and
(2) the incremental value of other entertainment as the additional amount that
respondents will pay to attend a festival with such entertainment as opposed to
one without it.
The ratio of these incremental values represents the relative value that consumers
ascribe to the music performed at a festival as compared to the other types of
entertainment available.
Supporting appendices
The appendices to this report set out further information about our survey:
In Appendix 1, we provide further information about the econometric techniques we
use to analyse the results of the choice modelling exercises.
In Appendix 2, we provide further information about the survey sample and design.
In Appendix 3, we set out the survey questions and choice modelling instructions
provided to respondents.
11
3. Choice modelling results
Introduction
In this section, we summarise our choice modelling results.
Relative value of composition and performance
Consumers are willing to pay on average:
(1) £65.31 more to attend a concert with the songs they like than the same concert
where the songs being played are songs they neither like nor dislike, and;
(2) £51.65 more to attend a concert with an artist’s performance they like than the
same concert where they neither like nor dislike the artist’s performance.
Consumers’ preferences therefore show that the incremental value of the composition
in a concert is larger than the incremental value of the performance. In particular, the
incremental value of the composition is approximately 126% of the incremental value
of the performance.
Consumers are willing to pay on average:
(1) £168.00 more to attend a festival with the songs they like than the same
festival where the songs being played are songs they neither like nor dislike,
and;
(2) £181.70 more to attend a festival with the artists’ performances they like than
the same festival where they neither like nor dislike the artists’ performances.
Consumers’ preferences therefore show that the incremental value of the composition
in a festival is lower than the incremental value of the performance. In particular, the
incremental value of the composition is approximately 92% of the incremental value of
the performance.
Relative value of music and other entertainment
Consumers are willing to pay on average:
(1) £287.11 more to attend a festival with the music they like than the same
festival where the music being played is the music they neither like nor dislike,
and;
(2) £101.08 more to attend a festival with other entertainment activities than the
same festival where these activities are not offered.
12
Consumers’ preferences therefore show that the incremental value of the music at
festivals (including both the value of compositions and the performance) is larger than
the incremental value of other entertainment activities. In particular, the incremental
value of the music is approximately 284% of the incremental value of other activities.
Choice of baseline
In the analysis above, we estimate the incremental value of songs, performances and
music by considering the WTP of songs/performances/artists that respondents like as
compared to those that they neither like nor dislike. The baseline for our assessment is
therefore songs/performances/artists that respondents neither like nor dislike. We
adopt this baseline because it is not feasible to consider a concert or festival with no
songs/performance/artist. However, there are other baselines that we could have
selected. These include:
(1) songs/performances/music that respondents do not know; and
(2) songs/performances/music that respondents dislike.
We have also performed our analysis using those baselines for which we have a
positive valuation.1 We determined that our conclusions are not sensitive to our choice
of baseline.2 We set out the results of adopting alternative approaches in Table 3-1
(relative value of compositions and performance) and Table 3-2 (relative value of music
and other entertainment) below.
Each row in Table 3-1 provides the incremental value of the songs and the
performance computed as the difference between the songs and performance you like
and the relevant baseline scenario. For instance, the incremental value of the songs
when the baseline is “neither like nor dislike” is the difference between the value of the
songs you like and the songs you neither line nor dislike. The incremental value of the
songs will depend on the type of performance considered and, similarly, the
incremental value of the performance will depend on the type of artist considered.
1 A negative valuation implies that respondents are not willing to pay for attending the concert or
festival and, therefore, they are not willing to attend the concert or festival unless they are paid
for it. These situations cannot be used as baselines for our analysis
2 See Appendix 5 for further details.

13
Each column indicates the type of attribute we have set for the other attribute when
computing the incremental values. That is, the type of performance when computing
the incremental value of the songs and the type of songs when computing the
incremental value of the performance. For instance, the incremental value of the songs
in a concert, computed as the difference between the songs you like and the songs you
neither line nor dislike (“Baseline: Neither like nor dislike”), is £65.31 when the artist is
the one the respondent neither likes nor dislikes, and £103.00 when the artist is the
one they like. Similarly, the incremental value of the performance in a concert,
computed as the difference between the performance you like and the performance
you neither line nor dislike (“Baseline: Neither like nor dislike”), is £51.65 when the
songs are the ones they neither like nor dislike, and £89.35 when the songs are the
ones they like.
The shaded entries indicate the baselines that we have adopted in our primary
analysis.
Table 3-1: Relative value of songs and performances
Type of the other attribute
Concerts Festivals
Neither like
nor dislike Like
Neither
like nor
dislike
Don't
know Like
Baseline: Neither like nor dislike
Incremental value of songs £65.31 £103.00 £168.00 £266.77 £208.62
Incremental value of performances £51.65 £89.35 £181.70 £283.54 £222.31
Relative value (songs/performances) 126% 115% 92% 94% 94%
Baseline: Do not know
Incremental value of songs n.a. £99.31 n.a. n.a. £165.85
Incremental value of performances n.a. £94.19 n.a. n.a. £182.62
Relative value (songs/performances) n.a. 105% n.a. n.a. 91%
Baseline: Dislike
Incremental value of songs n.a. n.a. n.a. n.a. £411.69
Incremental value of performances n.a. n.a. n.a. n.a. £413.54
Relative value (songs/performances) n.a. n.a. n.a. n.a. 100%
14
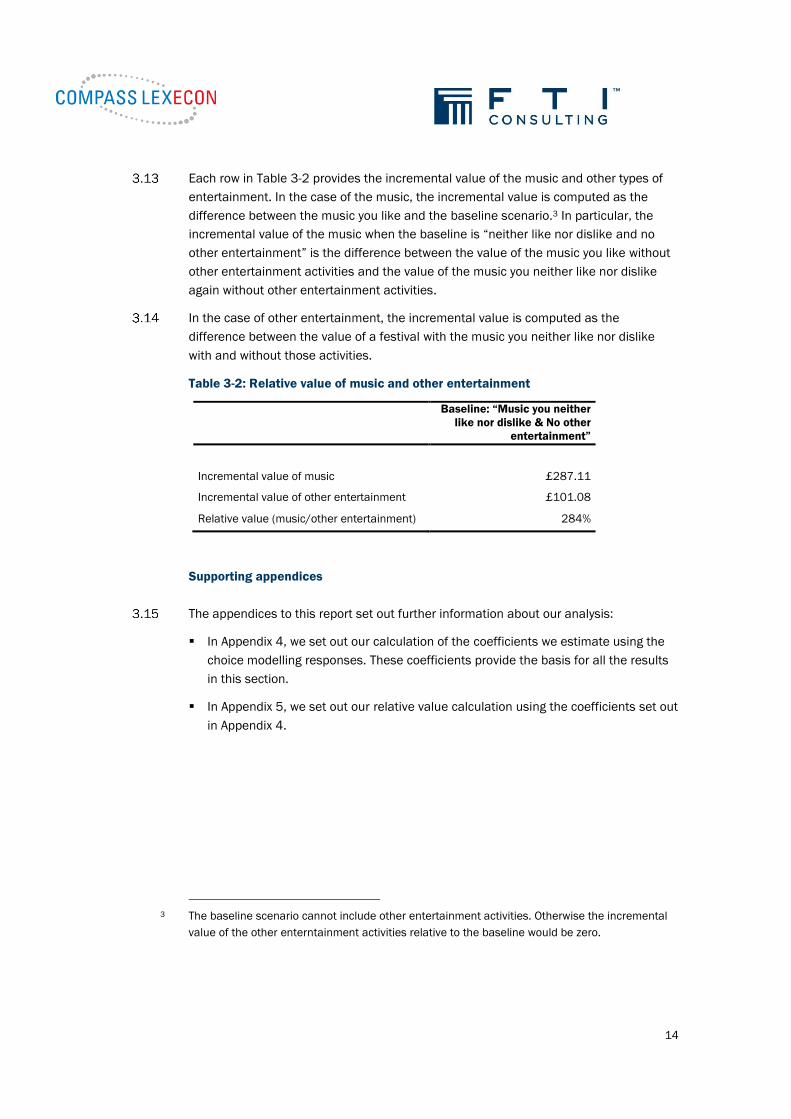
Each row in Table 3-2 provides the incremental value of the music and other types of
entertainment. In the case of the music, the incremental value is computed as the
difference between the music you like and the baseline scenario.3 In particular, the
incremental value of the music when the baseline is “neither like nor dislike and no
other entertainment” is the difference between the value of the music you like without
other entertainment activities and the value of the music you neither like nor dislike
again without other entertainment activities.
In the case of other entertainment, the incremental value is computed as the
difference between the value of a festival with the music you neither like nor dislike
with and without those activities.
Table 3-2: Relative value of music and other entertainment
Baseline: “Music you neither
like nor dislike & No other
entertainment”
Incremental value of music £287.11
Incremental value of other entertainment £101.08
Relative value (music/other entertainment) 284%
Supporting appendices
The appendices to this report set out further information about our analysis:
In Appendix 4, we set out our calculation of the coefficients we estimate using the
choice modelling responses. These coefficients provide the basis for all the results
in this section.
In Appendix 5, we set out our relative value calculation using the coefficients set out
in Appendix 4.
3 The baseline scenario cannot include other entertainment activities. Otherwise the incremental
value of the other enterntainment activities relative to the baseline would be zero.
15
4. Reasons for attending a festival
In addition to the choice exercises included in the survey, we asked respondents about
the factors they take into account when attending a festival.
Factors considered in general
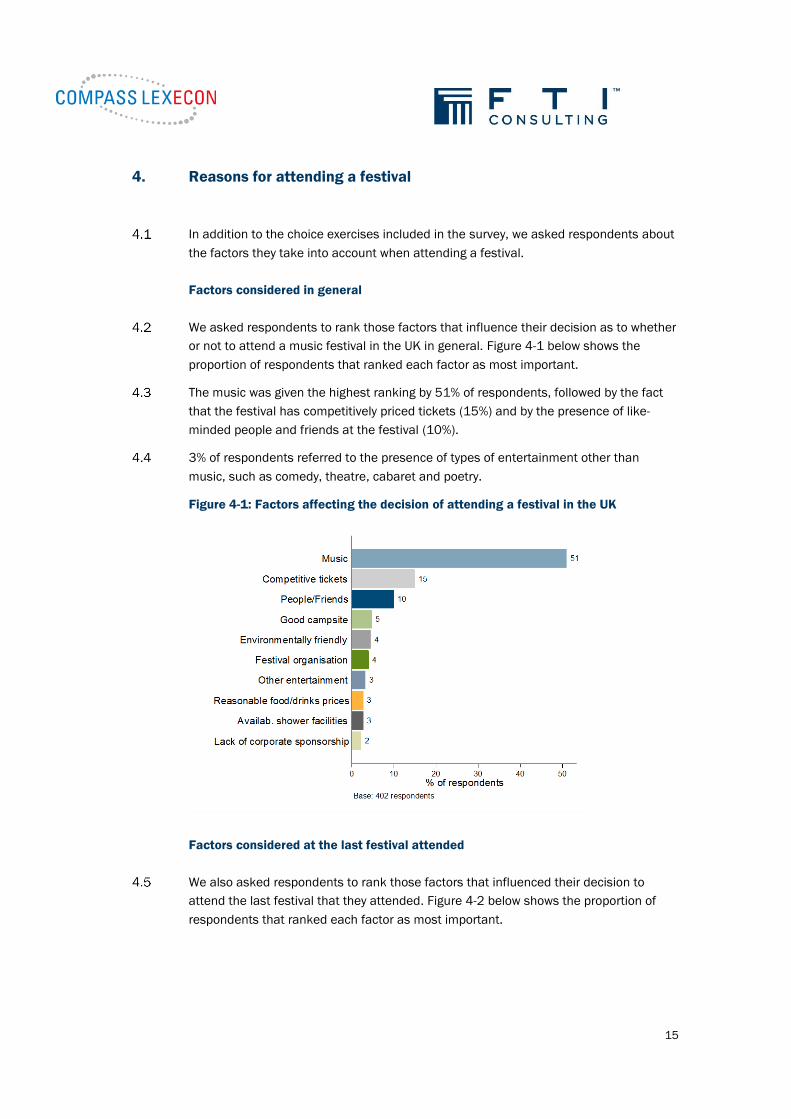
We asked respondents to rank those factors that influence their decision as to whether
or not to attend a music festival in the UK in general. Figure 4-1 below shows the
proportion of respondents that ranked each factor as most important.
The music was given the highest ranking by 51% of respondents, followed by the fact
that the festival has competitively priced tickets (15%) and by the presence of like-
minded people and friends at the festival (10%).
3% of respondents referred to the presence of types of entertainment other than
music, such as comedy, theatre, cabaret and poetry.
Figure 4-1: Factors affecting the decision of attending a festival in the UK
Factors considered at the last festival attended
We also asked respondents to rank those factors that influenced their decision to
attend the last festival that they attended. Figure 4-2 below shows the proportion of
respondents that ranked each factor as most important.

16
As in the previous case, we find that more than half of respondents indicated that the
music was the most important factor in their decision (54%). The second most
important factor was a “Social & Relaxation” component (e.g. spend time with friends,
escape from normal life, to reminiscence), but only 23% of respondents indicated it as
important. The third most important factor was to “Experience something new” (8%).
4% of respondents referred to the presence of types of entertainment other than
music.
Figure 4-2: Factors affecting the decision of attending the last festival in the UK
Summary
The results of the survey indicate that the music is the key factor when attending a
festival in the UK, while the availability of other entertainment activities was of limited
importance.
1
2
4
7
8
23
54
0 20 40 60
% of respondents
Ent. children
Other reasons
Other entertainment
Support a cause
Experience smth new
Social & Relaxation
Music
Base: 402 respondents
17
Appendix 1
Econometric methodology
Introduction
A1.1 In order to compute the relative contribution of the composition and performance to
the value of a concert and festivals, as well as the relative contribution of the music
and other entertainment types to the value of a festival, we estimated UK consumers’
WTP for attending a concert and a festival using a stated preference (SP) method.
Within the SP family, we used a discrete choice experiment (DCE), a choice modelling
method. In this section, we provide a general description of DCEs and their application
to our work.
Discrete choice experiments
A1.2 According to Louviere et al. (2010), among the different SP methods, DCEs are the
most general and consistent with economic demand theory.4 DCEs are based on
random utility theory (“RUT”), which provides an explanation of the choice behaviour of
individuals. RUT assumes a stochastic decision process in which consumers are
assumed to choose one alternative out of a set of discrete alternatives that maximise
their utility. We approximate the random utility model using a mixed logit model.
Following Train (2009), the utility of person n from alternative j is specified as:5
𝑈𝑛𝑗 = 𝛽𝑛𝑥𝑛𝑗 + 휀𝑛𝑗
Where:
i. 𝑥𝑛𝑗 are observed variables (e.g. the type of songs, the type of performance, the
availability of other entertainment types, etc.) that relate to alternative j and
decision maker (survey respondent) n;
ii. 𝛽𝑛 is a vector of coefficients6 of these variables for person n representing that
4 Louviere, J.J., T.N., Terry and R.T. Carson (2010), Discrete choice experiments are not conjoint
analysis, Journal of Choice Modelling, 3(3), pp 57-72.
5 Train, K. (2009), Discrete Choice Methods with Simulation, Cambridge University Press, New
York, 2nd edition.
6 The coefficient of an attribute in the utility function is also known as the “partworth” of an
attribute.
18
person’s tastes; and
iii. 휀𝑛𝑗 is a random term that is an independently and identically distributed (iid)
extreme value.
A1.3 In a mixed logit model, the coefficients βn vary over decision makers in the population
with density f (β), which is a function of parameters θ that represent, for example, the
mean and covariance of the coefficients in the population. Unlike the more standard
logit model, mixed logit models provide a flexible specification to represent the
distribution of preferences in the population and, thus, to take into account the
heterogeneity among respondents’ tastes and to allow for unrestricted substitution
patterns (i.e. relaxing the independence from irrelevant alternatives assumption).
Mixed logit models require the specification of a distribution function for each of the
coefficients of the utility function that are assumed to be random.7 The higher a utility
function, the more value a consumer would attribute to a certain product. In most
applications, these distributions are normal or lognormal (the latter is useful when the
sign of the coefficient is the same for all individuals).8
Application to this case
A1.4 The estimation of the logit models requires information on decisions made by
individuals and the factors that can influence these decisions. We collect this
information through a survey that simulates purchasing decisions made by individuals.
Purchasing decisions consist of a choice made from a finite set of alternatives. As
explained below, in this particular case, each offering is defined by different attributes
such as they type of music being performed. Survey data simulates the choice process
(“choice experiment”); respondents are presented with a number of alternatives, each
one described by a different combination of attributes, and are asked to choose their
preferred alternative. The responses to this type of question allow us to understand
consumers’ WTP for a single attribute (such as the type of music being performed).
A1.5 In this case we have measured:
(1) the incremental value to consumers of compositions by reference to the
incremental value that they place upon the songs performed at the concert or
festival; and
7 Some of the coefficients can be fixed.
8 See, for example, Goett, A. A., K., Hudson and K., Train (2000), “Customers’ Choice Among Retail
Energy Suppliers: The Willingness-to-Pay for Service Attributes”, The Energy Journal, 21(4), 1-28.
19
(2) the incremental value to consumers of performances by reference to the
incremental value that they place upon the artists’ performances at the concert
and festival.
A1.6 We have estimated two utility functions: one reflects consumers’ utility from attending
a concert or a festival with different types of songs and artists’ performances; and the
other reflects consumers’ utility from attending a festival with different types of music
and other entertainment.
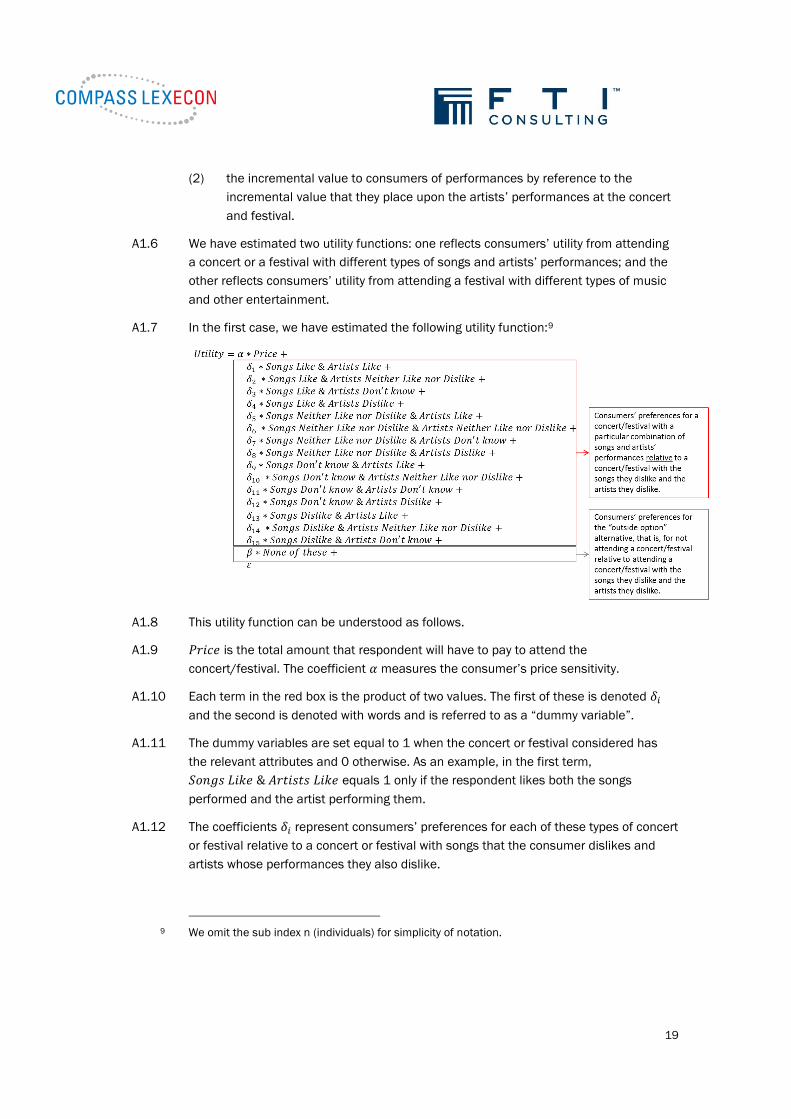
A1.7 In the first case, we have estimated the following utility function:9
A1.8 This utility function can be understood as follows.
A1.9 𝑃𝑟𝑖𝑐𝑒 is the total amount that respondent will have to pay to attend the
concert/festival. The coefficient 𝛼 measures the consumer’s price sensitivity.
A1.10 Each term in the red box is the product of two values. The first of these is denoted 𝛿𝑖
and the second is denoted with words and is referred to as a “dummy variable”.
A1.11 The dummy variables are set equal to 1 when the concert or festival considered has
the relevant attributes and 0 otherwise. As an example, in the first term,
𝑆𝑜𝑛𝑔𝑠 𝐿𝑖𝑘𝑒 & 𝐴𝑟𝑡𝑖𝑠𝑡𝑠 𝐿𝑖𝑘𝑒 equals 1 only if the respondent likes both the songs
performed and the artist performing them.
A1.12 The coefficients 𝛿𝑖 represent consumers’ preferences for each of these types of concert
or festival relative to a concert or festival with songs that the consumer dislikes and
artists whose performances they also dislike.
9 We omit the sub index n (individuals) for simplicity of notation.
20
A1.13 In the grey box, 𝑁𝑜𝑛𝑒 𝑜𝑓 𝑡ℎ𝑒𝑠𝑒 equals 1 if the respondent prefers not to select any of
the concerts or festivals presented. The coefficient 𝛽 represents individuals’
preferences for this option relative to the other alternatives presented.
A1.14 Finally, 휀 is a random term that is an iid extreme value.
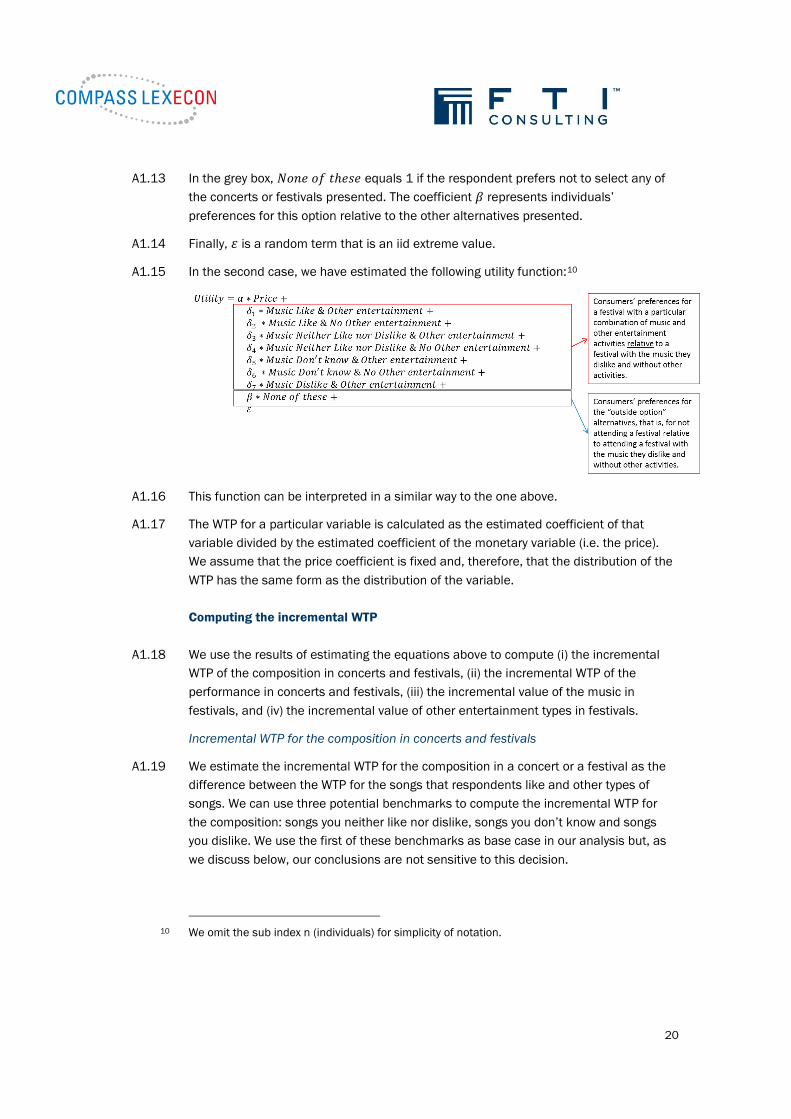
A1.15 In the second case, we have estimated the following utility function:10
A1.16 This function can be interpreted in a similar way to the one above.
A1.17 The WTP for a particular variable is calculated as the estimated coefficient of that
variable divided by the estimated coefficient of the monetary variable (i.e. the price).
We assume that the price coefficient is fixed and, therefore, that the distribution of the
WTP has the same form as the distribution of the variable.
Computing the incremental WTP
A1.18 We use the results of estimating the equations above to compute (i) the incremental
WTP of the composition in concerts and festivals, (ii) the incremental WTP of the
performance in concerts and festivals, (iii) the incremental value of the music in
festivals, and (iv) the incremental value of other entertainment types in festivals.
Incremental WTP for the composition in concerts and festivals
A1.19 We estimate the incremental WTP for the composition in a concert or a festival as the
difference between the WTP for the songs that respondents like and other types of
songs. We can use three potential benchmarks to compute the incremental WTP for
the composition: songs you neither like nor dislike, songs you don’t know and songs
you dislike. We use the first of these benchmarks as base case in our analysis but, as
we discuss below, our conclusions are not sensitive to this decision.
10 We omit the sub index n (individuals) for simplicity of notation.

21
A1.20 We estimate the incremental WTP for the composition using the estimated coefficients
of the utility function described in paragraph A1.7 as follows:
𝐼𝑛𝑐𝑟𝑒𝑚𝑒𝑛𝑡𝑎𝑙 𝑊𝑇𝑃 𝑐𝑜𝑚𝑝𝑜𝑠𝑖𝑡𝑖𝑜𝑛 =𝛿6 − 𝛿2
𝛼
A1.21 We estimate separately the utility function described in paragraph A1.7 for concerts
and festivals so that we estimate different incremental WTP for the composition for
concerts and festivals.
Incremental WTP for the performance in concerts and festivals
A1.22 We estimate the incremental WTP for the performance in a concert or a festival as the
difference between the WTP for the artists’ performances that respondents like and
other types of artists’ performances. In line with our approach for compositions, we use
as a base case benchmark the WTP for a concert or festival with artist performances
that respondents neither like nor dislike.
A1.23 We estimate the incremental WTP for the performance using the estimated coefficients
of the utility function described in paragraph A1.7 as follows:
𝐼𝑛𝑐𝑟𝑒𝑚𝑒𝑛𝑡𝑎𝑙 𝑊𝑇𝑃 𝑝𝑒𝑟𝑓𝑜𝑟𝑚𝑎𝑛𝑐𝑒 =𝛿6 − 𝛿5
𝛼
A1.24 We estimate separately the utility function described in paragraph A1.7 for concerts
and festivals so that we estimate different incremental WTP for the performances in
concerts and festivals.
Incremental WTP for the music in festivals
A1.25 We estimate the incremental WTP for the music at festivals as the difference between
the WTP for the music that respondents like and other types of music. In line with our
approach for compositions and the performance, we use as a base case benchmark
the WTP for a festival with the music that respondents neither like nor dislike.
A1.26 We estimate the incremental WTP for the music using the estimated coefficients of the
utility function described in paragraph A1.15 as follows:
𝐼𝑛𝑐𝑟𝑒𝑚𝑒𝑛𝑡𝑎𝑙 𝑊𝑇𝑃 𝑚𝑢𝑠𝑖𝑐 =𝛿4 − 𝛿2
𝛼
Incremental WTP for other entertainment types in festivals
A1.27 We estimate the incremental WTP for the presence of other entertainment activities
such as comedy, theatre, cabaret and poetry, as the difference between the WTP for a
festival with the music that respondents neither like nor dislike with other
entertainment types and a festival with the same music, but without other
entertainment types.

22
A1.28 We estimate the incremental WTP for other entertainment types using the estimated
coefficients of the utility function described in paragraph A1.15 as follows:
𝐼𝑛𝑐𝑟𝑒𝑚𝑒𝑛𝑡𝑎𝑙 𝑊𝑇𝑃 𝑜𝑡ℎ𝑒𝑟 𝑒𝑛𝑡𝑒𝑟𝑡𝑎𝑖𝑛𝑚𝑒𝑛𝑡 𝑡𝑦𝑝𝑒𝑠 =𝛿4 − 𝛿3
𝛼

23
Appendix 2
Survey sample and design
Introduction
A2.1 In this appendix we set out further information about the survey sample and choice
exercise design.
Sample description
A2.2 BDRC Continental undertook an online survey between Friday 15 August and Monday
18 August 2014. Responses were collected using an online panel of UK residents aged
16 years and above. The survey invite was randomly sent to a nationally representative
cross-section of the UK population, which is representative of the target population in
terms of age, gender and place of residence. 811 respondents took part in our survey.
Of these, 780 respondents had attended at least one concert in the last 12 months
and 402 respondents had attended at least one festival in the same period.
A2.3 Table A2-1 below shows the distribution of the final sample by age and gender across
the groups of respondents.
Table A2-1: Gender and age characteristics of the final sample
Criteria Respondents %
Gender
Male 396 49%
Female 415 51%
Total 811 100%
Age
16-17 years 19 2%
18-24 years 89 11%
25-34 years 155 19%
35-44 years 147 18%
45-54 years 153 19%
55-65 years 137 17%
66 or over 111 14%
Total 811 100%

24
Choice exercises
A2.4 As mentioned in paragraph 1.5 above, the survey consisted of two parts: an initial
questionnaire and a series of choice exercises. In the following subsections, we provide
further details of the exercises included in the survey.
First choice exercise
A2.5 In this exercise we asked respondents to assume that they had decided to attend a
concert at a medium-sized indoor concert venue where there will be a headline
performer and a support act.
A2.6 We also asked them to assume that:
(1) in total, the event will last for four hours;
(2) the venue has space for both seating and standing and has good quality sound
and stage lighting;
(3) there is a bar inside the venue, which sells various brands of beer, wine and
spirits as well as soft drinks and crisps; and
(4) the venue is within an hour’s travel from their home and there are adequate
transport links to and from the venue.
A2.7 Respondents were presented with four options: three different concerts and the
possibility not to choose any of these concerts. Each concert was characterised by the
following attributes:
(1) The songs performed: this indicates whether respondents know and like the
songs performed. The options respondents may be presented with were (i) songs
they like, (ii) songs they neither like nor dislike, (iii) songs they dislike, or
(iv) songs they don’t know (that is, they haven’t listened to these songs before).
(2) The artist’s live performance: this indicates whether respondents know and like
how the headline artist performs in a live show. The options respondents may be
presented with were (i) an artist’s performance they like, (ii) an artist’s
performance they neither like nor dislike, (iii) an artist’s performance they
dislike, or (iv) an artist’s performance they don’t know (that is, they don’t know
how the headline artist performs in a live show).
(3) The ticket price: the total price that respondents will have to pay to enter the
concert. We set six alternative prices: £5, £10, £20, £30, £50 and £80.
A2.8 In Table A2-2 we summarise the attributes and levels.
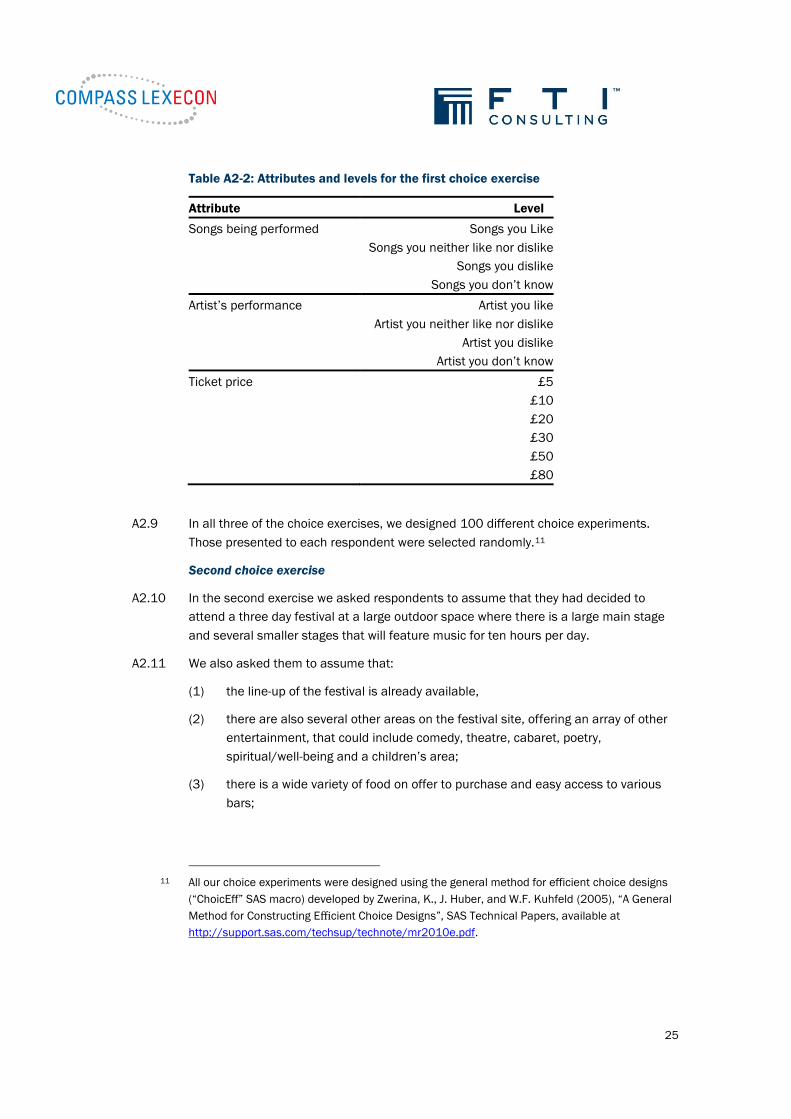
25
Table A2-2: Attributes and levels for the first choice exercise
Attribute Level
Songs being performed Songs you Like
Songs you neither like nor dislike
Songs you dislike
Songs you don’t know
Artist’s performance Artist you like
Artist you neither like nor dislike
Artist you dislike
Artist you don’t know
Ticket price £5
£10
£20
£30
£50
£80
A2.9 In all three of the choice exercises, we designed 100 different choice experiments.
Those presented to each respondent were selected randomly.11
Second choice exercise
A2.10 In the second exercise we asked respondents to assume that they had decided to
attend a three day festival at a large outdoor space where there is a large main stage
and several smaller stages that will feature music for ten hours per day.
A2.11 We also asked them to assume that:
(1) the line-up of the festival is already available,
(2) there are also several other areas on the festival site, offering an array of other
entertainment, that could include comedy, theatre, cabaret, poetry,
spiritual/well-being and a children’s area;
(3) there is a wide variety of food on offer to purchase and easy access to various
bars;
11 All our choice experiments were designed using the general method for efficient choice designs
(“ChoicEff” SAS macro) developed by Zwerina, K., J. Huber, and W.F. Kuhfeld (2005), “A General
Method for Constructing Efficient Choice Designs”, SAS Technical Papers, available at
http://support.sas.com/techsup/technote/mr2010e.pdf.
26
(4) respondents will be allocated a pitch for their tent in one of the designated
camping areas;
(5) the camping area has ample temporary toilet facilities, but there are no shower
facilities; and
(6) it will take four hours to travel to the venue.
A2.12 Respondents were presented with four options: three different festivals and the
possibility not to choose any of these concerts. Each festival was characterised by the
following attributes:
(1) The songs performed: this indicates whether respondents know and like the
songs performed. The options respondents may be presented with were (i) songs
they like, (ii) songs they neither like nor dislike, (iii) songs they dislike, or
(iv) songs they don’t know (that is, they haven’t listened to these songs before).
(2) The artists’ live performances: this indicates whether respondents know and like
how the artists perform in a live show. The options respondents may be
presented with were (i) artists’ performances they like, (ii) artists’ performances
they neither like nor dislike, (iii) artists’ performances they dislike, or (iv) artists’
performances they don’t know (that is, they don’t know how the artists perform
in a live show).
(3) The ticket price: the total price that respondents will have to pay to enter the
festival including camping. We set six alternative prices: £25, £60, £120, £180,
£270 and £400. The largest of these prices were intentionally selected to be
high relative to the usual pricing of festival tickets to ensure that there is
sufficient variability in the prices so that we could observe respondents’ price
sensitivity in their responses.
A2.13 In Table A2-3 we summarise the attributes and levels.
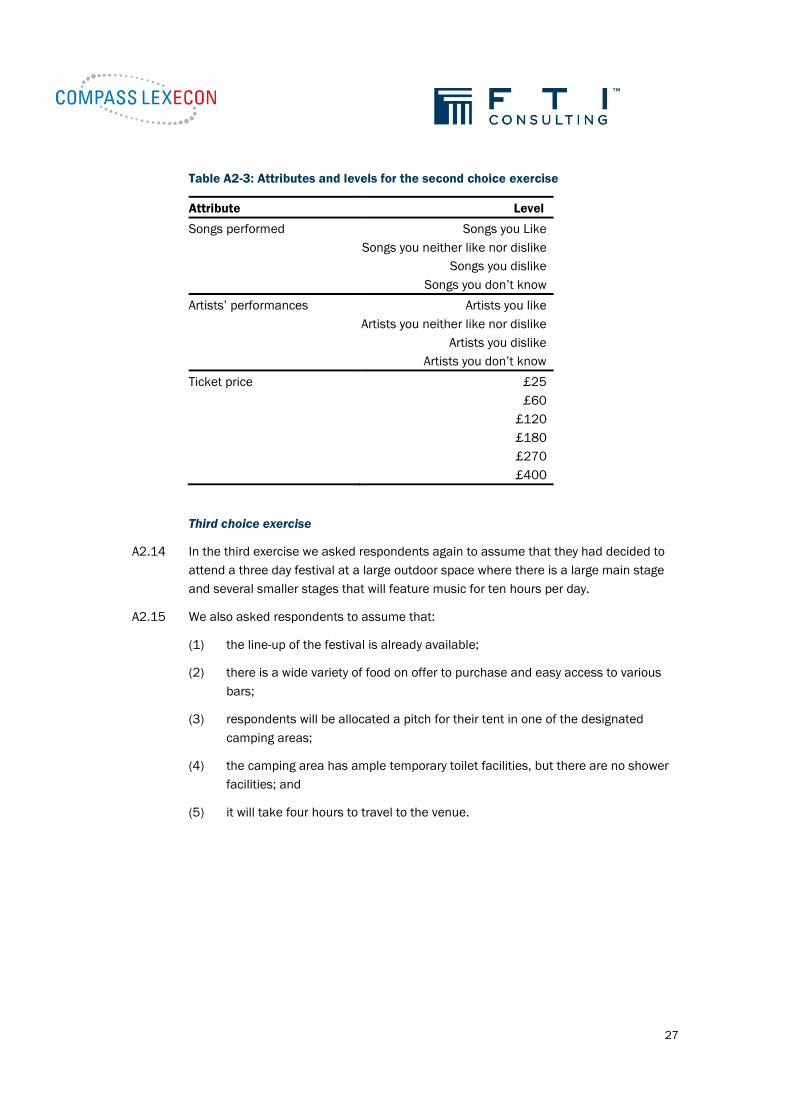
27
Table A2-3: Attributes and levels for the second choice exercise
Attribute Level
Songs performed Songs you Like
Songs you neither like nor dislike
Songs you dislike
Songs you don’t know
Artists’ performances Artists you like
Artists you neither like nor dislike
Artists you dislike
Artists you don’t know
Ticket price £25
£60
£120
£180
£270
£400
Third choice exercise
A2.14 In the third exercise we asked respondents again to assume that they had decided to
attend a three day festival at a large outdoor space where there is a large main stage
and several smaller stages that will feature music for ten hours per day.
A2.15 We also asked respondents to assume that:
(1) the line-up of the festival is already available;
(2) there is a wide variety of food on offer to purchase and easy access to various
bars;
(3) respondents will be allocated a pitch for their tent in one of the designated
camping areas;
(4) the camping area has ample temporary toilet facilities, but there are no shower
facilities; and
(5) it will take four hours to travel to the venue.
28
A2.16 Respondents were given a choice of four different options: three different festivals and
the possibility not to choose any of these concerts. Each festival was characterised by
the following attributes:
(1) The music performed: this indicates whether respondents know and like the
music performed (the music being the combination of the artists’ live
performance and the songs being performed). The options respondents may be
presented with were (i) music they like, (ii) music they neither like nor dislike, (iii)
music they dislike, or (iv) music they don’t know (that is, they haven’t listened to
these music before).
(2) Other entertainment types: this indicates whether there are also several other
areas on the festival site, offering an array of other entertainment, such as,
comedy, theatre, cabaret, poetry, spiritual/wellbeing or a children’s area.
(3) The ticket price: the total price that respondents will have to pay to enter the
festival including camping. We set six alternative prices: £25, £60, £120, £180,
£270 and £400.
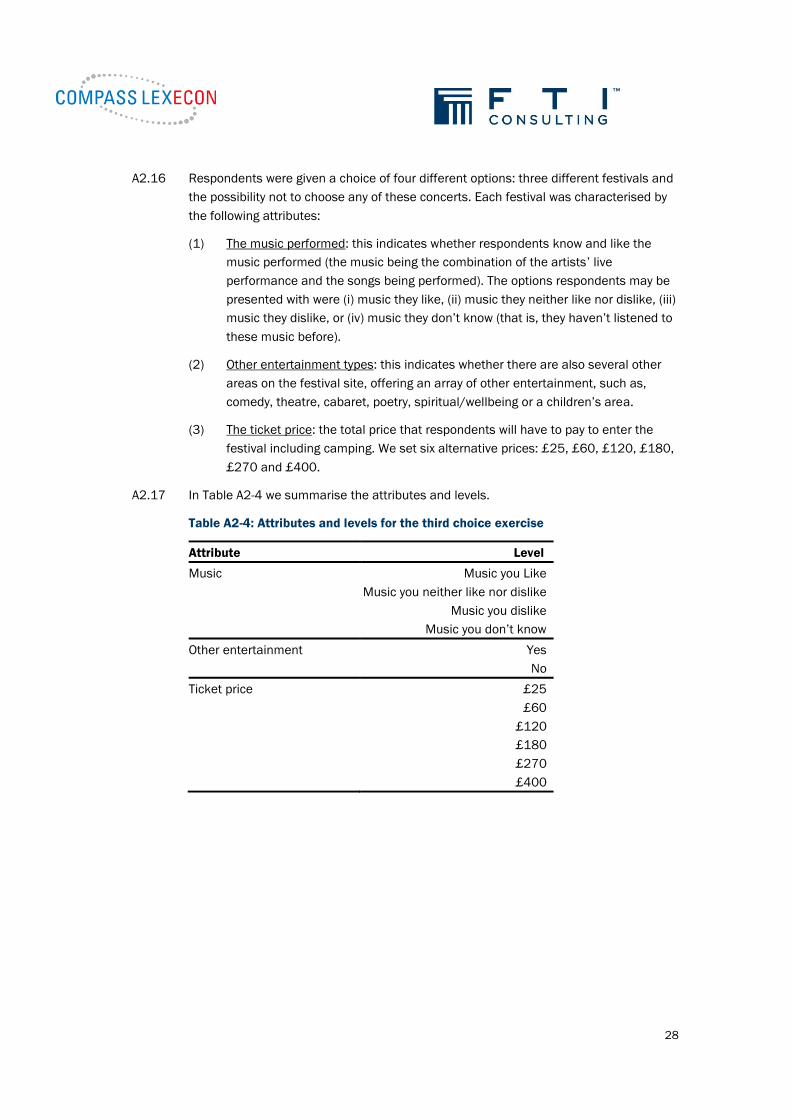
A2.17 In Table A2-4 we summarise the attributes and levels.
Table A2-4: Attributes and levels for the third choice exercise
Attribute Level
Music Music you Like
Music you neither like nor dislike
Music you dislike
Music you don’t know
Other entertainment Yes
No
Ticket price £25
£60
£120
£180
£270
£400
29
Appendix 3
Survey questions
A3.1 This appendix contains the script and questions used for the survey. The words shown
in coloured text are instructions to the survey company. The choice exercises are
ordered differently to how we have reported them in this report. “Exercise 1 –
Festivals” corresponds to Exercise 2 in this report. “Exercise 2 – Festivals” corresponds
to Exercise 3 in this report. “Exercise 1 – Concerts” corresponds to Exercise 1 in this
report.
We are undertaking a survey on consumers’ preferences for live music concerts and
festivals that include music in the UK. This includes any genre of live music, except for
classical music.
We would like to ask you about the features that are important to you when choosing to
attend these types of music events.
Please answer the questions so that they accurately reflect what you would choose in a
real situation.
Thank you for your help.
Screening Questions
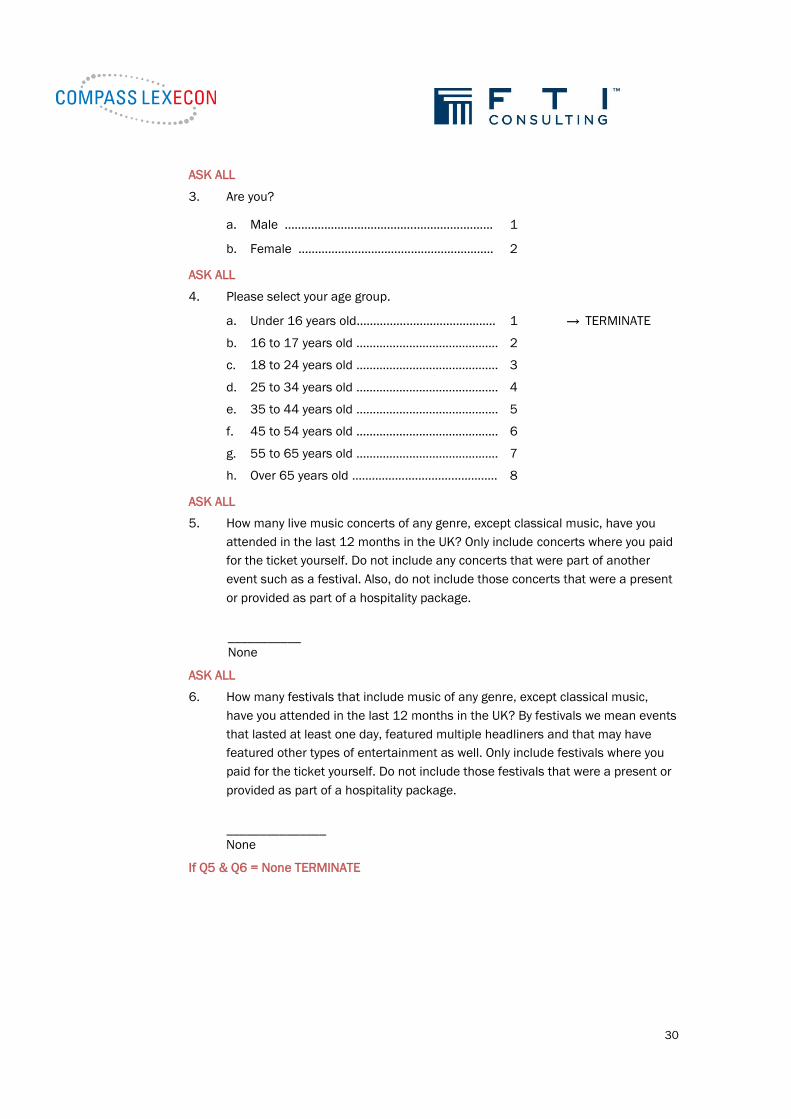
ASK ALL
1. Are you a UK resident?
a. Yes
b. No → TERMINATE
ASK ALL
2. Do you or any member of your family work for any of the following types of
industries?
a. Market Research ………………..……….…………… 1 → TERMINATE
b. Advertising ……………….……………………………… 2 → TERMINATE
c. Music industry (e.g. record label, music publishing, live music, music retail,
etc.) ..……....……………………………………….......… 3 → TERMINATE
d. None of the above ……………………………….…... 4 → CONTINUE
30
ASK ALL
3. Are you?
a. Male …………………………………….…….……….… 1
b. Female ………………………….……….……………… 2
ASK ALL
4. Please select your age group.
a. Under 16 years old………………..…….…………… 1 → TERMINATE
b. 16 to 17 years old ………….………………………… 2
c. 18 to 24 years old ………….………………………… 3
d. 25 to 34 years old ………….………………………… 4
e. 35 to 44 years old ………….………………………… 5
f. 45 to 54 years old ………….………………………… 6
g. 55 to 65 years old ………….………………………… 7
h. Over 65 years old ………….……………….………… 8
ASK ALL
5. How many live music concerts of any genre, except classical music, have you
attended in the last 12 months in the UK? Only include concerts where you paid
for the ticket yourself. Do not include any concerts that were part of another
event such as a festival. Also, do not include those concerts that were a present
or provided as part of a hospitality package.
___________
None
ASK ALL
6. How many festivals that include music of any genre, except classical music,
have you attended in the last 12 months in the UK? By festivals we mean events
that lasted at least one day, featured multiple headliners and that may have
featured other types of entertainment as well. Only include festivals where you
paid for the ticket yourself. Do not include those festivals that were a present or
provided as part of a hospitality package.
_______________
None
If Q5 & Q6 = None TERMINATE

31
Questions on festivals
ASK ALL (Q6 = 1+)
We are now going to ask you some questions about the festivals you have attended
over the past 12 months in the UK. When talking about “music festival” we refer to any
festival at which live music is performed but there may also be other entertainment. We
remind you that we are talking about any genre of live music, except for classical
music.
7. Of the <Insert number from Q6 e.g. 5> music festival(s) you have attended over
the past 12 months in the UK, in how many cases did you buy your ticket from
the primary ticketing market?
By primary ticketing market we mean getting the tickets directly from the
organiser - either directly or through a sales platform. This does not include
tickets purchased on the secondary market from people or organisations (such
as, Getmein.com, Viagogo.co.uk, Seatwave.com, Stubhub.co.uk, etc.) that sell
tickets originally obtained from the primary market.
a. 5
b. 4
c. 3
d. 2
e. 1
f. Did not buy any tickets through the primary ticketing market
g. Don’t know
ASK IF Q7 is NOT D/K or Did not buy any tickets through the primary ticketing market
8. Thinking about the <Insert number from Q7 e.g. 5> festivals for which you
bought tickets on the primary ticketing market, in how many cases did you pay a
booking fee in addition to the face value of your ticket?
a. 5
b. 4
c. 3
d. 2
e. 1
f. No cases
g. Don’t know
32
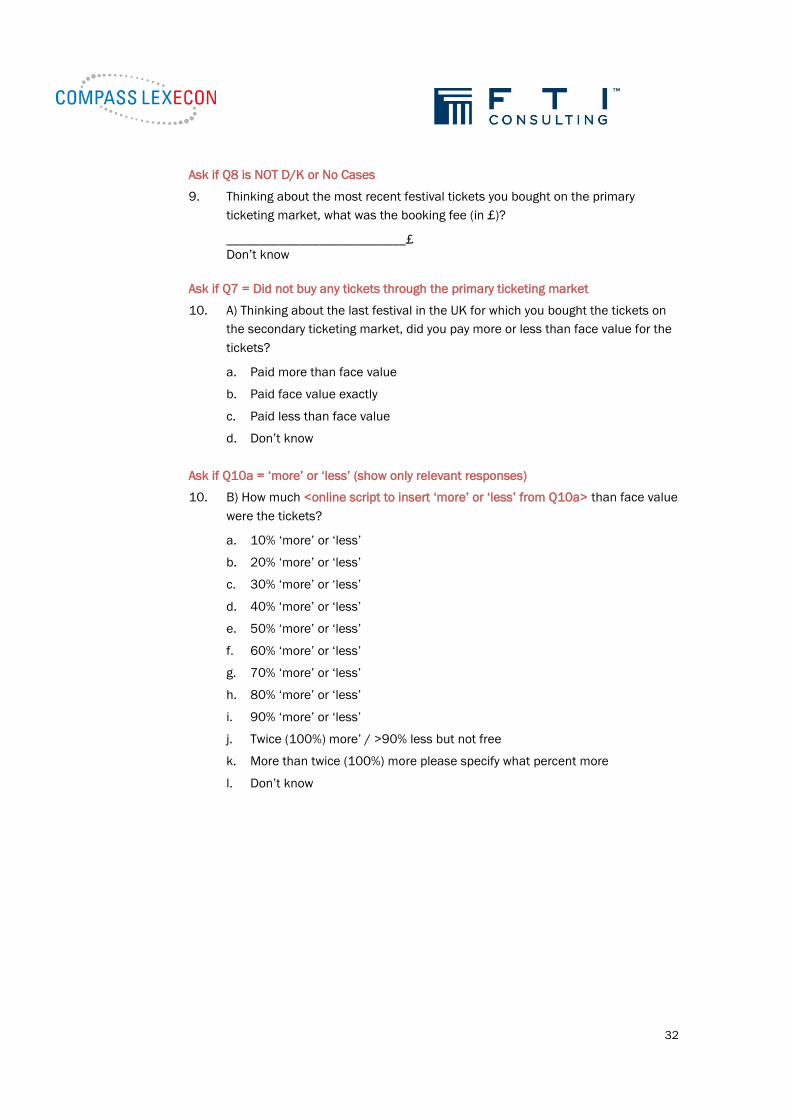
Ask if Q8 is NOT D/K or No Cases
9. Thinking about the most recent festival tickets you bought on the primary
ticketing market, what was the booking fee (in £)?
___________________________£
Don’t know
Ask if Q7 = Did not buy any tickets through the primary ticketing market
10. A) Thinking about the last festival in the UK for which you bought the tickets on
the secondary ticketing market, did you pay more or less than face value for the
tickets?
a. Paid more than face value
b. Paid face value exactly
c. Paid less than face value
d. Don’t know
Ask if Q10a = ‘more’ or ‘less’ (show only relevant responses)
10. B) How much <online script to insert ‘more’ or ‘less’ from Q10a> than face value
were the tickets?
a. 10% ‘more’ or ‘less’
b. 20% ‘more’ or ‘less’
c. 30% ‘more’ or ‘less’
d. 40% ‘more’ or ‘less’
e. 50% ‘more’ or ‘less’
f. 60% ‘more’ or ‘less’
g. 70% ‘more’ or ‘less’
h. 80% ‘more’ or ‘less’
i. 90% ‘more’ or ‘less’
j. Twice (100%) more’ / >90% less but not free
k. More than twice (100%) more please specify what percent more
l. Don’t know
33
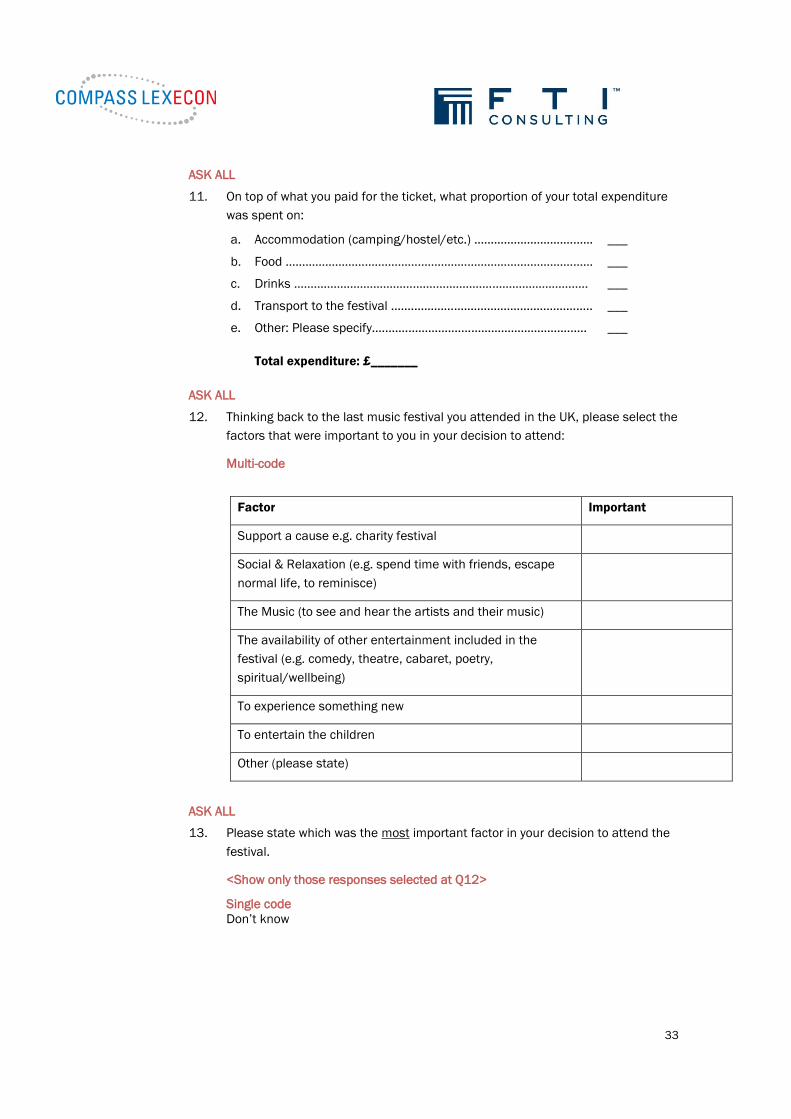
ASK ALL
11. On top of what you paid for the ticket, what proportion of your total expenditure
was spent on:
a. Accommodation (camping/hostel/etc.) ……………………………… ___
b. Food …………………………….……………………….……….………………… ___
c. Drinks ……………………………………...…………………………………….. ___
d. Transport to the festival ….…………………….………………………….. ___
e. Other: Please specify…..………………….……………………………….. ___
Total expenditure: £_______
ASK ALL
12. Thinking back to the last music festival you attended in the UK, please select the
factors that were important to you in your decision to attend:
Multi-code
Factor Important
Support a cause e.g. charity festival
Social & Relaxation (e.g. spend time with friends, escape
normal life, to reminisce)
The Music (to see and hear the artists and their music)
The availability of other entertainment included in the
festival (e.g. comedy, theatre, cabaret, poetry,
spiritual/wellbeing)
To experience something new
To entertain the children
Other (please state)
ASK ALL
13. Please state which was the most important factor in your decision to attend the
festival.
<Show only those responses selected at Q12>
Single code
Don’t know
34
ASK ALL
14. In the table below we have listed some factors that influence people’s decision
of whether or not to attend a music festival in the UK.
Please rank them in order of importance to you, with 1 being the Most Important
and 10 being the Least Important.
Factor Ranking
Like-minded people & friends will be there
Effectiveness of overall festival organisation
The Music (to see and hear the artists and their music)
Good campsite organisation
Competitively priced tickets
It is environmentally friendly
Availability of shower facilities
Reasonable food and drinks prices
Lack of corporate sponsorship
The availability of other entertainment included in the festival
(e.g. comedy, theatre, cabaret, poetry, spiritual/well-being and
children’s area)
<online scripting – FESTIVAL respondents (Q6 = 1+) will now see the two conjoint
exercises>
Exercise 1 - Festivals
We are going to show you a number of different scenarios that describe different
festivals. For each scenario, we are going to ask you to consider the events shown and
to choose your preferred one.
For the purposes of these exercises, please, assume that:
You are going to attend a three day festival at a large outdoor space.
There is a large main stage and several smaller stages. Each of the stages will
feature music for ten hours per day, throughout the event. The line-up of the festival
is already available.

35
There are also several other areas on the festival site, offering an array of other
entertainment. These would include: Comedy, Theatre, Cabaret, Poetry,
Spiritual/Well-being and a Children’s Area.
There is a wide variety of food on offer to purchase and easy access to various bars.
You will be allocated a pitch for your tent in one of the designated camping areas.
There are ample temporary toilet facilities, but there are no shower facilities.
It will take you four hours to travel to the venue.
The options shown are the only ones available to you.
When making your choice, please consider what choice you would make if you were
spending your own money; do not choose an option if you would not choose it in
reality.
The options shown in each exercise will be characterised by:
The songs being performed: this indicates whether you know and like the songs
being performed. In particular, whether (i) you like the songs, or (ii) you neither like
nor dislike them, or (iii) you dislike them or (iv) you just don’t know them (that is, you
haven’t listened to these songs before).
The artists’ live performance: this indicates whether you know and like how the
artists perform in a live show. In particular, whether (i) you like their live
performance, or (ii) you neither like nor dislike their live performance, or (iii) you
dislike their live performance or (iv) you just don’t know how the artists perform in a
live show.
The ticket price: the total price that you will have to pay to enter the festival
including camping.
In these exercises, the options shown are the only ones available so that if you want to
go to a festival you have to choose one of the alternatives shown.
You will always have an option called "None of these". If you select this option you are
indicating that you would prefer not to attend a festival on any of the terms offered.
Exercise 2 - Festivals
We want you once again to assume that you are going to attend a three day festival at
a large outdoor space. As in the previous case, we want you to assume that:
There is a large main stage and several smaller stages. Each of the stages will
feature music for ten hours per day, throughout the event. The line-up of the festival
is already available.

36
There is a wide variety of food on offer to purchase and easy access to various bars.
You will be allocated a pitch for your tent in one of the designated camping areas.
There are ample temporary toilet facilities, but there are no shower facilities.
It will take you four hours to travel to the venue.
The options shown are the only ones available to you.
When making your choice, please consider what choice you would make if you were
spending your own money; do not choose an option if you would not choose it in
reality.
Unlike the previous case, unless indicated in the scenario, there are no other
entertainment activities.
The options shown in each exercise will be characterised by:
The music: this indicates whether you know and like the music (being the
combination of both the artists’ live performance and the songs being performed).
In particular, whether (i) you like the music, or (ii) you neither like nor dislike it, or
(iii) you dislike it or (iv) you just don’t know it.
Other entertainment activities: this indicates whether there are also several other
areas on the festival site, offering an array of other entertainment, such as, comedy,
theatre, cabaret, poetry, spiritual/wellbeing and a children’s area.
The ticket price: the total price that you will have to pay to enter the festival
including camping.
In these exercises, the options shown are the only ones available so that if you want to
go to a festival you have to choose one of the alternatives shown.
You will always have an option called "None of these". If you select this option you are
indicating that you would prefer not to attend a festival on any of the terms offered.
Questions on concerts
ASK ALL (Q5 = AT LEAST ONE CONCERT)
We are now going to ask you some questions about the concerts you have attended
over the past 12 months in the UK. We remind you that we are talking about any genre
of live music, except for classical music.
37
15. Of the <Insert number from Q5 e.g. 5> concert(s) you have attended over the
past 12 months in the UK, in how many cases did you buy your ticket from the
primary ticketing market?
By primary ticketing market we mean getting the tickets directly from the
organiser - either directly or through a sales platform. This does not include
tickets purchased on the secondary market from people or organisations (such
as, Getmein.com, Viagogo.co.uk, Seatwave.com, Stubhub.co.uk, etc.) that sell
tickets originally obtained from the primary market.
a. 5
b. 4
c. 3
d. 2
e. 1
f. Did not buy any tickets through the primary ticketing market
g. Don’t know
ASK ALL
16. Thinking about the <Insert number from Q15 e.g. 5> concert(s) for which you
bought tickets on the primary ticketing market, in what proportion of cases did
you pay a booking fee in addition to the face value of your ticket?
<Script to show number of concerts attended at Q5, example below>
a. 5
b. 4
c. 3
d. 2
e. 1
f. No cases
g. Don’t know
Ask if Q16 is NOT D/K or No Cases
17. Thinking about the most recent concert tickets you bought on the primary
ticketing market, what was the booking fee (in £)?
__________________________£
Don’t know
38
Ask if Q15 = Did not buy any tickets through the primary ticketing market
18. A) Thinking about the last concert in the UK for which you bought the tickets on
the secondary ticketing market, did you pay more or less than face value for the
tickets?
a. Paid more than face value
b. Paid face value exactly
c. Paid less than face value
d. Don’t know
Ask if Q19a = ‘more’ or ‘less’
18. B) How much <online script to insert ‘more’ or ‘less’ from Q19a> than face value
were the tickets?
a. 10% ‘more’ or ‘less’
b. 20% ‘more’ or ‘less’
c. 30% ‘more’ or ‘less’
d. 40% ‘more’ or ‘less’
e. 50% ‘more’ or ‘less’
f. 60% ‘more’ or ‘less’
g. 70% ‘more’ or ‘less’
h. 80% ‘more’ or ‘less’
i. 90% ‘more’ or ‘less’
j. Twice (100%) more’ / >90% less but not free
k. More than twice (100%) more please specify what percent more
l. Don’t know
<online scripting – CONCERT respondents (Q5 = 1+) will now see the one conjoint
exercise>
Exercise 1 - Concerts
We are going to show you a number of different scenarios that describe different
concerts of any type other than classical music. For each scenario, we are going to ask
you to consider the events shown and to choose your preferred one.
For the purposes of these exercises, please, assume that:
You are going to attend a concert at a medium sized, indoor concert venue.
There will be a headline performer and one support act. In total, the event will last
for four hours.

39
The venue has space for both seating and standing and has good quality sound and
stage lighting. There is a bar inside the venue, which sells various brands of beer,
wine and spirits as well as soft drinks and crisps.
The venue is within an hour’s travel from your home and there are adequate
transport links to and from the venue.
The options shown are the only ones available to you.
When making your choice, please consider what choice you would make if you were
spending your own money; do not choose an option if you would not choose it in
reality.
The options shown in each exercise will be characterised by:
The songs being performed: this indicates whether you know and like the songs
being performed. In particular, whether (i) you like the songs, or (ii) you neither like
nor dislike them, or (iii) you dislike them or (iv) you just don’t know them (that is, you
haven’t listened to these songs before).
The artist’s live performance: this indicates whether you know and like how the
headline artist performs in a live show. In particular, whether (i) you like their live
performance, or (ii) you neither like nor dislike their live performance, or (iii) you
dislike their live performance or (iv) you just don’t know how the headline artist
performs in a live show.
The ticket price: the total price that you will have to pay to enter the concert.
In these exercises, the options shown are the only ones available so that if you want to
go to a concert you have to choose one of the alternatives shown.
You will always have an option called "None of these". If you select this option you are
indicating that you would prefer not to attend a concert on any of the terms offered.

40
Socio-demographic questions
ASK ALL
19. Which region do you live in?
a. Channel Islands
b. East
c. East Midlands
d. London
e. North East
f. North West
g. Northern Ireland
h. Scotland
i. South East
j. South West
k. Wales
l. West Midlands
m. Yorkshire & Humberside
ASK ALL
20. What is your current working status?
a. Paid employment (30+ hours a week)
b. Paid employment (8-29 hours a week)
c. Paid employment (less than 8 hours a week)
d. Self-employed
e. Retired
f. Studying full time
g. Look after the house
h. Unemployed
i. Other
j. Prefer not to say

41
ASK ALL
21. In which of the following income bands does your gross annual household
income fall?
a. Up to £5,000
b. £5,000-£9,999
c. £10,000-£14,999
d. £15,000-£19,999
e. £20,000-£24,999
f. £25,000-£29,999
g. £30,000-£34,999
h. £35,000-£39,999
i. £40,000-£49,999
j. £50,000-£74,999
k. £75,000 and above
l. Prefer not to say
42
Appendix 4
Estimation results
First exercise: relative value of compositions and performances at concerts
A4.1 In Table A4-1 we set out the estimated coefficients of the equation described in
paragraph A1.7 based on the responses to the first choice exercise using a mixed logit
model. The mixed logit model results have been obtained by assuming that some
coefficients are normally distributed in the population. In particular, we assume that all
non-price coefficients of the utility function are normally distributed.12 The price
coefficient is assumed to be fixed rather than varying over respondents. Under this
specification, the distribution of the WTP for an attribute has the same form as the
distribution of the attribute’s coefficient, which varies over respondents.13
A4.2 In the table below we show the mean and the standard deviation of the estimated
distribution for those coefficients that are assumed to be normally distributed and the
point estimate for the coefficient that is assumed to be fixed (“Ticket price”). The stars
next to each coefficient indicate that the coefficient is statistically significant, i.e., that it
is statistically different from zero. A mean coefficient that is not statistically significant
is said to be on average statistically equal to the omitted combination (in this case
“Songs you dislike” and “Artist you dislike”). A standard deviation coefficient that is not
statistically significant implies that all consumers derive the same utility from this
attribute, i.e. that the utility does not change across respondents.
12 Assuming that the coefficient of a particular attribute is normally distributed implies that some
individuals place a positive value on that attribute while other individuals place a negative value
on it.
13 For further discussion see Goett et al. (2000) and Sonnier, G. and K., Train (2005), “Mixed Logit
with Bounded Distributions of Correlated Partworths”, Ch. 7, pp. 117-134, in Applications of
Simulation Methods in Environmental Resource Economics, A. Alberini and R. Scarpa, eds.,
Springer Publisher: Dordrecht, The Netherlands.
43
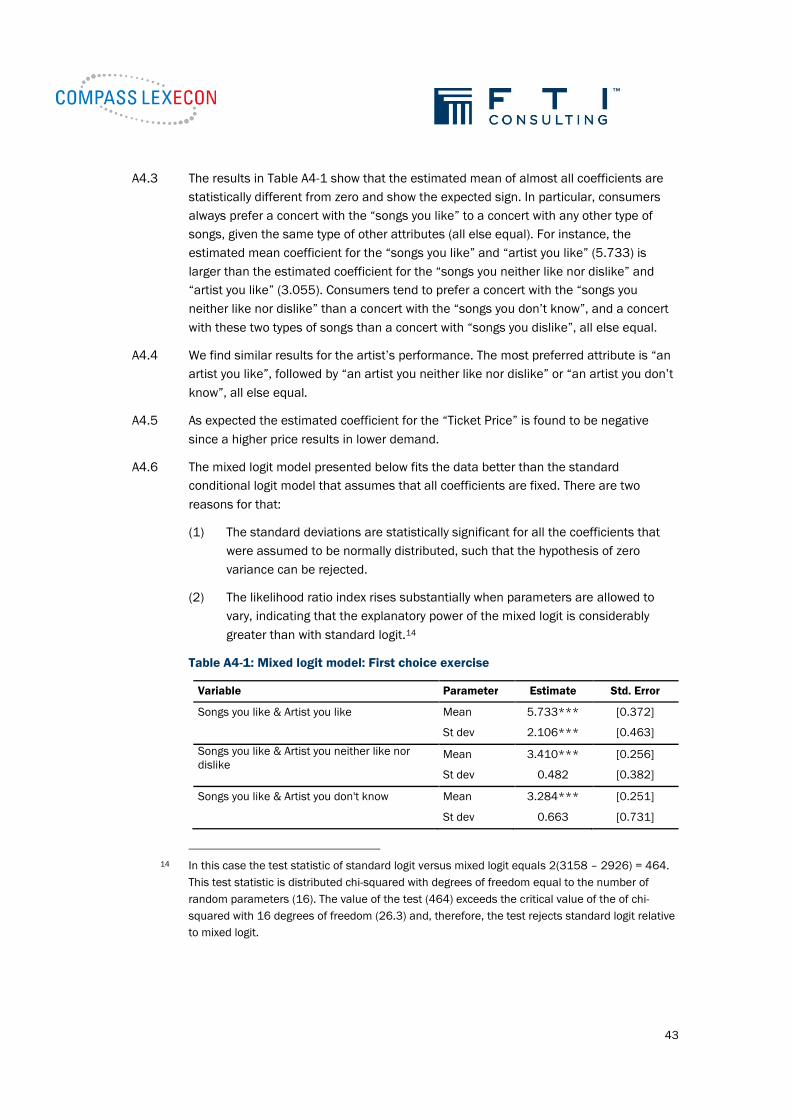
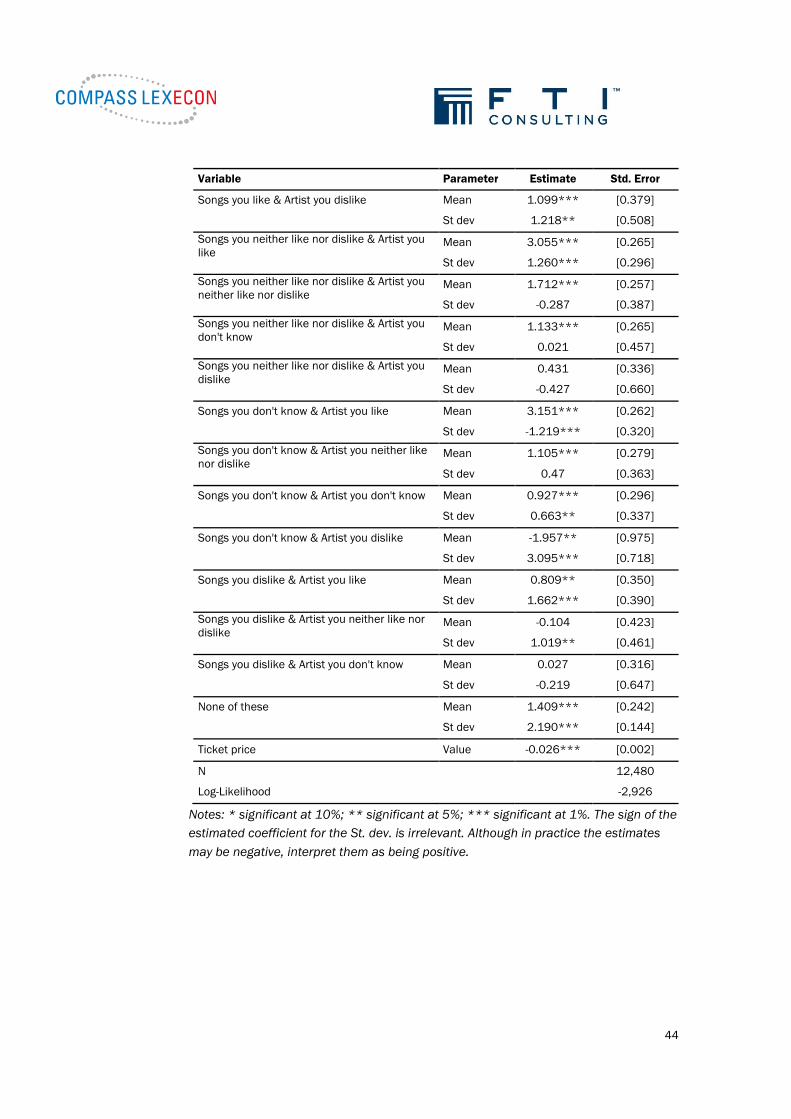
A4.3 The results in Table A4-1 show that the estimated mean of almost all coefficients are
statistically different from zero and show the expected sign. In particular, consumers
always prefer a concert with the “songs you like” to a concert with any other type of
songs, given the same type of other attributes (all else equal). For instance, the
estimated mean coefficient for the “songs you like” and “artist you like” (5.733) is
larger than the estimated coefficient for the “songs you neither like nor dislike” and
“artist you like” (3.055). Consumers tend to prefer a concert with the “songs you
neither like nor dislike” than a concert with the “songs you don’t know”, and a concert
with these two types of songs than a concert with “songs you dislike”, all else equal.
A4.4 We find similar results for the artist’s performance. The most preferred attribute is “an
artist you like”, followed by “an artist you neither like nor dislike” or “an artist you don’t
know”, all else equal.
A4.5 As expected the estimated coefficient for the “Ticket Price” is found to be negative
since a higher price results in lower demand.
A4.6 The mixed logit model presented below fits the data better than the standard
conditional logit model that assumes that all coefficients are fixed. There are two
reasons for that:
(1) The standard deviations are statistically significant for all the coefficients that
were assumed to be normally distributed, such that the hypothesis of zero
variance can be rejected.
(2) The likelihood ratio index rises substantially when parameters are allowed to
vary, indicating that the explanatory power of the mixed logit is considerably
greater than with standard logit.14
Table A4-1: Mixed logit model: First choice exercise
Variable Parameter Estimate Std. Error
Songs you like & Artist you like Mean 5.733*** [0.372]
St dev 2.106*** [0.463]
Songs you like & Artist you neither like nor
dislike
Mean 3.410*** [0.256]
St dev 0.482 [0.382]
Songs you like & Artist you don't know Mean 3.284*** [0.251]
St dev 0.663 [0.731]
14 In this case the test statistic of standard logit versus mixed logit equals 2(3158 – 2926) = 464.
This test statistic is distributed chi-squared with degrees of freedom equal to the number of
random parameters (16). The value of the test (464) exceeds the critical value of the of chi-
squared with 16 degrees of freedom (26.3) and, therefore, the test rejects standard logit relative
to mixed logit.
44
Variable Parameter Estimate Std. Error
Songs you like & Artist you dislike Mean 1.099*** [0.379]
St dev 1.218** [0.508]
Songs you neither like nor dislike & Artist you
like
Mean 3.055*** [0.265]
St dev 1.260*** [0.296]
Songs you neither like nor dislike & Artist you
neither like nor dislike
Mean 1.712*** [0.257]
St dev -0.287 [0.387]
Songs you neither like nor dislike & Artist you
don't know
Mean 1.133*** [0.265]
St dev 0.021 [0.457]
Songs you neither like nor dislike & Artist you
dislike
Mean 0.431 [0.336]
St dev -0.427 [0.660]
Songs you don't know & Artist you like Mean 3.151*** [0.262]
St dev -1.219*** [0.320]
Songs you don't know & Artist you neither like
nor dislike
Mean 1.105*** [0.279]
St dev 0.47 [0.363]
Songs you don't know & Artist you don't know Mean 0.927*** [0.296]
St dev 0.663** [0.337]
Songs you don't know & Artist you dislike Mean -1.957** [0.975]
St dev 3.095*** [0.718]
Songs you dislike & Artist you like Mean 0.809** [0.350]
St dev 1.662*** [0.390]
Songs you dislike & Artist you neither like nor
dislike
Mean -0.104 [0.423]
St dev 1.019** [0.461]
Songs you dislike & Artist you don't know Mean 0.027 [0.316]
St dev -0.219 [0.647]
None of these Mean 1.409*** [0.242]
St dev 2.190*** [0.144]
Ticket price Value -0.026*** [0.002]
N 12,480
Log-Likelihood -2,926
Notes: * significant at 10%; ** significant at 5%; *** significant at 1%. The sign of the
estimated coefficient for the St. dev. is irrelevant. Although in practice the estimates
may be negative, interpret them as being positive.

45
Second exercise: relative value of compositions and performances at festivals
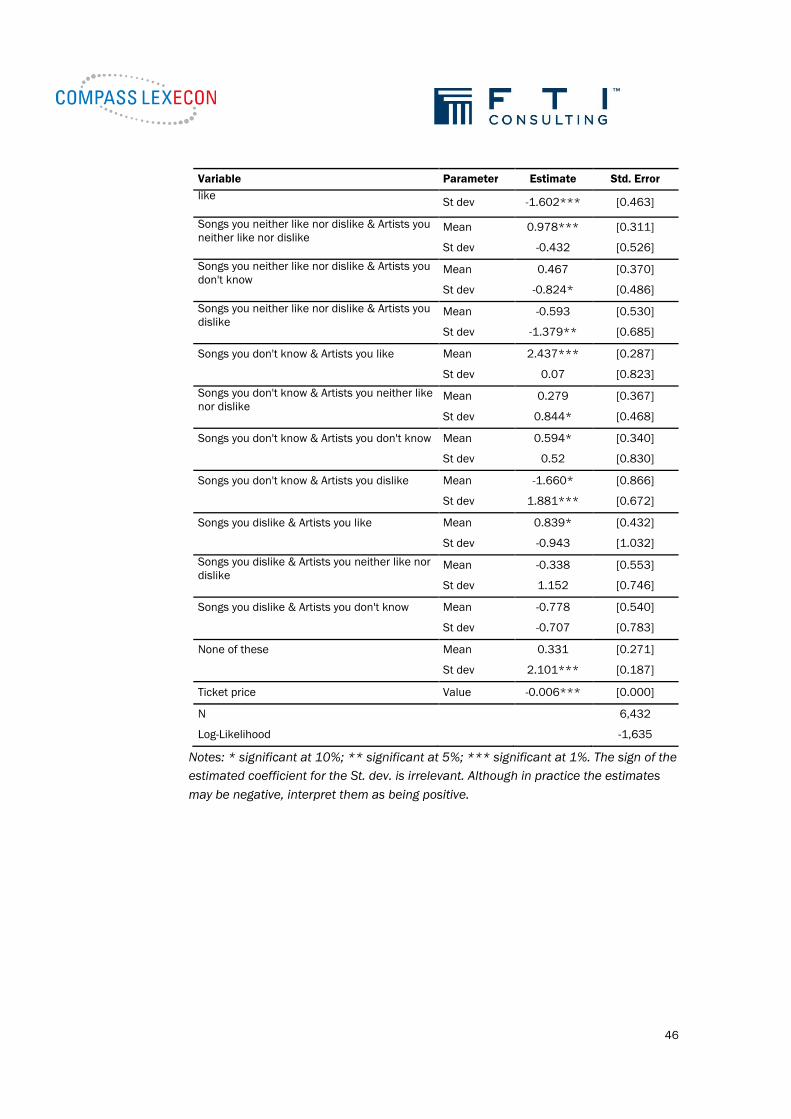
A4.7 In Table A4-2 we set out the estimated coefficients of the equation described in
paragraph A1.7 based on the responses to the second choice exercise using a mixed
logit model. As with the first choice exercise, the mixed logit model results have been
obtained by assuming that that all non-price coefficients of the utility function are
normally distributed and the price coefficient is assumed to be fixed.
A4.8 Similarly to what we find for the first choice exercise, almost all coefficients are
statistically significant and show the expected sign.
A4.9 Regarding the songs performed, consumers always prefer a festival with the “songs you
like” compared to a festival with any other type of songs. All else equal, consumers
either prefer a festival with the “songs you neither like nor dislike” to the “songs you
don’t know” or are indifferent between the two. Finally, they prefer a festival with the
“songs you neither like nor dislike” or the “songs you don’t know” to a festival with the
“songs you dislike”.
A4.10 Regarding the artists’ performances, the most preferred attribute is “artists you like”,
followed by “artists you neither like nor dislike” or “artists you don’t know”, all else
equal.
A4.11 The estimated price coefficient is negative as expected.
Table A4-2: Mixed logit model: Second choice exercise15
Variable Parameter Estimate Std. Error
Songs you like & Artists you like Mean 3.515*** [0.316]
St dev -1.409** [0.551]
Songs you like & Artists you neither like nor
dislike
Mean 2.070*** [0.327]
St dev 1.977*** [0.430]
Songs you like & Artists you don't know Mean 2.328*** [0.292]
St dev 0.764* [0.414]
Songs you like & Artists you dislike Mean 0.827** [0.368]
St dev 1.032* [0.529]
Songs you neither like nor dislike & Artists you Mean 2.159*** [0.314]
15 As in the first choice exercise, the likelihood ratio index indicates that the explanatory power of
the mixed logit is greater than with standard logit. In particular, the test statistic of standard logit
versus mixed logit is equal to 2(1749 – 1635) = 228. This test statistic is distributed chi-squared
with degrees of freedom equal to the number of random parameters (16). The value of the test
(228) exceeds the critical value of the of chi-squared with 16 degrees of freedom (26.3) and,
therefore, the test rejects standard logit relative to mixed logit.
46
Variable Parameter Estimate Std. Error
like
St dev -1.602*** [0.463]
Songs you neither like nor dislike & Artists you
neither like nor dislike
Mean 0.978*** [0.311]
St dev -0.432 [0.526]
Songs you neither like nor dislike & Artists you
don't know
Mean 0.467 [0.370]
St dev -0.824* [0.486]
Songs you neither like nor dislike & Artists you
dislike
Mean -0.593 [0.530]
St dev -1.379** [0.685]
Songs you don't know & Artists you like Mean 2.437*** [0.287]
St dev 0.07 [0.823]
Songs you don't know & Artists you neither like
nor dislike
Mean 0.279 [0.367]
St dev 0.844* [0.468]
Songs you don't know & Artists you don't know Mean 0.594* [0.340]
St dev 0.52 [0.830]
Songs you don't know & Artists you dislike Mean -1.660* [0.866]
St dev 1.881*** [0.672]
Songs you dislike & Artists you like Mean 0.839* [0.432]
St dev -0.943 [1.032]
Songs you dislike & Artists you neither like nor
dislike
Mean -0.338 [0.553]
St dev 1.152 [0.746]
Songs you dislike & Artists you don't know Mean -0.778 [0.540]
St dev -0.707 [0.783]
None of these Mean 0.331 [0.271]
St dev 2.101*** [0.187]
Ticket price Value -0.006*** [0.000]
N 6,432
Log-Likelihood -1,635
Notes: * significant at 10%; ** significant at 5%; *** significant at 1%. The sign of the
estimated coefficient for the St. dev. is irrelevant. Although in practice the estimates
may be negative, interpret them as being positive.

47
Third exercise: relative value of music and other entertainment at festivals
A4.12 In Table A4-3 we set out the estimated coefficients of the equation described in
paragraph A1.15 based on the responses to the third choice exercise using a mixed
logit model. As with the previous choice exercises, the mixed logit model results have
been obtained by assuming that that all non-price coefficients of the utility function are
normally distributed and the price coefficient is assumed to be fixed.
A4.13 Almost all coefficients are statistically significant and show the expected sign. We find
that consumers always prefer a festival with the “music you like” than a festival with
any other type of music, all else equal. Consumers also prefer a festival with the “music
you neither like nor dislike” than a festival with the “music you don’t know” and any of
these two types of festivals than a festival with the “music you dislike”, all else equal.
A4.14 We also find that, given a particular type of music, consumers prefer a festival with
“other entertainment” than a festival without “other entertainment”. The exception to
this is when the music is the “music you dislike”, in which case having “other
entertainment” does not change consumers preferences. The estimated coefficients
show that respondents are not willing to pay to go to such a festival.

48
Table A4-3: Mixed logit model: Third choice exercise16
Variable Parameter Estimate Std. Error
Music you like & Other entertainment Mean 4.225*** [0.268]
St dev 1.360*** [0.316]
Music you like & No other entertainment Mean 3.538*** [0.242]
St dev 0.233 [0.408]
Music you neither like nor dislike & Other
entertainment
Mean 1.994*** [0.247]
St dev 0.832*** [0.318]
Music you neither like nor dislike & No other
entertainment Mean 1.155*** [0.281]
St dev 1.022** [0.424]
Music you don't know & Other entertainment Mean 1.646*** [0.256]
St dev -0.815** [0.403]
Music you don't know & No other
entertainment
Mean 0.462 [0.373]
St dev 1.272*** [0.478]
Music you dislike & Other entertainment Mean -0.988 [0.660]
St dev 2.317*** [0.626]
None of these Mean 0.636*** [0.234]
St dev 1.888*** [0.175]
Ticket price Value -0.008*** [0.001]
N 6,432
Log-Likelihood -1,510
Notes: * significant at 10%; ** significant at 5%; *** significant at 1%. The sign of the
estimated coefficient for the St. dev. is irrelevant. Although in practice the estimates
may be negative, interpret them as being positive.
16 As in the previous choice exercises, the likelihood ratio index indicates that the explanatory
power of the mixed logit is greater than with standard logit. In particular, the test statistic of
standard logit versus mixed logit is equal to 2(1607 – 1510) = 194. This test statistic is
distributed chi-squared with degrees of freedom equal to the number of random parameters (8).
The value of the test (194) exceeds the critical value of the of chi-squared with 8 degrees of
freedom (15.51) and, therefore, the test rejects standard logit relative to mixed logit.
49
Appendix 5
Relative value calculations
A5.1 In this appendix we provide additional details on the WTP computed for each attribute
and the relative valuations of songs and performances in concerts and festivals and
the relative valuation of music and other entertainment types in festivals.
Potential baselines
As explained in paragraph 1.9, we estimate the incremental WTP for a particular
attribute in a concert or festival as the difference between the WTP for a concert or
festival with the songs/performance/music that respondents like and the WTP for the
same concert or festival but with other types of songs/performance/music. Thus, the
incremental WTP for an attribute depends on the baseline used as a reference. Table
A5-1 below shows all the potential baselines that could be used to calculate the
incremental WTP for the composition and for the performance in concerts or festivals.
We could calculate the incremental WTP for the composition by comparing the WTP in
scenario A, B, C or D with any other scenario in the same column (for instance, scenario
B with scenario F). Similarly, we could calculate the incremental WTP for the
performance by comparing the WTP in scenario A, E, I or M with any other scenario in
the same row (for instance, scenario E and scenario F).
For the purposes of our analysis a baseline is a valid one if the WTP for attending a
concert or festival of that level of liking is positive.17 Otherwise, we would overestimate
the value of the attribute. For simplicity of exposition, in our main calculations we used
as a baseline the songs/artist/music respondents neither like nor dislike, when the
WTP is positive in all cases. As we discuss below, we find qualitatively similar results
when we use any other benchmarks with a positive WTP.
17 A negative WTP for a concert or a festival would mean that individuals do not want to attend that
concert or that festival and, actually, that they would only attend if they got some money in
exchange.
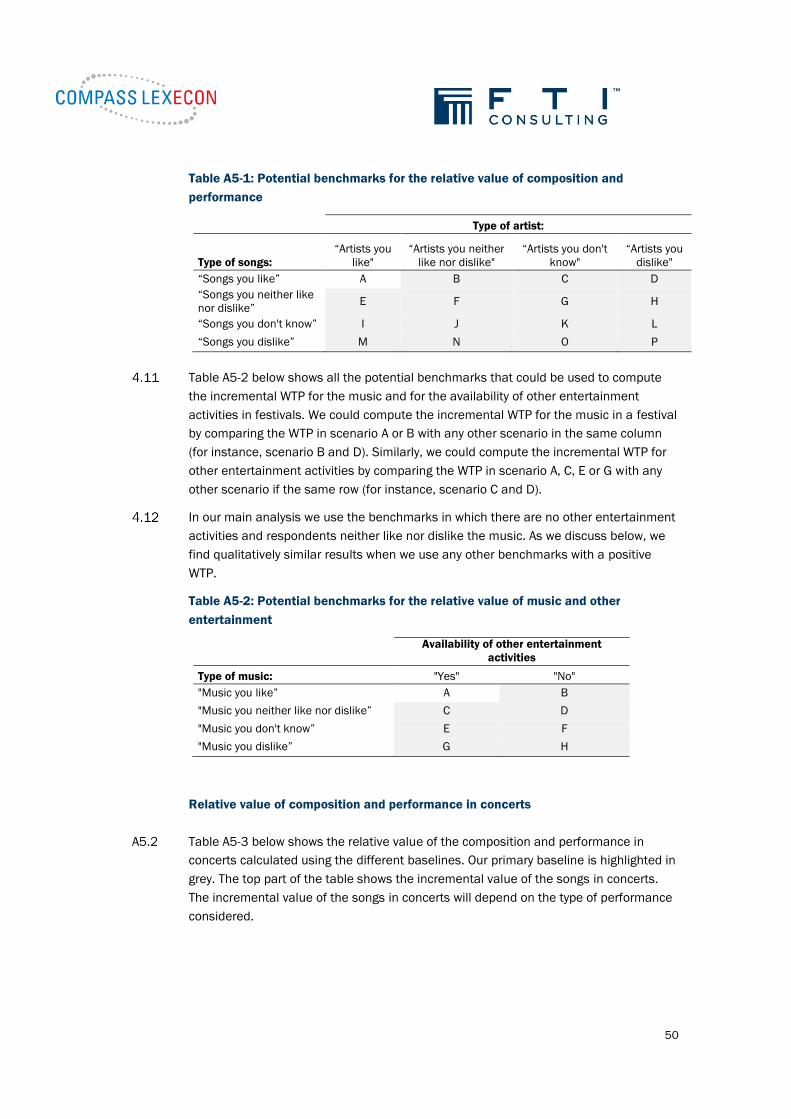
50
Table A5-1: Potential benchmarks for the relative value of composition and
performance
Type of artist:
Type of songs:
“Artists you
like"
“Artists you neither
like nor dislike"
“Artists you don't
know"
“Artists you
dislike"
“Songs you like” A B C D
“Songs you neither like
nor dislike” E F G H
“Songs you don't know” I J K L
“Songs you dislike” M N O P
Table A5-2 below shows all the potential benchmarks that could be used to compute
the incremental WTP for the music and for the availability of other entertainment
activities in festivals. We could compute the incremental WTP for the music in a festival
by comparing the WTP in scenario A or B with any other scenario in the same column
(for instance, scenario B and D). Similarly, we could compute the incremental WTP for
other entertainment activities by comparing the WTP in scenario A, C, E or G with any
other scenario if the same row (for instance, scenario C and D).
In our main analysis we use the benchmarks in which there are no other entertainment
activities and respondents neither like nor dislike the music. As we discuss below, we
find qualitatively similar results when we use any other benchmarks with a positive
WTP.
Table A5-2: Potential benchmarks for the relative value of music and other
entertainment
Availability of other entertainment
activities
Type of music: "Yes" "No"
"Music you like” A B
"Music you neither like nor dislike” C D
"Music you don't know” E F
"Music you dislike” G H
Relative value of composition and performance in concerts
A5.2 Table A5-3 below shows the relative value of the composition and performance in
concerts calculated using the different baselines. Our primary baseline is highlighted in
grey. The top part of the table shows the incremental value of the songs in concerts.
The incremental value of the songs in concerts will depend on the type of performance
considered.
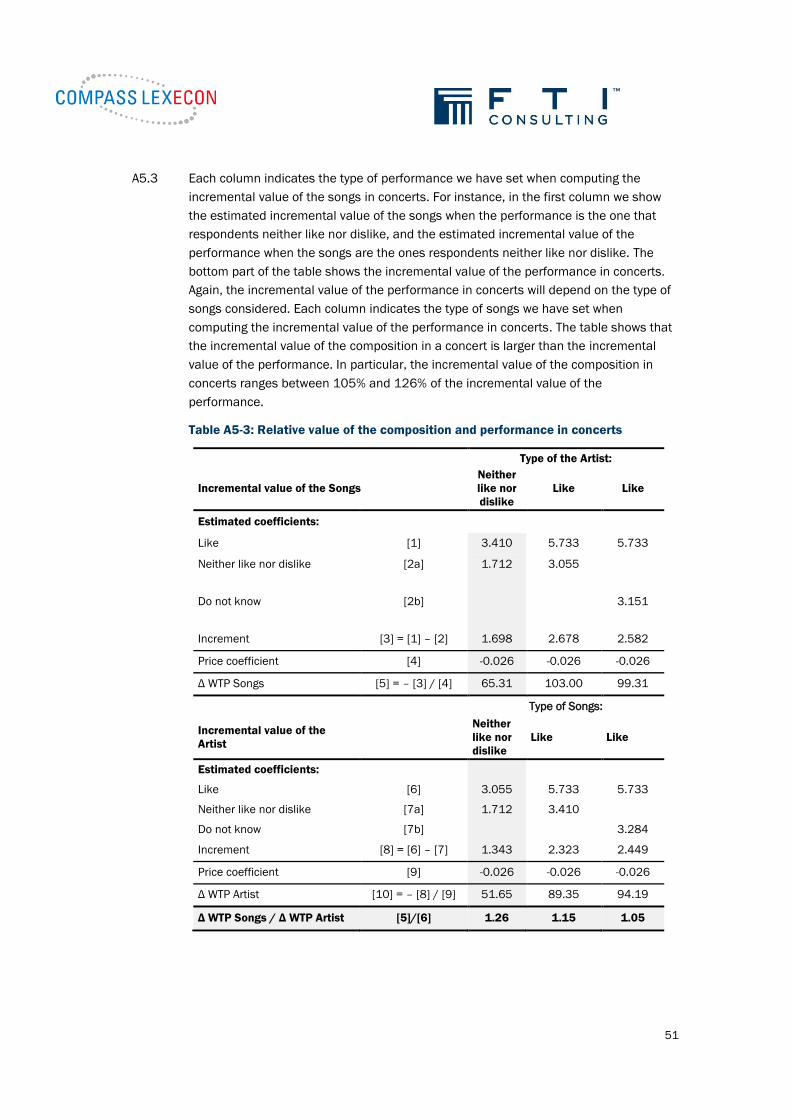
51
A5.3 Each column indicates the type of performance we have set when computing the
incremental value of the songs in concerts. For instance, in the first column we show
the estimated incremental value of the songs when the performance is the one that
respondents neither like nor dislike, and the estimated incremental value of the
performance when the songs are the ones respondents neither like nor dislike. The
bottom part of the table shows the incremental value of the performance in concerts.
Again, the incremental value of the performance in concerts will depend on the type of
songs considered. Each column indicates the type of songs we have set when
computing the incremental value of the performance in concerts. The table shows that
the incremental value of the composition in a concert is larger than the incremental
value of the performance. In particular, the incremental value of the composition in
concerts ranges between 105% and 126% of the incremental value of the
performance.
Table A5-3: Relative value of the composition and performance in concerts
Type of the Artist:
Incremental value of the Songs
Neither
like nor
dislike
Like Like
Estimated coefficients:
Like [1] 3.410 5.733 5.733
Neither like nor dislike [2a] 1.712 3.055
Do not know [2b] 3.151
Increment [3] = [1] – [2] 1.698 2.678 2.582
Price coefficient [4] -0.026 -0.026 -0.026
Δ WTP Songs [5] = – [3] / [4] 65.31 103.00 99.31
Type of Songs:
Incremental value of the
Artist
Neither
like nor
dislike
Like Like
Estimated coefficients:
Like [6] 3.055 5.733 5.733
Neither like nor dislike [7a] 1.712 3.410
Do not know [7b] 3.284
Increment [8] = [6] – [7] 1.343 2.323 2.449
Price coefficient [9] -0.026 -0.026 -0.026
Δ WTP Artist [10] = – [8] / [9] 51.65 89.35 94.19
Δ WTP Songs / Δ WTP Artist [5]/[6] 1.26 1.15 1.05
52
Relative value of composition and performance in festivals
A5.4 Table A5-4 below shows the relative value of the composition and performance in
festivals calculated using different baselines. Our base case is highlighted in grey. The
top part of the table shows the incremental value of the songs in festivals. The
incremental value of the songs in festivals will depend on the type of performance
considered.
A5.5 Each column indicates the type of performance we have set when computing the
incremental value of the songs in festivals. For instance, in the first column we show
the estimated incremental value of the songs when the performance is the one that
respondents neither like nor dislike, and the estimated incremental value of the
performance when the songs are the ones respondents neither like nor dislike. The
bottom part of the table shows the incremental value of the performance in festivals.
Again, the incremental value of the performance in festivals will depend on the type of
songs considered.
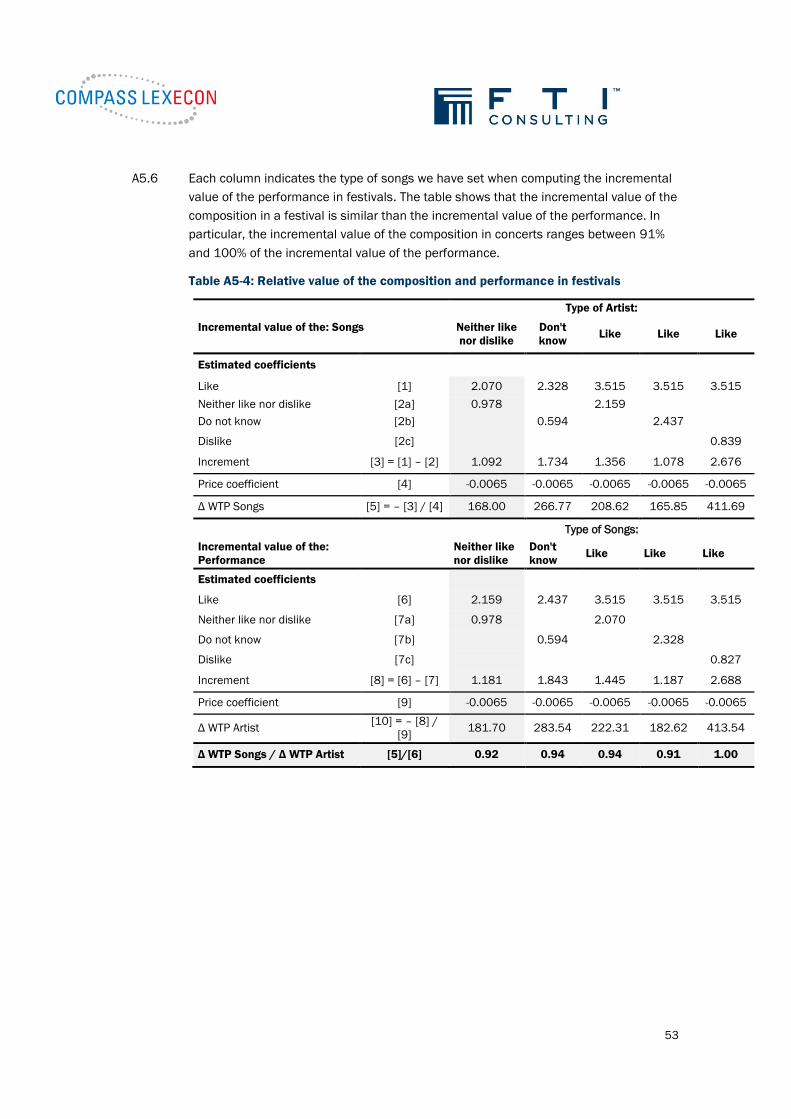
53
A5.6 Each column indicates the type of songs we have set when computing the incremental
value of the performance in festivals. The table shows that the incremental value of the
composition in a festival is similar than the incremental value of the performance. In
particular, the incremental value of the composition in concerts ranges between 91%
and 100% of the incremental value of the performance.
Table A5-4: Relative value of the composition and performance in festivals
Type of Artist:
Incremental value of the: Songs
Neither like
nor dislike
Don't
know Like Like Like
Estimated coefficients
Like [1] 2.070 2.328 3.515 3.515 3.515
Neither like nor dislike [2a] 0.978 2.159
Do not know [2b] 0.594 2.437
Dislike [2c] 0.839
Increment [3] = [1] – [2] 1.092 1.734 1.356 1.078 2.676
Price coefficient [4] -0.0065 -0.0065 -0.0065 -0.0065 -0.0065
Δ WTP Songs [5] = – [3] / [4] 168.00 266.77 208.62 165.85 411.69
Type of Songs:
Incremental value of the:
Performance Neither like
nor dislike
Don't
know Like Like Like
Estimated coefficients
Like [6] 2.159 2.437 3.515 3.515 3.515
Neither like nor dislike [7a] 0.978 2.070
Do not know [7b] 0.594 2.328
Dislike [7c] 0.827
Increment [8] = [6] – [7] 1.181 1.843 1.445 1.187 2.688
Price coefficient [9] -0.0065 -0.0065 -0.0065 -0.0065 -0.0065
Δ WTP Artist [10] = – [8] /
[9] 181.70 283.54 222.31 182.62 413.54
Δ WTP Songs / Δ WTP Artist [5]/[6] 0.92 0.94 0.94 0.91 1.00

54
Relative value of music and other entertainment types in festivals
A5.7 Table A5-5 below shows the relative value of the music and other entertainment types
in festivals. The top part of the table shows the incremental value of the music. In
particular, we compute the incremental value of the music as the difference between
the music you like and the music you neither like nor dislike when there is no other
entertainment activities. The bottom part of the table shows the incremental value of
other entertainment that is computed as the difference between the value of a festival
with and without the presence of other entertainment activities when the music is the
one you neither like nor dislike. The table shows that the incremental value of the
music in festivals is larger than the incremental value of other types of activities. In
particular, the incremental value of the music in festivals ranges between 284% of the
incremental value of other types of entertainment.
Table A5-5: Relative value of the composition and performance in festivals
Incremental value of the Music No other
entertainment
Estimated coefficients
Like [1] 3.538
Neither like nor dislike [2a] 1.155
Increment [3] = [1] – [2] 2.383
Price coefficient [4] -0.0083
Δ WTP Music [5] = – [3] / [4] 287.11
Incremental value of Other
entertainment
Music Neither
like nor
dislike
Estimated coefficients
Yes [6] 1.994
No [7a] 1.155
Increment [8] = [6] – [7] 0.839
Price coefficient [9] -0.0083
Δ WTP Other entertainment [10] = – [8] / [9] 101.08
Δ WTP Music / Δ WTP Other entertainment [5]/[6] 2.84