estimation of oil relative permeability from gravity...
TRANSCRIPT

SCA2002-13 1/12
ESTIMATION OF OIL RELATIVE PERMEABILITY FROM GRAVITY DRAINAGE EXPERIMENTS: MODELS
AND ACCURACY B. PEDRERA1, H. BERTIN1, G. HAMON2, L. DALLET3
1: LEPT-ENSAM, University of Bordeaux, France, 2: TotalFinaElf , Pau, France 3: Gaz-de-France, Paris, France
ABSTRACT Gravity assisted gas displacement of oil in reservoirs is increasingly being considered. Accurate estimates of relative permeabilities are needed to understand and predict fluids motion, especially when very low oil saturations are reached. In our study, gravity drainage experiments under secondary conditions are performed with different core wettabilities. Then, relative permeabilities are determined from the experimental data (oil recovery and saturation profiles measured by gamma-ray attenuation) using an analytical calculation and an identification method based on a numerical model. Our work aims at testing both approaches and efficiencies. The first method results from an analytical treatment of the multiphase flow model, where capillary pressure is taken into account and gas displacement is neglected. Capillary pressure is directly obtained from the last saturation profile when capillary equilibrium is reached. Then, a computer-aided procedure using a numerical finite-difference scheme calculates oil relative permeability from the saturation profiles measured at different times and different positions along the core. Saturation experimental noise due to gamma-ray technique is simulated and its effect on oil relative permeability calculation is tested. Two trends are observed: for high oil saturations, relative permeability curve is correctly described while, for low oil saturations, there is a slope change due to inaccurate values. The second method consists in using an inversion software (CAROPT, developed by TotalFinaElf) based on the minimization between computed and measured data. Inputs are saturation profiles and oil recovery; outputs are relative permeabilities and capillary pressure. Optimization process and final results depend on the initial data set that is considered. Our work suggests that the analytical method provides accurate estimates of relative permeability that are good initial data for the identification method. However, because of the assumptions used in the analytical calculation and its proved inaccuracy for low saturations due to experimental noise, conclusions cannot be drawn about flow regime at these very low saturations and results should be compared to those obtained by the identification method. At last, both approaches give a similar interpretation, which shows they are complementary.
SCA2002-13 2/12
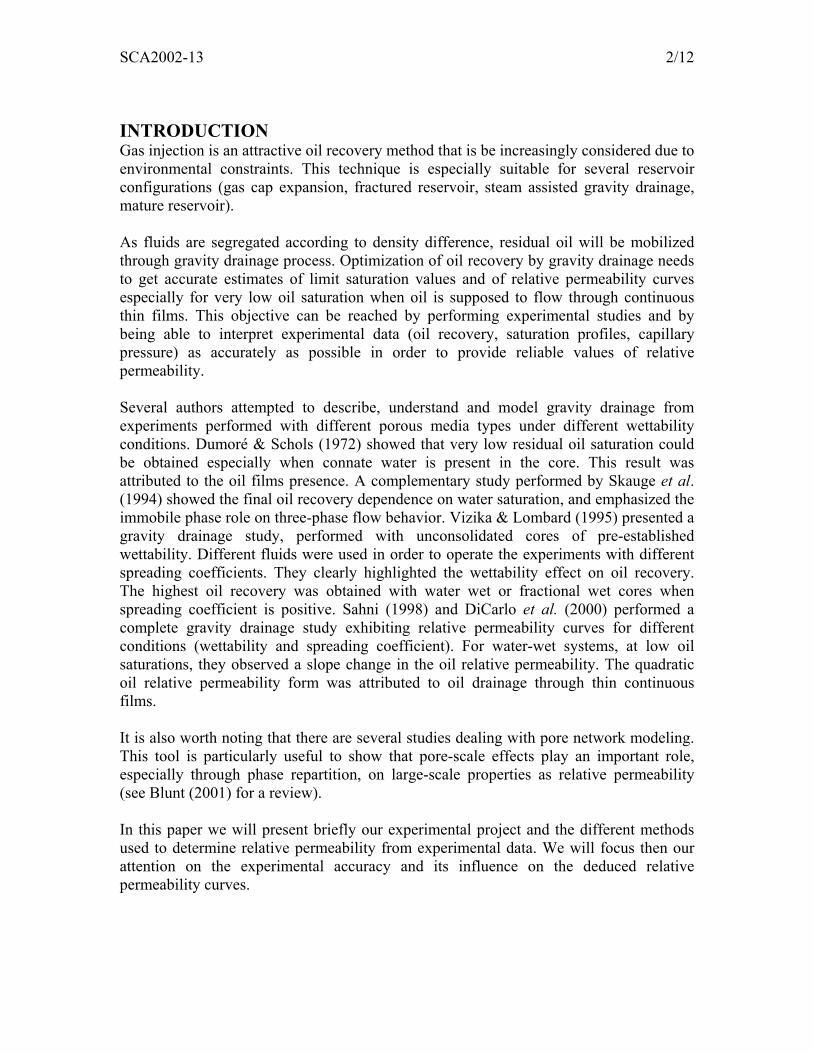
INTRODUCTION Gas injection is an attractive oil recovery method that is be increasingly considered due to environmental constraints. This technique is especially suitable for several reservoir configurations (gas cap expansion, fractured reservoir, steam assisted gravity drainage, mature reservoir). As fluids are segregated according to density difference, residual oil will be mobilized through gravity drainage process. Optimization of oil recovery by gravity drainage needs to get accurate estimates of limit saturation values and of relative permeability curves especially for very low oil saturation when oil is supposed to flow through continuous thin films. This objective can be reached by performing experimental studies and by being able to interpret experimental data (oil recovery, saturation profiles, capillary pressure) as accurately as possible in order to provide reliable values of relative permeability. Several authors attempted to describe, understand and model gravity drainage from experiments performed with different porous media types under different wettability conditions. Dumoré & Schols (1972) showed that very low residual oil saturation could be obtained especially when connate water is present in the core. This result was attributed to the oil films presence. A complementary study performed by Skauge et al. (1994) showed the final oil recovery dependence on water saturation, and emphasized the immobile phase role on three-phase flow behavior. Vizika & Lombard (1995) presented a gravity drainage study, performed with unconsolidated cores of pre-established wettability. Different fluids were used in order to operate the experiments with different spreading coefficients. They clearly highlighted the wettability effect on oil recovery. The highest oil recovery was obtained with water wet or fractional wet cores when spreading coefficient is positive. Sahni (1998) and DiCarlo et al. (2000) performed a complete gravity drainage study exhibiting relative permeability curves for different conditions (wettability and spreading coefficient). For water-wet systems, at low oil saturations, they observed a slope change in the oil relative permeability. The quadratic oil relative permeability form was attributed to oil drainage through thin continuous films. It is also worth noting that there are several studies dealing with pore network modeling. This tool is particularly useful to show that pore-scale effects play an important role, especially through phase repartition, on large-scale properties as relative permeability (see Blunt (2001) for a review). In this paper we will present briefly our experimental project and the different methods used to determine relative permeability from experimental data. We will focus then our attention on the experimental accuracy and its influence on the deduced relative permeability curves.

SCA2002-13 3/12
EXPERIMENTAL This section provides a brief description of experimental procedures. Additional details are provided in a separate paper (Pedrera et al., 2002). Porous Media The gravity drainage experiments were performed with artificial consolidated porous media available in cylindrical form (D = 0.05 m, L = 1m). This sintered porous medium Aerolith-10, provided by USF Schumacher, is known to be homogeneous and initially water-wet. The average porosity is around 38% and absolute permeability ranges between 5 and 7 Darcy. A temperature aging procedure, using a crude oil, has been developed by TotalFinaElf to modify the core wettability. Fluids Gas is ambient air. Water phase is a brine containing 50g/l of Sodium Iodide (NaI) to increase gamma ray attenuation coefficient and contrast with oil attenuation that will provide a better measurement accuracy. Oil is a mineral refined paraffinic one (Marcol 52 from ESSO). The physical fluids properties are given in Table 1. Experimental Procedure 1) The porous medium, equipped with valves at the two ends and epoxy coated, is
vertically positioned in a gamma ray rig. 2) The porous medium is fully saturated with CO2 before injecting brine. Porosity is
then measured by gamma-ray technique and change in core weight. Both values are compared and found in good agreement. Brine permeability is measured at this stage.
3) Oil is injected from the top of the core in order to displace water down to irreducible water saturation (Swi). Saturation profile is measured by gamma-ray attenuation technique and oil relative permeability at Swi is also measured.
4) A following step may be performed, corresponding to wettability modification of the core. The process consists in crude oil injection, time and temperature aging of the system, followed by a mineral oil injection.
5) Inlet and outlet valves are open to start air gravity drainage. Oil recovery and saturation profiles are continuously measured during the experience.
As mentioned in the experimental procedure, porosity and saturation profiles are measured using a gamma-ray attenuation technique, well known in petroleum engineering literature (Nicholls & Heaviside, 1985) and based on the comparison between an emitted radiation and a transmitted one. However, gamma-ray emission is a random phenomenon and measurement accuracy strongly depends on several parameters like counting times or detectors stability (Putz et al., 1993). We aimed at performing each counting for very stable temperature conditions and steady-state regime for detectors. We also took into account the source drift. As measurement accuracy depends on counting time, we used long counting times (4 to 10 minutes) for static measurements (porosity, irreducible water saturation profile and short ones (1 or 1.5 minutes) for dynamic measurements (saturation profiles during gravity drainage). Under these conditions, the

SCA2002-13 4/12
saturation (expressed in percentages) measurements uncertainty ranges between ± 2 points and ± 4 points depending on saturation value and counting time. At this systematic error we should add an uncertainty due to a possible core wrapping modification during the wettability alteration aging process. The observed accuracy is coherent with previous experimental works performed with similar techniques. An example of experimental data is given in Figure 1 and 3. We observe clearly the experimental noise on saturation profiles. This has been observed frequently in recent experimental studies, particularly on very permeable samples or unconsolidated sands (Sargent, 1999). It should be pointed out that:
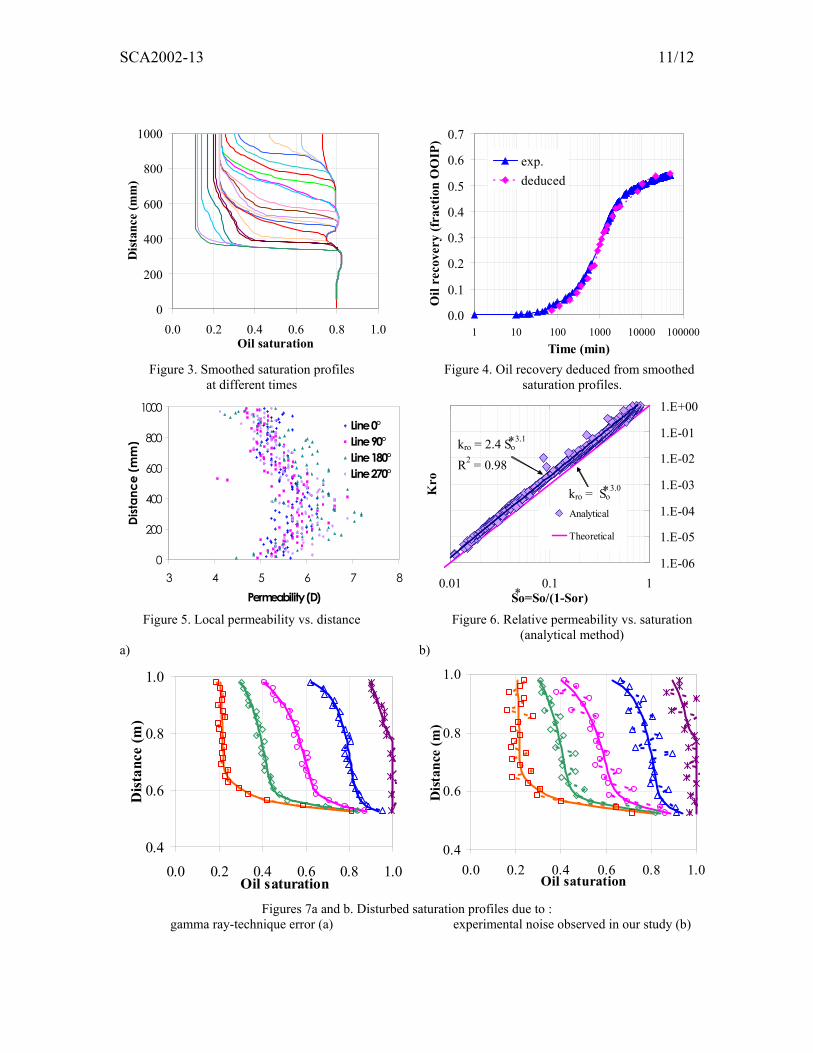
- This scatter cannot be explained only by typical errors on gamma technique. It has been attributed to small-scale heterogeneities (Sargent, 1999). In this study, local permeability was measured using an automated probe permeameter. Local permeability was measured every 1 cm along 4 lines equally spaced over the outer core surface. Figure 5 shows a typical permeability profile. There is a significant scatter at small scale although the relative variations of permeability are small compared to reservoir rocks or unconsolidated sands.
- Comparison between oil recovery measured at the core outlet and deduced from saturation measurement shows a discrepancy. A process that imposes the average value to fit the recovery curve smoothes saturation profiles. Result is given in Figures 2 and 4. ANALYSIS OF GRAVITY DRAINAGE EXPERIMENTS When gravity drainage experiments under secondary conditions are performed, relative permeabilities can be determined from the experimental data (oil recovery and saturation profiles measured by gamma-ray attenuation) using an analytical calculation or an inversion method. Both the experimental method and the interpretation originate from air/water drainage experiments performed by hydrogeologists (Vachaud & Gaudet, 1978). Physical Model Gravity drainage can be modeled by conservation equation, generalized Darcy’s law and capillary pressure relationship. The Darcy’s law for uncompressible three-phase system (gas, oil and water), flowing downwards, can be written as follows:
gw,o,igi
i
rii =
−
∂∂−= gρ
zp
µk.ku (1)
Conservation equations for the three phases are:
gw,o,iii ==∂φ∂+
∂∂ 0
tS
zu (2)
Capillary pressure relationships are: (2) go
go ppPc −=
(3) woow ppPc −=

SCA2002-13 5/12
Boundary conditions are:
(4) 0Poutlettheat
Ppinlettheat
c =
=go
atmg
Analytical Treatment This method has been used by several authors (Naylor et al., 1995, Sahni, 1998). It is briefly described here below. As the gas phase flows at very slow velocity, viscous effects are neglected and its pressure gradient can be considered as hydrostatic. Therefore,
zρz
pg
g =∂∂
(5)
Derivating equation (3) and using equation (6) leads to:
z
Pgρzp c
∂∂−=
∂∂ go
go (6)
Equation (1), for i = o, becomes:
( ) ( )
−+
∂∂= gρρ
zP
µkkt,zu c
ogo
goro
o (7)
and can be integrated along the core as follows:
( ) ( )dzt
t,zSt,zuz
0 ∂∂φ−= ∫ o
o (8)
The reference used for the oil relative permeability is the oil effective permeability at irreducible water saturation, so that oil relative permeability can be written as:
( )( )( )
( )
∂
∂+ρ−ρ
∂∂φµ
−=∫
zPgS@k
dzt
t,zS
t,zSkc
z
0go
gowio
oo
oro (9)
Gravity drainage is completed when equilibrium between gravity and capillary forces is reached. Capillary pressure is directly obtained from the last saturation profile and can be calculated by: (10) ( ) ( ) CgSSPc +ρ−ρ−=+ gowo
go
where C is a constant. Then, a computer-aided procedure using a numerical finite-difference approximation of equation (10) calculates oil relative permeability from capillary pressure (Eq. 11) and the saturation profiles measured at different times and positions along the core. The results are plotted as (kr vs So). Data can be fitted on a Corey type relative permeability defined as follows:
on
0
SS1SSkk
−−
−=orwi
orororo (11)

SCA2002-13 6/12
Method Accuracy The method accuracy has been evaluated using oil/air gravity drainage profiles obtained by direct numerical simulation using a finite difference black-oil simulator, which incorporates both viscous, capillary and gravity forces. The physical core properties (porosity, permeability, core length) are the same than experimental ones. First, we tested our analytical model ability to compute the oil relative permeability from the numerical saturation profiles. Results presented in Figure 6 show a good agreement between computed (n0 = 3.1) and initial data (n0 = 3) even if computed relative permeability is slightly higher than the input value. The slight discrepancy is due to numerical approximations and the fact that gas relative permeability is neglected in the analytical method. Figure 6 shows the very small scatter in Krog(So) results. This scatter is even smaller in the very low oil saturation region. This would confirm the analytical gravity drainage experiments interpretation is a sound technique to detect changes in oil relative permeability curve for low oil saturations, should the experimental saturation profiles be ideal. Similar behavior has been observed for input data presenting a change in slope of oil relative permeability curve. Secondly, we studied the experimental saturation effect on the relative permeability determination. The saturation profiles obtained by direct simulation were disturbed twice as follows:
(13) osmoothedodisturbedo S_deltaSS +=
In the first case, noise is due to gamma-ray technique and delta_So is given by :
(14) ( 02;0;02,0randomS_delta +−=o )that is to say that each saturation along a profile is ± 2 points randomly modified. In the second case, noise is exactly that observed during our experimental study and delta_So is given by :
( )
π××+= z
3cos1,01;0randomS_delta o (15)
that is to say that each saturation measured every 6 cm can be at the very most ± 10 points randomly modified. Disturbed saturation profiles (Figures 7a and 7b) were obtained from numerical profiles randomly treated. Oil relative permeability is then calculated from those profiles. Results are presented in Figures 8a and 8b for the two tested experimental noises. Several observations can be drawn from these figures: - First of all, these figures highlight that the resulting data set Krog(So) is rather
cloudy. This is very similar to experimental observations made in recent studies, when oil relative permeability is calculated from saturation data obtained during gravity drainage (Sargent et al., 1999).
- Secondly, there is a good agreement between averaged curves calculated from noised saturation data and theoretical value if oil saturation is high. On the other hand, for low oil saturations values, there is a significantly larger scatter in oil relative

SCA2002-13 7/12
permeability. Close inspection of figure 8a in the very low oil saturation region shows that calculated Krog:
- Departs significantly from the oil relative permeability used to generate these noised saturation profiles.
- Deviates towards more optimistic values. Accounting for rather small errors in saturation data typical from attenuation techniques results in a slope change in the oil relative permeability curve, in the very low oil reduced saturation region.
These observations indicate that oil relative permeability obtained directly from saturation data is less accurate and reliable in the low than on the high and medium oil saturation regions. The slope change in the oil relative permeability curve in the very low oil saturation region may originate from experimental noise rather from a change of flow regime. Inversion Method Description Gravity drainage experiments have been interpreted using a numerical tool (CAROPT, developed by TotalFinaElf) that couples together a flow simulator and a minimization routine. This tool is able to calculate relative permeability curves and capillary pressure minimizing the difference between numerical simulation and experimental observation (oil recovery and saturation profiles). However, an initial estimate for the relative permeability and capillary pressure is needed to start the process. It is also possible to lock the value of any parameter (relative permeability or capillary pressure) in the initial estimates during the optimization. CAROPT estimates optimum values for all free parameters by matching the measured experimental data using a weighted least square objective function. Moreover, an uncertainty range can be calculated independently for each parameter. It is based on the confidence interval estimate for a given parameter and relies on statistical tool. The use of such a tool is very convenient to interpret experimental data but it is well known that the optimization results accuracy depends on several choices: initial parameters set, numerical weight put on experimental observations. Final match can be strongly improved by making the correct choices for these entities. Methodology As inversion method has been more used to describe forced displacement than free gravity drainage, we started our simulation by a sensitivity study. Our objective is twofold. We want first to determine the most accurate choices (initial set data, observation weight and identified parameters) for the optimization process and, secondly, to compare inversion results with those obtained by analytical calculation described here above. Simulator inputs are the geometry, the petrophysical porous medium properties (porosity, absolute permeability), the physico-chemical fluids properties (densities, viscosities, interfacial tension), the initial relative permeability curve, the applied pressure drop and the capillary pressure.

SCA2002-13 8/12
In our study, the optimization conditions are described as follows: - the capillary pressure can be fixed or not, - the history matching is based either on the fitting of the oil recovery or on the oil
recovery and the last saturation profile, - different weight values and initial estimates for the oil relative permeability and the
capillary pressure are tested. The simulation accuracy is also estimated from the agreement between experimental and simulated saturation profiles. Results After this preliminary sensitivity study, optimal conditions for the identification process are determined as follow: - history matching should be determined on the oil recovery and on the last saturation
profile corresponding to capillary equilibrium, - initial weight values should be the same for all experimental observations, - initial estimate for capillary pressure should be the one measured experimentally, - initial estimates for oil relative permeability is given by the result obtained using the
analytical method. Under these optimal conditions, the identification tool provides results that are the most independent of the initialization step. These conditions will be used for the identification process. At last, the identification method provides results that are very close to those obtained by the semi-analytical approach (see Figure 9). Error estimates are calculated from an approximation to the Hessian matrix as a 90% confidence interval for each parameter being optimised. Error estimates are presented in Figure 10. We turn our attention on: - errors bars are the highest for saturations included in 0.4 to 0.7 (i.e. for reduced
saturations included in 0.4 to 0.6) ; this is due to lack of data during the earlier times of the drainage (when the rate of oil is high),
- in the medium saturations region, identification error bars are small as saturation profiles provide a lot of information ; they are also smaller than analytical points scatter,
- error bars are high at the very low reduced oil saturations (that is to say saturations near to the residual oil saturation) and show that the identification method as well as the analytical method provides unreliable relative permeabilities values at these saturations, so that conclusions cannot be drawn about flow regime in this saturation region.
CONCLUSIONS Two different techniques have been applied to the oil relative permeability determination from gas/oil gravity drainage in presence of irreducible water: a direct analytical technique using saturation data and an inversion method. From this study, the following conclusions can be drawn:

SCA2002-13 9/12
1. The analytical method, although the hypothesis of no gas flow, provides good and straightforward relative permeability estimates in the high and medium saturation regions.
2. Experimental noise observed on saturation profiles results in unreliable and inaccurate oil relative permeability, analytically calculated, in the low oil saturation region. Change in slope of the oil relative permeability towards more optimistic values at low oil saturations might originate from the saturation measurements inaccuracy.
3. Identification method is powerful to determine relative permeability, except at the very low reduced oil saturations. However, results strongly depend on the initial data set if the inversion is not constrained by either a saturation profile or the capillary pressure in addition to production. It is also less time consuming that the analytical approach.
4. There is a good agreement between the results given by both analytical and identification methods. Moreover, these methods are complementary in the sense that the results provided by the analytical method are the best initial set to start the optimization process.
ACKNOWLEDGEMENTS Financial support from TotalFinaElf and Gaz-de-France is gratefully acknowledged. Discussions with A. Ahmadi and D. Lasseux were fruitful. NOMENCLATURE g gravity acceleration (m.s-2) k permeability (m2) ko@Swi oil effective permeability at irreducible water saturation (m2) kr relative permeability
0k ro proportionality constant introduced in the definition of the relative permeability no Corey exponent P pressure (Pa) Patm atmospheric pressure (=1.013 105 Pa) Pc capillary pressure (Pa)
gocP capillary pressure gas/oil
S saturation t time (s) u filtration velocity (m.s-1) z distance (m) φ porosity µ viscosity (Pa.s) ρ density (kg.m-3) Subscripts i phase (w,o,g) g gas o oil or residual oil

SCA2002-13 10/12
w water wi irreducible water REFERENCES 1. BLUNT M.J., Flow in porous media: pore network model and multiphase flow. Current Opinion in Colloïd & Int. Sc., 6, pp. 197-207, 2001. 2. DICARLO D.A., SAHNI A. & BLUNT M., The effects of wettability on three-phase relative permeability, SPE 49317, SPE ATCE, 1998. 3. DUMORE J.M. & SCHOLS R.S., Drainage capillary pressure functions and the influence of connate water, SPE 4096, SPE-AIME, 1972. 4. VACHAUD, G., GAUDET, J.P.: “Air and water flow during infiltration in a vertical bounded column of soil” Journal of Hydrology, vol 22, pp89-108, 1978 5. NAYLOR P., SARGENT N.C., CROSBIE A.J. & TILSED A.P., Gravity drainage during gas injection, 8th IOR European Symposium, Vienna, Austria, 1995. 6. NICHOLLS C.P. & HEAVISIDE J., Gamma ray absorption techniques improve analysis of core displacement tests. SPE 14421, 1985. 7. PUTZ A.G., MORINEAU Y. M. & BEGANI R., Gamma ray absorption measurements, laboratory experiments in bottomhole conditions. SPE 26621, 1993. 8. PEDRERA B., BERTIN H., HAMON G. & AUGUSTIN A., Wettability effect on oil relative permeability during a gravity drainage, SPE 77542, 2002. 9. SAHNI A., Measurements of three phase relative permeability during gravity drainage using CT scanning, thesis, Stanford University, USA, 1998. 10. SKAUGE A., ELERI O., GRAUE A. & MONSTAD P., Influence of connate water on oil recovery by gravity drainage, SPE 27817, SPE/DOE IOR Symposium, 1994. 11. VIZIKA O. & LOMBARD J.M., Wettability and spreading: two key parameters in oil recovery with three-phase gravity drainage, SPERE, 54-58, 1996. 12. SARGENT N., ELEMENT, D., GOODYEAR S., JOHNSTON, J.: “Gas and water Flood Gravity Drainage in Viscous oil fields Developments” SCA-9935, 1999.
0
200
400
600
800
1000
0.0 0.2 0.4 0.6 0.8 1.0
Oil Saturation
Dis
tanc
e (m
m)
0.0
0.1
0.2
0.3
0.4
0.5
0.6
0.7
1 10 100 1000 10000 100000
Time (min.)
Oil
Rec
over
y (f
ract
ion
OO
IP)
exp.deduced
Figure 1. Measured saturation profiles Figure 2. Oil recovery deduced from measured at different times saturation profiles.
SCA2002-13 11/12
0
200
400
600
800
1000
0.0 0.2 0.4 0.6 0.8 1.0Oil saturation
Dis
tanc
e (m
m)
0.0
0.1
0.2
0.3
0.4
0.5
0.6
0.7
1 10 100 1000 10000 100000Time (min)
Oil
reco
very
(fra
ctio
n O
OIP
)
exp.deduced
Figure 3. Smoothed saturation profiles Figure 4. Oil recovery deduced from smoothed at different times saturation profiles.
0
200
400
600
800
1000
3 4 5 6 7 8Permeability (D)
Dist
ance
(mm
)
Line 0°Line 90°Line 180°Line 270°
1.E-06
1.E-05
1.E-04
1.E-03
1.E-02
1.E-01
1.E+00
0.01 0.1 1So=So/(1-Sor)
Kro
Analytical
Theoretical
kro = 2.4 So3.1
R2 = 0.98
*
kro = So3.0*
*
Figure 5. Local permeability vs. distance Figure 6. Relative permeability vs. saturation (analytical method) a)
0.4
0.6
0.8
1.0
0.0 0.2 0.4 0.6 0.8 1.0Oil saturation
Dis
tanc
e (m
)
b)
0.4
0.6
0.8
1.0
0.0 0.2 0.4 0.6 0.8 1.0Oil saturation
Dist
ance
(m)
Figures 7a and b. Disturbed saturation profiles due to : gamma ray-technique error (a) experimental noise observed in our study (b)

SCA2002-13 12/12
a)
kro = 1.1So*2.4
R2 = 0.89
1.E-08
1.E-06
1.E-04
1.E-02
1.E+001.E-05 1.E-04 1.E-03 1.E-02 1.E-01 1.E+00
So*=So/(1-Sor)
k ro
kro = 2.0So*2.8
R2 = 1.00
b)
1.E-08
1.E-06
1.E-04
1.E-02
1.E+001.E-05 1.E-04 1.E-03 1.E-02 1.E-01 1.E+00
So*=So/(1-Sor)
k ro
kro = 0.6So*2.4
R2 = 0.89
kro = 2.0So*2.8
R2 = 1.0
Figures 8a and b. Relative permeability vs. saturation deduced from the disturbed saturation profiles due to: gamma ray-technique (a) experimental noise observed in our study (b) a)
0.0001
0.001
0.01
0.1
10.01 0.1 1
S *o(1) = (S o-S or)/(1-/S wi-S or)
Oil
rela
tive p
erm
eabi
lity Analytical
Inversed
b)
0
0.05
0.1
0.0 0.2 0.4 0.6 0.8Sg
Pc (b
ar)
Pc exp.
Pc inv.
1-Swi-Sorg
Figures 9a and b. Comparison between the analytical method and the inversion method.
0.0001
0.001
0.01
0.1
10.01 0.1 1
S *o(1) = (S o-S or)/(1-/S wi-S or)
Oil
rela
tive
perm
eabi
lity
Analytical
Inversed
Figure 10. Inversion method accuracy : kro vs So.
Density (kg/m3) Viscosity (Pa.s) Brine 50 g/l NaI 1045 1.0 E-03 Oil Marcol 52 831 11,3 E-03
Air 1.29 1.8 E-05 Crude oil 790 -
Table 1. Physical fluids properties.