estimation of food contribution of...as fruit and vegetables e.g. sugar released from fruit when it...
TRANSCRIPT

i
ESTIMATION OF FOOD
AND NUTRIENT INTAKES
FROM FOOD PURCHASE
DATA IN SCOTLAND
2001-2012
Project Code
FS424018
April 2015
e
FS424018
April 2015
Authors Karen L Barton1
Wendy L Wrieden2
Advised by Julie Armstrong3 Andrea Sherriff4
CONTRIBUTION OF
FOODS TO INTAKES OF
ENERGY AND SELECTED
NUTRIENTS USING FOOD
PURCHASE DATA IN
SCOTLAND
2001-2012
Project Code
FS424018
April 2015
Project Code
FS424018
April 2015
1. Centre for Public Health Nutrition Research, Division of Cancer Research,
University of Dundee, Ninewells Hospital and Medical School, Dundee DD1 9SY
2. School of Pharmacy and Life Sciences, Robert Gordon University, Riverside East
(N548d), Garthdee Road, Aberdeen, AB10 7GJ
3. School of Life Sciences, Glasgow Caledonian University, Cowcaddens, Glasgow, G4
0BA
4. University of Glasgow Dental School, 9th Floor, 378 Sauchiehall Street, Glasgow,
G2 3JZ

i
ACKNOWLEDGEMENTS
This report has been produced under a contract placed by the Food Standards Agency. On the
1st April 2015, Food Standards Scotland took on all of the functions previously carried out in
Scotland by the Food Standards Agency.
The authors would like to acknowledge the contribution of the following people and thank them
for their support and guidance throughout the project.
Project Steering Group
Annie Anderson - Director of the Centre for Public Health Nutrition Research, University of
Dundee
Angela Craigie - Lecturer, Centre for Public Health Nutrition Research, University of Dundee
Jim Holding - Government Statistician, Department for Environment, Food & Rural Affairs (Defra)
David Lee - Food Statistics Team, Department for Environment, Food & Rural Affairs (Defra)
Administration Support
Jill Hampton, Centre for Public Health Nutrition Research, University of Dundee
Food Standards Scotland
Anne Milne
Heather Peace
The authors would also like to thank the staff of the Defra, York and London for their invaluable
help with interpreting the data and formulating the calculations required for analysis of the Living
Costs and Food Survey (LCFS) data, in particular Jim Holding, David Lee and Clare Burgon; and
the staff at the Office of National Statistics (ONS), Newport, Wales for their assistance in
providing data on sampling and income variables and for mapping Scottish Index of Multiple
Deprivation (SIMD) data to the LCFS households.
This work was carried out using data from the UK Data Archive, University of Essex
http://www.data-archive.ac.uk/, additional variables on sampling and income were provided by
ONS, SIMD data were obtained from Scottish Neighbourhood Statistics.

ii
EXECUTIVE SUMMARY
Introduction
Evidence based Scottish Dietary Targets (Goals) have been monitored since 2001 (Wrieden and
Barton, 2015). The rationale for setting these food and nutrient targets was based on data mainly
from the National Food Surveys of 1989-1991 and the foods consumed at that time. As national
and global food supplies evolve, it is important to revisit the relative contribution of individual
food categories to energy, fat, saturated fat, added sugars (non-milk extrinsic sugars (NMES)) and
fibre (non-starch polysaccharides (NSP)) in the overall diet to inform policy development and
ensure that key foods and drinks are included in the monitoring of overall population intakes.
Further analysis by level of deprivation may help explain why there is little difference in
population intakes of fat and saturated fat by level of deprivation in Scotland despite clear
differences in the consumption of some foods (Wrieden and Barton, 2015).
Objective
The purpose of this work was to explore which foods and drinks are the main contributors to
intakes of energy, fat, saturated fat, NMES and NSP in the Scottish diet and to identify any
differences between quintiles of the Scottish Index of Multiple Deprivation (SIMD).
Methods
Household food purchase data for Scotland from 2001 to 2012, from the UK Living Costs and
Food Survey (Expenditure and Food Survey until 2008), for 5484 households, were analysed to
estimate the contribution that selected food groupings made to intakes of energy, fat, saturated
fat, NMES and NSP. Adjustments were made for waste (Waste and Resource Action Programme
Survey (WRAP), 2008) and data were analysed using general linear models within the complex
samples module of SPSS (SPSS Inc., Chicago, IL, USA), weighting to the Scottish population and
taking account of sampling methods.
Key Findings
The results suggest that foods and drinks that are often described as “discretionary” (namely
confectionery and sweet biscuits, sugar-sweetened beverages, crisps and savoury snacks, and
cakes pastries and puddings) are large contributors to energy in the diet. Total confectionery
and sweet biscuits, in addition to being the largest contributor of NMES, are also the largest
contributors to energy and saturated fat and the third largest contributor to fat; providing around

iii
10% of energy and fat, and 14% of saturated fat. The table below provides a summary of the
contribution of these foods to the overall diet.
Summary of the contribution that "discretionary" foods make to energy, fat, saturated fat and sugar intake (mean intake (percentage) per person per day)
Weight
g
Energy Kcal
(%)
Fat g (%) Saturated Fat g
(%)
NMES g
(%)*
Total Confectionery and Sweet
Biscuits
44.1 191 (9.6) 8.5
(10.1)
4.4 (13.9) 18.1 (23.77)
Sugar Containing Soft Drinks 231.0 65.4 (3.3) nil nil 17.0 (22.27)
Crisps and Savoury Snacks 13.3 61.9 (3.1) 3.5 (4.1) 0.5 (1.5) <0.1 (<1%)
Cakes, Pastries and Puddings 17.6 59.6 (3.0) 2.8 (3.3) 1.2 (3.65) 4.4 (5.79)
*Non-milk extrinsic sugars - sugars, excluding those in milk and milk products that are not incorporated into the cellular structure of foods, such as fruit and vegetables e.g. sugar released from fruit when it is blended or juiced, table sugar, honey and added sugar in cakes, biscuit, sweets, breakfast cereals and soft drinks
The results also suggest that there are several additional foods that may warrant monitoring in
the future which also contribute considerably to the diet but perhaps differently by level of
deprivation e.g. spreading fats, alcoholic drinks, cheese, cooking oil, ice cream and dairy desserts,
cream and nuts.
Conclusion
Confectionery and sweet biscuits, sugar-sweetened beverages, crisps and savoury snacks, and
cakes pastries and puddings are not necessary as part of a healthy balanced diet, and advice is
that intake should be limited. Given that the prevalence of overweight and obesity in adults aged
16 to 64 in Scotland rose from 52.4% in 1995 to 62.6% in 2013 (Bromley et al., 2014), even a small
reduction in consumption of these foods would assist greatly in reducing population energy
intakes and moving the population diet towards the Scottish Dietary Goals. For example, it would
be possible to reduce intakes by 120 kcals per person per day by reducing consumption from all
of these discretionary categories by a third, providing such foods are not substituted.
References
BROMLEY, C., DOWLING, S., GRAY, L., HUGHES, T., LEYLAND, A., MCNEILL, G. & MARCINKIEWICZ, A. 2014. The
Scottish Health Survey 2013 Edition: Volume 1 - Main Report, Edinburgh, Scottish Government.
WRIEDEN, W. L. & BARTON, K. L. 2015. Estimation of food and nutrient intakes from food purchase data in
Scotland 2001-2012 [Online]. Aberdeen: Food Standards Agency in Scotland.

i
CONTENTS
Acknowledgements ..................................................................................................................................... i
Executive Summary .................................................................................................................................... ii
Contents ....................................................................................................................................................... i
List of Tables ............................................................................................................................................... ii
1. Background ............................................................................................................................................. 1
1.1 Introduction ........................................................................................................................................ 1
1.2 Purpose .............................................................................................................................................. 2
2. Methodology ........................................................................................................................................... 3
2.1 Analysis of Data ................................................................................................................................. 4
2.2 Presentation of Results ...................................................................................................................... 4
3. Results ..................................................................................................................................................... 6
3.1 Contribution of Foods to Intakes of Energy, Macronutrients and Fibre ............................................. 6
3.2 Contribution of Foods to Intakes of Energy, Macronutrients and Fibre by SIMD ............................ 13
4. Discussion ............................................................................................................................................. 18
5. References ............................................................................................................................................ 21
6. Appendices ........................................................................................................................................... 22
Appendix 1: Recommended Edible Food Waste Estimates .................................................................. 23
Appendix 2: Food Groupings Used for Contributing Foods Analysis1 ................................................... 33
Appendix 3: Breakdown of Food Groupings by Food Code .................................................................. 35

ii
LIST OF TABLES
Table 1: Mean contribution of foods1 providing more than 1% of energy (2001-2012 data) ........................ 8
Table 2: Mean contribution of foods1 providing more than 1% of fat (2001-2012 data) ............................... 9
Table 3: Mean contribution of foods1 providing more than 1% of saturated fat (2001-2012 data) ............. 10
Table 4: Mean contribution of foods1 providing more than 1% of NMES (2001-2012 data) ....................... 11
Table 5: Mean contribution of foods1 providing more than 1% of NSP (2001-2012 data) .......................... 12
Table 6: Mean contribution to energy from selected foods1 by SIMD (LCF Household and Eaten Out Data
for 2010 to 2012 combined) ....................................................................................................... 14
Table 7: Mean contribution to fat from selected foods1 by SIMD (LCF Household and Eaten Out Data for
2010 to 2012 combined) ............................................................................................................ 15
Table 8: Mean contribution to saturated fat from selected foods1 by SIMD (LCF Household and Eaten Out
Data for 2010 to 2012 combined) ............................................................................................... 16
Table 9: Mean contribution to NMES from selected foods1 by SIMD (LCF Household and Eaten Out Data
for 2010 to 2012 combined) ....................................................................................................... 17
Table 10: Mean contribution to NSP from selected foods1 by SIMD (LCF Household and Eaten Out Data
for 2010 to 2012 combined) ....................................................................................................... 17

1
1. BACKGROUND
1.1 Introduction
Evidence based Scottish Dietary Targets (Goals) have been monitored since 2001 (Wrieden and Barton,
2015). The baseline figures used in the setting of these targets were derived mainly from the National
Food Surveys of 1989-1991 and were an indication of food and nutrient intake at that time. As national
and global food supplies are constantly evolving, it is important to revisit the relative contribution of
individual food categories to energy, fat, saturated fat, added sugars (non-milk extrinsic sugars (NMES))
and fibre (non-starch polysaccharide (NSP)) in the overall diet to ensure that the most important foods
and drinks are included in the monitoring of overall population intakes. Previous reports in 2010 and
2012 monitoring the Scottish Diet (Barton et al., 2010, Barton and Wrieden, 2012) showed that the
consumption of some of the main foods contributing to total fat and saturated fat intake, such as milk
and processed meat, were higher in households from more deprived areas. However, no socioeconomic
differences have been detected in total fat and saturated fat intake (Barton et al., 2010, Barton and
Wrieden, 2012). This new analysis assesses the contribution that foods high in NMES, fat and saturated
fat intakes make to the Scottish diet to ensure that current policy is targeting the correct foods. It also
explores the contribution that foods make to energy and non-starch polysaccharide intake.
This work has been carried out in order to inform the Food Standards Agency in Scotland (FSAS) policy
and monitoring requirements in relation to progress towards the revised Dietary Goals for Scotland
published in May 2013 (Scottish Government, 2013). These dietary goals set the direction of travel for
the changes needed to improve the Scottish diet and so reduce the burden of common diet related
diseases, and obesity. The goals are population level, nutrient and food-based targets, embedded into
key policy documents and underpin Scottish Government policy on nutrition. This includes the recent
publication of Supporting Healthy Choices: A Framework for Voluntary Action for the food and retail
industry to improve Scotland’s dietary health by reducing levels of energy, fats and NMES in the food
chain (Scottish Government and Food Standards Agency in Scotland, 2014). It is important and timely
to understand and update current knowledge on the relative contribution that individual food and drink
categories make to the intake of energy, fat, saturated fat, NMES and NSP in Scotland.
Monitoring work by Barton and Wrieden (2012) using data from the Expenditure and Food Survey (EFS)
and the Living Costs and Food Survey (LCF) reported population trends in diet and nutrient intakes in
relation to Scottish Dietary Targets (SDTs) (Scottish Office, 1996) and a limited list of additional foods
and drinks highlighted for reduction or increase in the Scottish Diet report (Scottish Office, 1993). This
work continues (Wrieden and Barton, 2015) with a focus on the revised Dietary Goals for Scotland

2
(Scottish Government, 2013). However, national and global food supplies are constantly evolving and it
is important to revisit the contribution of different food categories to the energy and macronutrients
targeted for reduction in the diet and ensure that the most important foods and drinks are included in
the monitoring of overall population intakes and in relation to deprivation.
It is also important to explore differences in the relative contributions from household foods and drinks
compared to eaten out foods and drinks. Previous analysis (Wrieden and Barton, 2011) suggested that
the energy density of food eaten out is about 30% higher than household food suggesting a difference
in the proportions of foods and drinks consumed and therefore their relative contribution to
macronutrients and energy. This new work will help to inform Scottish Government and FSAS policy and
monitoring in relation to Supporting Healthy Choices (Scottish Government and Food Standards Agency
in Scotland, 2014).
1.2 Purpose
The purpose of this work was to explore which foods and drinks are the main contributors to intakes of
energy, fat, saturated fat, NMES and NSP in the Scottish Diet, both inside and out of the home. This is
important in order to inform FSAS and government policy and further explain differences in the intake
of some foods by level of deprivation which do not necessarily translate into differences in nutrient
intakes.

3
2. METHODOLOGY
The EFS/LCF is an annual household budget survey designed to collect information about household
food and expenditure. It collects household food purchase and eating out data from every person over
seven years of age in each household over a 14 day period. Although it is not designed to measure
intakes of specific individuals, valuable data on average population intakes of specific food groups and
nutrients can be produced using appropriate methodology for comparison with population level goals.
The advantages and disadvantages of using data from the LCFS are provided in Appendix 2 of the
Estimation of Food and Nutrient Intakes from Food Purchase Data in Scotland 2001-2012 by Wrieden
and Barton (2015).
EFS/LCF data for each year, in its raw form, was obtained from the UK Data Archive. Data on sampling
methodology, and Scottish Index of Multiple Deprivation (SIMD) quintiles were obtained from the UK
Office for National Statistics (ONS).
As per monitoring work (Wrieden and Barton, 2015) household consumption data over two weeks minus
waste (Appendix 1) (based on purchases) for each food code was multiplied by the appropriate nutrient
content per gram (provided by Defra) in MS Access to obtain the nutrient intake per food for each
household. These intakes were then divided by the number of individuals in the household and divided
by 14 to obtain the mean daily nutrient intake per person for each food. The resultant data was exported
to SPSS. In order to calculate mean population intake it was also necessary to add information on zero
intake of foods per household. This was carried out by listing one occurrence of each food code by each
household – i.e. listing the 517 (of the 522 food codes that nutrient information is available for) by each
of the 5484 households, merging nutrient data for each household where available and re-coding all
missing values as zero.
Preliminary analysis highlighted the need to group similar foods in order to determine results for the
contribution of foods to energy, the macronutrients and NSP. The way that the NDNS present similar
data was consulted prior to grouping foods (Henderson et al. 2003). Preliminary grouping in
collaboration with FSAS resulted in 65 food groupings being established (of which 2 groups have been
used for those foods of little nutritional value and those food codes that may have a substantial nutrient
contribution but were too heterogeneous or too difficult to group with other foods (unclassified foods,
the largest component being “unspecified meal e.g. 'meal', 'school meal' or 'meal at work'”– a
breakdown of all unclassified foods can be found in Appendix 3)). A further 8 combined “total” food
groups were also established e.g. ‘total fruit and vegetables’ which was an addition of the fruit,
vegetable and fruit (and vegetable) juice groups. Appendix 2 lists the 73 food groupings with Appendix

4
3 providing detail on the breakdown of each of these food groupings by food code. As this work was
exploratory in nature, these food groupings are broad and are different to those used by Wrieden and
Barton (2015) in that they do not consider the different components of composite dishes / items. For
example the 'total processed red meat' group includes the carbohydrate component for some items
(e.g. pastry) and the 'fruit and vegetable' group does not include the vegetable component of composite
dishes (e.g. Bolognese, pizza etc.). Mean daily intakes per person of each of the food groupings were
calculated and zero intakes were added for non-consumers as described above.
2.1 Analysis of Data
Due to the multi-staged stratified sampling procedure of the LCF, data were analysed using descriptive
statistics and general linear models within the complex samples module of SPSS, version 21 (SPSS Inc.,
Chicago, IL, USA) and weighted according to the population in Scotland. The data were weighted so that
estimates obtained for mean food nutrient intake more accurately reflected that of the population in
Scotland and household composition. The data were weighted according to the sampling methodology
of the original data collected by ONS (Office for National Statistics, 2010) to reduce the effect of non-
response bias and to ensure that estimates obtained more accurately reflected that of the Scottish
population and household composition. The weights were produced in two stages: firstly the data were
weighted to compensate for non-response (sample-based weighting) and secondly the sample
distribution was weighted so that it matched the population distribution in terms of region, age group
and sex (population based weighting) (Department for Environment Food & Rural Affairs (Defra),
2013b).The weights were provided by Defra.
Linear associations between the contribution of each food group to energy or nutrient intake over time
or by SIMD quintile were assessed by linear regression. Wald tests were used to give an indication of
statistical significance for differences and trends and adjustment for multiple comparisons was made
using the least significance difference method.
2.2 Presentation of Results
Results are presented for the key contributing food groupings, and full results of the 67 food groupings
and 8 total groups can be provided in Excel spreadsheets on request. Results are provided for population
data (i.e. includes consumers and non-consumers) for the % contribution of each food grouping to the
total nutrient intake for energy in kcal, and for fat, saturated fat, NMES and NSP in g.

5
Differences in Contributing Foods over Time
The tables presenting results for 2001 to 2012 have been ordered in descending order from the highest
overall contributor of energy, fat, saturated fat, NMES or NSP, for food groupings that contribute to
more than 1% of total intake. The tables also provide results on household and eaten out consumption
and for time periods 2001-2003, 2004-2006, 2007-2009 and 2010-2012. As household consumption
makes the greatest contribution (on the whole) to total consumption, the household column is ordered
correctly in descending order, however this is not the case for eaten out consumption. P-values were
calculated for the linear trend over time of the contributing amount in kcal or g rather than the %
contribution.
Differences in Contributing Foods by SIMD
For the tables presenting analysis by SIMD, a pragmatic decision was taken to present only the results
for food groupings where there was both a significant difference for linear trend and an absolute
difference between SIMD quintile 1 and SIMD quintile 5 which was greater than or equal to 20% (5% for
energy) of the difference between the means for SIMD quintile 1 and SIMD quintile 5 from the 2010-
2012 SIMD analysis. Percentage contributions provided are based on the total intake for the SIMD
quintile rather than that of the overall population. P-values were calculated for the linear trend of the
contributing amount in kcal or g rather than the % contribution. The absolute difference column is the
absolute difference between the most and the least deprived quintile and is a simple measure of
inequality. A positive figure shows that contribution of the food grouping is greater in the most deprived
quintile and a negative figure shows that contribution of the food grouping is greater in the least
deprived quintile.

6
3. RESULTS
3.1 Contribution of Foods to Intakes of Energy, Macronutrients and Fibre
Contribution to Energy Intake
Table 1 shows that the highest contributors to energy were total confectionery and sweet biscuits
(9.7%), bread and rolls (8.1%), total processed red meat (7.5%), total milk (6.1%) and unclassified foods
(5.6%). With the exception of unclassified foods and sandwiches, household consumption provided the
greatest proportion of total energy for each of the food groupings. The highest contributors to total
energy from eaten out foods and drinks were unclassified foods (4.1%), alcoholic drinks (1.2%),
sandwiches (1.2%), total processed red meat (0.9%), sugar containing soft drinks (0.8%), total
confectionery and sweet biscuits (0.6%), and processed potatoes (0.7%).
Contribution to Fat Intake
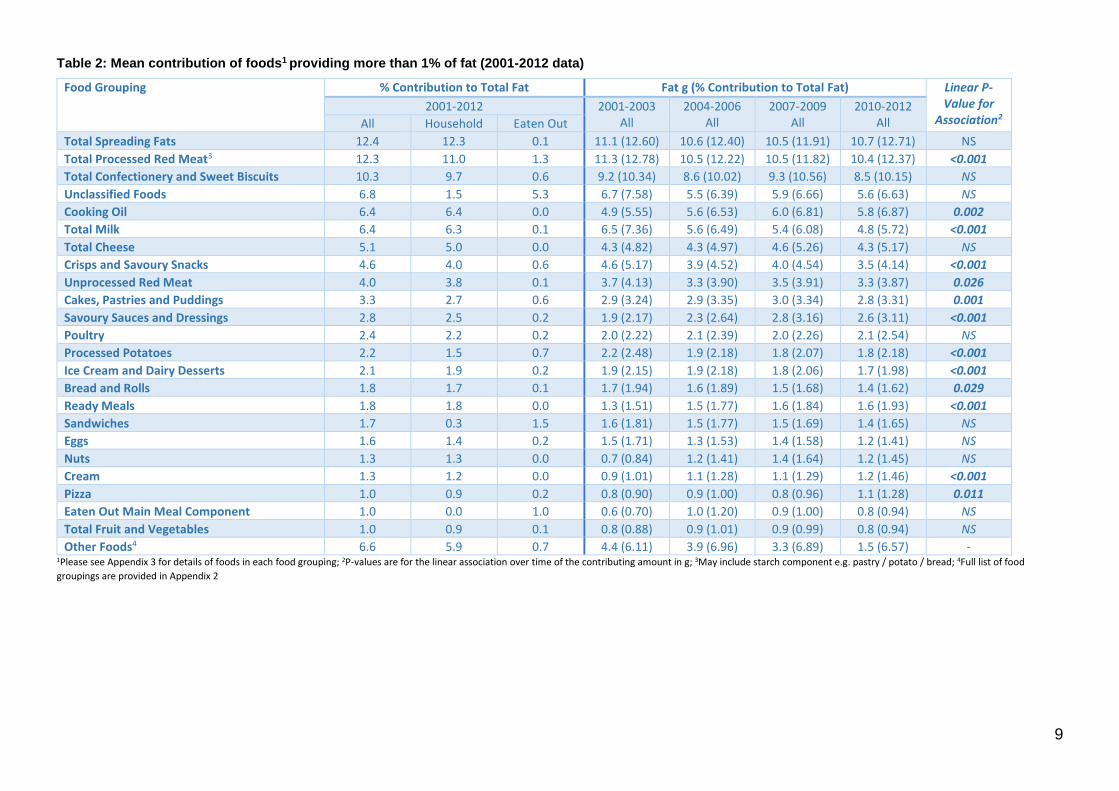
Table 2 shows that the highest contributors to fat were total spreading fats (12.4%), total processed red
meat (12.3%), total confectionery and sweet biscuits (10.3%), unclassified foods (6.8%), cooking oil
(6.4%), total milk (6.4%) and total cheese (5.1%). With the exception of unclassified foods, sandwiches
and eaten out main meal components, household consumption provided the greatest proportion of fat
for each of the food groupings. The highest contributors to fat from eaten out foods and drinks were
unclassified foods (5.3%), sandwiches (1.5%), total processed red meat (1.3%), eaten out main meal
components (1.0%), processed potatoes (0.7%), total confectionery and sweet biscuits (0.6%), crisps and
savoury snacks (0.6%) and cakes, pastries and puddings (0.6%).
Contribution to Saturated Fat Intake
Table 3 shows that the highest contributors to saturated fat were total spreading fats (14.2%), total
confectionery and sweet biscuits (14.0%), total processed red meat (12.1%), total milk (10.3%), total
cheese (8.2%), and unclassified foods (5.5%). With the exception of unclassified foods and sandwiches,
household consumption provided the greatest proportion of saturated fat for each of the food
groupings. The highest contributors to saturated fat from eaten out foods and drinks were unclassified
foods (3.6%), total processed red meat (1.3%), sandwiches (1.1%), total confectionery and sweet biscuits
(0.8%), crisps and savoury snacks (0.6%) and cakes, pastries and puddings (0.6%).
Contribution to NMES Intake
Table 4 shows that the highest contributors to NMES were sugar containing soft drinks (24.4%), total
confectionery and sweet biscuits (23.4%), sugar (14.6%), total fruit and vegetables (7.4%) and cakes,
pastries and puddings (5.8%). For all food groupings, household consumption provided the greatest
7
proportion of NMES. The highest contributors to NMES from eaten out foods and drinks were sugar-
containing soft drinks (4.6%), total confectionery and sweet biscuits (2.1%), alcoholic drinks (2.0%) and
cakes, pastries and puddings (0.6%)
Contribution to NSP Intake
Table 5 shows that the highest contributors to NSP were total fruit and vegetables (24.5%), bread and
rolls (15.4%), total breakfast cereals (10.1%), and unclassified foods (9.1%). With the exception of
unclassified foods, sandwiches and eaten out main meal components, household consumption provided
the greatest proportion of NSP for each of the food groupings. The highest contributors to NSP from
eaten out foods and drinks were unclassified foods (6.9%), processed potatoes (1.2%), sandwiches
(1.2%), fruit and vegetables (0.8%) crisps and savoury snacks (0.6%) and total processed red meat (from
non-meat component) (0.5%).
Contribution Over Time
Although statistically significant changes over time were found in the contribution of foods to energy,
fat, saturated fat, NMES and NSP, the magnitude of these differences was small.
In terms of contribution to energy, foods for which a significant decrease in the absolute amount
contributed also resulted in the percentage contribution to energy decreasing, were bread and rolls,
total milk and sugar containing soft drinks. Conversely the contribution from savoury sauces and
dressings, ready meals and pizza to energy increased over the four 3 year periods.
In terms of foods contributing to fat and saturated fat over the four 3-year periods, total milk, crisps and
savoury snacks, and bread and rolls decreased significantly in both absolute amount and in the
percentage contribution as did ice cream and dairy desserts for fat only. In contrast, contribution from
cream increased as did ready meals for fat only.
For NMES, sugar containing soft drinks contributed an average of 22.5g (26% of total NMES) in 2001-
2003 but this had decreased to 17g (22%) by 2010-2012.
A significant decrease in the contribution of bread and rolls, and crisps and savoury snacks, to NSP was
seen in absolute terms which was reflected in a decreasing percentage contributed. However, a small
significant increase in the contribution from pasta, rice and noodles and other baked goods (i.e. items
such as non-standard breads such as garlic bread, teacakes etc.) was observed.

8
Table 1: Mean contribution of foods1 providing more than 1% of energy (2001-2012 data)
Food Grouping % Contribution to Total Kcal Kcal (% Contribution to Total Kcal) Linear P-Value for
Association2 2001-2012 2001-2003
All 2004-2006
All 2007-2009
All 2010-2012
All All Household Eaten Out
Total Confectionery and Sweet Biscuits 9.7 9.1 0.6 208 (9.84) 194 (9.47) 211 (10.05) 191 (9.55) NS
Bread and Rolls 8.1 7.9 0.2 189 (8.94) 172 (8.40) 157 (7.51) 147 (7.37) <0.001
Total Processed Red Meat3 7.5 6.6 0.9 163 (7.70) 152 (7.40) 152 (7.25) 151 (7.55) 0.020
Total Milk 6.1 5.9 0.1 139 (6.57) 125 (6.07) 124 (5.92) 113 (5.66) <0.001
Unclassified Foods 5.6 1.5 4.1 130 (6.17) 108 (5.27) 116 (5.55) 112 (5.58) NS
Total Fruit and Vegetables 4.9 4.7 0.2 93.7 (4.43) 102 (4.99) 106 (5.08) 98.1 (4.91) NS
Total Spreading Fats 4.7 4.7 0.0 102 (4.81) 97.0 (4.72) 95.5 (4.56) 96.8 (4.84) NS
Alcoholic Drinks 3.9 2.7 1.2 82.3 (3.89) 83.3 (4.06) 76.5 (3.65) 79.6 (3.98) NS
Sugar Containing Soft Drinks 3.7 3.0 0.8 87.3 (4.13) 81.5 (3.97) 75.5 (3.60) 65.4 (3.27) <0.001
Total Breakfast Cereal 3.6 3.6 0.0 69.8 (3.30) 70.5 (3.43) 82.4 (3.94) 77.9 (3.90) 0.005
Crisps and Savoury Snacks 3.2 2.9 0.4 75.1 (3.55) 63.4 (3.09) 67.5 (3.22) 61.9 (3.09) <0.001
Cakes, Pastries and Puddings 3.0 2.6 0.4 64.1 (3.04) 64.1 (3.12) 63.7 (3.04) 59.6 (2.98) NS
Pasta, Rice and Noodles 2.8 2.6 0.2 56.7 (2.68) 53.8 (2.62) 58.1 (2.77) 62.4 (3.12) NS
Total Cheese 2.6 2.5 0.0 51.6 (2.44) 51.6 (2.51) 56.1 (2.68) 52.8 (2.64) NS
Unprocessed Red Meat 2.5 2.4 0.1 55.6 (2.63) 51.4 (2.50) 52.2 (2.49) 50.2 (2.51) NS
Cooking Oil 2.4 2.4 0.0 44.2 (2.09) 50.5 (2.46) 54.2 (2.59) 52.0 (2.60) NS
Processed Potatoes 2.4 1.8 0.7 55.5 (2.63) 47.7 (2.32) 47.9 (2.29) 49.9 (2.50) 0.016
Sugar 2.2 2.2 0.0 51.3 (2.43) 41.9 (2.04) 42.4 (2.03) 43.3 (2.17) NS
Poultry 1.8 1.7 0.1 37.0 (1.75) 38.3 (1.87) 37.4 (1.78) 39.1 (1.95) NS
Savoury Sauces and Dressings 1.7 1.6 0.1 29.8 (1.41) 33.2 (1.62) 39.4 (1.88) 37.6 (1.88) <0.001
Ice Cream and Dairy Desserts 1.7 1.6 0.1 34.8 (1.65) 34.5 (1.68) 34.5 (1.65) 34.3 (1.72) NS
Potatoes 1.5 1.4 0.2 26.0 (1.23) 36.2 (1.77) 33.6 (1.60) 30.7 (1.54) 0.009
Ready Meals 1.5 1.5 0.0 28.0 (1.33) 31.2 (1.52) 32.1 (1.53) 33.1 (1.66) 0.001
Sandwiches 1.4 0.2 1.2 31.3 (1.48) 30.1 (1.46) 29.4 (1.40) 27.4 (1.37) 0.029
Other Baked Goods 1.4 1.3 0.1 24.6 (1.17) 28.4 (1.38) 32.7 (1.56) 31.2 (1.56) <0.001
Pizza 1.2 1.0 0.2 21.7 (1.03) 23.1 (1.13) 23.1 (1.10) 28.8 (1.44) <0.001
Yoghurt and Fromage Frais 1.1 1.1 0.0 18.3 (0.86) 23.1 (1.13) 23.5 (1.12) 23.3 (1.16) <0.001
Other Foods4 7.6 6.3 1.3 143 (6.82) 165 (8.00) 170 (8.16) 149 (5.34) - 1Please see Appendix 3 for details of foods in each food grouping; 2P-values are for the linear association over time of the contributing amount in kcal;.3May include starch component e.g. pastry / potato / bread; 4Full list of food
groupings are provided in Appendix 2
9
Table 2: Mean contribution of foods1 providing more than 1% of fat (2001-2012 data)
Food Grouping % Contribution to Total Fat Fat g (% Contribution to Total Fat) Linear P-Value for
Association2 2001-2012 2001-2003
All 2004-2006
All 2007-2009
All 2010-2012
All All Household Eaten Out
Total Spreading Fats 12.4 12.3 0.1 11.1 (12.60) 10.6 (12.40) 10.5 (11.91) 10.7 (12.71) NS
Total Processed Red Meat3 12.3 11.0 1.3 11.3 (12.78) 10.5 (12.22) 10.5 (11.82) 10.4 (12.37) <0.001
Total Confectionery and Sweet Biscuits 10.3 9.7 0.6 9.2 (10.34) 8.6 (10.02) 9.3 (10.56) 8.5 (10.15) NS
Unclassified Foods 6.8 1.5 5.3 6.7 (7.58) 5.5 (6.39) 5.9 (6.66) 5.6 (6.63) NS
Cooking Oil 6.4 6.4 0.0 4.9 (5.55) 5.6 (6.53) 6.0 (6.81) 5.8 (6.87) 0.002
Total Milk 6.4 6.3 0.1 6.5 (7.36) 5.6 (6.49) 5.4 (6.08) 4.8 (5.72) <0.001
Total Cheese 5.1 5.0 0.0 4.3 (4.82) 4.3 (4.97) 4.6 (5.26) 4.3 (5.17) NS
Crisps and Savoury Snacks 4.6 4.0 0.6 4.6 (5.17) 3.9 (4.52) 4.0 (4.54) 3.5 (4.14) <0.001
Unprocessed Red Meat 4.0 3.8 0.1 3.7 (4.13) 3.3 (3.90) 3.5 (3.91) 3.3 (3.87) 0.026
Cakes, Pastries and Puddings 3.3 2.7 0.6 2.9 (3.24) 2.9 (3.35) 3.0 (3.34) 2.8 (3.31) 0.001
Savoury Sauces and Dressings 2.8 2.5 0.2 1.9 (2.17) 2.3 (2.64) 2.8 (3.16) 2.6 (3.11) <0.001
Poultry 2.4 2.2 0.2 2.0 (2.22) 2.1 (2.39) 2.0 (2.26) 2.1 (2.54) NS
Processed Potatoes 2.2 1.5 0.7 2.2 (2.48) 1.9 (2.18) 1.8 (2.07) 1.8 (2.18) <0.001
Ice Cream and Dairy Desserts 2.1 1.9 0.2 1.9 (2.15) 1.9 (2.18) 1.8 (2.06) 1.7 (1.98) <0.001
Bread and Rolls 1.8 1.7 0.1 1.7 (1.94) 1.6 (1.89) 1.5 (1.68) 1.4 (1.62) 0.029
Ready Meals 1.8 1.8 0.0 1.3 (1.51) 1.5 (1.77) 1.6 (1.84) 1.6 (1.93) <0.001
Sandwiches 1.7 0.3 1.5 1.6 (1.81) 1.5 (1.77) 1.5 (1.69) 1.4 (1.65) NS
Eggs 1.6 1.4 0.2 1.5 (1.71) 1.3 (1.53) 1.4 (1.58) 1.2 (1.41) NS
Nuts 1.3 1.3 0.0 0.7 (0.84) 1.2 (1.41) 1.4 (1.64) 1.2 (1.45) NS
Cream 1.3 1.2 0.0 0.9 (1.01) 1.1 (1.28) 1.1 (1.29) 1.2 (1.46) <0.001
Pizza 1.0 0.9 0.2 0.8 (0.90) 0.9 (1.00) 0.8 (0.96) 1.1 (1.28) 0.011
Eaten Out Main Meal Component 1.0 0.0 1.0 0.6 (0.70) 1.0 (1.20) 0.9 (1.00) 0.8 (0.94) NS
Total Fruit and Vegetables 1.0 0.9 0.1 0.8 (0.88) 0.9 (1.01) 0.9 (0.99) 0.8 (0.94) NS
Other Foods4 6.6 5.9 0.7 4.4 (6.11) 3.9 (6.96) 3.3 (6.89) 1.5 (6.57) - 1Please see Appendix 3 for details of foods in each food grouping; 2P-values are for the linear association over time of the contributing amount in g; 3May include starch component e.g. pastry / potato / bread; 4Full list of food
groupings are provided in Appendix 2

10
Table 3: Mean contribution of foods1 providing more than 1% of saturated fat (2001-2012 data)
Food Grouping % Contribution to Saturated Fat Saturated Fat g (% Contribution to Saturated Fat) Linear P-Value for
Association2 2001-2012 2001-2003
All 2004-2006
All 2007-2009
All 2010-2012
All All Household Eaten Out
Total Spreading Fats 14.2 14.1 0.2 4.6 (13.18) 4.9 (14.32) 4.7 (13.89) 5.0 (15.68) NS
Total Confectionery and Sweet Biscuits 14.0 13.2 0.8 4.9 (14.08) 4.6 (13.54) 4.9 (14.44) 4.4 (13.89) 0.042
Total Processed Red Meat3 12.1 10.8 1.3 4.4 (12.41) 4.0 (11.88) 4.0 (11.70) 4.0 (12.41) 0.007
Total Milk 10.3 10.1 0.2 4.1 (11.65) 3.5 (10.28) 3.4 (9.80) 3.0 (9.31) <0.001
Total Cheese 8.2 8.1 0.1 2.7 (7.72) 2.7 (7.99) 3.0 (8.63) 2.7 (8.55) NS
Unclassified Foods 5.5 1.9 3.6 2.0 (5.80) 1.7 (5.05) 1.9 (5.50) 1.8 (5.60) NS
Unprocessed Red Meat 4.3 4.2 0.1 1.5 (4.40) 1.4 (4.20) 1.5 (4.29) 1.4 (4.29) NS
Crisps and Savoury Snacks 3.7 3.0 0.6 1.8 (5.18) 1.5 (4.48) 1.2 (3.38) 0.5 (1.52) <0.001
Cakes, Pastries and Puddings 3.6 3.1 0.6 1.2 (3.56) 1.2 (3.68) 1.3 (3.66) 1.2 (3.65) NS
Ice Cream and Dairy Desserts 3.5 3.2 0.3 1.2 (3.52) 1.2 (3.62) 1.2 (3.48) 1.1 (3.44) NS
Cream 2.0 2.0 0.0 0.6 (1.61) 0.7 (2.05) 0.7 (2.11) 0.8 (2.42) 0.002
Cooking Oil 1.9 1.9 0.0 0.6 (1.57) 0.6 (1.89) 0.7 (2.02) 0.7 (2.08) NS
Poultry 1.7 1.6 0.1 0.6 (1.57) 0.6 (1.71) 0.6 (1.64) 0.6 (1.87) NS
Sandwiches 1.3 0.2 1.1 0.5 (1.36) 0.4 (1.33) 0.5 (1.33) 0.4 (1.33) NS
Ready Meals 1.2 1.2 0.0 0.4 (1.12) 0.4 (1.26) 0.4 (1.18) 0.4 (1.23) NS
Eggs 1.1 1.0 0.1 0.4 (1.19) 0.4 (1.06) 0.4 (1.13) 0.3 (1.00) <0.001
Pizza 1.1 0.9 0.2 0.3 (0.93) 0.4 (1.04) 0.3 (1.02) 0.4 (1.38) <0.001
Processed Potatoes 1.1 0.9 0.2 0.4 (1.25) 0.4 (1.11) 0.3 (0.95) 0.3 (1.04) <0.001
Savoury Sauces and Dressings 1.1 0.9 0.2 0.3 (0.87) 0.4 (1.10) 0.4 (1.22) 0.3 (1.07) 0.015
Bread and Rolls 1.0 0.9 0.2 0.4 (1.11) 0.4 (1.10) 0.3 (0.99) 0.3 (0.91) <0.001
Other Foods4 7.0 6.1 0.9 2.1 (5.88) 2.5 (7.30) 2.6 (7.65) 2.3 (7.33) - 1Please see Appendix 3 for details of foods in each food grouping; 2P-values are for the linear association over time of the contributing amount in g; 3May include starch component e.g. pastry / potato / bread; 4Full list of food
groupings are provided in Appendix 2

11
Table 4: Mean contribution of foods1 providing more than 1% of NMES (2001-2012 data)
Food Grouping % Contribution to NMES NMES g (% Contribution to NMES) Linear P-Value for
Association2 2001-2012 2001-2003
All 2004-2006
All 2007-2009
All 2010-2012
All All Household Eaten Out
Sugar Containing Soft Drinks 24.4 19.8 4.6 22.5 (25.85) 21.1 (25.66) 19.5 (23.74) 17.0 (22.27) <0.001
Total Confectionery and Sweet Biscuits 23.4 21.3 2.1 20.2 (23.31) 18.6 (22.67) 19.7 (23.98) 18.1 (23.77) 0.020
Sugar 14.6 14.6 0.0 13.7 (15.73) 11.2 (13.61) 11.3 (13.77) 11.5 (15.12) NS
Total Fruit and Vegetables 7.4 7.0 0.4 5.7 (6.61) 6.1 (7.40) 6.4 (7.80) 5.9 (7.75) NS
Cakes, Pastries and Puddings 5.8 5.2 0.6 4.9 (5.60) 4.9 (6.03) 4.8 (5.82) 4.4 (5.79) 0.032
Jam, marmalade, honey and sweet spreads 4.3 4.3 0.1 3.2 (3.72) 3.5 (4.31) 3.9 (4.74) 3.5 (4.57) NS
Ice Cream and Dairy Desserts 3.7 3.4 0.3 2.9 (3.29) 2.8 (3.44) 3.0 (3.6) 3.3 (4.37) 0.011
Total Breakfast Cereal 3.3 3.3 0.0 2.9 (3.29) 2.6 (3.11) 2.9 (3.58) 2.5 (3.24) NS
Alcoholic Drinks 3.0 1.0 2.0 2.7 (3.13) 2.7 (3.32) 2.3 (2.76) 2.2 (2.90) <0.001
Savoury Sauces and Dressings 2.4 2.4 0.0 2.0 (2.32) 1.9 (2.37) 2.0 (2.46) 2.0 (2.61) NS
Yoghurt and Fromage Frais 2.1 2.1 0.0 1.5 (1.67) 1.8 (2.24) 1.9 (2.28) 1.9 (2.43) <0.001
Unclassified Foods 1.0 0.7 0.4 0.9 (1.02) 0.9 (1.04) 0.9 (1.07) 0.8 (1.02) NS
Other Foods3 4.5 3.9 0.6 3.9 (4.46) 4.0 (4.81) 3.6 (4.39) 3.2 (4.16) - 1Please see Appendix 3 for details of foods in each food grouping; 2P-values are for the linear association over time of the contributing amount in g; 3Full list of food groupings are provided in Appendix 2

12
Table 5: Mean contribution of foods1 providing more than 1% of NSP (2001-2012 data)
Food Grouping % Contribution to NSP NSP g (% Contribution to NSP) Linear P-Value for
Association2 2001-2012 2001-2003
All 2004-2006
All 2007-2009
All 2010-2012
All All Household Eaten Out
Total Fruit and Vegetables 24.5 23.7 0.8 2.9 (23.55) 3.1 (25.15) 3.2 (25.06) 2.9 (24.12) NS
Bread and Rolls 15.4 15.2 0.2 2.0 (16.38) 2.0 (16.17) 1.9 (14.68) 1.8 (14.43) <0.001
Total Breakfast Cereal 10.1 10.1 0.0 1.3 (10.52) 1.2 (9.50) 1.3 (10.33) 1.2 (9.98) NS
Unclassified Foods 9.1 2.2 6.9 1.3 (10.46) 1.0 (8.39) 1.1 (8.70) 1.1 (8.73) NS
Total Confectionery and Sweet Biscuits 4.9 4.8 0.1 0.6 (4.64) 0.5 (4.36) 0.6 (4.83) 0.7 (5.65) <0.001
Processed Potatoes 4.7 3.5 1.2 0.6 (5.16) 0.5 (4.30) 0.6 (4.35) 0.6 (5.10) NS
Crisps and Savoury Snacks 4.3 3.6 0.6 0.7 (5.37) 0.6 (4.53) 0.5 (3.72) 0.4 (3.48) <0.001
Potatoes 4.0 3.6 0.4 0.4 (3.23) 0.6 (4.78) 0.5 (4.29) 0.4 (3.59) NS
Pasta, Rice and Noodles 3.5 3.3 0.2 0.4 (3.06) 0.4 (3.33) 0.5 (3.74) 0.5 (3.85) 0.001
Total Processed Red Meat3 2.5 2.0 0.5 0.3 (2.54) 0.3 (2.36) 0.3 (2.31) 0.3 (2.76) 0.045
Other Baked Goods 2.0 1.9 0.1 0.2 (1.65) 0.2 (1.95) 0.3 (2.24) 0.3 (2.28) <0.001
Cakes, Pastries and Puddings 1.6 1.3 0.2 0.2 (1.49) 0.2 (1.49) 0.2 (1.61) 0.2 (1.76) <0.001
Ready Meals 1.6 1.6 0.0 0.2 (1.42) 0.2 (1.50) 0.2 (1.53) 0.2 (1.82) <0.001
Pizza 1.5 1.2 0.2 0.2 (1.39) 0.2 (1.46) 0.2 (1.35) 0.2 (1.65) 0.017
Savoury Sauces and Dressings 1.5 1.4 0.1 0.2 (1.26) 0.2 (1.50) 0.2 (1.58) 0.2 (1.64) <0.001
Flour 1.3 1.3 0.0 0.1 (1.01) 0.2 (1.22) 0.2 (1.64) 0.2 (1.31) 0.046
Sandwiches 1.3 0.2 1.2 0.2 (1.40) 0.2 (1.36) 0.2 (1.30) 0.2 (1.26) NS
Eaten Out Main Meal Component 1.1 0.0 1.1 0.1 (0.84) 0.2 (1.29) 0.1 (1.17) 0.1 (1.10) NS
Nuts 1.1 1.1 0.0 0.1 (0.73) 0.1 (1.17) 0.2 (1.36) 0.1 (1.20) 0.001
Soup 1.1 0.6 0.5 0.1 (1.10) 0.1 (1.09) 0.1 (0.99) 0.1 (1.17) NS
Other Foods3 3.1 2.8 0.3 0.3 (2.80) 0.4 (3.09) 0.4 (3.21) 0.4 (3.12) - 1Please see Appendix 3 for details of foods in each food grouping; 2P-values are for the linear association over time of the contributing amount in g; 3May include starch component e.g. pastry / potato / bread; 4Full list of food
groupings are provided in Appendix 2

13
3.2 Contribution of Foods to Intakes of Energy, Macronutrients and Fibre by SIMD
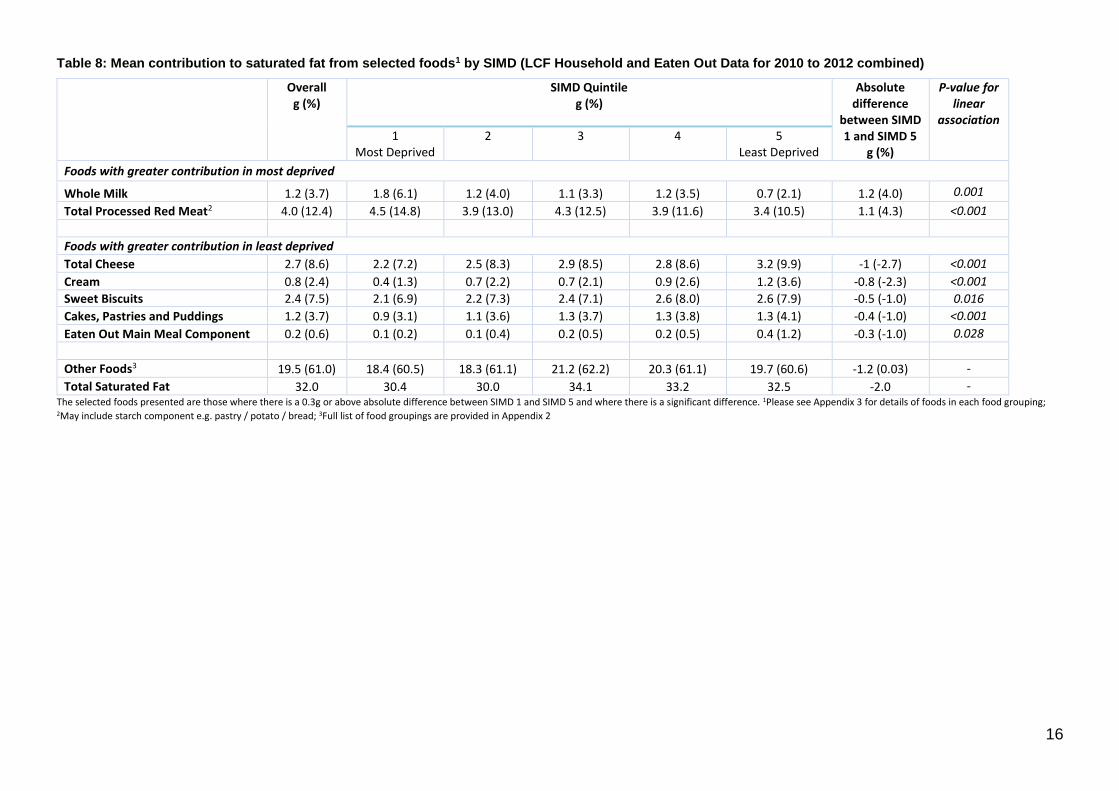
Tables 6, 7 and 8 provide the results for the analysis of foods contributing to energy, fat and saturated fat
by SIMD for 2010 to 2012. As may be expected, the foods within each of the three tables are broadly
similar with the numbers of foods reducing in line with the reduction in intake. In all 3 tables the number
of food groupings that contributed more energy, fat and saturated fat to the least deprived compared to
the most deprived is greater. It should be noted that the majority of foods that contributed more energy,
fat or saturated fat to the most deprived are already monitored (Wrieden and Barton, 2015) however
greater intakes of cheese, nuts, cream and poultry by the least deprived are not. This explains why
monitoring results, which suggested that there were clear differences in the intake of some foods by
deprivation, did not necessarily translate into differences in macronutrient intakes.
Table 9 shows that the only foods contributing to NMES intake for which there were absolute differences
between SIMD quintiles based on the cut-off criteria previously defined were sugar-containing soft drinks
and sugar. It should be noted that these 2 food groupings combined contributed more NMES (10.2g) to
the diet of the most deprived than the overall difference (3.1g) and that the least deprived consumed
more NMES from other sources, in particular fruit and vegetable juices, and cakes, pastries and puddings.
Table 10 shows that the only foods contributing to NSP intake for which there were absolute differences
between SIMD quintiles based on the cut-off criteria used were total fruit and vegetables and total
breakfast cereal. They contributed the majority of the additional NSP consumed by the least deprived
compared to the most deprived and as such continue to be two key food groupings to be targeted in
health promotion programmes. However, mean intakes in the least deprived also remained far below
the recommended population average of 18g/day, and were just above the recommended individual
minimum of 12g/day, highlighting that the majority of the population would benefit from increasing NSP
intake.

14
Table 6: Mean contribution to energy from selected foods1 by SIMD (LCF Household and Eaten Out Data for 2010 to 2012 combined)
Overall kcal (%)
SIMD Quintile kcal (%)
Absolute difference
between SIMD 1 and SIMD 5
kcal (%)
P-value for linear
association 1 Most Deprived
2 3 4 5
Least Deprived
Foods with greater contribution in most deprived Total Processed Red Meat2 151 (7.6) 169.8 (8.7) 149.2 (7.9) 161.5 (7.6) 145.7 (7.1) 130.7 (6.5) 39 (2.2) <0.001
Whole Milk 30.9 (1.5) 48 (2.5) 30.8 (1.6) 29.5 (1.4) 29.9 (1.5) 17.5 (0.9) 30.4 (1.6) 0.001
Sugar Containing Soft Drinks 65.4 (3.3) 84.7 (4.4) 60.1 (3.2) 61.4 (2.9) 58.9 (2.9) 60.5 (3) 24.3 (1.3) 0.005
Processed Potatoes 49.9 (2.5) 59.7 (3.1) 51.1 (2.7) 50.4 (2.4) 49.1 (2.4) 40.5 (2) 19.2 (1.1) 0.002
Sugar 43.3 (2.2) 45.4 (2.3) 55.1 (2.9) 49.5 (2.3) 37.1 (1.8) 31.8 (1.6) 13.6 (0.8) 0.007
Foods with greater contribution in least deprived
Total Fruit and Vegetables 98.1 (4.9) 76.7 (3.9) 82.1 (4.4) 112.4 (5.3) 107.4 (5.2) 111.3 (5.6) -34.5 (-1.6) <0.001
Total Breakfast Cereal 77.9 (3.9) 60.8 (3.1) 69.5 (3.7) 83.8 (4) 86.6 (4.2) 88.5 (4.4) -27.7 (-1.3) 0.002
Eaten Out Main Meal Component 15.7 (0.8) 4.8 (0.2) 12.6 (0.7) 18.6 (0.9) 13.6 (0.7) 27.1 (1.4) -22.3 (-1.1) 0.037
Cakes, Pastries and Puddings 59.6 (3) 47.7 (2.5) 54.1 (2.9) 64.3 (3) 63.7 (3.1) 67.7 (3.4) -20 (-0.9) <0.001
Total Cheese 52.8 (2.6) 42.5 (2.2) 48 (2.5) 55.5 (2.6) 54.8 (2.7) 62.1 (3.1) -19.7 (-0.9) <0.001
Sweet Biscuits 98.8 (4.9) 87.9 (4.5) 91.7 (4.9) 98.9 (4.7) 109.8 (5.4) 105.9 (5.3) -18 (-0.8) 0.013
Other Baked Goods 31.2 (1.6) 22 (1.1) 29 (1.5) 35.4 (1.7) 32.8 (1.6) 36.5 (1.8) -14.5 (-0.7) <0.001
Nuts 14.3 (0.7) 7.5 (0.4) 10.7 (0.6) 16.1 (0.8) 14.8 (0.7) 21.3 (1.1) -13.8 (-0.7) 0.001
Flour 15.3 (0.8) 3.5 (0.2) 17.3 (0.9) 15.8 (0.7) 26.8 (1.3) 15.1 (0.8) -11.6 (-0.6) 0.048
Cream 11.6 (0.6) 6.1 (0.3) 10.1 (0.5) 10.7 (0.5) 12.9 (0.6) 17.4 (0.9) -11.3 (-0.6) <0.001
Other Foods3 1183 (59.2) 1175 (60.5) 1113 (59.1) 1255 (59.2) 1203 (58.8) 1170 (58.4) 5.4 (2.1) -
Total Energy 1999 1942 1885 2119 2047 2004 -61.4 - The selected foods presented are those where there is an 11kcal or above absolute difference between SIMD 1 and SIMD 5 and where there is a significant difference. 1Please see Appendix 3 for details of foods in each food grouping; 2May include starch component e.g. pastry / potato / bread; 3Full list of food groupings are provided in Appendix 2

15
Table 7: Mean contribution to fat from selected foods1 by SIMD (LCF Household and Eaten Out Data for 2010 to 2012 combined)
Overall g (%)
SIMD Quintile g (%)
Absolute difference
between SIMD 1 and SIMD 5
g (%)
P-value for linear
association 1
Most Deprived 2 3 4 5
Least Deprived
Foods with greater contribution in most deprived Total Processed Red Meat2 10.4 (12.4) 11.8 (14.4) 10.2 (1.0) 11.1 (12.6) 10.1 (11.5) 9.0 (10.7) 2.8 (3.7) <0.001
Whole Milk 1.9 (2.2) 2.9 (3.5) 1.9 (2.4) 1.8 (2.0) 1.8 (2.1) 1.1 (1.3) 1.8 (2.3) 0.001
Processed Potatoes 1.8 (2.2) 2.2 (2.7) 1.8 (2.3) 1.9 (2.1) 1.8 (2.1) 1.5 (1.8) 0.7 (0.9) 0.003
Foods with greater contribution in least deprived
Total Cheese 4.3 (5.2) 3.5 (4.3) 4.0 (5.0) 4.6 (5.2) 4.5 (5.2) 5.1 (6.1) -1.6 (-1.8) <0.001
Cream 1.2 (1.5) 0.6 (0.8) 1.1 (1.4) 1.1 (1.3) 1.4 (1.6) 1.8 (2.2) -1.2 (-1.4) <0.001
Eaten Out Main Meal Component 0.8 (0.9) 0.3 (0.3) 0.6 (0.8) 0.9 (1.0) 0.7 (0.8) 1.4 (1.7) -1.2 (-1.4) 0.037
Nuts 1.2 (1.5) 0.6 (0.8) 0.9 (1.2) 1.4 (1.6) 1.3 (1.4) 1.8 (2.2) -1.2 (-1.4) 0.001
Cakes, Pastries and Puddings 2.8 (3.3) 2.2 (2.7) 2.6 (3.2) 3.0 (3.4) 3.0 (3.4) 3.1 (3.8) -0.9 (-1.0) <0.001
Sweet Biscuits 4.7 (5.6) 4.2 (5.1) 4.4 (5.5) 4.8 (5.4) 5.2 (6.0) 5.1 (6.1) -0.9 (-0.9) 0.014
Ready Meals 1.6 (1.9) 1.3 (1.5) 1.7 (2.1) 1.7 (1.9) 1.8 (2.0) 1.8 (2.1) -0.5 (-0.6) 0.006
Semi-skimmed Milk 2.4 (2.8) 1.9 (2.3) 2.4 (3.1) 2.7 (3.0) 2.4 (2.8) 2.4 (2.9) -0.5 (-0.6) 0.055
Total Breakfast Cereal 0.8 (1.0) 0.5 (0.6) 0.7 (0.9) 0.9 (1.0) 0.9 (1.1) 1.0 (1.2) -0.5 (-0.5) <0.001
Poultry 2.1 (2.5) 1.9 (2.3) 1.9 (2.4) 2.1 (2.3) 2.5 (2.8) 2.3 (2.8) -0.4 (-0.4) 0.035
Sandwiches 1.4 (1.7) 1.2 (1.4) 1.2 (1.5) 1.5 (1.7) 1.5 (1.7) 1.6 (1.9) -0.4 (-0.5) 0.025
Unprocessed Fish 0.6 (0.8) 0.4 (0.5) 0.6 (0.7) 0.6 (0.6) 0.8 (1.0) 0.8 (1.0) -0.4 (-0.4) <0.001
Other Baked Goods 0.7 (0.9) 0.5 (0.6) 0.7 (0.8) 0.8 (0.9) 0.8 (0.9) 0.8 (1.0) -0.3 (-0.4) <0.001
Total Fruit and Vegetables 0.8 (0.9) 0.6 (0.8) 0.7 (0.9) 0.9 (1.0) 0.9 (1.0) 0.9 (1.1) -0.3 (-0.3) <0.001
Other Foods3 44.6 (53) 45.2 (55.3) 41.5 (52.6) 46.8 (52.8) 46.1 (52.7) 42.4 (50.5) 2.9 (4.8) -
Total Fat 84.1 81.8 78.9 88.6 87.5 83.9 -2.0 - The selected foods presented are those where there is a 0.3g or above absolute difference between SIMD 1 and SIMD 5 and where there is a significant difference. 1Please see Appendix 3 for details of foods in each food grouping; 2May include starch component e.g. pastry / potato / bread; 3Full list of food groupings are provided in Appendix 2
16
Table 8: Mean contribution to saturated fat from selected foods1 by SIMD (LCF Household and Eaten Out Data for 2010 to 2012 combined)
Overall g (%)
SIMD Quintile g (%)
Absolute difference
between SIMD 1 and SIMD 5
g (%)
P-value for linear
association 1
Most Deprived 2 3 4 5
Least Deprived
Foods with greater contribution in most deprived
Whole Milk 1.2 (3.7) 1.8 (6.1) 1.2 (4.0) 1.1 (3.3) 1.2 (3.5) 0.7 (2.1) 1.2 (4.0) 0.001
Total Processed Red Meat2 4.0 (12.4) 4.5 (14.8) 3.9 (13.0) 4.3 (12.5) 3.9 (11.6) 3.4 (10.5) 1.1 (4.3) <0.001
Foods with greater contribution in least deprived Total Cheese 2.7 (8.6) 2.2 (7.2) 2.5 (8.3) 2.9 (8.5) 2.8 (8.6) 3.2 (9.9) -1 (-2.7) <0.001
Cream 0.8 (2.4) 0.4 (1.3) 0.7 (2.2) 0.7 (2.1) 0.9 (2.6) 1.2 (3.6) -0.8 (-2.3) <0.001
Sweet Biscuits 2.4 (7.5) 2.1 (6.9) 2.2 (7.3) 2.4 (7.1) 2.6 (8.0) 2.6 (7.9) -0.5 (-1.0) 0.016
Cakes, Pastries and Puddings 1.2 (3.7) 0.9 (3.1) 1.1 (3.6) 1.3 (3.7) 1.3 (3.8) 1.3 (4.1) -0.4 (-1.0) <0.001
Eaten Out Main Meal Component 0.2 (0.6) 0.1 (0.2) 0.1 (0.4) 0.2 (0.5) 0.2 (0.5) 0.4 (1.2) -0.3 (-1.0) 0.028
Other Foods3 19.5 (61.0) 18.4 (60.5) 18.3 (61.1) 21.2 (62.2) 20.3 (61.1) 19.7 (60.6) -1.2 (0.03) -
Total Saturated Fat 32.0 30.4 30.0 34.1 33.2 32.5 -2.0 - The selected foods presented are those where there is a 0.3g or above absolute difference between SIMD 1 and SIMD 5 and where there is a significant difference. 1Please see Appendix 3 for details of foods in each food grouping; 2May include starch component e.g. pastry / potato / bread; 3Full list of food groupings are provided in Appendix 2

17
Table 9: Mean contribution to NMES from selected foods1 by SIMD (LCF Household and Eaten Out Data for 2010 to 2012 combined)
Overall g (%)
SIMD Quintile g (%)
Absolute difference
between SIMD 1 and SIMD 5
g (%)
P-value for linear
association 1
Most Deprived 2 3 4 5
Least Deprived
Foods with greater contribution in most deprived
Sugar Containing Soft Drinks 17.0 (22.3) 22.2 (28.8) 15.5 (20.8) 16.1 (19.7) 15.1 (20.3) 15.7 (21.1) 6.6 (7.6) 0.004
Sugar 11.5 (15.1) 12.1 (15.7) 14.7 (19.7) 13.2 (16.2) 9.9 (13.3) 8.5 (11.4) 3.6 (4.2) 0.002
Foods with greater contribution in least deprived Fruit (and veg) juice 4.1 (5.4) 3.2 (4.1) 3.2 (4.3) 5.0 (6.1) 4.2 (5.6) 4.9 (6.6) -1.7 (-2.5) 0.001
Cakes, Pastries and Puddings 4.4 (5.8) 3.5 (4.6) 3.9 (5.3) 4.8 (5.9) 4.7 (6.3) 5.0 (6.8) -1.5 (-2.2) <0.001
Jam, marmalade, honey and sweet spreads 3.5 (4.6) 2.8 (3.6) 2.8 (3.8) 4.4 (5.4) 3.4 (4.6) 4.0 (5.3) -1.2 (-1.7)
0.008
Sweet Biscuits 5.5 (7.3) 4.9 (6.3) 5.1 (6.9) 5.6 (6.9) 6.1 (8.3) 5.9 (8.0) -1.1 (-1.7) 0.014
Other Foods2 30.3 (39.7) 28.6 (37.0) 29.2 (39.2) 32.4 (39.8) 30.9 (41.6) 30.2 (40.7) -1.6 (-3.7) -
Total NMES 76.3 77.3 74.4 81.5 74.3 74.2 3.1 - The selected foods presented are those where there is a 1.0g or above absolute difference between SIMD 1 and SIMD 5 and where there is a significant difference. 1Please see Appendix 3 for details of foods in each food grouping; 2Full list of food groupings are provided in Appendix 2
Table 10: Mean contribution to NSP from selected foods1 by SIMD (LCF Household and Eaten Out Data for 2010 to 2012 combined)
Overall g (%)
SIMD Quintile g (%)
Absolute difference
between SIMD 1 and SIMD 5
g (%)
P-value for linear
association 1
Most Deprived 2 3 4 5
Least Deprived
Foods with greater contribution in least deprived Total Fruit and Vegetables 2.9 (24.1) 2.3 (20.8) 2.6 (22.7) 3.2 (24.8) 3.3 (25.5) 3.4 (26.0) -1.0 (-5.1) <0.001
Total Breakfast Cereal 1.2 (10.0) 0.9 (7.7) 1.1 (10.1) 1.3 (9.8) 1.4 (10.8) 1.4 (11.2) -0.6 (-3.5) <0.001
Other Foods2 8.1 (66.4) 8.0 (71.3) 7.5 (67.0) 8.4 (65.2) 8.0 (63.1) 8.1 (62.9) -0.2 (8.4) -
Total NSP 12.2 11.2 11.2 12.9 12.7 12.9 -1.8 - The selected foods presented are those where there is a 0.4g or above absolute difference between SIMD 1 and SIMD 5 and where there is a significant difference. 1Please see Appendix 3 for details of foods in each food grouping; 2Full list of food groupings are provided in Appendix 2

18
4. DISCUSSION
It is of concern that the largest contributors to energy, fat and NMES are foods that are often
described as “discretionary” and are not required as part of a healthy balanced diet, namely
confectionery and sweet biscuits, sugar-sweetened beverages, crisps and savoury snacks. The
results highlight that total confectionery and sweet biscuits, a category that is often considered
a high contributor of NMES, is also a high contributor of energy, fat and saturated fat. They
constitute the largest contributor to energy and saturated fat, providing almost 10% of energy
and 14% of saturated fat. It is also of interest that this group contributes a large proportion of
energy and saturated fat irrespective of socioeconomic position.
Given that the prevalence of overweight and obesity in adults aged 16 to 64 in Scotland rose from
52.4% in 1995 to 62.6% in 2013 (Bromley et al., 2014), even a small reduction in consumption of
these foods would assist greatly in reducing population energy intakes and moving the
population diet towards the Scottish Dietary Goals. For example, it would be possible to reduce
intakes by 120 kcals per person per day by reducing consumption from all of these discretionary
categories by a third, providing such foods are not substituted. The results show the importance
of targeting certain foods for reduction in the diet and for reformulation as advocated in
Supporting Healthy Choices (Scottish Government and Food Standards Agency in Scotland, 2014)
The majority of foods that contribute most energy, fat, saturated fat, NMES and NSP are already
monitored (Wrieden and Barton, 2015). The work has highlighted that certain foods that are not
monitored at present contribute an appreciable amount of energy, fat or saturated fat to the
diet. In particular, spreading fats, alcoholic drinks, cheese, cooking oil, ice cream and dairy
desserts, and cream together provide 15.8% of energy, 27.3% of fat and 29.8% of saturated fat.
Also, differences were found by deprivation level in foods not already monitored, namely the
contribution of cheese, cream and nuts to energy, fat and saturated fat. These additional foods
may warrant monitoring in the future. The finding that sugar containing soft drink consumption
has dropped (Wrieden and Barton, 2015) is also reflected in a drop in the contribution that sugar
containing soft drinks make to energy and NMES intake over time.
Whilst the proportion of energy, macronutrients and NSP obtained from eaten out foods is
relatively small, the results can be used to inform policies on catering, of which the most notable
is the contribution that sugar containing drinks makes to NMES in eating out. Sugar containing
soft drinks were the most frequently purchased beverage in a recent assessment of foods and

19
drinks consumed out of the home by the NPD Group. They found that around one-third of all
eating out of the home occasions included a soft drink, and around two-thirds of these were non-
diet (NPD Group Inc, 2014).
Further to scrutiny of results by the FSAS and the project steering group, it may be decided that
additional foods should be monitored on an annual basis. Additionally, it may be felt to be
worthwhile to track the contribution that certain food groupings make to nutrient intake over
time, e.g. the contribution that sugar containing soft drinks have made to energy and NMES
intake over time and the contribution that crisps and savoury snacks make to fat and saturated
fat in light of re-formulation work with industry. However it must be borne in mind that any
changes in nutrient intake due to recent product re-formulation are unlikely to have been found
over the last three years studied (2010-2012) as work with the Food Standards Agency in Scotland
and the food industry is ongoing, and this will be monitored in future years. The food
composition data used for this analysis are updated on a rolling basis, however some of the
market share data are out-dated, dating back to 1999, and require to be updated. Work is on-
going to update these market shares using data provided by KANTAR (a commercial market
research company) (Department for Environment Food & Rural Affairs (Defra), 2010). Data for
2010 onwards have been obtained by Defra from the Department of Health and Public Health
England (due to the responsibility for nutrition passing from the FSA to the Department of Health)
and work continues to update nutrient compositions on a rolling basis (Department for
Environment Food & Rural Affairs (Defra), 2013a). A limitation of the methodology used here is
that there could be a time delay of several years for the nutrient composition of products to be
updated.
Conclusion
Confectionery and sweet biscuits should only contribute a very small amount to a balanced
healthy diet as illustrated by the Eatwell plate. Reducing sugary drinks by two-thirds and halving
confectionery and sweet biscuit intake (the top 2 contributors to NMES intake) has the potential
to bring population NMES intake below the dietary goal for Scotland (less than 11% of food
energy) (Scottish Government, 2013) and offer a significant reduction in excess energy. This work
provides evidence that the lack of an association between deprivation and fat or saturated fat
intake masks distinct differences in the contributors to the intakes of these nutrients.

20
Consideration should be given to monitoring trends in consumption of foods such as cheese,
cooking oil and cream.

21
5. REFERENCES
BARTON, K. L. & WRIEDEN, W. L. 2012. Estimation of food and nutrient intakes from food survey data in Scotland 2001-2009 [Online]. Aberdeen: Food Standards Agency in Scotland. Available: http://www.foodbase.org.uk//admintools/reportdocuments/749-1-1324_Final_Report_2001-2009.pdf [Accessed 05 December 2013.
BARTON, K. L., WRIEDEN, W. L., GREGOR, A., ARMSTRONG, J. & SHERRIFF, A. 2010. Estimation of Food and Nutrient Intakes from Expenditure and Food Survey Data in Scottish 2001-2006.
BROMLEY, C., DOWLING, S., GRAY, L., HUGHES, T., LEYLAND, A., MCNEILL, G. & MARCINKIEWICZ, A. 2014. The Scottish Health Survey 2013 Edition: Volume 1 - Main Report, Edinburgh, Scottish Government.
DEPARTMENT FOR ENVIRONMENT FOOD & RURAL AFFAIRS (DEFRA) 2008. Family Food. A report on the 2007 Expenditure and Food Survey.
DEPARTMENT FOR ENVIRONMENT FOOD & RURAL AFFAIRS (DEFRA) 2010. Family Food 2009. A report on the 2009 Family Food Module of the Living Costs and Food Survey.
DEPARTMENT FOR ENVIRONMENT FOOD & RURAL AFFAIRS (DEFRA) 2013a. Family Food 2012. DEPARTMENT FOR ENVIRONMENT FOOD & RURAL AFFAIRS (DEFRA). 2013b. Survey sampling for Family
Food [Online]. Available: https://www.gov.uk/government/uploads/system/uploads/attachment_data/file/265263/familyfood-method-sampling-12dec13.pdf.
NPD GROUP INC 2014. An Assessment of Out of Home Food and Drink in Scotland. OFFICE FOR NATIONAL STATISTICS 2010. Family Spending: A report on the 2009 Living Costs and Food
Survey, Newport, Office for National Statistics,. SCOTTISH GOVERNMENT. 2013. Revised Dietary Goals for Scotland [Online]. Edinburgh. Available:
http://www.scotland.gov.uk/Topics/Health/Healthy-Living/Food-Health/DietaryGoalsScot [Accessed 5 December 2013.
SCOTTISH GOVERNMENT AND FOOD STANDARDS AGENCY IN SCOTLAND 2014. Supporting Healthy Choices: A Framework for Voluntary Action.
SCOTTISH OFFICE 1993. Scotland's health a challenge to us all. The Scottish Diet : report of a Working Party to the Chief Medical Officer for Scotland, Edinburgh, The Scottish Office Home and Health Department.
SCOTTISH OFFICE 1996. Scotland's health a challenge to us all. Eating for Health: A diet action plan for Scotland, Edinburgh, The Scottish Office Department of Health.
WASTE AND RESOURCE ACTION PROGRAMME SURVEY (WRAP) 2008. The Food We Waste. Oxon. WRIEDEN, W. L. & BARTON, K. L. 2011. The Scottish Diet: Estimations of energy density and expenditure
[Online]. Aberdeen. Available: http://www.foodbase.org.uk//admintools/reportdocuments/749-1-1277_S14035_Energy_Density_Final_Report.pdf [Accessed 05 December 2013.
WRIEDEN, W. L. & BARTON, K. L. 2015. Estimation of food and nutrient intakes from food purchase data in Scotland 2001-2012 [Online]. Aberdeen: Food Standards Agency in Scotland.

22
6. APPENDICES
Appendix 1: Recommended Edible Food Waste Estimates
Appendix 2: Food Groupings Used for Contributing Foods Analysis
Appendix 3: Breakdown of Food Groupings by Food Code

23
Appendix 1: Recommended Edible Food Waste Estimates
The following figures for estimated waste are from the Waste and Resource Action Programme Survey (WRAP) (2008). The incorporation of these figures in the estimation of food and nutrient intakes from the EFS were discussed in the Annex of the 2007 Family Food report (Department for Environment Food & Rural Affairs (Defra), 2008) and were mapped to the EFS food codes for this purpose by Defra (personal communication).
Defra
Code
Description Single
Adult
Waste
Multiple
Adult
Waste
402 UHT whole milk 0.1 0.1
403 Sterilised whole milk 0.1 0.1 404 Pasteurised or homogenised whole milk 0.1 0.1
501 School Milk 0.1 0.1
601 Welfare milk 0.1 0.1 901 Condensed or evaporated milk 0.1 0.1
1102 Infant or baby milks - ready to drink 0.1 0.1 1103 Infant or baby milks - dried 0.1 0.1
1201 Instant dried milk 0.1 0.1
1301 Yoghurt 0.1146 0.0802 1302 Fromage frais 0.1 0.1
1502 Fully skimmed milk 0.1 0.1 1503 Semi-skimmed milk 0.1 0.1
1603 Dairy desserts - not frozen 0.1 0.1 1605 Dried milk products 0.1 0.1
1606 Milk drinks & other milks (replaced 200405 onwards) 0.1 0.1
1607 Milk drinks & other milks 0.1 0.1 1608 Non-dairy milk substitutes 0.1 0.1
1701 Cream 0.1222 0.096 2201 Hard cheese - Cheddar type 0.0883 0.0829
2202 Hard cheese - Other UK or foreign equivalent 0.0883 0.0829
2203 Hard cheese - Edam or other foreign 0.0883 0.0829 2205 Cottage cheese 0.0883 0.0829
2206 Soft natural cheese 0.0883 0.0829 2301 Processed cheese 0.0883 0.0829
3102 Beef joints - on the bone 0.0815 0.0457
3103 Beef joints - boned 0.0815 0.0457 3104 Beef steak - less expensive 0.0815 0.0457
3105 Beef steak - more expensive 0.0815 0.0457 3106 Minced beef 0.0815 0.0457
3107 All other beef and veal 0.0815 0.0457 3601 Mutton 0.0224 0.0262
3602 Lamb joints 0.0224 0.0262
3603 Lamb chops 0.0224 0.0262 3604 All other lamb 0.0224 0.0262
4101 Pork joints 0.2041 0.133 4102 Pork chops 0.2041 0.133
4103 Pork fillets and steaks 0.2041 0.133
4104 All other pork 0.2041 0.133 4603 Ox liver 0.0815 0.0457
4604 Lambs liver 0.0224 0.0262 4605 Pigs liver 0.2041 0.133
4607 All other liver 0.0584 0.0401 5101 All offal other than liver 0.0584 0.0401
5502 Bacon and ham joints, uncooked 0.2041 0.133
5505 Bacon and ham rashers, uncooked 0.2041 0.133 5801 Ham and bacon 0.2041 0.133
5903 Cooked chicken and turkey 0.1855 0.0837 5904 Takeaway chicken 0.1855 0.0837
6201 Corned beef - canned or sliced 0.0815 0.0457
6601 Other cooked meat 0.0584 0.0401 7102 Other canned meat and canned meat products 0.0584 0.0401

24
7401 Chicken - whole or part 0.1855 0.0837 7703 Turkey - whole or part 0.1855 0.0837
7704 Poultry other than chicken or turkey 0.1855 0.0837 7801 Other fresh, chilled or frozen meat 0.0584 0.0401
7901 Sausages, uncooked - pork 0.0584 0.0401
8001 Sausages, uncooked - beef etc. 0.0584 0.0401 8302 Meat pies - ready to eat 0.2563 0.29
8303 Sausage rolls - ready to eat 0.2563 0.29 8401 Meat pies, pasties and puddings - frozen or not frozen 0.2563 0.29
8501 Burgers - frozen or not frozen 0.0584 0.0401
8901 Complete meat-based ready meals - frozen or not frozen 0.2563 0.29 8902 Other convenience meat products - frozen or not frozen 0.2563 0.29
9301 Pate 0.1324 0.0755 9302 Delicatessen type sausages 0.0584 0.0401
9403 Meat pastes and spreads 0.1324 0.0755 9501 Takeaway meat pies and pasties 0.2563 0.29
9502 Takeaway burger and bun 0.2563 0.29
9503 Takeaway kebabs 0.2563 0.29 9504 Takeaway sausages and saveloys 0.2563 0.29
9505 Takeaway meat based meals 0.2563 0.29 9506 Takeaway miscellaneous meats 0.2563 0.29
10201 White fish, fresh or chilled 0.096 0.0418
10202 White fish, frozen 0.096 0.0418 10601 Herrings and other blue fish, fresh or chilled 0.096 0.0418
10602 Herrings and other blue fish, frozen 0.096 0.0418 10701 Salmon, fresh or chilled 0.096 0.0418
10702 Salmon, frozen 0.096 0.0418 10801 Blue fish, dried or salted or smoked 0.096 0.0418
11401 White fish, dried or salted or smoked 0.096 0.0418
11702 Shellfish, fresh or chilled 0.2178 0.0621 11703 Shellfish, frozen 0.2178 0.0621
11801 Takeaway fish 0.096 0.0418 11901 Tinned salmon 0.096 0.0418
12001 Other tinned or bottled fish 0.096 0.0418
12103 Ready meals and other fish products - frozen or not frozen 0.2563 0.29 12304 Takeaway fish products 0.2563 0.29
12305 Takeaway fish based meals 0.2563 0.29 12901 Eggs 0.073 0.0463
13501 Butter 0.0386 0.0176 13801 Soft margarine 0.0386 0.0176
13802 Other margarine 0.0386 0.0176
13901 Lard, cooking fat 0.1267 0.091 14304 Olive Oil 0.1267 0.091
14305 Other vegetable and salad oils 0.1267 0.091 14802 Reduced fat spreads 0.0386 0.0176
14803 Low fat spreads 0.0386 0.0176
14805 Suet and dripping 0.0584 0.0401 14807 Imitation cream 0.1 0.1
15001 Sugar 0.1267 0.091 15101 Jams and fruit curds 0.1267 0.091
15201 Marmalade 0.1267 0.091 15301 Syrup, treacle 0.1267 0.091
15401 Honey 0.1267 0.091
15501 Potatoes - bought Jan-Aug, previous year’s crop 0.3718 0.2416 15502 Potatoes - bought Jan-Aug, this year’s crop 0.3718 0.2416
15503 Potatoes - bought Sep-Dec, current crop or new imported 0.3718 0.2416 15504 Fresh potatoes not specified elsewhere 0.3718 0.2416
15505 Fresh new potatoes 0.3718 0.2416
15506 Fresh baking potatoes 0.3718 0.2416 16201 Fresh cabbages 0.7014 0.4155
16301 Fresh brussels sprouts 0.1701 0.0794 16401 Fresh cauliflower 0.1449 0.1019

25
16701 Lettuce and leafy salads 0.5069 0.3519 16702 Prepared lettuce salads 0.6023 0.4633
16801 Fresh peas 0.0917 0.0417 16901 Fresh beans 0.5589 0.3071
17101 Other fresh green vegetables 0.2589 0.1589
17201 Fresh carrots 0.3835 0.1681 17301 Fresh turnips and swede 0.1231 0.0669
17401 Other fresh root vegetables 0.225 0.1511 17501 Fresh onions, leeks and shallots 0.2143 0.1408
17601 Fresh cucumbers 0.3717 0.2357
17701 Fresh mushrooms 0.1483 0.104 17801 Fresh tomatoes 0.1582 0.0926
18301 Fresh vegetable stew pack, stir-fry pack etc. 0.3429 0.2301 18302 Fresh stem vegetables 0.6075 0.453
18303 Fresh marrow, courgettes, aubergine, pumpkin and other vegetables 0.1691 0.1147 18304 Fresh herbs 0.1267 0.091
18401 Tomatoes, canned or bottled 0.1582 0.0926
18501 Peas, canned 0.0917 0.0417 18802 Baked beans in sauce 0.0828 0.0309
18803 Other canned beans and pulses 0.2589 0.1589 19101 Other canned vegetables 0.2589 0.1589
19201 Dried pulses, other than air-dried 0.2589 0.1589
19501 Air-dried vegetables 0.3429 0.2301 19602 Tomato puree and vegetable purees 0.1267 0.091
19603 Vegetable juices e.g. tomato juice, carrot juice 0.1 0.1 19702 Chips - frozen or not frozen 0.3718 0.2416
19703 Takeaway chips 0.3718 0.2416 19801 Instant potato 0.3718 0.2416
19901 Canned potatoes 0.3718 0.2416
20002 Crisps and potato snacks 0.1239 0.0809 20101 Other potato products - frozen or not frozen 0.3718 0.2416
20301 Peas, frozen 0.0917 0.0417 20401 Beans, frozen 0.5589 0.3071
20601 Ready meals and other vegetable products - frozen or not frozen 0.2563 0.29
20604 All vegetable takeaway products 0.2563 0.29 20801 Other frozen vegetables 0.2589 0.1589
21001 Fresh oranges 0.3382 0.2325 21401 Other fresh citrus fruits 0.0536 0.041
21701 Fresh apples 0.6627 0.2772 21801 Fresh pears 0.1442 0.1929
22101 Fresh stone fruit 0.2036 0.1797
22201 Fresh grapes 0.0833 0.0778 22701 Other fresh soft fruit 0.433 0.2521
22801 Fresh bananas 0.1545 0.082 22901 Fresh melons 0.2848 0.1797
23101 Other fresh fruit 0.1404 0.0938
23301 Tinned peaches, pears and pineapples 0.0806 0.0899 23601 All other tinned or bottled fruit 0.0806 0.0899
24001 Dried fruit 0.0806 0.0899 24101 Frozen strawberries, apple slices, peach halves, oranges and other
frozen fruits
0.0806 0.0899
24502 Nuts & edible seeds 0.0228 0.043
24503 Peanut butter 0.0228 0.043
24801 Pure fruit juices 0.1 0.1
25102 White bread, standard, unsliced 0.3335 0.2399
25202 White bread, standard, sliced 0.3335 0.2399
25701 White bread, premium, sliced and unsliced 0.3335 0.2399
25801 White bread, soft grain, sliced and unsliced 0.3335 0.2399
25901 Brown bread, sliced and unsliced 0.3335 0.2399
26001 Wholemeal and granary bread, sliced and unsliced 0.3335 0.2399
26302 Rolls - white, brown or wholemeal 0.3942 0.1718
26303 Malt bread and fruit loaves 0.0861 0.0241

26
26304 Vienna and French bread 0.3942 0.1718
26305 Starch reduced bread and rolls 0.3335 0.2399
26308 Other breads 0.3349 0.4585
26309 Sandwiches 0.2563 0.29
26310 Sandwiches from takeaway 0.2563 0.29
26311 Takeaway breads 0.3349 0.4585
26401 Flour 0.0677 0.0641
26701 Buns, scones and teacakes 0.1239 0.1163
27001 Cakes and pastries, not frozen 0.2802 0.1703
27002 Takeaway pastries 0.2802 0.1703
27101 Crisp bread 0.0539 0.0438
27402 Sweet biscuits (not chocolate) and cereal bars 0.0539 0.0438
27403 Cream crackers and other unsweetened biscuits 0.0539 0.0438
27702 Chocolate biscuits 0.0539 0.0438
28101 Oatmeal and oat products 0.0275 0.0224
28202 Muesli 0.0275 0.0224
28203 High fibre breakfast cereals 0.0275 0.0224
28204 Sweetened breakfast cereals 0.0275 0.0224
28205 Other breakfast cereals 0.0275 0.0224
28502 Canned or fresh carton custard 0.0638 0.0283
28503 All canned milk puddings 0.0638 0.0283
28601 Puddings 0.0638 0.0283
28702 Dried rice 0.2335 0.1402
28703 Cooked rice 0.2335 0.1402
28704 Takeaway rice 0.2335 0.1402
29001 Invalid foods, slimming foods and sports foods 0.0448 0.0656
29101 Infant cereal foods 0.1 0.1
29402 Cakes and pastries - frozen 0.2802 0.1703
29501 Canned pasta 0.2563 0.29
29502 Dried and fresh pasta 0.1848 0.1595
29503 Takeaway pasta and noodles 0.2563 0.29
29601 Pizzas - frozen and not frozen 0.2563 0.29
29602 Takeaway pizza 0.2563 0.29
29907 Cake, pudding and dessert mixes 0.298 0.4353
29909 Cereal snacks 0.0275 0.0224
29915 Quiches and flans - frozen and not frozen 0.2563 0.29
29916 Takeaway crisps, savoury snacks, popcorn, poppadums, prawn
crackers
0.1239 0.0809
29919 Other cereal foods - frozen and not frozen 0.0275 0.0224
30101 Other cereals 0 0
30401 Tea 0.1 0.1
30701 Coffee beans and ground coffee 0.1 0.1
30801 Instant coffee 0.1 0.1
30901 Coffee essences 0.1 0.1
31001 Tea and coffee from takeaway 0.1 0.1
31201 Cocoa and chocolate drinks 0.0448 0.0656
31301 Malt drinks and chocolate versions of malted drinks 0.0448 0.0656
31401 Mineral or spring waters 0.1 0.1
31501 Baby foods 0.1 0.1
31801 Soups - canned or cartons 0.2563 0.29
31901 Soups - dehydrated or powdered 0.0448 0.0656
32001 Soups - from takeaway 0.2563 0.29
32101 Other takeaway food brought home 0.2563 0.29
32201 Meals on wheels - items not specified 0.2563 0.29
32302 Salad dressings 0.1267 0.091
32303 Other spreads and dressings 0.1267 0.091
32702 Pickles 0.1267 0.091
32703 Sauces 0.1267 0.091
32704 Takeaway sauces and mayonnaise 0.1267 0.091

27
32801 Stock cubes and meat and yeast extracts 0.298 0.4353
32901 Jelly squares or crystals 0.0638 0.0283
33203 Ice cream tub or block 0.0638 0.0283
33302 Ice cream cornets, choc-ices, lollies with ice cream 0.0638 0.0283
33303 Ice lollies, sorbet, frozen mousse, frozen yoghurt 0.0638 0.0283
33304 Takeaway ice cream, ice cream products, milkshakes 0.0638 0.0283
33401 Salt 0.1267 0.091
33501 Artificial sweeteners 0.1267 0.091
33602 Vinegar 0.1267 0.091
33603 Spices and dried herbs 0.1267 0.091
33604 Bisto, gravy granules, stuffing mix, baking powder, yeast 0.298 0.4353
33605 Wine and beer making kits 0.1 0.1
33606 Fruit teas, instant tea, herbal tea, rosehip tea 0.1 0.1
33607 Payment for food, type not specified 0.1 0.1
33901 Soya and novel protein foods 0.2589 0.1589
34001 Soft drinks, concentrated, not low calorie 0.1 0.1
34101 Soft drinks, not concentrated, not low calorie 0.1 0.1
34301 Soft drinks, concentrated, low calorie 0.1 0.1
34401 Soft drinks, not concentrated, low calorie 0.1 0.1
35001 Chocolate bars - solid 0.0958 0.0575
35101 Chocolate bars - filled 0.0958 0.0575
35202 Chewing gum 0.1239 0.0809
35301 Mints 0.0958 0.0575
35302 Boiled sweets 0.0958 0.0575
35401 Fudges, toffees, caramels 0.0958 0.0575
35501 Takeaway confectionery 0.0958 0.0575
38102 Beers 0.1 0.1
38202 Lagers and continental beers 0.1 0.1
38302 Ciders and perry 0.1 0.1
38402 Champagne, sparkling wines and wine with mixer 0.1 0.1
38403 Table wine 0.1 0.1
38501 Spirits with mixer 0.1 0.1
38601 Fortified wines 0.1 0.1
38701 Spirits 0.1 0.1
38801 Liqueurs and cocktails 0.1 0.1
38901 Alcopops 0.1 0.1
100101 Meat or fish based curry with sauce 0 0
100102 Meat or fish based curry without sauce 0 0
100103 Vegetable or fruit based curry 0 0
100104 Dhal and dhal dishes 0 0
100105 Samosas 0 0
100106 Other Indian dishes 0 0
100107 Indian breads 0 0
100108 Indian buffet or shared meal or unspecified Indian meal 0 0
100201 Chinese or Thai meat or fish based dishes excluding curry 0 0
100202 Chop suey and fu yung dishes 0 0
100203 Chinese or Thai vegetable based main course dishes excluding curry 0 0
100204 Chinese or Thai curry 0 0
100205 Spring rolls 0 0
100206 Other Chinese or Thai dishes 0 0
100207 Chinese or Thai buffet or shared meal or unspecified Chinese or Thai
meal
0 0
100301 All other ethnic meals 0 0
110101 Steak - without sauce e.g. braised, sirloin 0 0
110102 Roast meat with sauce or gravy 0 0
110103 Pork chops with sauce or gravy 0 0
110104 Lamb chops with sauce or gravy 0 0
110105 Spare ribs 0 0
110106 Bacon 0 0

28
110107 Gammon or ham 0 0
110108 All offal including liver, kidney, tongue 0 0
110201 Chicken or turkey with sauce or gravy 0 0
110202 Chicken or turkey in breadcrumbs or batter 0 0
110203 Duck with sauce or gravy 0 0
110204 Game with sauce or gravy 0 0
110301 Small or single burgers 0 0
110302 Large or double burgers 0 0
110303 Chicken burger 0 0
110401 Kebabs - all types including chicken 0 0
110402 Plain sausages e.g. beef, pork 0 0
110403 Other sausages 0 0
110404 Hot dogs and sausage sandwiches 0 0
110501 Meat pies (pastry topped) and pasties 0 0
110502 Meat pies (potato topped e.g. shepherd's pie) 0 0
110503 Sausage roll (pastry) 0 0
110601 Meat and vegetable stews, casseroles or hotpots 0 0
110602 Chicken or turkey stews, casseroles or hotpots 0 0
110603 Meat lasagne, cannelloni, moussaka and other meat-based oven baked
dishes
0 0
110701 All pates 0 0
110801 Other meat products or dishes 0 0
120101 White fish - grilled, steamed, baked or boiled - without sauce 0 0
120102 White fish - fried (incl. in batter/breadcrumbs) - without sauce 0 0
120201 Trout, tuna and salmon only - fresh - without sauce or dressing 0 0
120202 Other fatty fish - without sauce or dressing e.g. herring, mackerel,
sardines
0 0
120301 Shellfish - without sauce or dressing e.g. prawns, shrimps, oysters, crab 0 0
120401 Kippers and other smoked fish e.g. smoked salmon 0 0
120501 Other fish products and unspecified 'fish' e.g. squid, sushi, crabsticks 0 0
120601 Fish, processed, in breadcrumbs (fish fingers, fish cakes, scampi) -
without sauce or dressing
0 0
120602 Fish burgers (in bun) 0 0
120603 Fish based pie or other dish e.g. paella, kedgeree, tuna pasta bake 0 0
130101 Cottage cheese including with pineapple 0 0
130102 Soft, continental or processed cheese e.g. brie 0 0
130103 Cheddar, blue or other hard cheese and unspecified 'cheese' 0 0
130104 Quiche and cheese pies or pasties 0 0
130105 Other cheese dishes e.g. Welsh rarebit, cheese and biscuits 0 0
130201 Pizza - cheese and tomato, vegetable or unspecified 'pizza' 0 0
130202 Pizza - meat, fish or poultry 0 0
130301 Eggs - boiled or poached 0 0
130302 Eggs - scrambled, fried, omelettes or unspecified 'egg' 0 0
130303 Other egg dishes e.g. egg mayonnaise 0 0
140101 Chips and French fries - from fast food outlet e.g. McDonalds 0 0
140102 Chips - served with meal e.g. from restaurant or chip shop 0 0
140103 Potatoes - boiled or unspecified 'potato' 0 0
140104 Potatoes - mashed 0 0
140105 Potatoes - roast 0 0
140106 Sautéed potatoes, potato croquettes, hash browns etc. 0 0
140107 Baked or jacket potatoes - without filling 0 0
140108 Other potato dishes (e.g. wedges, potato salad) including unspecified
'potato dish'
0 0
150101 Lettuce and cress 0 0
150102 Other green vegetables e.g. spinach, cabbage, sprouts 0 0
150201 Peppers - raw or cooked 0 0
150202 Courgettes, marrow, aubergine, pumpkin, plantain, cucumbers 0 0
150203 Peas and sweetcorn 0 0

29
150204 Baked beans and other beans (not green beans) and pulses 0 0
150205 Tomato - fresh or raw 0 0
150206 Tomato - cooked or processed 0 0
150301 Carrots 0 0
150302 Onions - raw, cooked or unspecified 'onions' 0 0
150303 Onions - fried 0 0
150304 Other root vegetables or tubers e.g. turnip, parsnip, radish, beetroot 0 0
150401 Mushrooms - raw or cooked 0 0
150501 Mixed vegetables or unspecified 'vegetable' 0 0
150502 Other vegetables e.g. artichoke, asparagus 0 0
150503 Vegetables in batter or breadcrumbs and deep fried vegetables e.g.
onion rings
0 0
150504 Onion and other vegetable bhajis and pakora 0 0
150601 Veggie burger, bean burger, veggie sausage, nut roast 0 0
150602 Vegetable lasagne, vegetable cannelloni, vegetable moussaka and other
oven baked vegetable based dishes
0 0
150603 Stuffed vegetables (e.g. stuffed pepper) and vegetable based starter 0 0
150604 Vegetable based stews and casseroles and vegetable based pies 0 0
160101 Mixed salad, main course - without dressing 0 0
160102 Mixed salad, side dish - without dressing - including unspecified 'salad' 0 0
160103 Green salad - without dressing 0 0
160201 Vegetable or fruit and nut salad - with dressing 0 0
160202 Pasta, rice, mixed bean or cereal-based salads - with dressing 0 0
160301 Meat salad e.g. beef, lamb salads 0 0
160302 Chicken or turkey salad 0 0
160303 Fish salad e.g. tuna, salmon salads 0 0
160401 Cheese salad including ploughman’s 0 0
160402 Egg salad 0 0
160501 Other salads e.g. Greek, Florida, Russian 0 0
160601 Salad buffet or buffet meal where items not specified 0 0
170101 Fried rice and risotto 0 0
170102 All cooked rice excluding fried rice e.g. boiled, pilau, savoury 0 0
170103 Pasta - not filled and plain noodles (including pot noodle) - without
sauce
0 0
170104 Pasta - filled e.g. ravioli, tortellini - without sauce 0 0
170105 Noodles with meat, vegetables etc. 0 0
180101 Meat & fish soups 0 0
180102 Vegetable based soups 0 0
180103 Chinese soups, consommé (meat, fish or veg) 0 0
180104 Other soups including unspecified 'soup' 0 0
190101 Muesli and oat crunch cereals 0 0
190102 Other high fibre breakfast cereals e.g. Allbran, Weetabix 0 0
190103 Sweetened breakfast cereals e.g. Frosties, Sugar Puffs 0 0
190104 Hot breakfast cereals e.g. porridge, Ready Brek 0 0
190105 Other breakfast cereals and unspecified 'cereal' e.g. Cornflakes, Rice
Krispies, Special K
0 0
200101 All citrus fruit, fresh e.g. orange, grapefruit 0 0
200102 Banana, fresh 0 0
200103 Apples, fresh 0 0
200104 Pears, fresh 0 0
200105 Stone fruit, fresh e.g. apricot, plum, peach, cherry, avocado 0 0
200106 Grapes, fresh 0 0
200107 Soft fruit or berries, fresh e.g. strawberries, blackberries - without
cream or ice cream
0 0
200108 Melon, fresh 0 0
200109 Pineapple, fresh 0 0
200110 Fresh fruit salad - without cream or ice cream 0 0
200111 Other fresh fruit (kiwi, passion) and unspecified 'fruit' 0 0
200112 Free school fruit 0 0
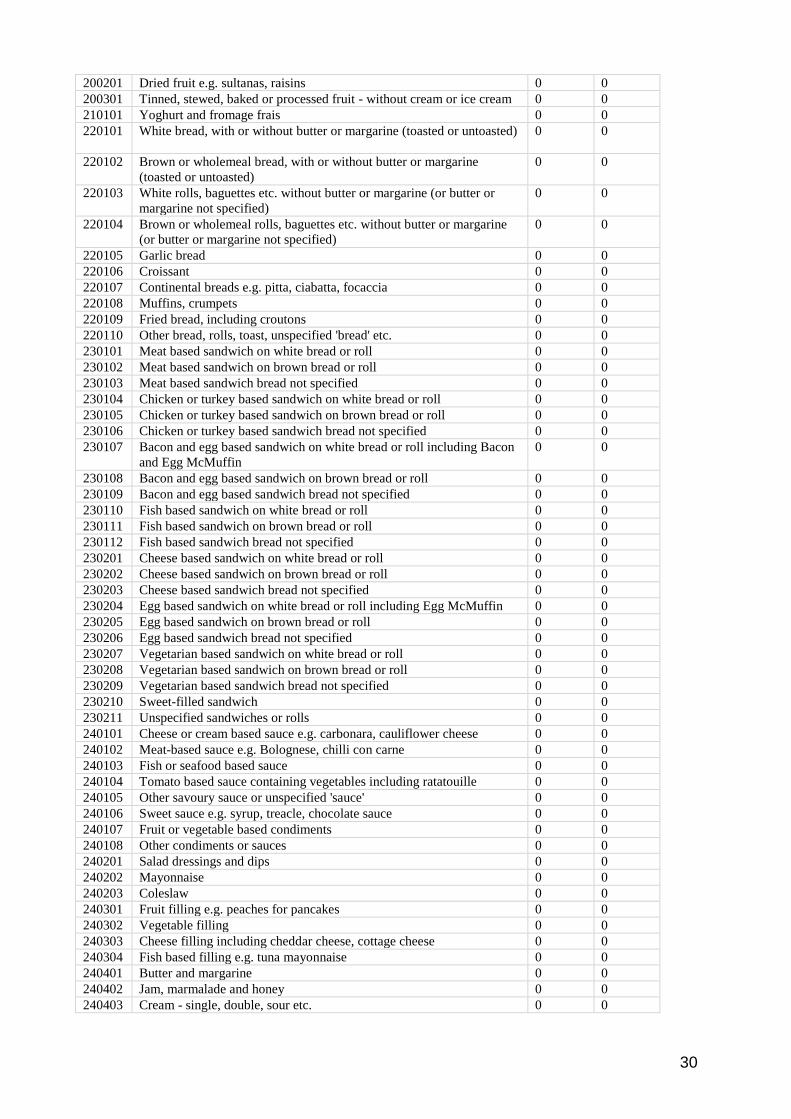
30
200201 Dried fruit e.g. sultanas, raisins 0 0
200301 Tinned, stewed, baked or processed fruit - without cream or ice cream 0 0
210101 Yoghurt and fromage frais 0 0
220101 White bread, with or without butter or margarine (toasted or untoasted) 0 0
220102 Brown or wholemeal bread, with or without butter or margarine
(toasted or untoasted)
0 0
220103 White rolls, baguettes etc. without butter or margarine (or butter or
margarine not specified)
0 0
220104 Brown or wholemeal rolls, baguettes etc. without butter or margarine
(or butter or margarine not specified)
0 0
220105 Garlic bread 0 0
220106 Croissant 0 0
220107 Continental breads e.g. pitta, ciabatta, focaccia 0 0
220108 Muffins, crumpets 0 0
220109 Fried bread, including croutons 0 0
220110 Other bread, rolls, toast, unspecified 'bread' etc. 0 0
230101 Meat based sandwich on white bread or roll 0 0
230102 Meat based sandwich on brown bread or roll 0 0
230103 Meat based sandwich bread not specified 0 0
230104 Chicken or turkey based sandwich on white bread or roll 0 0
230105 Chicken or turkey based sandwich on brown bread or roll 0 0
230106 Chicken or turkey based sandwich bread not specified 0 0
230107 Bacon and egg based sandwich on white bread or roll including Bacon
and Egg McMuffin
0 0
230108 Bacon and egg based sandwich on brown bread or roll 0 0
230109 Bacon and egg based sandwich bread not specified 0 0
230110 Fish based sandwich on white bread or roll 0 0
230111 Fish based sandwich on brown bread or roll 0 0
230112 Fish based sandwich bread not specified 0 0
230201 Cheese based sandwich on white bread or roll 0 0
230202 Cheese based sandwich on brown bread or roll 0 0
230203 Cheese based sandwich bread not specified 0 0
230204 Egg based sandwich on white bread or roll including Egg McMuffin 0 0
230205 Egg based sandwich on brown bread or roll 0 0
230206 Egg based sandwich bread not specified 0 0
230207 Vegetarian based sandwich on white bread or roll 0 0
230208 Vegetarian based sandwich on brown bread or roll 0 0
230209 Vegetarian based sandwich bread not specified 0 0
230210 Sweet-filled sandwich 0 0
230211 Unspecified sandwiches or rolls 0 0
240101 Cheese or cream based sauce e.g. carbonara, cauliflower cheese 0 0
240102 Meat-based sauce e.g. Bolognese, chilli con carne 0 0
240103 Fish or seafood based sauce 0 0
240104 Tomato based sauce containing vegetables including ratatouille 0 0
240105 Other savoury sauce or unspecified 'sauce' 0 0
240106 Sweet sauce e.g. syrup, treacle, chocolate sauce 0 0
240107 Fruit or vegetable based condiments 0 0
240108 Other condiments or sauces 0 0
240201 Salad dressings and dips 0 0
240202 Mayonnaise 0 0
240203 Coleslaw 0 0
240301 Fruit filling e.g. peaches for pancakes 0 0
240302 Vegetable filling 0 0
240303 Cheese filling including cheddar cheese, cottage cheese 0 0
240304 Fish based filling e.g. tuna mayonnaise 0 0
240401 Butter and margarine 0 0
240402 Jam, marmalade and honey 0 0
240403 Cream - single, double, sour etc. 0 0

31
240404 Custard 0 0
240405 Sugar (as an addition to tea, coffee etc.) 0 0
240501 Commercial baby food in a jar or can 0 0
240601 Yorkshire puddings and dumplings 0 0
240701 Unspecified meal e.g. 'meal', 'school meal' or 'meal at work' 0 0
250101 Coffee, black including espresso 0 0
250102 Coffee, white including cappuccino, latte 0 0
250103 Coffee, black or white not specified 0 0
250104 Tea, white (including black or white not specified) 0 0
250105 Tea, black including Chinese tea, herbal tea, fruit tea 0 0
250106 Hot chocolate or cocoa, with milk or water 0 0
260201 Mineral water 0 0
260202 Soft drink (incl. carbonates and still) - low calorie 0 0
260203 Soft drink (incl. carbonates & still) - not low calorie (including drinks
where calorie content unspecified)
0 0
260204 Pure fruit juices 0 0
260205 Vegetable juices e.g. tomato juice, carrot juice 0 0
260206 Soft drink where pure juice or juice drink not specified 0 0
260301 Milk as a drink 0 0
260302 Milk on cereal 0 0
260303 Milkshake and flavoured milk 0 0
260304 Free school milk 0 0
270101 Spirits 0 0
270102 Liqueurs 0 0
270103 Cocktails 0 0
270104 Spirits or liqueurs with mixer e.g. gin & tonic, Bacardi & coke 0 0
270201 Wine (not sparkling) including unspecified 'wine' 0 0
270202 Sparkling wines (e.g. Champagne) and wine with mixer (e.g. Bucks
Fizz)
0 0
270203 Fortified wine e.g. sherry, port, vermouth 0 0
270204 Cider or perry - half pint or bottle 0 0
270205 Cider or perry - pint or can or size not specified 0 0
270206 Alcoholic soft drinks (alcopops), and ready-mixed bottled drinks 0 0
270301 Bitter - half pint or bottle 0 0
270302 Bitter - pint or can or size not specified 0 0
270303 Lager or other beers including unspecified 'beer' - half pint or bottle 0 0
270304 Lager or other beers including unspecified 'beer' - pint or can or size
not specified
0 0
270401 Round of drinks, alcohol not otherwise specified 0 0
280101 Solid, unfilled chocolate bars and sweets and unspecified 'chocolate' 0 0
280102 Filled chocolate-coated bars and sweets e.g. Mars, Snickers, Minstrels 0 0
280103 Single chocolate (after dinner) 0 0
280104 Chewing gum and bubble gum 0 0
280105 Mints e.g. Polo, Extra Strong 0 0
280106 Boiled sweets, jellies and unspecified 'sweets' e.g. fruit gums 0 0
280107 Uncoated toffee or fudge, uncoated e.g. Toffos, chocolate éclairs,
caramels
0 0
280108 Pick 'n' mix, nougat, liquorice and other sweets 0 0
290101 Ice cream in a cone, cornet or wafer and ice cream desserts 0 0
290103 Ice cream scoop or tub including ice cream served with dessert 0 0
290104 Iced lollies and sorbets 0 0
290201 Doughnut 0 0
290202 Cream pastries e.g. chocolate éclairs, profiteroles 0 0
290203 Cream sponge or gateau (not chocolate) e.g. Victoria sandwich 0 0
290204 Rich chocolate cake or chocolate gateau e.g. Death by Chocolate 0 0
290205 Fruit and other pies or pastries 0 0
290206 Fruit cake 0 0
290207 Other sponge cakes or desserts (not cream cakes) 0 0
290208 Custard desserts or sweet soufflé 0 0
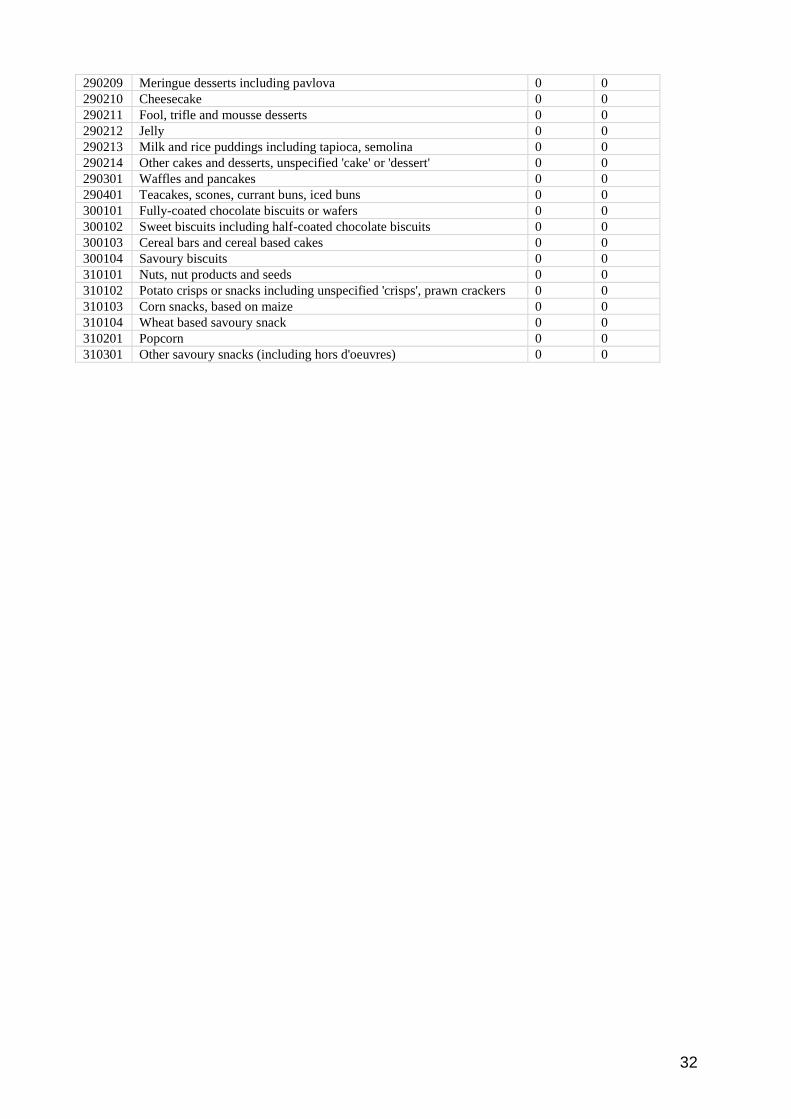
32
290209 Meringue desserts including pavlova 0 0
290210 Cheesecake 0 0
290211 Fool, trifle and mousse desserts 0 0
290212 Jelly 0 0
290213 Milk and rice puddings including tapioca, semolina 0 0
290214 Other cakes and desserts, unspecified 'cake' or 'dessert' 0 0
290301 Waffles and pancakes 0 0
290401 Teacakes, scones, currant buns, iced buns 0 0
300101 Fully-coated chocolate biscuits or wafers 0 0
300102 Sweet biscuits including half-coated chocolate biscuits 0 0
300103 Cereal bars and cereal based cakes 0 0
300104 Savoury biscuits 0 0
310101 Nuts, nut products and seeds 0 0
310102 Potato crisps or snacks including unspecified 'crisps', prawn crackers 0 0
310103 Corn snacks, based on maize 0 0
310104 Wheat based savoury snack 0 0
310201 Popcorn 0 0
310301 Other savoury snacks (including hors d'oeuvres) 0 0

Appendix 2: Food Groupings Used for Contributing Foods Analysis
33
Appendix 2: Food Groupings Used for Contributing Foods Analysis1
Food Grouping Code
Food Grouping Description Weight2 Secondary Food Grouping Code
Secondary Food Grouping Description
Weight2 Tertiary Food Grouping Code
Tertiary Food Grouping Description
Weight2
48 Semi-skimmed Milk 131.6
62 Total Milk 232.2
49 Skimmed Milk 14.3
67 Whole Milk 69.5
28 Milk Drinks 1.5
69 Yoghurt and Fromage Frais 24.4
11 Cream 2.9
23 Low Fat Cheese 0.4
60 Total Cheese 14.7
27 Medium Fat Cheese 4.8
19 Full Fat Cheese 9.5
3 Block Margarine 0.2
9 Cooking Fat 0.4
10 Cooking Oil 6.1
6 Butter 6.4
52 Total Spreading Fats 15.7
50 Soft Margarine 1.7
43 Reduced and Low Fat Spread
7.6
15 Eggs 1.0
17 Fruit 96.3
61 Total Fruit and Vegetables 246.9
18 Fruit (and veg) juice 45.1
66 Vegetables 105.5
51 Soup 16.8
37 Potatoes 55.9
40 Processed Potatoes 29.2
65 Unprocessed Red Meat 27.5
2 Bacon and Ham 14.7
63 Total Processed Red Meat 63.3
5 Burgers and Kebabs 6.7
26 Meat Filled Pastry 10.1
45 Sausages 14.4
33 Other processed meat 17.3
38 Poultry 29.7
41 Processed Poultry 1.0
64 Unprocessed Fish 11.0
39 Processed Fish 5.2
30 Non Meat Savoury Pastry 1.3
34 Pasta, Rice and Noodles 24.2
36 Pizza 9.7
16 Flour 4.6
24 Low fibre and lower NMES Breakfast Cereal
4.3
59 Total Breakfast Cereal 20.7
25 Low fibre or high NMES Breakfast Cereal
4.8
68 Wholegrain/ high fibre Breakfast Cereal
11.7
4 Bread and Rolls 74.7

Appendix 2: Food Groupings Used for Contributing Foods Analysis
34
32 Other Baked Goods 10.8
7 Cakes, Pastries and Puddings
17.6
29 Milk Puddings 3.9
20 Ice Cream and Dairy Desserts
32.2
22 Jelly, Ice Lollies and Sorbets 0.9
21 Jam, marmalade, honey and sweet spreads
5.6
53 Sugar 11.6
8 Chocolate Confectionery 14.7
70 Total Confectionery 21.8 71
Total Confectionery and Sweet Biscuits
44.1 54 Sugar Confectionery 7.1
57 Sweet Biscuits 22.3
46 Savoury Biscuits 2.5
47 Savoury Sauces and Dressings
22.4
42 Ready Meals 20.5
58 Takeaway Main Meal Component
5.8
13 Eaten Out Main Meal Component
6.5
14 Eaten Out Side Dish 0.4
44 Sandwiches 14.1
12 Crisps and Savoury Snacks 13.3
31 Nuts 2.4
35 Peanut Butter 0.5
55 Sugar Containing Soft Drinks 231.0
56 Sugar Free Soft Drinks 97.9
1 Alcoholic Drinks 159.4
-8 Unclassified Foods 27.8
-9 Foods of Little Nutritional Value
65.9
Total 1701
1Appendix 3 provides detail on the breakdown of each of these food groupings by food code; 2Average weight in
grams, per food group, per person, per day - 2001-2012 data combined.

35
Appendix 3: Breakdown of Food Groupings by Food Code
Food Code
Description Food Grouping
Code
Food Grouping Description Factor
30401 Tea -9 Foods of Little Nutritional Value 1
30701 Coffee beans and ground coffee -9 Foods of Little Nutritional Value 1
30801 Instant coffee -9 Foods of Little Nutritional Value 1
30901 Coffee essences -9 Foods of Little Nutritional Value 1
31001 Tea and coffee from takeaway -9 Foods of Little Nutritional Value 1
31401 Mineral or spring waters -9 Foods of Little Nutritional Value 1
33401 Salt -9 Foods of Little Nutritional Value 1
250101 Coffee, black including espresso -9 Foods of Little Nutritional Value 1
250102 Coffee, white including cappuccino, latte -9 Foods of Little Nutritional Value 1
250103 Coffee, black or white not specified -9 Foods of Little Nutritional Value 1
250104 Tea, white (including black or white not specified) -9 Foods of Little Nutritional Value 1
250105 Tea, black including Chinese tea, herbal tea, fruit tea -9 Foods of Little Nutritional Value 1
260201 Mineral water -9 Foods of Little Nutritional Value 1
14807 Imitation cream -8 Unclassified Foods 1
29001 Invalid foods, slimming foods and sports foods -8 Unclassified Foods 1
29101 Infant cereal foods -8 Unclassified Foods 1
29919 Other cereal foods - frozen and not frozen -8 Unclassified Foods 1
30101 Other cereals -8 Unclassified Foods 1
31501 Baby foods -8 Unclassified Foods 1
32201 Meals on wheels - items not specified -8 Unclassified Foods 1
32801 Stock cubes and meat and yeast extracts -8 Unclassified Foods 1
33901 Soya and novel protein foods -8 Unclassified Foods 1
35202 Chewing gum -8 Unclassified Foods 1
240501 Commercial baby food in a jar or can -8 Unclassified Foods 1
240601 Yorkshire puddings and dumplings -8 Unclassified Foods 1
240701 Unspecified meal e.g. 'meal', 'school meal' or 'meal at work' -8 Unclassified Foods 1
280104 Chewing gum and bubble gum -8 Unclassified Foods 1
310201 Popcorn -8 Unclassified Foods 1
310301 Other savoury snacks (including hors d'oeuvres) -8 Unclassified Foods 1
38102 Beers 1 Alcoholic Drinks 1
38202 Lagers and continental beers 1 Alcoholic Drinks 1
38302 Ciders and perry 1 Alcoholic Drinks 1
38402 Champagne, sparkling wines and wine with mixer 1 Alcoholic Drinks 1
38403 Table wine 1 Alcoholic Drinks 1
38501 Spirits with mixer 1 Alcoholic Drinks 0.15
38601 Fortified wines 1 Alcoholic Drinks 1
38701 Spirits 1 Alcoholic Drinks 1
38801 Liqueurs and cocktails 1 Alcoholic Drinks 1
38901 Alcopops 1 Alcoholic Drinks 0.15
270101 Spirits 1 Alcoholic Drinks 1
270102 Liqueurs 1 Alcoholic Drinks 1
270103 Cocktails 1 Alcoholic Drinks 1
270104 Spirits or liqueurs with mixer e.g. gin & tonic, Bacardi & coke 1 Alcoholic Drinks 0.15
270201 Wine (not sparkling) including unspecified 'wine' 1 Alcoholic Drinks 1
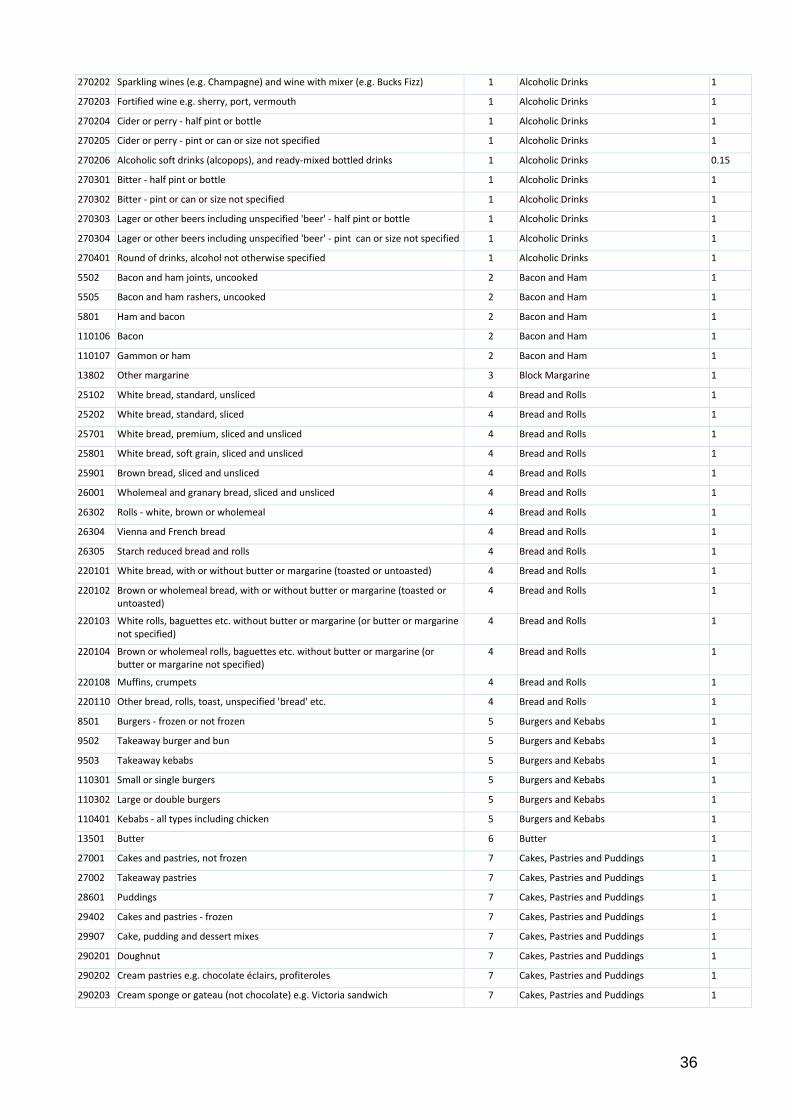
36
270202 Sparkling wines (e.g. Champagne) and wine with mixer (e.g. Bucks Fizz) 1 Alcoholic Drinks 1
270203 Fortified wine e.g. sherry, port, vermouth 1 Alcoholic Drinks 1
270204 Cider or perry - half pint or bottle 1 Alcoholic Drinks 1
270205 Cider or perry - pint or can or size not specified 1 Alcoholic Drinks 1
270206 Alcoholic soft drinks (alcopops), and ready-mixed bottled drinks 1 Alcoholic Drinks 0.15
270301 Bitter - half pint or bottle 1 Alcoholic Drinks 1
270302 Bitter - pint or can or size not specified 1 Alcoholic Drinks 1
270303 Lager or other beers including unspecified 'beer' - half pint or bottle 1 Alcoholic Drinks 1
270304 Lager or other beers including unspecified 'beer' - pint can or size not specified 1 Alcoholic Drinks 1
270401 Round of drinks, alcohol not otherwise specified 1 Alcoholic Drinks 1
5502 Bacon and ham joints, uncooked 2 Bacon and Ham 1
5505 Bacon and ham rashers, uncooked 2 Bacon and Ham 1
5801 Ham and bacon 2 Bacon and Ham 1
110106 Bacon 2 Bacon and Ham 1
110107 Gammon or ham 2 Bacon and Ham 1
13802 Other margarine 3 Block Margarine 1
25102 White bread, standard, unsliced 4 Bread and Rolls 1
25202 White bread, standard, sliced 4 Bread and Rolls 1
25701 White bread, premium, sliced and unsliced 4 Bread and Rolls 1
25801 White bread, soft grain, sliced and unsliced 4 Bread and Rolls 1
25901 Brown bread, sliced and unsliced 4 Bread and Rolls 1
26001 Wholemeal and granary bread, sliced and unsliced 4 Bread and Rolls 1
26302 Rolls - white, brown or wholemeal 4 Bread and Rolls 1
26304 Vienna and French bread 4 Bread and Rolls 1
26305 Starch reduced bread and rolls 4 Bread and Rolls 1
220101 White bread, with or without butter or margarine (toasted or untoasted) 4 Bread and Rolls 1
220102 Brown or wholemeal bread, with or without butter or margarine (toasted or untoasted)
4 Bread and Rolls 1
220103 White rolls, baguettes etc. without butter or margarine (or butter or margarine not specified)
4 Bread and Rolls 1
220104 Brown or wholemeal rolls, baguettes etc. without butter or margarine (or butter or margarine not specified)
4 Bread and Rolls 1
220108 Muffins, crumpets 4 Bread and Rolls 1
220110 Other bread, rolls, toast, unspecified 'bread' etc. 4 Bread and Rolls 1
8501 Burgers - frozen or not frozen 5 Burgers and Kebabs 1
9502 Takeaway burger and bun 5 Burgers and Kebabs 1
9503 Takeaway kebabs 5 Burgers and Kebabs 1
110301 Small or single burgers 5 Burgers and Kebabs 1
110302 Large or double burgers 5 Burgers and Kebabs 1
110401 Kebabs - all types including chicken 5 Burgers and Kebabs 1
13501 Butter 6 Butter 1
27001 Cakes and pastries, not frozen 7 Cakes, Pastries and Puddings 1
27002 Takeaway pastries 7 Cakes, Pastries and Puddings 1
28601 Puddings 7 Cakes, Pastries and Puddings 1
29402 Cakes and pastries - frozen 7 Cakes, Pastries and Puddings 1
29907 Cake, pudding and dessert mixes 7 Cakes, Pastries and Puddings 1
290201 Doughnut 7 Cakes, Pastries and Puddings 1
290202 Cream pastries e.g. chocolate éclairs, profiteroles 7 Cakes, Pastries and Puddings 1
290203 Cream sponge or gateau (not chocolate) e.g. Victoria sandwich 7 Cakes, Pastries and Puddings 1

37
290204 Rich chocolate cake or chocolate gateau e.g. Death by Chocolate 7 Cakes, Pastries and Puddings 1
290205 Fruit and other pies or pastries 7 Cakes, Pastries and Puddings 1
290206 Fruit cake 7 Cakes, Pastries and Puddings 1
290207 Other sponge cakes or desserts (not cream cakes) 7 Cakes, Pastries and Puddings 1
290209 Meringue desserts including pavlova 7 Cakes, Pastries and Puddings 1
290210 Cheesecake 7 Cakes, Pastries and Puddings 1
290214 Other cakes and desserts, unspecified 'cake' or 'dessert' 7 Cakes, Pastries and Puddings 1
35001 Chocolate bars - solid 8 Chocolate Confectionery 1
35101 Chocolate bars - filled 8 Chocolate Confectionery 1
280101 Solid, unfilled chocolate bars and sweets and unspecified 'chocolate' 8 Chocolate Confectionery 1
280102 Filled chocolate-coated bars and sweets e.g. Mars, Snickers, Minstrels 8 Chocolate Confectionery 1
280103 Single chocolate (after dinner) 8 Chocolate Confectionery 1
13901 Lard, cooking fat 9 Cooking Fat 1
14805 Suet and dripping 9 Cooking Fat 1
14304 Olive Oil 10 Cooking Oil 1
14305 Other vegetable and salad oils 10 Cooking Oil 1
1701 Cream 11 Cream 1
240403 Cream - single, double, sour etc. 11 Cream 1
20002 Crisps and potato snacks 12 Crisps and Savoury Snacks 1
29909 Cereal snacks 12 Crisps and Savoury Snacks 1
29916 Takeaway crisps, savoury snacks, popcorn, poppadums, prawn crackers 12 Crisps and Savoury Snacks 1
310102 Potato crisps or snacks including unspecified 'crisps', prawn crackers 12 Crisps and Savoury Snacks 1
310103 Cornsnacks, based on maize 12 Crisps and Savoury Snacks 1
310104 Wheat based savoury snack 12 Crisps and Savoury Snacks 1
100101 Meat or fish based curry with sauce 13 Eaten Out Main Meal Component 1
100102 Meat or fish based curry without sauce 13 Eaten Out Main Meal Component 1
100103 Vegetable or fruit based curry 13 Eaten Out Main Meal Component 1
100104 Dhal and dhal dishes 13 Eaten Out Main Meal Component 1
100108 Indian buffet or shared meal or unspecified Indian meal 13 Eaten Out Main Meal Component 1
100201 Chinese or Thai meat or fish based dishes excluding curry 13 Eaten Out Main Meal Component 1
100202 Chop suey and fu yung dishes 13 Eaten Out Main Meal Component 1
100203 Chinese or Thai vegetable based main course dishes excluding curry 13 Eaten Out Main Meal Component 1
100204 Chinese or Thai curry 13 Eaten Out Main Meal Component 1
100207 Chinese or Thai buffet or shared meal or unspecified Chinese or Thai meal 13 Eaten Out Main Meal Component 1
100301 All other ethnic meals 13 Eaten Out Main Meal Component 1
110502 Meat pies (potato topped e.g. shepherd's pie) 13 Eaten Out Main Meal Component 1
110601 Meat and vegetable stews, casseroles or hotpots 13 Eaten Out Main Meal Component 1
110602 Chicken or turkey stews, casseroles or hotpots 13 Eaten Out Main Meal Component 1
110603 Meat lasagne, cannelloni, moussaka and other meat-based oven baked dishes 13 Eaten Out Main Meal Component 1
120603 Fish based pie or other dish e.g. paella, kedgeree, tuna pasta bake 13 Eaten Out Main Meal Component 1
150601 Veggie burger, bean burger, veggie sausage, nut roast 13 Eaten Out Main Meal Component 1
150602 Vegetable lasagne, vegetable cannelloni, vegetable moussaka and other oven baked vegetable based dishes
13 Eaten Out Main Meal Component 1
150604 Vegetable based stews and casseroles and vegetable based pies 13 Eaten Out Main Meal Component 1
160301 Meat salad e.g. beef, lamb salads 13 Eaten Out Main Meal Component 1
160302 Chicken or turkey salad 13 Eaten Out Main Meal Component 1
160303 Fish salad e.g. tuna, salmon salads 13 Eaten Out Main Meal Component 1
160401 Cheese salad including ploughmans 13 Eaten Out Main Meal Component 1
160402 Egg salad 13 Eaten Out Main Meal Component 1

38
160601 Salad buffet or buffet meal where items not specified 13 Eaten Out Main Meal Component 1
170105 Noodles with meat, vegetables etc. 13 Eaten Out Main Meal Component 1
100105 Samosas 14 Eaten Out Side Dish 1
100106 Other Indian dishes 14 Eaten Out Side Dish 1
100205 Spring rolls 14 Eaten Out Side Dish 1
100206 Other Chinese or Thai dishes 14 Eaten Out Side Dish 1
130303 Other egg dishes e.g. egg mayonnaise 14 Eaten Out Side Dish 1
150503 Vegetables in batter or breadcrumbs and deep fried vegetables e.g. onion rings 14 Eaten Out Side Dish 1
150504 Onion and other vegetable bhajis and pakora 14 Eaten Out Side Dish 1
150603 Stuffed vegetables (e.g. stuffed pepper) and vegetable based starter 14 Eaten Out Side Dish 1
160201 Vegetable or fruit and nut salad - with dressing 14 Eaten Out Side Dish 1
160501 Other salads e.g. Greek, Florida, Russian 14 Eaten Out Side Dish 1
12901 Eggs 15 Eggs 1
130301 Eggs - boiled or poached 15 Eggs 1
130302 Eggs - scrambled, fried, omelettes or unspecified 'egg' 15 Eggs 1
26401 Flour 16 Flour 1
21001 Fresh oranges 17 Fruit 1
21401 Other fresh citrus fruits 17 Fruit 1
21701 Fresh apples 17 Fruit 1
21801 Fresh pears 17 Fruit 1
22101 Fresh stone fruit 17 Fruit 1
22201 Fresh grapes 17 Fruit 1
22701 Other fresh soft fruit 17 Fruit 1
22801 Fresh bananas 17 Fruit 1
22901 Fresh melons 17 Fruit 1
23101 Other fresh fruit 17 Fruit 1
23301 Tinned peaches, pears and pineapples 17 Fruit 1
23601 All other tinned or bottled fruit 17 Fruit 1
24001 Dried fruit 17 Fruit 1
24101 Frozen strawberries, apple slices, peach halves, oranges and other frozen fruits 17 Fruit 1
200101 All citrus fruit, fresh e.g. orange, grapefruit 17 Fruit 1
200102 Banana, fresh 17 Fruit 1
200103 Apples, fresh 17 Fruit 1
200104 Pears, fresh 17 Fruit 1
200105 Stone fruit, fresh e.g. apricot, plum, peach, cherry, avocado 17 Fruit 1
200106 Grapes, fresh 17 Fruit 1
200107 Soft fruit or berries, fresh e.g. strawberries, blackberries - without cream or ice cream
17 Fruit 1
200108 Melon, fresh 17 Fruit 1
200109 Pineapple, fresh 17 Fruit 1
200110 Fresh fruit salad - without cream or ice cream 17 Fruit 1
200111 Other fresh fruit (kiwi, passion) and unspecified 'fruit' 17 Fruit 1
200112 Free school fruit 17 Fruit 1
200201 Dried fruit e.g. sultanas, raisins 17 Fruit 1
200301 Tinned, stewed, baked or processed fruit - without cream or ice cream 17 Fruit 1
240301 Fruit filling e.g. peaches for pancakes 17 Fruit 1
19603 Vegetable juices e.g. tomato juice, carrot juice 18 Fruit (and veg) juice 1
24801 Pure fruit juices 18 Fruit (and veg) juice 1
260204 Pure fruit juices 18 Fruit (and veg) juice 1

39
260205 Vegetable juices e.g. tomato juice, carrot juice 18 Fruit (and veg) juice 1
2201 Hard cheese - Cheddar type 19 Full Fat Cheese 1
2202 Hard cheese - Other UK or foreign equivalent 19 Full Fat Cheese 1
130103 Cheddar, blue or other hard cheese and unspecified 'cheese' 19 Full Fat Cheese 1
1603 Dairy desserts - not frozen 20 Ice Cream and Dairy Desserts 1
33203 Ice cream tub or block 20 Ice Cream and Dairy Desserts 1
33302 Ice cream cornets, choc-ices, lollies with ice cream 20 Ice Cream and Dairy Desserts 1
33303 Ice lollies, sorbet, frozen mousse, frozen yoghurt 20 Ice Cream and Dairy Desserts 1
33304 Takeaway ice cream, ice cream products, milkshakes 20 Ice Cream and Dairy Desserts 1
290101 Ice cream in a cone, cornet or wafer and ice cream desserts 20 Ice Cream and Dairy Desserts 1
290103 Ice cream scoop or tub including ice cream served with dessert 20 Ice Cream and Dairy Desserts 1
290211 Fool, trifle and mousse desserts 20 Ice Cream and Dairy Desserts 1
15101 Jams and fruit curds 21 Jam, marmalade, honey and sweet spreads 1
15201 Marmalade 21 Jam, marmalade, honey and sweet spreads 1
15301 Syrup, treacle 21 Jam, marmalade, honey and sweet spreads 1
15401 Honey 21 Jam, marmalade, honey and sweet spreads 1
32303 Other spreads and dressings 21 Jam, marmalade, honey and sweet spreads 1
240106 Sweet sauce e.g. syrup, treacle, chocolate sauce 21 Jam, marmalade, honey and sweet spreads 1
240107 Fruit or vegetable based condiments 21 Jam, marmalade, honey and sweet spreads 1
240402 Jam, marmalade and honey 21 Jam, marmalade, honey and sweet spreads 1
32901 Jelly squares or crystals 22 Jelly, Ice Lollies and Sorbets 1
290104 Iced lollies and sorbets 22 Jelly, Ice Lollies and Sorbets 1
290212 Jelly 22 Jelly, Ice Lollies and Sorbets 1
2205 Cottage cheese 23 Low Fat Cheese 1
130101 Cottage cheese including with pineapple 23 Low Fat Cheese 1
28205 Other breakfast cereals 24 Low fibre and lower NMES Breakfast Cereal 1
28204 Sweetened breakfast cereals 25 Low fibre or high NMES Breakfast Cereal 1
190103 Sweetened breakfast cereals e.g. Frosties, Sugar Puffs 25 Low fibre or high NMES Breakfast Cereal 1
190105 Other breakfast cereals and unspecified 'cereal' e.g. Cornflakes, Rice Krispies, Special K
25 Low fibre or high NMES Breakfast Cereal 1
8302 Meat pies - ready to eat 26 Meat Filled Pastry 1
8303 Sausage rolls - ready to eat 26 Meat Filled Pastry 1
8401 Meat pies, pasties and puddings - frozen or not frozen 26 Meat Filled Pastry 1
9501 Takeaway meat pies and pasties 26 Meat Filled Pastry 1
110501 Meat pies (pastry topped) and pasties 26 Meat Filled Pastry 1
110503 Sausage roll (pastry) 26 Meat Filled Pastry 1
2203 Hard cheese - Edam or other foreign 27 Medium Fat Cheese 1
2206 Soft natural cheese 27 Medium Fat Cheese 1
2301 Processed cheese 27 Medium Fat Cheese 1
130102 Soft, continental or processed cheese e.g. brie 27 Medium Fat Cheese 1
31201 Cocoa and chocolate drinks 28 Milk Drinks 1
31301 Malt drinks and chocolate versions of malted drinks 28 Milk Drinks 1
250106 Hot chocolate or cocoa, with milk or water 28 Milk Drinks 1
28502 Canned or fresh carton custard 29 Milk Puddings 1
28503 All canned milk puddings 29 Milk Puddings 1
240404 Custard 29 Milk Puddings 1
290208 Custard desserts or sweet soufflé 29 Milk Puddings 1
290213 Milk and rice puddings including tapioca, semolina 29 Milk Puddings 1
29915 Quiches and flans - frozen and not frozen 30 Non Meat Savoury Pastry 1

40
130104 Quiche and cheese pies or pasties 30 Non Meat Savoury Pastry 1
24502 Nuts & edible seeds 31 Nuts 1
310101 Nuts, nut products and seeds 31 Nuts 1
26303 Malt bread and fruit loaves 32 Other Baked Goods 1
26308 Other breads 32 Other Baked Goods 1
26311 Takeaway breads 32 Other Baked Goods 1
26701 Buns, scones and teacakes 32 Other Baked Goods 1
100107 Indian breads 32 Other Baked Goods 1
220105 Garlic bread 32 Other Baked Goods 1
220106 Croissant 32 Other Baked Goods 1
220107 Continental breads e.g. pitta, ciabatta, focaccia 32 Other Baked Goods 1
220109 Fried bread, including croutons 32 Other Baked Goods 1
290301 Waffles and pancakes 32 Other Baked Goods 1
290401 Teacakes, scones, currant buns, iced buns 32 Other Baked Goods 1
6201 Corned beef - canned or sliced 33 Other processed meat 1
6601 Other cooked meat 33 Other processed meat 1
7102 Other canned meat and canned meat products 33 Other processed meat 1
8902 Other convenience meat products - frozen or not frozen 33 Other processed meat 1
9301 Pate 33 Other processed meat 1
9403 Meat pastes and spreads 33 Other processed meat 1
9506 Takeaway miscellaneous meats 33 Other processed meat 1
110701 All pates 33 Other processed meat 1
110801 Other meat products or dishes 33 Other processed meat 1
28702 Dried rice 34 Pasta, Rice and Noodles 1
28703 Cooked rice 34 Pasta, Rice and Noodles 1
28704 Takeaway rice 34 Pasta, Rice and Noodles 1
29501 Canned pasta 34 Pasta, Rice and Noodles 1
29502 Dried and fresh pasta 34 Pasta, Rice and Noodles 1
29503 Takeaway pasta and noodles 34 Pasta, Rice and Noodles 1
160202 Pasta, rice, mixed bean or cereal-based salads - with dressing 34 Pasta, Rice and Noodles 1
170101 Fried rice and risotto 34 Pasta, Rice and Noodles 1
170102 All cooked rice excluding fried rice e.g. boiled, pilau, savoury 34 Pasta, Rice and Noodles 1
170103 Pasta - not filled and plain noodles (including pot noodle) - without sauce 34 Pasta, Rice and Noodles 1
170104 Pasta - filled e.g. ravioli, tortellini - without sauce 34 Pasta, Rice and Noodles 1
24503 Peanut butter 35 Peanut Butter 1
29601 Pizzas - frozen and not frozen 36 Pizza 1
29602 Takeaway pizza 36 Pizza 1
130201 Pizza - cheese and tomato, vegetable or unspecified 'pizza' 36 Pizza 1
130202 Pizza - meat, fish or poultry 36 Pizza 1
15501 Potatoes - bought Jan-Aug, previous year’s crop 37 Potatoes 1
15502 Potatoes - bought Jan-Aug, this year’s crop 37 Potatoes 1
15503 Potatoes - bought Sep-Dec, current crop or new imported 37 Potatoes 1
15504 Fresh potatoes not specified elsewhere 37 Potatoes 1
15505 Fresh new potatoes 37 Potatoes 1
15506 Fresh baking potatoes 37 Potatoes 1
19901 Canned potatoes 37 Potatoes 1
140103 Potatoes - boiled or unspecified 'potato' 37 Potatoes 1
140104 Potatoes - mashed 37 Potatoes 1

41
140105 Potatoes - roast 37 Potatoes 1
140106 Sautéed potatoes, potato croquettes, hash browns etc. 37 Potatoes 1
140107 Baked or jacket potatoes - without filling 37 Potatoes 1
140108 Other potato dishes (e.g. wedges, potato salad) including unspecified 'potato dish'
37 Potatoes 1
5903 Cooked chicken and turkey 38 Poultry 1
7401 Chicken - whole or part 38 Poultry 1
7703 Turkey - whole or part 38 Poultry 1
7704 Poultry other than chicken or turkey 38 Poultry 1
110201 Chicken or turkey with sauce or gravy 38 Poultry 1
110202 Chicken or turkey in breadcrumbs or batter 38 Poultry 1
110203 Duck with sauce or gravy 38 Poultry 1
11801 Takeaway fish 39 Processed Fish 1
12001 Other tinned or bottled fish 39 Processed Fish 1
12304 Takeaway fish products 39 Processed Fish 1
120601 Fish, processed, in breadcrumbs (fish fingers, fish cakes, scampi) - without sauce or dressing
39 Processed Fish 1
120602 Fish burgers (in bun) 39 Processed Fish 1
240304 Fish based filling e.g. tuna mayonnaise 39 Processed Fish 1
19702 Chips - frozen or not frozen 40 Processed Potatoes 1
19703 Takeaway chips 40 Processed Potatoes 1
19801 Instant potato 40 Processed Potatoes 1
20101 Other potato products - frozen or not frozen 40 Processed Potatoes 1
140101 Chips and French fries - from fast food outlet e.g. McDonalds 40 Processed Potatoes 1
140102 Chips - served with meal e.g. from restaurant or chip shop 40 Processed Potatoes 1
5904 Takeaway chicken 41 Processed Poultry 1
110303 Chicken burger 41 Processed Poultry 1
8901 Complete meat-based ready meals - frozen or not frozen 42 Ready Meals 1
12103 Ready meals and other fish products - frozen or not frozen 42 Ready Meals 1
20601 Ready meals and other vegetable products - frozen or not frozen 42 Ready Meals 1
14802 Reduced fat spreads 43 Reduced and Low Fat Spread 1
14803 Low fat spreads 43 Reduced and Low Fat Spread 1
26309 Sandwiches 44 Sandwiches 1
26310 Sandwiches from takeaway 44 Sandwiches 1
230101 Meat based sandwich on white bread or roll 44 Sandwiches 1
230102 Meat based sandwich on brown bread or roll 44 Sandwiches 1
230103 Meat based sandwich bread not specified 44 Sandwiches 1
230104 Chicken or turkey based sandwich on white bread or roll 44 Sandwiches 1
230105 Chicken or turkey based sandwich on brown bread or roll 44 Sandwiches 1
230106 Chicken or turkey based sandwich bread not specified 44 Sandwiches 1
230107 Bacon and egg based sandwich on white bread or roll including Bacon and Egg McMuffin
44 Sandwiches 1
230108 Bacon and egg based sandwich on brown bread or roll 44 Sandwiches 1
230109 Bacon and egg based sandwich bread not specified 44 Sandwiches 1
230110 Fish based sandwich on white bread or roll 44 Sandwiches 1
230111 Fish based sandwich on brown bread or roll 44 Sandwiches 1
230112 Fish based sandwich bread not specified 44 Sandwiches 1
230201 Cheese based sandwich on white bread or roll 44 Sandwiches 1

42
230202 Cheese based sandwich on brown bread or roll 44 Sandwiches 1
230203 Cheese based sandwich bread not specified 44 Sandwiches 1
230204 Egg based sandwich on white bread or roll including Egg McMuffin 44 Sandwiches 1
230205 Egg based sandwich on brown bread or roll 44 Sandwiches 1
230206 Egg based sandwich bread not specified 44 Sandwiches 1
230207 Vegetarian based sandwich on white bread or roll 44 Sandwiches 1
230208 Vegetarian based sandwich on brown bread or roll 44 Sandwiches 1
230209 Vegetarian based sandwich bread not specified 44 Sandwiches 1
230210 Sweet-filled sandwich 44 Sandwiches 1
230211 Unspecified sandwiches or rolls 44 Sandwiches 1
7901 Sausages, uncooked - pork 45 Sausages 1
8001 Sausages, uncooked - beef etc. 45 Sausages 1
9302 Delicatessen type sausages 45 Sausages 1
9504 Takeaway sausages and saveloys 45 Sausages 1
110402 Plain sausages e.g. beef, pork 45 Sausages 1
110403 Other sausages 45 Sausages 1
110404 Hot dogs and sausage sandwiches 45 Sausages 1
27101 Crispbread 46 Savoury Biscuits 1
27403 Cream crackers and other unsweetened biscuits 46 Savoury Biscuits 1
300104 Savoury biscuits 46 Savoury Biscuits 1
32302 Salad dressings 47 Savoury Sauces and Dressings 1
32702 Pickles 47 Savoury Sauces and Dressings 1
32703 Sauces 47 Savoury Sauces and Dressings 1
32704 Takeaway sauces and mayonnaise 47 Savoury Sauces and Dressings 1
240101 Cheese or cream based sauce e.g. carbonara, cauliflower cheese 47 Savoury Sauces and Dressings 1
240102 Meat-based sauce e.g. bolognese, chilli con carne 47 Savoury Sauces and Dressings 1
240103 Fish or seafood based sauce 47 Savoury Sauces and Dressings 1
240104 Tomato based sauce containing vegetables including ratatouille 47 Savoury Sauces and Dressings 1
240105 Other savoury sauce or unspecified 'sauce' 47 Savoury Sauces and Dressings 1
240108 Other condiments or sauces 47 Savoury Sauces and Dressings 1
240201 Salad dressings and dips 47 Savoury Sauces and Dressings 1
240202 Mayonnaise 47 Savoury Sauces and Dressings 1
240203 Coleslaw 47 Savoury Sauces and Dressings 1
1503 Semi-skimmed milk 48 Semi-skimmed Milk 1
1502 Fully skimmed milk 49 Skimmed Milk 1
13801 Soft margarine 50 Soft Margarine 1
31801 Soups - canned or cartons 51 Soup 1
31901 Soups - dehydrated or powdered 51 Soup 1
32001 Soups - from takeaway 51 Soup 1
180101 Meat & fish soups 51 Soup 1
180102 Vegetable based soups 51 Soup 1
180103 Chinese soups, consommé (meat, fish or veg) 51 Soup 1
180104 Other soups including unspecified 'soup' 51 Soup 1
13501 Butter 52 Total Spreading Fats 1
13801 Soft margarine 52 Total Spreading Fats 1
14802 Reduced fat spreads 52 Total Spreading Fats 1
14803 Low fat spreads 52 Total Spreading Fats 1
240401 Butter and margarine 52 Spreading Fats 1

43
15001 Sugar 53 Sugar 1
240405 Sugar (as an addition to tea, coffee etc.) 53 Sugar 1
35301 Mints 54 Sugar Confectionery 1
35302 Boiled sweets 54 Sugar Confectionery 1
35401 Fudges, toffees, caramels 54 Sugar Confectionery 1
35501 Takeaway confectionery 54 Sugar Confectionery 1
280105 Mints e.g. Polo, Extra Strong 54 Sugar Confectionery 1
280106 Boiled sweets, jellies and unspecified 'sweets' e.g. fruit gums 54 Sugar Confectionery 1
280107 Uncoated toffee or fudge, uncoated e.g. Toffos, chocolate eclairs, caramels 54 Sugar Confectionery 1
280108 Pick 'n' mix, nougat, liquorice and other sweets 54 Sugar Confectionery 1
34001 Soft drinks, concentrated, not low calorie 55 Sugar Containing Soft Drinks 1
34101 Soft drinks, not concentrated, not low calorie 55 Sugar Containing Soft Drinks 1
38501 Spirits with mixer 55 Sugar Containing Soft Drinks 0.85
38901 Alcopops 55 Sugar Containing Soft Drinks 0.85
260203 Soft drink (incl carbonates & still) - not low calorie (including drinks where calorie content unspecified)
55 Sugar Containing Soft Drinks 1
260206 Soft drink where pure juice or juice drink not specified 55 Sugar Containing Soft Drinks 1
270104 Spirits or liqueurs with mixer e.g. gin & tonic, Bacardi & coke 55 Sugar Containing Soft Drinks 0.85
270206 Alcoholic soft drinks (alcopops), and ready-mixed bottled drinks 55 Sugar Containing Soft Drinks 0.85
34301 Soft drinks, concentrated, low calorie 56 Sugar Free Soft Drinks 1
34401 Soft drinks, not concentrated, low calorie 56 Sugar Free Soft Drinks 1
260202 Soft drink (incl carbonates and still) - low calorie 56 Sugar Free Soft Drinks 1
27402 Sweet biscuits (not chocolate) and cereal bars 57 Sweet Biscuits 1
27702 Chocolate biscuits 57 Sweet Biscuits 1
300101 Fully-coated chocolate biscuits or wafers 57 Sweet Biscuits 1
300102 Sweet biscuits including half-coated chocolate biscuits 57 Sweet Biscuits 1
300103 Cereal bars and cereal based cakes 57 Sweet Biscuits 1
9505 Takeaway meat based meals 58 Takeaway Main Meal Component 1
12305 Takeaway fish based meals 58 Takeaway Main Meal Component 1
20604 All vegetable takeaway products 58 Takeaway Main Meal Component 1
28101 Oatmeal and oat products 59 Total Breakfast Cereal 1
28202 Muesli 59 Total Breakfast Cereal 1
28203 High fibre breakfast cereals 59 Total Breakfast Cereal 1
28204 Sweetened breakfast cereals 59 Total Breakfast Cereal 1
28205 Other breakfast cereals 59 Total Breakfast Cereal 1
190101 Muesli and oat crunch cereals 59 Total Breakfast Cereal 1
190102 Other high fibre breakfast cereals e.g. Allbran, Weetabix 59 Total Breakfast Cereal 1
190103 Sweetened breakfast cereals e.g. Frosties, Sugar Puffs 59 Total Breakfast Cereal 1
190104 Hot breakfast cereals e.g. porridge, Ready Brek 59 Total Breakfast Cereal 1
190105 Other breakfast cereals and unspecified 'cereal' e.g. Cornflakes, Rice Krispies, Special K
59 Total Breakfast Cereal 1
2201 Hard cheese - Cheddar type 60 Total Cheese 1
2202 Hard cheese - Other UK or foreign equivalent 60 Total Cheese 1
2203 Hard cheese - Edam or other foreign 60 Total Cheese 1
2205 Cottage cheese 60 Total Cheese 1
2206 Soft natural cheese 60 Total Cheese 1
2301 Processed cheese 60 Total Cheese 1

44
130101 Cottage cheese including with pineapple 60 Total Cheese 2
130105 Other cheese dishes e.g. Welsh rarebit, cheese and biscuits 60 Total Cheese 1
240303 Cheese filling including cheddar cheese, cottage cheese 60 Total Cheese 1
16201 Fresh cabbages 61 Total Fruit and Vegetables 1
16301 Fresh Brussels sprouts 61 Total Fruit and Vegetables 1
16401 Fresh cauliflower 61 Total Fruit and Vegetables 1
16701 Lettuce and leafy salads 61 Total Fruit and Vegetables 1
16702 Prepared lettuce salads 61 Total Fruit and Vegetables 1
16801 Fresh peas 61 Total Fruit and Vegetables 1
16901 Fresh beans 61 Total Fruit and Vegetables 1
17101 Other fresh green vegetables 61 Total Fruit and Vegetables 1
17201 Fresh carrots 61 Total Fruit and Vegetables 1
17301 Fresh turnips and swede 61 Total Fruit and Vegetables 1
17401 Other fresh root vegetables 61 Total Fruit and Vegetables 1
17501 Fresh onions, leeks and shallots 61 Total Fruit and Vegetables 1
17601 Fresh cucumbers 61 Total Fruit and Vegetables 1
17701 Fresh mushrooms 61 Total Fruit and Vegetables 1
17801 Fresh tomatoes 61 Total Fruit and Vegetables 1
18301 Fresh vegetable stewpack, stirfry pack etc. 61 Total Fruit and Vegetables 1
18302 Fresh stem vegetables 61 Total Fruit and Vegetables 1
18303 Fresh marrow, courgettes, aubergine, pumpkin and other vegetables 61 Total Fruit and Vegetables 1
18304 Fresh herbs 61 Total Fruit and Vegetables 1
18401 Tomatoes, canned or bottled 61 Total Fruit and Vegetables 1
18501 Peas, canned 61 Total Fruit and Vegetables 1
18802 Baked beans in sauce 61 Total Fruit and Vegetables 1
18803 Other canned beans and pulses 61 Total Fruit and Vegetables 1
19101 Other canned vegetables 61 Total Fruit and Vegetables 1
19201 Dried pulses, other than air-dried 61 Total Fruit and Vegetables 1
19501 Air-dried vegetables 61 Total Fruit and Vegetables 1
19602 Tomato puree and vegetable purees 61 Total Fruit and Vegetables 1
19603 Vegetable juices e.g. tomato juice, carrot juice 61 Total Fruit and Vegetables 1
20301 Peas, frozen 61 Total Fruit and Vegetables 1
20401 Beans, frozen 61 Total Fruit and Vegetables 1
20801 Other frozen vegetables 61 Total Fruit and Vegetables 1
21001 Fresh oranges 61 Total Fruit and Vegetables 1
21401 Other fresh citrus fruits 61 Total Fruit and Vegetables 1
21701 Fresh apples 61 Total Fruit and Vegetables 1
21801 Fresh pears 61 Total Fruit and Vegetables 1
22101 Fresh stone fruit 61 Total Fruit and Vegetables 1
22201 Fresh grapes 61 Total Fruit and Vegetables 1
22701 Other fresh soft fruit 61 Total Fruit and Vegetables 1
22801 Fresh bananas 61 Total Fruit and Vegetables 1
22901 Fresh melons 61 Total Fruit and Vegetables 1
23101 Other fresh fruit 61 Total Fruit and Vegetables 1
23301 Tinned peaches, pears and pineapples 61 Total Fruit and Vegetables 1
23601 All other tinned or bottled fruit 61 Total Fruit and Vegetables 1
24001 Dried fruit 61 Total Fruit and Vegetables 1
24101 Frozen strawberries, apple slices, peach halves, oranges and other frozen fruits 61 Total Fruit and Vegetables 1
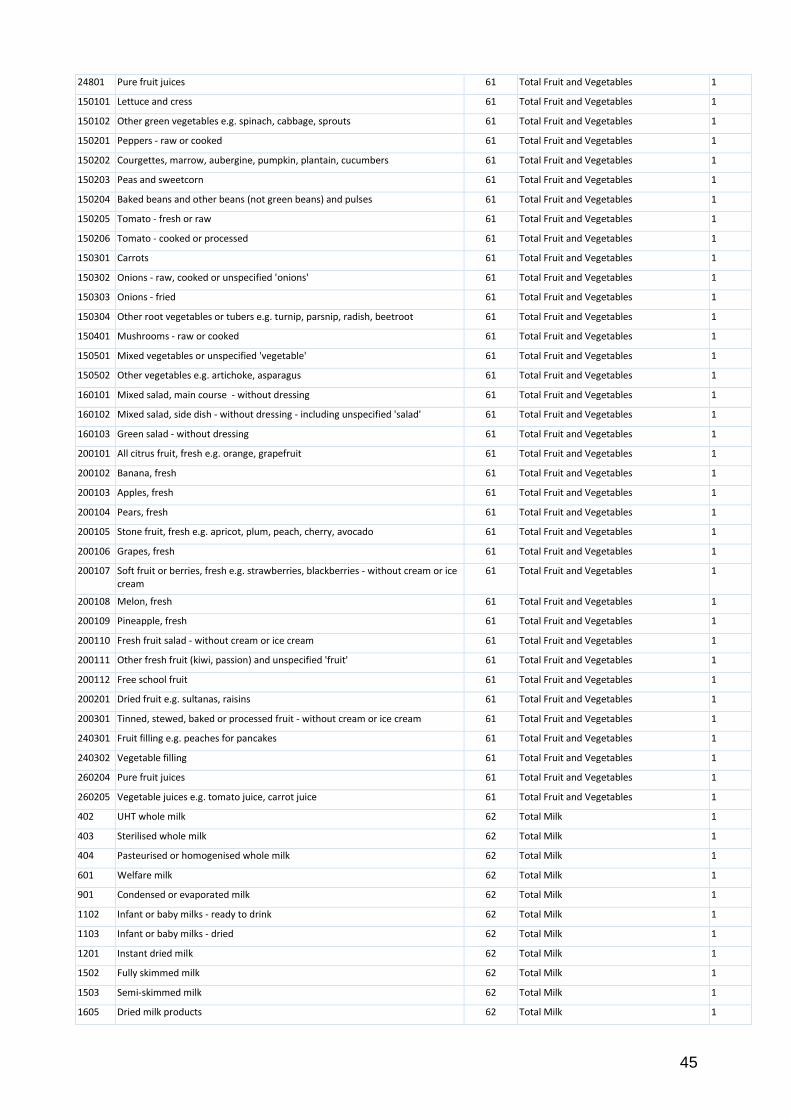
45
24801 Pure fruit juices 61 Total Fruit and Vegetables 1
150101 Lettuce and cress 61 Total Fruit and Vegetables 1
150102 Other green vegetables e.g. spinach, cabbage, sprouts 61 Total Fruit and Vegetables 1
150201 Peppers - raw or cooked 61 Total Fruit and Vegetables 1
150202 Courgettes, marrow, aubergine, pumpkin, plantain, cucumbers 61 Total Fruit and Vegetables 1
150203 Peas and sweetcorn 61 Total Fruit and Vegetables 1
150204 Baked beans and other beans (not green beans) and pulses 61 Total Fruit and Vegetables 1
150205 Tomato - fresh or raw 61 Total Fruit and Vegetables 1
150206 Tomato - cooked or processed 61 Total Fruit and Vegetables 1
150301 Carrots 61 Total Fruit and Vegetables 1
150302 Onions - raw, cooked or unspecified 'onions' 61 Total Fruit and Vegetables 1
150303 Onions - fried 61 Total Fruit and Vegetables 1
150304 Other root vegetables or tubers e.g. turnip, parsnip, radish, beetroot 61 Total Fruit and Vegetables 1
150401 Mushrooms - raw or cooked 61 Total Fruit and Vegetables 1
150501 Mixed vegetables or unspecified 'vegetable' 61 Total Fruit and Vegetables 1
150502 Other vegetables e.g. artichoke, asparagus 61 Total Fruit and Vegetables 1
160101 Mixed salad, main course - without dressing 61 Total Fruit and Vegetables 1
160102 Mixed salad, side dish - without dressing - including unspecified 'salad' 61 Total Fruit and Vegetables 1
160103 Green salad - without dressing 61 Total Fruit and Vegetables 1
200101 All citrus fruit, fresh e.g. orange, grapefruit 61 Total Fruit and Vegetables 1
200102 Banana, fresh 61 Total Fruit and Vegetables 1
200103 Apples, fresh 61 Total Fruit and Vegetables 1
200104 Pears, fresh 61 Total Fruit and Vegetables 1
200105 Stone fruit, fresh e.g. apricot, plum, peach, cherry, avocado 61 Total Fruit and Vegetables 1
200106 Grapes, fresh 61 Total Fruit and Vegetables 1
200107 Soft fruit or berries, fresh e.g. strawberries, blackberries - without cream or ice cream
61 Total Fruit and Vegetables 1
200108 Melon, fresh 61 Total Fruit and Vegetables 1
200109 Pineapple, fresh 61 Total Fruit and Vegetables 1
200110 Fresh fruit salad - without cream or ice cream 61 Total Fruit and Vegetables 1
200111 Other fresh fruit (kiwi, passion) and unspecified 'fruit' 61 Total Fruit and Vegetables 1
200112 Free school fruit 61 Total Fruit and Vegetables 1
200201 Dried fruit e.g. sultanas, raisins 61 Total Fruit and Vegetables 1
200301 Tinned, stewed, baked or processed fruit - without cream or ice cream 61 Total Fruit and Vegetables 1
240301 Fruit filling e.g. peaches for pancakes 61 Total Fruit and Vegetables 1
240302 Vegetable filling 61 Total Fruit and Vegetables 1
260204 Pure fruit juices 61 Total Fruit and Vegetables 1
260205 Vegetable juices e.g. tomato juice, carrot juice 61 Total Fruit and Vegetables 1
402 UHT whole milk 62 Total Milk 1
403 Sterilised whole milk 62 Total Milk 1
404 Pasteurised or homogenised whole milk 62 Total Milk 1
601 Welfare milk 62 Total Milk 1
901 Condensed or evaporated milk 62 Total Milk 1
1102 Infant or baby milks - ready to drink 62 Total Milk 1
1103 Infant or baby milks - dried 62 Total Milk 1
1201 Instant dried milk 62 Total Milk 1
1502 Fully skimmed milk 62 Total Milk 1
1503 Semi-skimmed milk 62 Total Milk 1
1605 Dried milk products 62 Total Milk 1

46
1606 Milk drinks & other milks (replaced 200405 onwards) 62 Total Milk 1
1607 Milk drinks & other milks 62 Total Milk 1
1608 Non-dairy milk substitutes 62 Total Milk 1
260301 Milk as a drink 62 Total Milk 1
260302 Milk on cereal 62 Total Milk 1
260303 Milkshake and flavoured milk 62 Total Milk 1
260304 Free school milk 62 Total Milk 1
5502 Bacon and ham joints, uncooked 63 Total Processed Red Meat 1
5505 Bacon and ham rashers, uncooked 63 Total Processed Red Meat 1
5801 Ham and bacon 63 Total Processed Red Meat 1
6201 Corned beef - canned or sliced 63 Total Processed Red Meat 1
6601 Other cooked meat 63 Total Processed Red Meat 1
7102 Other canned meat and canned meat products 63 Total Processed Red Meat 1
7901 Sausages, uncooked - pork 63 Total Processed Red Meat 1
8001 Sausages, uncooked - beef etc. 63 Total Processed Red Meat 1
8302 Meat pies - ready to eat 63 Total Processed Red Meat 1
8303 Sausage rolls - ready to eat 63 Total Processed Red Meat 1
8401 Meat pies, pasties and puddings - frozen or not frozen 63 Total Processed Red Meat 1
8501 Burgers - frozen or not frozen 63 Total Processed Red Meat 1
8902 Other convenience meat products - frozen or not frozen 63 Total Processed Red Meat 1
9301 Pate 63 Total Processed Red Meat 1
9302 Delicatessen type sausages 63 Total Processed Red Meat 1
9403 Meat pastes and spreads 63 Total Processed Red Meat 1
9501 Takeaway meat pies and pasties 63 Total Processed Red Meat 1
9502 Takeaway burger and bun 63 Total Processed Red Meat 1
9503 Takeaway kebabs 63 Total Processed Red Meat 1
9504 Takeaway sausages and saveloys 63 Total Processed Red Meat 1
9506 Takeaway miscellaneous meats 63 Total Processed Red Meat 1
110106 Bacon 63 Total Processed Red Meat 1
110107 Gammon or ham 63 Total Processed Red Meat 1
110301 Small or single burgers 63 Total Processed Red Meat 1
110302 Large or double burgers 63 Total Processed Red Meat 1
110401 Kebabs - all types including chicken 63 Total Processed Red Meat 1
110402 Plain sausages e.g. beef, pork 63 Total Processed Red Meat 1
110403 Other sausages 63 Total Processed Red Meat 1
110404 Hot dogs and sausage sandwiches 63 Total Processed Red Meat 1
110501 Meat pies (pastry topped) and pasties 63 Total Processed Red Meat 1
110503 Sausage roll (pastry) 63 Total Processed Red Meat 1
110701 All pates 63 Total Processed Red Meat 1
110801 Other meat products or dishes 63 Total Processed Red Meat 1
10201 White fish, fresh or chilled 64 Unprocessed Fish 1
10202 White fish, frozen 64 Unprocessed Fish 1
10601 Herrings and other blue fish, fresh or chilled 64 Unprocessed Fish 1
10602 Herrings and other blue fish, frozen 64 Unprocessed Fish 1
10701 Salmon, fresh or chilled 64 Unprocessed Fish 1
10702 Salmon, frozen 64 Unprocessed Fish 1
10801 Blue fish, dried or salted or smoked 64 Unprocessed Fish 1
11401 White fish, dried or salted or smoked 64 Unprocessed Fish 1

47
11702 Shellfish, fresh or chilled 64 Unprocessed Fish 1
11703 Shellfish, frozen 64 Unprocessed Fish 1
11901 Tinned salmon 64 Unprocessed Fish 1
120101 White fish - grilled, steamed, baked or boiled - without sauce 64 Unprocessed Fish 1
120102 White fish - fried (incl in batter/breadcrumbs) - without sauce 64 Unprocessed Fish 1
120201 Trout, tuna and salmon only - fresh - without sauce or dressing 64 Unprocessed Fish 1
120202 Other fatty fish - without sauce or dressing e.g. herring, mackerel, sardines 64 Unprocessed Fish 1
120301 Shellfish - without sauce or dressing e.g. prawns, shrimps, oysters, crab 64 Unprocessed Fish 1
120401 Kippers and other smoked fish e.g. smoked salmon 64 Unprocessed Fish 1
120501 Other fish products and unspecified 'fish' e.g. squid, sushi, crabsticks 64 Unprocessed Fish 1
3102 Beef joints - on the bone 65 Unprocessed Red Meat 1
3103 Beef joints - boned 65 Unprocessed Red Meat 1
3104 Beef steak - less expensive 65 Unprocessed Red Meat 1
3105 Beef steak - more expensive 65 Unprocessed Red Meat 1
3106 Minced beef 65 Unprocessed Red Meat 1
3107 All other beef and veal 65 Unprocessed Red Meat 1
3601 Mutton 65 Unprocessed Red Meat 1
3602 Lamb joints 65 Unprocessed Red Meat 1
3603 Lamb chops 65 Unprocessed Red Meat 1
3604 All other lamb 65 Unprocessed Red Meat 1
4101 Pork joints 65 Unprocessed Red Meat 1
4102 Pork chops 65 Unprocessed Red Meat 1
4103 Pork fillets and steaks 65 Unprocessed Red Meat 1
4104 All other pork 65 Unprocessed Red Meat 1
4603 Ox liver 65 Unprocessed Red Meat 1
4604 Lambs liver 65 Unprocessed Red Meat 1
4605 Pigs liver 65 Unprocessed Red Meat 1
4607 All other liver 65 Unprocessed Red Meat 1
5101 All offal other than liver 65 Unprocessed Red Meat 1
7801 Other fresh, chilled or frozen meat 65 Unprocessed Red Meat 1
110101 Steak - without sauce e.g. braised, sirloin 65 Unprocessed Red Meat 1
110102 Roast meat with sauce or gravy 65 Unprocessed Red Meat 1
110103 Pork chops with sauce or gravy 65 Unprocessed Red Meat 1
110104 Lamb chops with sauce or gravy 65 Unprocessed Red Meat 1
110105 Spare ribs 65 Unprocessed Red Meat 1
110108 All offal including liver, kidney, tongue 65 Unprocessed Red Meat 1
110204 Game with sauce or gravy 65 Unprocessed Red Meat 1
16201 Fresh cabbages 66 Vegetables 1
16301 Fresh Brussels sprouts 66 Vegetables 1
16401 Fresh cauliflower 66 Vegetables 1
16701 Lettuce and leafy salads 66 Vegetables 1
16702 Prepared lettuce salads 66 Vegetables 1
16801 Fresh peas 66 Vegetables 1
16901 Fresh beans 66 Vegetables 1
17101 Other fresh green vegetables 66 Vegetables 1
17201 Fresh carrots 66 Vegetables 1
17301 Fresh turnips and swede 66 Vegetables 1
17401 Other fresh root vegetables 66 Vegetables 1

48
17501 Fresh onions, leeks and shallots 66 Vegetables 1
17601 Fresh cucumbers 66 Vegetables 1
17701 Fresh mushrooms 66 Vegetables 1
17801 Fresh tomatoes 66 Vegetables 1
18301 Fresh vegetable stewpack, stirfry pack etc. 66 Vegetables 1
18302 Fresh stem vegetables 66 Vegetables 1
18303 Fresh marrow, courgettes, aubergine, pumpkin and other vegetables 66 Vegetables 1
18304 Fresh herbs 66 Vegetables 1
18401 Tomatoes, canned or bottled 66 Vegetables 1
18501 Peas, canned 66 Vegetables 1
18802 Baked beans in sauce 66 Vegetables 1
18803 Other canned beans and pulses 66 Vegetables 1
19101 Other canned vegetables 66 Vegetables 1
19201 Dried pulses, other than air-dried 66 Vegetables 1
19501 Air-dried vegetables 66 Vegetables 1
19602 Tomato puree and vegetable purees 66 Vegetables 1
20301 Peas, frozen 66 Vegetables 1
20401 Beans, frozen 66 Vegetables 1
20801 Other frozen vegetables 66 Vegetables 1
150101 Lettuce and cress 66 Vegetables 1
150102 Other green vegetables e.g. spinach, cabbage, sprouts 66 Vegetables 1
150201 Peppers - raw or cooked 66 Vegetables 1
150202 Courgettes, marrow, aubergine, pumpkin, plantain, cucumbers 66 Vegetables 1
150203 Peas and sweetcorn 66 Vegetables 1
150204 Baked beans and other beans (not green beans) and pulses 66 Vegetables 1
150205 Tomato - fresh or raw 66 Vegetables 1
150206 Tomato - cooked or processed 66 Vegetables 1
150301 Carrots 66 Vegetables 1
150302 Onions - raw, cooked or unspecified 'onions' 66 Vegetables 1
150303 Onions - fried 66 Vegetables 1
150304 Other root vegetables or tubers e.g. turnip, parsnip, radish, beetroot 66 Vegetables 1
150401 Mushrooms - raw or cooked 66 Vegetables 1
150501 Mixed vegetables or unspecified 'vegetable' 66 Vegetables 1
150502 Other vegetables e.g. artichoke, asparagus 66 Vegetables 1
160101 Mixed salad, main course - without dressing 66 Vegetables 1
160102 Mixed salad, side dish - without dressing - including unspecified 'salad' 66 Vegetables 1
160103 Green salad - without dressing 66 Vegetables 1
240302 Vegetable filling 66 Vegetables 1
402 UHT whole milk 67 Whole Milk 1
403 Sterilised whole milk 67 Whole Milk 1
404 Pasteurised or homogenised whole milk 67 Whole Milk 1
601 Welfare milk 67 Whole Milk 1
28101 Oatmeal and oat products 68 Wholegrain/ HF Breakfast Cereal 1
28202 Muesli 68 Wholegrain/ HF Breakfast Cereal 1
28203 High fibre breakfast cereals 68 Wholegrain/ HF Breakfast Cereal 1
190101 Muesli and oat crunch cereals 68 Wholegrain/ HF Breakfast Cereal 1
190102 Other high fibre breakfast cereals e.g. Allbran, Weetabix 68 Wholegrain/ HF Breakfast Cereal 1
190104 Hot breakfast cereals e.g. porridge, Ready Brek 68 Wholegrain/ HF Breakfast Cereal 1

49
1301 Yoghurt 69 Yoghurt and Fromage Frais 1
1302 Fromage frais 69 Yoghurt and Fromage Frais 1
210101 Yoghurt and fromage frais 69 Yoghurt and Fromage Frais 1
35001 Chocolate bars - solid 70 Total Confectionery 1
35101 Chocolate bars - filled 70 Total Confectionery 1
35301 Mints 70 Total Confectionery 1
35302 Boiled sweets 70 Total Confectionery 1
35401 Fudges, toffees, caramels 70 Total Confectionery 1
35501 Takeaway confectionery 70 Total Confectionery 1
280101 Solid, unfilled chocolate bars and sweets and unspecified 'chocolate' 70 Total Confectionery 1
280102 Filled chocolate-coated bars and sweets e.g. Mars, Snickers, Minstrels 70 Total Confectionery 1
280103 Single chocolate (after dinner) 70 Total Confectionery 1
280105 Mints e.g. Polo, Extra Strong 70 Total Confectionery 1
280106 Boiled sweets, jellies and unspecified 'sweets' e.g. fruit gums 70 Total Confectionery 1
280107 Uncoated toffee or fudge, uncoated e.g. Toffos, chocolate éclairs, caramels 70 Total Confectionery 1
280108 Pick 'n' mix, nougat, liquorice and other sweets 70 Total Confectionery 1
27402 Sweet biscuits (not chocolate) and cereal bars 71 Total Confectionery and Sweet Biscuits 1
27702 Chocolate biscuits 71 Total Confectionery and Sweet Biscuits 1
35001 Chocolate bars - solid 71 Total Confectionery and Sweet Biscuits 1
35101 Chocolate bars - filled 71 Total Confectionery and Sweet Biscuits 1
35301 Mints 71 Total Confectionery and Sweet Biscuits 1
35302 Boiled sweets 71 Total Confectionery and Sweet Biscuits 1
35401 Fudges, toffees, caramels 71 Total Confectionery and Sweet Biscuits 1
35501 Takeaway confectionery 71 Total Confectionery and Sweet Biscuits 1
280101 Solid, unfilled chocolate bars and sweets and unspecified 'chocolate' 71 Total Confectionery and Sweet Biscuits 1
280102 Filled chocolate-coated bars and sweets e.g. Mars, Snickers, Minstrels 71 Total Confectionery and Sweet Biscuits 1
280103 Single chocolate (after dinner) 71 Total Confectionery and Sweet Biscuits 1
280105 Mints e.g. Polo, Extra Strong 71 Total Confectionery and Sweet Biscuits 1
280106 Boiled sweets, jellies and unspecified 'sweets' e.g. fruit gums 71 Total Confectionery and Sweet Biscuits 1
280107 Uncoated toffee or fudge, uncoated e.g. Toffos, chocolate eclairs, caramels 71 Total Confectionery and Sweet Biscuits 1
280108 Pick 'n' mix, nougat, liquorice and other sweets 71 Total Confectionery and Sweet Biscuits 1
300101 Fully-coated chocolate biscuits or wafers 71 Total Confectionery and Sweet Biscuits 1
300102 Sweet biscuits including half-coated chocolate biscuits 71 Total Confectionery and Sweet Biscuits 1
300103 Cereal bars and cereal based cakes 71 Total Confectionery and Sweet Biscuits 1