estimation of flutter derivatives of various sections ...the 2012 world congress on advances in...
TRANSCRIPT

The 2012 World Congress on Advances in Civil, Environmental, and Materials Research (ACEM’ 12)Seoul, Korea, August 26-30, 2012
Estimation of Flutter Derivatives of Various Sections Using Numerical Simulation and Neural Network
*Jaeyong Chung1), Seoung-Woo Lee2), Seongkyu Chang3), Yun-Seok Kim4)
1), 2), 3), 4)
TESolution Co. Ltd, Anseong-Si, Kyunggi-Do, Korea 1)
ABSTRACT
Recently, Computational Fluid Dynamic (CFD) method is being popular countermeasures for analyzing flow behaviors in wind engineering fields. This paper presents the reliability and the accuracy of numerical simulation and neural network method to predict flutter derivatives of rectangular section. The flutter derivatives are the essential parameters in the estimation of critical flutter wind speed in aero-elastic analysis of a flexible bridge. The flutter derivatives are found to be functions of the cross section geometry of the bridge deck and the reduced wind speed. The numerical simulations of flutter analysis for two-dimensional rectangular section are conducted by fluid-structure interaction method. The numerical simulations carried out for rectangular section, which is forced in vertical or torsional harmonic motion. From the results of numerical simulation, the flutter derivatives are compared with theoretical results and experimental data from forced vibration test. Overall, the calculated flutter derivatives and critical flutter velocity from the numerical simulation are in good agreement with those of wind tunnel test. Furthermore, additional estimated method, neural network, is attempted to propose a method estimating the flutter derivatives without wind tunnel test. 1. INTRODUCTION
The aero-elastic phenomena have seen for long-span bridges are flutter, galloping, and vortex shedding induced vibration. Flutter is one of complicated issues to be considered in the design of long-span bridges. The unsteady aerodynamic forces due
1) General Manager
2) General Manager
3) Manager
4) C.E.O.
to the bridge deck motion are usually expressed in flutter derivatives (Scanlan 1971, Theodorsen 1935). Flutter derivatives plays an important role in predicting critical flutter wind speed for evaluating the flutter stability of bridges, and have been studied by many researchers (Ge 2000, Gu 2001, Matsumoto 2005). The wind tunnel test is the most general way to extract flutter derivatives of bridge section. However, it is well known that the flutter derivatives are closely related with test conditions, such as the reduced wind speed, amplitude of forced oscillation and wind properties, etc. Recently, the role of numerical simulation increased as a powerful method for studying various wind effects on bridges, which are not suitable for wind tunnel investigation. Many numerical simulation studies have been conducted for estimation flutter derivatives of bridge sections (Frandesen 2005, Simonsen 2008, Xin 2010, Huang 2011). Also, (Chen 2003, Chen et al. 2008) have proposed a neural network approach to predict the flutter derivatives of rectangular section models using free vibration test data. In this paper, the numerical simulation performed for evaluating flutter derivatives of rectangular section. The critical flutter wind speed is predicted from these flutter derivatives. The results obtained by numerical simulation are compared with the experimental ones to validate the numerical simulation approach. Also, back-propagation neural network is attempted to estimate the flutter derivatives using forced vibration test data. 2. WIND TUNNEL TEST
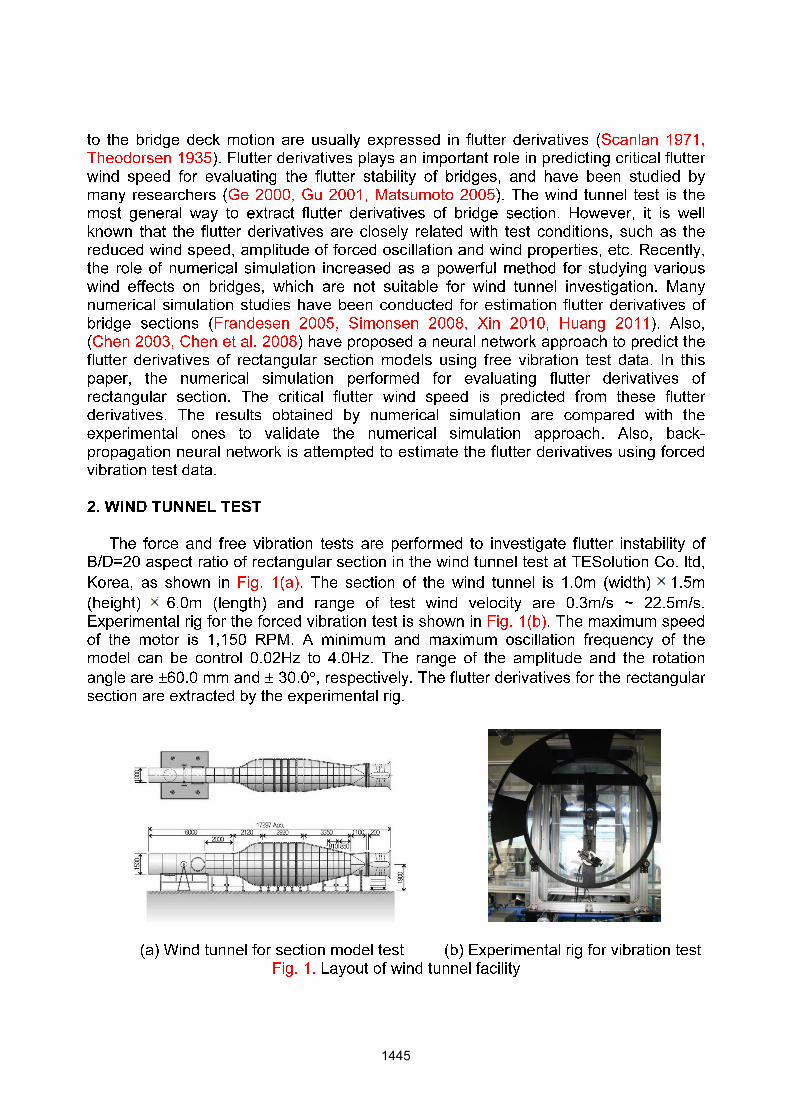
The force and free vibration tests are performed to investigate flutter instability of B/D=20 aspect ratio of rectangular section in the wind tunnel test at TESolution Co. ltd,
Korea, as shown in Fig. 1(a). The section of the wind tunnel is 1.0m (width) 1.5m
(height) 6.0m (length) and range of test wind velocity are 0.3m/s ~ 22.5m/s. Experimental rig for the forced vibration test is shown in Fig. 1(b). The maximum speed of the motor is 1,150 RPM. A minimum and maximum oscillation frequency of the model can be control 0.02Hz to 4.0Hz. The range of the amplitude and the rotation
angle are ±60.0 mm and ± 30.0°, respectively. The flutter derivatives for the rectangular section are extracted by the experimental rig.
(a) Wind tunnel for section model test (b) Experimental rig for vibration test Fig. 1. Layout of wind tunnel facility

3. NUME
The dmethod are solvcomputealgorithmunsteadfield of
depende
the wall
model. Tboundar
shown t
these re
flow in thThe twotwo gridapplied while thgrid regcalculatiquadran
edges th
SST mouniform the uppeplate is d
ERICAL S
descriptionapplied fo
ved by a seed by them is usedy simulatiothe comp
ency of the
by the k-
The SST mry layers b
to predict b
easons, th
his simulato-dimensiod regions to the whe dynamicgion near ion time st
ngular grids
he grid has
odel. The bvelocity co
er and lowdefined as
SIMULATIO
n of numeror solving inecond-ordee secondd to solveon, the ste
putation do
e k-ω mod
ε model, M
model accby modify
better flow
e k-ω SST
tion. nal compuas Fig. 2ole compu
c region wthe bridg
tep. The nus and 94,2
s refined a
boundary condition, th
wer boundas wall cond
Fig. 2. G
ON SETUP
rical simulancompresser central d-order upe the preeady-stateomain. In
el and to p
Menter (19
ounts for ting the tu
w separatio
T turbulenc
utational do. The twoutational das deform
ge sectionumber of g292 triangu
and the y+
conditions he outlet baries are deition.
Grid distribu
P
ation setupsible Naviedifference
pwind schessure-veloe simulatio
order to o
prevent th
94) introdu
the transpourbulent ed
on compar
ce model
omain ando grid regiomain. Th
med by the ns is defogrids in staular grids w
+ height of
are defineboundary iefined as s
ution of com
p is given er-Stokes escheme, aeme. Theocity coupn is conduovercome
e over-pre
uced the S
ort of the ddy-viscos
red to both
is employ
the wholeons, statio
he stationabridge mo
ormed withationary anwith body-f
body-fitted
ed as; the s defined symmetry
mputationa
in this secequation. Tand the coe pressurepling equaucted for ithe proble
ediction of
Shear Stres
turbulent sity functio
h k-ε and k
yed to sim
e computatonary and ary region otion at eah moving
nd dynamicfitted grid,
d grid is ar
inlet bounas pressucondition,
al domain
ction. FiniteThe diffusi
onvection tee-implicit
ation. To initializing em of free
length sca
ss Transpo
shear streson. SST h
k- ω mode
ulate the
tional dom dynamic was not d
ach time ssection a
c regions irespective
round 1 fo
ndary is dere outlet cand the s
e volume ve terms erms are SIMPLE simulate the flow
e-stream
ales near
ort (SST)
ss inside as been
els. From
turbulent
ain have regions,
deformed step. The at every s 12,855 ely. Near
r the k-ω
efined as condition, urface of

The B/D=20 aspect ratio of rectangular section is forced to move either vertically to the flow direction or rotationally in a sinusoidal motion with constant amplitude. The
amplitudes of the vertical and rotational motions are chosen as 0.02 m and 4.0° for
translation and rotation. The motion is harmonic motion, and the rotation is defined as positive clockwise and the translation is positive upwards as shown in Fig. 2. For each harmonic motion, approach velocities were considered from 0 m/s to 20 m/s. The summary of parameters of test is given as Table 1.
4. BACK-PROPAGATION NEURAL NETWORK FOR FLUTTER DERIVATIVES
Generally, the flutter derivatives are extracted by wind tunnel test such as free vibration test or forced vibration test. However, the wind tunnel test consumed much time and cost to perform the test. Therefore, a method for estimating the flutter derivatives without the wind tunnel test is expressed in this section. Generally, natural phenomena are not easy to show the relationship with cause and effect using formula. Recently, in order to solve the problem, neural network is often used. Fig. 3 shows the structure of the neural network used in this study. The width-to-depth ratio (B/D),
reduced frequencies (K � Bϖ/U) and reduced velocities (U���) are used as input data of input layer while the flutter derivatives are used as desired output of neural network in training process. The B/D ratios of the rectangular sections are 5, 8, 10, 15 and 20 for training the neural network, where the flutter derivatives used for training are extracted by the forced vibration test. B/D=12.5 is used in order to verify this method. The eight neural networks are used to estimate the flutter derivatives (H�
∗, A�∗, i � 1,⋯4)
in this study.
B/D11o
12o
12n
o
*
iHK
redU
1
ihW 2
jiW
Hidden layer ( )Input layer ( ) Output layer ( )
M
h i j
Fig. 3. Structure of neural network
Table 1: Parameters of forced vibration of plate
Velocity (m/s) Forced vibration frequency (Hz)
Amplitude for vertical forced vibration (m)
Amplitude for torsional
forced vibration (°)
0.0 ~ 20.0 2.0 0.02 4.0

5. RESULTS
5.1 Numerical Simulation Figs. 4 and 5 show that the calculated flutter derivatives for aspect ratio B/D=20 are compared with experimental results. Theodorsen's analytical results for a flat plate are also shown in the figures. From the figures, it can be seen that the calculated flutter derivatives are in good agreement with those of the wind tunnel test in the range of small reduced wind speed but there are some discrepancies of flutter derivatives between wind tunnel test and CFD as the reduce wind speed increases. This discrepancy has not much effect on estimating critical flutter velocity. Some discrepancies in Figs 4 and 5 could be reduced by more proper set up of numerical simulation, such as time step, turbulence models, grid size, etc. From the flutter derivatives by numerical simulation, an estimated critical flutter wind speed is compared with the experimental results (Fig. 6). The predicted critical wind speed using CFD is good agreement with one is obtained by wind tunnel test (Table 2).
(a) H1* (b) H4* (c) A1* (d) A4*
Fig. 4. Flutter derivatives of vertical forced vibration test
(a) H2* (b) H3* (c) A2* (d) A3*
Fig. 5. Flutter derivatives of torsional forced vibration test
Fig. 6. Estimation of critical flutter wind speed
Table 2: Critical flutter wind speed
CFD 16.8 m/s
Forced vibration test (Exp.) 16.0 m/s
Free vibration test (Exp.) 17.2 m/s

5.2 Neural Network Approach The flutter derivatives estimated by the neural network are shown in Figs. 7 and 8. Although the training patterns have extremely limited in this study, most estimated flutter derivatives showed a good agreement with experimental results while H2* has a little difference against the experimental result.
(a) H1* (b) H4* (c) A1* (d) A4*
Fig. 7. Comparison of the predicted and experimental flutter derivatives for the section
with B/D 12.5 (vertical motion)
(a) H2* (b) H3* (c) A2* (d) A3*
Fig. 8. Comparison of the predicted and experimental flutter derivatives for the section with B/D 12.5 (torsional motion)
CONCLUSION
The main purpose of this study was to verify the potentiality of the numerical simulation for estimation flutter derivatives and critical wind speed. Based on the results of numerical simulation, the numerical results showed a reasonable agreement with the experimental results. Some of flutter derivatives using numerical simulation has discrepancies for increasing the reduced wind speed. The discrepancies could be reduced by more proper set up of numerical simulation, such as time step, turbulence models, grid size, etc. Also, another estimated method, neural network, is examined to propose a method estimating the flutter derivatives without wind tunnel test. Although the training patterns have extremely limited in this study, most estimated flutter derivatives showed a good agreement with experimental results. Further studies concerning three-dimensional numerical simulation of forced vibration, numerical simulation of free vibration for directly calculating critical flutter wind speed, the

effectiveness of turbulence models, and applications of real bridge section will be carried out. REFERENCES
1) Chen, C.H. (2003). "Determination of flutter derivatives via a neural network approach", J. Sound and Vibration, Vol. 263, 797-813. 2) Chen, C.H., Wu, J.C, and Chen J.H. (2008). "Prediction of flutter derivatives by artificial neural networks", J. Wind. Eng. Ind. Aerodyn., Vol. 96, 1925-1937. 3) Frandsen, J.B. (2005). "Numerical bridge deck studies using finite elements", J. Fluids Structures, Vol. 19, 171-191. 4) Ge, Y. and Tanaka, H. (2000). "Aeodynamic flutter analysis of cable-supported bridges by multi-mode and full-mode approaches", J. Wind. Eng. Ind. Aerodyn., Vol. 86, 123-153. 5) Gu, M., Zhang, R., and Xiang, H. (2001). "Parametric study on flutter derivatives of bridge decks", Eng. Structures, Vol. 23, 1607-1613. 6) Huang, L. and Liao, H. (2011). "Identification of flutter derivatives of bridge deck under multi-frequency vibration", Eng. Application of Computational Fluid Mechanics, Vol. 5(1), 16-25. 7) Matsumoto, M. (2005). “Flutter instability of structures”, 4th EACWE04, Paper K04. 8) Menter, F. R. (1994) "Two-Equation Eddy-viscosity Turbulence Models for Engineering Applications", AIAA Journal, Vol. 32(8). 9) Scalan, R.H., Tomko, J.J (1971). “Airfoil and bridge deck flutter derivatives", J. Eng. Mech., ASCE, Vol. 97(6), 1717-1737. 10) Simonsen, K. and Stevens, R. (2008). "Investigation on long-span suspension bridges during erection, The Great Belt East Bridge", Master Thesis, Aalborg Univ. Denmark. 11) Theodorsen, T. (1934). “General theory of aerodynamic instability and the mechanism of flutter”, Tech. report No. 496, NACA, 32-40. 12) Xin, D., Ou, J., and Li, H. (2010). "Flutter stability analysis of long-span bridge based on numerical calculation applying dynamic mesh technique", CWE2010, Chapel Hill, NC, USA.