estimation of economic parameters of u.s. hydropower · pdf fileestimation of economic...
TRANSCRIPT

INEELEXT-03-00662
Estimation of Economic Parameters of US Hydropower Resources
Douglas G Hall INEEL Richard T Hunt INEEL Kelly S Reeves NPS Greg R Carroll BNI
June 2003
Idaho National Engineering and Environmental Laboratory Bechtel BWXT Idaho LLC
This information was prepared as anGovernment Neither the US Governmakes any warranty express or impliaccuracy completeness or usefulness or represents that its use would not ispecific commercial product processotherwise does not necessarily constituthe US Government or any agency thdo not necessarily state or reflect those
DISCLAIMER
account of work sponsored by an agency of the US ment nor any agency thereof nor any of their employees ed or assumes any legal liability or responsibility for the of any information apparatus product or process disclosed nfringe privately owned rights References herein to any or service by trade name trademark manufacturer or te or imply its endorsement recommendation or favoring by ereof The views and opinions of authors expressed herein of the US Government or any agency thereof
INEELEXT-03-00662
Estimation of Economic Parameters of US Hydropower Resources
Douglas G Hall INEEL Richard T Hunt INEEL Kelly S Reeves NPS Greg R Carroll BNI
June 2003
Idaho National Engineering and Environmental LaboratoryIdaho Falls Idaho 83415
Prepared for the US Department of Energy
Office of Energy Efficiency and Renewable Energyand
Energy Information Administration Office of Integrated Analysis and Forecasting
Under DOE Idaho Operations OfficeContract DE-AC07-99ID13727
ABSTRACT
Tools for estimating the cost of developing and operating and maintaining hydropower resources in the form of regression curves were developed based on historical plant data Development costs that were addressed included licensing construction and five types of environmental mitigation It was found that the data for each type of cost correlated well with plant capacity A tool for estimating the annual and monthly electric generation of hydropower resources was also developed Additional tools were developed to estimate the cost of upgrading a turbine or a generator The development and operation and maintenance cost estimating tools and the generation estimating tool were applied to 2155 US hydropower sites representing a total potential capacity of 43036 MW The sites included totally undeveloped sites dams without a hydroelectric plant and hydroelectric plants that could be expanded to achieve greater capacity Site characteristics and estimated costs and generation for each site were assembled in a database in Excel format that is included on a compact disk at the back of the report
iii
iv
EXECUTIVE SUMMARY
The US Department of Energy (DOE) Office of Energy Efficiency and Renewable Energy and Energy Information Administration jointly funded the Idaho National Engineering and Environmental Laboratory (INEEL) to perform a study that would provide DOE policy makers and the public with documented and peer-reviewed contemporary estimates of potential US hydroelectricity supply from conventional sources including quantities and associated costs This study supports the DOE congressionally mandated mission to analyze and forecast US energy supply and demand and provide information and assistance in the development of US hydropower
In order to meet DOErsquos informational needs the technical objectives of the study were to develop tools for estimating the cost of developing operating and maintaining and upgrading hydroelectric plants and estimating their electric generating potential and applying these estimating tools to known hydropower resources to which they are applicable A collection of sources of historical hydroelectric plant data was used to create data populations on which to base the estimating tools Once it was determined that most of the various types of the historical cost data each correlated with plant capacity tools in the form of least squares power curves were used to represent cost as a function of capacity
Separate tools were developed for each component of development cost including the costs of licensing constructing and responding to the possible need for five types of environmental mitigation Operation and maintenance (OampM) cost estimating was addressed by two tools one for fixed OampM costs and one for variable OampM costs Separate tools were developed for estimating the cost of upgrading Francis Kaplan and bulb turbines and for upgrading a generator These tools were found to require an additional variable besides capacity In the case of turbines the primary variable was hydraulic head and in the case of generators it was rotational speed A method for estimating annual and monthly electric generation was developed based on 30 years of generation history of a large number of US hydroelectric plants Based on the historical data average plant factors were developed for each state These plant factors could then be used to estimate generation based on the location of a hydropower resource of interest
The data sources and technical approach used to develop the estimating tools are described The equations for the resulting estimating tools are provided in the results section and are compared with the data from which they were derived in Appendix A A distribution of the base data in the form of numbers of data points in various capacity ranges and the extremes of the data population is also presented in Appendix A for each of the tools except the upgrade tools The development and OampM cost estimating tools were found to have R2 values ranging from 056 to 099
The development and OampM cost estimating tools and the generation estimating tool were applied to applicable resources in the Hydropower Evaluation Software (HES) database (Francfort et al 2002) This database was the result of an extensive assessment of US hydropower resources (Connor et al 1998) Because the study was focused on making estimates for
v
resources having capacities of 1 MW or greater that were not excluded from development by federal or state statutes or policies estimates were made for 2155 of the 5677 resources in the database These resources included undeveloped sites dams without hydroelectric plants and expansion of existing hydroelectric plants The applicable resources constituted 43036 of the 69009 MW (62) total capacity of the resources in the HES database The cost and generation estimates were combined with resource characteristic information from the HES database to produce the INEEL Hydropower Resource Economics Database (IHRED) This database is provided in Excel format on a compact disk in a pocket on the back cover of this report The database has 78 fields of information for the 2155 sites A data dictionary that describes each field is provided in Appendix B
Estimated costs included in the database including licensing construction mitigation and OampM were not developed by performing individual site analyses They are general cost estimates based on a collection of historical experience for similar facilities Therefore the costs presented in this study should not be interpreted as precise engineering estimates Actual costs for any specific site could vary significantly from these generalized estimates as indicated by the scatter in the data used to develop the estimating tools exhibited in the regression curvedata comparisons in Appendix A
The extensive data generated by the study are summarized in the following table
Type of Site
Number of Sites ---
Percent of Total (2155 sites)
Total Capacity (MW)
--- Percent of Total (43036 MW)
Median Unit Cost to
Develop Sites (2002$kW)
Median Unit Cost to
Develop Site Capacity
(2002$kW)
Undeveloped 965 (45)
17369 (40) 3600 2700
Dams wo power
1026 (48)
20749 (48) 2000 1200
Dams w power
164 (8)
4917 (11) 1200 700
All 2155 (100)
43036 (100) 2600 1600
As shown by the data in this table most of the hydropower potential is approximately evenly split between undeveloped sites and dams without power both in numbers of sites and total capacity The expansion of existing hydroelectric plants constitutes approximately 10 in terms of number of sites and total capacity While development costs ranged from less than $500 per kW to greater than $6000 per kW in 2002 dollars most of the plants had development costs less than $5000 per kW
The distribution of the number of plants and amount of capacity that could be developed as a function of unit cost were approximately symmetric for each
vi
type of site If the sites of a particular type were ranked by unit cost the median unit cost of developing the sites of that type (ie half the sites can be developed for unit costs less than this value and half for more) is listed in the table above as ldquoMedian Unit Cost to Develop Sitesrdquo The same ranking can be used to identify the median unit cost of developing the capacity represented by sites of a particular type (ie half the total capacity of the sites can be developed for unit costs less than this value and half for more) is listed in the table as ldquoMedian Unit Cost to Develop Site Capacityrdquo
The overall median unit cost for developing capacity listed in the above table shows that half of the 43036 MW of capacity can be developed for unit costs of $1600 per kW or less which is competitive with other sources of electricity The median unit costs of developing power potential by adding a powerhouse to existing dams and expanding existing hydroelectric plants are $1200 per kW and $700 per kW respectively These indications of competitive pricing are borne out in greater detail in the following table that shows numbers of plants and corresponding amounts of capacity by type of site that could be developed for unit costs within each of several unit cost ranges
Total Development
CostkW (2002$)
Undeveloped Dams Without Power Dams With Power Total
No of Sites
Capacity (MW)
No of Sites
Capacity (MW)
No of Sites
Capacity (MW)
No of Sites
Capacity (MW)
le 500 0 0 0 0 3 1514 3 1514
500 to 1000 0 0 21 8007 44 2853 65 10860
1000 to 1500 0 0 157 7892 84 478 241 8369
1500 to 2000 2 774 303 3349 28 61 333 4185
2000 to 2500 44 4362 334 1149 2 6 380 5516
2500 to 3000 155 7107 170 280 3 5 328 7392
3000 to 4000 522 4680 38 69 0 0 560 4749
ge $4000 242 447 3 3 0 0 245 450
Total 965 17369 1026 20749 164 4917 2155 43036
The median unit cost of developing the capacity associated with undeveloped sites is significantly higher at $2700 per kW However while unit cost is a good indicator of total development costs using it alone for comparison with other technologies penalizes projects like hydroelectric facilities that have high initial costs long life no fuel costs and low operating costs Hydropower also has significant economic advantages in terms of reliability dispatchability and peaking power supply among others
The principal conclusion of the study is that historical hydropower data while exhibiting significant scatter exhibit sufficient correlation with plant capacity to allow the production of estimating tools that can produce meaningful cost and generation estimates Additional data and research are needed to refine these tools particularly in the area of estimating the cost of water quality mitigation The IHRED data were assembled but analysis of this body of data was beyond the scope of the study These data should be analyzed to determine the trends and patterns in the data Such analysis may provide useful information
vii
for the prediction of future hydropower capacity and generation and for making decisions regarding hydropower development The turbine and generator upgrade cost estimating tools could not be applied to specific sites because no comprehensive assessment has been made of the potential increase in capacity and generation on a site-specific base This assessment should be performed and the tools applied to estimate the investment cost and the potential return in increased capacity and generation
For further information or comments please contact
Douglas G Hall Project Manager Hydropower Economics Analysis Project Idaho National Engineering and Environmental Laboratory PO Box 1625 MS 3850 Idaho Falls ID 83415-3850 Phone (208) 526-9525 E-mail dghinelgov
Richard T Hunt Principal Investigator Hydropower Economics Analysis Project Idaho National Engineering and Environmental Laboratory PO Box 1625 MS 3830 Idaho Falls ID 83415-3830 Phone (208) 526-2825 E-mail huntrtinelgov
Garold L Sommers Program Manager Hydropower Program Idaho National Engineering and Environmental Laboratory PO Box 1625 MS 3830 Idaho Falls ID 83415-3830 Phone (208) 526-1965 E-mail sommerglinelgov
viii
ACKNOWLEDGMENTS
The authors acknowledge and express their appreciation of the contributions to this study of Dr Thomas Petersik Mr Christopher Namovicz and Mr Mark Gielecki of the DOE Energy Information Administration (EIA) Office of Integrated Analysis and Forecasting for significant data contributions peer review of this report and general technical consultation and support The authors also acknowledge and express their appreciation of the technical support of Mr John Flynn of the US Department of Energy and Mrs Peggy A Brookshier of the DOE Idaho Operations Office The authors further acknowledge and express their appreciation of the consultation and document review provided by Mr Robert M Neilson of the INEEL
ix
x
CONTENTS
ABSTRACT iii
EXECUTIVE SUMMARY v
ACKNOWLEDGMENTS ix
ACRONYMSxiii
NOMENCLATURE xv
1 INTRODUCTION 1
2 TECHNICAL APPROACH 2
21 Cost Estimating Tools for Plant Development or Expansion 2
211 Data Sources 2 212 General Method 4 213 Data Screening 4 214 Accounting for Cost Variations by Type of Site 7
22 Cost Estimating Tools for Plant Operation and Maintenance 8
23 Cost Estimating Tools for Turbine and Generator Upgrade 9
24 Estimating Plant Electric Generation 10
25 FERC Annual Charge 10
26 Application of Estimating Tools to Hydropower Resources 10
3 RESULTS 13
31 Cost Estimating Tools for Plant Development or Expansion 13
32 Cost Estimating Tools for Plant Operation and Maintenance 13
33 Cost Estimating Tools for Turbine and Generator Upgrade 16
34 Estimating Plant Electric Generation 16
35 Estimated Economic Parameters for Hydropower Resources 16
36 Likelihood of Development 22
4 CONCLUSIONS AND RECOMMENDATIONS 23
5 REFERENCES 25
xi
Appendix AmdashCost Estimating Tools A-1
Appendix BmdashINEEL Hydropower Resource Economics Database B-1
FIGURES
Figure 1 Escalation for licensing costs mitigation costs except fish passage and operating and maintenance costs 6
Figure 6 Number of IHRED resources having capacities or capacity additions within various capacity
Figure 7 Total capacity of IHRED resources having capacities or capacity additions within various
Figure 8 Number of IHRED resources having unit cost (total development) within various unit cost
Figure 9 Total capacity of IHRED resources having unit cost (total development) within various unit cost
Figure 2 Escalation for construction costs and fish passage costs 6
Figure 3 Escalation for turbine replacement costs 9
Figure 4 Distribution of the hydropower resource sites in the HES database based on numbers of sites 11
Figure 5 Distribution of hydropower resource sites in the HES database based on total capacity 12
ranges 18
capacity ranges 19
ranges 20
ranges 21
TABLES
Table 1 Number of data points for development cost historical data by data source as applicable to various cost types and types of sites 3
Table 2 Escalation factors for construction costs labor intensive costs and turbine replacement costs 5
Table 3 Cost estimating equations for licensing construction and five types of mitigation 14
Table 4 Significance test results for development cost estimating equation exponents 15
Table 5 Cost estimating equations for fixed and variable operation and maintenance 15
Table 6 Significance test results for OampM cost estimating equation exponents 15
Table 7 Cost estimating equations for turbine and generator upgrades 15
Table 8 Annual and monthly plant factors by state 17
xii
ACRONYMS
BNI Bechtel National Incorporated
DOE US Department of Energy
EERE DOE Office of Energy Efficiency and Renewable Energy
EIA DOE Energy Information Administration
FERC Federal Energy Regulatory Commission
GIS geographic information system
A set of digital geographic information such as map layers and elevation data layers that can be analyzed using both standardized data queries as well as spatial query techniques
HES Hydropower Evaluation Software
IHRED INEEL Hydropower Resource Economics Database
INEEL Idaho National Engineering and Environmental Laboratory
NPS Nuclear Placement Services
OampM operation and maintenance
xiii
xiv
NOMENCLATURE
Plant Age (A) The date when a hydroelectric plant was completed or last upgraded
Capacity (C) The design (nameplate) electric power generating capability of a hydroelectric power plant in kilowatts (kW) or megawatts (MW)
Capacity Factor (CF) Another name for plant factor
Generation (G) The electric energy generating capability of a hydroelectric power plant during a specified period of time in kilowatt-hours (kW-h) or megawatt-hours (MW-h)
Hydraulic head (H) Usually the vertical distance from the water surface in the impoundment to the center of the turbine in feet
Plant Factor (PF) The ratio of actual electricity generation during a specified period of time to the ideal generation during the period where the ideal generation is equal to plant capacity multiplied by the time during the period
Speed (S) Generator rotational speed in rpm
R2 A measure of goodness of fit of a regression curve equation to a population of data from which it is derived using the method of least squares a value of 10 denotes that all data points coincide with points on the regression curve (Note The least squares curve fits were determined using transformed versions of the power law equations that were linearized using logarithms However the reported R2 values were determined for the un-transformed power law equations and were generally lower than the values for the linearized versions of the equations)
δ A factor such that (1+δxUB) times the equation of the regression curve defines an upper bounding curve and (1-δxLB) times the equation of the regression curve defines a lower bounding curve where the two bounding curves encompass x percent of the data points
η Efficiency of a hydroelectric plant (water to wire)
ν Degrees of freedom equals (n ndash 2) for the power law estimating equations in this report where n is the number of data points
xv
xvi
Estimation of Economic Parameters of US Hydropower Resources
1 INTRODUCTION
The Idaho National Engineering and Environmental Laboratory (INEEL) performed an extensive assessment of potential US hydropower resources for the US Department of Energy (DOE) during the period from 1989 to 1998 (Connor et al 1998) This assessment resulted in the identification of 5677 sites having a hydropower potential in aggregate of approximately 70000 MW of hydroelectric power Although the assessment identified site attributes that would affect the cost of developing the site estimates of development costs were not made The assessment also did not address additional US hydroelectric potential achievable by upgrading equipment at existing installations There is growing public and policy maker interest in the extent to which hydropower can meet future US electricity and environmental demands These interests require that contemporary estimates of the cost and electricity generation capability of potential hydropower resources be made The hydropower industry will also benefit from having initial estimates of the cost of developing operating and maintaining individual resources and their generation potential as a means of selecting sites for more extensive evaluations
The purpose of the present study was to provide tools to estimate development costs operating and maintenance costs and electricity generation and apply these tools to the previously identified hydropower resources This application resulted in a new database based on the original hydropower resources database (Hydropower Evaluation Software [HES] databasemdashFrancfort et al 2002) that includes estimates of various categories of development costs (including contemporary environmental requirements) fixed and variable operating and maintenance costs and plant factors and generation In addition to
providing and applying tools for estimating economic data to hydropower resources the study has provided tools for estimating the cost of upgrading turbines and generators at existing plants
The study was funded by the DOE Office of Energy Efficiency and Renewable Energy (EERE) and the DOE Energy Information Administration (EIA) Office of Integrated Analysis and Forecasting It provides EIA with estimates needed to model conventional hydroelectricity supply using the Renewable Fuels Module which provides summary information to the Electricity Market Module of the National Energy Modeling System It will also support the mission of the EERE to provide information and assist in the development of US hydropower
This report provides a detailed description of how the cost and generation estimating tools were developed using hydropower industry historical data It describes how the applicable tools were applied to hydropower resources in the HES database to create the INEEL Hydropower Resource Economics Database (IHRED) The new database contains resource characteristics and estimates of development costs operation and maintenance (OampM) costs and annual and monthly electric generation The resulting estimating tools are presented in the body of the report and are shown graphically in Appendix A in which they are compared with the historical data from which they were derived The data dictionary for the IHRED is presented in Appendix B The database itself is provided in Excel format on a compact disk at the back of the report The report concludes with conclusions from the study and recommendations for additional related research
1
2 TECHNICAL APPROACH
Tools were developed for estimating the development costs OampM costs and electricity generation for undeveloped sites dams not having a hydroelectric plant and the expansion of existing hydroelectric plants through the installation of an additional turbine-generator These tools were developed using historical hydroelectric data from a number of sources It was found early in the study that all types of cost data correlated as well or better with plant capacity or added plant capacity than with an independent variable incorporating capacity and head such as used in the study reported in Gordon 1983
This section describes how the cost and generation estimating tools were developed and how they were applied to hydropower resource sites identified in hydropower resource assessment reported in Conner et al 1998 It also describes how cost estimating tools were developed for estimating the upgrade of a turbine or a generator at an existing hydroelectric plant These tools were not applied to specific sites because unlike the resource assessment no site-specific inventory of the upgrade potential of US hydroelectric plants has been performed
21 Cost Estimating Tools forPlant Development orExpansion
Hydropower site development cost comprises the costs for licensing construction and mitigation Five types of mitigation costs that may apply to a site depending on its location and characteristics were addressed
bull Fish and wildlife mitigation
bull Recreation mitigation
bull Historical and archeological mitigation
bull Water quality monitoring
bull Fish passage
It should be noted that water quality monitoring rather than water quality mitigation was addressed in defining a cost estimating tool This limitation was necessary because no unique functional relationship between water quality mitigation cost and plant capacity could be found Water quality mitigation costs were found to vary widely with location even within the same state It should also be noted that the mitigation costs that were used to develop the cost estimating tools were the total costs that would occur over 30 years in 2002 dollars rather than levelized annual costs
211 Data Sources
The sources of historical data for each type of development cost and the type of site to which they apply are shown in Table 1 The principal source of data for licensing costs and the only source of data for costs associated with the first four types of mitigation listed above were environmental assessments and relicensing documents obtained from the Federal Energy Regulatory Commission (FERC 2003) FERC documents associated with a total of 226 plants containing costs during the period from 1980 through 1997 were reviewed A later set of FERC documents containing costs during the period from 1999 through 2001 were also reviewed at the suggestion of technical approach review panel members Additional relicensing costs for the period 1993 through 1995 were taken from EPRI 1995
Plant construction costs for undeveloped sites were taken from data provided by the EIA (EIA 2003a) for the period 1990 through 2000 These data included costs in the following categories
bull Land and land rights
bull Structures and improvements
bull Reservoirs dams and waterways
bull Equipment
bull Roads railroads and bridges
2
3
Table 1 Number of data points for development cost historical data by data source as applicable to various cost types and types of sites
Data Source
Licensing Cost
Construction Cost
Fish and Wildlife Mitigation Cost
(1)
Recreation Mitigation Cost (2)
Historical and Archeological Mitigation Cost
(3)
Water Quality Monitoring Cost
(4) Fish Passage Cost
(5)
Fixed Operations and
Maintenance Cost 3
Variable Operations and
Maintenance Cost 3
Plant Factor amp
Generation 4U
ndev
elop
ed 1
Dam
s w
o P
ower
Dam
s w
Pow
er
Und
evel
oped
Dam
s w
o P
ower
Dam
s w
Pow
er 2
Und
evel
oped
1
Dam
s w
o P
ower
Dam
s w
Pow
er
Und
evel
oped
1
Dam
s w
o P
ower
Dam
s w
Pow
er
Und
evel
oped
1
Dam
s w
o P
ower
Dam
s w
Pow
er
Und
evel
oped
1
Dam
s w
o P
ower
Dam
s w
Pow
er
All All All All
FERC Environmental Assessment and License Documents (1980 - 1997)
133 64 90 19 78
FERC Environmental Assessment and License Documents (1999-2001)
6 10 11 3 11 3
EIA data (1990-2000) 267 214 214 2319 474 384
2452 501 421
EIA data (1970-2000 excluding 1983)
18690 1157
EPRI TR-104858 23
Christensen 1986 12 12
Francfort et al 1994 7
Total 162 267 226 226 74 101 22 89 10 2340 475 384
2452 501 421
18690 1157
1 Upper limit of 67 data range 2 Lower limit of 67 data range 3 Upper - total records middle - avg cost values lower - no of plants 4 Upper - total records lower - no of plants
The same data source was used for costs of power house construction and expansion of an existing hydroelectric plant except in this case only costs in the ldquostructures and improvementsrdquo and ldquoequipmentrdquo categories were used Several points were also taken from Christensen 1986
Fish passage construction cost was limited to those projects that installed bi-directional fish passage as opposed to uni-directional passage or screens The majority of the cost data came from Francfort et alrsquos review of fish passage projects (Francfort et al 1994) Three data points were also obtained from FERC relicensing applications with costs in the 1999 through 2001 period
212 General Method
The sets of historical data were assembled in the form of Excel spreadsheets and each contained plant identifiers costs capacity and other plant data For each dataset the following operations were performed to determine an estimating tool
1 Each cost was escalated to 2002 dollars using one of the two escalation curves discussed below
2 Escalated costs were plotted as a function of plant capacity in the case of undeveloped sites and dams without power or as a function of added capacity for plant expansions at dams with power
3 A least squares curve fit was performed on the data in each plot to determine a best fit mathematical function providing cost in 2002 dollars as a function of plant capacity The derived function could then be used as a tool to estimate costs of this type for hydropower sites In addition to the function the least squares curve fitting also provided a root-mean-square (RMS) goodness of fit value
Costs for labor intensive work were escalated using the consumer price index (CPI) with 1970 as the base year (EHR 2002) The escalation values are listed in the second column of Table 2 and are shown graphically in Figure 1 Escalation factors
represented by this curve were applied to licensing costs and all mitigation costs except fish passage which has a large construction component
Plant and fish passage construction costs were escalated using the escalation data listed in the first column of Table 2 and are shown graphically in Figure 2 These data use 1940 as the reference year Prior to 1969 escalation values are from the Engineering News Record (ENR 2002) For 1969 and later the values are from the US Bureau of Reclamation (USBR 2002)
In order to escalate a cost from its year of occurrence to 2002 an escalation ratio was calculated by dividing the 2002 escalation factor value by the escalation factor value for the year of cost occurrence The escalation ratio was then applied to the cost to escalate it to the cost in 2002 dollars
213 Data Screening
The dataset containing construction costs (EIA 2003a) included data for 909 plants Ninety plants were eliminated by one or more of the following three criteria
1 Capacity less than 1 MW
2 Capacity greater than 1300 MW
3 Pumped storage plant
Prior to determining the construction cost estimating tools the data for the remaining 819 plants were screened to identify unusable or unrealistic records For the undeveloped site construction cost estimating tool the following data screens were made
1 Any records containing a zero value for total cost of plant were considered unusable (2 of plants removed)
2 Records for plants constructed prior to 1940 were not used because even though the costs could be escalated it was judged that the escalated costs would be unrealistically low relative to current costs because of the low labor rates that existed prior to 1940 (88 of plants removed)
4
Table 2 Escalation factors for construction costs labor intensive costs and turbine replacement costs Year Constructiona Inflation b Turbine c Year Constructiona Inflationb Turbine 2002 182490 48362 253 1969 38911 2001 179767 47017 248 1968 35525 2000 176654 45480 242 1967 33307 1999 171206 44497 239 1966 32023 1998 167315 43835 235 1965 30895 1997 162646 42829 228 1964 30156 1996 156420 41597 228 1963 29261 1995 155642 40480 228 1962 28560 1994 150195 39454 226 1961 27977 1993 147860 38312 221 1960 27549 1992 143969 37193 216 1959 27004 1991 143191 35687 208 1958 25875 1990 138521 33862 195 1957 25058 1989 133852 32308 185 1956 24202 1988 127626 31029 179 1955 23113 1987 124514 29934 174 1954 21984 1986 122957 29387 169 1953 21245 1985 121595 28382 166 1952 20506 1984 121595 27194 163 1951 19767 1983 117899 26348 158 1950 18482 1982 116732 24819 150 1949 17354 1981 110895 22490 143 1948 16809 1980 102140 19818 131 1947 15409 1979 91440 17809 118 1946 12918 1978 83658 16553 108 1945 11790 1977 77821 15525 100 1944 11556 1976 74903 14681 1943 11284 1975 71012 13471 1942 10934 1974 64202 12124 1941 10389 1973 54475 11416 1940 10000 1972 50584 11051 1971 48638 10594 1970 44747 10000
a ENR 2002 and USBR 2002
b EHR 2002
c USBR 2002
5
50
45
40
35
30
25
20
15
10
05
00
Economic History Resources
Cos
t Ind
ex
1970 1975 1980 1985 1990 1995 2000 2005
Year
Figure 1 Escalation for licensing costs mitigation costs except fish passage and operating and maintenance costs
20
18
16
14
12
Engineering News Record US Bureau of Reclamation
1940 1950 1960 1970 1980 1990 2000 2010 Year
Cos
t Ind
ex
10
8
6
4
2
0
Figure 2 Escalation for construction costs and fish passage costs
6
3 Any construction cost less than $700kW or greater than $5000kW was considered to be atypical and was not used (9 of plants removed)
4 A history of construction cost for a specific plant that decreased rather than increased in successive years was reviewed to select the most realistic value or marked as unusable if a best value could not be identified (1 of plants removed)
The data screening process prior to determining the construction cost estimating tools for power house addition to a dam or expansion of a hydroelectric plant was the same except for the zero data screen If either the cost for ldquostructures and improvementsrdquo or the cost for ldquoequipmentrdquo was zero the record was considered to be unusable Most of the plants removed by screening were removed because they were constructed prior to 1940 (80 of plants removed) The zero cost criteria and the unit cost criteria accounted for 10 and 9 of the plants removed respectively with an additional 1 of the plants removed being the result of difficult to interpret cost trends
Data screening resulted in data for 267 plants being used to determine the construction cost estimating tool for undeveloped sites Screening also resulted in data for 214 plants being used to determine the construction cost estimating tool for power house addition and plant expansion Since the construction cost values for a given plant were reported as a cumulative cost and therefore increased each year the actual cost data point for a specific plant was the construction cost value for the earliest year in the dataset in nearly all cases
214 Accounting for Cost Variations byType of Site
The cost data for licensing fish and wildlife mitigation recreation mitigation historical and archeological mitigation and water quality monitoring were taken from environmental assessment and relicensing documents for existing hydroelectric plants rather than from new FERC license applications Since these costs would be higher for new development it was decided to include a premium for these costs associated with undeveloped sites and dams without power It was
reasoned that these costs for dams without power would be higher than for existing hydroelectric plants (dams with power) and would be higher still for undeveloped sites
These premiums were defined by taking the upper bound of envelopes that encompassed two-thirds or 98 of the data points in analogy to plus or minus one and two sigma bands The upper and lower bounds of each envelope were determined by selecting values of a data band parameter δ such that the curves defined by (1 plusmn δ) times the regression curve equation encompassed either two-thirds or 98 of the data points A different value of δ was used to encompass the designated fraction of the points above the regression curve than was used to encompass this fraction of points below the curve
For licensing and the four types of mitigation the regression curve itself was used as the estimating tool for a plant expansion The 67 upper bound [(1+δ67UB) times the regression curve equation] was used as the estimating tool for addition of a powerhouse to a dam without power The 98 upper bound [(1+δ98UB) times the regression curve equation] was used as the estimating tool for an undeveloped site
No premium for fish passage cost was used This is because it was judged that the installation cost of fish passage would not be affected by the extent of previous development at the site Fish passage was thus treated as an incremental cost in all cases rather than as an integrated cost that would differ depending on the type of site at which it was installed
A bounding curve was also used at the estimating tool for estimating the construction cost of a plant expansion Because the available data were the costs associated with the addition of a powerhouse it was judged that these costs were too high when estimating the cost of a plant expansion For this reason the equation for the 67 lower bound of the cost data for construction of a powerhouse [(1-δ67LB) times the regression curve equation] was used as the estimating equation for the construction cost of a plant expansion
7
22 Cost Estimating Tools forPlant Operation andMaintenance
Separate cost estimating tools were developed for fixed and variable OampM costs The data on which these tools were based was EIA data (EIA 2003a) for the period 1990 through 2001 The following costs were considered to be fixed OampM costs
bull Operation supervision and engineering
bull Maintenance supervision and engineering
bull Maintenance of structures
bull Maintenance of reservoirs dams and waterways
bull Maintenance of electric plant
bull Maintenance of miscellaneous hydraulic plant
In contrast the following costs were considered to be variable OampM costs
bull Water for power
bull Hydraulic expenses
bull Electric expenses
bull Miscellaneous hydraulic power expenses
bull Rents
Prior to performing the process to determine the cost estimating tool screening operations were performed on the dataset Of the 909 plants represented in the dataset 90 were eliminated by one or more of the following three criteria
1 Capacity less than 1 MW
2 Capacity greater than 1300 MW
3 Pumped storage plant
For the fixed OampM cost estimating tool the following data screens were made
1 Any record containing a zero or negative value for any of the fixed OampM component costs listed above or zero electicity generation was
considered to be unusable (93 of plants removed)
2 Any record containing a total fixed OampM cost that was less than 05 millskW-h or greater than 55 millskW-h was considered to be unusable (7 of plants removed)
Plants for which there was more than one capacity listed were treated as separate plants at the respective capacities
For the variable OampM cost estimating tool the following data screens were made
1 Any record containing a negative value for any of the variable OampM component costs listed above was considered to be unusable (1 of plants removed)
2 Any record containing zero values for all the variable OampM component costs listed above except water for power was considered to be unusable (78 of plants removed)
3 Any record containing a total variable OampM cost that was less than 15 millskW-h or greater than 80 millskW-h was considered to be unusable (21 of plants removed)
Plants for which there was more than one capacity listed were treated as separate plants at the respective capacities
These screening operations resulted in significant reductions in the numbers of plants that actually contributed to the determination of the estimating tools Of the original 819 plants of interest data for 384 plants was used to determine the fixed OampM cost estimating tool while data for 421 plants was used to determine the variable OampM cost estimating tool Because some plants had more than one capacity listed for the same plant 474 data points were used to determine the fixed OampM cost estimating tool and 501 data points were used to determine the variable OampM cost estimating tool
Both of the OampM cost estimating tools were determined using a process similar to that described above for development costs
8
(1) escalating costs to 2002 dollars using the escalation data shown in Figure 1 (2) time averaging the data for each plant-capacity combination to obtain an average annual cost (3) plotting the average values as a function of plant capacity or added capacity and (4) performing a least squares curve fit to determine the equation to be used as the estimating tool
23 Cost Estimating Tools forTurbine and Generator Upgrade
The cost estimating tools for upgrading three types of turbines Francis Kaplan and bulb were produced using data from EPRI 1989 Cost data points were taken from working plots of cost as a
function of hydraulic head for various plant capacities These costs were escalated to 2002 dollars using the cost escalation data in the third column of Table 2 which is shown graphically in Figure 3 (USBR 2002) Iterative analysis was performed on the data for each type of turbine to obtain a mathematical expression of cost as a function of capacity and hydraulic head that closely matched the escalated data
The cost estimating tool for upgrading generators is based on data obtained from a hydropower industry source (Hunt 2003) These data are in the form of generator cost as a function of rotational speed for various capacities Iterative analysis was performed on the data to obtain a mathematical expression of cost as a function of capacity and rotational speed that closely matched the data
Cos
t Ind
ex
3
25
2
15
1
05
0
US Bureau of Reclamation
1977 1982 1987 1992 1997 2002 Year
Figure 3 Escalation for turbine replacement costs
9
24 Estimating Plant ElectricGeneration
The EIA provided both annual and monthly plant generation data for the period 1970 through 2000 (EIA 2003b) The generation data were converted to plant factors (PF) using the equation
GenerationTimePeriod(MW minus h)PFTime Period = Capacity(MW) x Time(hours)
where
Time = annual or monthly hours
The plant factor data were grouped by the state in which the plant is located The plant factors for each time period (Annual January February etc) associated with each state regardless of year or location of occurrence were used to obtain an unweighted average plant factor for each time period for each state Annual plant factors less than 025 or greater than 085 were judged to be unrealistic and were not included in the average
The plant factors for a given state were used to estimate either the total or incremental (for plant expansions) potential generation of hydropower resource sites within the state using the inverse of the above equation
GStateTime Period = (PFState Time Period) lowast(C)lowast(Time)
where
GState Time Period = generation during a specified time period in MW-h
PFStateTime Period = average state plant factor for a specified period of time
C = plant capacity or added capacity in MW
Time = time period in hours
25 FERC Annual Charge For plants with a capacity greater than
15 MW FERC charges plant owners an annual fee based on plant capacity and annual generation (FERC 1999) In order to have a complete estimate of plant costs the following formula was applied once the plant annual generation or added generation was estimated as described in the previous section
Cost (2002$) = (017238 G ) + (153227 C )
where
G = annual generation in MW-h
C = capacity in kW
26 Application of Estimating Tools to Hydropower Resources
The cost and generation estimating tools that were developed as described above were applied to the hydropower resources identified in the resource assessment reported in Connor et al 1998 Characteristic information about the hydropower resources was assembled in the HES database (Francfort et al 2002) The database was screened to identify sites to which the estimating tools were applicable using the following criteria to identify nonapplicable sites
bull Sites having capacity potentials less than 1 MW
bull Sites that were excluded from development by federal statutes and policies
bull Sites that were excluded from development by state and municipal statutes and policies
bull Sites that have been developed since the assessment was performed
bull Sites that are pumped storage plants
10
Sites that were excluded from development by federal statutes and policies were identified by using geographic information system (GIS) tools to intersect the geographic location of resources in the HES database with a GIS data layer containing all federally excluded areas including
bull National battlefields
bull National historic parks
bull National parks
bull National parkways
bull National monuments
bull National preserves
bull National wildlife refuges
bull Wildlife management areas
bull National wilderness areas
bull Wild and scenic rivers
Dams w Power 164 8
The HES database also contained information about whether the resource is sited at the upstream or downstream end of a wild and scenic stream reach (W_S_PROT) or on a tributary (W_S_TRIB) of a stream designated as wild and scenic It also contained information about whether a site is located in a federally designated exclusion zone FED103_C and FED106_C Those sites that were designated as meeting any of these criteria or were identified as being in an exclusion zone via the use of the GIS layer were eliminated from the list of resources to which the estimating tools were applied
Of the 5677 resources in the HES database 3522 were found to be unsuitable for application of the estimating tools for one or more of the reasons stated above leaving 2155 applicable sites Figure 4 shows the distribution of the resources in the HES database based on the applicability of the estimating tools and the various reasons for nonapplicability (Applicable sites are designated as ldquoIHRED sitesrdquo) Most of sites (2311 sites or 41) were eliminated because they had a capacity of less than 1 MW
Undeveloped Sites 965
Dams wo 45 Power 1026 48
IHRED Sites IHRED Sites Capacity 2155 2155 lt 1MW 38 2311 41
Pumped Storage Sites
3 Excluded Sites 01 Developed 1189
Sites 2119 HES Sites 03 5766
Figure 4 Distribution of the hydropower resource sites in the HES database based on numbers of sites
11
A counterpart to the distribution shown in cost of water quality monitoring was estimated for Figure 4 in terms of the total amount of power all sites represented by applicable resources and the various classes of nonapplicable resources is The basic site characteristic data from the HES shown in Figure 5 This figure shows that while database was combined with the cost and the resources having a capacity of 1 MW or less generation data produced using the estimating represented 41 of the HES sites in number they tools to create a new database named the INEEL collectively represented only 1 of the total Hydropower Resource Economics Database capacity of all the sites in the HES database (IHRED) Because the HES database did not
identify plants that could be upgraded by installing The cost estimating tools were applied to the new turbines or generators the tools for estimating
applicable sites in the HES database based on the these costs were not applied to any of the listed capacity of the site The potential generation resources listed in the database (annual and monthly) of the resource was estimated using the average plant factors for the state in which The distribution of the 2511 sites in the the resource is located The application of the IHRED in terms of the types of sites is shown in mitigation cost estimating tools was dependent on Figure 4 Of these sites the sites that were either site characteristics in the HES database The cost of totally undeveloped or were a dam without a fish and wildlife mitigation was estimated if any of hydroelectric installation represented 45 and 48 the FISH_C WILDLF_C or T_E_W_C (indicates of the applicable sites respectively Sites with the presence of threatened or endangered wildlife) hydroelectric installations that could be expanded fields contained a ldquoYrdquo value The cost of recreation were 8 of the applicable sites mitigation was estimated if either of the following
Viewed from a total capacity perspective parameters had a ldquoYrdquo value REC_C or SCENIC_C Figure 5 shows a nearly equal portion for totally The cost of historical and archeological mitigation undeveloped sites and dams without a was estimated if either of the following parameters hydroelectric installation being 40 and 48 of the had a ldquoYrdquo value CULTUR_C or HISTORY_C The total capacity of the IHRED sites respectively cost of fish passage mitigation was estimated if the Sites with hydroelectric installations that could beT_E_F_C parameter (indicates the presence of expanded represent 11 of the total capacity threatened or endangered fish) had a ldquoYrdquo value The
Dams w Power 4917 MW
11 Undeveloped Sites
17369 MW Capacity lt 40
1MW Dams wo 743 MW Excluded Sites Power 120749 MW 24619 MW 48 36
IHRED Sites 43036 MW
Developed IHRED Sites Sites 43036 MW Pumped 291 MW
62 Storage Sites 04 321 MW
05 HES Sites 69009 MW
Figure 5 Distribution of hydropower resource sites in the HES database based on total capacity
12
3 RESULTS
The technical approach to developing cost and generation estimating was executed using the various sources of historical data listed in Table 1 The resulting tools for estimation are described in this section The application of these tools to applicable hydropower resources in the HES database that resulted in the production of the IHRED is also described
31 Cost Estimating Tools forPlant Development orExpansion
The historical data for licensing costs construction costs and five types of mitigation costs were found to correlate well with plant capacity or added capacity Plots of the basic data that were used to develop each cost estimating tool are presented in Appendix A along with the resulting regression curve and data bands encompassing 67 and 98 of the data points In addition the population of each basic dataset based on capacity ranges accompanies each basic plot in the appendix These distribution charts are accompanied by a thumbnail plot listing the minimum and maximum values of cost and capacity included in the dataset
A least squares curve fit showed that a power curve best represented the data in each dataset The equation for each cost estimating tool is listed in Table 3 which gives the coefficient and exponent for the power curve the data band parameter values and the R2 value indicating the goodness of the fit The equations of the upper and lower bounds of the data band encompass either 67 or 98 of the data points They are the same as the basic curve fit equation except the coefficient is multiplied by (1 + δxUB) for the upper bound or multiplied by (1 - δxLB) for the lower bound where x is either 67 or 98 No value is listed for the data band parameter and no R2 is listed in the table for tools that are the upper or lower bound of a dataset
In order to gain confidence that cost has a power law relationship with capacity for each of
the elements of development costs tests of significance were performed on the exponents in each of the cost estimating equations These tests showed that the exponents are statistically significantly different than zero with greater than 99 confidence providing confidence that cost increases with capacity rather than there being a significant probability that cost does not vary with capacity (exponent equals zero) The values of the t statistic for each of the exponents is compared with the t statistic value for a one-tailed 999 significance test in Table 4
32 Cost Estimating Tools forPlant Operation andMaintenance
The historical data for fixed and variable OampM costs were also found to correlate well with plant capacity or added capacity Plots of the basic data that were used to develop each cost estimating tool are presented in Appendix A along with the resulting regression curve and data bands encompassing 67 of the data points In addition the population of each basic dataset based on capacity ranges along with a thumbnail plot listing the minimum and maximum values of cost and capacity included in the dataset accompanies each basic plot in the appendix
A least squares curve fit showed that a power curve best represented the data in each dataset The equation for each cost estimating tool is listed in Table 5 which gives the coefficient and exponent for the power curve the data band parameter values and the R2 value indicating the goodness of the fit
The results of tests of significance on the exponents of the two OampM cost estimating tools are presented in Table 6 These results show with greater than 999 confidence that cost increases with capacity
13
14
Table 3 Cost estimating equations for licensing construction and five types of mitigation
Cost (2002$) = A lowast [Capacity (MW)] B
Estimating Tool Application Coefficient
(A) Exponent
(B)
Data Band Parameter
(δ98UB)
Data Band Parameter
(δ67UB)
Data Band Parameter
(δ67LB)
Data Band Parameter
(δ98LB) R2
Licensing - Undeveloped Sites 61E+05 070 - - - - NA
Licensing - Dams wo Power 31E+05 070 - - - - NA
Licensing ndash Dams w Power 21E+05 070 190 46 39 63 074
Construction - Undeveloped Sites 33E+06 090 126 49 35 67 081
Construction - Dams wo Power 22E+06 081 250 67 38 74 074
Construction - Dams w Power 14E+06 081 - - - - NA
Fish amp Wildlife Mitigation - Undeveloped Sites 31E+05 096 - - - - NA
Fish amp Wildlife Mitigation - Dams wo Power 20E+05 096 - - - - NA
Fish amp Wildlife Mitigation - Dams w Power 83E+04 096 278 138 39 77 070
Recreation Mitigation - Undeveloped Sites 24E+05 097 - - - - NA
Recreation Mitigation - Dams wo Power 17E+05 097 - - - - NA
Recreation Mitigation - Dams w wo Power 63E+04 097 282 166 54 92 087
Historical amp Archeological Mitigation - Undeveloped Sites 10E+05 072 - - - - NA
Historical amp Archeological Mitigation - Dams wo Power 85E+04 072 - - - - NA
Historical amp Archeological Mitigation - Dams w wo Power 63E+04 072 65 35 43 50 094
Water Quality Monitoring - Undeveloped Sites 40E+05 044 - - - - NA
Water Quality Monitoring - Dams wo Power 20E+05 044 - - - - NA
Water Quality Monitoring - Dams w wo Power 7E+04 044 513 213 59 93 056
Fish Passage Mitigation 13E+06 056 79 09 18 31 099
Table 4 Significance test results for development cost estimating equation exponents Estimating Tool Exponent Standard
Error t Statistic Value t (ν 0001)
Licensing ndash Dams wo Power 02806 24854 3142 Construction ndash Undeveloped Sites 01781 50378 3121 Construction ndash Dams wo Power 02706 29825 3127 Fish amp Wildlife Mitigation 05587 17142 3207 Recreation Mitigation 06534 14835 3175 Hist amp Arch Mitigation 05753 12440 3552 Water Quality Mitigation 07837 5559 3187 Fish Passage Mitigation 03827 14571 4501
Table 5 Cost estimating equations for fixed and variable operation and maintenance
Cost (2002$) = A lowast [Capacity (MW)] B
Estimating Tool Application Coefficient
(A) Exponent
(B)
Data Band Parameter
(δ98UB)
Data Band Parameter
(δ67UB)
Data Band Parameter
(δ67LB)
Data Band Parameter
(δ98LB) R2
Fixed Operation and Maintenance 24E4 075 192 67 46 74 060
Variable Operation and Maintenance 24E4 080 255 77 39 74 067
Table 6 Significance test results for OampM cost estimating equation exponents Estimating Tool Exponent Standard
Error t Statistic Value t (ν 0001)
Fixed Operation and Maintenance 02127 35400 3108
Variable Operation and Maintenance 02198 36295 3107
Table 7 Cost estimating equations for turbine and generator upgrades
Turbines Cost (2002$) = A lowast [Capacity (MW)] B lowast [Head(ft)] C
Estimating Tool Application Coefficient (A)
Exponent(B)
Exponent(C)
Francis Turbines 3E6 071 -042 Kaplan Turbines 4E6 072 -038 Bulb Turbines 6E6 086 -063
Generators Cost (2002$) = A lowast [Capacity (MW)] B lowast [Speed(rpm)] C
Generators 3E6 065 -038
15
33 Cost Estimating Tools forTurbine and Generator Upgrade
Development of the cost estimating tools for turbine and generator upgrades resulted in power equations in which the coefficient is a function of the capacity of the turbine or generator being replaced The equations for these tools are listed in Table 7 The tools are shown graphically in Appendix A
34 Estimating Plant ElectricGeneration
Annual and monthly plant factors were determined for each state The resulting plant factors are listed in Table 8
35 Estimated Economic Parameters for Hydropower Resources
The development and OampM cost estimating tools listed in Tables 3 and 5 and the plant factors listed in Table 8 were applied to 2155 US hydropower resources from the HES database to build the IHRED Resource characteristic data in the HES database were retained in the IHRED and cost and generation data were added to assemble the 78 fields of data for each resource The IHRED data dictionary which provides field names and descriptions is listed in Appendix B The database in Excel format is provided on a compact disk as part of Appendix B and is included in a pocket on the back cover of this document
The distribution of the hydropower resources in the IHRED which is based on the number of resources having capacities or capacity additions within various capacity ranges is shown in Figure 6 This figure shows that 1461 of the 2155 resources in the IHRED (68) had capacities or capacity additions in the 1 to 10 MW range Ninety-two percent of the resources had capacities or capacity additions of 50 MW or less A comparison of Figure 6 with similar distributions for the data populations on which the cost estimating tools are based (Appendix A) reveals that the distributions are similar Thus the vast majority of cost estimates that were made for
resources in the IHRED were based on historical data from plants in the same capacity range
A related distribution of the IHRED resources is shown in Figure 7 In this figure the total capacity represented by the resources having capacities or capacity additions in each capacity range is shown This figure shows that the 1461 resources (68 of the sites) having capacities or capacity additions in the 1 to 10 MW range represent only 12 of the total 43036 MW of the IHRED resources The 92 of the IHRED resources having capacities or capacity additions of 50 MW or less constitute 41 of the total capacity of the resources Another 44 of the total capacity is contributed by resources having capacities or capacity additions of 100 MW or greater with 24 of the total capacity being contributed by the 21 sites having capacities or added capacities greater than 250 MW
All the cost estimating tools are based on data populations that include data for plants having capacities greater than 100 MW But the number of points is less than at the other end of the capacity scale The data populations on which construction and OampM cost estimating tools are based have the best representations at the high end of the capacity range The thumbnail plot on each of the source data distributions in Appendix A provides the minimum and maximum capacity and cost of the source data
The distributions of the IHRED sites which are given in capacity ranges in Figures 6 and 7 are presented in ranges of unit development cost in Figures 8 and 9 Unit development cost is the sum of the estimated costs of licensing construction and any required mitigation divided by the capacity or added capacity of the site The distribution of the number of undeveloped sites that could be developed for various unit costs is shown by the blue bar segments in Figure 8 This is an approximately symmetric distribution with the maximum number of this type of site being developed for $3500 to $4000 per kW Likewise the distribution of dams without power sites shown by the red bar segments is approximately symmetric with the maximum number of this type of site being developed for $2000 to $2500 per kW The distribution of the dams with power or plant expansions shown by the white bar segments is also approximately symmetric with the
16
17
Table 8 Annual and monthly plant factors by state State
ALASKA Abbr AK
Annual05021
January 04876
February 04819
March 04512
April 04547
May 04767
June 05393
July 05500
August 05350
September 05119
October 05255
November 05183
December 04913
ALABAMA AL 04378 06489 06718 06707 05330 04145 03464 03093 02818 02485 02686 03642 05108 ARKANSAS AR 04208 04725 05037 05317 05319 04773 04441 04069 03438 02760 02717 03322 04630 ARIZONA AZ 04860 03438 03812 04679 05759 05943 06538 06510 06250 04859 03570 03379 03511 CALIFORNIA CA 05487 04931 05327 05935 06149 06462 06396 06067 05779 05142 04476 04422 04748 COLORADO CO 04946 04514 04430 04233 04226 05743 06686 06528 05547 04983 04259 03858 04290 CONNECTICUT CT 04672 05576 06018 07414 07574 06209 03994 02340 01927 01878 03089 04478 05670 FLORIDA FL 04316 04622 05304 05875 05232 03985 04180 04397 04674 03660 02626 03277 04030 GEORGIA GA 04378 05166 05343 05414 05251 04563 04142 03752 03788 03340 03446 03925 04472 HAWAII HI 06111 05876 05655 06429 07861 07110 05799 05666 05572 05183 05620 06526 06015 IOWA IA 05549 04745 05169 06212 06221 06163 05996 05680 05218 05017 04851 05738 05565 IDAHO ID 06037 06042 05955 06129 06402 06619 06675 06262 05837 05647 05354 05586 05930 ILLINOIS IL 05145 04649 04862 04980 04980 04978 05105 05266 05439 05318 05346 05672 05139 INDIANA IN 04982 04985 05219 05715 06232 06107 05497 04458 03833 03837 03846 04792 05306 KANSAS KS 04083 03470 03956 04382 03919 04057 03933 03869 04029 04389 03806 04579 04616 KENTUCKY KY 05309 05786 05401 04974 04948 05522 05652 05533 05207 04826 04841 05352 05655 LOUISIANA LA 04208 04725 05037 05317 05319 04773 04441 04069 03438 02760 02717 03322 04630 MASSACHUSETTS MA 04840 05478 05567 06323 06284 05800 04386 03254 03251 03094 04032 05011 05646 MARYLAND MD 04251 04507 05409 07230 07349 05427 03296 02448 01753 01898 02650 03911 05232 MAINE ME 05824 05815 05975 06618 07114 07023 06119 04918 04448 04603 05273 06001 06007 MICHIGAN MI 04830 04720 04842 05523 06556 05808 04896 03977 03633 03905 04260 04820 05052 MINNESOTA MN 06054 05247 05346 05927 07256 07216 06882 06184 04920 05275 05755 06720 05914 MISSISSIPPI MS 04208 04725 05037 05317 05319 04773 04441 04069 03438 02760 02717 03322 04630 MISSOURI MO 04107 04300 04663 05651 05668 04890 04205 03607 03186 02658 02633 03550 04321 MONTANA MT 06114 06125 05951 05761 06088 06463 07059 06616 05897 05570 05768 06111 05960 NORTH CAROLINA NC 04555 05545 05772 05896 05321 04863 04410 03768 03824 03448 03427 03763 04699 NORTH DAKOTA ND 05474 06104 06300 04981 04679 05173 05854 06091 06104 05267 04856 05110 05220 NEBRASKA NE 04700 03989 04822 05014 05072 04905 05113 05273 04948 04362 04526 04515 03880 NEW HAMPSHIRE NH 05524 05381 05579 06556 07584 07165 05561 04081 03811 03725 04937 06042 05896 NEW JERSEY NJ 03310 03245 03719 05082 04571 04178 03115 02431 01707 02596 02882 02858 03372 NEW MEXICO NM 04796 03652 03899 05137 06029 05825 05497 05551 04771 04776 04424 03806 04131 NEVADA NV 05410 04312 04996 05414 06409 06542 06103 05931 05794 05529 04979 04317 04580 NEW YORK NY 05354 05519 05667 06301 07009 06425 05094 04088 03700 03933 04763 05768 06027 OHIO OH 04681 04524 04352 04403 05141 05315 05319 05082 04268 04148 04245 04465 04886 OKLAHOMA OK 04605 04242 04525 05970 06085 06262 06424 04826 03137 02581 02561 04078 04585 OREGON OR 05669 06551 06488 06478 06274 06254 05721 04558 04211 04494 04733 05784 06552 PENNSYLVANIA PA 04995 05224 05609 06931 07016 06139 05045 03931 02977 02932 03548 04727 05910 RHODE ISLAND RI 03052 03785 06043 06396 05104 03676 01644 00979 00524 00636 00841 02574 04636 SOUTH CAROLINA SC 04691 05875 06200 06191 05735 05103 04485 03623 03585 03227 03528 03978 04860 SOUTH DAKOTA SD 05064 03835 03532 03836 04706 05240 05707 06291 06546 06319 05656 05056 03952 TENNESSEE TN 05055 06158 06057 05671 04868 04611 04836 04749 05038 04437 04252 04553 05475 TEXAS TX 05053 04893 05144 05404 05441 05814 06325 05176 04754 04607 04309 04480 04318 UTAH UT 05127 03949 04286 04481 05577 06849 06833 06088 05760 05077 04278 04163 04139 VIRGINIA VA 04429 05144 05783 06306 06127 05781 04653 03381 02961 02692 02818 03381 04221 VERMONT VT 04976 04905 04974 05767 07418 06618 04687 03192 03051 03268 04570 05739 05567 WASHINGTON WA 05312 06069 06096 05597 05488 05795 05959 05084 04000 04007 04256 05385 06066 WISCONSIN WI 05559 04863 04944 05931 07286 06675 05861 04837 04526 05042 05359 05968 05423 WEST VIRGINIA WV 05609 06136 06743 07019 07047 06851 05880 04774 04265 03806 03920 04944 06009 WYOMING WY 05034 04149 04053 04354 05054 05789 06720 06922 06361 04867 03983 03997 04081
Louisiana and Mississippi values were estimated using Arkansas plant factors
1 to 1
0
10 to
20
20 to
30
30 to
40
40 to
50
50 to
60
60 to
70
70 to
80
80 to
90
90 to
100
100 t
o 150
15
0 to 2
00
200 t
o 250
gt250
18
1750
1500
1250
1000
750
Total No of Sites = 2155
21 10
6 03
18 08
29 13
12 06
14 06
17 08
18 08
35 16
53 25
63 29
146 68
262 122
1461 678
W i th Po w e r W i th out Pow e r Unde vel o pe dN
o o
f Site
s
500
250
0
Capacity Range (MW)
Figure 6 Number of IHRED resources having capacities or capacity additions within various capacity ranges
1 to 1
0
10 to
20
20 to
30
30 to
40
40 to
50
50 to
60
60 to
70
70 to
80
80 to
90
90 to
100
100 t
o 150
15
0 to 2
00
200 t
o 250
gt250
C
apac
ity (M
W)
12500
10000
7500
5000
Total Capacity = 43036 MW
1422 33
3159 73
3622 84
1156 27
1214 28
1315 31
1195 28
1954 45
2465 572210
51
3654 85
3890 90
10554 245
5225 121
W i th P o w e r W i thou t Po w e r Und e v e lo ped
2500
0
Capacity Range (MW)
Figure 7 Total capacity of IHRED resources having capacities or capacity additions within various capacity ranges
19
0 to 5
00
500 t
o 100
0 10
00 to
150
0 15
00 to
200
0 20
00 to
250
0 25
00 to
300
0 30
00 to
350
0 35
00 to
400
0 40
00 to
450
0 45
00 to
500
0 50
00 to
550
0 55
00 to
600
0 60
00 to
650
0
20
100
0
Total No of Sites = 2155
1 00
58 0204
43 20
188 87
288 134 272
126
328 152
380 176
3 01
333 155
241 112
65 30
W i th Pow e r W i thout Pow e r Un de v e l o p e d
Unit Cost Range ($kW)
Figure 8 Number of IHRED resources having unit cost (total development) within various unit cost ranges
500
400
300
200No
of S
ites
0 to 5
00
5 00 t
o 100
0 10
00 to
15 0
0 15
00 to
200
0 20
00 to
250
0 25
00 to
300
0 30
00 to
35 0
0 35
00 to
400
0 40
00 to
450
0 45
00 to
50 0
0 50
00 to
55 0
0 55
00 to
600
0 60
00 to
650
0
21
12000
10000
8000
6000
4000
Total Capacity = 43036 MW 10860 252
8369 194
4185 97
1514 35
5516 128
7392 172
3483 81
1265 29
370 09 58
01 15
00 6
00 1
00
W i th P o w e r W i th out Po w e r Un dev el o pedC
apac
ity (M
W)
2000
0
Unit Cost Range ($kW)
Figure 9 Total capacity of IHRED resources having unit cost (total development) within various unit cost ranges
maximum number of this type of site being developed for $1000 to $1500 per kW These maximum points of the respective distributions shift downward in unit cost from the perspective of developing the maximum capacity as shown in Figure 9 The maximum total capacity from undeveloped sites is obtained for $2500 to $3000 per kW while the maximum total capacity is obtained from adding a powerhouse to dams without power for $500 to $1500 per kW The maximum total capacity from plant expansions is obtained for $500 to $1000 per kW Viewed as a whole the results indicate that over 20000 MW of capacity could be developed at unit costs of $1500 per kW or less
When considering new generating plants long-standing energy industry practice has been to use unit costs ($kW) of various facilities as a comparison tool to make development decisions While the unit cost parameter is a good indicator of total development costs using it alone for comparison with other technologies penalizes projects like hydroelectric facilities that have high initial costs long life no fuel costs and low operating costs
The chart showing amounts of capacity (MW) falling within various unit cost ranges (Figure 9) is presented for information as a relative cost indicator for the available hydropower resources analyzed in this study It is not intended to imply an endorsement of the unit cost method to compare various technologies and make development decisions
36 Likelihood of Development
In order to provide the IHRED user with some measure of the likelihood that a particular site will be developed the SITEPROB field and the associated values from the HES database were included in the IHRED as field number 36 This parameter ranges from 010 which indicates the least likely sites to be developed to 090 which indicates the most likely sites The researchers
reasoned that no site has a 0 probability of development just as no site can be predicted to have a 100 probability of development
As described in Francfort et al 2002 the value of the SITEPROB variable is a composite of the values of ldquosuitability factorsrdquo that were determined to apply to a site during the hydropower resource assessment reported in Connor et al 1998 Dependent upon the type of site (undeveloped dam wo power or dam w power) suitability factor values were assigned to each of 12 environmental attributes and seven federally designated land uses The suitability factor values (010 025 050 075 090) reflect a) the probability that the attribute or land use will make a project unacceptable prohibiting its development and b) the degree to which associated licensing and mitigation costs would reduce the economic viability of the project The lowest value indicates that the attribute would tend to prohibit development or make it highly unlikely and the highest value indicates that the attribute will have little effect on the likelihood of development The SITEPROB value is either the single lowest suitability factor associated with the site or the next lowest value when there is more than one occurrence of the lowest value
22
4 CONCLUSIONS AND RECOMMENDATIONS
Analysis of historical hydropower data has shown that the costs of licensing construction five types of mitigation and fixed and variable OampM costs correlate with plant capacity As a result least squares power curve fits of cost as a function of capacity were defined that have R2
values ranging from 056 to 099 These power equations can be used to estimate costs in 2002 dollars for hydropower resources including undeveloped sites addition of a power house to a dam and expansion of an existing hydroelectric plant Functional relationships were also developed that can be used to estimate the cost in 2002 dollars of upgrading three types of turbines (Francis Kaplan and bulb) and upgrading generators
In addition to the cost estimating tools a method for estimating resource annual and monthly electric generation was developed This method which is based on 30 years of generation data can be used to determine generation based on average generation values for the state in which the resource is located
The HES database that contains 5677 hydropower resources and has a total capacity of 69009 MW was evaluated and found to contain 2155 resources having a total capacity of 43036 MW to which the cost and generation estimating tools were applicable Application of the tools resulted in cost and generation data which was assembled to produce the IHRED that included these data and site characteristic information for each of the 2155 resources This database will be useful both in predicting future hydroelectric supply and as a preliminary indication of the feasibility of realizing the potential of hydropower resources
The estimated costs of developing the 2155 sites in the IHRED indicate that over 20000 MW of new capacity could be developed for $1500 per kW or less These sites are existing dams to which a powerhouse could be added or existing hydroelectric plants that could be expanded The development of undeveloped sites is significantly more expensive with a median unit cost of $2700 per kW While the unit cost is relatively high in
comparison with other technologies it should be considered that hydroelectric facilities offer attractive characteristics that offset the high initial cost such as long life no fuel costs and low operating costs as well as reliability dispatchability and peaking power supply among others
This study was constrained to use only data sources that were readily available generally in electronic form In addition questionable or incomplete data could not be evaluated and had to be treated as unusable The data populations on which the cost estimating tools are based could be expanded with greater research and the purchase of private data collections Some of the data that was not used because it appeared questionable or incomplete could possibly be used if it were further researched The larger data populations obtained from these efforts would refine the cost estimating tools
The majority of the estimating tools had R2
values in the 60 and 70 percentiles indicating significant scatter in the data Additional data may increase these R2 values However this scatter may be indicative of dependence on another variable or other variables in addition to plant capacity Alternate functional relationships that may better correlate the data should be investigated
A tool for estimating water quality mitigation could not be produced within the constraints of the study because of the limited data that was readily available and the lack of correlation with a single parameter like plant capacity Greater research would probably add additional data and may result in a method of estimating this parameter The estimating tool for the cost of water quality monitoring which had an R2 value of 056 would no doubt benefit from additional research Such research may well show that dependence on a single variable like plant capacity is not sufficient for estimating this cost
The tools that were developed for estimating the cost of upgrading turbines and generators could not be applied to specific sites to evaluate
23
the potential for capacity increase resulting from these types of upgrades An evaluation of US hydroelectric plants from the perspective of upgrade potential should be performed to create a counterpart to the IHRED containing plant characteristics the estimated cost of the plant upgrade estimated associated licensing and mitigation costs if any estimated incremental OampM costs and added capacity and generation
The method of estimating plant generation should be reviewed to determine whether a more mechanistic model can be developed Use of 30 years of historical data is a good first step but the resulting predictors could probably benefit from refinement based on climatic prediction models Also using state boundaries as the arbiter of what average plant factor applies to a particular location is probably not optimally accurate Plant factors based on hydrography would probably
provide better predictors This approach should be investigated
The present study produced a large volume of data associated with a significant number of hydropower resources It was not within the scope of the study to analyze this data extensively and draw conclusions or make recommendations based on such analysis Greater value could be obtained from the useful product that has been produced if the IHRED data were analyzed to determine the trends and patterns that they contain This analysis should be performed for the benefit of both those who will use the data for predicting future hydroelectric supply and those who are decision makers regarding hydropower development
24
5 REFERENCES
Connor A M J E Francfort B N Rinehart 1998 U S Hydropower Resource Assessment Final Report DOEID-104302 December 1998
Christensen J P 1986 Small Hydropower Development the Process Pitfalls and Experience Vol III DOEID12254-1 June 1986
EHR 2002 What was the Inflation Rate Then Economic History Resources httpwwwehnetehresourceshowmuchinfla tionphp December 5 2002
EIA 2003a Hydroelectric plant data for 1990 through 2000 dataset (FERC Form I Annual Report of Major Electric Utilities Licencees and Others) transmitted as an attachment to T Petersik (EIA) email to R T Hunt (INEEL) October 9 2002
EIA 2003b Hydroelectric plant generation data for 1970 through 2000 dataset (FERC Form I Annual Report of Major Electric Utilities Licencees and Others) transmitted as an attachment to M E Johnson (EIA) email to R T Hunt (INEEL) December 19 2002
ENR 2002 Building Cost Index History (1915ndash2002) Engineering News-Record httpenrconstructioncomcostcostbciasp August 14 2002
EPRI 1989 Hydropower Plant Modernization Guide Vol 1 Electric Power Research Institute GS-6419 July 1989 pp 5-76 through 5-78
EPRI 1995 Water Resource Management and Hydropower Guidebook for Collaboration and Public Involvement Electric Power Research Institute TR-104858 1995
FERC 1999 FERC Annual Charges Federal Energy Regulatory Commission telefax August 13 1999
FERC 2003 environmental assessment and license documents Federal Energy Regulatory Commission httpwwwfercgov
Francfort et al 1994 Environmental Mitigation at Hydroelectric Projects DOEID-10360 January 1994
Francfort J E S D Matthews B N Rinehart 2002 Uniform Criteria for US Hydropower Resource Assessment Hydropower Evaluation Software (HES) Userrsquos Manual DOEID-10338 Rev 1 June 2002
Gordon JL 1983 Hydropower Cost Estimates Water Power amp Dam Construction Vol 35 No 11 1983
Hunt RT 2003 R T Hunt private communication with anonymous hydropower industry source January 2003
USBR 2002 Hydropower Construction Costs Trends US Bureau of Reclamation httpwwwusbrgovpowerindexhtml October 2002
25
Appendix A
Cost Estimating Tools
A-1
A-2
A-3
10000M Y = 6E5(C) 070
Y = 3E5(C) 070
Y = 2E5(C) 070
R2 = 074
1000M
Lice
nsin
g C
ost (
2002
$)
100M
FERC 2003 (1980 - 1997) EPRI 1995
FERC 2003 (1999 - 2001) 010M
Undeveloped Sites Dams Without Power Dams With Power 67 Lower Bound 98 Lower Bound
001M 1 10 100 1000 10000
Capacity (MW)
Figure A1A Licensing cost as a function of plant capacity for an undeveloped site and powerhouse installation at a dam without power and as a function of added capacity for a plant expansion
1 to 1
0
10 to
20
20 to
30
30 to
40
40 to
50
gt 50
$105694
$20572000
1 MW 1167 MW Capacity (MW)
Cos
t (20
02$)
Total No of Data Points = 162 102
22 13
5 4 16
0
20
40
60
80
100
120
No
of D
ata
Poin
ts
A-4
Capacity Range (MW)
Figure A-1B Number of licensing cost data points for various plant capacity ranges
Y = 3E6(C) 090
R2 = 081
10M
100M
1000M
10000M
100000M C
onst
ruct
ion
Cos
t (20
02$)
EIA 2003a (1990 - 2000) 67 Upper Bound Undeveloped Sites 67 Lower Bound
A-5
1 10 100 1000 10000 Capacity (MW)
Figure A-2A Plant construction cost as a function of plant capacity for undeveloped sites
1 to 1
0
10 to
20
20 to
30
30 to
40
40 to
50
50 to
60
60 to
70
70 to
80
80 to
90
90 to
1 00
100 t
o 150
15
0 to 2
00
200 t
o 250
gt 250
$1 4 11 4 5 3
$2 1 80 5 39 8 3 9
1 M W 1 28 0 M WCapacity (MW)
Cos
t (20
02$)
Total No of Data Points = 267 47
40
24 23
15 11
6
13 9 10
31
12
6
20
0
5
10
15
20
25
30
35
40
45
50
55
No
of D
ata
Poin
ts
A-6
Capacity Range (MW)
Figure A-2B Number of undeveloped site construction cost data points for various plant capacity ranges
A-7 C
onst
ruct
ion
Cost
(200
2$)
100000M
10000M
1000M
100M
10M
01M
Y = 1E6(C)081
Y = 2E6(C) 081
R2 = 074
1 10 100 1000 10000 Capacity (MW)
EIA 2003a (1990 - 2000) Christensen 1986
67 Upper Bound
Dams With Power Dams Without Power
Figure A-3A Construction cost as a function of plant capacity for a powerhouse installation at a dam without power or as a function of added capacity for a plant expansion
1 to 1
0
10 to
20
20 to
30
30 to
40
40 to
50
50 to
60
60 to
70
70 to
80
80 to
90
90 to
100
100 t
o 150
15
0 to 2
00
200 t
o 250
gt 250
$89 8 2 9 4
$1 1 69 4 85 4 7 6
1 M W 1 28 0 M WCapacity (MW)
Cos
t (20
02$)
Total No of Data Points = 226
19
37
21 20
14
10
6
12 9 10
30
12
6
20
0
5
10
15
20
25
30
35
40
No
of D
ata
Poin
ts
A-8
Capacity Range (MW)
Figure A-3B Number of powerhouse construction cost data points for various plant capacity ranges
A-9
100000M
10000M
1000M
100M
010M
001M
Y = 2E5(C)096
Y = 8E4(C) 096
R2 = 070
1 10 100 1000 10000 Capacity (MW)
FERC 2003 (1980 - 1997)
Undeveloped Sites Dams Without Power
FERC 2003 (1999 - 2001)
67 Lower Bound Dams With Power
98 Lower Bound
Y = 3E5(C)096
Figure A-4A Fish and wildlife mitigation cost as a function of plant capacity for undeveloped sites and powerhouse installation at a dam without power and as a function of added capacity for a plant expansion
Fish
and
Wild
life
Miti
gatio
n C
ost (
2002
$)
1 to 1
0
10 to
20
20 to
30
30 to
40
40 to
50
gt 50
$36773
$27271669
1 MW 697 MW Capacity (MW)
Cos
t (20
02$)
Total No of Data Points = 74 42
11 7
2 3
9
0
5
10
15
20
25
30
35
40
45
No
of D
ata
Poin
ts
A-10
Capacity Range (MW)
Figure A-4B Number of fish and wildlife mitigation cost data points for various plant capacity ranges
A-11
1000000M
100000M
10000M
1000M
0100M
0010M
0001M
Y = 6E4(C) 097
R2 = 087
097
1 10 100 1000 10000 Capacity (MW)
FERC 2003 (1980 - 1997)
Undeveloped Sites Dams Without Power
FERC 2003 (1999 - 2001)
67 Lower Bound Dams With Power
98 Lower Bound
Y = 2E5(C) Y = 2E5(C) 097
Figure A-5A Recreation mitigation cost as a function of plant capacity for undeveloped sites and powerhouse installation at a dam without power and as a function of added capacity for a plant expansion
Rec
reat
ion
Miti
gatio
n C
ost (
2002
$)
1 to 1
0
10 to
20
20 to
30
30 to
40
40 to
50
gt50
$9 2 6 7
$ 27 7 34 6 7 4
1 M W 69 7 M WCapacity (MW)
Cos
t (20
02$)
Total No of Data Points = 101 63
13
5 4 3
13
0
10
20
30
40
50
60
70
No
of D
ata
Poin
ts
A-12
Capacity Range (MW)
Figure A-5B Number of recreation mitigation cost data points for various plant capacity ranges
A-13
10000M
072Y = 1E5(C) 0721000M Y = 8E4(C)
072Y = 6E4(C) R2 = 094
100M
FERC 2003 (1980 - 1997) FERC 2003 (1999 - 2001) 010M Undeveloped Sites Dams Without Power Dams With Power 67 Lower Bound 98 Lower Bound
001M 1 10 100 1000 10000
Capacity (MW)
Figure A-6A Historical and archeological mitigation cost as a function of plant capacity for undeveloped sites and powerhouse installation at a dam without power and as a function of added capacity for a plant expansion
His
toric
al amp
Arc
heol
ogic
al M
itiga
tion
Cos
t (20
02$)
1 to 1
0
10 to
20
20 to
30
30 to
40
40 to
50
gt 50
$10 3 93 9
$6 0 32 1 12
4 M W 69 7 M WCapacity (MW)
Cos
t (20
02$)
Total No of Data Points = 22 12
1
4
0
2 3
0
2
4
6
8
10
12
14
No
of D
ata
Poin
ts
A-14
Capacity Range (MW)
Figure A-6B Number of historical and archeological mitigation cost data points for various plant capacity ranges
10000M
Y = 7E4(C)044
R2 = 056
Y = 2E5(C)044
0010M
0100M
1000M
Wat
er Q
ualit
y M
onito
ring
Cos
t (20
02$)
FERC 2003 (1980 - 1997)
Undeveloped Sites Dams Without Power
FERC 2003 (1999 - 2001)
67 Lower Bound Dams With Power
98 Lower Bound
Y = 4E5(C)044
A-15
0001M 1 10 100 1000 10000
Capacity (MW)
Figure A-7A Water quality monitoring cost as a function of plant capacity for undeveloped sites and powerhouse installation at a dam without power and as a function of added capacity for a plant expansion
1 to 1
0
10 to
20
20 to
30
30 to
40
40 to
50
gt50
$7 6 73
$2 2 09 7 09
1 44 M W 69 7 M WCapacity (MW)
Cos
t (20
02$)
Total No of Data Points = 89 51
14
7 3 2
12
0
10
20
30
40
50
60
No
of D
ata
Poin
ts
A-16
Capacity Range (MW)
Figure A-7B Number of water quality monitoring cost data points for various plant capacity ranges
A-17
1000M
Y = 1E6(C)056
R2 = 099
100M
Fish
Pas
sage
Cos
t (20
02$)
Francfort 1994 FERC 2003 (1999 - 2001)
67 Upper Bound Fish Passage 67 Lower Bound
10M 1 10 100 1000 10000
Capacity (MW)
Figure A-8A Fish passage cost as a function of plant capacity for undeveloped sites and powerhouse installation at a dam without power and as a function of added capacity for a plant expansion
1 to 1
0
10 to
20
20 to
30
30 to
40
40 to
50
gt50
A-18
$1 0 12 3 7 4
$ 52 7 62 5 0 0
1 M W 84 0 M WCapacity (MW)
Cos
t (20
02$)
No
of D
ata
Poin
ts
7
6
5
4
3
2
1
0
1
6 Total No of Data Points = 10
0 0 0
3
Capacity Range (MW)
Figure A-8B Number of fish passage cost data points for various plant capacity ranges
A-19
Y = 2E4(C)075
R2 = 060
001M
010M
100M
1000M
10000M
Fixe
d O
ampM
Cos
t (20
02$)
EIA 2003b (1990 - 2000) 67 Upper Bound All Sites 67 Lower Bound
1 10 100 1000 10000
Capacity (MW)
Figure A-9A Fixed operating and maintenance costs as a function of plant capacity for undeveloped sites and powerhouse installation at a dam without power and as a function of added capacity for a plant expansion
1 to 1
0
10 to
20
20 to
30
30 to
40
40 to
50
50 to
60
60 to
70
70 to
80
80 to
90
90 to
100
100 t
o 150
15
0 to 2
00
200 t
o 250
gt 250
$ 17 1 5 7
$ 11 4 92 7 7 4
1 M W 1 28 0 M WCapacity (MW)
Cos
t (20
02$)
Total No of Data Points = 474
24
105
55 47
33 27
14 19
14 12
51
25
11
37
0
20
40
60
80
10 0
12 0
No
of D
ata
Poin
ts
A-20
Capacity Range (MW)
Figure A-9B Number of fixed operation and maintenance cost data points for various plant capacity ranges
Y = 2E4(C)080
R2 = 067
001M
010M
100M
1000M
10000M Va
riabl
e O
ampM
Cos
t (20
02$)
EIA 2003b (1990 - 2000) 67 Upper Bound All Sites 67 Lower Bound
A-21
1 10 100 1000 10000
Capacity (MW)
Figure A-10A Variable operating and maintenance costs as a function of plant capacity for undeveloped and powerhouse installation at a dam without power and as a function of added capacity for a plant expansion
1 to 1
0
10 to
20
20 to
30
30 to
40
40 to
50
50 to
60
60 to
70
70 to
80
80 to
90
90 to
1 00
100 t
o 150
15
0 to 2
00
200 t
o 250
gt 250
$15 104
$12 929 143
1 MW 1 280 MWCapacity (MW)
Cos
t (20
02$)
Total No of Data Points = 501
39
116
58 51
37 25
14 24
14 14
53
25
10 21
0
20
40
60
80
10 0
12 0
14 0
No
of D
ata
Poin
ts
A-22
Capacity Range (MW)
Figure A-10B Number of variable operation and maintenance cost data points for various plant capacity ranges
A-23
Fran
cis
Turb
ine
Upg
rade
Cos
t (20
02$)
1000M
100M
10M
01M
071 -042Y = [3E6 sdot (C) ] sdot (H)
(C = 200 MW) Y = 13E8(H)-042
(C = 100 MW) Y = 77E7(H)-042
(C = 75 MW) Y = 63E7(H)-042
(C = 50 MW) Y = 47E7(H)-042
(C = 20 MW) Y = 25E7(H)-042
(C = 10 MW) Y = 15E7(H)-042
(C = 5 MW) Y = 92E6(H)-042
100 1000 Head (ft)
Figure A-11 Francis turbine upgrade cost as a function hydraulic head for various plant capacities
10000
A-24
1000M
100M
10M
(C = 5 MW) Y = 13E7(H)-038
(C = 10 MW) Y = 22E7(H)-038
(C = 20 MW) Y = 37E7(H)-038
(C = 50 MW) Y = 71E7(H)-038
(C = 75 MW) Y = 95E7(H)-038 (C = 100 MW) Y = 12E8(H)-038
(C = 200 MW) Y = 19E8(H)-038
10 100
Head (ft)
-038072 )H(](C)[4E6Y sdotsdot=
Figure A-12 Kaplan turbine upgrade cost as a function hydraulic head for various plant capacities
Kap
lan
Turb
ine
Upg
rade
Cos
t (20
02$)
1000
1000M B
ulb
Turb
ine
Upg
rade
Cos
t (20
02$)
100M
(C = 5 MW) Y = 25E7(H)-063
(C = 10 MW) Y = 45E7(H)-063
(C = 20 MW) Y = 82E7(H)-063
(C = 50 MW) Y = 18E8(H)-063
-063086 )H(](C)[6E6Y sdotsdot=
10M 1 10 100 1000
Head (ft)
Figure A-13 Bulb turbine upgrade cost as a function hydraulic head for various plant capacities
A-25
A-26
10M
01M
(C = 5 MW) Y = 84E6(S)-038
(C = 10 MW) Y = 13E7(S)-038
(C = 20 MW) Y = 21E7(S)-038
(C = 50 MW) Y = 37E7(S)-038 (C = 75 MW) Y = 49E7(S)-038 (C = 100 MW) Y = 59E7(S)-038
(C = 200 MW) Y = 92E7(S)-038
100 1000 Speed (RPM)
-038065 )S(](C)[3E6Y sdotsdot=
Figure A-14 Generator upgrade cost as a function of RPM for various plant capacities
1000M
100M
Gen
erat
or U
pgra
de C
ost (
2002
$)
10000
Appendix B
INEEL Hydropower Resource Economics Database (see document back cover for IHRED compact disk)
B-1
B-2
Field Number Field Name Type Description
Appendix B
INEEL Hydropower Resource Economics Database B1 IHRED Data Dictionary B2 IHRED
The data dictionary for the INEEL The IHRED in Excel format is provided on the Hydropower Resource Economics Database compact disk which is in a pocket on the back (IHRED) is given in Table B-1 This table lists the cover of this document The database contains field number parameter name field type (number resource characteristic data estimated or text) field description and units for the development and OampM costs and estimated 78 fields in the database annual and monthly generation for 2155 US
hydropower resources
Table B-1 INEEL Hydropower Resource Economics Database Data Dictionary Units
1 ProjectNumber Text Project Number (FERC number or pseudo FERC number) mdash
2 PlantName Text Name of the project mdash
3 StreamName Text Name of the stream where the project is located mdash
4 StateAbbr Text Two letter abbreviation for the state where the project is located mdash
5 NERCSubregion Text NERC Subregion (1 = East Central Area Reliability Coordination Agreement (ECAR) 2 = Electric Reliability Council of Texas (ERCOT) 3 = Mid-Atlantic Area Council (MAAC) 4 = Mid-America Interconnected Network (MAIN) 5 = Mid-Continent Area Power Pool (MAPP) 6 = Northeast Power Coordinating CouncilNew York (NY) 7 = Northeast Power Coordinating CouncilNew England (NE) 8 = Southeastern Electric Reliability CouncilFlorida (FL) 9 = Southeastern Electric Reliability CouncilExcl Florida (STV) 10 = Southwest Power Pool (SPP) 11 = Western Systems Coordinating CouncilNWP (NWP) 12 = Western Systems Coordinating CouncilRA (RA) 13 = Western Systems Coordinating CouncilCNV (CNV))
mdash
6 Latitude Number Latitude (first digits refer to degrees north last 2 digits refer to minutes)
ddmm
7 Longitude Number Longitude (First digits refer to degrees west last 2 digits refer to minutes)
ddmm
8 ClassCode Text Owner class code (C = Cooperative F = Federal I = Industrial M = Municipal and other non-federal P = Private utility R = Private nonutility)
mdash
9 OwnerName Text Name of project owner mdash
10 Capacity Number Potential capacity at undeveloped sites or sites without power or potential additional capacity at sites with power
MW
11 UnitType Text Type of unit (C = Conventional R = Reversible Z = Missing) mdash
12 PlantType Text Type of Plant (CMB = Combined conventional and reversible units DIV = Gravity diversion (powerhouse on different stream) PDV = Pumped diversion (one-way pumped storage) PMP = Pure (recycled) pump storage RES = Reservoir only ROR = Run-of-river (dam lt= 10 ft high and minimal storage) RRG = Reregulating STG = Storage conventional hydro (dam gt 10 ft high with significant storage) TID = Tidal conventional hydro)
mdash
B-3
Field Number Field Name Type Description
Table B-1 (continued) Units
13 ProjectStatus Text Status of Project (DJ = Disclaimer of FERC jurisdiction EA = Exemption applied for FA = Federally authorized FR = Federally recommended LE = License exemption LJ = Lack of FERC jurisdiction MA = FERC major license application MO = FERC license outstanding NA = FERC minor license application (lt15 kW) NO = FERC minor license outstanding (lt15 kW) PA = FERC preliminary permit application PO = FERC preliminary permit outstanding XX = No status YO = FERC minor part license outstanding ZZ = Missing)
mdash
14 BasinName Text River basin name mdash
15 CountyName Text County where the project is located mdash
16 DamStatus Text Status of Dam (W = With Power WO = Without Power U = Undeveloped)
mdash
17 WSProtection Text WildScenic Protection mdash
18 WSTributary Text WildScenic Tributary or UpstreamDownstream WildScenic Location (YNltblankgt)
mdash
19 Cultural Text Cultural Value (YNltblankgt) mdash
20 Fish Text Fish Value (YNltblankgt) mdash
21 Geological Text Geological Value (YNltblankgt) mdash
22 Historical Text Historical Value (YNltblankgt) mdash
23 Other Text Other criteria such as rare wetland communities and wilderness designation
mdash
24 Recreation Text Recreation Value (YNltblankgt) mdash
25 Scenic Text Scenic Value (YNltblankgt) mdash
26 Wildlife Text Wildlife Value (YNltblankgt) mdash
27 TEW Text ThreatenedEndangered Wildlife (YNltblankgt) mdash
28 TEF Text ThreatenedEndangered Fish (YNltblankgt) mdash
29 FLC103 Text Federal Land Code 103 (National Park Monument Lakeshore Parkway Battlefield or Recreation Area) (YNltblankgt)
mdash
30 FLC104 Text Federal Land Code 104 (National Forest or Grassland) (YNltblankgt)
mdash
31 FLC105 Text Federal Land Code 105 (National Wildlife Refuge Game Preserve or Fish Hatchery) (YNltblankgt)
mdash
32 FLC106 Text Federal Land Code 106 (National Scenic Waterway or Wilderness Area) (YNltblankgt)
mdash
33 FLC107 Text Federal Land Code 107(Indian Reservation) (YNltblankgt) mdash
34 FLC108 Text Federal Land Code 108 (Military Reservation) (YNltblankgt) mdash
35 FLC198 Text Federal Land Code 198 (Not On Federal Land) (YNltblankgt) mdash
36 SiteProb Number Project Environmental Suitability Factor (010 = Development prohibited or highly unlikely 025 = Major reduction in likelihood of development 050 = Likelihood of development reduced by half 075 = Minor reduction in likelihood of development 090 = Little effect on likelihood of development)
mdash
37 LicensingCost Number Total Licensing Cost $K
38 ConstructionCost Number Total Construction Cost $K
39 OvrNiteDevCost Number Overnight Development Cost ( LicensingCost + ConstructionCost ) $K
40 MitHist_Arch Number 30 year Archaeological and Historical mitigation cost (applicable if either Cultural or Historical fields are Y )
$K
41 MitFish_Wildlife Number 30 year fish and wildlife mitigation cost (applicable if any of the Fish Wildlife or TEW fields are Y )
$K
42 MitScenic_Rec Number 30 year scenic and recreation mitigation cost (applicable if either Recreation or Scenic fields are Y )
$K
B-4
Field Number Field Name Type Description
Table B-1 (continued) Units
43 MitWaterMonitor Number 30 year water quality monitoring cost $K
44 MitFishPassage Number 30 year fish passage cost (applicable if TEF field is Y ) $K
45 MitTotal Number Total Mitigation Cost ( Sum of MitHist_Arch MitFish_Wildlife MitScenic_Rec MitWaterMonitor and MitFishPassage )
$K
46 TotalDevCost Number Total Development Cost ( OvrNiteDevCost + MitTotal ) $K
47 UnitTotalDevCost Number Total Development Unit Cost $kW
48 FixedOM Number Average Annual Fixed OampM $K
49 UnitFixedOM Number Average Annual Fixed OampM Unit Cost $kW
50 VariableOM Number Average Annual Variable OampM $K
51 UnitVariableOM Number Average Annual Variable OampM Unit Cost MillskWh
52 FERCAnnChrg Number FERC Annual Charge (applicable if Capacity gt= 15 MW ) $K
53 PFAnnual Number Average Annual Plant Factor -
54 PFJan Number Average January Plant Factor -
55 PFFeb Number Average February Plant Factor -
56 PFMar Number Average March Plant Factor -
57 PFApr Number Average April Plant Factor -
58 PFMay Number Average May Plant Factor -
59 PFJun Number Average June Plant Factor -
60 PFJul Number Average July Plant Factor -
61 PFAug Number Average August Plant Factor -
62 PFSept Number Average September Plant Factor -
63 PFOct Number Average October Plant Factor -
64 PFNov Number Average November Plant Factor -
65 PFDec Number Average December Plant Factor -
66 GenAnnual Number Average Annual Generation MWh
67 GenJan Number Average January Generation MWh
68 GenFeb Number Average February Generation MWh
69 GenMar Number Average March Generation MWh
70 GenApr Number Average April Generation MWh
71 GenMay Number Average May Generation MWh
72 GenJun Number Average June Generation MWh
73 GenJul Number Average July Generation MWh
74 GenAug Number Average August Generation MWh
75 GenSept Number Average September Generation MWh
76 GenOct Number Average October Generation MWh
77 GenNov Number Average November Generation MWh
78 GenDec Number Average December Generation MWh
Special field values NA Value not available in source data
Value removed due to homeland security concerns
B-5
- ABSTRACT
- EXECUTIVE SUMMARY
- ACKNOWLEDGMENTS
- ACRONYMS
- NOMENCLATURE
- INTRODUCTION
- TECHNICAL APPROACH
-
- Cost Estimating Tools for Plant Development or Expansion
-
- Data Sources
- General Method
- Data Screening
- Accounting for Cost Variations by Type of Site
-
- Cost Estimating Tools for Plant Operation and Maintenance
- Cost Estimating Tools for Turbine and Generator Upgrade
- Estimating Plant Electric Generation
- FERC Annual Charge
- Application of Estimating Tools to Hydropower Resources
-
- RESULTS
-
- Cost Estimating Tools for Plant Development or Expansion
- Cost Estimating Tools for Plant Operation and Maintenance
- Cost Estimating Tools for Turbine and Generator Upgrade
- Estimating Plant Electric Generation
- Estimated Economic Parameters for Hydropower Resources
- Likelihood of Development
-
- CONCLUSIONS AND RECOMMENDATIONS
- REFERENCES
-
- B1IHRED Data Dictionary
- B2IHRED
-
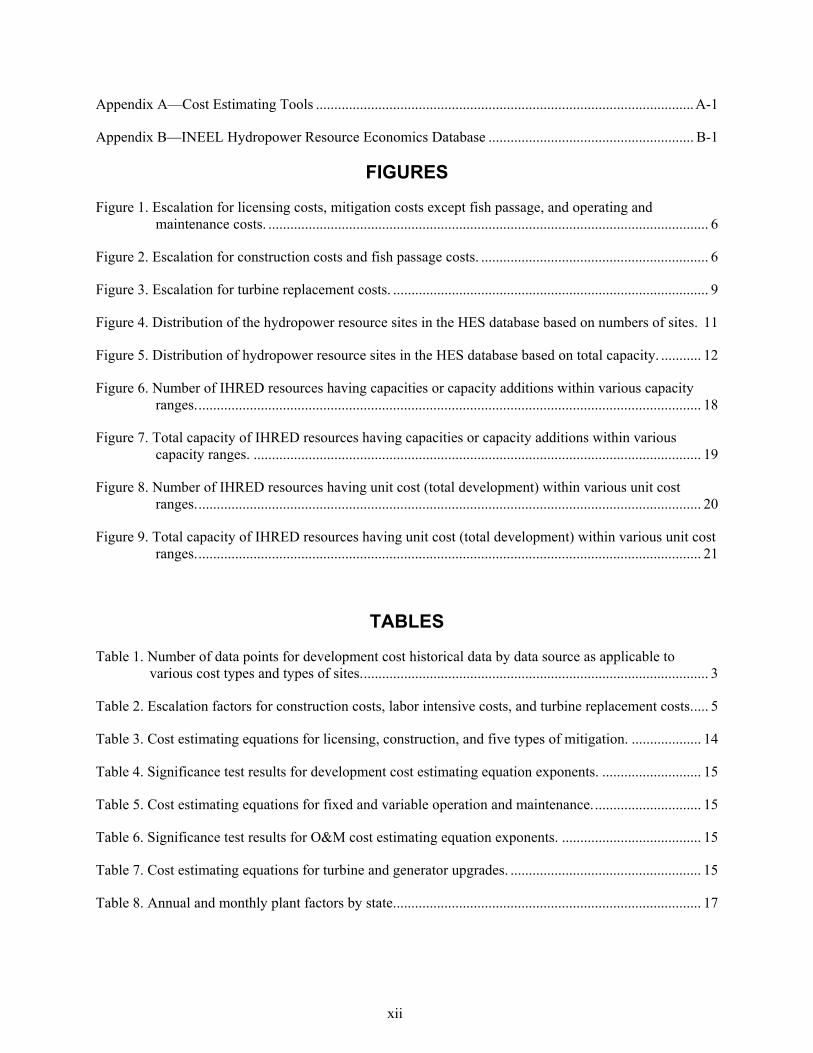

3
Table 1 Number of data points for development cost historical data by data source as applicable to various cost types and types of sites
Data Source
Licensing Cost
Construction Cost
Fish and Wildlife Mitigation Cost
(1)
Recreation Mitigation Cost (2)
Historical and Archeological Mitigation Cost
(3)
Water Quality Monitoring Cost
(4) Fish Passage Cost
(5)
Fixed Operations and
Maintenance Cost 3
Variable Operations and
Maintenance Cost 3
Plant Factor amp
Generation 4U
ndev
elop
ed 1
Dam
s w
o P
ower
Dam
s w
Pow
er
Und
evel
oped
Dam
s w
o P
ower
Dam
s w
Pow
er 2
Und
evel
oped
1
Dam
s w
o P
ower
Dam
s w
Pow
er
Und
evel
oped
1
Dam
s w
o P
ower
Dam
s w
Pow
er
Und
evel
oped
1
Dam
s w
o P
ower
Dam
s w
Pow
er
Und
evel
oped
1
Dam
s w
o P
ower
Dam
s w
Pow
er
All All All All
FERC Environmental Assessment and License Documents (1980 - 1997)
133 64 90 19 78
FERC Environmental Assessment and License Documents (1999-2001)
6 10 11 3 11 3
EIA data (1990-2000) 267 214 214 2319 474 384
2452 501 421
EIA data (1970-2000 excluding 1983)
18690 1157
EPRI TR-104858 23
Christensen 1986 12 12
Francfort et al 1994 7
Total 162 267 226 226 74 101 22 89 10 2340 475 384
2452 501 421
18690 1157
1 Upper limit of 67 data range 2 Lower limit of 67 data range 3 Upper - total records middle - avg cost values lower - no of plants 4 Upper - total records lower - no of plants
The same data source was used for costs of power house construction and expansion of an existing hydroelectric plant except in this case only costs in the ldquostructures and improvementsrdquo and ldquoequipmentrdquo categories were used Several points were also taken from Christensen 1986
Fish passage construction cost was limited to those projects that installed bi-directional fish passage as opposed to uni-directional passage or screens The majority of the cost data came from Francfort et alrsquos review of fish passage projects (Francfort et al 1994) Three data points were also obtained from FERC relicensing applications with costs in the 1999 through 2001 period
212 General Method
The sets of historical data were assembled in the form of Excel spreadsheets and each contained plant identifiers costs capacity and other plant data For each dataset the following operations were performed to determine an estimating tool
1 Each cost was escalated to 2002 dollars using one of the two escalation curves discussed below
2 Escalated costs were plotted as a function of plant capacity in the case of undeveloped sites and dams without power or as a function of added capacity for plant expansions at dams with power
3 A least squares curve fit was performed on the data in each plot to determine a best fit mathematical function providing cost in 2002 dollars as a function of plant capacity The derived function could then be used as a tool to estimate costs of this type for hydropower sites In addition to the function the least squares curve fitting also provided a root-mean-square (RMS) goodness of fit value
Costs for labor intensive work were escalated using the consumer price index (CPI) with 1970 as the base year (EHR 2002) The escalation values are listed in the second column of Table 2 and are shown graphically in Figure 1 Escalation factors
represented by this curve were applied to licensing costs and all mitigation costs except fish passage which has a large construction component
Plant and fish passage construction costs were escalated using the escalation data listed in the first column of Table 2 and are shown graphically in Figure 2 These data use 1940 as the reference year Prior to 1969 escalation values are from the Engineering News Record (ENR 2002) For 1969 and later the values are from the US Bureau of Reclamation (USBR 2002)
In order to escalate a cost from its year of occurrence to 2002 an escalation ratio was calculated by dividing the 2002 escalation factor value by the escalation factor value for the year of cost occurrence The escalation ratio was then applied to the cost to escalate it to the cost in 2002 dollars
213 Data Screening
The dataset containing construction costs (EIA 2003a) included data for 909 plants Ninety plants were eliminated by one or more of the following three criteria
1 Capacity less than 1 MW
2 Capacity greater than 1300 MW
3 Pumped storage plant
Prior to determining the construction cost estimating tools the data for the remaining 819 plants were screened to identify unusable or unrealistic records For the undeveloped site construction cost estimating tool the following data screens were made
1 Any records containing a zero value for total cost of plant were considered unusable (2 of plants removed)
2 Records for plants constructed prior to 1940 were not used because even though the costs could be escalated it was judged that the escalated costs would be unrealistically low relative to current costs because of the low labor rates that existed prior to 1940 (88 of plants removed)
4
Table 2 Escalation factors for construction costs labor intensive costs and turbine replacement costs Year Constructiona Inflation b Turbine c Year Constructiona Inflationb Turbine 2002 182490 48362 253 1969 38911 2001 179767 47017 248 1968 35525 2000 176654 45480 242 1967 33307 1999 171206 44497 239 1966 32023 1998 167315 43835 235 1965 30895 1997 162646 42829 228 1964 30156 1996 156420 41597 228 1963 29261 1995 155642 40480 228 1962 28560 1994 150195 39454 226 1961 27977 1993 147860 38312 221 1960 27549 1992 143969 37193 216 1959 27004 1991 143191 35687 208 1958 25875 1990 138521 33862 195 1957 25058 1989 133852 32308 185 1956 24202 1988 127626 31029 179 1955 23113 1987 124514 29934 174 1954 21984 1986 122957 29387 169 1953 21245 1985 121595 28382 166 1952 20506 1984 121595 27194 163 1951 19767 1983 117899 26348 158 1950 18482 1982 116732 24819 150 1949 17354 1981 110895 22490 143 1948 16809 1980 102140 19818 131 1947 15409 1979 91440 17809 118 1946 12918 1978 83658 16553 108 1945 11790 1977 77821 15525 100 1944 11556 1976 74903 14681 1943 11284 1975 71012 13471 1942 10934 1974 64202 12124 1941 10389 1973 54475 11416 1940 10000 1972 50584 11051 1971 48638 10594 1970 44747 10000
a ENR 2002 and USBR 2002
b EHR 2002
c USBR 2002
5
50
45
40
35
30
25
20
15
10
05
00
Economic History Resources
Cos
t Ind
ex
1970 1975 1980 1985 1990 1995 2000 2005
Year
Figure 1 Escalation for licensing costs mitigation costs except fish passage and operating and maintenance costs
20
18
16
14
12
Engineering News Record US Bureau of Reclamation
1940 1950 1960 1970 1980 1990 2000 2010 Year
Cos
t Ind
ex
10
8
6
4
2
0
Figure 2 Escalation for construction costs and fish passage costs
6
3 Any construction cost less than $700kW or greater than $5000kW was considered to be atypical and was not used (9 of plants removed)
4 A history of construction cost for a specific plant that decreased rather than increased in successive years was reviewed to select the most realistic value or marked as unusable if a best value could not be identified (1 of plants removed)
The data screening process prior to determining the construction cost estimating tools for power house addition to a dam or expansion of a hydroelectric plant was the same except for the zero data screen If either the cost for ldquostructures and improvementsrdquo or the cost for ldquoequipmentrdquo was zero the record was considered to be unusable Most of the plants removed by screening were removed because they were constructed prior to 1940 (80 of plants removed) The zero cost criteria and the unit cost criteria accounted for 10 and 9 of the plants removed respectively with an additional 1 of the plants removed being the result of difficult to interpret cost trends
Data screening resulted in data for 267 plants being used to determine the construction cost estimating tool for undeveloped sites Screening also resulted in data for 214 plants being used to determine the construction cost estimating tool for power house addition and plant expansion Since the construction cost values for a given plant were reported as a cumulative cost and therefore increased each year the actual cost data point for a specific plant was the construction cost value for the earliest year in the dataset in nearly all cases
214 Accounting for Cost Variations byType of Site
The cost data for licensing fish and wildlife mitigation recreation mitigation historical and archeological mitigation and water quality monitoring were taken from environmental assessment and relicensing documents for existing hydroelectric plants rather than from new FERC license applications Since these costs would be higher for new development it was decided to include a premium for these costs associated with undeveloped sites and dams without power It was
reasoned that these costs for dams without power would be higher than for existing hydroelectric plants (dams with power) and would be higher still for undeveloped sites
These premiums were defined by taking the upper bound of envelopes that encompassed two-thirds or 98 of the data points in analogy to plus or minus one and two sigma bands The upper and lower bounds of each envelope were determined by selecting values of a data band parameter δ such that the curves defined by (1 plusmn δ) times the regression curve equation encompassed either two-thirds or 98 of the data points A different value of δ was used to encompass the designated fraction of the points above the regression curve than was used to encompass this fraction of points below the curve
For licensing and the four types of mitigation the regression curve itself was used as the estimating tool for a plant expansion The 67 upper bound [(1+δ67UB) times the regression curve equation] was used as the estimating tool for addition of a powerhouse to a dam without power The 98 upper bound [(1+δ98UB) times the regression curve equation] was used as the estimating tool for an undeveloped site
No premium for fish passage cost was used This is because it was judged that the installation cost of fish passage would not be affected by the extent of previous development at the site Fish passage was thus treated as an incremental cost in all cases rather than as an integrated cost that would differ depending on the type of site at which it was installed
A bounding curve was also used at the estimating tool for estimating the construction cost of a plant expansion Because the available data were the costs associated with the addition of a powerhouse it was judged that these costs were too high when estimating the cost of a plant expansion For this reason the equation for the 67 lower bound of the cost data for construction of a powerhouse [(1-δ67LB) times the regression curve equation] was used as the estimating equation for the construction cost of a plant expansion
7
22 Cost Estimating Tools forPlant Operation andMaintenance
Separate cost estimating tools were developed for fixed and variable OampM costs The data on which these tools were based was EIA data (EIA 2003a) for the period 1990 through 2001 The following costs were considered to be fixed OampM costs
bull Operation supervision and engineering
bull Maintenance supervision and engineering
bull Maintenance of structures
bull Maintenance of reservoirs dams and waterways
bull Maintenance of electric plant
bull Maintenance of miscellaneous hydraulic plant
In contrast the following costs were considered to be variable OampM costs
bull Water for power
bull Hydraulic expenses
bull Electric expenses
bull Miscellaneous hydraulic power expenses
bull Rents
Prior to performing the process to determine the cost estimating tool screening operations were performed on the dataset Of the 909 plants represented in the dataset 90 were eliminated by one or more of the following three criteria
1 Capacity less than 1 MW
2 Capacity greater than 1300 MW
3 Pumped storage plant
For the fixed OampM cost estimating tool the following data screens were made
1 Any record containing a zero or negative value for any of the fixed OampM component costs listed above or zero electicity generation was
considered to be unusable (93 of plants removed)
2 Any record containing a total fixed OampM cost that was less than 05 millskW-h or greater than 55 millskW-h was considered to be unusable (7 of plants removed)
Plants for which there was more than one capacity listed were treated as separate plants at the respective capacities
For the variable OampM cost estimating tool the following data screens were made
1 Any record containing a negative value for any of the variable OampM component costs listed above was considered to be unusable (1 of plants removed)
2 Any record containing zero values for all the variable OampM component costs listed above except water for power was considered to be unusable (78 of plants removed)
3 Any record containing a total variable OampM cost that was less than 15 millskW-h or greater than 80 millskW-h was considered to be unusable (21 of plants removed)
Plants for which there was more than one capacity listed were treated as separate plants at the respective capacities
These screening operations resulted in significant reductions in the numbers of plants that actually contributed to the determination of the estimating tools Of the original 819 plants of interest data for 384 plants was used to determine the fixed OampM cost estimating tool while data for 421 plants was used to determine the variable OampM cost estimating tool Because some plants had more than one capacity listed for the same plant 474 data points were used to determine the fixed OampM cost estimating tool and 501 data points were used to determine the variable OampM cost estimating tool
Both of the OampM cost estimating tools were determined using a process similar to that described above for development costs
8
(1) escalating costs to 2002 dollars using the escalation data shown in Figure 1 (2) time averaging the data for each plant-capacity combination to obtain an average annual cost (3) plotting the average values as a function of plant capacity or added capacity and (4) performing a least squares curve fit to determine the equation to be used as the estimating tool
23 Cost Estimating Tools forTurbine and Generator Upgrade
The cost estimating tools for upgrading three types of turbines Francis Kaplan and bulb were produced using data from EPRI 1989 Cost data points were taken from working plots of cost as a
function of hydraulic head for various plant capacities These costs were escalated to 2002 dollars using the cost escalation data in the third column of Table 2 which is shown graphically in Figure 3 (USBR 2002) Iterative analysis was performed on the data for each type of turbine to obtain a mathematical expression of cost as a function of capacity and hydraulic head that closely matched the escalated data
The cost estimating tool for upgrading generators is based on data obtained from a hydropower industry source (Hunt 2003) These data are in the form of generator cost as a function of rotational speed for various capacities Iterative analysis was performed on the data to obtain a mathematical expression of cost as a function of capacity and rotational speed that closely matched the data
Cos
t Ind
ex
3
25
2
15
1
05
0
US Bureau of Reclamation
1977 1982 1987 1992 1997 2002 Year
Figure 3 Escalation for turbine replacement costs
9
24 Estimating Plant ElectricGeneration
The EIA provided both annual and monthly plant generation data for the period 1970 through 2000 (EIA 2003b) The generation data were converted to plant factors (PF) using the equation
GenerationTimePeriod(MW minus h)PFTime Period = Capacity(MW) x Time(hours)
where
Time = annual or monthly hours
The plant factor data were grouped by the state in which the plant is located The plant factors for each time period (Annual January February etc) associated with each state regardless of year or location of occurrence were used to obtain an unweighted average plant factor for each time period for each state Annual plant factors less than 025 or greater than 085 were judged to be unrealistic and were not included in the average
The plant factors for a given state were used to estimate either the total or incremental (for plant expansions) potential generation of hydropower resource sites within the state using the inverse of the above equation
GStateTime Period = (PFState Time Period) lowast(C)lowast(Time)
where
GState Time Period = generation during a specified time period in MW-h
PFStateTime Period = average state plant factor for a specified period of time
C = plant capacity or added capacity in MW
Time = time period in hours
25 FERC Annual Charge For plants with a capacity greater than
15 MW FERC charges plant owners an annual fee based on plant capacity and annual generation (FERC 1999) In order to have a complete estimate of plant costs the following formula was applied once the plant annual generation or added generation was estimated as described in the previous section
Cost (2002$) = (017238 G ) + (153227 C )
where
G = annual generation in MW-h
C = capacity in kW
26 Application of Estimating Tools to Hydropower Resources
The cost and generation estimating tools that were developed as described above were applied to the hydropower resources identified in the resource assessment reported in Connor et al 1998 Characteristic information about the hydropower resources was assembled in the HES database (Francfort et al 2002) The database was screened to identify sites to which the estimating tools were applicable using the following criteria to identify nonapplicable sites
bull Sites having capacity potentials less than 1 MW
bull Sites that were excluded from development by federal statutes and policies
bull Sites that were excluded from development by state and municipal statutes and policies
bull Sites that have been developed since the assessment was performed
bull Sites that are pumped storage plants
10
Sites that were excluded from development by federal statutes and policies were identified by using geographic information system (GIS) tools to intersect the geographic location of resources in the HES database with a GIS data layer containing all federally excluded areas including
bull National battlefields
bull National historic parks
bull National parks
bull National parkways
bull National monuments
bull National preserves
bull National wildlife refuges
bull Wildlife management areas
bull National wilderness areas
bull Wild and scenic rivers
Dams w Power 164 8
The HES database also contained information about whether the resource is sited at the upstream or downstream end of a wild and scenic stream reach (W_S_PROT) or on a tributary (W_S_TRIB) of a stream designated as wild and scenic It also contained information about whether a site is located in a federally designated exclusion zone FED103_C and FED106_C Those sites that were designated as meeting any of these criteria or were identified as being in an exclusion zone via the use of the GIS layer were eliminated from the list of resources to which the estimating tools were applied
Of the 5677 resources in the HES database 3522 were found to be unsuitable for application of the estimating tools for one or more of the reasons stated above leaving 2155 applicable sites Figure 4 shows the distribution of the resources in the HES database based on the applicability of the estimating tools and the various reasons for nonapplicability (Applicable sites are designated as ldquoIHRED sitesrdquo) Most of sites (2311 sites or 41) were eliminated because they had a capacity of less than 1 MW
Undeveloped Sites 965
Dams wo 45 Power 1026 48
IHRED Sites IHRED Sites Capacity 2155 2155 lt 1MW 38 2311 41
Pumped Storage Sites
3 Excluded Sites 01 Developed 1189
Sites 2119 HES Sites 03 5766
Figure 4 Distribution of the hydropower resource sites in the HES database based on numbers of sites
11
A counterpart to the distribution shown in cost of water quality monitoring was estimated for Figure 4 in terms of the total amount of power all sites represented by applicable resources and the various classes of nonapplicable resources is The basic site characteristic data from the HES shown in Figure 5 This figure shows that while database was combined with the cost and the resources having a capacity of 1 MW or less generation data produced using the estimating represented 41 of the HES sites in number they tools to create a new database named the INEEL collectively represented only 1 of the total Hydropower Resource Economics Database capacity of all the sites in the HES database (IHRED) Because the HES database did not
identify plants that could be upgraded by installing The cost estimating tools were applied to the new turbines or generators the tools for estimating
applicable sites in the HES database based on the these costs were not applied to any of the listed capacity of the site The potential generation resources listed in the database (annual and monthly) of the resource was estimated using the average plant factors for the state in which The distribution of the 2511 sites in the the resource is located The application of the IHRED in terms of the types of sites is shown in mitigation cost estimating tools was dependent on Figure 4 Of these sites the sites that were either site characteristics in the HES database The cost of totally undeveloped or were a dam without a fish and wildlife mitigation was estimated if any of hydroelectric installation represented 45 and 48 the FISH_C WILDLF_C or T_E_W_C (indicates of the applicable sites respectively Sites with the presence of threatened or endangered wildlife) hydroelectric installations that could be expanded fields contained a ldquoYrdquo value The cost of recreation were 8 of the applicable sites mitigation was estimated if either of the following
Viewed from a total capacity perspective parameters had a ldquoYrdquo value REC_C or SCENIC_C Figure 5 shows a nearly equal portion for totally The cost of historical and archeological mitigation undeveloped sites and dams without a was estimated if either of the following parameters hydroelectric installation being 40 and 48 of the had a ldquoYrdquo value CULTUR_C or HISTORY_C The total capacity of the IHRED sites respectively cost of fish passage mitigation was estimated if the Sites with hydroelectric installations that could beT_E_F_C parameter (indicates the presence of expanded represent 11 of the total capacity threatened or endangered fish) had a ldquoYrdquo value The
Dams w Power 4917 MW
11 Undeveloped Sites
17369 MW Capacity lt 40
1MW Dams wo 743 MW Excluded Sites Power 120749 MW 24619 MW 48 36
IHRED Sites 43036 MW
Developed IHRED Sites Sites 43036 MW Pumped 291 MW
62 Storage Sites 04 321 MW
05 HES Sites 69009 MW
Figure 5 Distribution of hydropower resource sites in the HES database based on total capacity
12
3 RESULTS
The technical approach to developing cost and generation estimating was executed using the various sources of historical data listed in Table 1 The resulting tools for estimation are described in this section The application of these tools to applicable hydropower resources in the HES database that resulted in the production of the IHRED is also described
31 Cost Estimating Tools forPlant Development orExpansion
The historical data for licensing costs construction costs and five types of mitigation costs were found to correlate well with plant capacity or added capacity Plots of the basic data that were used to develop each cost estimating tool are presented in Appendix A along with the resulting regression curve and data bands encompassing 67 and 98 of the data points In addition the population of each basic dataset based on capacity ranges accompanies each basic plot in the appendix These distribution charts are accompanied by a thumbnail plot listing the minimum and maximum values of cost and capacity included in the dataset
A least squares curve fit showed that a power curve best represented the data in each dataset The equation for each cost estimating tool is listed in Table 3 which gives the coefficient and exponent for the power curve the data band parameter values and the R2 value indicating the goodness of the fit The equations of the upper and lower bounds of the data band encompass either 67 or 98 of the data points They are the same as the basic curve fit equation except the coefficient is multiplied by (1 + δxUB) for the upper bound or multiplied by (1 - δxLB) for the lower bound where x is either 67 or 98 No value is listed for the data band parameter and no R2 is listed in the table for tools that are the upper or lower bound of a dataset
In order to gain confidence that cost has a power law relationship with capacity for each of
the elements of development costs tests of significance were performed on the exponents in each of the cost estimating equations These tests showed that the exponents are statistically significantly different than zero with greater than 99 confidence providing confidence that cost increases with capacity rather than there being a significant probability that cost does not vary with capacity (exponent equals zero) The values of the t statistic for each of the exponents is compared with the t statistic value for a one-tailed 999 significance test in Table 4
32 Cost Estimating Tools forPlant Operation andMaintenance
The historical data for fixed and variable OampM costs were also found to correlate well with plant capacity or added capacity Plots of the basic data that were used to develop each cost estimating tool are presented in Appendix A along with the resulting regression curve and data bands encompassing 67 of the data points In addition the population of each basic dataset based on capacity ranges along with a thumbnail plot listing the minimum and maximum values of cost and capacity included in the dataset accompanies each basic plot in the appendix
A least squares curve fit showed that a power curve best represented the data in each dataset The equation for each cost estimating tool is listed in Table 5 which gives the coefficient and exponent for the power curve the data band parameter values and the R2 value indicating the goodness of the fit
The results of tests of significance on the exponents of the two OampM cost estimating tools are presented in Table 6 These results show with greater than 999 confidence that cost increases with capacity
13
14
Table 3 Cost estimating equations for licensing construction and five types of mitigation
Cost (2002$) = A lowast [Capacity (MW)] B
Estimating Tool Application Coefficient
(A) Exponent
(B)
Data Band Parameter
(δ98UB)
Data Band Parameter
(δ67UB)
Data Band Parameter
(δ67LB)
Data Band Parameter
(δ98LB) R2
Licensing - Undeveloped Sites 61E+05 070 - - - - NA
Licensing - Dams wo Power 31E+05 070 - - - - NA
Licensing ndash Dams w Power 21E+05 070 190 46 39 63 074
Construction - Undeveloped Sites 33E+06 090 126 49 35 67 081
Construction - Dams wo Power 22E+06 081 250 67 38 74 074
Construction - Dams w Power 14E+06 081 - - - - NA
Fish amp Wildlife Mitigation - Undeveloped Sites 31E+05 096 - - - - NA
Fish amp Wildlife Mitigation - Dams wo Power 20E+05 096 - - - - NA
Fish amp Wildlife Mitigation - Dams w Power 83E+04 096 278 138 39 77 070
Recreation Mitigation - Undeveloped Sites 24E+05 097 - - - - NA
Recreation Mitigation - Dams wo Power 17E+05 097 - - - - NA
Recreation Mitigation - Dams w wo Power 63E+04 097 282 166 54 92 087
Historical amp Archeological Mitigation - Undeveloped Sites 10E+05 072 - - - - NA
Historical amp Archeological Mitigation - Dams wo Power 85E+04 072 - - - - NA
Historical amp Archeological Mitigation - Dams w wo Power 63E+04 072 65 35 43 50 094
Water Quality Monitoring - Undeveloped Sites 40E+05 044 - - - - NA
Water Quality Monitoring - Dams wo Power 20E+05 044 - - - - NA
Water Quality Monitoring - Dams w wo Power 7E+04 044 513 213 59 93 056
Fish Passage Mitigation 13E+06 056 79 09 18 31 099
Table 4 Significance test results for development cost estimating equation exponents Estimating Tool Exponent Standard
Error t Statistic Value t (ν 0001)
Licensing ndash Dams wo Power 02806 24854 3142 Construction ndash Undeveloped Sites 01781 50378 3121 Construction ndash Dams wo Power 02706 29825 3127 Fish amp Wildlife Mitigation 05587 17142 3207 Recreation Mitigation 06534 14835 3175 Hist amp Arch Mitigation 05753 12440 3552 Water Quality Mitigation 07837 5559 3187 Fish Passage Mitigation 03827 14571 4501
Table 5 Cost estimating equations for fixed and variable operation and maintenance
Cost (2002$) = A lowast [Capacity (MW)] B
Estimating Tool Application Coefficient
(A) Exponent
(B)
Data Band Parameter
(δ98UB)
Data Band Parameter
(δ67UB)
Data Band Parameter
(δ67LB)
Data Band Parameter
(δ98LB) R2
Fixed Operation and Maintenance 24E4 075 192 67 46 74 060
Variable Operation and Maintenance 24E4 080 255 77 39 74 067
Table 6 Significance test results for OampM cost estimating equation exponents Estimating Tool Exponent Standard
Error t Statistic Value t (ν 0001)
Fixed Operation and Maintenance 02127 35400 3108
Variable Operation and Maintenance 02198 36295 3107
Table 7 Cost estimating equations for turbine and generator upgrades
Turbines Cost (2002$) = A lowast [Capacity (MW)] B lowast [Head(ft)] C
Estimating Tool Application Coefficient (A)
Exponent(B)
Exponent(C)
Francis Turbines 3E6 071 -042 Kaplan Turbines 4E6 072 -038 Bulb Turbines 6E6 086 -063
Generators Cost (2002$) = A lowast [Capacity (MW)] B lowast [Speed(rpm)] C
Generators 3E6 065 -038
15
33 Cost Estimating Tools forTurbine and Generator Upgrade
Development of the cost estimating tools for turbine and generator upgrades resulted in power equations in which the coefficient is a function of the capacity of the turbine or generator being replaced The equations for these tools are listed in Table 7 The tools are shown graphically in Appendix A
34 Estimating Plant ElectricGeneration
Annual and monthly plant factors were determined for each state The resulting plant factors are listed in Table 8
35 Estimated Economic Parameters for Hydropower Resources
The development and OampM cost estimating tools listed in Tables 3 and 5 and the plant factors listed in Table 8 were applied to 2155 US hydropower resources from the HES database to build the IHRED Resource characteristic data in the HES database were retained in the IHRED and cost and generation data were added to assemble the 78 fields of data for each resource The IHRED data dictionary which provides field names and descriptions is listed in Appendix B The database in Excel format is provided on a compact disk as part of Appendix B and is included in a pocket on the back cover of this document
The distribution of the hydropower resources in the IHRED which is based on the number of resources having capacities or capacity additions within various capacity ranges is shown in Figure 6 This figure shows that 1461 of the 2155 resources in the IHRED (68) had capacities or capacity additions in the 1 to 10 MW range Ninety-two percent of the resources had capacities or capacity additions of 50 MW or less A comparison of Figure 6 with similar distributions for the data populations on which the cost estimating tools are based (Appendix A) reveals that the distributions are similar Thus the vast majority of cost estimates that were made for
resources in the IHRED were based on historical data from plants in the same capacity range
A related distribution of the IHRED resources is shown in Figure 7 In this figure the total capacity represented by the resources having capacities or capacity additions in each capacity range is shown This figure shows that the 1461 resources (68 of the sites) having capacities or capacity additions in the 1 to 10 MW range represent only 12 of the total 43036 MW of the IHRED resources The 92 of the IHRED resources having capacities or capacity additions of 50 MW or less constitute 41 of the total capacity of the resources Another 44 of the total capacity is contributed by resources having capacities or capacity additions of 100 MW or greater with 24 of the total capacity being contributed by the 21 sites having capacities or added capacities greater than 250 MW
All the cost estimating tools are based on data populations that include data for plants having capacities greater than 100 MW But the number of points is less than at the other end of the capacity scale The data populations on which construction and OampM cost estimating tools are based have the best representations at the high end of the capacity range The thumbnail plot on each of the source data distributions in Appendix A provides the minimum and maximum capacity and cost of the source data
The distributions of the IHRED sites which are given in capacity ranges in Figures 6 and 7 are presented in ranges of unit development cost in Figures 8 and 9 Unit development cost is the sum of the estimated costs of licensing construction and any required mitigation divided by the capacity or added capacity of the site The distribution of the number of undeveloped sites that could be developed for various unit costs is shown by the blue bar segments in Figure 8 This is an approximately symmetric distribution with the maximum number of this type of site being developed for $3500 to $4000 per kW Likewise the distribution of dams without power sites shown by the red bar segments is approximately symmetric with the maximum number of this type of site being developed for $2000 to $2500 per kW The distribution of the dams with power or plant expansions shown by the white bar segments is also approximately symmetric with the
16
17
Table 8 Annual and monthly plant factors by state State
ALASKA Abbr AK
Annual05021
January 04876
February 04819
March 04512
April 04547
May 04767
June 05393
July 05500
August 05350
September 05119
October 05255
November 05183
December 04913
ALABAMA AL 04378 06489 06718 06707 05330 04145 03464 03093 02818 02485 02686 03642 05108 ARKANSAS AR 04208 04725 05037 05317 05319 04773 04441 04069 03438 02760 02717 03322 04630 ARIZONA AZ 04860 03438 03812 04679 05759 05943 06538 06510 06250 04859 03570 03379 03511 CALIFORNIA CA 05487 04931 05327 05935 06149 06462 06396 06067 05779 05142 04476 04422 04748 COLORADO CO 04946 04514 04430 04233 04226 05743 06686 06528 05547 04983 04259 03858 04290 CONNECTICUT CT 04672 05576 06018 07414 07574 06209 03994 02340 01927 01878 03089 04478 05670 FLORIDA FL 04316 04622 05304 05875 05232 03985 04180 04397 04674 03660 02626 03277 04030 GEORGIA GA 04378 05166 05343 05414 05251 04563 04142 03752 03788 03340 03446 03925 04472 HAWAII HI 06111 05876 05655 06429 07861 07110 05799 05666 05572 05183 05620 06526 06015 IOWA IA 05549 04745 05169 06212 06221 06163 05996 05680 05218 05017 04851 05738 05565 IDAHO ID 06037 06042 05955 06129 06402 06619 06675 06262 05837 05647 05354 05586 05930 ILLINOIS IL 05145 04649 04862 04980 04980 04978 05105 05266 05439 05318 05346 05672 05139 INDIANA IN 04982 04985 05219 05715 06232 06107 05497 04458 03833 03837 03846 04792 05306 KANSAS KS 04083 03470 03956 04382 03919 04057 03933 03869 04029 04389 03806 04579 04616 KENTUCKY KY 05309 05786 05401 04974 04948 05522 05652 05533 05207 04826 04841 05352 05655 LOUISIANA LA 04208 04725 05037 05317 05319 04773 04441 04069 03438 02760 02717 03322 04630 MASSACHUSETTS MA 04840 05478 05567 06323 06284 05800 04386 03254 03251 03094 04032 05011 05646 MARYLAND MD 04251 04507 05409 07230 07349 05427 03296 02448 01753 01898 02650 03911 05232 MAINE ME 05824 05815 05975 06618 07114 07023 06119 04918 04448 04603 05273 06001 06007 MICHIGAN MI 04830 04720 04842 05523 06556 05808 04896 03977 03633 03905 04260 04820 05052 MINNESOTA MN 06054 05247 05346 05927 07256 07216 06882 06184 04920 05275 05755 06720 05914 MISSISSIPPI MS 04208 04725 05037 05317 05319 04773 04441 04069 03438 02760 02717 03322 04630 MISSOURI MO 04107 04300 04663 05651 05668 04890 04205 03607 03186 02658 02633 03550 04321 MONTANA MT 06114 06125 05951 05761 06088 06463 07059 06616 05897 05570 05768 06111 05960 NORTH CAROLINA NC 04555 05545 05772 05896 05321 04863 04410 03768 03824 03448 03427 03763 04699 NORTH DAKOTA ND 05474 06104 06300 04981 04679 05173 05854 06091 06104 05267 04856 05110 05220 NEBRASKA NE 04700 03989 04822 05014 05072 04905 05113 05273 04948 04362 04526 04515 03880 NEW HAMPSHIRE NH 05524 05381 05579 06556 07584 07165 05561 04081 03811 03725 04937 06042 05896 NEW JERSEY NJ 03310 03245 03719 05082 04571 04178 03115 02431 01707 02596 02882 02858 03372 NEW MEXICO NM 04796 03652 03899 05137 06029 05825 05497 05551 04771 04776 04424 03806 04131 NEVADA NV 05410 04312 04996 05414 06409 06542 06103 05931 05794 05529 04979 04317 04580 NEW YORK NY 05354 05519 05667 06301 07009 06425 05094 04088 03700 03933 04763 05768 06027 OHIO OH 04681 04524 04352 04403 05141 05315 05319 05082 04268 04148 04245 04465 04886 OKLAHOMA OK 04605 04242 04525 05970 06085 06262 06424 04826 03137 02581 02561 04078 04585 OREGON OR 05669 06551 06488 06478 06274 06254 05721 04558 04211 04494 04733 05784 06552 PENNSYLVANIA PA 04995 05224 05609 06931 07016 06139 05045 03931 02977 02932 03548 04727 05910 RHODE ISLAND RI 03052 03785 06043 06396 05104 03676 01644 00979 00524 00636 00841 02574 04636 SOUTH CAROLINA SC 04691 05875 06200 06191 05735 05103 04485 03623 03585 03227 03528 03978 04860 SOUTH DAKOTA SD 05064 03835 03532 03836 04706 05240 05707 06291 06546 06319 05656 05056 03952 TENNESSEE TN 05055 06158 06057 05671 04868 04611 04836 04749 05038 04437 04252 04553 05475 TEXAS TX 05053 04893 05144 05404 05441 05814 06325 05176 04754 04607 04309 04480 04318 UTAH UT 05127 03949 04286 04481 05577 06849 06833 06088 05760 05077 04278 04163 04139 VIRGINIA VA 04429 05144 05783 06306 06127 05781 04653 03381 02961 02692 02818 03381 04221 VERMONT VT 04976 04905 04974 05767 07418 06618 04687 03192 03051 03268 04570 05739 05567 WASHINGTON WA 05312 06069 06096 05597 05488 05795 05959 05084 04000 04007 04256 05385 06066 WISCONSIN WI 05559 04863 04944 05931 07286 06675 05861 04837 04526 05042 05359 05968 05423 WEST VIRGINIA WV 05609 06136 06743 07019 07047 06851 05880 04774 04265 03806 03920 04944 06009 WYOMING WY 05034 04149 04053 04354 05054 05789 06720 06922 06361 04867 03983 03997 04081
Louisiana and Mississippi values were estimated using Arkansas plant factors
1 to 1
0
10 to
20
20 to
30
30 to
40
40 to
50
50 to
60
60 to
70
70 to
80
80 to
90
90 to
100
100 t
o 150
15
0 to 2
00
200 t
o 250
gt250
18
1750
1500
1250
1000
750
Total No of Sites = 2155
21 10
6 03
18 08
29 13
12 06
14 06
17 08
18 08
35 16
53 25
63 29
146 68
262 122
1461 678
W i th Po w e r W i th out Pow e r Unde vel o pe dN
o o
f Site
s
500
250
0
Capacity Range (MW)
Figure 6 Number of IHRED resources having capacities or capacity additions within various capacity ranges
1 to 1
0
10 to
20
20 to
30
30 to
40
40 to
50
50 to
60
60 to
70
70 to
80
80 to
90
90 to
100
100 t
o 150
15
0 to 2
00
200 t
o 250
gt250
C
apac
ity (M
W)
12500
10000
7500
5000
Total Capacity = 43036 MW
1422 33
3159 73
3622 84
1156 27
1214 28
1315 31
1195 28
1954 45
2465 572210
51
3654 85
3890 90
10554 245
5225 121
W i th P o w e r W i thou t Po w e r Und e v e lo ped
2500
0
Capacity Range (MW)
Figure 7 Total capacity of IHRED resources having capacities or capacity additions within various capacity ranges
19
0 to 5
00
500 t
o 100
0 10
00 to
150
0 15
00 to
200
0 20
00 to
250
0 25
00 to
300
0 30
00 to
350
0 35
00 to
400
0 40
00 to
450
0 45
00 to
500
0 50
00 to
550
0 55
00 to
600
0 60
00 to
650
0
20
100
0
Total No of Sites = 2155
1 00
58 0204
43 20
188 87
288 134 272
126
328 152
380 176
3 01
333 155
241 112
65 30
W i th Pow e r W i thout Pow e r Un de v e l o p e d
Unit Cost Range ($kW)
Figure 8 Number of IHRED resources having unit cost (total development) within various unit cost ranges
500
400
300
200No
of S
ites
0 to 5
00
5 00 t
o 100
0 10
00 to
15 0
0 15
00 to
200
0 20
00 to
250
0 25
00 to
300
0 30
00 to
35 0
0 35
00 to
400
0 40
00 to
450
0 45
00 to
50 0
0 50
00 to
55 0
0 55
00 to
600
0 60
00 to
650
0
21
12000
10000
8000
6000
4000
Total Capacity = 43036 MW 10860 252
8369 194
4185 97
1514 35
5516 128
7392 172
3483 81
1265 29
370 09 58
01 15
00 6
00 1
00
W i th P o w e r W i th out Po w e r Un dev el o pedC
apac
ity (M
W)
2000
0
Unit Cost Range ($kW)
Figure 9 Total capacity of IHRED resources having unit cost (total development) within various unit cost ranges
maximum number of this type of site being developed for $1000 to $1500 per kW These maximum points of the respective distributions shift downward in unit cost from the perspective of developing the maximum capacity as shown in Figure 9 The maximum total capacity from undeveloped sites is obtained for $2500 to $3000 per kW while the maximum total capacity is obtained from adding a powerhouse to dams without power for $500 to $1500 per kW The maximum total capacity from plant expansions is obtained for $500 to $1000 per kW Viewed as a whole the results indicate that over 20000 MW of capacity could be developed at unit costs of $1500 per kW or less
When considering new generating plants long-standing energy industry practice has been to use unit costs ($kW) of various facilities as a comparison tool to make development decisions While the unit cost parameter is a good indicator of total development costs using it alone for comparison with other technologies penalizes projects like hydroelectric facilities that have high initial costs long life no fuel costs and low operating costs
The chart showing amounts of capacity (MW) falling within various unit cost ranges (Figure 9) is presented for information as a relative cost indicator for the available hydropower resources analyzed in this study It is not intended to imply an endorsement of the unit cost method to compare various technologies and make development decisions
36 Likelihood of Development
In order to provide the IHRED user with some measure of the likelihood that a particular site will be developed the SITEPROB field and the associated values from the HES database were included in the IHRED as field number 36 This parameter ranges from 010 which indicates the least likely sites to be developed to 090 which indicates the most likely sites The researchers
reasoned that no site has a 0 probability of development just as no site can be predicted to have a 100 probability of development
As described in Francfort et al 2002 the value of the SITEPROB variable is a composite of the values of ldquosuitability factorsrdquo that were determined to apply to a site during the hydropower resource assessment reported in Connor et al 1998 Dependent upon the type of site (undeveloped dam wo power or dam w power) suitability factor values were assigned to each of 12 environmental attributes and seven federally designated land uses The suitability factor values (010 025 050 075 090) reflect a) the probability that the attribute or land use will make a project unacceptable prohibiting its development and b) the degree to which associated licensing and mitigation costs would reduce the economic viability of the project The lowest value indicates that the attribute would tend to prohibit development or make it highly unlikely and the highest value indicates that the attribute will have little effect on the likelihood of development The SITEPROB value is either the single lowest suitability factor associated with the site or the next lowest value when there is more than one occurrence of the lowest value
22
4 CONCLUSIONS AND RECOMMENDATIONS
Analysis of historical hydropower data has shown that the costs of licensing construction five types of mitigation and fixed and variable OampM costs correlate with plant capacity As a result least squares power curve fits of cost as a function of capacity were defined that have R2
values ranging from 056 to 099 These power equations can be used to estimate costs in 2002 dollars for hydropower resources including undeveloped sites addition of a power house to a dam and expansion of an existing hydroelectric plant Functional relationships were also developed that can be used to estimate the cost in 2002 dollars of upgrading three types of turbines (Francis Kaplan and bulb) and upgrading generators
In addition to the cost estimating tools a method for estimating resource annual and monthly electric generation was developed This method which is based on 30 years of generation data can be used to determine generation based on average generation values for the state in which the resource is located
The HES database that contains 5677 hydropower resources and has a total capacity of 69009 MW was evaluated and found to contain 2155 resources having a total capacity of 43036 MW to which the cost and generation estimating tools were applicable Application of the tools resulted in cost and generation data which was assembled to produce the IHRED that included these data and site characteristic information for each of the 2155 resources This database will be useful both in predicting future hydroelectric supply and as a preliminary indication of the feasibility of realizing the potential of hydropower resources
The estimated costs of developing the 2155 sites in the IHRED indicate that over 20000 MW of new capacity could be developed for $1500 per kW or less These sites are existing dams to which a powerhouse could be added or existing hydroelectric plants that could be expanded The development of undeveloped sites is significantly more expensive with a median unit cost of $2700 per kW While the unit cost is relatively high in
comparison with other technologies it should be considered that hydroelectric facilities offer attractive characteristics that offset the high initial cost such as long life no fuel costs and low operating costs as well as reliability dispatchability and peaking power supply among others
This study was constrained to use only data sources that were readily available generally in electronic form In addition questionable or incomplete data could not be evaluated and had to be treated as unusable The data populations on which the cost estimating tools are based could be expanded with greater research and the purchase of private data collections Some of the data that was not used because it appeared questionable or incomplete could possibly be used if it were further researched The larger data populations obtained from these efforts would refine the cost estimating tools
The majority of the estimating tools had R2
values in the 60 and 70 percentiles indicating significant scatter in the data Additional data may increase these R2 values However this scatter may be indicative of dependence on another variable or other variables in addition to plant capacity Alternate functional relationships that may better correlate the data should be investigated
A tool for estimating water quality mitigation could not be produced within the constraints of the study because of the limited data that was readily available and the lack of correlation with a single parameter like plant capacity Greater research would probably add additional data and may result in a method of estimating this parameter The estimating tool for the cost of water quality monitoring which had an R2 value of 056 would no doubt benefit from additional research Such research may well show that dependence on a single variable like plant capacity is not sufficient for estimating this cost
The tools that were developed for estimating the cost of upgrading turbines and generators could not be applied to specific sites to evaluate
23
the potential for capacity increase resulting from these types of upgrades An evaluation of US hydroelectric plants from the perspective of upgrade potential should be performed to create a counterpart to the IHRED containing plant characteristics the estimated cost of the plant upgrade estimated associated licensing and mitigation costs if any estimated incremental OampM costs and added capacity and generation
The method of estimating plant generation should be reviewed to determine whether a more mechanistic model can be developed Use of 30 years of historical data is a good first step but the resulting predictors could probably benefit from refinement based on climatic prediction models Also using state boundaries as the arbiter of what average plant factor applies to a particular location is probably not optimally accurate Plant factors based on hydrography would probably
provide better predictors This approach should be investigated
The present study produced a large volume of data associated with a significant number of hydropower resources It was not within the scope of the study to analyze this data extensively and draw conclusions or make recommendations based on such analysis Greater value could be obtained from the useful product that has been produced if the IHRED data were analyzed to determine the trends and patterns that they contain This analysis should be performed for the benefit of both those who will use the data for predicting future hydroelectric supply and those who are decision makers regarding hydropower development
24
5 REFERENCES
Connor A M J E Francfort B N Rinehart 1998 U S Hydropower Resource Assessment Final Report DOEID-104302 December 1998
Christensen J P 1986 Small Hydropower Development the Process Pitfalls and Experience Vol III DOEID12254-1 June 1986
EHR 2002 What was the Inflation Rate Then Economic History Resources httpwwwehnetehresourceshowmuchinfla tionphp December 5 2002
EIA 2003a Hydroelectric plant data for 1990 through 2000 dataset (FERC Form I Annual Report of Major Electric Utilities Licencees and Others) transmitted as an attachment to T Petersik (EIA) email to R T Hunt (INEEL) October 9 2002
EIA 2003b Hydroelectric plant generation data for 1970 through 2000 dataset (FERC Form I Annual Report of Major Electric Utilities Licencees and Others) transmitted as an attachment to M E Johnson (EIA) email to R T Hunt (INEEL) December 19 2002
ENR 2002 Building Cost Index History (1915ndash2002) Engineering News-Record httpenrconstructioncomcostcostbciasp August 14 2002
EPRI 1989 Hydropower Plant Modernization Guide Vol 1 Electric Power Research Institute GS-6419 July 1989 pp 5-76 through 5-78
EPRI 1995 Water Resource Management and Hydropower Guidebook for Collaboration and Public Involvement Electric Power Research Institute TR-104858 1995
FERC 1999 FERC Annual Charges Federal Energy Regulatory Commission telefax August 13 1999
FERC 2003 environmental assessment and license documents Federal Energy Regulatory Commission httpwwwfercgov
Francfort et al 1994 Environmental Mitigation at Hydroelectric Projects DOEID-10360 January 1994
Francfort J E S D Matthews B N Rinehart 2002 Uniform Criteria for US Hydropower Resource Assessment Hydropower Evaluation Software (HES) Userrsquos Manual DOEID-10338 Rev 1 June 2002
Gordon JL 1983 Hydropower Cost Estimates Water Power amp Dam Construction Vol 35 No 11 1983
Hunt RT 2003 R T Hunt private communication with anonymous hydropower industry source January 2003
USBR 2002 Hydropower Construction Costs Trends US Bureau of Reclamation httpwwwusbrgovpowerindexhtml October 2002
25
Appendix A
Cost Estimating Tools
A-1
A-2
A-3
10000M Y = 6E5(C) 070
Y = 3E5(C) 070
Y = 2E5(C) 070
R2 = 074
1000M
Lice
nsin
g C
ost (
2002
$)
100M
FERC 2003 (1980 - 1997) EPRI 1995
FERC 2003 (1999 - 2001) 010M
Undeveloped Sites Dams Without Power Dams With Power 67 Lower Bound 98 Lower Bound
001M 1 10 100 1000 10000
Capacity (MW)
Figure A1A Licensing cost as a function of plant capacity for an undeveloped site and powerhouse installation at a dam without power and as a function of added capacity for a plant expansion
1 to 1
0
10 to
20
20 to
30
30 to
40
40 to
50
gt 50
$105694
$20572000
1 MW 1167 MW Capacity (MW)
Cos
t (20
02$)
Total No of Data Points = 162 102
22 13
5 4 16
0
20
40
60
80
100
120
No
of D
ata
Poin
ts
A-4
Capacity Range (MW)
Figure A-1B Number of licensing cost data points for various plant capacity ranges
Y = 3E6(C) 090
R2 = 081
10M
100M
1000M
10000M
100000M C
onst
ruct
ion
Cos
t (20
02$)
EIA 2003a (1990 - 2000) 67 Upper Bound Undeveloped Sites 67 Lower Bound
A-5
1 10 100 1000 10000 Capacity (MW)
Figure A-2A Plant construction cost as a function of plant capacity for undeveloped sites
1 to 1
0
10 to
20
20 to
30
30 to
40
40 to
50
50 to
60
60 to
70
70 to
80
80 to
90
90 to
1 00
100 t
o 150
15
0 to 2
00
200 t
o 250
gt 250
$1 4 11 4 5 3
$2 1 80 5 39 8 3 9
1 M W 1 28 0 M WCapacity (MW)
Cos
t (20
02$)
Total No of Data Points = 267 47
40
24 23
15 11
6
13 9 10
31
12
6
20
0
5
10
15
20
25
30
35
40
45
50
55
No
of D
ata
Poin
ts
A-6
Capacity Range (MW)
Figure A-2B Number of undeveloped site construction cost data points for various plant capacity ranges
A-7 C
onst
ruct
ion
Cost
(200
2$)
100000M
10000M
1000M
100M
10M
01M
Y = 1E6(C)081
Y = 2E6(C) 081
R2 = 074
1 10 100 1000 10000 Capacity (MW)
EIA 2003a (1990 - 2000) Christensen 1986
67 Upper Bound
Dams With Power Dams Without Power
Figure A-3A Construction cost as a function of plant capacity for a powerhouse installation at a dam without power or as a function of added capacity for a plant expansion
1 to 1
0
10 to
20
20 to
30
30 to
40
40 to
50
50 to
60
60 to
70
70 to
80
80 to
90
90 to
100
100 t
o 150
15
0 to 2
00
200 t
o 250
gt 250
$89 8 2 9 4
$1 1 69 4 85 4 7 6
1 M W 1 28 0 M WCapacity (MW)
Cos
t (20
02$)
Total No of Data Points = 226
19
37
21 20
14
10
6
12 9 10
30
12
6
20
0
5
10
15
20
25
30
35
40
No
of D
ata
Poin
ts
A-8
Capacity Range (MW)
Figure A-3B Number of powerhouse construction cost data points for various plant capacity ranges
A-9
100000M
10000M
1000M
100M
010M
001M
Y = 2E5(C)096
Y = 8E4(C) 096
R2 = 070
1 10 100 1000 10000 Capacity (MW)
FERC 2003 (1980 - 1997)
Undeveloped Sites Dams Without Power
FERC 2003 (1999 - 2001)
67 Lower Bound Dams With Power
98 Lower Bound
Y = 3E5(C)096
Figure A-4A Fish and wildlife mitigation cost as a function of plant capacity for undeveloped sites and powerhouse installation at a dam without power and as a function of added capacity for a plant expansion
Fish
and
Wild
life
Miti
gatio
n C
ost (
2002
$)
1 to 1
0
10 to
20
20 to
30
30 to
40
40 to
50
gt 50
$36773
$27271669
1 MW 697 MW Capacity (MW)
Cos
t (20
02$)
Total No of Data Points = 74 42
11 7
2 3
9
0
5
10
15
20
25
30
35
40
45
No
of D
ata
Poin
ts
A-10
Capacity Range (MW)
Figure A-4B Number of fish and wildlife mitigation cost data points for various plant capacity ranges
A-11
1000000M
100000M
10000M
1000M
0100M
0010M
0001M
Y = 6E4(C) 097
R2 = 087
097
1 10 100 1000 10000 Capacity (MW)
FERC 2003 (1980 - 1997)
Undeveloped Sites Dams Without Power
FERC 2003 (1999 - 2001)
67 Lower Bound Dams With Power
98 Lower Bound
Y = 2E5(C) Y = 2E5(C) 097
Figure A-5A Recreation mitigation cost as a function of plant capacity for undeveloped sites and powerhouse installation at a dam without power and as a function of added capacity for a plant expansion
Rec
reat
ion
Miti
gatio
n C
ost (
2002
$)
1 to 1
0
10 to
20
20 to
30
30 to
40
40 to
50
gt50
$9 2 6 7
$ 27 7 34 6 7 4
1 M W 69 7 M WCapacity (MW)
Cos
t (20
02$)
Total No of Data Points = 101 63
13
5 4 3
13
0
10
20
30
40
50
60
70
No
of D
ata
Poin
ts
A-12
Capacity Range (MW)
Figure A-5B Number of recreation mitigation cost data points for various plant capacity ranges
A-13
10000M
072Y = 1E5(C) 0721000M Y = 8E4(C)
072Y = 6E4(C) R2 = 094
100M
FERC 2003 (1980 - 1997) FERC 2003 (1999 - 2001) 010M Undeveloped Sites Dams Without Power Dams With Power 67 Lower Bound 98 Lower Bound
001M 1 10 100 1000 10000
Capacity (MW)
Figure A-6A Historical and archeological mitigation cost as a function of plant capacity for undeveloped sites and powerhouse installation at a dam without power and as a function of added capacity for a plant expansion
His
toric
al amp
Arc
heol
ogic
al M
itiga
tion
Cos
t (20
02$)
1 to 1
0
10 to
20
20 to
30
30 to
40
40 to
50
gt 50
$10 3 93 9
$6 0 32 1 12
4 M W 69 7 M WCapacity (MW)
Cos
t (20
02$)
Total No of Data Points = 22 12
1
4
0
2 3
0
2
4
6
8
10
12
14
No
of D
ata
Poin
ts
A-14
Capacity Range (MW)
Figure A-6B Number of historical and archeological mitigation cost data points for various plant capacity ranges
10000M
Y = 7E4(C)044
R2 = 056
Y = 2E5(C)044
0010M
0100M
1000M
Wat
er Q
ualit
y M
onito
ring
Cos
t (20
02$)
FERC 2003 (1980 - 1997)
Undeveloped Sites Dams Without Power
FERC 2003 (1999 - 2001)
67 Lower Bound Dams With Power
98 Lower Bound
Y = 4E5(C)044
A-15
0001M 1 10 100 1000 10000
Capacity (MW)
Figure A-7A Water quality monitoring cost as a function of plant capacity for undeveloped sites and powerhouse installation at a dam without power and as a function of added capacity for a plant expansion
1 to 1
0
10 to
20
20 to
30
30 to
40
40 to
50
gt50
$7 6 73
$2 2 09 7 09
1 44 M W 69 7 M WCapacity (MW)
Cos
t (20
02$)
Total No of Data Points = 89 51
14
7 3 2
12
0
10
20
30
40
50
60
No
of D
ata
Poin
ts
A-16
Capacity Range (MW)
Figure A-7B Number of water quality monitoring cost data points for various plant capacity ranges
A-17
1000M
Y = 1E6(C)056
R2 = 099
100M
Fish
Pas
sage
Cos
t (20
02$)
Francfort 1994 FERC 2003 (1999 - 2001)
67 Upper Bound Fish Passage 67 Lower Bound
10M 1 10 100 1000 10000
Capacity (MW)
Figure A-8A Fish passage cost as a function of plant capacity for undeveloped sites and powerhouse installation at a dam without power and as a function of added capacity for a plant expansion
1 to 1
0
10 to
20
20 to
30
30 to
40
40 to
50
gt50
A-18
$1 0 12 3 7 4
$ 52 7 62 5 0 0
1 M W 84 0 M WCapacity (MW)
Cos
t (20
02$)
No
of D
ata
Poin
ts
7
6
5
4
3
2
1
0
1
6 Total No of Data Points = 10
0 0 0
3
Capacity Range (MW)
Figure A-8B Number of fish passage cost data points for various plant capacity ranges
A-19
Y = 2E4(C)075
R2 = 060
001M
010M
100M
1000M
10000M
Fixe
d O
ampM
Cos
t (20
02$)
EIA 2003b (1990 - 2000) 67 Upper Bound All Sites 67 Lower Bound
1 10 100 1000 10000
Capacity (MW)
Figure A-9A Fixed operating and maintenance costs as a function of plant capacity for undeveloped sites and powerhouse installation at a dam without power and as a function of added capacity for a plant expansion
1 to 1
0
10 to
20
20 to
30
30 to
40
40 to
50
50 to
60
60 to
70
70 to
80
80 to
90
90 to
100
100 t
o 150
15
0 to 2
00
200 t
o 250
gt 250
$ 17 1 5 7
$ 11 4 92 7 7 4
1 M W 1 28 0 M WCapacity (MW)
Cos
t (20
02$)
Total No of Data Points = 474
24
105
55 47
33 27
14 19
14 12
51
25
11
37
0
20
40
60
80
10 0
12 0
No
of D
ata
Poin
ts
A-20
Capacity Range (MW)
Figure A-9B Number of fixed operation and maintenance cost data points for various plant capacity ranges
Y = 2E4(C)080
R2 = 067
001M
010M
100M
1000M
10000M Va
riabl
e O
ampM
Cos
t (20
02$)
EIA 2003b (1990 - 2000) 67 Upper Bound All Sites 67 Lower Bound
A-21
1 10 100 1000 10000
Capacity (MW)
Figure A-10A Variable operating and maintenance costs as a function of plant capacity for undeveloped and powerhouse installation at a dam without power and as a function of added capacity for a plant expansion
1 to 1
0
10 to
20
20 to
30
30 to
40
40 to
50
50 to
60
60 to
70
70 to
80
80 to
90
90 to
1 00
100 t
o 150
15
0 to 2
00
200 t
o 250
gt 250
$15 104
$12 929 143
1 MW 1 280 MWCapacity (MW)
Cos
t (20
02$)
Total No of Data Points = 501
39
116
58 51
37 25
14 24
14 14
53
25
10 21
0
20
40
60
80
10 0
12 0
14 0
No
of D
ata
Poin
ts
A-22
Capacity Range (MW)
Figure A-10B Number of variable operation and maintenance cost data points for various plant capacity ranges
A-23
Fran
cis
Turb
ine
Upg
rade
Cos
t (20
02$)
1000M
100M
10M
01M
071 -042Y = [3E6 sdot (C) ] sdot (H)
(C = 200 MW) Y = 13E8(H)-042
(C = 100 MW) Y = 77E7(H)-042
(C = 75 MW) Y = 63E7(H)-042
(C = 50 MW) Y = 47E7(H)-042
(C = 20 MW) Y = 25E7(H)-042
(C = 10 MW) Y = 15E7(H)-042
(C = 5 MW) Y = 92E6(H)-042
100 1000 Head (ft)
Figure A-11 Francis turbine upgrade cost as a function hydraulic head for various plant capacities
10000
A-24
1000M
100M
10M
(C = 5 MW) Y = 13E7(H)-038
(C = 10 MW) Y = 22E7(H)-038
(C = 20 MW) Y = 37E7(H)-038
(C = 50 MW) Y = 71E7(H)-038
(C = 75 MW) Y = 95E7(H)-038 (C = 100 MW) Y = 12E8(H)-038
(C = 200 MW) Y = 19E8(H)-038
10 100
Head (ft)
-038072 )H(](C)[4E6Y sdotsdot=
Figure A-12 Kaplan turbine upgrade cost as a function hydraulic head for various plant capacities
Kap
lan
Turb
ine
Upg
rade
Cos
t (20
02$)
1000
1000M B
ulb
Turb
ine
Upg
rade
Cos
t (20
02$)
100M
(C = 5 MW) Y = 25E7(H)-063
(C = 10 MW) Y = 45E7(H)-063
(C = 20 MW) Y = 82E7(H)-063
(C = 50 MW) Y = 18E8(H)-063
-063086 )H(](C)[6E6Y sdotsdot=
10M 1 10 100 1000
Head (ft)
Figure A-13 Bulb turbine upgrade cost as a function hydraulic head for various plant capacities
A-25
A-26
10M
01M
(C = 5 MW) Y = 84E6(S)-038
(C = 10 MW) Y = 13E7(S)-038
(C = 20 MW) Y = 21E7(S)-038
(C = 50 MW) Y = 37E7(S)-038 (C = 75 MW) Y = 49E7(S)-038 (C = 100 MW) Y = 59E7(S)-038
(C = 200 MW) Y = 92E7(S)-038
100 1000 Speed (RPM)
-038065 )S(](C)[3E6Y sdotsdot=
Figure A-14 Generator upgrade cost as a function of RPM for various plant capacities
1000M
100M
Gen
erat
or U
pgra
de C
ost (
2002
$)
10000
Appendix B
INEEL Hydropower Resource Economics Database (see document back cover for IHRED compact disk)
B-1
B-2
Field Number Field Name Type Description
Appendix B
INEEL Hydropower Resource Economics Database B1 IHRED Data Dictionary B2 IHRED
The data dictionary for the INEEL The IHRED in Excel format is provided on the Hydropower Resource Economics Database compact disk which is in a pocket on the back (IHRED) is given in Table B-1 This table lists the cover of this document The database contains field number parameter name field type (number resource characteristic data estimated or text) field description and units for the development and OampM costs and estimated 78 fields in the database annual and monthly generation for 2155 US
hydropower resources
Table B-1 INEEL Hydropower Resource Economics Database Data Dictionary Units
1 ProjectNumber Text Project Number (FERC number or pseudo FERC number) mdash
2 PlantName Text Name of the project mdash
3 StreamName Text Name of the stream where the project is located mdash
4 StateAbbr Text Two letter abbreviation for the state where the project is located mdash
5 NERCSubregion Text NERC Subregion (1 = East Central Area Reliability Coordination Agreement (ECAR) 2 = Electric Reliability Council of Texas (ERCOT) 3 = Mid-Atlantic Area Council (MAAC) 4 = Mid-America Interconnected Network (MAIN) 5 = Mid-Continent Area Power Pool (MAPP) 6 = Northeast Power Coordinating CouncilNew York (NY) 7 = Northeast Power Coordinating CouncilNew England (NE) 8 = Southeastern Electric Reliability CouncilFlorida (FL) 9 = Southeastern Electric Reliability CouncilExcl Florida (STV) 10 = Southwest Power Pool (SPP) 11 = Western Systems Coordinating CouncilNWP (NWP) 12 = Western Systems Coordinating CouncilRA (RA) 13 = Western Systems Coordinating CouncilCNV (CNV))
mdash
6 Latitude Number Latitude (first digits refer to degrees north last 2 digits refer to minutes)
ddmm
7 Longitude Number Longitude (First digits refer to degrees west last 2 digits refer to minutes)
ddmm
8 ClassCode Text Owner class code (C = Cooperative F = Federal I = Industrial M = Municipal and other non-federal P = Private utility R = Private nonutility)
mdash
9 OwnerName Text Name of project owner mdash
10 Capacity Number Potential capacity at undeveloped sites or sites without power or potential additional capacity at sites with power
MW
11 UnitType Text Type of unit (C = Conventional R = Reversible Z = Missing) mdash
12 PlantType Text Type of Plant (CMB = Combined conventional and reversible units DIV = Gravity diversion (powerhouse on different stream) PDV = Pumped diversion (one-way pumped storage) PMP = Pure (recycled) pump storage RES = Reservoir only ROR = Run-of-river (dam lt= 10 ft high and minimal storage) RRG = Reregulating STG = Storage conventional hydro (dam gt 10 ft high with significant storage) TID = Tidal conventional hydro)
mdash
B-3
Field Number Field Name Type Description
Table B-1 (continued) Units
13 ProjectStatus Text Status of Project (DJ = Disclaimer of FERC jurisdiction EA = Exemption applied for FA = Federally authorized FR = Federally recommended LE = License exemption LJ = Lack of FERC jurisdiction MA = FERC major license application MO = FERC license outstanding NA = FERC minor license application (lt15 kW) NO = FERC minor license outstanding (lt15 kW) PA = FERC preliminary permit application PO = FERC preliminary permit outstanding XX = No status YO = FERC minor part license outstanding ZZ = Missing)
mdash
14 BasinName Text River basin name mdash
15 CountyName Text County where the project is located mdash
16 DamStatus Text Status of Dam (W = With Power WO = Without Power U = Undeveloped)
mdash
17 WSProtection Text WildScenic Protection mdash
18 WSTributary Text WildScenic Tributary or UpstreamDownstream WildScenic Location (YNltblankgt)
mdash
19 Cultural Text Cultural Value (YNltblankgt) mdash
20 Fish Text Fish Value (YNltblankgt) mdash
21 Geological Text Geological Value (YNltblankgt) mdash
22 Historical Text Historical Value (YNltblankgt) mdash
23 Other Text Other criteria such as rare wetland communities and wilderness designation
mdash
24 Recreation Text Recreation Value (YNltblankgt) mdash
25 Scenic Text Scenic Value (YNltblankgt) mdash
26 Wildlife Text Wildlife Value (YNltblankgt) mdash
27 TEW Text ThreatenedEndangered Wildlife (YNltblankgt) mdash
28 TEF Text ThreatenedEndangered Fish (YNltblankgt) mdash
29 FLC103 Text Federal Land Code 103 (National Park Monument Lakeshore Parkway Battlefield or Recreation Area) (YNltblankgt)
mdash
30 FLC104 Text Federal Land Code 104 (National Forest or Grassland) (YNltblankgt)
mdash
31 FLC105 Text Federal Land Code 105 (National Wildlife Refuge Game Preserve or Fish Hatchery) (YNltblankgt)
mdash
32 FLC106 Text Federal Land Code 106 (National Scenic Waterway or Wilderness Area) (YNltblankgt)
mdash
33 FLC107 Text Federal Land Code 107(Indian Reservation) (YNltblankgt) mdash
34 FLC108 Text Federal Land Code 108 (Military Reservation) (YNltblankgt) mdash
35 FLC198 Text Federal Land Code 198 (Not On Federal Land) (YNltblankgt) mdash
36 SiteProb Number Project Environmental Suitability Factor (010 = Development prohibited or highly unlikely 025 = Major reduction in likelihood of development 050 = Likelihood of development reduced by half 075 = Minor reduction in likelihood of development 090 = Little effect on likelihood of development)
mdash
37 LicensingCost Number Total Licensing Cost $K
38 ConstructionCost Number Total Construction Cost $K
39 OvrNiteDevCost Number Overnight Development Cost ( LicensingCost + ConstructionCost ) $K
40 MitHist_Arch Number 30 year Archaeological and Historical mitigation cost (applicable if either Cultural or Historical fields are Y )
$K
41 MitFish_Wildlife Number 30 year fish and wildlife mitigation cost (applicable if any of the Fish Wildlife or TEW fields are Y )
$K
42 MitScenic_Rec Number 30 year scenic and recreation mitigation cost (applicable if either Recreation or Scenic fields are Y )
$K
B-4
Field Number Field Name Type Description
Table B-1 (continued) Units
43 MitWaterMonitor Number 30 year water quality monitoring cost $K
44 MitFishPassage Number 30 year fish passage cost (applicable if TEF field is Y ) $K
45 MitTotal Number Total Mitigation Cost ( Sum of MitHist_Arch MitFish_Wildlife MitScenic_Rec MitWaterMonitor and MitFishPassage )
$K
46 TotalDevCost Number Total Development Cost ( OvrNiteDevCost + MitTotal ) $K
47 UnitTotalDevCost Number Total Development Unit Cost $kW
48 FixedOM Number Average Annual Fixed OampM $K
49 UnitFixedOM Number Average Annual Fixed OampM Unit Cost $kW
50 VariableOM Number Average Annual Variable OampM $K
51 UnitVariableOM Number Average Annual Variable OampM Unit Cost MillskWh
52 FERCAnnChrg Number FERC Annual Charge (applicable if Capacity gt= 15 MW ) $K
53 PFAnnual Number Average Annual Plant Factor -
54 PFJan Number Average January Plant Factor -
55 PFFeb Number Average February Plant Factor -
56 PFMar Number Average March Plant Factor -
57 PFApr Number Average April Plant Factor -
58 PFMay Number Average May Plant Factor -
59 PFJun Number Average June Plant Factor -
60 PFJul Number Average July Plant Factor -
61 PFAug Number Average August Plant Factor -
62 PFSept Number Average September Plant Factor -
63 PFOct Number Average October Plant Factor -
64 PFNov Number Average November Plant Factor -
65 PFDec Number Average December Plant Factor -
66 GenAnnual Number Average Annual Generation MWh
67 GenJan Number Average January Generation MWh
68 GenFeb Number Average February Generation MWh
69 GenMar Number Average March Generation MWh
70 GenApr Number Average April Generation MWh
71 GenMay Number Average May Generation MWh
72 GenJun Number Average June Generation MWh
73 GenJul Number Average July Generation MWh
74 GenAug Number Average August Generation MWh
75 GenSept Number Average September Generation MWh
76 GenOct Number Average October Generation MWh
77 GenNov Number Average November Generation MWh
78 GenDec Number Average December Generation MWh
Special field values NA Value not available in source data
Value removed due to homeland security concerns
B-5
- ABSTRACT
- EXECUTIVE SUMMARY
- ACKNOWLEDGMENTS
- ACRONYMS
- NOMENCLATURE
- INTRODUCTION
- TECHNICAL APPROACH
-
- Cost Estimating Tools for Plant Development or Expansion
-
- Data Sources
- General Method
- Data Screening
- Accounting for Cost Variations by Type of Site
-
- Cost Estimating Tools for Plant Operation and Maintenance
- Cost Estimating Tools for Turbine and Generator Upgrade
- Estimating Plant Electric Generation
- FERC Annual Charge
- Application of Estimating Tools to Hydropower Resources
-
- RESULTS
-
- Cost Estimating Tools for Plant Development or Expansion
- Cost Estimating Tools for Plant Operation and Maintenance
- Cost Estimating Tools for Turbine and Generator Upgrade
- Estimating Plant Electric Generation
- Estimated Economic Parameters for Hydropower Resources
- Likelihood of Development
-
- CONCLUSIONS AND RECOMMENDATIONS
- REFERENCES
-
- B1IHRED Data Dictionary
- B2IHRED
-
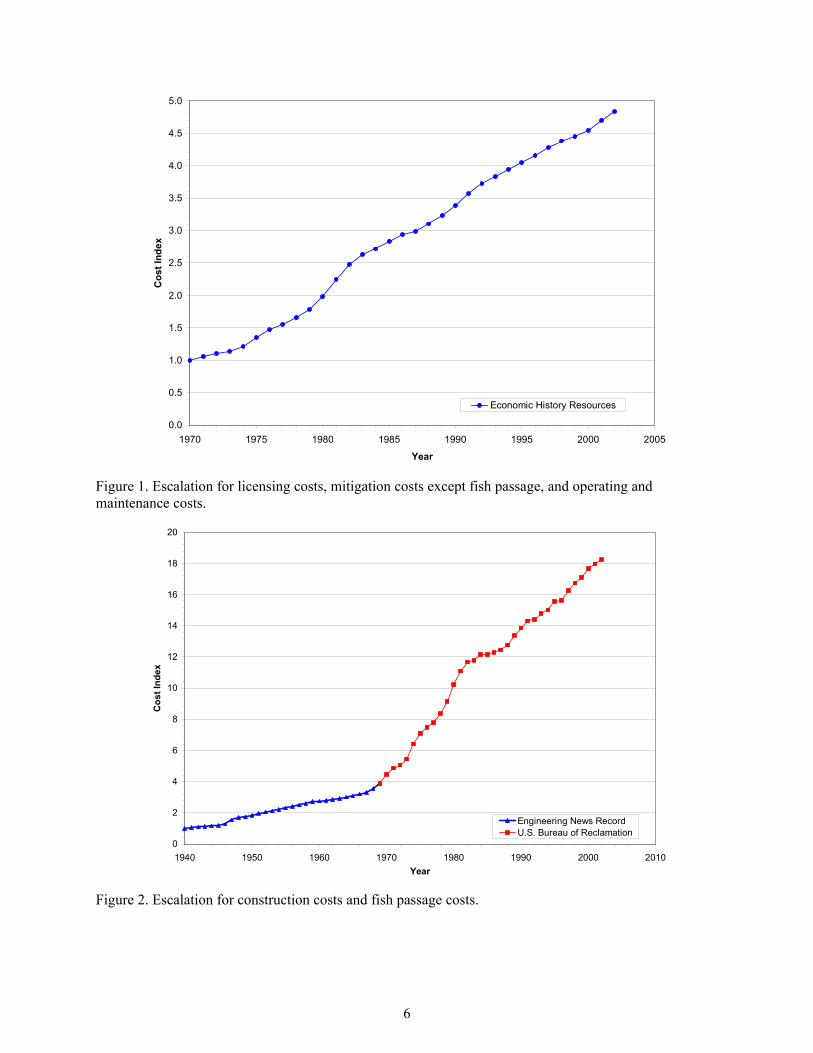
50
45
40
35
30
25
20
15
10
05
00
Economic History Resources
Cos
t Ind
ex
1970 1975 1980 1985 1990 1995 2000 2005
Year
Figure 1 Escalation for licensing costs mitigation costs except fish passage and operating and maintenance costs
20
18
16
14
12
Engineering News Record US Bureau of Reclamation
1940 1950 1960 1970 1980 1990 2000 2010 Year
Cos
t Ind
ex
10
8
6
4
2
0
Figure 2 Escalation for construction costs and fish passage costs
6
3 Any construction cost less than $700kW or greater than $5000kW was considered to be atypical and was not used (9 of plants removed)
4 A history of construction cost for a specific plant that decreased rather than increased in successive years was reviewed to select the most realistic value or marked as unusable if a best value could not be identified (1 of plants removed)
The data screening process prior to determining the construction cost estimating tools for power house addition to a dam or expansion of a hydroelectric plant was the same except for the zero data screen If either the cost for ldquostructures and improvementsrdquo or the cost for ldquoequipmentrdquo was zero the record was considered to be unusable Most of the plants removed by screening were removed because they were constructed prior to 1940 (80 of plants removed) The zero cost criteria and the unit cost criteria accounted for 10 and 9 of the plants removed respectively with an additional 1 of the plants removed being the result of difficult to interpret cost trends
Data screening resulted in data for 267 plants being used to determine the construction cost estimating tool for undeveloped sites Screening also resulted in data for 214 plants being used to determine the construction cost estimating tool for power house addition and plant expansion Since the construction cost values for a given plant were reported as a cumulative cost and therefore increased each year the actual cost data point for a specific plant was the construction cost value for the earliest year in the dataset in nearly all cases
214 Accounting for Cost Variations byType of Site
The cost data for licensing fish and wildlife mitigation recreation mitigation historical and archeological mitigation and water quality monitoring were taken from environmental assessment and relicensing documents for existing hydroelectric plants rather than from new FERC license applications Since these costs would be higher for new development it was decided to include a premium for these costs associated with undeveloped sites and dams without power It was
reasoned that these costs for dams without power would be higher than for existing hydroelectric plants (dams with power) and would be higher still for undeveloped sites
These premiums were defined by taking the upper bound of envelopes that encompassed two-thirds or 98 of the data points in analogy to plus or minus one and two sigma bands The upper and lower bounds of each envelope were determined by selecting values of a data band parameter δ such that the curves defined by (1 plusmn δ) times the regression curve equation encompassed either two-thirds or 98 of the data points A different value of δ was used to encompass the designated fraction of the points above the regression curve than was used to encompass this fraction of points below the curve
For licensing and the four types of mitigation the regression curve itself was used as the estimating tool for a plant expansion The 67 upper bound [(1+δ67UB) times the regression curve equation] was used as the estimating tool for addition of a powerhouse to a dam without power The 98 upper bound [(1+δ98UB) times the regression curve equation] was used as the estimating tool for an undeveloped site
No premium for fish passage cost was used This is because it was judged that the installation cost of fish passage would not be affected by the extent of previous development at the site Fish passage was thus treated as an incremental cost in all cases rather than as an integrated cost that would differ depending on the type of site at which it was installed
A bounding curve was also used at the estimating tool for estimating the construction cost of a plant expansion Because the available data were the costs associated with the addition of a powerhouse it was judged that these costs were too high when estimating the cost of a plant expansion For this reason the equation for the 67 lower bound of the cost data for construction of a powerhouse [(1-δ67LB) times the regression curve equation] was used as the estimating equation for the construction cost of a plant expansion
7
22 Cost Estimating Tools forPlant Operation andMaintenance
Separate cost estimating tools were developed for fixed and variable OampM costs The data on which these tools were based was EIA data (EIA 2003a) for the period 1990 through 2001 The following costs were considered to be fixed OampM costs
bull Operation supervision and engineering
bull Maintenance supervision and engineering
bull Maintenance of structures
bull Maintenance of reservoirs dams and waterways
bull Maintenance of electric plant
bull Maintenance of miscellaneous hydraulic plant
In contrast the following costs were considered to be variable OampM costs
bull Water for power
bull Hydraulic expenses
bull Electric expenses
bull Miscellaneous hydraulic power expenses
bull Rents
Prior to performing the process to determine the cost estimating tool screening operations were performed on the dataset Of the 909 plants represented in the dataset 90 were eliminated by one or more of the following three criteria
1 Capacity less than 1 MW
2 Capacity greater than 1300 MW
3 Pumped storage plant
For the fixed OampM cost estimating tool the following data screens were made
1 Any record containing a zero or negative value for any of the fixed OampM component costs listed above or zero electicity generation was
considered to be unusable (93 of plants removed)
2 Any record containing a total fixed OampM cost that was less than 05 millskW-h or greater than 55 millskW-h was considered to be unusable (7 of plants removed)
Plants for which there was more than one capacity listed were treated as separate plants at the respective capacities
For the variable OampM cost estimating tool the following data screens were made
1 Any record containing a negative value for any of the variable OampM component costs listed above was considered to be unusable (1 of plants removed)
2 Any record containing zero values for all the variable OampM component costs listed above except water for power was considered to be unusable (78 of plants removed)
3 Any record containing a total variable OampM cost that was less than 15 millskW-h or greater than 80 millskW-h was considered to be unusable (21 of plants removed)
Plants for which there was more than one capacity listed were treated as separate plants at the respective capacities
These screening operations resulted in significant reductions in the numbers of plants that actually contributed to the determination of the estimating tools Of the original 819 plants of interest data for 384 plants was used to determine the fixed OampM cost estimating tool while data for 421 plants was used to determine the variable OampM cost estimating tool Because some plants had more than one capacity listed for the same plant 474 data points were used to determine the fixed OampM cost estimating tool and 501 data points were used to determine the variable OampM cost estimating tool
Both of the OampM cost estimating tools were determined using a process similar to that described above for development costs
8
(1) escalating costs to 2002 dollars using the escalation data shown in Figure 1 (2) time averaging the data for each plant-capacity combination to obtain an average annual cost (3) plotting the average values as a function of plant capacity or added capacity and (4) performing a least squares curve fit to determine the equation to be used as the estimating tool
23 Cost Estimating Tools forTurbine and Generator Upgrade
The cost estimating tools for upgrading three types of turbines Francis Kaplan and bulb were produced using data from EPRI 1989 Cost data points were taken from working plots of cost as a
function of hydraulic head for various plant capacities These costs were escalated to 2002 dollars using the cost escalation data in the third column of Table 2 which is shown graphically in Figure 3 (USBR 2002) Iterative analysis was performed on the data for each type of turbine to obtain a mathematical expression of cost as a function of capacity and hydraulic head that closely matched the escalated data
The cost estimating tool for upgrading generators is based on data obtained from a hydropower industry source (Hunt 2003) These data are in the form of generator cost as a function of rotational speed for various capacities Iterative analysis was performed on the data to obtain a mathematical expression of cost as a function of capacity and rotational speed that closely matched the data
Cos
t Ind
ex
3
25
2
15
1
05
0
US Bureau of Reclamation
1977 1982 1987 1992 1997 2002 Year
Figure 3 Escalation for turbine replacement costs
9
24 Estimating Plant ElectricGeneration
The EIA provided both annual and monthly plant generation data for the period 1970 through 2000 (EIA 2003b) The generation data were converted to plant factors (PF) using the equation
GenerationTimePeriod(MW minus h)PFTime Period = Capacity(MW) x Time(hours)
where
Time = annual or monthly hours
The plant factor data were grouped by the state in which the plant is located The plant factors for each time period (Annual January February etc) associated with each state regardless of year or location of occurrence were used to obtain an unweighted average plant factor for each time period for each state Annual plant factors less than 025 or greater than 085 were judged to be unrealistic and were not included in the average
The plant factors for a given state were used to estimate either the total or incremental (for plant expansions) potential generation of hydropower resource sites within the state using the inverse of the above equation
GStateTime Period = (PFState Time Period) lowast(C)lowast(Time)
where
GState Time Period = generation during a specified time period in MW-h
PFStateTime Period = average state plant factor for a specified period of time
C = plant capacity or added capacity in MW
Time = time period in hours
25 FERC Annual Charge For plants with a capacity greater than
15 MW FERC charges plant owners an annual fee based on plant capacity and annual generation (FERC 1999) In order to have a complete estimate of plant costs the following formula was applied once the plant annual generation or added generation was estimated as described in the previous section
Cost (2002$) = (017238 G ) + (153227 C )
where
G = annual generation in MW-h
C = capacity in kW
26 Application of Estimating Tools to Hydropower Resources
The cost and generation estimating tools that were developed as described above were applied to the hydropower resources identified in the resource assessment reported in Connor et al 1998 Characteristic information about the hydropower resources was assembled in the HES database (Francfort et al 2002) The database was screened to identify sites to which the estimating tools were applicable using the following criteria to identify nonapplicable sites
bull Sites having capacity potentials less than 1 MW
bull Sites that were excluded from development by federal statutes and policies
bull Sites that were excluded from development by state and municipal statutes and policies
bull Sites that have been developed since the assessment was performed
bull Sites that are pumped storage plants
10
Sites that were excluded from development by federal statutes and policies were identified by using geographic information system (GIS) tools to intersect the geographic location of resources in the HES database with a GIS data layer containing all federally excluded areas including
bull National battlefields
bull National historic parks
bull National parks
bull National parkways
bull National monuments
bull National preserves
bull National wildlife refuges
bull Wildlife management areas
bull National wilderness areas
bull Wild and scenic rivers
Dams w Power 164 8
The HES database also contained information about whether the resource is sited at the upstream or downstream end of a wild and scenic stream reach (W_S_PROT) or on a tributary (W_S_TRIB) of a stream designated as wild and scenic It also contained information about whether a site is located in a federally designated exclusion zone FED103_C and FED106_C Those sites that were designated as meeting any of these criteria or were identified as being in an exclusion zone via the use of the GIS layer were eliminated from the list of resources to which the estimating tools were applied
Of the 5677 resources in the HES database 3522 were found to be unsuitable for application of the estimating tools for one or more of the reasons stated above leaving 2155 applicable sites Figure 4 shows the distribution of the resources in the HES database based on the applicability of the estimating tools and the various reasons for nonapplicability (Applicable sites are designated as ldquoIHRED sitesrdquo) Most of sites (2311 sites or 41) were eliminated because they had a capacity of less than 1 MW
Undeveloped Sites 965
Dams wo 45 Power 1026 48
IHRED Sites IHRED Sites Capacity 2155 2155 lt 1MW 38 2311 41
Pumped Storage Sites
3 Excluded Sites 01 Developed 1189
Sites 2119 HES Sites 03 5766
Figure 4 Distribution of the hydropower resource sites in the HES database based on numbers of sites
11
A counterpart to the distribution shown in cost of water quality monitoring was estimated for Figure 4 in terms of the total amount of power all sites represented by applicable resources and the various classes of nonapplicable resources is The basic site characteristic data from the HES shown in Figure 5 This figure shows that while database was combined with the cost and the resources having a capacity of 1 MW or less generation data produced using the estimating represented 41 of the HES sites in number they tools to create a new database named the INEEL collectively represented only 1 of the total Hydropower Resource Economics Database capacity of all the sites in the HES database (IHRED) Because the HES database did not
identify plants that could be upgraded by installing The cost estimating tools were applied to the new turbines or generators the tools for estimating
applicable sites in the HES database based on the these costs were not applied to any of the listed capacity of the site The potential generation resources listed in the database (annual and monthly) of the resource was estimated using the average plant factors for the state in which The distribution of the 2511 sites in the the resource is located The application of the IHRED in terms of the types of sites is shown in mitigation cost estimating tools was dependent on Figure 4 Of these sites the sites that were either site characteristics in the HES database The cost of totally undeveloped or were a dam without a fish and wildlife mitigation was estimated if any of hydroelectric installation represented 45 and 48 the FISH_C WILDLF_C or T_E_W_C (indicates of the applicable sites respectively Sites with the presence of threatened or endangered wildlife) hydroelectric installations that could be expanded fields contained a ldquoYrdquo value The cost of recreation were 8 of the applicable sites mitigation was estimated if either of the following
Viewed from a total capacity perspective parameters had a ldquoYrdquo value REC_C or SCENIC_C Figure 5 shows a nearly equal portion for totally The cost of historical and archeological mitigation undeveloped sites and dams without a was estimated if either of the following parameters hydroelectric installation being 40 and 48 of the had a ldquoYrdquo value CULTUR_C or HISTORY_C The total capacity of the IHRED sites respectively cost of fish passage mitigation was estimated if the Sites with hydroelectric installations that could beT_E_F_C parameter (indicates the presence of expanded represent 11 of the total capacity threatened or endangered fish) had a ldquoYrdquo value The
Dams w Power 4917 MW
11 Undeveloped Sites
17369 MW Capacity lt 40
1MW Dams wo 743 MW Excluded Sites Power 120749 MW 24619 MW 48 36
IHRED Sites 43036 MW
Developed IHRED Sites Sites 43036 MW Pumped 291 MW
62 Storage Sites 04 321 MW
05 HES Sites 69009 MW
Figure 5 Distribution of hydropower resource sites in the HES database based on total capacity
12
3 RESULTS
The technical approach to developing cost and generation estimating was executed using the various sources of historical data listed in Table 1 The resulting tools for estimation are described in this section The application of these tools to applicable hydropower resources in the HES database that resulted in the production of the IHRED is also described
31 Cost Estimating Tools forPlant Development orExpansion
The historical data for licensing costs construction costs and five types of mitigation costs were found to correlate well with plant capacity or added capacity Plots of the basic data that were used to develop each cost estimating tool are presented in Appendix A along with the resulting regression curve and data bands encompassing 67 and 98 of the data points In addition the population of each basic dataset based on capacity ranges accompanies each basic plot in the appendix These distribution charts are accompanied by a thumbnail plot listing the minimum and maximum values of cost and capacity included in the dataset
A least squares curve fit showed that a power curve best represented the data in each dataset The equation for each cost estimating tool is listed in Table 3 which gives the coefficient and exponent for the power curve the data band parameter values and the R2 value indicating the goodness of the fit The equations of the upper and lower bounds of the data band encompass either 67 or 98 of the data points They are the same as the basic curve fit equation except the coefficient is multiplied by (1 + δxUB) for the upper bound or multiplied by (1 - δxLB) for the lower bound where x is either 67 or 98 No value is listed for the data band parameter and no R2 is listed in the table for tools that are the upper or lower bound of a dataset
In order to gain confidence that cost has a power law relationship with capacity for each of
the elements of development costs tests of significance were performed on the exponents in each of the cost estimating equations These tests showed that the exponents are statistically significantly different than zero with greater than 99 confidence providing confidence that cost increases with capacity rather than there being a significant probability that cost does not vary with capacity (exponent equals zero) The values of the t statistic for each of the exponents is compared with the t statistic value for a one-tailed 999 significance test in Table 4
32 Cost Estimating Tools forPlant Operation andMaintenance
The historical data for fixed and variable OampM costs were also found to correlate well with plant capacity or added capacity Plots of the basic data that were used to develop each cost estimating tool are presented in Appendix A along with the resulting regression curve and data bands encompassing 67 of the data points In addition the population of each basic dataset based on capacity ranges along with a thumbnail plot listing the minimum and maximum values of cost and capacity included in the dataset accompanies each basic plot in the appendix
A least squares curve fit showed that a power curve best represented the data in each dataset The equation for each cost estimating tool is listed in Table 5 which gives the coefficient and exponent for the power curve the data band parameter values and the R2 value indicating the goodness of the fit
The results of tests of significance on the exponents of the two OampM cost estimating tools are presented in Table 6 These results show with greater than 999 confidence that cost increases with capacity
13
14
Table 3 Cost estimating equations for licensing construction and five types of mitigation
Cost (2002$) = A lowast [Capacity (MW)] B
Estimating Tool Application Coefficient
(A) Exponent
(B)
Data Band Parameter
(δ98UB)
Data Band Parameter
(δ67UB)
Data Band Parameter
(δ67LB)
Data Band Parameter
(δ98LB) R2
Licensing - Undeveloped Sites 61E+05 070 - - - - NA
Licensing - Dams wo Power 31E+05 070 - - - - NA
Licensing ndash Dams w Power 21E+05 070 190 46 39 63 074
Construction - Undeveloped Sites 33E+06 090 126 49 35 67 081
Construction - Dams wo Power 22E+06 081 250 67 38 74 074
Construction - Dams w Power 14E+06 081 - - - - NA
Fish amp Wildlife Mitigation - Undeveloped Sites 31E+05 096 - - - - NA
Fish amp Wildlife Mitigation - Dams wo Power 20E+05 096 - - - - NA
Fish amp Wildlife Mitigation - Dams w Power 83E+04 096 278 138 39 77 070
Recreation Mitigation - Undeveloped Sites 24E+05 097 - - - - NA
Recreation Mitigation - Dams wo Power 17E+05 097 - - - - NA
Recreation Mitigation - Dams w wo Power 63E+04 097 282 166 54 92 087
Historical amp Archeological Mitigation - Undeveloped Sites 10E+05 072 - - - - NA
Historical amp Archeological Mitigation - Dams wo Power 85E+04 072 - - - - NA
Historical amp Archeological Mitigation - Dams w wo Power 63E+04 072 65 35 43 50 094
Water Quality Monitoring - Undeveloped Sites 40E+05 044 - - - - NA
Water Quality Monitoring - Dams wo Power 20E+05 044 - - - - NA
Water Quality Monitoring - Dams w wo Power 7E+04 044 513 213 59 93 056
Fish Passage Mitigation 13E+06 056 79 09 18 31 099
Table 4 Significance test results for development cost estimating equation exponents Estimating Tool Exponent Standard
Error t Statistic Value t (ν 0001)
Licensing ndash Dams wo Power 02806 24854 3142 Construction ndash Undeveloped Sites 01781 50378 3121 Construction ndash Dams wo Power 02706 29825 3127 Fish amp Wildlife Mitigation 05587 17142 3207 Recreation Mitigation 06534 14835 3175 Hist amp Arch Mitigation 05753 12440 3552 Water Quality Mitigation 07837 5559 3187 Fish Passage Mitigation 03827 14571 4501
Table 5 Cost estimating equations for fixed and variable operation and maintenance
Cost (2002$) = A lowast [Capacity (MW)] B
Estimating Tool Application Coefficient
(A) Exponent
(B)
Data Band Parameter
(δ98UB)
Data Band Parameter
(δ67UB)
Data Band Parameter
(δ67LB)
Data Band Parameter
(δ98LB) R2
Fixed Operation and Maintenance 24E4 075 192 67 46 74 060
Variable Operation and Maintenance 24E4 080 255 77 39 74 067
Table 6 Significance test results for OampM cost estimating equation exponents Estimating Tool Exponent Standard
Error t Statistic Value t (ν 0001)
Fixed Operation and Maintenance 02127 35400 3108
Variable Operation and Maintenance 02198 36295 3107
Table 7 Cost estimating equations for turbine and generator upgrades
Turbines Cost (2002$) = A lowast [Capacity (MW)] B lowast [Head(ft)] C
Estimating Tool Application Coefficient (A)
Exponent(B)
Exponent(C)
Francis Turbines 3E6 071 -042 Kaplan Turbines 4E6 072 -038 Bulb Turbines 6E6 086 -063
Generators Cost (2002$) = A lowast [Capacity (MW)] B lowast [Speed(rpm)] C
Generators 3E6 065 -038
15
33 Cost Estimating Tools forTurbine and Generator Upgrade
Development of the cost estimating tools for turbine and generator upgrades resulted in power equations in which the coefficient is a function of the capacity of the turbine or generator being replaced The equations for these tools are listed in Table 7 The tools are shown graphically in Appendix A
34 Estimating Plant ElectricGeneration
Annual and monthly plant factors were determined for each state The resulting plant factors are listed in Table 8
35 Estimated Economic Parameters for Hydropower Resources
The development and OampM cost estimating tools listed in Tables 3 and 5 and the plant factors listed in Table 8 were applied to 2155 US hydropower resources from the HES database to build the IHRED Resource characteristic data in the HES database were retained in the IHRED and cost and generation data were added to assemble the 78 fields of data for each resource The IHRED data dictionary which provides field names and descriptions is listed in Appendix B The database in Excel format is provided on a compact disk as part of Appendix B and is included in a pocket on the back cover of this document
The distribution of the hydropower resources in the IHRED which is based on the number of resources having capacities or capacity additions within various capacity ranges is shown in Figure 6 This figure shows that 1461 of the 2155 resources in the IHRED (68) had capacities or capacity additions in the 1 to 10 MW range Ninety-two percent of the resources had capacities or capacity additions of 50 MW or less A comparison of Figure 6 with similar distributions for the data populations on which the cost estimating tools are based (Appendix A) reveals that the distributions are similar Thus the vast majority of cost estimates that were made for
resources in the IHRED were based on historical data from plants in the same capacity range
A related distribution of the IHRED resources is shown in Figure 7 In this figure the total capacity represented by the resources having capacities or capacity additions in each capacity range is shown This figure shows that the 1461 resources (68 of the sites) having capacities or capacity additions in the 1 to 10 MW range represent only 12 of the total 43036 MW of the IHRED resources The 92 of the IHRED resources having capacities or capacity additions of 50 MW or less constitute 41 of the total capacity of the resources Another 44 of the total capacity is contributed by resources having capacities or capacity additions of 100 MW or greater with 24 of the total capacity being contributed by the 21 sites having capacities or added capacities greater than 250 MW
All the cost estimating tools are based on data populations that include data for plants having capacities greater than 100 MW But the number of points is less than at the other end of the capacity scale The data populations on which construction and OampM cost estimating tools are based have the best representations at the high end of the capacity range The thumbnail plot on each of the source data distributions in Appendix A provides the minimum and maximum capacity and cost of the source data
The distributions of the IHRED sites which are given in capacity ranges in Figures 6 and 7 are presented in ranges of unit development cost in Figures 8 and 9 Unit development cost is the sum of the estimated costs of licensing construction and any required mitigation divided by the capacity or added capacity of the site The distribution of the number of undeveloped sites that could be developed for various unit costs is shown by the blue bar segments in Figure 8 This is an approximately symmetric distribution with the maximum number of this type of site being developed for $3500 to $4000 per kW Likewise the distribution of dams without power sites shown by the red bar segments is approximately symmetric with the maximum number of this type of site being developed for $2000 to $2500 per kW The distribution of the dams with power or plant expansions shown by the white bar segments is also approximately symmetric with the
16
17
Table 8 Annual and monthly plant factors by state State
ALASKA Abbr AK
Annual05021
January 04876
February 04819
March 04512
April 04547
May 04767
June 05393
July 05500
August 05350
September 05119
October 05255
November 05183
December 04913
ALABAMA AL 04378 06489 06718 06707 05330 04145 03464 03093 02818 02485 02686 03642 05108 ARKANSAS AR 04208 04725 05037 05317 05319 04773 04441 04069 03438 02760 02717 03322 04630 ARIZONA AZ 04860 03438 03812 04679 05759 05943 06538 06510 06250 04859 03570 03379 03511 CALIFORNIA CA 05487 04931 05327 05935 06149 06462 06396 06067 05779 05142 04476 04422 04748 COLORADO CO 04946 04514 04430 04233 04226 05743 06686 06528 05547 04983 04259 03858 04290 CONNECTICUT CT 04672 05576 06018 07414 07574 06209 03994 02340 01927 01878 03089 04478 05670 FLORIDA FL 04316 04622 05304 05875 05232 03985 04180 04397 04674 03660 02626 03277 04030 GEORGIA GA 04378 05166 05343 05414 05251 04563 04142 03752 03788 03340 03446 03925 04472 HAWAII HI 06111 05876 05655 06429 07861 07110 05799 05666 05572 05183 05620 06526 06015 IOWA IA 05549 04745 05169 06212 06221 06163 05996 05680 05218 05017 04851 05738 05565 IDAHO ID 06037 06042 05955 06129 06402 06619 06675 06262 05837 05647 05354 05586 05930 ILLINOIS IL 05145 04649 04862 04980 04980 04978 05105 05266 05439 05318 05346 05672 05139 INDIANA IN 04982 04985 05219 05715 06232 06107 05497 04458 03833 03837 03846 04792 05306 KANSAS KS 04083 03470 03956 04382 03919 04057 03933 03869 04029 04389 03806 04579 04616 KENTUCKY KY 05309 05786 05401 04974 04948 05522 05652 05533 05207 04826 04841 05352 05655 LOUISIANA LA 04208 04725 05037 05317 05319 04773 04441 04069 03438 02760 02717 03322 04630 MASSACHUSETTS MA 04840 05478 05567 06323 06284 05800 04386 03254 03251 03094 04032 05011 05646 MARYLAND MD 04251 04507 05409 07230 07349 05427 03296 02448 01753 01898 02650 03911 05232 MAINE ME 05824 05815 05975 06618 07114 07023 06119 04918 04448 04603 05273 06001 06007 MICHIGAN MI 04830 04720 04842 05523 06556 05808 04896 03977 03633 03905 04260 04820 05052 MINNESOTA MN 06054 05247 05346 05927 07256 07216 06882 06184 04920 05275 05755 06720 05914 MISSISSIPPI MS 04208 04725 05037 05317 05319 04773 04441 04069 03438 02760 02717 03322 04630 MISSOURI MO 04107 04300 04663 05651 05668 04890 04205 03607 03186 02658 02633 03550 04321 MONTANA MT 06114 06125 05951 05761 06088 06463 07059 06616 05897 05570 05768 06111 05960 NORTH CAROLINA NC 04555 05545 05772 05896 05321 04863 04410 03768 03824 03448 03427 03763 04699 NORTH DAKOTA ND 05474 06104 06300 04981 04679 05173 05854 06091 06104 05267 04856 05110 05220 NEBRASKA NE 04700 03989 04822 05014 05072 04905 05113 05273 04948 04362 04526 04515 03880 NEW HAMPSHIRE NH 05524 05381 05579 06556 07584 07165 05561 04081 03811 03725 04937 06042 05896 NEW JERSEY NJ 03310 03245 03719 05082 04571 04178 03115 02431 01707 02596 02882 02858 03372 NEW MEXICO NM 04796 03652 03899 05137 06029 05825 05497 05551 04771 04776 04424 03806 04131 NEVADA NV 05410 04312 04996 05414 06409 06542 06103 05931 05794 05529 04979 04317 04580 NEW YORK NY 05354 05519 05667 06301 07009 06425 05094 04088 03700 03933 04763 05768 06027 OHIO OH 04681 04524 04352 04403 05141 05315 05319 05082 04268 04148 04245 04465 04886 OKLAHOMA OK 04605 04242 04525 05970 06085 06262 06424 04826 03137 02581 02561 04078 04585 OREGON OR 05669 06551 06488 06478 06274 06254 05721 04558 04211 04494 04733 05784 06552 PENNSYLVANIA PA 04995 05224 05609 06931 07016 06139 05045 03931 02977 02932 03548 04727 05910 RHODE ISLAND RI 03052 03785 06043 06396 05104 03676 01644 00979 00524 00636 00841 02574 04636 SOUTH CAROLINA SC 04691 05875 06200 06191 05735 05103 04485 03623 03585 03227 03528 03978 04860 SOUTH DAKOTA SD 05064 03835 03532 03836 04706 05240 05707 06291 06546 06319 05656 05056 03952 TENNESSEE TN 05055 06158 06057 05671 04868 04611 04836 04749 05038 04437 04252 04553 05475 TEXAS TX 05053 04893 05144 05404 05441 05814 06325 05176 04754 04607 04309 04480 04318 UTAH UT 05127 03949 04286 04481 05577 06849 06833 06088 05760 05077 04278 04163 04139 VIRGINIA VA 04429 05144 05783 06306 06127 05781 04653 03381 02961 02692 02818 03381 04221 VERMONT VT 04976 04905 04974 05767 07418 06618 04687 03192 03051 03268 04570 05739 05567 WASHINGTON WA 05312 06069 06096 05597 05488 05795 05959 05084 04000 04007 04256 05385 06066 WISCONSIN WI 05559 04863 04944 05931 07286 06675 05861 04837 04526 05042 05359 05968 05423 WEST VIRGINIA WV 05609 06136 06743 07019 07047 06851 05880 04774 04265 03806 03920 04944 06009 WYOMING WY 05034 04149 04053 04354 05054 05789 06720 06922 06361 04867 03983 03997 04081
Louisiana and Mississippi values were estimated using Arkansas plant factors
1 to 1
0
10 to
20
20 to
30
30 to
40
40 to
50
50 to
60
60 to
70
70 to
80
80 to
90
90 to
100
100 t
o 150
15
0 to 2
00
200 t
o 250
gt250
18
1750
1500
1250
1000
750
Total No of Sites = 2155
21 10
6 03
18 08
29 13
12 06
14 06
17 08
18 08
35 16
53 25
63 29
146 68
262 122
1461 678
W i th Po w e r W i th out Pow e r Unde vel o pe dN
o o
f Site
s
500
250
0
Capacity Range (MW)
Figure 6 Number of IHRED resources having capacities or capacity additions within various capacity ranges
1 to 1
0
10 to
20
20 to
30
30 to
40
40 to
50
50 to
60
60 to
70
70 to
80
80 to
90
90 to
100
100 t
o 150
15
0 to 2
00
200 t
o 250
gt250
C
apac
ity (M
W)
12500
10000
7500
5000
Total Capacity = 43036 MW
1422 33
3159 73
3622 84
1156 27
1214 28
1315 31
1195 28
1954 45
2465 572210
51
3654 85
3890 90
10554 245
5225 121
W i th P o w e r W i thou t Po w e r Und e v e lo ped
2500
0
Capacity Range (MW)
Figure 7 Total capacity of IHRED resources having capacities or capacity additions within various capacity ranges
19
0 to 5
00
500 t
o 100
0 10
00 to
150
0 15
00 to
200
0 20
00 to
250
0 25
00 to
300
0 30
00 to
350
0 35
00 to
400
0 40
00 to
450
0 45
00 to
500
0 50
00 to
550
0 55
00 to
600
0 60
00 to
650
0
20
100
0
Total No of Sites = 2155
1 00
58 0204
43 20
188 87
288 134 272
126
328 152
380 176
3 01
333 155
241 112
65 30
W i th Pow e r W i thout Pow e r Un de v e l o p e d
Unit Cost Range ($kW)
Figure 8 Number of IHRED resources having unit cost (total development) within various unit cost ranges
500
400
300
200No
of S
ites
0 to 5
00
5 00 t
o 100
0 10
00 to
15 0
0 15
00 to
200
0 20
00 to
250
0 25
00 to
300
0 30
00 to
35 0
0 35
00 to
400
0 40
00 to
450
0 45
00 to
50 0
0 50
00 to
55 0
0 55
00 to
600
0 60
00 to
650
0
21
12000
10000
8000
6000
4000
Total Capacity = 43036 MW 10860 252
8369 194
4185 97
1514 35
5516 128
7392 172
3483 81
1265 29
370 09 58
01 15
00 6
00 1
00
W i th P o w e r W i th out Po w e r Un dev el o pedC
apac
ity (M
W)
2000
0
Unit Cost Range ($kW)
Figure 9 Total capacity of IHRED resources having unit cost (total development) within various unit cost ranges
maximum number of this type of site being developed for $1000 to $1500 per kW These maximum points of the respective distributions shift downward in unit cost from the perspective of developing the maximum capacity as shown in Figure 9 The maximum total capacity from undeveloped sites is obtained for $2500 to $3000 per kW while the maximum total capacity is obtained from adding a powerhouse to dams without power for $500 to $1500 per kW The maximum total capacity from plant expansions is obtained for $500 to $1000 per kW Viewed as a whole the results indicate that over 20000 MW of capacity could be developed at unit costs of $1500 per kW or less
When considering new generating plants long-standing energy industry practice has been to use unit costs ($kW) of various facilities as a comparison tool to make development decisions While the unit cost parameter is a good indicator of total development costs using it alone for comparison with other technologies penalizes projects like hydroelectric facilities that have high initial costs long life no fuel costs and low operating costs
The chart showing amounts of capacity (MW) falling within various unit cost ranges (Figure 9) is presented for information as a relative cost indicator for the available hydropower resources analyzed in this study It is not intended to imply an endorsement of the unit cost method to compare various technologies and make development decisions
36 Likelihood of Development
In order to provide the IHRED user with some measure of the likelihood that a particular site will be developed the SITEPROB field and the associated values from the HES database were included in the IHRED as field number 36 This parameter ranges from 010 which indicates the least likely sites to be developed to 090 which indicates the most likely sites The researchers
reasoned that no site has a 0 probability of development just as no site can be predicted to have a 100 probability of development
As described in Francfort et al 2002 the value of the SITEPROB variable is a composite of the values of ldquosuitability factorsrdquo that were determined to apply to a site during the hydropower resource assessment reported in Connor et al 1998 Dependent upon the type of site (undeveloped dam wo power or dam w power) suitability factor values were assigned to each of 12 environmental attributes and seven federally designated land uses The suitability factor values (010 025 050 075 090) reflect a) the probability that the attribute or land use will make a project unacceptable prohibiting its development and b) the degree to which associated licensing and mitigation costs would reduce the economic viability of the project The lowest value indicates that the attribute would tend to prohibit development or make it highly unlikely and the highest value indicates that the attribute will have little effect on the likelihood of development The SITEPROB value is either the single lowest suitability factor associated with the site or the next lowest value when there is more than one occurrence of the lowest value
22
4 CONCLUSIONS AND RECOMMENDATIONS
Analysis of historical hydropower data has shown that the costs of licensing construction five types of mitigation and fixed and variable OampM costs correlate with plant capacity As a result least squares power curve fits of cost as a function of capacity were defined that have R2
values ranging from 056 to 099 These power equations can be used to estimate costs in 2002 dollars for hydropower resources including undeveloped sites addition of a power house to a dam and expansion of an existing hydroelectric plant Functional relationships were also developed that can be used to estimate the cost in 2002 dollars of upgrading three types of turbines (Francis Kaplan and bulb) and upgrading generators
In addition to the cost estimating tools a method for estimating resource annual and monthly electric generation was developed This method which is based on 30 years of generation data can be used to determine generation based on average generation values for the state in which the resource is located
The HES database that contains 5677 hydropower resources and has a total capacity of 69009 MW was evaluated and found to contain 2155 resources having a total capacity of 43036 MW to which the cost and generation estimating tools were applicable Application of the tools resulted in cost and generation data which was assembled to produce the IHRED that included these data and site characteristic information for each of the 2155 resources This database will be useful both in predicting future hydroelectric supply and as a preliminary indication of the feasibility of realizing the potential of hydropower resources
The estimated costs of developing the 2155 sites in the IHRED indicate that over 20000 MW of new capacity could be developed for $1500 per kW or less These sites are existing dams to which a powerhouse could be added or existing hydroelectric plants that could be expanded The development of undeveloped sites is significantly more expensive with a median unit cost of $2700 per kW While the unit cost is relatively high in
comparison with other technologies it should be considered that hydroelectric facilities offer attractive characteristics that offset the high initial cost such as long life no fuel costs and low operating costs as well as reliability dispatchability and peaking power supply among others
This study was constrained to use only data sources that were readily available generally in electronic form In addition questionable or incomplete data could not be evaluated and had to be treated as unusable The data populations on which the cost estimating tools are based could be expanded with greater research and the purchase of private data collections Some of the data that was not used because it appeared questionable or incomplete could possibly be used if it were further researched The larger data populations obtained from these efforts would refine the cost estimating tools
The majority of the estimating tools had R2
values in the 60 and 70 percentiles indicating significant scatter in the data Additional data may increase these R2 values However this scatter may be indicative of dependence on another variable or other variables in addition to plant capacity Alternate functional relationships that may better correlate the data should be investigated
A tool for estimating water quality mitigation could not be produced within the constraints of the study because of the limited data that was readily available and the lack of correlation with a single parameter like plant capacity Greater research would probably add additional data and may result in a method of estimating this parameter The estimating tool for the cost of water quality monitoring which had an R2 value of 056 would no doubt benefit from additional research Such research may well show that dependence on a single variable like plant capacity is not sufficient for estimating this cost
The tools that were developed for estimating the cost of upgrading turbines and generators could not be applied to specific sites to evaluate
23
the potential for capacity increase resulting from these types of upgrades An evaluation of US hydroelectric plants from the perspective of upgrade potential should be performed to create a counterpart to the IHRED containing plant characteristics the estimated cost of the plant upgrade estimated associated licensing and mitigation costs if any estimated incremental OampM costs and added capacity and generation
The method of estimating plant generation should be reviewed to determine whether a more mechanistic model can be developed Use of 30 years of historical data is a good first step but the resulting predictors could probably benefit from refinement based on climatic prediction models Also using state boundaries as the arbiter of what average plant factor applies to a particular location is probably not optimally accurate Plant factors based on hydrography would probably
provide better predictors This approach should be investigated
The present study produced a large volume of data associated with a significant number of hydropower resources It was not within the scope of the study to analyze this data extensively and draw conclusions or make recommendations based on such analysis Greater value could be obtained from the useful product that has been produced if the IHRED data were analyzed to determine the trends and patterns that they contain This analysis should be performed for the benefit of both those who will use the data for predicting future hydroelectric supply and those who are decision makers regarding hydropower development
24
5 REFERENCES
Connor A M J E Francfort B N Rinehart 1998 U S Hydropower Resource Assessment Final Report DOEID-104302 December 1998
Christensen J P 1986 Small Hydropower Development the Process Pitfalls and Experience Vol III DOEID12254-1 June 1986
EHR 2002 What was the Inflation Rate Then Economic History Resources httpwwwehnetehresourceshowmuchinfla tionphp December 5 2002
EIA 2003a Hydroelectric plant data for 1990 through 2000 dataset (FERC Form I Annual Report of Major Electric Utilities Licencees and Others) transmitted as an attachment to T Petersik (EIA) email to R T Hunt (INEEL) October 9 2002
EIA 2003b Hydroelectric plant generation data for 1970 through 2000 dataset (FERC Form I Annual Report of Major Electric Utilities Licencees and Others) transmitted as an attachment to M E Johnson (EIA) email to R T Hunt (INEEL) December 19 2002
ENR 2002 Building Cost Index History (1915ndash2002) Engineering News-Record httpenrconstructioncomcostcostbciasp August 14 2002
EPRI 1989 Hydropower Plant Modernization Guide Vol 1 Electric Power Research Institute GS-6419 July 1989 pp 5-76 through 5-78
EPRI 1995 Water Resource Management and Hydropower Guidebook for Collaboration and Public Involvement Electric Power Research Institute TR-104858 1995
FERC 1999 FERC Annual Charges Federal Energy Regulatory Commission telefax August 13 1999
FERC 2003 environmental assessment and license documents Federal Energy Regulatory Commission httpwwwfercgov
Francfort et al 1994 Environmental Mitigation at Hydroelectric Projects DOEID-10360 January 1994
Francfort J E S D Matthews B N Rinehart 2002 Uniform Criteria for US Hydropower Resource Assessment Hydropower Evaluation Software (HES) Userrsquos Manual DOEID-10338 Rev 1 June 2002
Gordon JL 1983 Hydropower Cost Estimates Water Power amp Dam Construction Vol 35 No 11 1983
Hunt RT 2003 R T Hunt private communication with anonymous hydropower industry source January 2003
USBR 2002 Hydropower Construction Costs Trends US Bureau of Reclamation httpwwwusbrgovpowerindexhtml October 2002
25
Appendix A
Cost Estimating Tools
A-1
A-2
A-3
10000M Y = 6E5(C) 070
Y = 3E5(C) 070
Y = 2E5(C) 070
R2 = 074
1000M
Lice
nsin
g C
ost (
2002
$)
100M
FERC 2003 (1980 - 1997) EPRI 1995
FERC 2003 (1999 - 2001) 010M
Undeveloped Sites Dams Without Power Dams With Power 67 Lower Bound 98 Lower Bound
001M 1 10 100 1000 10000
Capacity (MW)
Figure A1A Licensing cost as a function of plant capacity for an undeveloped site and powerhouse installation at a dam without power and as a function of added capacity for a plant expansion
1 to 1
0
10 to
20
20 to
30
30 to
40
40 to
50
gt 50
$105694
$20572000
1 MW 1167 MW Capacity (MW)
Cos
t (20
02$)
Total No of Data Points = 162 102
22 13
5 4 16
0
20
40
60
80
100
120
No
of D
ata
Poin
ts
A-4
Capacity Range (MW)
Figure A-1B Number of licensing cost data points for various plant capacity ranges
Y = 3E6(C) 090
R2 = 081
10M
100M
1000M
10000M
100000M C
onst
ruct
ion
Cos
t (20
02$)
EIA 2003a (1990 - 2000) 67 Upper Bound Undeveloped Sites 67 Lower Bound
A-5
1 10 100 1000 10000 Capacity (MW)
Figure A-2A Plant construction cost as a function of plant capacity for undeveloped sites
1 to 1
0
10 to
20
20 to
30
30 to
40
40 to
50
50 to
60
60 to
70
70 to
80
80 to
90
90 to
1 00
100 t
o 150
15
0 to 2
00
200 t
o 250
gt 250
$1 4 11 4 5 3
$2 1 80 5 39 8 3 9
1 M W 1 28 0 M WCapacity (MW)
Cos
t (20
02$)
Total No of Data Points = 267 47
40
24 23
15 11
6
13 9 10
31
12
6
20
0
5
10
15
20
25
30
35
40
45
50
55
No
of D
ata
Poin
ts
A-6
Capacity Range (MW)
Figure A-2B Number of undeveloped site construction cost data points for various plant capacity ranges
A-7 C
onst
ruct
ion
Cost
(200
2$)
100000M
10000M
1000M
100M
10M
01M
Y = 1E6(C)081
Y = 2E6(C) 081
R2 = 074
1 10 100 1000 10000 Capacity (MW)
EIA 2003a (1990 - 2000) Christensen 1986
67 Upper Bound
Dams With Power Dams Without Power
Figure A-3A Construction cost as a function of plant capacity for a powerhouse installation at a dam without power or as a function of added capacity for a plant expansion
1 to 1
0
10 to
20
20 to
30
30 to
40
40 to
50
50 to
60
60 to
70
70 to
80
80 to
90
90 to
100
100 t
o 150
15
0 to 2
00
200 t
o 250
gt 250
$89 8 2 9 4
$1 1 69 4 85 4 7 6
1 M W 1 28 0 M WCapacity (MW)
Cos
t (20
02$)
Total No of Data Points = 226
19
37
21 20
14
10
6
12 9 10
30
12
6
20
0
5
10
15
20
25
30
35
40
No
of D
ata
Poin
ts
A-8
Capacity Range (MW)
Figure A-3B Number of powerhouse construction cost data points for various plant capacity ranges
A-9
100000M
10000M
1000M
100M
010M
001M
Y = 2E5(C)096
Y = 8E4(C) 096
R2 = 070
1 10 100 1000 10000 Capacity (MW)
FERC 2003 (1980 - 1997)
Undeveloped Sites Dams Without Power
FERC 2003 (1999 - 2001)
67 Lower Bound Dams With Power
98 Lower Bound
Y = 3E5(C)096
Figure A-4A Fish and wildlife mitigation cost as a function of plant capacity for undeveloped sites and powerhouse installation at a dam without power and as a function of added capacity for a plant expansion
Fish
and
Wild
life
Miti
gatio
n C
ost (
2002
$)
1 to 1
0
10 to
20
20 to
30
30 to
40
40 to
50
gt 50
$36773
$27271669
1 MW 697 MW Capacity (MW)
Cos
t (20
02$)
Total No of Data Points = 74 42
11 7
2 3
9
0
5
10
15
20
25
30
35
40
45
No
of D
ata
Poin
ts
A-10
Capacity Range (MW)
Figure A-4B Number of fish and wildlife mitigation cost data points for various plant capacity ranges
A-11
1000000M
100000M
10000M
1000M
0100M
0010M
0001M
Y = 6E4(C) 097
R2 = 087
097
1 10 100 1000 10000 Capacity (MW)
FERC 2003 (1980 - 1997)
Undeveloped Sites Dams Without Power
FERC 2003 (1999 - 2001)
67 Lower Bound Dams With Power
98 Lower Bound
Y = 2E5(C) Y = 2E5(C) 097
Figure A-5A Recreation mitigation cost as a function of plant capacity for undeveloped sites and powerhouse installation at a dam without power and as a function of added capacity for a plant expansion
Rec
reat
ion
Miti
gatio
n C
ost (
2002
$)
1 to 1
0
10 to
20
20 to
30
30 to
40
40 to
50
gt50
$9 2 6 7
$ 27 7 34 6 7 4
1 M W 69 7 M WCapacity (MW)
Cos
t (20
02$)
Total No of Data Points = 101 63
13
5 4 3
13
0
10
20
30
40
50
60
70
No
of D
ata
Poin
ts
A-12
Capacity Range (MW)
Figure A-5B Number of recreation mitigation cost data points for various plant capacity ranges
A-13
10000M
072Y = 1E5(C) 0721000M Y = 8E4(C)
072Y = 6E4(C) R2 = 094
100M
FERC 2003 (1980 - 1997) FERC 2003 (1999 - 2001) 010M Undeveloped Sites Dams Without Power Dams With Power 67 Lower Bound 98 Lower Bound
001M 1 10 100 1000 10000
Capacity (MW)
Figure A-6A Historical and archeological mitigation cost as a function of plant capacity for undeveloped sites and powerhouse installation at a dam without power and as a function of added capacity for a plant expansion
His
toric
al amp
Arc
heol
ogic
al M
itiga
tion
Cos
t (20
02$)
1 to 1
0
10 to
20
20 to
30
30 to
40
40 to
50
gt 50
$10 3 93 9
$6 0 32 1 12
4 M W 69 7 M WCapacity (MW)
Cos
t (20
02$)
Total No of Data Points = 22 12
1
4
0
2 3
0
2
4
6
8
10
12
14
No
of D
ata
Poin
ts
A-14
Capacity Range (MW)
Figure A-6B Number of historical and archeological mitigation cost data points for various plant capacity ranges
10000M
Y = 7E4(C)044
R2 = 056
Y = 2E5(C)044
0010M
0100M
1000M
Wat
er Q
ualit
y M
onito
ring
Cos
t (20
02$)
FERC 2003 (1980 - 1997)
Undeveloped Sites Dams Without Power
FERC 2003 (1999 - 2001)
67 Lower Bound Dams With Power
98 Lower Bound
Y = 4E5(C)044
A-15
0001M 1 10 100 1000 10000
Capacity (MW)
Figure A-7A Water quality monitoring cost as a function of plant capacity for undeveloped sites and powerhouse installation at a dam without power and as a function of added capacity for a plant expansion
1 to 1
0
10 to
20
20 to
30
30 to
40
40 to
50
gt50
$7 6 73
$2 2 09 7 09
1 44 M W 69 7 M WCapacity (MW)
Cos
t (20
02$)
Total No of Data Points = 89 51
14
7 3 2
12
0
10
20
30
40
50
60
No
of D
ata
Poin
ts
A-16
Capacity Range (MW)
Figure A-7B Number of water quality monitoring cost data points for various plant capacity ranges
A-17
1000M
Y = 1E6(C)056
R2 = 099
100M
Fish
Pas
sage
Cos
t (20
02$)
Francfort 1994 FERC 2003 (1999 - 2001)
67 Upper Bound Fish Passage 67 Lower Bound
10M 1 10 100 1000 10000
Capacity (MW)
Figure A-8A Fish passage cost as a function of plant capacity for undeveloped sites and powerhouse installation at a dam without power and as a function of added capacity for a plant expansion
1 to 1
0
10 to
20
20 to
30
30 to
40
40 to
50
gt50
A-18
$1 0 12 3 7 4
$ 52 7 62 5 0 0
1 M W 84 0 M WCapacity (MW)
Cos
t (20
02$)
No
of D
ata
Poin
ts
7
6
5
4
3
2
1
0
1
6 Total No of Data Points = 10
0 0 0
3
Capacity Range (MW)
Figure A-8B Number of fish passage cost data points for various plant capacity ranges
A-19
Y = 2E4(C)075
R2 = 060
001M
010M
100M
1000M
10000M
Fixe
d O
ampM
Cos
t (20
02$)
EIA 2003b (1990 - 2000) 67 Upper Bound All Sites 67 Lower Bound
1 10 100 1000 10000
Capacity (MW)
Figure A-9A Fixed operating and maintenance costs as a function of plant capacity for undeveloped sites and powerhouse installation at a dam without power and as a function of added capacity for a plant expansion
1 to 1
0
10 to
20
20 to
30
30 to
40
40 to
50
50 to
60
60 to
70
70 to
80
80 to
90
90 to
100
100 t
o 150
15
0 to 2
00
200 t
o 250
gt 250
$ 17 1 5 7
$ 11 4 92 7 7 4
1 M W 1 28 0 M WCapacity (MW)
Cos
t (20
02$)
Total No of Data Points = 474
24
105
55 47
33 27
14 19
14 12
51
25
11
37
0
20
40
60
80
10 0
12 0
No
of D
ata
Poin
ts
A-20
Capacity Range (MW)
Figure A-9B Number of fixed operation and maintenance cost data points for various plant capacity ranges
Y = 2E4(C)080
R2 = 067
001M
010M
100M
1000M
10000M Va
riabl
e O
ampM
Cos
t (20
02$)
EIA 2003b (1990 - 2000) 67 Upper Bound All Sites 67 Lower Bound
A-21
1 10 100 1000 10000
Capacity (MW)
Figure A-10A Variable operating and maintenance costs as a function of plant capacity for undeveloped and powerhouse installation at a dam without power and as a function of added capacity for a plant expansion
1 to 1
0
10 to
20
20 to
30
30 to
40
40 to
50
50 to
60
60 to
70
70 to
80
80 to
90
90 to
1 00
100 t
o 150
15
0 to 2
00
200 t
o 250
gt 250
$15 104
$12 929 143
1 MW 1 280 MWCapacity (MW)
Cos
t (20
02$)
Total No of Data Points = 501
39
116
58 51
37 25
14 24
14 14
53
25
10 21
0
20
40
60
80
10 0
12 0
14 0
No
of D
ata
Poin
ts
A-22
Capacity Range (MW)
Figure A-10B Number of variable operation and maintenance cost data points for various plant capacity ranges
A-23
Fran
cis
Turb
ine
Upg
rade
Cos
t (20
02$)
1000M
100M
10M
01M
071 -042Y = [3E6 sdot (C) ] sdot (H)
(C = 200 MW) Y = 13E8(H)-042
(C = 100 MW) Y = 77E7(H)-042
(C = 75 MW) Y = 63E7(H)-042
(C = 50 MW) Y = 47E7(H)-042
(C = 20 MW) Y = 25E7(H)-042
(C = 10 MW) Y = 15E7(H)-042
(C = 5 MW) Y = 92E6(H)-042
100 1000 Head (ft)
Figure A-11 Francis turbine upgrade cost as a function hydraulic head for various plant capacities
10000
A-24
1000M
100M
10M
(C = 5 MW) Y = 13E7(H)-038
(C = 10 MW) Y = 22E7(H)-038
(C = 20 MW) Y = 37E7(H)-038
(C = 50 MW) Y = 71E7(H)-038
(C = 75 MW) Y = 95E7(H)-038 (C = 100 MW) Y = 12E8(H)-038
(C = 200 MW) Y = 19E8(H)-038
10 100
Head (ft)
-038072 )H(](C)[4E6Y sdotsdot=
Figure A-12 Kaplan turbine upgrade cost as a function hydraulic head for various plant capacities
Kap
lan
Turb
ine
Upg
rade
Cos
t (20
02$)
1000
1000M B
ulb
Turb
ine
Upg
rade
Cos
t (20
02$)
100M
(C = 5 MW) Y = 25E7(H)-063
(C = 10 MW) Y = 45E7(H)-063
(C = 20 MW) Y = 82E7(H)-063
(C = 50 MW) Y = 18E8(H)-063
-063086 )H(](C)[6E6Y sdotsdot=
10M 1 10 100 1000
Head (ft)
Figure A-13 Bulb turbine upgrade cost as a function hydraulic head for various plant capacities
A-25
A-26
10M
01M
(C = 5 MW) Y = 84E6(S)-038
(C = 10 MW) Y = 13E7(S)-038
(C = 20 MW) Y = 21E7(S)-038
(C = 50 MW) Y = 37E7(S)-038 (C = 75 MW) Y = 49E7(S)-038 (C = 100 MW) Y = 59E7(S)-038
(C = 200 MW) Y = 92E7(S)-038
100 1000 Speed (RPM)
-038065 )S(](C)[3E6Y sdotsdot=
Figure A-14 Generator upgrade cost as a function of RPM for various plant capacities
1000M
100M
Gen
erat
or U
pgra
de C
ost (
2002
$)
10000
Appendix B
INEEL Hydropower Resource Economics Database (see document back cover for IHRED compact disk)
B-1
B-2
Field Number Field Name Type Description
Appendix B
INEEL Hydropower Resource Economics Database B1 IHRED Data Dictionary B2 IHRED
The data dictionary for the INEEL The IHRED in Excel format is provided on the Hydropower Resource Economics Database compact disk which is in a pocket on the back (IHRED) is given in Table B-1 This table lists the cover of this document The database contains field number parameter name field type (number resource characteristic data estimated or text) field description and units for the development and OampM costs and estimated 78 fields in the database annual and monthly generation for 2155 US
hydropower resources
Table B-1 INEEL Hydropower Resource Economics Database Data Dictionary Units
1 ProjectNumber Text Project Number (FERC number or pseudo FERC number) mdash
2 PlantName Text Name of the project mdash
3 StreamName Text Name of the stream where the project is located mdash
4 StateAbbr Text Two letter abbreviation for the state where the project is located mdash
5 NERCSubregion Text NERC Subregion (1 = East Central Area Reliability Coordination Agreement (ECAR) 2 = Electric Reliability Council of Texas (ERCOT) 3 = Mid-Atlantic Area Council (MAAC) 4 = Mid-America Interconnected Network (MAIN) 5 = Mid-Continent Area Power Pool (MAPP) 6 = Northeast Power Coordinating CouncilNew York (NY) 7 = Northeast Power Coordinating CouncilNew England (NE) 8 = Southeastern Electric Reliability CouncilFlorida (FL) 9 = Southeastern Electric Reliability CouncilExcl Florida (STV) 10 = Southwest Power Pool (SPP) 11 = Western Systems Coordinating CouncilNWP (NWP) 12 = Western Systems Coordinating CouncilRA (RA) 13 = Western Systems Coordinating CouncilCNV (CNV))
mdash
6 Latitude Number Latitude (first digits refer to degrees north last 2 digits refer to minutes)
ddmm
7 Longitude Number Longitude (First digits refer to degrees west last 2 digits refer to minutes)
ddmm
8 ClassCode Text Owner class code (C = Cooperative F = Federal I = Industrial M = Municipal and other non-federal P = Private utility R = Private nonutility)
mdash
9 OwnerName Text Name of project owner mdash
10 Capacity Number Potential capacity at undeveloped sites or sites without power or potential additional capacity at sites with power
MW
11 UnitType Text Type of unit (C = Conventional R = Reversible Z = Missing) mdash
12 PlantType Text Type of Plant (CMB = Combined conventional and reversible units DIV = Gravity diversion (powerhouse on different stream) PDV = Pumped diversion (one-way pumped storage) PMP = Pure (recycled) pump storage RES = Reservoir only ROR = Run-of-river (dam lt= 10 ft high and minimal storage) RRG = Reregulating STG = Storage conventional hydro (dam gt 10 ft high with significant storage) TID = Tidal conventional hydro)
mdash
B-3
Field Number Field Name Type Description
Table B-1 (continued) Units
13 ProjectStatus Text Status of Project (DJ = Disclaimer of FERC jurisdiction EA = Exemption applied for FA = Federally authorized FR = Federally recommended LE = License exemption LJ = Lack of FERC jurisdiction MA = FERC major license application MO = FERC license outstanding NA = FERC minor license application (lt15 kW) NO = FERC minor license outstanding (lt15 kW) PA = FERC preliminary permit application PO = FERC preliminary permit outstanding XX = No status YO = FERC minor part license outstanding ZZ = Missing)
mdash
14 BasinName Text River basin name mdash
15 CountyName Text County where the project is located mdash
16 DamStatus Text Status of Dam (W = With Power WO = Without Power U = Undeveloped)
mdash
17 WSProtection Text WildScenic Protection mdash
18 WSTributary Text WildScenic Tributary or UpstreamDownstream WildScenic Location (YNltblankgt)
mdash
19 Cultural Text Cultural Value (YNltblankgt) mdash
20 Fish Text Fish Value (YNltblankgt) mdash
21 Geological Text Geological Value (YNltblankgt) mdash
22 Historical Text Historical Value (YNltblankgt) mdash
23 Other Text Other criteria such as rare wetland communities and wilderness designation
mdash
24 Recreation Text Recreation Value (YNltblankgt) mdash
25 Scenic Text Scenic Value (YNltblankgt) mdash
26 Wildlife Text Wildlife Value (YNltblankgt) mdash
27 TEW Text ThreatenedEndangered Wildlife (YNltblankgt) mdash
28 TEF Text ThreatenedEndangered Fish (YNltblankgt) mdash
29 FLC103 Text Federal Land Code 103 (National Park Monument Lakeshore Parkway Battlefield or Recreation Area) (YNltblankgt)
mdash
30 FLC104 Text Federal Land Code 104 (National Forest or Grassland) (YNltblankgt)
mdash
31 FLC105 Text Federal Land Code 105 (National Wildlife Refuge Game Preserve or Fish Hatchery) (YNltblankgt)
mdash
32 FLC106 Text Federal Land Code 106 (National Scenic Waterway or Wilderness Area) (YNltblankgt)
mdash
33 FLC107 Text Federal Land Code 107(Indian Reservation) (YNltblankgt) mdash
34 FLC108 Text Federal Land Code 108 (Military Reservation) (YNltblankgt) mdash
35 FLC198 Text Federal Land Code 198 (Not On Federal Land) (YNltblankgt) mdash
36 SiteProb Number Project Environmental Suitability Factor (010 = Development prohibited or highly unlikely 025 = Major reduction in likelihood of development 050 = Likelihood of development reduced by half 075 = Minor reduction in likelihood of development 090 = Little effect on likelihood of development)
mdash
37 LicensingCost Number Total Licensing Cost $K
38 ConstructionCost Number Total Construction Cost $K
39 OvrNiteDevCost Number Overnight Development Cost ( LicensingCost + ConstructionCost ) $K
40 MitHist_Arch Number 30 year Archaeological and Historical mitigation cost (applicable if either Cultural or Historical fields are Y )
$K
41 MitFish_Wildlife Number 30 year fish and wildlife mitigation cost (applicable if any of the Fish Wildlife or TEW fields are Y )
$K
42 MitScenic_Rec Number 30 year scenic and recreation mitigation cost (applicable if either Recreation or Scenic fields are Y )
$K
B-4
Field Number Field Name Type Description
Table B-1 (continued) Units
43 MitWaterMonitor Number 30 year water quality monitoring cost $K
44 MitFishPassage Number 30 year fish passage cost (applicable if TEF field is Y ) $K
45 MitTotal Number Total Mitigation Cost ( Sum of MitHist_Arch MitFish_Wildlife MitScenic_Rec MitWaterMonitor and MitFishPassage )
$K
46 TotalDevCost Number Total Development Cost ( OvrNiteDevCost + MitTotal ) $K
47 UnitTotalDevCost Number Total Development Unit Cost $kW
48 FixedOM Number Average Annual Fixed OampM $K
49 UnitFixedOM Number Average Annual Fixed OampM Unit Cost $kW
50 VariableOM Number Average Annual Variable OampM $K
51 UnitVariableOM Number Average Annual Variable OampM Unit Cost MillskWh
52 FERCAnnChrg Number FERC Annual Charge (applicable if Capacity gt= 15 MW ) $K
53 PFAnnual Number Average Annual Plant Factor -
54 PFJan Number Average January Plant Factor -
55 PFFeb Number Average February Plant Factor -
56 PFMar Number Average March Plant Factor -
57 PFApr Number Average April Plant Factor -
58 PFMay Number Average May Plant Factor -
59 PFJun Number Average June Plant Factor -
60 PFJul Number Average July Plant Factor -
61 PFAug Number Average August Plant Factor -
62 PFSept Number Average September Plant Factor -
63 PFOct Number Average October Plant Factor -
64 PFNov Number Average November Plant Factor -
65 PFDec Number Average December Plant Factor -
66 GenAnnual Number Average Annual Generation MWh
67 GenJan Number Average January Generation MWh
68 GenFeb Number Average February Generation MWh
69 GenMar Number Average March Generation MWh
70 GenApr Number Average April Generation MWh
71 GenMay Number Average May Generation MWh
72 GenJun Number Average June Generation MWh
73 GenJul Number Average July Generation MWh
74 GenAug Number Average August Generation MWh
75 GenSept Number Average September Generation MWh
76 GenOct Number Average October Generation MWh
77 GenNov Number Average November Generation MWh
78 GenDec Number Average December Generation MWh
Special field values NA Value not available in source data
Value removed due to homeland security concerns
B-5
- ABSTRACT
- EXECUTIVE SUMMARY
- ACKNOWLEDGMENTS
- ACRONYMS
- NOMENCLATURE
- INTRODUCTION
- TECHNICAL APPROACH
-
- Cost Estimating Tools for Plant Development or Expansion
-
- Data Sources
- General Method
- Data Screening
- Accounting for Cost Variations by Type of Site
-
- Cost Estimating Tools for Plant Operation and Maintenance
- Cost Estimating Tools for Turbine and Generator Upgrade
- Estimating Plant Electric Generation
- FERC Annual Charge
- Application of Estimating Tools to Hydropower Resources
-
- RESULTS
-
- Cost Estimating Tools for Plant Development or Expansion
- Cost Estimating Tools for Plant Operation and Maintenance
- Cost Estimating Tools for Turbine and Generator Upgrade
- Estimating Plant Electric Generation
- Estimated Economic Parameters for Hydropower Resources
- Likelihood of Development
-
- CONCLUSIONS AND RECOMMENDATIONS
- REFERENCES
-
- B1IHRED Data Dictionary
- B2IHRED
-
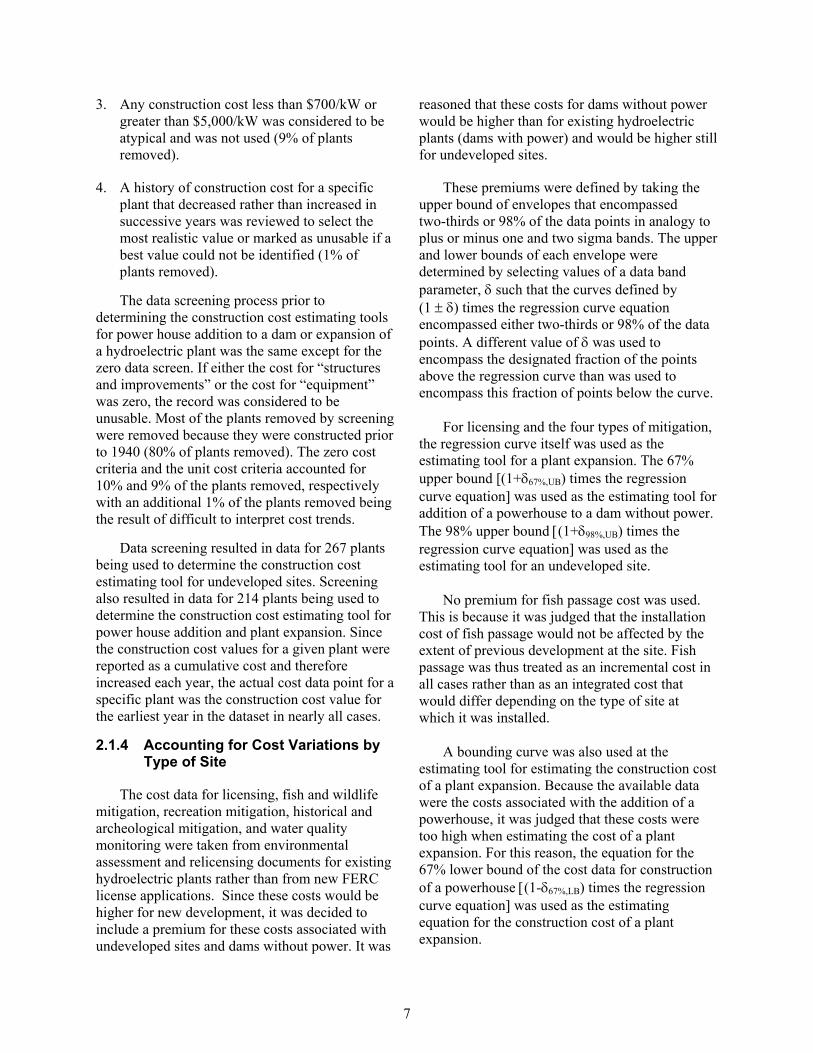
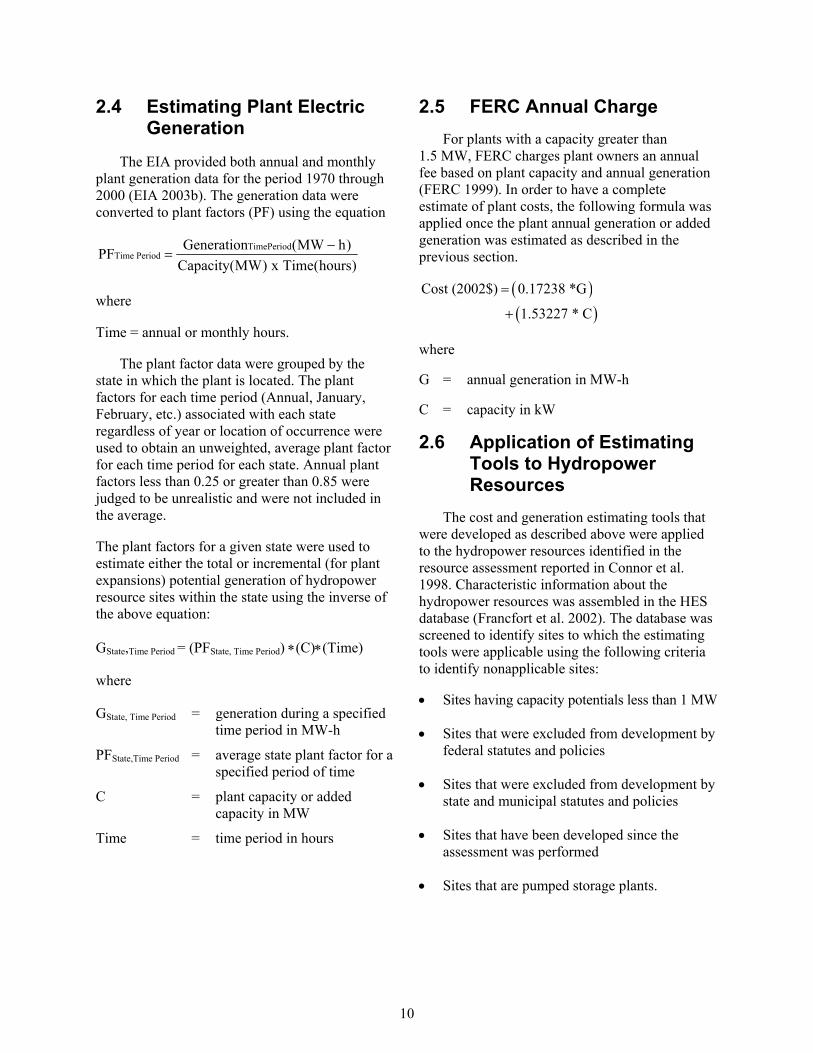
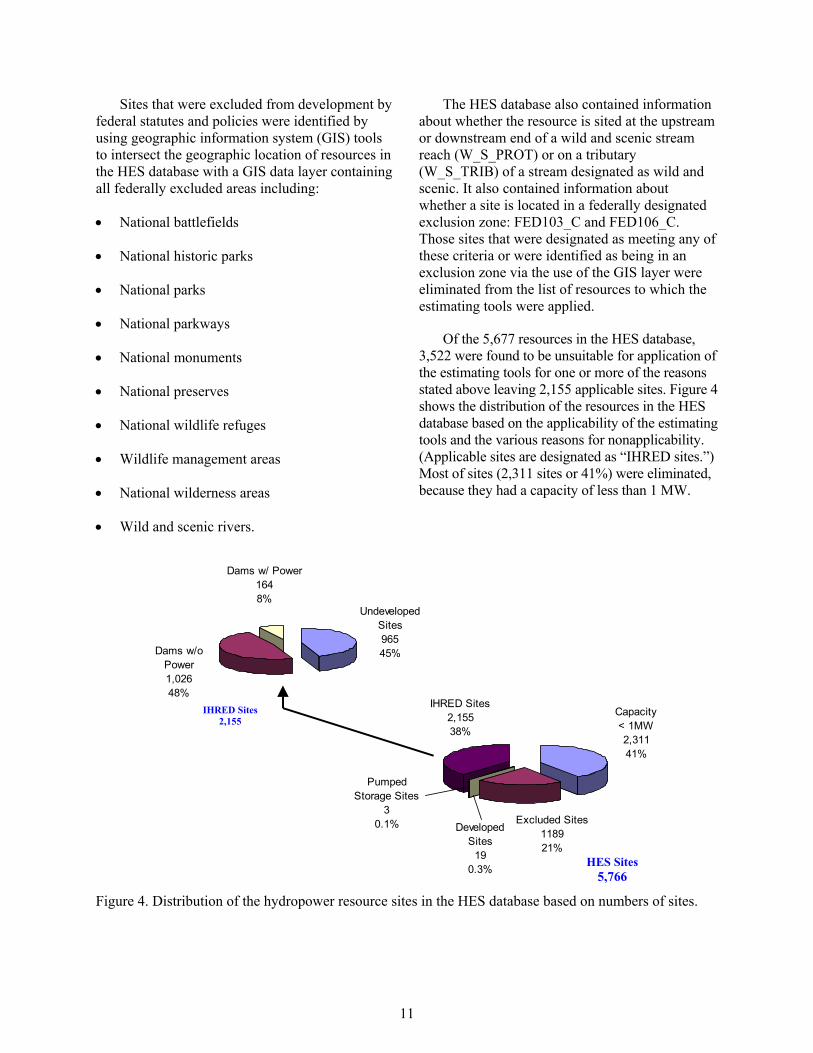

14
Table 3 Cost estimating equations for licensing construction and five types of mitigation
Cost (2002$) = A lowast [Capacity (MW)] B
Estimating Tool Application Coefficient
(A) Exponent
(B)
Data Band Parameter
(δ98UB)
Data Band Parameter
(δ67UB)
Data Band Parameter
(δ67LB)
Data Band Parameter
(δ98LB) R2
Licensing - Undeveloped Sites 61E+05 070 - - - - NA
Licensing - Dams wo Power 31E+05 070 - - - - NA
Licensing ndash Dams w Power 21E+05 070 190 46 39 63 074
Construction - Undeveloped Sites 33E+06 090 126 49 35 67 081
Construction - Dams wo Power 22E+06 081 250 67 38 74 074
Construction - Dams w Power 14E+06 081 - - - - NA
Fish amp Wildlife Mitigation - Undeveloped Sites 31E+05 096 - - - - NA
Fish amp Wildlife Mitigation - Dams wo Power 20E+05 096 - - - - NA
Fish amp Wildlife Mitigation - Dams w Power 83E+04 096 278 138 39 77 070
Recreation Mitigation - Undeveloped Sites 24E+05 097 - - - - NA
Recreation Mitigation - Dams wo Power 17E+05 097 - - - - NA
Recreation Mitigation - Dams w wo Power 63E+04 097 282 166 54 92 087
Historical amp Archeological Mitigation - Undeveloped Sites 10E+05 072 - - - - NA
Historical amp Archeological Mitigation - Dams wo Power 85E+04 072 - - - - NA
Historical amp Archeological Mitigation - Dams w wo Power 63E+04 072 65 35 43 50 094
Water Quality Monitoring - Undeveloped Sites 40E+05 044 - - - - NA
Water Quality Monitoring - Dams wo Power 20E+05 044 - - - - NA
Water Quality Monitoring - Dams w wo Power 7E+04 044 513 213 59 93 056
Fish Passage Mitigation 13E+06 056 79 09 18 31 099
Table 4 Significance test results for development cost estimating equation exponents Estimating Tool Exponent Standard
Error t Statistic Value t (ν 0001)
Licensing ndash Dams wo Power 02806 24854 3142 Construction ndash Undeveloped Sites 01781 50378 3121 Construction ndash Dams wo Power 02706 29825 3127 Fish amp Wildlife Mitigation 05587 17142 3207 Recreation Mitigation 06534 14835 3175 Hist amp Arch Mitigation 05753 12440 3552 Water Quality Mitigation 07837 5559 3187 Fish Passage Mitigation 03827 14571 4501
Table 5 Cost estimating equations for fixed and variable operation and maintenance
Cost (2002$) = A lowast [Capacity (MW)] B
Estimating Tool Application Coefficient
(A) Exponent
(B)
Data Band Parameter
(δ98UB)
Data Band Parameter
(δ67UB)
Data Band Parameter
(δ67LB)
Data Band Parameter
(δ98LB) R2
Fixed Operation and Maintenance 24E4 075 192 67 46 74 060
Variable Operation and Maintenance 24E4 080 255 77 39 74 067
Table 6 Significance test results for OampM cost estimating equation exponents Estimating Tool Exponent Standard
Error t Statistic Value t (ν 0001)
Fixed Operation and Maintenance 02127 35400 3108
Variable Operation and Maintenance 02198 36295 3107
Table 7 Cost estimating equations for turbine and generator upgrades
Turbines Cost (2002$) = A lowast [Capacity (MW)] B lowast [Head(ft)] C
Estimating Tool Application Coefficient (A)
Exponent(B)
Exponent(C)
Francis Turbines 3E6 071 -042 Kaplan Turbines 4E6 072 -038 Bulb Turbines 6E6 086 -063
Generators Cost (2002$) = A lowast [Capacity (MW)] B lowast [Speed(rpm)] C
Generators 3E6 065 -038
15
33 Cost Estimating Tools forTurbine and Generator Upgrade
Development of the cost estimating tools for turbine and generator upgrades resulted in power equations in which the coefficient is a function of the capacity of the turbine or generator being replaced The equations for these tools are listed in Table 7 The tools are shown graphically in Appendix A
34 Estimating Plant ElectricGeneration
Annual and monthly plant factors were determined for each state The resulting plant factors are listed in Table 8
35 Estimated Economic Parameters for Hydropower Resources
The development and OampM cost estimating tools listed in Tables 3 and 5 and the plant factors listed in Table 8 were applied to 2155 US hydropower resources from the HES database to build the IHRED Resource characteristic data in the HES database were retained in the IHRED and cost and generation data were added to assemble the 78 fields of data for each resource The IHRED data dictionary which provides field names and descriptions is listed in Appendix B The database in Excel format is provided on a compact disk as part of Appendix B and is included in a pocket on the back cover of this document
The distribution of the hydropower resources in the IHRED which is based on the number of resources having capacities or capacity additions within various capacity ranges is shown in Figure 6 This figure shows that 1461 of the 2155 resources in the IHRED (68) had capacities or capacity additions in the 1 to 10 MW range Ninety-two percent of the resources had capacities or capacity additions of 50 MW or less A comparison of Figure 6 with similar distributions for the data populations on which the cost estimating tools are based (Appendix A) reveals that the distributions are similar Thus the vast majority of cost estimates that were made for
resources in the IHRED were based on historical data from plants in the same capacity range
A related distribution of the IHRED resources is shown in Figure 7 In this figure the total capacity represented by the resources having capacities or capacity additions in each capacity range is shown This figure shows that the 1461 resources (68 of the sites) having capacities or capacity additions in the 1 to 10 MW range represent only 12 of the total 43036 MW of the IHRED resources The 92 of the IHRED resources having capacities or capacity additions of 50 MW or less constitute 41 of the total capacity of the resources Another 44 of the total capacity is contributed by resources having capacities or capacity additions of 100 MW or greater with 24 of the total capacity being contributed by the 21 sites having capacities or added capacities greater than 250 MW
All the cost estimating tools are based on data populations that include data for plants having capacities greater than 100 MW But the number of points is less than at the other end of the capacity scale The data populations on which construction and OampM cost estimating tools are based have the best representations at the high end of the capacity range The thumbnail plot on each of the source data distributions in Appendix A provides the minimum and maximum capacity and cost of the source data
The distributions of the IHRED sites which are given in capacity ranges in Figures 6 and 7 are presented in ranges of unit development cost in Figures 8 and 9 Unit development cost is the sum of the estimated costs of licensing construction and any required mitigation divided by the capacity or added capacity of the site The distribution of the number of undeveloped sites that could be developed for various unit costs is shown by the blue bar segments in Figure 8 This is an approximately symmetric distribution with the maximum number of this type of site being developed for $3500 to $4000 per kW Likewise the distribution of dams without power sites shown by the red bar segments is approximately symmetric with the maximum number of this type of site being developed for $2000 to $2500 per kW The distribution of the dams with power or plant expansions shown by the white bar segments is also approximately symmetric with the
16
17
Table 8 Annual and monthly plant factors by state State
ALASKA Abbr AK
Annual05021
January 04876
February 04819
March 04512
April 04547
May 04767
June 05393
July 05500
August 05350
September 05119
October 05255
November 05183
December 04913
ALABAMA AL 04378 06489 06718 06707 05330 04145 03464 03093 02818 02485 02686 03642 05108 ARKANSAS AR 04208 04725 05037 05317 05319 04773 04441 04069 03438 02760 02717 03322 04630 ARIZONA AZ 04860 03438 03812 04679 05759 05943 06538 06510 06250 04859 03570 03379 03511 CALIFORNIA CA 05487 04931 05327 05935 06149 06462 06396 06067 05779 05142 04476 04422 04748 COLORADO CO 04946 04514 04430 04233 04226 05743 06686 06528 05547 04983 04259 03858 04290 CONNECTICUT CT 04672 05576 06018 07414 07574 06209 03994 02340 01927 01878 03089 04478 05670 FLORIDA FL 04316 04622 05304 05875 05232 03985 04180 04397 04674 03660 02626 03277 04030 GEORGIA GA 04378 05166 05343 05414 05251 04563 04142 03752 03788 03340 03446 03925 04472 HAWAII HI 06111 05876 05655 06429 07861 07110 05799 05666 05572 05183 05620 06526 06015 IOWA IA 05549 04745 05169 06212 06221 06163 05996 05680 05218 05017 04851 05738 05565 IDAHO ID 06037 06042 05955 06129 06402 06619 06675 06262 05837 05647 05354 05586 05930 ILLINOIS IL 05145 04649 04862 04980 04980 04978 05105 05266 05439 05318 05346 05672 05139 INDIANA IN 04982 04985 05219 05715 06232 06107 05497 04458 03833 03837 03846 04792 05306 KANSAS KS 04083 03470 03956 04382 03919 04057 03933 03869 04029 04389 03806 04579 04616 KENTUCKY KY 05309 05786 05401 04974 04948 05522 05652 05533 05207 04826 04841 05352 05655 LOUISIANA LA 04208 04725 05037 05317 05319 04773 04441 04069 03438 02760 02717 03322 04630 MASSACHUSETTS MA 04840 05478 05567 06323 06284 05800 04386 03254 03251 03094 04032 05011 05646 MARYLAND MD 04251 04507 05409 07230 07349 05427 03296 02448 01753 01898 02650 03911 05232 MAINE ME 05824 05815 05975 06618 07114 07023 06119 04918 04448 04603 05273 06001 06007 MICHIGAN MI 04830 04720 04842 05523 06556 05808 04896 03977 03633 03905 04260 04820 05052 MINNESOTA MN 06054 05247 05346 05927 07256 07216 06882 06184 04920 05275 05755 06720 05914 MISSISSIPPI MS 04208 04725 05037 05317 05319 04773 04441 04069 03438 02760 02717 03322 04630 MISSOURI MO 04107 04300 04663 05651 05668 04890 04205 03607 03186 02658 02633 03550 04321 MONTANA MT 06114 06125 05951 05761 06088 06463 07059 06616 05897 05570 05768 06111 05960 NORTH CAROLINA NC 04555 05545 05772 05896 05321 04863 04410 03768 03824 03448 03427 03763 04699 NORTH DAKOTA ND 05474 06104 06300 04981 04679 05173 05854 06091 06104 05267 04856 05110 05220 NEBRASKA NE 04700 03989 04822 05014 05072 04905 05113 05273 04948 04362 04526 04515 03880 NEW HAMPSHIRE NH 05524 05381 05579 06556 07584 07165 05561 04081 03811 03725 04937 06042 05896 NEW JERSEY NJ 03310 03245 03719 05082 04571 04178 03115 02431 01707 02596 02882 02858 03372 NEW MEXICO NM 04796 03652 03899 05137 06029 05825 05497 05551 04771 04776 04424 03806 04131 NEVADA NV 05410 04312 04996 05414 06409 06542 06103 05931 05794 05529 04979 04317 04580 NEW YORK NY 05354 05519 05667 06301 07009 06425 05094 04088 03700 03933 04763 05768 06027 OHIO OH 04681 04524 04352 04403 05141 05315 05319 05082 04268 04148 04245 04465 04886 OKLAHOMA OK 04605 04242 04525 05970 06085 06262 06424 04826 03137 02581 02561 04078 04585 OREGON OR 05669 06551 06488 06478 06274 06254 05721 04558 04211 04494 04733 05784 06552 PENNSYLVANIA PA 04995 05224 05609 06931 07016 06139 05045 03931 02977 02932 03548 04727 05910 RHODE ISLAND RI 03052 03785 06043 06396 05104 03676 01644 00979 00524 00636 00841 02574 04636 SOUTH CAROLINA SC 04691 05875 06200 06191 05735 05103 04485 03623 03585 03227 03528 03978 04860 SOUTH DAKOTA SD 05064 03835 03532 03836 04706 05240 05707 06291 06546 06319 05656 05056 03952 TENNESSEE TN 05055 06158 06057 05671 04868 04611 04836 04749 05038 04437 04252 04553 05475 TEXAS TX 05053 04893 05144 05404 05441 05814 06325 05176 04754 04607 04309 04480 04318 UTAH UT 05127 03949 04286 04481 05577 06849 06833 06088 05760 05077 04278 04163 04139 VIRGINIA VA 04429 05144 05783 06306 06127 05781 04653 03381 02961 02692 02818 03381 04221 VERMONT VT 04976 04905 04974 05767 07418 06618 04687 03192 03051 03268 04570 05739 05567 WASHINGTON WA 05312 06069 06096 05597 05488 05795 05959 05084 04000 04007 04256 05385 06066 WISCONSIN WI 05559 04863 04944 05931 07286 06675 05861 04837 04526 05042 05359 05968 05423 WEST VIRGINIA WV 05609 06136 06743 07019 07047 06851 05880 04774 04265 03806 03920 04944 06009 WYOMING WY 05034 04149 04053 04354 05054 05789 06720 06922 06361 04867 03983 03997 04081
Louisiana and Mississippi values were estimated using Arkansas plant factors
1 to 1
0
10 to
20
20 to
30
30 to
40
40 to
50
50 to
60
60 to
70
70 to
80
80 to
90
90 to
100
100 t
o 150
15
0 to 2
00
200 t
o 250
gt250
18
1750
1500
1250
1000
750
Total No of Sites = 2155
21 10
6 03
18 08
29 13
12 06
14 06
17 08
18 08
35 16
53 25
63 29
146 68
262 122
1461 678
W i th Po w e r W i th out Pow e r Unde vel o pe dN
o o
f Site
s
500
250
0
Capacity Range (MW)
Figure 6 Number of IHRED resources having capacities or capacity additions within various capacity ranges
1 to 1
0
10 to
20
20 to
30
30 to
40
40 to
50
50 to
60
60 to
70
70 to
80
80 to
90
90 to
100
100 t
o 150
15
0 to 2
00
200 t
o 250
gt250
C
apac
ity (M
W)
12500
10000
7500
5000
Total Capacity = 43036 MW
1422 33
3159 73
3622 84
1156 27
1214 28
1315 31
1195 28
1954 45
2465 572210
51
3654 85
3890 90
10554 245
5225 121
W i th P o w e r W i thou t Po w e r Und e v e lo ped
2500
0
Capacity Range (MW)
Figure 7 Total capacity of IHRED resources having capacities or capacity additions within various capacity ranges
19
0 to 5
00
500 t
o 100
0 10
00 to
150
0 15
00 to
200
0 20
00 to
250
0 25
00 to
300
0 30
00 to
350
0 35
00 to
400
0 40
00 to
450
0 45
00 to
500
0 50
00 to
550
0 55
00 to
600
0 60
00 to
650
0
20
100
0
Total No of Sites = 2155
1 00
58 0204
43 20
188 87
288 134 272
126
328 152
380 176
3 01
333 155
241 112
65 30
W i th Pow e r W i thout Pow e r Un de v e l o p e d
Unit Cost Range ($kW)
Figure 8 Number of IHRED resources having unit cost (total development) within various unit cost ranges
500
400
300
200No
of S
ites
0 to 5
00
5 00 t
o 100
0 10
00 to
15 0
0 15
00 to
200
0 20
00 to
250
0 25
00 to
300
0 30
00 to
35 0
0 35
00 to
400
0 40
00 to
450
0 45
00 to
50 0
0 50
00 to
55 0
0 55
00 to
600
0 60
00 to
650
0
21
12000
10000
8000
6000
4000
Total Capacity = 43036 MW 10860 252
8369 194
4185 97
1514 35
5516 128
7392 172
3483 81
1265 29
370 09 58
01 15
00 6
00 1
00
W i th P o w e r W i th out Po w e r Un dev el o pedC
apac
ity (M
W)
2000
0
Unit Cost Range ($kW)
Figure 9 Total capacity of IHRED resources having unit cost (total development) within various unit cost ranges
maximum number of this type of site being developed for $1000 to $1500 per kW These maximum points of the respective distributions shift downward in unit cost from the perspective of developing the maximum capacity as shown in Figure 9 The maximum total capacity from undeveloped sites is obtained for $2500 to $3000 per kW while the maximum total capacity is obtained from adding a powerhouse to dams without power for $500 to $1500 per kW The maximum total capacity from plant expansions is obtained for $500 to $1000 per kW Viewed as a whole the results indicate that over 20000 MW of capacity could be developed at unit costs of $1500 per kW or less
When considering new generating plants long-standing energy industry practice has been to use unit costs ($kW) of various facilities as a comparison tool to make development decisions While the unit cost parameter is a good indicator of total development costs using it alone for comparison with other technologies penalizes projects like hydroelectric facilities that have high initial costs long life no fuel costs and low operating costs
The chart showing amounts of capacity (MW) falling within various unit cost ranges (Figure 9) is presented for information as a relative cost indicator for the available hydropower resources analyzed in this study It is not intended to imply an endorsement of the unit cost method to compare various technologies and make development decisions
36 Likelihood of Development
In order to provide the IHRED user with some measure of the likelihood that a particular site will be developed the SITEPROB field and the associated values from the HES database were included in the IHRED as field number 36 This parameter ranges from 010 which indicates the least likely sites to be developed to 090 which indicates the most likely sites The researchers
reasoned that no site has a 0 probability of development just as no site can be predicted to have a 100 probability of development
As described in Francfort et al 2002 the value of the SITEPROB variable is a composite of the values of ldquosuitability factorsrdquo that were determined to apply to a site during the hydropower resource assessment reported in Connor et al 1998 Dependent upon the type of site (undeveloped dam wo power or dam w power) suitability factor values were assigned to each of 12 environmental attributes and seven federally designated land uses The suitability factor values (010 025 050 075 090) reflect a) the probability that the attribute or land use will make a project unacceptable prohibiting its development and b) the degree to which associated licensing and mitigation costs would reduce the economic viability of the project The lowest value indicates that the attribute would tend to prohibit development or make it highly unlikely and the highest value indicates that the attribute will have little effect on the likelihood of development The SITEPROB value is either the single lowest suitability factor associated with the site or the next lowest value when there is more than one occurrence of the lowest value
22
4 CONCLUSIONS AND RECOMMENDATIONS
Analysis of historical hydropower data has shown that the costs of licensing construction five types of mitigation and fixed and variable OampM costs correlate with plant capacity As a result least squares power curve fits of cost as a function of capacity were defined that have R2
values ranging from 056 to 099 These power equations can be used to estimate costs in 2002 dollars for hydropower resources including undeveloped sites addition of a power house to a dam and expansion of an existing hydroelectric plant Functional relationships were also developed that can be used to estimate the cost in 2002 dollars of upgrading three types of turbines (Francis Kaplan and bulb) and upgrading generators
In addition to the cost estimating tools a method for estimating resource annual and monthly electric generation was developed This method which is based on 30 years of generation data can be used to determine generation based on average generation values for the state in which the resource is located
The HES database that contains 5677 hydropower resources and has a total capacity of 69009 MW was evaluated and found to contain 2155 resources having a total capacity of 43036 MW to which the cost and generation estimating tools were applicable Application of the tools resulted in cost and generation data which was assembled to produce the IHRED that included these data and site characteristic information for each of the 2155 resources This database will be useful both in predicting future hydroelectric supply and as a preliminary indication of the feasibility of realizing the potential of hydropower resources
The estimated costs of developing the 2155 sites in the IHRED indicate that over 20000 MW of new capacity could be developed for $1500 per kW or less These sites are existing dams to which a powerhouse could be added or existing hydroelectric plants that could be expanded The development of undeveloped sites is significantly more expensive with a median unit cost of $2700 per kW While the unit cost is relatively high in
comparison with other technologies it should be considered that hydroelectric facilities offer attractive characteristics that offset the high initial cost such as long life no fuel costs and low operating costs as well as reliability dispatchability and peaking power supply among others
This study was constrained to use only data sources that were readily available generally in electronic form In addition questionable or incomplete data could not be evaluated and had to be treated as unusable The data populations on which the cost estimating tools are based could be expanded with greater research and the purchase of private data collections Some of the data that was not used because it appeared questionable or incomplete could possibly be used if it were further researched The larger data populations obtained from these efforts would refine the cost estimating tools
The majority of the estimating tools had R2
values in the 60 and 70 percentiles indicating significant scatter in the data Additional data may increase these R2 values However this scatter may be indicative of dependence on another variable or other variables in addition to plant capacity Alternate functional relationships that may better correlate the data should be investigated
A tool for estimating water quality mitigation could not be produced within the constraints of the study because of the limited data that was readily available and the lack of correlation with a single parameter like plant capacity Greater research would probably add additional data and may result in a method of estimating this parameter The estimating tool for the cost of water quality monitoring which had an R2 value of 056 would no doubt benefit from additional research Such research may well show that dependence on a single variable like plant capacity is not sufficient for estimating this cost
The tools that were developed for estimating the cost of upgrading turbines and generators could not be applied to specific sites to evaluate
23
the potential for capacity increase resulting from these types of upgrades An evaluation of US hydroelectric plants from the perspective of upgrade potential should be performed to create a counterpart to the IHRED containing plant characteristics the estimated cost of the plant upgrade estimated associated licensing and mitigation costs if any estimated incremental OampM costs and added capacity and generation
The method of estimating plant generation should be reviewed to determine whether a more mechanistic model can be developed Use of 30 years of historical data is a good first step but the resulting predictors could probably benefit from refinement based on climatic prediction models Also using state boundaries as the arbiter of what average plant factor applies to a particular location is probably not optimally accurate Plant factors based on hydrography would probably
provide better predictors This approach should be investigated
The present study produced a large volume of data associated with a significant number of hydropower resources It was not within the scope of the study to analyze this data extensively and draw conclusions or make recommendations based on such analysis Greater value could be obtained from the useful product that has been produced if the IHRED data were analyzed to determine the trends and patterns that they contain This analysis should be performed for the benefit of both those who will use the data for predicting future hydroelectric supply and those who are decision makers regarding hydropower development
24
5 REFERENCES
Connor A M J E Francfort B N Rinehart 1998 U S Hydropower Resource Assessment Final Report DOEID-104302 December 1998
Christensen J P 1986 Small Hydropower Development the Process Pitfalls and Experience Vol III DOEID12254-1 June 1986
EHR 2002 What was the Inflation Rate Then Economic History Resources httpwwwehnetehresourceshowmuchinfla tionphp December 5 2002
EIA 2003a Hydroelectric plant data for 1990 through 2000 dataset (FERC Form I Annual Report of Major Electric Utilities Licencees and Others) transmitted as an attachment to T Petersik (EIA) email to R T Hunt (INEEL) October 9 2002
EIA 2003b Hydroelectric plant generation data for 1970 through 2000 dataset (FERC Form I Annual Report of Major Electric Utilities Licencees and Others) transmitted as an attachment to M E Johnson (EIA) email to R T Hunt (INEEL) December 19 2002
ENR 2002 Building Cost Index History (1915ndash2002) Engineering News-Record httpenrconstructioncomcostcostbciasp August 14 2002
EPRI 1989 Hydropower Plant Modernization Guide Vol 1 Electric Power Research Institute GS-6419 July 1989 pp 5-76 through 5-78
EPRI 1995 Water Resource Management and Hydropower Guidebook for Collaboration and Public Involvement Electric Power Research Institute TR-104858 1995
FERC 1999 FERC Annual Charges Federal Energy Regulatory Commission telefax August 13 1999
FERC 2003 environmental assessment and license documents Federal Energy Regulatory Commission httpwwwfercgov
Francfort et al 1994 Environmental Mitigation at Hydroelectric Projects DOEID-10360 January 1994
Francfort J E S D Matthews B N Rinehart 2002 Uniform Criteria for US Hydropower Resource Assessment Hydropower Evaluation Software (HES) Userrsquos Manual DOEID-10338 Rev 1 June 2002
Gordon JL 1983 Hydropower Cost Estimates Water Power amp Dam Construction Vol 35 No 11 1983
Hunt RT 2003 R T Hunt private communication with anonymous hydropower industry source January 2003
USBR 2002 Hydropower Construction Costs Trends US Bureau of Reclamation httpwwwusbrgovpowerindexhtml October 2002
25
Appendix A
Cost Estimating Tools
A-1
A-2
A-3
10000M Y = 6E5(C) 070
Y = 3E5(C) 070
Y = 2E5(C) 070
R2 = 074
1000M
Lice
nsin
g C
ost (
2002
$)
100M
FERC 2003 (1980 - 1997) EPRI 1995
FERC 2003 (1999 - 2001) 010M
Undeveloped Sites Dams Without Power Dams With Power 67 Lower Bound 98 Lower Bound
001M 1 10 100 1000 10000
Capacity (MW)
Figure A1A Licensing cost as a function of plant capacity for an undeveloped site and powerhouse installation at a dam without power and as a function of added capacity for a plant expansion
1 to 1
0
10 to
20
20 to
30
30 to
40
40 to
50
gt 50
$105694
$20572000
1 MW 1167 MW Capacity (MW)
Cos
t (20
02$)
Total No of Data Points = 162 102
22 13
5 4 16
0
20
40
60
80
100
120
No
of D
ata
Poin
ts
A-4
Capacity Range (MW)
Figure A-1B Number of licensing cost data points for various plant capacity ranges
Y = 3E6(C) 090
R2 = 081
10M
100M
1000M
10000M
100000M C
onst
ruct
ion
Cos
t (20
02$)
EIA 2003a (1990 - 2000) 67 Upper Bound Undeveloped Sites 67 Lower Bound
A-5
1 10 100 1000 10000 Capacity (MW)
Figure A-2A Plant construction cost as a function of plant capacity for undeveloped sites
1 to 1
0
10 to
20
20 to
30
30 to
40
40 to
50
50 to
60
60 to
70
70 to
80
80 to
90
90 to
1 00
100 t
o 150
15
0 to 2
00
200 t
o 250
gt 250
$1 4 11 4 5 3
$2 1 80 5 39 8 3 9
1 M W 1 28 0 M WCapacity (MW)
Cos
t (20
02$)
Total No of Data Points = 267 47
40
24 23
15 11
6
13 9 10
31
12
6
20
0
5
10
15
20
25
30
35
40
45
50
55
No
of D
ata
Poin
ts
A-6
Capacity Range (MW)
Figure A-2B Number of undeveloped site construction cost data points for various plant capacity ranges
A-7 C
onst
ruct
ion
Cost
(200
2$)
100000M
10000M
1000M
100M
10M
01M
Y = 1E6(C)081
Y = 2E6(C) 081
R2 = 074
1 10 100 1000 10000 Capacity (MW)
EIA 2003a (1990 - 2000) Christensen 1986
67 Upper Bound
Dams With Power Dams Without Power
Figure A-3A Construction cost as a function of plant capacity for a powerhouse installation at a dam without power or as a function of added capacity for a plant expansion
1 to 1
0
10 to
20
20 to
30
30 to
40
40 to
50
50 to
60
60 to
70
70 to
80
80 to
90
90 to
100
100 t
o 150
15
0 to 2
00
200 t
o 250
gt 250
$89 8 2 9 4
$1 1 69 4 85 4 7 6
1 M W 1 28 0 M WCapacity (MW)
Cos
t (20
02$)
Total No of Data Points = 226
19
37
21 20
14
10
6
12 9 10
30
12
6
20
0
5
10
15
20
25
30
35
40
No
of D
ata
Poin
ts
A-8
Capacity Range (MW)
Figure A-3B Number of powerhouse construction cost data points for various plant capacity ranges
A-9
100000M
10000M
1000M
100M
010M
001M
Y = 2E5(C)096
Y = 8E4(C) 096
R2 = 070
1 10 100 1000 10000 Capacity (MW)
FERC 2003 (1980 - 1997)
Undeveloped Sites Dams Without Power
FERC 2003 (1999 - 2001)
67 Lower Bound Dams With Power
98 Lower Bound
Y = 3E5(C)096
Figure A-4A Fish and wildlife mitigation cost as a function of plant capacity for undeveloped sites and powerhouse installation at a dam without power and as a function of added capacity for a plant expansion
Fish
and
Wild
life
Miti
gatio
n C
ost (
2002
$)
1 to 1
0
10 to
20
20 to
30
30 to
40
40 to
50
gt 50
$36773
$27271669
1 MW 697 MW Capacity (MW)
Cos
t (20
02$)
Total No of Data Points = 74 42
11 7
2 3
9
0
5
10
15
20
25
30
35
40
45
No
of D
ata
Poin
ts
A-10
Capacity Range (MW)
Figure A-4B Number of fish and wildlife mitigation cost data points for various plant capacity ranges
A-11
1000000M
100000M
10000M
1000M
0100M
0010M
0001M
Y = 6E4(C) 097
R2 = 087
097
1 10 100 1000 10000 Capacity (MW)
FERC 2003 (1980 - 1997)
Undeveloped Sites Dams Without Power
FERC 2003 (1999 - 2001)
67 Lower Bound Dams With Power
98 Lower Bound
Y = 2E5(C) Y = 2E5(C) 097
Figure A-5A Recreation mitigation cost as a function of plant capacity for undeveloped sites and powerhouse installation at a dam without power and as a function of added capacity for a plant expansion
Rec
reat
ion
Miti
gatio
n C
ost (
2002
$)
1 to 1
0
10 to
20
20 to
30
30 to
40
40 to
50
gt50
$9 2 6 7
$ 27 7 34 6 7 4
1 M W 69 7 M WCapacity (MW)
Cos
t (20
02$)
Total No of Data Points = 101 63
13
5 4 3
13
0
10
20
30
40
50
60
70
No
of D
ata
Poin
ts
A-12
Capacity Range (MW)
Figure A-5B Number of recreation mitigation cost data points for various plant capacity ranges
A-13
10000M
072Y = 1E5(C) 0721000M Y = 8E4(C)
072Y = 6E4(C) R2 = 094
100M
FERC 2003 (1980 - 1997) FERC 2003 (1999 - 2001) 010M Undeveloped Sites Dams Without Power Dams With Power 67 Lower Bound 98 Lower Bound
001M 1 10 100 1000 10000
Capacity (MW)
Figure A-6A Historical and archeological mitigation cost as a function of plant capacity for undeveloped sites and powerhouse installation at a dam without power and as a function of added capacity for a plant expansion
His
toric
al amp
Arc
heol
ogic
al M
itiga
tion
Cos
t (20
02$)
1 to 1
0
10 to
20
20 to
30
30 to
40
40 to
50
gt 50
$10 3 93 9
$6 0 32 1 12
4 M W 69 7 M WCapacity (MW)
Cos
t (20
02$)
Total No of Data Points = 22 12
1
4
0
2 3
0
2
4
6
8
10
12
14
No
of D
ata
Poin
ts
A-14
Capacity Range (MW)
Figure A-6B Number of historical and archeological mitigation cost data points for various plant capacity ranges
10000M
Y = 7E4(C)044
R2 = 056
Y = 2E5(C)044
0010M
0100M
1000M
Wat
er Q
ualit
y M
onito
ring
Cos
t (20
02$)
FERC 2003 (1980 - 1997)
Undeveloped Sites Dams Without Power
FERC 2003 (1999 - 2001)
67 Lower Bound Dams With Power
98 Lower Bound
Y = 4E5(C)044
A-15
0001M 1 10 100 1000 10000
Capacity (MW)
Figure A-7A Water quality monitoring cost as a function of plant capacity for undeveloped sites and powerhouse installation at a dam without power and as a function of added capacity for a plant expansion
1 to 1
0
10 to
20
20 to
30
30 to
40
40 to
50
gt50
$7 6 73
$2 2 09 7 09
1 44 M W 69 7 M WCapacity (MW)
Cos
t (20
02$)
Total No of Data Points = 89 51
14
7 3 2
12
0
10
20
30
40
50
60
No
of D
ata
Poin
ts
A-16
Capacity Range (MW)
Figure A-7B Number of water quality monitoring cost data points for various plant capacity ranges
A-17
1000M
Y = 1E6(C)056
R2 = 099
100M
Fish
Pas
sage
Cos
t (20
02$)
Francfort 1994 FERC 2003 (1999 - 2001)
67 Upper Bound Fish Passage 67 Lower Bound
10M 1 10 100 1000 10000
Capacity (MW)
Figure A-8A Fish passage cost as a function of plant capacity for undeveloped sites and powerhouse installation at a dam without power and as a function of added capacity for a plant expansion
1 to 1
0
10 to
20
20 to
30
30 to
40
40 to
50
gt50
A-18
$1 0 12 3 7 4
$ 52 7 62 5 0 0
1 M W 84 0 M WCapacity (MW)
Cos
t (20
02$)
No
of D
ata
Poin
ts
7
6
5
4
3
2
1
0
1
6 Total No of Data Points = 10
0 0 0
3
Capacity Range (MW)
Figure A-8B Number of fish passage cost data points for various plant capacity ranges
A-19
Y = 2E4(C)075
R2 = 060
001M
010M
100M
1000M
10000M
Fixe
d O
ampM
Cos
t (20
02$)
EIA 2003b (1990 - 2000) 67 Upper Bound All Sites 67 Lower Bound
1 10 100 1000 10000
Capacity (MW)
Figure A-9A Fixed operating and maintenance costs as a function of plant capacity for undeveloped sites and powerhouse installation at a dam without power and as a function of added capacity for a plant expansion
1 to 1
0
10 to
20
20 to
30
30 to
40
40 to
50
50 to
60
60 to
70
70 to
80
80 to
90
90 to
100
100 t
o 150
15
0 to 2
00
200 t
o 250
gt 250
$ 17 1 5 7
$ 11 4 92 7 7 4
1 M W 1 28 0 M WCapacity (MW)
Cos
t (20
02$)
Total No of Data Points = 474
24
105
55 47
33 27
14 19
14 12
51
25
11
37
0
20
40
60
80
10 0
12 0
No
of D
ata
Poin
ts
A-20
Capacity Range (MW)
Figure A-9B Number of fixed operation and maintenance cost data points for various plant capacity ranges
Y = 2E4(C)080
R2 = 067
001M
010M
100M
1000M
10000M Va
riabl
e O
ampM
Cos
t (20
02$)
EIA 2003b (1990 - 2000) 67 Upper Bound All Sites 67 Lower Bound
A-21
1 10 100 1000 10000
Capacity (MW)
Figure A-10A Variable operating and maintenance costs as a function of plant capacity for undeveloped and powerhouse installation at a dam without power and as a function of added capacity for a plant expansion
1 to 1
0
10 to
20
20 to
30
30 to
40
40 to
50
50 to
60
60 to
70
70 to
80
80 to
90
90 to
1 00
100 t
o 150
15
0 to 2
00
200 t
o 250
gt 250
$15 104
$12 929 143
1 MW 1 280 MWCapacity (MW)
Cos
t (20
02$)
Total No of Data Points = 501
39
116
58 51
37 25
14 24
14 14
53
25
10 21
0
20
40
60
80
10 0
12 0
14 0
No
of D
ata
Poin
ts
A-22
Capacity Range (MW)
Figure A-10B Number of variable operation and maintenance cost data points for various plant capacity ranges
A-23
Fran
cis
Turb
ine
Upg
rade
Cos
t (20
02$)
1000M
100M
10M
01M
071 -042Y = [3E6 sdot (C) ] sdot (H)
(C = 200 MW) Y = 13E8(H)-042
(C = 100 MW) Y = 77E7(H)-042
(C = 75 MW) Y = 63E7(H)-042
(C = 50 MW) Y = 47E7(H)-042
(C = 20 MW) Y = 25E7(H)-042
(C = 10 MW) Y = 15E7(H)-042
(C = 5 MW) Y = 92E6(H)-042
100 1000 Head (ft)
Figure A-11 Francis turbine upgrade cost as a function hydraulic head for various plant capacities
10000
A-24
1000M
100M
10M
(C = 5 MW) Y = 13E7(H)-038
(C = 10 MW) Y = 22E7(H)-038
(C = 20 MW) Y = 37E7(H)-038
(C = 50 MW) Y = 71E7(H)-038
(C = 75 MW) Y = 95E7(H)-038 (C = 100 MW) Y = 12E8(H)-038
(C = 200 MW) Y = 19E8(H)-038
10 100
Head (ft)
-038072 )H(](C)[4E6Y sdotsdot=
Figure A-12 Kaplan turbine upgrade cost as a function hydraulic head for various plant capacities
Kap
lan
Turb
ine
Upg
rade
Cos
t (20
02$)
1000
1000M B
ulb
Turb
ine
Upg
rade
Cos
t (20
02$)
100M
(C = 5 MW) Y = 25E7(H)-063
(C = 10 MW) Y = 45E7(H)-063
(C = 20 MW) Y = 82E7(H)-063
(C = 50 MW) Y = 18E8(H)-063
-063086 )H(](C)[6E6Y sdotsdot=
10M 1 10 100 1000
Head (ft)
Figure A-13 Bulb turbine upgrade cost as a function hydraulic head for various plant capacities
A-25
A-26
10M
01M
(C = 5 MW) Y = 84E6(S)-038
(C = 10 MW) Y = 13E7(S)-038
(C = 20 MW) Y = 21E7(S)-038
(C = 50 MW) Y = 37E7(S)-038 (C = 75 MW) Y = 49E7(S)-038 (C = 100 MW) Y = 59E7(S)-038
(C = 200 MW) Y = 92E7(S)-038
100 1000 Speed (RPM)
-038065 )S(](C)[3E6Y sdotsdot=
Figure A-14 Generator upgrade cost as a function of RPM for various plant capacities
1000M
100M
Gen
erat
or U
pgra
de C
ost (
2002
$)
10000
Appendix B
INEEL Hydropower Resource Economics Database (see document back cover for IHRED compact disk)
B-1
B-2
Field Number Field Name Type Description
Appendix B
INEEL Hydropower Resource Economics Database B1 IHRED Data Dictionary B2 IHRED
The data dictionary for the INEEL The IHRED in Excel format is provided on the Hydropower Resource Economics Database compact disk which is in a pocket on the back (IHRED) is given in Table B-1 This table lists the cover of this document The database contains field number parameter name field type (number resource characteristic data estimated or text) field description and units for the development and OampM costs and estimated 78 fields in the database annual and monthly generation for 2155 US
hydropower resources
Table B-1 INEEL Hydropower Resource Economics Database Data Dictionary Units
1 ProjectNumber Text Project Number (FERC number or pseudo FERC number) mdash
2 PlantName Text Name of the project mdash
3 StreamName Text Name of the stream where the project is located mdash
4 StateAbbr Text Two letter abbreviation for the state where the project is located mdash
5 NERCSubregion Text NERC Subregion (1 = East Central Area Reliability Coordination Agreement (ECAR) 2 = Electric Reliability Council of Texas (ERCOT) 3 = Mid-Atlantic Area Council (MAAC) 4 = Mid-America Interconnected Network (MAIN) 5 = Mid-Continent Area Power Pool (MAPP) 6 = Northeast Power Coordinating CouncilNew York (NY) 7 = Northeast Power Coordinating CouncilNew England (NE) 8 = Southeastern Electric Reliability CouncilFlorida (FL) 9 = Southeastern Electric Reliability CouncilExcl Florida (STV) 10 = Southwest Power Pool (SPP) 11 = Western Systems Coordinating CouncilNWP (NWP) 12 = Western Systems Coordinating CouncilRA (RA) 13 = Western Systems Coordinating CouncilCNV (CNV))
mdash
6 Latitude Number Latitude (first digits refer to degrees north last 2 digits refer to minutes)
ddmm
7 Longitude Number Longitude (First digits refer to degrees west last 2 digits refer to minutes)
ddmm
8 ClassCode Text Owner class code (C = Cooperative F = Federal I = Industrial M = Municipal and other non-federal P = Private utility R = Private nonutility)
mdash
9 OwnerName Text Name of project owner mdash
10 Capacity Number Potential capacity at undeveloped sites or sites without power or potential additional capacity at sites with power
MW
11 UnitType Text Type of unit (C = Conventional R = Reversible Z = Missing) mdash
12 PlantType Text Type of Plant (CMB = Combined conventional and reversible units DIV = Gravity diversion (powerhouse on different stream) PDV = Pumped diversion (one-way pumped storage) PMP = Pure (recycled) pump storage RES = Reservoir only ROR = Run-of-river (dam lt= 10 ft high and minimal storage) RRG = Reregulating STG = Storage conventional hydro (dam gt 10 ft high with significant storage) TID = Tidal conventional hydro)
mdash
B-3
Field Number Field Name Type Description
Table B-1 (continued) Units
13 ProjectStatus Text Status of Project (DJ = Disclaimer of FERC jurisdiction EA = Exemption applied for FA = Federally authorized FR = Federally recommended LE = License exemption LJ = Lack of FERC jurisdiction MA = FERC major license application MO = FERC license outstanding NA = FERC minor license application (lt15 kW) NO = FERC minor license outstanding (lt15 kW) PA = FERC preliminary permit application PO = FERC preliminary permit outstanding XX = No status YO = FERC minor part license outstanding ZZ = Missing)
mdash
14 BasinName Text River basin name mdash
15 CountyName Text County where the project is located mdash
16 DamStatus Text Status of Dam (W = With Power WO = Without Power U = Undeveloped)
mdash
17 WSProtection Text WildScenic Protection mdash
18 WSTributary Text WildScenic Tributary or UpstreamDownstream WildScenic Location (YNltblankgt)
mdash
19 Cultural Text Cultural Value (YNltblankgt) mdash
20 Fish Text Fish Value (YNltblankgt) mdash
21 Geological Text Geological Value (YNltblankgt) mdash
22 Historical Text Historical Value (YNltblankgt) mdash
23 Other Text Other criteria such as rare wetland communities and wilderness designation
mdash
24 Recreation Text Recreation Value (YNltblankgt) mdash
25 Scenic Text Scenic Value (YNltblankgt) mdash
26 Wildlife Text Wildlife Value (YNltblankgt) mdash
27 TEW Text ThreatenedEndangered Wildlife (YNltblankgt) mdash
28 TEF Text ThreatenedEndangered Fish (YNltblankgt) mdash
29 FLC103 Text Federal Land Code 103 (National Park Monument Lakeshore Parkway Battlefield or Recreation Area) (YNltblankgt)
mdash
30 FLC104 Text Federal Land Code 104 (National Forest or Grassland) (YNltblankgt)
mdash
31 FLC105 Text Federal Land Code 105 (National Wildlife Refuge Game Preserve or Fish Hatchery) (YNltblankgt)
mdash
32 FLC106 Text Federal Land Code 106 (National Scenic Waterway or Wilderness Area) (YNltblankgt)
mdash
33 FLC107 Text Federal Land Code 107(Indian Reservation) (YNltblankgt) mdash
34 FLC108 Text Federal Land Code 108 (Military Reservation) (YNltblankgt) mdash
35 FLC198 Text Federal Land Code 198 (Not On Federal Land) (YNltblankgt) mdash
36 SiteProb Number Project Environmental Suitability Factor (010 = Development prohibited or highly unlikely 025 = Major reduction in likelihood of development 050 = Likelihood of development reduced by half 075 = Minor reduction in likelihood of development 090 = Little effect on likelihood of development)
mdash
37 LicensingCost Number Total Licensing Cost $K
38 ConstructionCost Number Total Construction Cost $K
39 OvrNiteDevCost Number Overnight Development Cost ( LicensingCost + ConstructionCost ) $K
40 MitHist_Arch Number 30 year Archaeological and Historical mitigation cost (applicable if either Cultural or Historical fields are Y )
$K
41 MitFish_Wildlife Number 30 year fish and wildlife mitigation cost (applicable if any of the Fish Wildlife or TEW fields are Y )
$K
42 MitScenic_Rec Number 30 year scenic and recreation mitigation cost (applicable if either Recreation or Scenic fields are Y )
$K
B-4
Field Number Field Name Type Description
Table B-1 (continued) Units
43 MitWaterMonitor Number 30 year water quality monitoring cost $K
44 MitFishPassage Number 30 year fish passage cost (applicable if TEF field is Y ) $K
45 MitTotal Number Total Mitigation Cost ( Sum of MitHist_Arch MitFish_Wildlife MitScenic_Rec MitWaterMonitor and MitFishPassage )
$K
46 TotalDevCost Number Total Development Cost ( OvrNiteDevCost + MitTotal ) $K
47 UnitTotalDevCost Number Total Development Unit Cost $kW
48 FixedOM Number Average Annual Fixed OampM $K
49 UnitFixedOM Number Average Annual Fixed OampM Unit Cost $kW
50 VariableOM Number Average Annual Variable OampM $K
51 UnitVariableOM Number Average Annual Variable OampM Unit Cost MillskWh
52 FERCAnnChrg Number FERC Annual Charge (applicable if Capacity gt= 15 MW ) $K
53 PFAnnual Number Average Annual Plant Factor -
54 PFJan Number Average January Plant Factor -
55 PFFeb Number Average February Plant Factor -
56 PFMar Number Average March Plant Factor -
57 PFApr Number Average April Plant Factor -
58 PFMay Number Average May Plant Factor -
59 PFJun Number Average June Plant Factor -
60 PFJul Number Average July Plant Factor -
61 PFAug Number Average August Plant Factor -
62 PFSept Number Average September Plant Factor -
63 PFOct Number Average October Plant Factor -
64 PFNov Number Average November Plant Factor -
65 PFDec Number Average December Plant Factor -
66 GenAnnual Number Average Annual Generation MWh
67 GenJan Number Average January Generation MWh
68 GenFeb Number Average February Generation MWh
69 GenMar Number Average March Generation MWh
70 GenApr Number Average April Generation MWh
71 GenMay Number Average May Generation MWh
72 GenJun Number Average June Generation MWh
73 GenJul Number Average July Generation MWh
74 GenAug Number Average August Generation MWh
75 GenSept Number Average September Generation MWh
76 GenOct Number Average October Generation MWh
77 GenNov Number Average November Generation MWh
78 GenDec Number Average December Generation MWh
Special field values NA Value not available in source data
Value removed due to homeland security concerns
B-5
- ABSTRACT
- EXECUTIVE SUMMARY
- ACKNOWLEDGMENTS
- ACRONYMS
- NOMENCLATURE
- INTRODUCTION
- TECHNICAL APPROACH
-
- Cost Estimating Tools for Plant Development or Expansion
-
- Data Sources
- General Method
- Data Screening
- Accounting for Cost Variations by Type of Site
-
- Cost Estimating Tools for Plant Operation and Maintenance
- Cost Estimating Tools for Turbine and Generator Upgrade
- Estimating Plant Electric Generation
- FERC Annual Charge
- Application of Estimating Tools to Hydropower Resources
-
- RESULTS
-
- Cost Estimating Tools for Plant Development or Expansion
- Cost Estimating Tools for Plant Operation and Maintenance
- Cost Estimating Tools for Turbine and Generator Upgrade
- Estimating Plant Electric Generation
- Estimated Economic Parameters for Hydropower Resources
- Likelihood of Development
-
- CONCLUSIONS AND RECOMMENDATIONS
- REFERENCES
-
- B1IHRED Data Dictionary
- B2IHRED
-
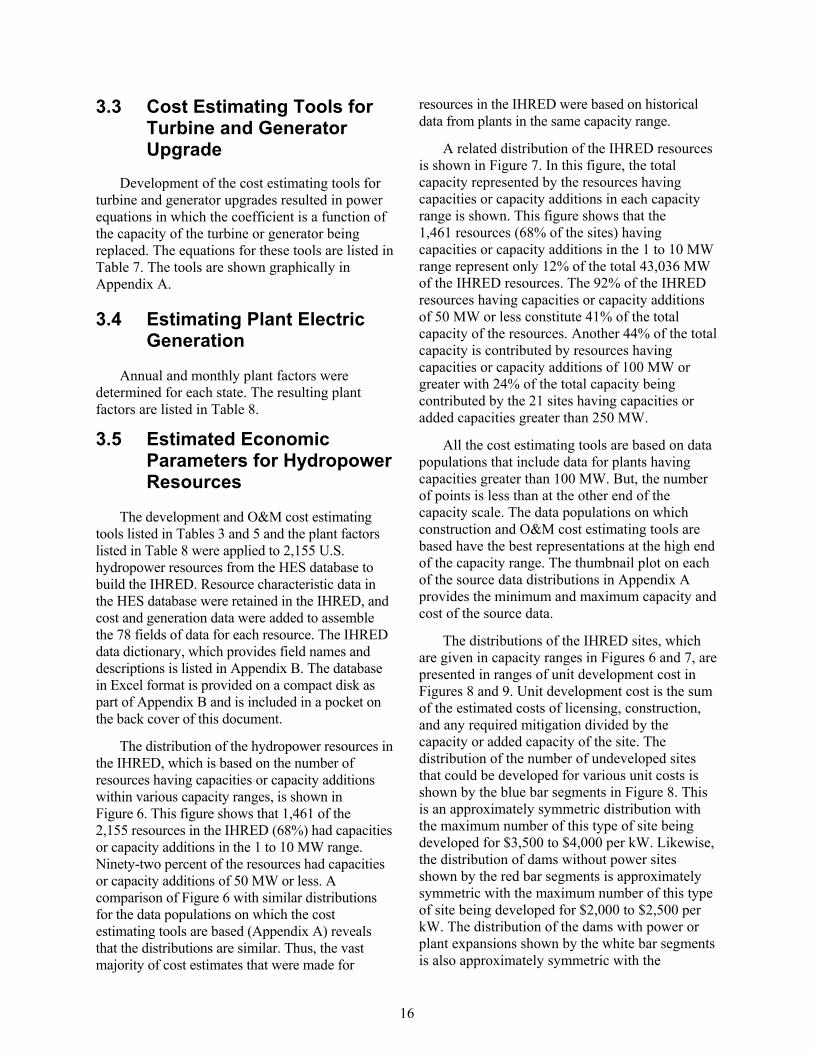

1 to 1
0
10 to
20
20 to
30
30 to
40
40 to
50
50 to
60
60 to
70
70 to
80
80 to
90
90 to
100
100 t
o 150
15
0 to 2
00
200 t
o 250
gt250
C
apac
ity (M
W)
12500
10000
7500
5000
Total Capacity = 43036 MW
1422 33
3159 73
3622 84
1156 27
1214 28
1315 31
1195 28
1954 45
2465 572210
51
3654 85
3890 90
10554 245
5225 121
W i th P o w e r W i thou t Po w e r Und e v e lo ped
2500
0
Capacity Range (MW)
Figure 7 Total capacity of IHRED resources having capacities or capacity additions within various capacity ranges
19
0 to 5
00
500 t
o 100
0 10
00 to
150
0 15
00 to
200
0 20
00 to
250
0 25
00 to
300
0 30
00 to
350
0 35
00 to
400
0 40
00 to
450
0 45
00 to
500
0 50
00 to
550
0 55
00 to
600
0 60
00 to
650
0
20
100
0
Total No of Sites = 2155
1 00
58 0204
43 20
188 87
288 134 272
126
328 152
380 176
3 01
333 155
241 112
65 30
W i th Pow e r W i thout Pow e r Un de v e l o p e d
Unit Cost Range ($kW)
Figure 8 Number of IHRED resources having unit cost (total development) within various unit cost ranges
500
400
300
200No
of S
ites
0 to 5
00
5 00 t
o 100
0 10
00 to
15 0
0 15
00 to
200
0 20
00 to
250
0 25
00 to
300
0 30
00 to
35 0
0 35
00 to
400
0 40
00 to
450
0 45
00 to
50 0
0 50
00 to
55 0
0 55
00 to
600
0 60
00 to
650
0
21
12000
10000
8000
6000
4000
Total Capacity = 43036 MW 10860 252
8369 194
4185 97
1514 35
5516 128
7392 172
3483 81
1265 29
370 09 58
01 15
00 6
00 1
00
W i th P o w e r W i th out Po w e r Un dev el o pedC
apac
ity (M
W)
2000
0
Unit Cost Range ($kW)
Figure 9 Total capacity of IHRED resources having unit cost (total development) within various unit cost ranges
maximum number of this type of site being developed for $1000 to $1500 per kW These maximum points of the respective distributions shift downward in unit cost from the perspective of developing the maximum capacity as shown in Figure 9 The maximum total capacity from undeveloped sites is obtained for $2500 to $3000 per kW while the maximum total capacity is obtained from adding a powerhouse to dams without power for $500 to $1500 per kW The maximum total capacity from plant expansions is obtained for $500 to $1000 per kW Viewed as a whole the results indicate that over 20000 MW of capacity could be developed at unit costs of $1500 per kW or less
When considering new generating plants long-standing energy industry practice has been to use unit costs ($kW) of various facilities as a comparison tool to make development decisions While the unit cost parameter is a good indicator of total development costs using it alone for comparison with other technologies penalizes projects like hydroelectric facilities that have high initial costs long life no fuel costs and low operating costs
The chart showing amounts of capacity (MW) falling within various unit cost ranges (Figure 9) is presented for information as a relative cost indicator for the available hydropower resources analyzed in this study It is not intended to imply an endorsement of the unit cost method to compare various technologies and make development decisions
36 Likelihood of Development
In order to provide the IHRED user with some measure of the likelihood that a particular site will be developed the SITEPROB field and the associated values from the HES database were included in the IHRED as field number 36 This parameter ranges from 010 which indicates the least likely sites to be developed to 090 which indicates the most likely sites The researchers
reasoned that no site has a 0 probability of development just as no site can be predicted to have a 100 probability of development
As described in Francfort et al 2002 the value of the SITEPROB variable is a composite of the values of ldquosuitability factorsrdquo that were determined to apply to a site during the hydropower resource assessment reported in Connor et al 1998 Dependent upon the type of site (undeveloped dam wo power or dam w power) suitability factor values were assigned to each of 12 environmental attributes and seven federally designated land uses The suitability factor values (010 025 050 075 090) reflect a) the probability that the attribute or land use will make a project unacceptable prohibiting its development and b) the degree to which associated licensing and mitigation costs would reduce the economic viability of the project The lowest value indicates that the attribute would tend to prohibit development or make it highly unlikely and the highest value indicates that the attribute will have little effect on the likelihood of development The SITEPROB value is either the single lowest suitability factor associated with the site or the next lowest value when there is more than one occurrence of the lowest value
22
4 CONCLUSIONS AND RECOMMENDATIONS
Analysis of historical hydropower data has shown that the costs of licensing construction five types of mitigation and fixed and variable OampM costs correlate with plant capacity As a result least squares power curve fits of cost as a function of capacity were defined that have R2
values ranging from 056 to 099 These power equations can be used to estimate costs in 2002 dollars for hydropower resources including undeveloped sites addition of a power house to a dam and expansion of an existing hydroelectric plant Functional relationships were also developed that can be used to estimate the cost in 2002 dollars of upgrading three types of turbines (Francis Kaplan and bulb) and upgrading generators
In addition to the cost estimating tools a method for estimating resource annual and monthly electric generation was developed This method which is based on 30 years of generation data can be used to determine generation based on average generation values for the state in which the resource is located
The HES database that contains 5677 hydropower resources and has a total capacity of 69009 MW was evaluated and found to contain 2155 resources having a total capacity of 43036 MW to which the cost and generation estimating tools were applicable Application of the tools resulted in cost and generation data which was assembled to produce the IHRED that included these data and site characteristic information for each of the 2155 resources This database will be useful both in predicting future hydroelectric supply and as a preliminary indication of the feasibility of realizing the potential of hydropower resources
The estimated costs of developing the 2155 sites in the IHRED indicate that over 20000 MW of new capacity could be developed for $1500 per kW or less These sites are existing dams to which a powerhouse could be added or existing hydroelectric plants that could be expanded The development of undeveloped sites is significantly more expensive with a median unit cost of $2700 per kW While the unit cost is relatively high in
comparison with other technologies it should be considered that hydroelectric facilities offer attractive characteristics that offset the high initial cost such as long life no fuel costs and low operating costs as well as reliability dispatchability and peaking power supply among others
This study was constrained to use only data sources that were readily available generally in electronic form In addition questionable or incomplete data could not be evaluated and had to be treated as unusable The data populations on which the cost estimating tools are based could be expanded with greater research and the purchase of private data collections Some of the data that was not used because it appeared questionable or incomplete could possibly be used if it were further researched The larger data populations obtained from these efforts would refine the cost estimating tools
The majority of the estimating tools had R2
values in the 60 and 70 percentiles indicating significant scatter in the data Additional data may increase these R2 values However this scatter may be indicative of dependence on another variable or other variables in addition to plant capacity Alternate functional relationships that may better correlate the data should be investigated
A tool for estimating water quality mitigation could not be produced within the constraints of the study because of the limited data that was readily available and the lack of correlation with a single parameter like plant capacity Greater research would probably add additional data and may result in a method of estimating this parameter The estimating tool for the cost of water quality monitoring which had an R2 value of 056 would no doubt benefit from additional research Such research may well show that dependence on a single variable like plant capacity is not sufficient for estimating this cost
The tools that were developed for estimating the cost of upgrading turbines and generators could not be applied to specific sites to evaluate
23
the potential for capacity increase resulting from these types of upgrades An evaluation of US hydroelectric plants from the perspective of upgrade potential should be performed to create a counterpart to the IHRED containing plant characteristics the estimated cost of the plant upgrade estimated associated licensing and mitigation costs if any estimated incremental OampM costs and added capacity and generation
The method of estimating plant generation should be reviewed to determine whether a more mechanistic model can be developed Use of 30 years of historical data is a good first step but the resulting predictors could probably benefit from refinement based on climatic prediction models Also using state boundaries as the arbiter of what average plant factor applies to a particular location is probably not optimally accurate Plant factors based on hydrography would probably
provide better predictors This approach should be investigated
The present study produced a large volume of data associated with a significant number of hydropower resources It was not within the scope of the study to analyze this data extensively and draw conclusions or make recommendations based on such analysis Greater value could be obtained from the useful product that has been produced if the IHRED data were analyzed to determine the trends and patterns that they contain This analysis should be performed for the benefit of both those who will use the data for predicting future hydroelectric supply and those who are decision makers regarding hydropower development
24
5 REFERENCES
Connor A M J E Francfort B N Rinehart 1998 U S Hydropower Resource Assessment Final Report DOEID-104302 December 1998
Christensen J P 1986 Small Hydropower Development the Process Pitfalls and Experience Vol III DOEID12254-1 June 1986
EHR 2002 What was the Inflation Rate Then Economic History Resources httpwwwehnetehresourceshowmuchinfla tionphp December 5 2002
EIA 2003a Hydroelectric plant data for 1990 through 2000 dataset (FERC Form I Annual Report of Major Electric Utilities Licencees and Others) transmitted as an attachment to T Petersik (EIA) email to R T Hunt (INEEL) October 9 2002
EIA 2003b Hydroelectric plant generation data for 1970 through 2000 dataset (FERC Form I Annual Report of Major Electric Utilities Licencees and Others) transmitted as an attachment to M E Johnson (EIA) email to R T Hunt (INEEL) December 19 2002
ENR 2002 Building Cost Index History (1915ndash2002) Engineering News-Record httpenrconstructioncomcostcostbciasp August 14 2002
EPRI 1989 Hydropower Plant Modernization Guide Vol 1 Electric Power Research Institute GS-6419 July 1989 pp 5-76 through 5-78
EPRI 1995 Water Resource Management and Hydropower Guidebook for Collaboration and Public Involvement Electric Power Research Institute TR-104858 1995
FERC 1999 FERC Annual Charges Federal Energy Regulatory Commission telefax August 13 1999
FERC 2003 environmental assessment and license documents Federal Energy Regulatory Commission httpwwwfercgov
Francfort et al 1994 Environmental Mitigation at Hydroelectric Projects DOEID-10360 January 1994
Francfort J E S D Matthews B N Rinehart 2002 Uniform Criteria for US Hydropower Resource Assessment Hydropower Evaluation Software (HES) Userrsquos Manual DOEID-10338 Rev 1 June 2002
Gordon JL 1983 Hydropower Cost Estimates Water Power amp Dam Construction Vol 35 No 11 1983
Hunt RT 2003 R T Hunt private communication with anonymous hydropower industry source January 2003
USBR 2002 Hydropower Construction Costs Trends US Bureau of Reclamation httpwwwusbrgovpowerindexhtml October 2002
25
Appendix A
Cost Estimating Tools
A-1
A-2
A-3
10000M Y = 6E5(C) 070
Y = 3E5(C) 070
Y = 2E5(C) 070
R2 = 074
1000M
Lice
nsin
g C
ost (
2002
$)
100M
FERC 2003 (1980 - 1997) EPRI 1995
FERC 2003 (1999 - 2001) 010M
Undeveloped Sites Dams Without Power Dams With Power 67 Lower Bound 98 Lower Bound
001M 1 10 100 1000 10000
Capacity (MW)
Figure A1A Licensing cost as a function of plant capacity for an undeveloped site and powerhouse installation at a dam without power and as a function of added capacity for a plant expansion
1 to 1
0
10 to
20
20 to
30
30 to
40
40 to
50
gt 50
$105694
$20572000
1 MW 1167 MW Capacity (MW)
Cos
t (20
02$)
Total No of Data Points = 162 102
22 13
5 4 16
0
20
40
60
80
100
120
No
of D
ata
Poin
ts
A-4
Capacity Range (MW)
Figure A-1B Number of licensing cost data points for various plant capacity ranges
Y = 3E6(C) 090
R2 = 081
10M
100M
1000M
10000M
100000M C
onst
ruct
ion
Cos
t (20
02$)
EIA 2003a (1990 - 2000) 67 Upper Bound Undeveloped Sites 67 Lower Bound
A-5
1 10 100 1000 10000 Capacity (MW)
Figure A-2A Plant construction cost as a function of plant capacity for undeveloped sites
1 to 1
0
10 to
20
20 to
30
30 to
40
40 to
50
50 to
60
60 to
70
70 to
80
80 to
90
90 to
1 00
100 t
o 150
15
0 to 2
00
200 t
o 250
gt 250
$1 4 11 4 5 3
$2 1 80 5 39 8 3 9
1 M W 1 28 0 M WCapacity (MW)
Cos
t (20
02$)
Total No of Data Points = 267 47
40
24 23
15 11
6
13 9 10
31
12
6
20
0
5
10
15
20
25
30
35
40
45
50
55
No
of D
ata
Poin
ts
A-6
Capacity Range (MW)
Figure A-2B Number of undeveloped site construction cost data points for various plant capacity ranges
A-7 C
onst
ruct
ion
Cost
(200
2$)
100000M
10000M
1000M
100M
10M
01M
Y = 1E6(C)081
Y = 2E6(C) 081
R2 = 074
1 10 100 1000 10000 Capacity (MW)
EIA 2003a (1990 - 2000) Christensen 1986
67 Upper Bound
Dams With Power Dams Without Power
Figure A-3A Construction cost as a function of plant capacity for a powerhouse installation at a dam without power or as a function of added capacity for a plant expansion
1 to 1
0
10 to
20
20 to
30
30 to
40
40 to
50
50 to
60
60 to
70
70 to
80
80 to
90
90 to
100
100 t
o 150
15
0 to 2
00
200 t
o 250
gt 250
$89 8 2 9 4
$1 1 69 4 85 4 7 6
1 M W 1 28 0 M WCapacity (MW)
Cos
t (20
02$)
Total No of Data Points = 226
19
37
21 20
14
10
6
12 9 10
30
12
6
20
0
5
10
15
20
25
30
35
40
No
of D
ata
Poin
ts
A-8
Capacity Range (MW)
Figure A-3B Number of powerhouse construction cost data points for various plant capacity ranges
A-9
100000M
10000M
1000M
100M
010M
001M
Y = 2E5(C)096
Y = 8E4(C) 096
R2 = 070
1 10 100 1000 10000 Capacity (MW)
FERC 2003 (1980 - 1997)
Undeveloped Sites Dams Without Power
FERC 2003 (1999 - 2001)
67 Lower Bound Dams With Power
98 Lower Bound
Y = 3E5(C)096
Figure A-4A Fish and wildlife mitigation cost as a function of plant capacity for undeveloped sites and powerhouse installation at a dam without power and as a function of added capacity for a plant expansion
Fish
and
Wild
life
Miti
gatio
n C
ost (
2002
$)
1 to 1
0
10 to
20
20 to
30
30 to
40
40 to
50
gt 50
$36773
$27271669
1 MW 697 MW Capacity (MW)
Cos
t (20
02$)
Total No of Data Points = 74 42
11 7
2 3
9
0
5
10
15
20
25
30
35
40
45
No
of D
ata
Poin
ts
A-10
Capacity Range (MW)
Figure A-4B Number of fish and wildlife mitigation cost data points for various plant capacity ranges
A-11
1000000M
100000M
10000M
1000M
0100M
0010M
0001M
Y = 6E4(C) 097
R2 = 087
097
1 10 100 1000 10000 Capacity (MW)
FERC 2003 (1980 - 1997)
Undeveloped Sites Dams Without Power
FERC 2003 (1999 - 2001)
67 Lower Bound Dams With Power
98 Lower Bound
Y = 2E5(C) Y = 2E5(C) 097
Figure A-5A Recreation mitigation cost as a function of plant capacity for undeveloped sites and powerhouse installation at a dam without power and as a function of added capacity for a plant expansion
Rec
reat
ion
Miti
gatio
n C
ost (
2002
$)
1 to 1
0
10 to
20
20 to
30
30 to
40
40 to
50
gt50
$9 2 6 7
$ 27 7 34 6 7 4
1 M W 69 7 M WCapacity (MW)
Cos
t (20
02$)
Total No of Data Points = 101 63
13
5 4 3
13
0
10
20
30
40
50
60
70
No
of D
ata
Poin
ts
A-12
Capacity Range (MW)
Figure A-5B Number of recreation mitigation cost data points for various plant capacity ranges
A-13
10000M
072Y = 1E5(C) 0721000M Y = 8E4(C)
072Y = 6E4(C) R2 = 094
100M
FERC 2003 (1980 - 1997) FERC 2003 (1999 - 2001) 010M Undeveloped Sites Dams Without Power Dams With Power 67 Lower Bound 98 Lower Bound
001M 1 10 100 1000 10000
Capacity (MW)
Figure A-6A Historical and archeological mitigation cost as a function of plant capacity for undeveloped sites and powerhouse installation at a dam without power and as a function of added capacity for a plant expansion
His
toric
al amp
Arc
heol
ogic
al M
itiga
tion
Cos
t (20
02$)
1 to 1
0
10 to
20
20 to
30
30 to
40
40 to
50
gt 50
$10 3 93 9
$6 0 32 1 12
4 M W 69 7 M WCapacity (MW)
Cos
t (20
02$)
Total No of Data Points = 22 12
1
4
0
2 3
0
2
4
6
8
10
12
14
No
of D
ata
Poin
ts
A-14
Capacity Range (MW)
Figure A-6B Number of historical and archeological mitigation cost data points for various plant capacity ranges
10000M
Y = 7E4(C)044
R2 = 056
Y = 2E5(C)044
0010M
0100M
1000M
Wat
er Q
ualit
y M
onito
ring
Cos
t (20
02$)
FERC 2003 (1980 - 1997)
Undeveloped Sites Dams Without Power
FERC 2003 (1999 - 2001)
67 Lower Bound Dams With Power
98 Lower Bound
Y = 4E5(C)044
A-15
0001M 1 10 100 1000 10000
Capacity (MW)
Figure A-7A Water quality monitoring cost as a function of plant capacity for undeveloped sites and powerhouse installation at a dam without power and as a function of added capacity for a plant expansion
1 to 1
0
10 to
20
20 to
30
30 to
40
40 to
50
gt50
$7 6 73
$2 2 09 7 09
1 44 M W 69 7 M WCapacity (MW)
Cos
t (20
02$)
Total No of Data Points = 89 51
14
7 3 2
12
0
10
20
30
40
50
60
No
of D
ata
Poin
ts
A-16
Capacity Range (MW)
Figure A-7B Number of water quality monitoring cost data points for various plant capacity ranges
A-17
1000M
Y = 1E6(C)056
R2 = 099
100M
Fish
Pas
sage
Cos
t (20
02$)
Francfort 1994 FERC 2003 (1999 - 2001)
67 Upper Bound Fish Passage 67 Lower Bound
10M 1 10 100 1000 10000
Capacity (MW)
Figure A-8A Fish passage cost as a function of plant capacity for undeveloped sites and powerhouse installation at a dam without power and as a function of added capacity for a plant expansion
1 to 1
0
10 to
20
20 to
30
30 to
40
40 to
50
gt50
A-18
$1 0 12 3 7 4
$ 52 7 62 5 0 0
1 M W 84 0 M WCapacity (MW)
Cos
t (20
02$)
No
of D
ata
Poin
ts
7
6
5
4
3
2
1
0
1
6 Total No of Data Points = 10
0 0 0
3
Capacity Range (MW)
Figure A-8B Number of fish passage cost data points for various plant capacity ranges
A-19
Y = 2E4(C)075
R2 = 060
001M
010M
100M
1000M
10000M
Fixe
d O
ampM
Cos
t (20
02$)
EIA 2003b (1990 - 2000) 67 Upper Bound All Sites 67 Lower Bound
1 10 100 1000 10000
Capacity (MW)
Figure A-9A Fixed operating and maintenance costs as a function of plant capacity for undeveloped sites and powerhouse installation at a dam without power and as a function of added capacity for a plant expansion
1 to 1
0
10 to
20
20 to
30
30 to
40
40 to
50
50 to
60
60 to
70
70 to
80
80 to
90
90 to
100
100 t
o 150
15
0 to 2
00
200 t
o 250
gt 250
$ 17 1 5 7
$ 11 4 92 7 7 4
1 M W 1 28 0 M WCapacity (MW)
Cos
t (20
02$)
Total No of Data Points = 474
24
105
55 47
33 27
14 19
14 12
51
25
11
37
0
20
40
60
80
10 0
12 0
No
of D
ata
Poin
ts
A-20
Capacity Range (MW)
Figure A-9B Number of fixed operation and maintenance cost data points for various plant capacity ranges
Y = 2E4(C)080
R2 = 067
001M
010M
100M
1000M
10000M Va
riabl
e O
ampM
Cos
t (20
02$)
EIA 2003b (1990 - 2000) 67 Upper Bound All Sites 67 Lower Bound
A-21
1 10 100 1000 10000
Capacity (MW)
Figure A-10A Variable operating and maintenance costs as a function of plant capacity for undeveloped and powerhouse installation at a dam without power and as a function of added capacity for a plant expansion
1 to 1
0
10 to
20
20 to
30
30 to
40
40 to
50
50 to
60
60 to
70
70 to
80
80 to
90
90 to
1 00
100 t
o 150
15
0 to 2
00
200 t
o 250
gt 250
$15 104
$12 929 143
1 MW 1 280 MWCapacity (MW)
Cos
t (20
02$)
Total No of Data Points = 501
39
116
58 51
37 25
14 24
14 14
53
25
10 21
0
20
40
60
80
10 0
12 0
14 0
No
of D
ata
Poin
ts
A-22
Capacity Range (MW)
Figure A-10B Number of variable operation and maintenance cost data points for various plant capacity ranges
A-23
Fran
cis
Turb
ine
Upg
rade
Cos
t (20
02$)
1000M
100M
10M
01M
071 -042Y = [3E6 sdot (C) ] sdot (H)
(C = 200 MW) Y = 13E8(H)-042
(C = 100 MW) Y = 77E7(H)-042
(C = 75 MW) Y = 63E7(H)-042
(C = 50 MW) Y = 47E7(H)-042
(C = 20 MW) Y = 25E7(H)-042
(C = 10 MW) Y = 15E7(H)-042
(C = 5 MW) Y = 92E6(H)-042
100 1000 Head (ft)
Figure A-11 Francis turbine upgrade cost as a function hydraulic head for various plant capacities
10000
A-24
1000M
100M
10M
(C = 5 MW) Y = 13E7(H)-038
(C = 10 MW) Y = 22E7(H)-038
(C = 20 MW) Y = 37E7(H)-038
(C = 50 MW) Y = 71E7(H)-038
(C = 75 MW) Y = 95E7(H)-038 (C = 100 MW) Y = 12E8(H)-038
(C = 200 MW) Y = 19E8(H)-038
10 100
Head (ft)
-038072 )H(](C)[4E6Y sdotsdot=
Figure A-12 Kaplan turbine upgrade cost as a function hydraulic head for various plant capacities
Kap
lan
Turb
ine
Upg
rade
Cos
t (20
02$)
1000
1000M B
ulb
Turb
ine
Upg
rade
Cos
t (20
02$)
100M
(C = 5 MW) Y = 25E7(H)-063
(C = 10 MW) Y = 45E7(H)-063
(C = 20 MW) Y = 82E7(H)-063
(C = 50 MW) Y = 18E8(H)-063
-063086 )H(](C)[6E6Y sdotsdot=
10M 1 10 100 1000
Head (ft)
Figure A-13 Bulb turbine upgrade cost as a function hydraulic head for various plant capacities
A-25
A-26
10M
01M
(C = 5 MW) Y = 84E6(S)-038
(C = 10 MW) Y = 13E7(S)-038
(C = 20 MW) Y = 21E7(S)-038
(C = 50 MW) Y = 37E7(S)-038 (C = 75 MW) Y = 49E7(S)-038 (C = 100 MW) Y = 59E7(S)-038
(C = 200 MW) Y = 92E7(S)-038
100 1000 Speed (RPM)
-038065 )S(](C)[3E6Y sdotsdot=
Figure A-14 Generator upgrade cost as a function of RPM for various plant capacities
1000M
100M
Gen
erat
or U
pgra
de C
ost (
2002
$)
10000
Appendix B
INEEL Hydropower Resource Economics Database (see document back cover for IHRED compact disk)
B-1
B-2
Field Number Field Name Type Description
Appendix B
INEEL Hydropower Resource Economics Database B1 IHRED Data Dictionary B2 IHRED
The data dictionary for the INEEL The IHRED in Excel format is provided on the Hydropower Resource Economics Database compact disk which is in a pocket on the back (IHRED) is given in Table B-1 This table lists the cover of this document The database contains field number parameter name field type (number resource characteristic data estimated or text) field description and units for the development and OampM costs and estimated 78 fields in the database annual and monthly generation for 2155 US
hydropower resources
Table B-1 INEEL Hydropower Resource Economics Database Data Dictionary Units
1 ProjectNumber Text Project Number (FERC number or pseudo FERC number) mdash
2 PlantName Text Name of the project mdash
3 StreamName Text Name of the stream where the project is located mdash
4 StateAbbr Text Two letter abbreviation for the state where the project is located mdash
5 NERCSubregion Text NERC Subregion (1 = East Central Area Reliability Coordination Agreement (ECAR) 2 = Electric Reliability Council of Texas (ERCOT) 3 = Mid-Atlantic Area Council (MAAC) 4 = Mid-America Interconnected Network (MAIN) 5 = Mid-Continent Area Power Pool (MAPP) 6 = Northeast Power Coordinating CouncilNew York (NY) 7 = Northeast Power Coordinating CouncilNew England (NE) 8 = Southeastern Electric Reliability CouncilFlorida (FL) 9 = Southeastern Electric Reliability CouncilExcl Florida (STV) 10 = Southwest Power Pool (SPP) 11 = Western Systems Coordinating CouncilNWP (NWP) 12 = Western Systems Coordinating CouncilRA (RA) 13 = Western Systems Coordinating CouncilCNV (CNV))
mdash
6 Latitude Number Latitude (first digits refer to degrees north last 2 digits refer to minutes)
ddmm
7 Longitude Number Longitude (First digits refer to degrees west last 2 digits refer to minutes)
ddmm
8 ClassCode Text Owner class code (C = Cooperative F = Federal I = Industrial M = Municipal and other non-federal P = Private utility R = Private nonutility)
mdash
9 OwnerName Text Name of project owner mdash
10 Capacity Number Potential capacity at undeveloped sites or sites without power or potential additional capacity at sites with power
MW
11 UnitType Text Type of unit (C = Conventional R = Reversible Z = Missing) mdash
12 PlantType Text Type of Plant (CMB = Combined conventional and reversible units DIV = Gravity diversion (powerhouse on different stream) PDV = Pumped diversion (one-way pumped storage) PMP = Pure (recycled) pump storage RES = Reservoir only ROR = Run-of-river (dam lt= 10 ft high and minimal storage) RRG = Reregulating STG = Storage conventional hydro (dam gt 10 ft high with significant storage) TID = Tidal conventional hydro)
mdash
B-3
Field Number Field Name Type Description
Table B-1 (continued) Units
13 ProjectStatus Text Status of Project (DJ = Disclaimer of FERC jurisdiction EA = Exemption applied for FA = Federally authorized FR = Federally recommended LE = License exemption LJ = Lack of FERC jurisdiction MA = FERC major license application MO = FERC license outstanding NA = FERC minor license application (lt15 kW) NO = FERC minor license outstanding (lt15 kW) PA = FERC preliminary permit application PO = FERC preliminary permit outstanding XX = No status YO = FERC minor part license outstanding ZZ = Missing)
mdash
14 BasinName Text River basin name mdash
15 CountyName Text County where the project is located mdash
16 DamStatus Text Status of Dam (W = With Power WO = Without Power U = Undeveloped)
mdash
17 WSProtection Text WildScenic Protection mdash
18 WSTributary Text WildScenic Tributary or UpstreamDownstream WildScenic Location (YNltblankgt)
mdash
19 Cultural Text Cultural Value (YNltblankgt) mdash
20 Fish Text Fish Value (YNltblankgt) mdash
21 Geological Text Geological Value (YNltblankgt) mdash
22 Historical Text Historical Value (YNltblankgt) mdash
23 Other Text Other criteria such as rare wetland communities and wilderness designation
mdash
24 Recreation Text Recreation Value (YNltblankgt) mdash
25 Scenic Text Scenic Value (YNltblankgt) mdash
26 Wildlife Text Wildlife Value (YNltblankgt) mdash
27 TEW Text ThreatenedEndangered Wildlife (YNltblankgt) mdash
28 TEF Text ThreatenedEndangered Fish (YNltblankgt) mdash
29 FLC103 Text Federal Land Code 103 (National Park Monument Lakeshore Parkway Battlefield or Recreation Area) (YNltblankgt)
mdash
30 FLC104 Text Federal Land Code 104 (National Forest or Grassland) (YNltblankgt)
mdash
31 FLC105 Text Federal Land Code 105 (National Wildlife Refuge Game Preserve or Fish Hatchery) (YNltblankgt)
mdash
32 FLC106 Text Federal Land Code 106 (National Scenic Waterway or Wilderness Area) (YNltblankgt)
mdash
33 FLC107 Text Federal Land Code 107(Indian Reservation) (YNltblankgt) mdash
34 FLC108 Text Federal Land Code 108 (Military Reservation) (YNltblankgt) mdash
35 FLC198 Text Federal Land Code 198 (Not On Federal Land) (YNltblankgt) mdash
36 SiteProb Number Project Environmental Suitability Factor (010 = Development prohibited or highly unlikely 025 = Major reduction in likelihood of development 050 = Likelihood of development reduced by half 075 = Minor reduction in likelihood of development 090 = Little effect on likelihood of development)
mdash
37 LicensingCost Number Total Licensing Cost $K
38 ConstructionCost Number Total Construction Cost $K
39 OvrNiteDevCost Number Overnight Development Cost ( LicensingCost + ConstructionCost ) $K
40 MitHist_Arch Number 30 year Archaeological and Historical mitigation cost (applicable if either Cultural or Historical fields are Y )
$K
41 MitFish_Wildlife Number 30 year fish and wildlife mitigation cost (applicable if any of the Fish Wildlife or TEW fields are Y )
$K
42 MitScenic_Rec Number 30 year scenic and recreation mitigation cost (applicable if either Recreation or Scenic fields are Y )
$K
B-4
Field Number Field Name Type Description
Table B-1 (continued) Units
43 MitWaterMonitor Number 30 year water quality monitoring cost $K
44 MitFishPassage Number 30 year fish passage cost (applicable if TEF field is Y ) $K
45 MitTotal Number Total Mitigation Cost ( Sum of MitHist_Arch MitFish_Wildlife MitScenic_Rec MitWaterMonitor and MitFishPassage )
$K
46 TotalDevCost Number Total Development Cost ( OvrNiteDevCost + MitTotal ) $K
47 UnitTotalDevCost Number Total Development Unit Cost $kW
48 FixedOM Number Average Annual Fixed OampM $K
49 UnitFixedOM Number Average Annual Fixed OampM Unit Cost $kW
50 VariableOM Number Average Annual Variable OampM $K
51 UnitVariableOM Number Average Annual Variable OampM Unit Cost MillskWh
52 FERCAnnChrg Number FERC Annual Charge (applicable if Capacity gt= 15 MW ) $K
53 PFAnnual Number Average Annual Plant Factor -
54 PFJan Number Average January Plant Factor -
55 PFFeb Number Average February Plant Factor -
56 PFMar Number Average March Plant Factor -
57 PFApr Number Average April Plant Factor -
58 PFMay Number Average May Plant Factor -
59 PFJun Number Average June Plant Factor -
60 PFJul Number Average July Plant Factor -
61 PFAug Number Average August Plant Factor -
62 PFSept Number Average September Plant Factor -
63 PFOct Number Average October Plant Factor -
64 PFNov Number Average November Plant Factor -
65 PFDec Number Average December Plant Factor -
66 GenAnnual Number Average Annual Generation MWh
67 GenJan Number Average January Generation MWh
68 GenFeb Number Average February Generation MWh
69 GenMar Number Average March Generation MWh
70 GenApr Number Average April Generation MWh
71 GenMay Number Average May Generation MWh
72 GenJun Number Average June Generation MWh
73 GenJul Number Average July Generation MWh
74 GenAug Number Average August Generation MWh
75 GenSept Number Average September Generation MWh
76 GenOct Number Average October Generation MWh
77 GenNov Number Average November Generation MWh
78 GenDec Number Average December Generation MWh
Special field values NA Value not available in source data
Value removed due to homeland security concerns
B-5
- ABSTRACT
- EXECUTIVE SUMMARY
- ACKNOWLEDGMENTS
- ACRONYMS
- NOMENCLATURE
- INTRODUCTION
- TECHNICAL APPROACH
-
- Cost Estimating Tools for Plant Development or Expansion
-
- Data Sources
- General Method
- Data Screening
- Accounting for Cost Variations by Type of Site
-
- Cost Estimating Tools for Plant Operation and Maintenance
- Cost Estimating Tools for Turbine and Generator Upgrade
- Estimating Plant Electric Generation
- FERC Annual Charge
- Application of Estimating Tools to Hydropower Resources
-
- RESULTS
-
- Cost Estimating Tools for Plant Development or Expansion
- Cost Estimating Tools for Plant Operation and Maintenance
- Cost Estimating Tools for Turbine and Generator Upgrade
- Estimating Plant Electric Generation
- Estimated Economic Parameters for Hydropower Resources
- Likelihood of Development
-
- CONCLUSIONS AND RECOMMENDATIONS
- REFERENCES
-
- B1IHRED Data Dictionary
- B2IHRED
-

0 to 5
00
5 00 t
o 100
0 10
00 to
15 0
0 15
00 to
200
0 20
00 to
250
0 25
00 to
300
0 30
00 to
35 0
0 35
00 to
400
0 40
00 to
450
0 45
00 to
50 0
0 50
00 to
55 0
0 55
00 to
600
0 60
00 to
650
0
21
12000
10000
8000
6000
4000
Total Capacity = 43036 MW 10860 252
8369 194
4185 97
1514 35
5516 128
7392 172
3483 81
1265 29
370 09 58
01 15
00 6
00 1
00
W i th P o w e r W i th out Po w e r Un dev el o pedC
apac
ity (M
W)
2000
0
Unit Cost Range ($kW)
Figure 9 Total capacity of IHRED resources having unit cost (total development) within various unit cost ranges
maximum number of this type of site being developed for $1000 to $1500 per kW These maximum points of the respective distributions shift downward in unit cost from the perspective of developing the maximum capacity as shown in Figure 9 The maximum total capacity from undeveloped sites is obtained for $2500 to $3000 per kW while the maximum total capacity is obtained from adding a powerhouse to dams without power for $500 to $1500 per kW The maximum total capacity from plant expansions is obtained for $500 to $1000 per kW Viewed as a whole the results indicate that over 20000 MW of capacity could be developed at unit costs of $1500 per kW or less
When considering new generating plants long-standing energy industry practice has been to use unit costs ($kW) of various facilities as a comparison tool to make development decisions While the unit cost parameter is a good indicator of total development costs using it alone for comparison with other technologies penalizes projects like hydroelectric facilities that have high initial costs long life no fuel costs and low operating costs
The chart showing amounts of capacity (MW) falling within various unit cost ranges (Figure 9) is presented for information as a relative cost indicator for the available hydropower resources analyzed in this study It is not intended to imply an endorsement of the unit cost method to compare various technologies and make development decisions
36 Likelihood of Development
In order to provide the IHRED user with some measure of the likelihood that a particular site will be developed the SITEPROB field and the associated values from the HES database were included in the IHRED as field number 36 This parameter ranges from 010 which indicates the least likely sites to be developed to 090 which indicates the most likely sites The researchers
reasoned that no site has a 0 probability of development just as no site can be predicted to have a 100 probability of development
As described in Francfort et al 2002 the value of the SITEPROB variable is a composite of the values of ldquosuitability factorsrdquo that were determined to apply to a site during the hydropower resource assessment reported in Connor et al 1998 Dependent upon the type of site (undeveloped dam wo power or dam w power) suitability factor values were assigned to each of 12 environmental attributes and seven federally designated land uses The suitability factor values (010 025 050 075 090) reflect a) the probability that the attribute or land use will make a project unacceptable prohibiting its development and b) the degree to which associated licensing and mitigation costs would reduce the economic viability of the project The lowest value indicates that the attribute would tend to prohibit development or make it highly unlikely and the highest value indicates that the attribute will have little effect on the likelihood of development The SITEPROB value is either the single lowest suitability factor associated with the site or the next lowest value when there is more than one occurrence of the lowest value
22
4 CONCLUSIONS AND RECOMMENDATIONS
Analysis of historical hydropower data has shown that the costs of licensing construction five types of mitigation and fixed and variable OampM costs correlate with plant capacity As a result least squares power curve fits of cost as a function of capacity were defined that have R2
values ranging from 056 to 099 These power equations can be used to estimate costs in 2002 dollars for hydropower resources including undeveloped sites addition of a power house to a dam and expansion of an existing hydroelectric plant Functional relationships were also developed that can be used to estimate the cost in 2002 dollars of upgrading three types of turbines (Francis Kaplan and bulb) and upgrading generators
In addition to the cost estimating tools a method for estimating resource annual and monthly electric generation was developed This method which is based on 30 years of generation data can be used to determine generation based on average generation values for the state in which the resource is located
The HES database that contains 5677 hydropower resources and has a total capacity of 69009 MW was evaluated and found to contain 2155 resources having a total capacity of 43036 MW to which the cost and generation estimating tools were applicable Application of the tools resulted in cost and generation data which was assembled to produce the IHRED that included these data and site characteristic information for each of the 2155 resources This database will be useful both in predicting future hydroelectric supply and as a preliminary indication of the feasibility of realizing the potential of hydropower resources
The estimated costs of developing the 2155 sites in the IHRED indicate that over 20000 MW of new capacity could be developed for $1500 per kW or less These sites are existing dams to which a powerhouse could be added or existing hydroelectric plants that could be expanded The development of undeveloped sites is significantly more expensive with a median unit cost of $2700 per kW While the unit cost is relatively high in
comparison with other technologies it should be considered that hydroelectric facilities offer attractive characteristics that offset the high initial cost such as long life no fuel costs and low operating costs as well as reliability dispatchability and peaking power supply among others
This study was constrained to use only data sources that were readily available generally in electronic form In addition questionable or incomplete data could not be evaluated and had to be treated as unusable The data populations on which the cost estimating tools are based could be expanded with greater research and the purchase of private data collections Some of the data that was not used because it appeared questionable or incomplete could possibly be used if it were further researched The larger data populations obtained from these efforts would refine the cost estimating tools
The majority of the estimating tools had R2
values in the 60 and 70 percentiles indicating significant scatter in the data Additional data may increase these R2 values However this scatter may be indicative of dependence on another variable or other variables in addition to plant capacity Alternate functional relationships that may better correlate the data should be investigated
A tool for estimating water quality mitigation could not be produced within the constraints of the study because of the limited data that was readily available and the lack of correlation with a single parameter like plant capacity Greater research would probably add additional data and may result in a method of estimating this parameter The estimating tool for the cost of water quality monitoring which had an R2 value of 056 would no doubt benefit from additional research Such research may well show that dependence on a single variable like plant capacity is not sufficient for estimating this cost
The tools that were developed for estimating the cost of upgrading turbines and generators could not be applied to specific sites to evaluate
23
the potential for capacity increase resulting from these types of upgrades An evaluation of US hydroelectric plants from the perspective of upgrade potential should be performed to create a counterpart to the IHRED containing plant characteristics the estimated cost of the plant upgrade estimated associated licensing and mitigation costs if any estimated incremental OampM costs and added capacity and generation
The method of estimating plant generation should be reviewed to determine whether a more mechanistic model can be developed Use of 30 years of historical data is a good first step but the resulting predictors could probably benefit from refinement based on climatic prediction models Also using state boundaries as the arbiter of what average plant factor applies to a particular location is probably not optimally accurate Plant factors based on hydrography would probably
provide better predictors This approach should be investigated
The present study produced a large volume of data associated with a significant number of hydropower resources It was not within the scope of the study to analyze this data extensively and draw conclusions or make recommendations based on such analysis Greater value could be obtained from the useful product that has been produced if the IHRED data were analyzed to determine the trends and patterns that they contain This analysis should be performed for the benefit of both those who will use the data for predicting future hydroelectric supply and those who are decision makers regarding hydropower development
24
5 REFERENCES
Connor A M J E Francfort B N Rinehart 1998 U S Hydropower Resource Assessment Final Report DOEID-104302 December 1998
Christensen J P 1986 Small Hydropower Development the Process Pitfalls and Experience Vol III DOEID12254-1 June 1986
EHR 2002 What was the Inflation Rate Then Economic History Resources httpwwwehnetehresourceshowmuchinfla tionphp December 5 2002
EIA 2003a Hydroelectric plant data for 1990 through 2000 dataset (FERC Form I Annual Report of Major Electric Utilities Licencees and Others) transmitted as an attachment to T Petersik (EIA) email to R T Hunt (INEEL) October 9 2002
EIA 2003b Hydroelectric plant generation data for 1970 through 2000 dataset (FERC Form I Annual Report of Major Electric Utilities Licencees and Others) transmitted as an attachment to M E Johnson (EIA) email to R T Hunt (INEEL) December 19 2002
ENR 2002 Building Cost Index History (1915ndash2002) Engineering News-Record httpenrconstructioncomcostcostbciasp August 14 2002
EPRI 1989 Hydropower Plant Modernization Guide Vol 1 Electric Power Research Institute GS-6419 July 1989 pp 5-76 through 5-78
EPRI 1995 Water Resource Management and Hydropower Guidebook for Collaboration and Public Involvement Electric Power Research Institute TR-104858 1995
FERC 1999 FERC Annual Charges Federal Energy Regulatory Commission telefax August 13 1999
FERC 2003 environmental assessment and license documents Federal Energy Regulatory Commission httpwwwfercgov
Francfort et al 1994 Environmental Mitigation at Hydroelectric Projects DOEID-10360 January 1994
Francfort J E S D Matthews B N Rinehart 2002 Uniform Criteria for US Hydropower Resource Assessment Hydropower Evaluation Software (HES) Userrsquos Manual DOEID-10338 Rev 1 June 2002
Gordon JL 1983 Hydropower Cost Estimates Water Power amp Dam Construction Vol 35 No 11 1983
Hunt RT 2003 R T Hunt private communication with anonymous hydropower industry source January 2003
USBR 2002 Hydropower Construction Costs Trends US Bureau of Reclamation httpwwwusbrgovpowerindexhtml October 2002
25
Appendix A
Cost Estimating Tools
A-1
A-2
A-3
10000M Y = 6E5(C) 070
Y = 3E5(C) 070
Y = 2E5(C) 070
R2 = 074
1000M
Lice
nsin
g C
ost (
2002
$)
100M
FERC 2003 (1980 - 1997) EPRI 1995
FERC 2003 (1999 - 2001) 010M
Undeveloped Sites Dams Without Power Dams With Power 67 Lower Bound 98 Lower Bound
001M 1 10 100 1000 10000
Capacity (MW)
Figure A1A Licensing cost as a function of plant capacity for an undeveloped site and powerhouse installation at a dam without power and as a function of added capacity for a plant expansion
1 to 1
0
10 to
20
20 to
30
30 to
40
40 to
50
gt 50
$105694
$20572000
1 MW 1167 MW Capacity (MW)
Cos
t (20
02$)
Total No of Data Points = 162 102
22 13
5 4 16
0
20
40
60
80
100
120
No
of D
ata
Poin
ts
A-4
Capacity Range (MW)
Figure A-1B Number of licensing cost data points for various plant capacity ranges
Y = 3E6(C) 090
R2 = 081
10M
100M
1000M
10000M
100000M C
onst
ruct
ion
Cos
t (20
02$)
EIA 2003a (1990 - 2000) 67 Upper Bound Undeveloped Sites 67 Lower Bound
A-5
1 10 100 1000 10000 Capacity (MW)
Figure A-2A Plant construction cost as a function of plant capacity for undeveloped sites
1 to 1
0
10 to
20
20 to
30
30 to
40
40 to
50
50 to
60
60 to
70
70 to
80
80 to
90
90 to
1 00
100 t
o 150
15
0 to 2
00
200 t
o 250
gt 250
$1 4 11 4 5 3
$2 1 80 5 39 8 3 9
1 M W 1 28 0 M WCapacity (MW)
Cos
t (20
02$)
Total No of Data Points = 267 47
40
24 23
15 11
6
13 9 10
31
12
6
20
0
5
10
15
20
25
30
35
40
45
50
55
No
of D
ata
Poin
ts
A-6
Capacity Range (MW)
Figure A-2B Number of undeveloped site construction cost data points for various plant capacity ranges
A-7 C
onst
ruct
ion
Cost
(200
2$)
100000M
10000M
1000M
100M
10M
01M
Y = 1E6(C)081
Y = 2E6(C) 081
R2 = 074
1 10 100 1000 10000 Capacity (MW)
EIA 2003a (1990 - 2000) Christensen 1986
67 Upper Bound
Dams With Power Dams Without Power
Figure A-3A Construction cost as a function of plant capacity for a powerhouse installation at a dam without power or as a function of added capacity for a plant expansion
1 to 1
0
10 to
20
20 to
30
30 to
40
40 to
50
50 to
60
60 to
70
70 to
80
80 to
90
90 to
100
100 t
o 150
15
0 to 2
00
200 t
o 250
gt 250
$89 8 2 9 4
$1 1 69 4 85 4 7 6
1 M W 1 28 0 M WCapacity (MW)
Cos
t (20
02$)
Total No of Data Points = 226
19
37
21 20
14
10
6
12 9 10
30
12
6
20
0
5
10
15
20
25
30
35
40
No
of D
ata
Poin
ts
A-8
Capacity Range (MW)
Figure A-3B Number of powerhouse construction cost data points for various plant capacity ranges
A-9
100000M
10000M
1000M
100M
010M
001M
Y = 2E5(C)096
Y = 8E4(C) 096
R2 = 070
1 10 100 1000 10000 Capacity (MW)
FERC 2003 (1980 - 1997)
Undeveloped Sites Dams Without Power
FERC 2003 (1999 - 2001)
67 Lower Bound Dams With Power
98 Lower Bound
Y = 3E5(C)096
Figure A-4A Fish and wildlife mitigation cost as a function of plant capacity for undeveloped sites and powerhouse installation at a dam without power and as a function of added capacity for a plant expansion
Fish
and
Wild
life
Miti
gatio
n C
ost (
2002
$)
1 to 1
0
10 to
20
20 to
30
30 to
40
40 to
50
gt 50
$36773
$27271669
1 MW 697 MW Capacity (MW)
Cos
t (20
02$)
Total No of Data Points = 74 42
11 7
2 3
9
0
5
10
15
20
25
30
35
40
45
No
of D
ata
Poin
ts
A-10
Capacity Range (MW)
Figure A-4B Number of fish and wildlife mitigation cost data points for various plant capacity ranges
A-11
1000000M
100000M
10000M
1000M
0100M
0010M
0001M
Y = 6E4(C) 097
R2 = 087
097
1 10 100 1000 10000 Capacity (MW)
FERC 2003 (1980 - 1997)
Undeveloped Sites Dams Without Power
FERC 2003 (1999 - 2001)
67 Lower Bound Dams With Power
98 Lower Bound
Y = 2E5(C) Y = 2E5(C) 097
Figure A-5A Recreation mitigation cost as a function of plant capacity for undeveloped sites and powerhouse installation at a dam without power and as a function of added capacity for a plant expansion
Rec
reat
ion
Miti
gatio
n C
ost (
2002
$)
1 to 1
0
10 to
20
20 to
30
30 to
40
40 to
50
gt50
$9 2 6 7
$ 27 7 34 6 7 4
1 M W 69 7 M WCapacity (MW)
Cos
t (20
02$)
Total No of Data Points = 101 63
13
5 4 3
13
0
10
20
30
40
50
60
70
No
of D
ata
Poin
ts
A-12
Capacity Range (MW)
Figure A-5B Number of recreation mitigation cost data points for various plant capacity ranges
A-13
10000M
072Y = 1E5(C) 0721000M Y = 8E4(C)
072Y = 6E4(C) R2 = 094
100M
FERC 2003 (1980 - 1997) FERC 2003 (1999 - 2001) 010M Undeveloped Sites Dams Without Power Dams With Power 67 Lower Bound 98 Lower Bound
001M 1 10 100 1000 10000
Capacity (MW)
Figure A-6A Historical and archeological mitigation cost as a function of plant capacity for undeveloped sites and powerhouse installation at a dam without power and as a function of added capacity for a plant expansion
His
toric
al amp
Arc
heol
ogic
al M
itiga
tion
Cos
t (20
02$)
1 to 1
0
10 to
20
20 to
30
30 to
40
40 to
50
gt 50
$10 3 93 9
$6 0 32 1 12
4 M W 69 7 M WCapacity (MW)
Cos
t (20
02$)
Total No of Data Points = 22 12
1
4
0
2 3
0
2
4
6
8
10
12
14
No
of D
ata
Poin
ts
A-14
Capacity Range (MW)
Figure A-6B Number of historical and archeological mitigation cost data points for various plant capacity ranges
10000M
Y = 7E4(C)044
R2 = 056
Y = 2E5(C)044
0010M
0100M
1000M
Wat
er Q
ualit
y M
onito
ring
Cos
t (20
02$)
FERC 2003 (1980 - 1997)
Undeveloped Sites Dams Without Power
FERC 2003 (1999 - 2001)
67 Lower Bound Dams With Power
98 Lower Bound
Y = 4E5(C)044
A-15
0001M 1 10 100 1000 10000
Capacity (MW)
Figure A-7A Water quality monitoring cost as a function of plant capacity for undeveloped sites and powerhouse installation at a dam without power and as a function of added capacity for a plant expansion
1 to 1
0
10 to
20
20 to
30
30 to
40
40 to
50
gt50
$7 6 73
$2 2 09 7 09
1 44 M W 69 7 M WCapacity (MW)
Cos
t (20
02$)
Total No of Data Points = 89 51
14
7 3 2
12
0
10
20
30
40
50
60
No
of D
ata
Poin
ts
A-16
Capacity Range (MW)
Figure A-7B Number of water quality monitoring cost data points for various plant capacity ranges
A-17
1000M
Y = 1E6(C)056
R2 = 099
100M
Fish
Pas
sage
Cos
t (20
02$)
Francfort 1994 FERC 2003 (1999 - 2001)
67 Upper Bound Fish Passage 67 Lower Bound
10M 1 10 100 1000 10000
Capacity (MW)
Figure A-8A Fish passage cost as a function of plant capacity for undeveloped sites and powerhouse installation at a dam without power and as a function of added capacity for a plant expansion
1 to 1
0
10 to
20
20 to
30
30 to
40
40 to
50
gt50
A-18
$1 0 12 3 7 4
$ 52 7 62 5 0 0
1 M W 84 0 M WCapacity (MW)
Cos
t (20
02$)
No
of D
ata
Poin
ts
7
6
5
4
3
2
1
0
1
6 Total No of Data Points = 10
0 0 0
3
Capacity Range (MW)
Figure A-8B Number of fish passage cost data points for various plant capacity ranges
A-19
Y = 2E4(C)075
R2 = 060
001M
010M
100M
1000M
10000M
Fixe
d O
ampM
Cos
t (20
02$)
EIA 2003b (1990 - 2000) 67 Upper Bound All Sites 67 Lower Bound
1 10 100 1000 10000
Capacity (MW)
Figure A-9A Fixed operating and maintenance costs as a function of plant capacity for undeveloped sites and powerhouse installation at a dam without power and as a function of added capacity for a plant expansion
1 to 1
0
10 to
20
20 to
30
30 to
40
40 to
50
50 to
60
60 to
70
70 to
80
80 to
90
90 to
100
100 t
o 150
15
0 to 2
00
200 t
o 250
gt 250
$ 17 1 5 7
$ 11 4 92 7 7 4
1 M W 1 28 0 M WCapacity (MW)
Cos
t (20
02$)
Total No of Data Points = 474
24
105
55 47
33 27
14 19
14 12
51
25
11
37
0
20
40
60
80
10 0
12 0
No
of D
ata
Poin
ts
A-20
Capacity Range (MW)
Figure A-9B Number of fixed operation and maintenance cost data points for various plant capacity ranges
Y = 2E4(C)080
R2 = 067
001M
010M
100M
1000M
10000M Va
riabl
e O
ampM
Cos
t (20
02$)
EIA 2003b (1990 - 2000) 67 Upper Bound All Sites 67 Lower Bound
A-21
1 10 100 1000 10000
Capacity (MW)
Figure A-10A Variable operating and maintenance costs as a function of plant capacity for undeveloped and powerhouse installation at a dam without power and as a function of added capacity for a plant expansion
1 to 1
0
10 to
20
20 to
30
30 to
40
40 to
50
50 to
60
60 to
70
70 to
80
80 to
90
90 to
1 00
100 t
o 150
15
0 to 2
00
200 t
o 250
gt 250
$15 104
$12 929 143
1 MW 1 280 MWCapacity (MW)
Cos
t (20
02$)
Total No of Data Points = 501
39
116
58 51
37 25
14 24
14 14
53
25
10 21
0
20
40
60
80
10 0
12 0
14 0
No
of D
ata
Poin
ts
A-22
Capacity Range (MW)
Figure A-10B Number of variable operation and maintenance cost data points for various plant capacity ranges
A-23
Fran
cis
Turb
ine
Upg
rade
Cos
t (20
02$)
1000M
100M
10M
01M
071 -042Y = [3E6 sdot (C) ] sdot (H)
(C = 200 MW) Y = 13E8(H)-042
(C = 100 MW) Y = 77E7(H)-042
(C = 75 MW) Y = 63E7(H)-042
(C = 50 MW) Y = 47E7(H)-042
(C = 20 MW) Y = 25E7(H)-042
(C = 10 MW) Y = 15E7(H)-042
(C = 5 MW) Y = 92E6(H)-042
100 1000 Head (ft)
Figure A-11 Francis turbine upgrade cost as a function hydraulic head for various plant capacities
10000
A-24
1000M
100M
10M
(C = 5 MW) Y = 13E7(H)-038
(C = 10 MW) Y = 22E7(H)-038
(C = 20 MW) Y = 37E7(H)-038
(C = 50 MW) Y = 71E7(H)-038
(C = 75 MW) Y = 95E7(H)-038 (C = 100 MW) Y = 12E8(H)-038
(C = 200 MW) Y = 19E8(H)-038
10 100
Head (ft)
-038072 )H(](C)[4E6Y sdotsdot=
Figure A-12 Kaplan turbine upgrade cost as a function hydraulic head for various plant capacities
Kap
lan
Turb
ine
Upg
rade
Cos
t (20
02$)
1000
1000M B
ulb
Turb
ine
Upg
rade
Cos
t (20
02$)
100M
(C = 5 MW) Y = 25E7(H)-063
(C = 10 MW) Y = 45E7(H)-063
(C = 20 MW) Y = 82E7(H)-063
(C = 50 MW) Y = 18E8(H)-063
-063086 )H(](C)[6E6Y sdotsdot=
10M 1 10 100 1000
Head (ft)
Figure A-13 Bulb turbine upgrade cost as a function hydraulic head for various plant capacities
A-25
A-26
10M
01M
(C = 5 MW) Y = 84E6(S)-038
(C = 10 MW) Y = 13E7(S)-038
(C = 20 MW) Y = 21E7(S)-038
(C = 50 MW) Y = 37E7(S)-038 (C = 75 MW) Y = 49E7(S)-038 (C = 100 MW) Y = 59E7(S)-038
(C = 200 MW) Y = 92E7(S)-038
100 1000 Speed (RPM)
-038065 )S(](C)[3E6Y sdotsdot=
Figure A-14 Generator upgrade cost as a function of RPM for various plant capacities
1000M
100M
Gen
erat
or U
pgra
de C
ost (
2002
$)
10000
Appendix B
INEEL Hydropower Resource Economics Database (see document back cover for IHRED compact disk)
B-1
B-2
Field Number Field Name Type Description
Appendix B
INEEL Hydropower Resource Economics Database B1 IHRED Data Dictionary B2 IHRED
The data dictionary for the INEEL The IHRED in Excel format is provided on the Hydropower Resource Economics Database compact disk which is in a pocket on the back (IHRED) is given in Table B-1 This table lists the cover of this document The database contains field number parameter name field type (number resource characteristic data estimated or text) field description and units for the development and OampM costs and estimated 78 fields in the database annual and monthly generation for 2155 US
hydropower resources
Table B-1 INEEL Hydropower Resource Economics Database Data Dictionary Units
1 ProjectNumber Text Project Number (FERC number or pseudo FERC number) mdash
2 PlantName Text Name of the project mdash
3 StreamName Text Name of the stream where the project is located mdash
4 StateAbbr Text Two letter abbreviation for the state where the project is located mdash
5 NERCSubregion Text NERC Subregion (1 = East Central Area Reliability Coordination Agreement (ECAR) 2 = Electric Reliability Council of Texas (ERCOT) 3 = Mid-Atlantic Area Council (MAAC) 4 = Mid-America Interconnected Network (MAIN) 5 = Mid-Continent Area Power Pool (MAPP) 6 = Northeast Power Coordinating CouncilNew York (NY) 7 = Northeast Power Coordinating CouncilNew England (NE) 8 = Southeastern Electric Reliability CouncilFlorida (FL) 9 = Southeastern Electric Reliability CouncilExcl Florida (STV) 10 = Southwest Power Pool (SPP) 11 = Western Systems Coordinating CouncilNWP (NWP) 12 = Western Systems Coordinating CouncilRA (RA) 13 = Western Systems Coordinating CouncilCNV (CNV))
mdash
6 Latitude Number Latitude (first digits refer to degrees north last 2 digits refer to minutes)
ddmm
7 Longitude Number Longitude (First digits refer to degrees west last 2 digits refer to minutes)
ddmm
8 ClassCode Text Owner class code (C = Cooperative F = Federal I = Industrial M = Municipal and other non-federal P = Private utility R = Private nonutility)
mdash
9 OwnerName Text Name of project owner mdash
10 Capacity Number Potential capacity at undeveloped sites or sites without power or potential additional capacity at sites with power
MW
11 UnitType Text Type of unit (C = Conventional R = Reversible Z = Missing) mdash
12 PlantType Text Type of Plant (CMB = Combined conventional and reversible units DIV = Gravity diversion (powerhouse on different stream) PDV = Pumped diversion (one-way pumped storage) PMP = Pure (recycled) pump storage RES = Reservoir only ROR = Run-of-river (dam lt= 10 ft high and minimal storage) RRG = Reregulating STG = Storage conventional hydro (dam gt 10 ft high with significant storage) TID = Tidal conventional hydro)
mdash
B-3
Field Number Field Name Type Description
Table B-1 (continued) Units
13 ProjectStatus Text Status of Project (DJ = Disclaimer of FERC jurisdiction EA = Exemption applied for FA = Federally authorized FR = Federally recommended LE = License exemption LJ = Lack of FERC jurisdiction MA = FERC major license application MO = FERC license outstanding NA = FERC minor license application (lt15 kW) NO = FERC minor license outstanding (lt15 kW) PA = FERC preliminary permit application PO = FERC preliminary permit outstanding XX = No status YO = FERC minor part license outstanding ZZ = Missing)
mdash
14 BasinName Text River basin name mdash
15 CountyName Text County where the project is located mdash
16 DamStatus Text Status of Dam (W = With Power WO = Without Power U = Undeveloped)
mdash
17 WSProtection Text WildScenic Protection mdash
18 WSTributary Text WildScenic Tributary or UpstreamDownstream WildScenic Location (YNltblankgt)
mdash
19 Cultural Text Cultural Value (YNltblankgt) mdash
20 Fish Text Fish Value (YNltblankgt) mdash
21 Geological Text Geological Value (YNltblankgt) mdash
22 Historical Text Historical Value (YNltblankgt) mdash
23 Other Text Other criteria such as rare wetland communities and wilderness designation
mdash
24 Recreation Text Recreation Value (YNltblankgt) mdash
25 Scenic Text Scenic Value (YNltblankgt) mdash
26 Wildlife Text Wildlife Value (YNltblankgt) mdash
27 TEW Text ThreatenedEndangered Wildlife (YNltblankgt) mdash
28 TEF Text ThreatenedEndangered Fish (YNltblankgt) mdash
29 FLC103 Text Federal Land Code 103 (National Park Monument Lakeshore Parkway Battlefield or Recreation Area) (YNltblankgt)
mdash
30 FLC104 Text Federal Land Code 104 (National Forest or Grassland) (YNltblankgt)
mdash
31 FLC105 Text Federal Land Code 105 (National Wildlife Refuge Game Preserve or Fish Hatchery) (YNltblankgt)
mdash
32 FLC106 Text Federal Land Code 106 (National Scenic Waterway or Wilderness Area) (YNltblankgt)
mdash
33 FLC107 Text Federal Land Code 107(Indian Reservation) (YNltblankgt) mdash
34 FLC108 Text Federal Land Code 108 (Military Reservation) (YNltblankgt) mdash
35 FLC198 Text Federal Land Code 198 (Not On Federal Land) (YNltblankgt) mdash
36 SiteProb Number Project Environmental Suitability Factor (010 = Development prohibited or highly unlikely 025 = Major reduction in likelihood of development 050 = Likelihood of development reduced by half 075 = Minor reduction in likelihood of development 090 = Little effect on likelihood of development)
mdash
37 LicensingCost Number Total Licensing Cost $K
38 ConstructionCost Number Total Construction Cost $K
39 OvrNiteDevCost Number Overnight Development Cost ( LicensingCost + ConstructionCost ) $K
40 MitHist_Arch Number 30 year Archaeological and Historical mitigation cost (applicable if either Cultural or Historical fields are Y )
$K
41 MitFish_Wildlife Number 30 year fish and wildlife mitigation cost (applicable if any of the Fish Wildlife or TEW fields are Y )
$K
42 MitScenic_Rec Number 30 year scenic and recreation mitigation cost (applicable if either Recreation or Scenic fields are Y )
$K
B-4
Field Number Field Name Type Description
Table B-1 (continued) Units
43 MitWaterMonitor Number 30 year water quality monitoring cost $K
44 MitFishPassage Number 30 year fish passage cost (applicable if TEF field is Y ) $K
45 MitTotal Number Total Mitigation Cost ( Sum of MitHist_Arch MitFish_Wildlife MitScenic_Rec MitWaterMonitor and MitFishPassage )
$K
46 TotalDevCost Number Total Development Cost ( OvrNiteDevCost + MitTotal ) $K
47 UnitTotalDevCost Number Total Development Unit Cost $kW
48 FixedOM Number Average Annual Fixed OampM $K
49 UnitFixedOM Number Average Annual Fixed OampM Unit Cost $kW
50 VariableOM Number Average Annual Variable OampM $K
51 UnitVariableOM Number Average Annual Variable OampM Unit Cost MillskWh
52 FERCAnnChrg Number FERC Annual Charge (applicable if Capacity gt= 15 MW ) $K
53 PFAnnual Number Average Annual Plant Factor -
54 PFJan Number Average January Plant Factor -
55 PFFeb Number Average February Plant Factor -
56 PFMar Number Average March Plant Factor -
57 PFApr Number Average April Plant Factor -
58 PFMay Number Average May Plant Factor -
59 PFJun Number Average June Plant Factor -
60 PFJul Number Average July Plant Factor -
61 PFAug Number Average August Plant Factor -
62 PFSept Number Average September Plant Factor -
63 PFOct Number Average October Plant Factor -
64 PFNov Number Average November Plant Factor -
65 PFDec Number Average December Plant Factor -
66 GenAnnual Number Average Annual Generation MWh
67 GenJan Number Average January Generation MWh
68 GenFeb Number Average February Generation MWh
69 GenMar Number Average March Generation MWh
70 GenApr Number Average April Generation MWh
71 GenMay Number Average May Generation MWh
72 GenJun Number Average June Generation MWh
73 GenJul Number Average July Generation MWh
74 GenAug Number Average August Generation MWh
75 GenSept Number Average September Generation MWh
76 GenOct Number Average October Generation MWh
77 GenNov Number Average November Generation MWh
78 GenDec Number Average December Generation MWh
Special field values NA Value not available in source data
Value removed due to homeland security concerns
B-5
- ABSTRACT
- EXECUTIVE SUMMARY
- ACKNOWLEDGMENTS
- ACRONYMS
- NOMENCLATURE
- INTRODUCTION
- TECHNICAL APPROACH
-
- Cost Estimating Tools for Plant Development or Expansion
-
- Data Sources
- General Method
- Data Screening
- Accounting for Cost Variations by Type of Site
-
- Cost Estimating Tools for Plant Operation and Maintenance
- Cost Estimating Tools for Turbine and Generator Upgrade
- Estimating Plant Electric Generation
- FERC Annual Charge
- Application of Estimating Tools to Hydropower Resources
-
- RESULTS
-
- Cost Estimating Tools for Plant Development or Expansion
- Cost Estimating Tools for Plant Operation and Maintenance
- Cost Estimating Tools for Turbine and Generator Upgrade
- Estimating Plant Electric Generation
- Estimated Economic Parameters for Hydropower Resources
- Likelihood of Development
-
- CONCLUSIONS AND RECOMMENDATIONS
- REFERENCES
-
- B1IHRED Data Dictionary
- B2IHRED
-

1 to 1
0
10 to
20
20 to
30
30 to
40
40 to
50
gt 50
$105694
$20572000
1 MW 1167 MW Capacity (MW)
Cos
t (20
02$)
Total No of Data Points = 162 102
22 13
5 4 16
0
20
40
60
80
100
120
No
of D
ata
Poin
ts
A-4
Capacity Range (MW)
Figure A-1B Number of licensing cost data points for various plant capacity ranges
Y = 3E6(C) 090
R2 = 081
10M
100M
1000M
10000M
100000M C
onst
ruct
ion
Cos
t (20
02$)
EIA 2003a (1990 - 2000) 67 Upper Bound Undeveloped Sites 67 Lower Bound
A-5
1 10 100 1000 10000 Capacity (MW)
Figure A-2A Plant construction cost as a function of plant capacity for undeveloped sites
1 to 1
0
10 to
20
20 to
30
30 to
40
40 to
50
50 to
60
60 to
70
70 to
80
80 to
90
90 to
1 00
100 t
o 150
15
0 to 2
00
200 t
o 250
gt 250
$1 4 11 4 5 3
$2 1 80 5 39 8 3 9
1 M W 1 28 0 M WCapacity (MW)
Cos
t (20
02$)
Total No of Data Points = 267 47
40
24 23
15 11
6
13 9 10
31
12
6
20
0
5
10
15
20
25
30
35
40
45
50
55
No
of D
ata
Poin
ts
A-6
Capacity Range (MW)
Figure A-2B Number of undeveloped site construction cost data points for various plant capacity ranges
A-7 C
onst
ruct
ion
Cost
(200
2$)
100000M
10000M
1000M
100M
10M
01M
Y = 1E6(C)081
Y = 2E6(C) 081
R2 = 074
1 10 100 1000 10000 Capacity (MW)
EIA 2003a (1990 - 2000) Christensen 1986
67 Upper Bound
Dams With Power Dams Without Power
Figure A-3A Construction cost as a function of plant capacity for a powerhouse installation at a dam without power or as a function of added capacity for a plant expansion
1 to 1
0
10 to
20
20 to
30
30 to
40
40 to
50
50 to
60
60 to
70
70 to
80
80 to
90
90 to
100
100 t
o 150
15
0 to 2
00
200 t
o 250
gt 250
$89 8 2 9 4
$1 1 69 4 85 4 7 6
1 M W 1 28 0 M WCapacity (MW)
Cos
t (20
02$)
Total No of Data Points = 226
19
37
21 20
14
10
6
12 9 10
30
12
6
20
0
5
10
15
20
25
30
35
40
No
of D
ata
Poin
ts
A-8
Capacity Range (MW)
Figure A-3B Number of powerhouse construction cost data points for various plant capacity ranges
A-9
100000M
10000M
1000M
100M
010M
001M
Y = 2E5(C)096
Y = 8E4(C) 096
R2 = 070
1 10 100 1000 10000 Capacity (MW)
FERC 2003 (1980 - 1997)
Undeveloped Sites Dams Without Power
FERC 2003 (1999 - 2001)
67 Lower Bound Dams With Power
98 Lower Bound
Y = 3E5(C)096
Figure A-4A Fish and wildlife mitigation cost as a function of plant capacity for undeveloped sites and powerhouse installation at a dam without power and as a function of added capacity for a plant expansion
Fish
and
Wild
life
Miti
gatio
n C
ost (
2002
$)
1 to 1
0
10 to
20
20 to
30
30 to
40
40 to
50
gt 50
$36773
$27271669
1 MW 697 MW Capacity (MW)
Cos
t (20
02$)
Total No of Data Points = 74 42
11 7
2 3
9
0
5
10
15
20
25
30
35
40
45
No
of D
ata
Poin
ts
A-10
Capacity Range (MW)
Figure A-4B Number of fish and wildlife mitigation cost data points for various plant capacity ranges
A-11
1000000M
100000M
10000M
1000M
0100M
0010M
0001M
Y = 6E4(C) 097
R2 = 087
097
1 10 100 1000 10000 Capacity (MW)
FERC 2003 (1980 - 1997)
Undeveloped Sites Dams Without Power
FERC 2003 (1999 - 2001)
67 Lower Bound Dams With Power
98 Lower Bound
Y = 2E5(C) Y = 2E5(C) 097
Figure A-5A Recreation mitigation cost as a function of plant capacity for undeveloped sites and powerhouse installation at a dam without power and as a function of added capacity for a plant expansion
Rec
reat
ion
Miti
gatio
n C
ost (
2002
$)
1 to 1
0
10 to
20
20 to
30
30 to
40
40 to
50
gt50
$9 2 6 7
$ 27 7 34 6 7 4
1 M W 69 7 M WCapacity (MW)
Cos
t (20
02$)
Total No of Data Points = 101 63
13
5 4 3
13
0
10
20
30
40
50
60
70
No
of D
ata
Poin
ts
A-12
Capacity Range (MW)
Figure A-5B Number of recreation mitigation cost data points for various plant capacity ranges
A-13
10000M
072Y = 1E5(C) 0721000M Y = 8E4(C)
072Y = 6E4(C) R2 = 094
100M
FERC 2003 (1980 - 1997) FERC 2003 (1999 - 2001) 010M Undeveloped Sites Dams Without Power Dams With Power 67 Lower Bound 98 Lower Bound
001M 1 10 100 1000 10000
Capacity (MW)
Figure A-6A Historical and archeological mitigation cost as a function of plant capacity for undeveloped sites and powerhouse installation at a dam without power and as a function of added capacity for a plant expansion
His
toric
al amp
Arc
heol
ogic
al M
itiga
tion
Cos
t (20
02$)
1 to 1
0
10 to
20
20 to
30
30 to
40
40 to
50
gt 50
$10 3 93 9
$6 0 32 1 12
4 M W 69 7 M WCapacity (MW)
Cos
t (20
02$)
Total No of Data Points = 22 12
1
4
0
2 3
0
2
4
6
8
10
12
14
No
of D
ata
Poin
ts
A-14
Capacity Range (MW)
Figure A-6B Number of historical and archeological mitigation cost data points for various plant capacity ranges
10000M
Y = 7E4(C)044
R2 = 056
Y = 2E5(C)044
0010M
0100M
1000M
Wat
er Q
ualit
y M
onito
ring
Cos
t (20
02$)
FERC 2003 (1980 - 1997)
Undeveloped Sites Dams Without Power
FERC 2003 (1999 - 2001)
67 Lower Bound Dams With Power
98 Lower Bound
Y = 4E5(C)044
A-15
0001M 1 10 100 1000 10000
Capacity (MW)
Figure A-7A Water quality monitoring cost as a function of plant capacity for undeveloped sites and powerhouse installation at a dam without power and as a function of added capacity for a plant expansion
1 to 1
0
10 to
20
20 to
30
30 to
40
40 to
50
gt50
$7 6 73
$2 2 09 7 09
1 44 M W 69 7 M WCapacity (MW)
Cos
t (20
02$)
Total No of Data Points = 89 51
14
7 3 2
12
0
10
20
30
40
50
60
No
of D
ata
Poin
ts
A-16
Capacity Range (MW)
Figure A-7B Number of water quality monitoring cost data points for various plant capacity ranges
A-17
1000M
Y = 1E6(C)056
R2 = 099
100M
Fish
Pas
sage
Cos
t (20
02$)
Francfort 1994 FERC 2003 (1999 - 2001)
67 Upper Bound Fish Passage 67 Lower Bound
10M 1 10 100 1000 10000
Capacity (MW)
Figure A-8A Fish passage cost as a function of plant capacity for undeveloped sites and powerhouse installation at a dam without power and as a function of added capacity for a plant expansion
1 to 1
0
10 to
20
20 to
30
30 to
40
40 to
50
gt50
A-18
$1 0 12 3 7 4
$ 52 7 62 5 0 0
1 M W 84 0 M WCapacity (MW)
Cos
t (20
02$)
No
of D
ata
Poin
ts
7
6
5
4
3
2
1
0
1
6 Total No of Data Points = 10
0 0 0
3
Capacity Range (MW)
Figure A-8B Number of fish passage cost data points for various plant capacity ranges
A-19
Y = 2E4(C)075
R2 = 060
001M
010M
100M
1000M
10000M
Fixe
d O
ampM
Cos
t (20
02$)
EIA 2003b (1990 - 2000) 67 Upper Bound All Sites 67 Lower Bound
1 10 100 1000 10000
Capacity (MW)
Figure A-9A Fixed operating and maintenance costs as a function of plant capacity for undeveloped sites and powerhouse installation at a dam without power and as a function of added capacity for a plant expansion
1 to 1
0
10 to
20
20 to
30
30 to
40
40 to
50
50 to
60
60 to
70
70 to
80
80 to
90
90 to
100
100 t
o 150
15
0 to 2
00
200 t
o 250
gt 250
$ 17 1 5 7
$ 11 4 92 7 7 4
1 M W 1 28 0 M WCapacity (MW)
Cos
t (20
02$)
Total No of Data Points = 474
24
105
55 47
33 27
14 19
14 12
51
25
11
37
0
20
40
60
80
10 0
12 0
No
of D
ata
Poin
ts
A-20
Capacity Range (MW)
Figure A-9B Number of fixed operation and maintenance cost data points for various plant capacity ranges
Y = 2E4(C)080
R2 = 067
001M
010M
100M
1000M
10000M Va
riabl
e O
ampM
Cos
t (20
02$)
EIA 2003b (1990 - 2000) 67 Upper Bound All Sites 67 Lower Bound
A-21
1 10 100 1000 10000
Capacity (MW)
Figure A-10A Variable operating and maintenance costs as a function of plant capacity for undeveloped and powerhouse installation at a dam without power and as a function of added capacity for a plant expansion
1 to 1
0
10 to
20
20 to
30
30 to
40
40 to
50
50 to
60
60 to
70
70 to
80
80 to
90
90 to
1 00
100 t
o 150
15
0 to 2
00
200 t
o 250
gt 250
$15 104
$12 929 143
1 MW 1 280 MWCapacity (MW)
Cos
t (20
02$)
Total No of Data Points = 501
39
116
58 51
37 25
14 24
14 14
53
25
10 21
0
20
40
60
80
10 0
12 0
14 0
No
of D
ata
Poin
ts
A-22
Capacity Range (MW)
Figure A-10B Number of variable operation and maintenance cost data points for various plant capacity ranges
A-23
Fran
cis
Turb
ine
Upg
rade
Cos
t (20
02$)
1000M
100M
10M
01M
071 -042Y = [3E6 sdot (C) ] sdot (H)
(C = 200 MW) Y = 13E8(H)-042
(C = 100 MW) Y = 77E7(H)-042
(C = 75 MW) Y = 63E7(H)-042
(C = 50 MW) Y = 47E7(H)-042
(C = 20 MW) Y = 25E7(H)-042
(C = 10 MW) Y = 15E7(H)-042
(C = 5 MW) Y = 92E6(H)-042
100 1000 Head (ft)
Figure A-11 Francis turbine upgrade cost as a function hydraulic head for various plant capacities
10000
A-24
1000M
100M
10M
(C = 5 MW) Y = 13E7(H)-038
(C = 10 MW) Y = 22E7(H)-038
(C = 20 MW) Y = 37E7(H)-038
(C = 50 MW) Y = 71E7(H)-038
(C = 75 MW) Y = 95E7(H)-038 (C = 100 MW) Y = 12E8(H)-038
(C = 200 MW) Y = 19E8(H)-038
10 100
Head (ft)
-038072 )H(](C)[4E6Y sdotsdot=
Figure A-12 Kaplan turbine upgrade cost as a function hydraulic head for various plant capacities
Kap
lan
Turb
ine
Upg
rade
Cos
t (20
02$)
1000
1000M B
ulb
Turb
ine
Upg
rade
Cos
t (20
02$)
100M
(C = 5 MW) Y = 25E7(H)-063
(C = 10 MW) Y = 45E7(H)-063
(C = 20 MW) Y = 82E7(H)-063
(C = 50 MW) Y = 18E8(H)-063
-063086 )H(](C)[6E6Y sdotsdot=
10M 1 10 100 1000
Head (ft)
Figure A-13 Bulb turbine upgrade cost as a function hydraulic head for various plant capacities
A-25
A-26
10M
01M
(C = 5 MW) Y = 84E6(S)-038
(C = 10 MW) Y = 13E7(S)-038
(C = 20 MW) Y = 21E7(S)-038
(C = 50 MW) Y = 37E7(S)-038 (C = 75 MW) Y = 49E7(S)-038 (C = 100 MW) Y = 59E7(S)-038
(C = 200 MW) Y = 92E7(S)-038
100 1000 Speed (RPM)
-038065 )S(](C)[3E6Y sdotsdot=
Figure A-14 Generator upgrade cost as a function of RPM for various plant capacities
1000M
100M
Gen
erat
or U
pgra
de C
ost (
2002
$)
10000
Appendix B
INEEL Hydropower Resource Economics Database (see document back cover for IHRED compact disk)
B-1
B-2
Field Number Field Name Type Description
Appendix B
INEEL Hydropower Resource Economics Database B1 IHRED Data Dictionary B2 IHRED
The data dictionary for the INEEL The IHRED in Excel format is provided on the Hydropower Resource Economics Database compact disk which is in a pocket on the back (IHRED) is given in Table B-1 This table lists the cover of this document The database contains field number parameter name field type (number resource characteristic data estimated or text) field description and units for the development and OampM costs and estimated 78 fields in the database annual and monthly generation for 2155 US
hydropower resources
Table B-1 INEEL Hydropower Resource Economics Database Data Dictionary Units
1 ProjectNumber Text Project Number (FERC number or pseudo FERC number) mdash
2 PlantName Text Name of the project mdash
3 StreamName Text Name of the stream where the project is located mdash
4 StateAbbr Text Two letter abbreviation for the state where the project is located mdash
5 NERCSubregion Text NERC Subregion (1 = East Central Area Reliability Coordination Agreement (ECAR) 2 = Electric Reliability Council of Texas (ERCOT) 3 = Mid-Atlantic Area Council (MAAC) 4 = Mid-America Interconnected Network (MAIN) 5 = Mid-Continent Area Power Pool (MAPP) 6 = Northeast Power Coordinating CouncilNew York (NY) 7 = Northeast Power Coordinating CouncilNew England (NE) 8 = Southeastern Electric Reliability CouncilFlorida (FL) 9 = Southeastern Electric Reliability CouncilExcl Florida (STV) 10 = Southwest Power Pool (SPP) 11 = Western Systems Coordinating CouncilNWP (NWP) 12 = Western Systems Coordinating CouncilRA (RA) 13 = Western Systems Coordinating CouncilCNV (CNV))
mdash
6 Latitude Number Latitude (first digits refer to degrees north last 2 digits refer to minutes)
ddmm
7 Longitude Number Longitude (First digits refer to degrees west last 2 digits refer to minutes)
ddmm
8 ClassCode Text Owner class code (C = Cooperative F = Federal I = Industrial M = Municipal and other non-federal P = Private utility R = Private nonutility)
mdash
9 OwnerName Text Name of project owner mdash
10 Capacity Number Potential capacity at undeveloped sites or sites without power or potential additional capacity at sites with power
MW
11 UnitType Text Type of unit (C = Conventional R = Reversible Z = Missing) mdash
12 PlantType Text Type of Plant (CMB = Combined conventional and reversible units DIV = Gravity diversion (powerhouse on different stream) PDV = Pumped diversion (one-way pumped storage) PMP = Pure (recycled) pump storage RES = Reservoir only ROR = Run-of-river (dam lt= 10 ft high and minimal storage) RRG = Reregulating STG = Storage conventional hydro (dam gt 10 ft high with significant storage) TID = Tidal conventional hydro)
mdash
B-3
Field Number Field Name Type Description
Table B-1 (continued) Units
13 ProjectStatus Text Status of Project (DJ = Disclaimer of FERC jurisdiction EA = Exemption applied for FA = Federally authorized FR = Federally recommended LE = License exemption LJ = Lack of FERC jurisdiction MA = FERC major license application MO = FERC license outstanding NA = FERC minor license application (lt15 kW) NO = FERC minor license outstanding (lt15 kW) PA = FERC preliminary permit application PO = FERC preliminary permit outstanding XX = No status YO = FERC minor part license outstanding ZZ = Missing)
mdash
14 BasinName Text River basin name mdash
15 CountyName Text County where the project is located mdash
16 DamStatus Text Status of Dam (W = With Power WO = Without Power U = Undeveloped)
mdash
17 WSProtection Text WildScenic Protection mdash
18 WSTributary Text WildScenic Tributary or UpstreamDownstream WildScenic Location (YNltblankgt)
mdash
19 Cultural Text Cultural Value (YNltblankgt) mdash
20 Fish Text Fish Value (YNltblankgt) mdash
21 Geological Text Geological Value (YNltblankgt) mdash
22 Historical Text Historical Value (YNltblankgt) mdash
23 Other Text Other criteria such as rare wetland communities and wilderness designation
mdash
24 Recreation Text Recreation Value (YNltblankgt) mdash
25 Scenic Text Scenic Value (YNltblankgt) mdash
26 Wildlife Text Wildlife Value (YNltblankgt) mdash
27 TEW Text ThreatenedEndangered Wildlife (YNltblankgt) mdash
28 TEF Text ThreatenedEndangered Fish (YNltblankgt) mdash
29 FLC103 Text Federal Land Code 103 (National Park Monument Lakeshore Parkway Battlefield or Recreation Area) (YNltblankgt)
mdash
30 FLC104 Text Federal Land Code 104 (National Forest or Grassland) (YNltblankgt)
mdash
31 FLC105 Text Federal Land Code 105 (National Wildlife Refuge Game Preserve or Fish Hatchery) (YNltblankgt)
mdash
32 FLC106 Text Federal Land Code 106 (National Scenic Waterway or Wilderness Area) (YNltblankgt)
mdash
33 FLC107 Text Federal Land Code 107(Indian Reservation) (YNltblankgt) mdash
34 FLC108 Text Federal Land Code 108 (Military Reservation) (YNltblankgt) mdash
35 FLC198 Text Federal Land Code 198 (Not On Federal Land) (YNltblankgt) mdash
36 SiteProb Number Project Environmental Suitability Factor (010 = Development prohibited or highly unlikely 025 = Major reduction in likelihood of development 050 = Likelihood of development reduced by half 075 = Minor reduction in likelihood of development 090 = Little effect on likelihood of development)
mdash
37 LicensingCost Number Total Licensing Cost $K
38 ConstructionCost Number Total Construction Cost $K
39 OvrNiteDevCost Number Overnight Development Cost ( LicensingCost + ConstructionCost ) $K
40 MitHist_Arch Number 30 year Archaeological and Historical mitigation cost (applicable if either Cultural or Historical fields are Y )
$K
41 MitFish_Wildlife Number 30 year fish and wildlife mitigation cost (applicable if any of the Fish Wildlife or TEW fields are Y )
$K
42 MitScenic_Rec Number 30 year scenic and recreation mitigation cost (applicable if either Recreation or Scenic fields are Y )
$K
B-4
Field Number Field Name Type Description
Table B-1 (continued) Units
43 MitWaterMonitor Number 30 year water quality monitoring cost $K
44 MitFishPassage Number 30 year fish passage cost (applicable if TEF field is Y ) $K
45 MitTotal Number Total Mitigation Cost ( Sum of MitHist_Arch MitFish_Wildlife MitScenic_Rec MitWaterMonitor and MitFishPassage )
$K
46 TotalDevCost Number Total Development Cost ( OvrNiteDevCost + MitTotal ) $K
47 UnitTotalDevCost Number Total Development Unit Cost $kW
48 FixedOM Number Average Annual Fixed OampM $K
49 UnitFixedOM Number Average Annual Fixed OampM Unit Cost $kW
50 VariableOM Number Average Annual Variable OampM $K
51 UnitVariableOM Number Average Annual Variable OampM Unit Cost MillskWh
52 FERCAnnChrg Number FERC Annual Charge (applicable if Capacity gt= 15 MW ) $K
53 PFAnnual Number Average Annual Plant Factor -
54 PFJan Number Average January Plant Factor -
55 PFFeb Number Average February Plant Factor -
56 PFMar Number Average March Plant Factor -
57 PFApr Number Average April Plant Factor -
58 PFMay Number Average May Plant Factor -
59 PFJun Number Average June Plant Factor -
60 PFJul Number Average July Plant Factor -
61 PFAug Number Average August Plant Factor -
62 PFSept Number Average September Plant Factor -
63 PFOct Number Average October Plant Factor -
64 PFNov Number Average November Plant Factor -
65 PFDec Number Average December Plant Factor -
66 GenAnnual Number Average Annual Generation MWh
67 GenJan Number Average January Generation MWh
68 GenFeb Number Average February Generation MWh
69 GenMar Number Average March Generation MWh
70 GenApr Number Average April Generation MWh
71 GenMay Number Average May Generation MWh
72 GenJun Number Average June Generation MWh
73 GenJul Number Average July Generation MWh
74 GenAug Number Average August Generation MWh
75 GenSept Number Average September Generation MWh
76 GenOct Number Average October Generation MWh
77 GenNov Number Average November Generation MWh
78 GenDec Number Average December Generation MWh
Special field values NA Value not available in source data
Value removed due to homeland security concerns
B-5
- ABSTRACT
- EXECUTIVE SUMMARY
- ACKNOWLEDGMENTS
- ACRONYMS
- NOMENCLATURE
- INTRODUCTION
- TECHNICAL APPROACH
-
- Cost Estimating Tools for Plant Development or Expansion
-
- Data Sources
- General Method
- Data Screening
- Accounting for Cost Variations by Type of Site
-
- Cost Estimating Tools for Plant Operation and Maintenance
- Cost Estimating Tools for Turbine and Generator Upgrade
- Estimating Plant Electric Generation
- FERC Annual Charge
- Application of Estimating Tools to Hydropower Resources
-
- RESULTS
-
- Cost Estimating Tools for Plant Development or Expansion
- Cost Estimating Tools for Plant Operation and Maintenance
- Cost Estimating Tools for Turbine and Generator Upgrade
- Estimating Plant Electric Generation
- Estimated Economic Parameters for Hydropower Resources
- Likelihood of Development
-
- CONCLUSIONS AND RECOMMENDATIONS
- REFERENCES
-
- B1IHRED Data Dictionary
- B2IHRED
-

1 to 1
0
10 to
20
20 to
30
30 to
40
40 to
50
50 to
60
60 to
70
70 to
80
80 to
90
90 to
1 00
100 t
o 150
15
0 to 2
00
200 t
o 250
gt 250
$1 4 11 4 5 3
$2 1 80 5 39 8 3 9
1 M W 1 28 0 M WCapacity (MW)
Cos
t (20
02$)
Total No of Data Points = 267 47
40
24 23
15 11
6
13 9 10
31
12
6
20
0
5
10
15
20
25
30
35
40
45
50
55
No
of D
ata
Poin
ts
A-6
Capacity Range (MW)
Figure A-2B Number of undeveloped site construction cost data points for various plant capacity ranges
A-7 C
onst
ruct
ion
Cost
(200
2$)
100000M
10000M
1000M
100M
10M
01M
Y = 1E6(C)081
Y = 2E6(C) 081
R2 = 074
1 10 100 1000 10000 Capacity (MW)
EIA 2003a (1990 - 2000) Christensen 1986
67 Upper Bound
Dams With Power Dams Without Power
Figure A-3A Construction cost as a function of plant capacity for a powerhouse installation at a dam without power or as a function of added capacity for a plant expansion
1 to 1
0
10 to
20
20 to
30
30 to
40
40 to
50
50 to
60
60 to
70
70 to
80
80 to
90
90 to
100
100 t
o 150
15
0 to 2
00
200 t
o 250
gt 250
$89 8 2 9 4
$1 1 69 4 85 4 7 6
1 M W 1 28 0 M WCapacity (MW)
Cos
t (20
02$)
Total No of Data Points = 226
19
37
21 20
14
10
6
12 9 10
30
12
6
20
0
5
10
15
20
25
30
35
40
No
of D
ata
Poin
ts
A-8
Capacity Range (MW)
Figure A-3B Number of powerhouse construction cost data points for various plant capacity ranges
A-9
100000M
10000M
1000M
100M
010M
001M
Y = 2E5(C)096
Y = 8E4(C) 096
R2 = 070
1 10 100 1000 10000 Capacity (MW)
FERC 2003 (1980 - 1997)
Undeveloped Sites Dams Without Power
FERC 2003 (1999 - 2001)
67 Lower Bound Dams With Power
98 Lower Bound
Y = 3E5(C)096
Figure A-4A Fish and wildlife mitigation cost as a function of plant capacity for undeveloped sites and powerhouse installation at a dam without power and as a function of added capacity for a plant expansion
Fish
and
Wild
life
Miti
gatio
n C
ost (
2002
$)
1 to 1
0
10 to
20
20 to
30
30 to
40
40 to
50
gt 50
$36773
$27271669
1 MW 697 MW Capacity (MW)
Cos
t (20
02$)
Total No of Data Points = 74 42
11 7
2 3
9
0
5
10
15
20
25
30
35
40
45
No
of D
ata
Poin
ts
A-10
Capacity Range (MW)
Figure A-4B Number of fish and wildlife mitigation cost data points for various plant capacity ranges
A-11
1000000M
100000M
10000M
1000M
0100M
0010M
0001M
Y = 6E4(C) 097
R2 = 087
097
1 10 100 1000 10000 Capacity (MW)
FERC 2003 (1980 - 1997)
Undeveloped Sites Dams Without Power
FERC 2003 (1999 - 2001)
67 Lower Bound Dams With Power
98 Lower Bound
Y = 2E5(C) Y = 2E5(C) 097
Figure A-5A Recreation mitigation cost as a function of plant capacity for undeveloped sites and powerhouse installation at a dam without power and as a function of added capacity for a plant expansion
Rec
reat
ion
Miti
gatio
n C
ost (
2002
$)
1 to 1
0
10 to
20
20 to
30
30 to
40
40 to
50
gt50
$9 2 6 7
$ 27 7 34 6 7 4
1 M W 69 7 M WCapacity (MW)
Cos
t (20
02$)
Total No of Data Points = 101 63
13
5 4 3
13
0
10
20
30
40
50
60
70
No
of D
ata
Poin
ts
A-12
Capacity Range (MW)
Figure A-5B Number of recreation mitigation cost data points for various plant capacity ranges
A-13
10000M
072Y = 1E5(C) 0721000M Y = 8E4(C)
072Y = 6E4(C) R2 = 094
100M
FERC 2003 (1980 - 1997) FERC 2003 (1999 - 2001) 010M Undeveloped Sites Dams Without Power Dams With Power 67 Lower Bound 98 Lower Bound
001M 1 10 100 1000 10000
Capacity (MW)
Figure A-6A Historical and archeological mitigation cost as a function of plant capacity for undeveloped sites and powerhouse installation at a dam without power and as a function of added capacity for a plant expansion
His
toric
al amp
Arc
heol
ogic
al M
itiga
tion
Cos
t (20
02$)
1 to 1
0
10 to
20
20 to
30
30 to
40
40 to
50
gt 50
$10 3 93 9
$6 0 32 1 12
4 M W 69 7 M WCapacity (MW)
Cos
t (20
02$)
Total No of Data Points = 22 12
1
4
0
2 3
0
2
4
6
8
10
12
14
No
of D
ata
Poin
ts
A-14
Capacity Range (MW)
Figure A-6B Number of historical and archeological mitigation cost data points for various plant capacity ranges
10000M
Y = 7E4(C)044
R2 = 056
Y = 2E5(C)044
0010M
0100M
1000M
Wat
er Q
ualit
y M
onito
ring
Cos
t (20
02$)
FERC 2003 (1980 - 1997)
Undeveloped Sites Dams Without Power
FERC 2003 (1999 - 2001)
67 Lower Bound Dams With Power
98 Lower Bound
Y = 4E5(C)044
A-15
0001M 1 10 100 1000 10000
Capacity (MW)
Figure A-7A Water quality monitoring cost as a function of plant capacity for undeveloped sites and powerhouse installation at a dam without power and as a function of added capacity for a plant expansion
1 to 1
0
10 to
20
20 to
30
30 to
40
40 to
50
gt50
$7 6 73
$2 2 09 7 09
1 44 M W 69 7 M WCapacity (MW)
Cos
t (20
02$)
Total No of Data Points = 89 51
14
7 3 2
12
0
10
20
30
40
50
60
No
of D
ata
Poin
ts
A-16
Capacity Range (MW)
Figure A-7B Number of water quality monitoring cost data points for various plant capacity ranges
A-17
1000M
Y = 1E6(C)056
R2 = 099
100M
Fish
Pas
sage
Cos
t (20
02$)
Francfort 1994 FERC 2003 (1999 - 2001)
67 Upper Bound Fish Passage 67 Lower Bound
10M 1 10 100 1000 10000
Capacity (MW)
Figure A-8A Fish passage cost as a function of plant capacity for undeveloped sites and powerhouse installation at a dam without power and as a function of added capacity for a plant expansion
1 to 1
0
10 to
20
20 to
30
30 to
40
40 to
50
gt50
A-18
$1 0 12 3 7 4
$ 52 7 62 5 0 0
1 M W 84 0 M WCapacity (MW)
Cos
t (20
02$)
No
of D
ata
Poin
ts
7
6
5
4
3
2
1
0
1
6 Total No of Data Points = 10
0 0 0
3
Capacity Range (MW)
Figure A-8B Number of fish passage cost data points for various plant capacity ranges
A-19
Y = 2E4(C)075
R2 = 060
001M
010M
100M
1000M
10000M
Fixe
d O
ampM
Cos
t (20
02$)
EIA 2003b (1990 - 2000) 67 Upper Bound All Sites 67 Lower Bound
1 10 100 1000 10000
Capacity (MW)
Figure A-9A Fixed operating and maintenance costs as a function of plant capacity for undeveloped sites and powerhouse installation at a dam without power and as a function of added capacity for a plant expansion
1 to 1
0
10 to
20
20 to
30
30 to
40
40 to
50
50 to
60
60 to
70
70 to
80
80 to
90
90 to
100
100 t
o 150
15
0 to 2
00
200 t
o 250
gt 250
$ 17 1 5 7
$ 11 4 92 7 7 4
1 M W 1 28 0 M WCapacity (MW)
Cos
t (20
02$)
Total No of Data Points = 474
24
105
55 47
33 27
14 19
14 12
51
25
11
37
0
20
40
60
80
10 0
12 0
No
of D
ata
Poin
ts
A-20
Capacity Range (MW)
Figure A-9B Number of fixed operation and maintenance cost data points for various plant capacity ranges
Y = 2E4(C)080
R2 = 067
001M
010M
100M
1000M
10000M Va
riabl
e O
ampM
Cos
t (20
02$)
EIA 2003b (1990 - 2000) 67 Upper Bound All Sites 67 Lower Bound
A-21
1 10 100 1000 10000
Capacity (MW)
Figure A-10A Variable operating and maintenance costs as a function of plant capacity for undeveloped and powerhouse installation at a dam without power and as a function of added capacity for a plant expansion
1 to 1
0
10 to
20
20 to
30
30 to
40
40 to
50
50 to
60
60 to
70
70 to
80
80 to
90
90 to
1 00
100 t
o 150
15
0 to 2
00
200 t
o 250
gt 250
$15 104
$12 929 143
1 MW 1 280 MWCapacity (MW)
Cos
t (20
02$)
Total No of Data Points = 501
39
116
58 51
37 25
14 24
14 14
53
25
10 21
0
20
40
60
80
10 0
12 0
14 0
No
of D
ata
Poin
ts
A-22
Capacity Range (MW)
Figure A-10B Number of variable operation and maintenance cost data points for various plant capacity ranges
A-23
Fran
cis
Turb
ine
Upg
rade
Cos
t (20
02$)
1000M
100M
10M
01M
071 -042Y = [3E6 sdot (C) ] sdot (H)
(C = 200 MW) Y = 13E8(H)-042
(C = 100 MW) Y = 77E7(H)-042
(C = 75 MW) Y = 63E7(H)-042
(C = 50 MW) Y = 47E7(H)-042
(C = 20 MW) Y = 25E7(H)-042
(C = 10 MW) Y = 15E7(H)-042
(C = 5 MW) Y = 92E6(H)-042
100 1000 Head (ft)
Figure A-11 Francis turbine upgrade cost as a function hydraulic head for various plant capacities
10000
A-24
1000M
100M
10M
(C = 5 MW) Y = 13E7(H)-038
(C = 10 MW) Y = 22E7(H)-038
(C = 20 MW) Y = 37E7(H)-038
(C = 50 MW) Y = 71E7(H)-038
(C = 75 MW) Y = 95E7(H)-038 (C = 100 MW) Y = 12E8(H)-038
(C = 200 MW) Y = 19E8(H)-038
10 100
Head (ft)
-038072 )H(](C)[4E6Y sdotsdot=
Figure A-12 Kaplan turbine upgrade cost as a function hydraulic head for various plant capacities
Kap
lan
Turb
ine
Upg
rade
Cos
t (20
02$)
1000
1000M B
ulb
Turb
ine
Upg
rade
Cos
t (20
02$)
100M
(C = 5 MW) Y = 25E7(H)-063
(C = 10 MW) Y = 45E7(H)-063
(C = 20 MW) Y = 82E7(H)-063
(C = 50 MW) Y = 18E8(H)-063
-063086 )H(](C)[6E6Y sdotsdot=
10M 1 10 100 1000
Head (ft)
Figure A-13 Bulb turbine upgrade cost as a function hydraulic head for various plant capacities
A-25
A-26
10M
01M
(C = 5 MW) Y = 84E6(S)-038
(C = 10 MW) Y = 13E7(S)-038
(C = 20 MW) Y = 21E7(S)-038
(C = 50 MW) Y = 37E7(S)-038 (C = 75 MW) Y = 49E7(S)-038 (C = 100 MW) Y = 59E7(S)-038
(C = 200 MW) Y = 92E7(S)-038
100 1000 Speed (RPM)
-038065 )S(](C)[3E6Y sdotsdot=
Figure A-14 Generator upgrade cost as a function of RPM for various plant capacities
1000M
100M
Gen
erat
or U
pgra
de C
ost (
2002
$)
10000
Appendix B
INEEL Hydropower Resource Economics Database (see document back cover for IHRED compact disk)
B-1
B-2
Field Number Field Name Type Description
Appendix B
INEEL Hydropower Resource Economics Database B1 IHRED Data Dictionary B2 IHRED
The data dictionary for the INEEL The IHRED in Excel format is provided on the Hydropower Resource Economics Database compact disk which is in a pocket on the back (IHRED) is given in Table B-1 This table lists the cover of this document The database contains field number parameter name field type (number resource characteristic data estimated or text) field description and units for the development and OampM costs and estimated 78 fields in the database annual and monthly generation for 2155 US
hydropower resources
Table B-1 INEEL Hydropower Resource Economics Database Data Dictionary Units
1 ProjectNumber Text Project Number (FERC number or pseudo FERC number) mdash
2 PlantName Text Name of the project mdash
3 StreamName Text Name of the stream where the project is located mdash
4 StateAbbr Text Two letter abbreviation for the state where the project is located mdash
5 NERCSubregion Text NERC Subregion (1 = East Central Area Reliability Coordination Agreement (ECAR) 2 = Electric Reliability Council of Texas (ERCOT) 3 = Mid-Atlantic Area Council (MAAC) 4 = Mid-America Interconnected Network (MAIN) 5 = Mid-Continent Area Power Pool (MAPP) 6 = Northeast Power Coordinating CouncilNew York (NY) 7 = Northeast Power Coordinating CouncilNew England (NE) 8 = Southeastern Electric Reliability CouncilFlorida (FL) 9 = Southeastern Electric Reliability CouncilExcl Florida (STV) 10 = Southwest Power Pool (SPP) 11 = Western Systems Coordinating CouncilNWP (NWP) 12 = Western Systems Coordinating CouncilRA (RA) 13 = Western Systems Coordinating CouncilCNV (CNV))
mdash
6 Latitude Number Latitude (first digits refer to degrees north last 2 digits refer to minutes)
ddmm
7 Longitude Number Longitude (First digits refer to degrees west last 2 digits refer to minutes)
ddmm
8 ClassCode Text Owner class code (C = Cooperative F = Federal I = Industrial M = Municipal and other non-federal P = Private utility R = Private nonutility)
mdash
9 OwnerName Text Name of project owner mdash
10 Capacity Number Potential capacity at undeveloped sites or sites without power or potential additional capacity at sites with power
MW
11 UnitType Text Type of unit (C = Conventional R = Reversible Z = Missing) mdash
12 PlantType Text Type of Plant (CMB = Combined conventional and reversible units DIV = Gravity diversion (powerhouse on different stream) PDV = Pumped diversion (one-way pumped storage) PMP = Pure (recycled) pump storage RES = Reservoir only ROR = Run-of-river (dam lt= 10 ft high and minimal storage) RRG = Reregulating STG = Storage conventional hydro (dam gt 10 ft high with significant storage) TID = Tidal conventional hydro)
mdash
B-3
Field Number Field Name Type Description
Table B-1 (continued) Units
13 ProjectStatus Text Status of Project (DJ = Disclaimer of FERC jurisdiction EA = Exemption applied for FA = Federally authorized FR = Federally recommended LE = License exemption LJ = Lack of FERC jurisdiction MA = FERC major license application MO = FERC license outstanding NA = FERC minor license application (lt15 kW) NO = FERC minor license outstanding (lt15 kW) PA = FERC preliminary permit application PO = FERC preliminary permit outstanding XX = No status YO = FERC minor part license outstanding ZZ = Missing)
mdash
14 BasinName Text River basin name mdash
15 CountyName Text County where the project is located mdash
16 DamStatus Text Status of Dam (W = With Power WO = Without Power U = Undeveloped)
mdash
17 WSProtection Text WildScenic Protection mdash
18 WSTributary Text WildScenic Tributary or UpstreamDownstream WildScenic Location (YNltblankgt)
mdash
19 Cultural Text Cultural Value (YNltblankgt) mdash
20 Fish Text Fish Value (YNltblankgt) mdash
21 Geological Text Geological Value (YNltblankgt) mdash
22 Historical Text Historical Value (YNltblankgt) mdash
23 Other Text Other criteria such as rare wetland communities and wilderness designation
mdash
24 Recreation Text Recreation Value (YNltblankgt) mdash
25 Scenic Text Scenic Value (YNltblankgt) mdash
26 Wildlife Text Wildlife Value (YNltblankgt) mdash
27 TEW Text ThreatenedEndangered Wildlife (YNltblankgt) mdash
28 TEF Text ThreatenedEndangered Fish (YNltblankgt) mdash
29 FLC103 Text Federal Land Code 103 (National Park Monument Lakeshore Parkway Battlefield or Recreation Area) (YNltblankgt)
mdash
30 FLC104 Text Federal Land Code 104 (National Forest or Grassland) (YNltblankgt)
mdash
31 FLC105 Text Federal Land Code 105 (National Wildlife Refuge Game Preserve or Fish Hatchery) (YNltblankgt)
mdash
32 FLC106 Text Federal Land Code 106 (National Scenic Waterway or Wilderness Area) (YNltblankgt)
mdash
33 FLC107 Text Federal Land Code 107(Indian Reservation) (YNltblankgt) mdash
34 FLC108 Text Federal Land Code 108 (Military Reservation) (YNltblankgt) mdash
35 FLC198 Text Federal Land Code 198 (Not On Federal Land) (YNltblankgt) mdash
36 SiteProb Number Project Environmental Suitability Factor (010 = Development prohibited or highly unlikely 025 = Major reduction in likelihood of development 050 = Likelihood of development reduced by half 075 = Minor reduction in likelihood of development 090 = Little effect on likelihood of development)
mdash
37 LicensingCost Number Total Licensing Cost $K
38 ConstructionCost Number Total Construction Cost $K
39 OvrNiteDevCost Number Overnight Development Cost ( LicensingCost + ConstructionCost ) $K
40 MitHist_Arch Number 30 year Archaeological and Historical mitigation cost (applicable if either Cultural or Historical fields are Y )
$K
41 MitFish_Wildlife Number 30 year fish and wildlife mitigation cost (applicable if any of the Fish Wildlife or TEW fields are Y )
$K
42 MitScenic_Rec Number 30 year scenic and recreation mitigation cost (applicable if either Recreation or Scenic fields are Y )
$K
B-4
Field Number Field Name Type Description
Table B-1 (continued) Units
43 MitWaterMonitor Number 30 year water quality monitoring cost $K
44 MitFishPassage Number 30 year fish passage cost (applicable if TEF field is Y ) $K
45 MitTotal Number Total Mitigation Cost ( Sum of MitHist_Arch MitFish_Wildlife MitScenic_Rec MitWaterMonitor and MitFishPassage )
$K
46 TotalDevCost Number Total Development Cost ( OvrNiteDevCost + MitTotal ) $K
47 UnitTotalDevCost Number Total Development Unit Cost $kW
48 FixedOM Number Average Annual Fixed OampM $K
49 UnitFixedOM Number Average Annual Fixed OampM Unit Cost $kW
50 VariableOM Number Average Annual Variable OampM $K
51 UnitVariableOM Number Average Annual Variable OampM Unit Cost MillskWh
52 FERCAnnChrg Number FERC Annual Charge (applicable if Capacity gt= 15 MW ) $K
53 PFAnnual Number Average Annual Plant Factor -
54 PFJan Number Average January Plant Factor -
55 PFFeb Number Average February Plant Factor -
56 PFMar Number Average March Plant Factor -
57 PFApr Number Average April Plant Factor -
58 PFMay Number Average May Plant Factor -
59 PFJun Number Average June Plant Factor -
60 PFJul Number Average July Plant Factor -
61 PFAug Number Average August Plant Factor -
62 PFSept Number Average September Plant Factor -
63 PFOct Number Average October Plant Factor -
64 PFNov Number Average November Plant Factor -
65 PFDec Number Average December Plant Factor -
66 GenAnnual Number Average Annual Generation MWh
67 GenJan Number Average January Generation MWh
68 GenFeb Number Average February Generation MWh
69 GenMar Number Average March Generation MWh
70 GenApr Number Average April Generation MWh
71 GenMay Number Average May Generation MWh
72 GenJun Number Average June Generation MWh
73 GenJul Number Average July Generation MWh
74 GenAug Number Average August Generation MWh
75 GenSept Number Average September Generation MWh
76 GenOct Number Average October Generation MWh
77 GenNov Number Average November Generation MWh
78 GenDec Number Average December Generation MWh
Special field values NA Value not available in source data
Value removed due to homeland security concerns
B-5
- ABSTRACT
- EXECUTIVE SUMMARY
- ACKNOWLEDGMENTS
- ACRONYMS
- NOMENCLATURE
- INTRODUCTION
- TECHNICAL APPROACH
-
- Cost Estimating Tools for Plant Development or Expansion
-
- Data Sources
- General Method
- Data Screening
- Accounting for Cost Variations by Type of Site
-
- Cost Estimating Tools for Plant Operation and Maintenance
- Cost Estimating Tools for Turbine and Generator Upgrade
- Estimating Plant Electric Generation
- FERC Annual Charge
- Application of Estimating Tools to Hydropower Resources
-
- RESULTS
-
- Cost Estimating Tools for Plant Development or Expansion
- Cost Estimating Tools for Plant Operation and Maintenance
- Cost Estimating Tools for Turbine and Generator Upgrade
- Estimating Plant Electric Generation
- Estimated Economic Parameters for Hydropower Resources
- Likelihood of Development
-
- CONCLUSIONS AND RECOMMENDATIONS
- REFERENCES
-
- B1IHRED Data Dictionary
- B2IHRED
-

1 to 1
0
10 to
20
20 to
30
30 to
40
40 to
50
50 to
60
60 to
70
70 to
80
80 to
90
90 to
100
100 t
o 150
15
0 to 2
00
200 t
o 250
gt 250
$89 8 2 9 4
$1 1 69 4 85 4 7 6
1 M W 1 28 0 M WCapacity (MW)
Cos
t (20
02$)
Total No of Data Points = 226
19
37
21 20
14
10
6
12 9 10
30
12
6
20
0
5
10
15
20
25
30
35
40
No
of D
ata
Poin
ts
A-8
Capacity Range (MW)
Figure A-3B Number of powerhouse construction cost data points for various plant capacity ranges
A-9
100000M
10000M
1000M
100M
010M
001M
Y = 2E5(C)096
Y = 8E4(C) 096
R2 = 070
1 10 100 1000 10000 Capacity (MW)
FERC 2003 (1980 - 1997)
Undeveloped Sites Dams Without Power
FERC 2003 (1999 - 2001)
67 Lower Bound Dams With Power
98 Lower Bound
Y = 3E5(C)096
Figure A-4A Fish and wildlife mitigation cost as a function of plant capacity for undeveloped sites and powerhouse installation at a dam without power and as a function of added capacity for a plant expansion
Fish
and
Wild
life
Miti
gatio
n C
ost (
2002
$)
1 to 1
0
10 to
20
20 to
30
30 to
40
40 to
50
gt 50
$36773
$27271669
1 MW 697 MW Capacity (MW)
Cos
t (20
02$)
Total No of Data Points = 74 42
11 7
2 3
9
0
5
10
15
20
25
30
35
40
45
No
of D
ata
Poin
ts
A-10
Capacity Range (MW)
Figure A-4B Number of fish and wildlife mitigation cost data points for various plant capacity ranges
A-11
1000000M
100000M
10000M
1000M
0100M
0010M
0001M
Y = 6E4(C) 097
R2 = 087
097
1 10 100 1000 10000 Capacity (MW)
FERC 2003 (1980 - 1997)
Undeveloped Sites Dams Without Power
FERC 2003 (1999 - 2001)
67 Lower Bound Dams With Power
98 Lower Bound
Y = 2E5(C) Y = 2E5(C) 097
Figure A-5A Recreation mitigation cost as a function of plant capacity for undeveloped sites and powerhouse installation at a dam without power and as a function of added capacity for a plant expansion
Rec
reat
ion
Miti
gatio
n C
ost (
2002
$)
1 to 1
0
10 to
20
20 to
30
30 to
40
40 to
50
gt50
$9 2 6 7
$ 27 7 34 6 7 4
1 M W 69 7 M WCapacity (MW)
Cos
t (20
02$)
Total No of Data Points = 101 63
13
5 4 3
13
0
10
20
30
40
50
60
70
No
of D
ata
Poin
ts
A-12
Capacity Range (MW)
Figure A-5B Number of recreation mitigation cost data points for various plant capacity ranges
A-13
10000M
072Y = 1E5(C) 0721000M Y = 8E4(C)
072Y = 6E4(C) R2 = 094
100M
FERC 2003 (1980 - 1997) FERC 2003 (1999 - 2001) 010M Undeveloped Sites Dams Without Power Dams With Power 67 Lower Bound 98 Lower Bound
001M 1 10 100 1000 10000
Capacity (MW)
Figure A-6A Historical and archeological mitigation cost as a function of plant capacity for undeveloped sites and powerhouse installation at a dam without power and as a function of added capacity for a plant expansion
His
toric
al amp
Arc
heol
ogic
al M
itiga
tion
Cos
t (20
02$)
1 to 1
0
10 to
20
20 to
30
30 to
40
40 to
50
gt 50
$10 3 93 9
$6 0 32 1 12
4 M W 69 7 M WCapacity (MW)
Cos
t (20
02$)
Total No of Data Points = 22 12
1
4
0
2 3
0
2
4
6
8
10
12
14
No
of D
ata
Poin
ts
A-14
Capacity Range (MW)
Figure A-6B Number of historical and archeological mitigation cost data points for various plant capacity ranges
10000M
Y = 7E4(C)044
R2 = 056
Y = 2E5(C)044
0010M
0100M
1000M
Wat
er Q
ualit
y M
onito
ring
Cos
t (20
02$)
FERC 2003 (1980 - 1997)
Undeveloped Sites Dams Without Power
FERC 2003 (1999 - 2001)
67 Lower Bound Dams With Power
98 Lower Bound
Y = 4E5(C)044
A-15
0001M 1 10 100 1000 10000
Capacity (MW)
Figure A-7A Water quality monitoring cost as a function of plant capacity for undeveloped sites and powerhouse installation at a dam without power and as a function of added capacity for a plant expansion
1 to 1
0
10 to
20
20 to
30
30 to
40
40 to
50
gt50
$7 6 73
$2 2 09 7 09
1 44 M W 69 7 M WCapacity (MW)
Cos
t (20
02$)
Total No of Data Points = 89 51
14
7 3 2
12
0
10
20
30
40
50
60
No
of D
ata
Poin
ts
A-16
Capacity Range (MW)
Figure A-7B Number of water quality monitoring cost data points for various plant capacity ranges
A-17
1000M
Y = 1E6(C)056
R2 = 099
100M
Fish
Pas
sage
Cos
t (20
02$)
Francfort 1994 FERC 2003 (1999 - 2001)
67 Upper Bound Fish Passage 67 Lower Bound
10M 1 10 100 1000 10000
Capacity (MW)
Figure A-8A Fish passage cost as a function of plant capacity for undeveloped sites and powerhouse installation at a dam without power and as a function of added capacity for a plant expansion
1 to 1
0
10 to
20
20 to
30
30 to
40
40 to
50
gt50
A-18
$1 0 12 3 7 4
$ 52 7 62 5 0 0
1 M W 84 0 M WCapacity (MW)
Cos
t (20
02$)
No
of D
ata
Poin
ts
7
6
5
4
3
2
1
0
1
6 Total No of Data Points = 10
0 0 0
3
Capacity Range (MW)
Figure A-8B Number of fish passage cost data points for various plant capacity ranges
A-19
Y = 2E4(C)075
R2 = 060
001M
010M
100M
1000M
10000M
Fixe
d O
ampM
Cos
t (20
02$)
EIA 2003b (1990 - 2000) 67 Upper Bound All Sites 67 Lower Bound
1 10 100 1000 10000
Capacity (MW)
Figure A-9A Fixed operating and maintenance costs as a function of plant capacity for undeveloped sites and powerhouse installation at a dam without power and as a function of added capacity for a plant expansion
1 to 1
0
10 to
20
20 to
30
30 to
40
40 to
50
50 to
60
60 to
70
70 to
80
80 to
90
90 to
100
100 t
o 150
15
0 to 2
00
200 t
o 250
gt 250
$ 17 1 5 7
$ 11 4 92 7 7 4
1 M W 1 28 0 M WCapacity (MW)
Cos
t (20
02$)
Total No of Data Points = 474
24
105
55 47
33 27
14 19
14 12
51
25
11
37
0
20
40
60
80
10 0
12 0
No
of D
ata
Poin
ts
A-20
Capacity Range (MW)
Figure A-9B Number of fixed operation and maintenance cost data points for various plant capacity ranges
Y = 2E4(C)080
R2 = 067
001M
010M
100M
1000M
10000M Va
riabl
e O
ampM
Cos
t (20
02$)
EIA 2003b (1990 - 2000) 67 Upper Bound All Sites 67 Lower Bound
A-21
1 10 100 1000 10000
Capacity (MW)
Figure A-10A Variable operating and maintenance costs as a function of plant capacity for undeveloped and powerhouse installation at a dam without power and as a function of added capacity for a plant expansion
1 to 1
0
10 to
20
20 to
30
30 to
40
40 to
50
50 to
60
60 to
70
70 to
80
80 to
90
90 to
1 00
100 t
o 150
15
0 to 2
00
200 t
o 250
gt 250
$15 104
$12 929 143
1 MW 1 280 MWCapacity (MW)
Cos
t (20
02$)
Total No of Data Points = 501
39
116
58 51
37 25
14 24
14 14
53
25
10 21
0
20
40
60
80
10 0
12 0
14 0
No
of D
ata
Poin
ts
A-22
Capacity Range (MW)
Figure A-10B Number of variable operation and maintenance cost data points for various plant capacity ranges
A-23
Fran
cis
Turb
ine
Upg
rade
Cos
t (20
02$)
1000M
100M
10M
01M
071 -042Y = [3E6 sdot (C) ] sdot (H)
(C = 200 MW) Y = 13E8(H)-042
(C = 100 MW) Y = 77E7(H)-042
(C = 75 MW) Y = 63E7(H)-042
(C = 50 MW) Y = 47E7(H)-042
(C = 20 MW) Y = 25E7(H)-042
(C = 10 MW) Y = 15E7(H)-042
(C = 5 MW) Y = 92E6(H)-042
100 1000 Head (ft)
Figure A-11 Francis turbine upgrade cost as a function hydraulic head for various plant capacities
10000
A-24
1000M
100M
10M
(C = 5 MW) Y = 13E7(H)-038
(C = 10 MW) Y = 22E7(H)-038
(C = 20 MW) Y = 37E7(H)-038
(C = 50 MW) Y = 71E7(H)-038
(C = 75 MW) Y = 95E7(H)-038 (C = 100 MW) Y = 12E8(H)-038
(C = 200 MW) Y = 19E8(H)-038
10 100
Head (ft)
-038072 )H(](C)[4E6Y sdotsdot=
Figure A-12 Kaplan turbine upgrade cost as a function hydraulic head for various plant capacities
Kap
lan
Turb
ine
Upg
rade
Cos
t (20
02$)
1000
1000M B
ulb
Turb
ine
Upg
rade
Cos
t (20
02$)
100M
(C = 5 MW) Y = 25E7(H)-063
(C = 10 MW) Y = 45E7(H)-063
(C = 20 MW) Y = 82E7(H)-063
(C = 50 MW) Y = 18E8(H)-063
-063086 )H(](C)[6E6Y sdotsdot=
10M 1 10 100 1000
Head (ft)
Figure A-13 Bulb turbine upgrade cost as a function hydraulic head for various plant capacities
A-25
A-26
10M
01M
(C = 5 MW) Y = 84E6(S)-038
(C = 10 MW) Y = 13E7(S)-038
(C = 20 MW) Y = 21E7(S)-038
(C = 50 MW) Y = 37E7(S)-038 (C = 75 MW) Y = 49E7(S)-038 (C = 100 MW) Y = 59E7(S)-038
(C = 200 MW) Y = 92E7(S)-038
100 1000 Speed (RPM)
-038065 )S(](C)[3E6Y sdotsdot=
Figure A-14 Generator upgrade cost as a function of RPM for various plant capacities
1000M
100M
Gen
erat
or U
pgra
de C
ost (
2002
$)
10000
Appendix B
INEEL Hydropower Resource Economics Database (see document back cover for IHRED compact disk)
B-1
B-2
Field Number Field Name Type Description
Appendix B
INEEL Hydropower Resource Economics Database B1 IHRED Data Dictionary B2 IHRED
The data dictionary for the INEEL The IHRED in Excel format is provided on the Hydropower Resource Economics Database compact disk which is in a pocket on the back (IHRED) is given in Table B-1 This table lists the cover of this document The database contains field number parameter name field type (number resource characteristic data estimated or text) field description and units for the development and OampM costs and estimated 78 fields in the database annual and monthly generation for 2155 US
hydropower resources
Table B-1 INEEL Hydropower Resource Economics Database Data Dictionary Units
1 ProjectNumber Text Project Number (FERC number or pseudo FERC number) mdash
2 PlantName Text Name of the project mdash
3 StreamName Text Name of the stream where the project is located mdash
4 StateAbbr Text Two letter abbreviation for the state where the project is located mdash
5 NERCSubregion Text NERC Subregion (1 = East Central Area Reliability Coordination Agreement (ECAR) 2 = Electric Reliability Council of Texas (ERCOT) 3 = Mid-Atlantic Area Council (MAAC) 4 = Mid-America Interconnected Network (MAIN) 5 = Mid-Continent Area Power Pool (MAPP) 6 = Northeast Power Coordinating CouncilNew York (NY) 7 = Northeast Power Coordinating CouncilNew England (NE) 8 = Southeastern Electric Reliability CouncilFlorida (FL) 9 = Southeastern Electric Reliability CouncilExcl Florida (STV) 10 = Southwest Power Pool (SPP) 11 = Western Systems Coordinating CouncilNWP (NWP) 12 = Western Systems Coordinating CouncilRA (RA) 13 = Western Systems Coordinating CouncilCNV (CNV))
mdash
6 Latitude Number Latitude (first digits refer to degrees north last 2 digits refer to minutes)
ddmm
7 Longitude Number Longitude (First digits refer to degrees west last 2 digits refer to minutes)
ddmm
8 ClassCode Text Owner class code (C = Cooperative F = Federal I = Industrial M = Municipal and other non-federal P = Private utility R = Private nonutility)
mdash
9 OwnerName Text Name of project owner mdash
10 Capacity Number Potential capacity at undeveloped sites or sites without power or potential additional capacity at sites with power
MW
11 UnitType Text Type of unit (C = Conventional R = Reversible Z = Missing) mdash
12 PlantType Text Type of Plant (CMB = Combined conventional and reversible units DIV = Gravity diversion (powerhouse on different stream) PDV = Pumped diversion (one-way pumped storage) PMP = Pure (recycled) pump storage RES = Reservoir only ROR = Run-of-river (dam lt= 10 ft high and minimal storage) RRG = Reregulating STG = Storage conventional hydro (dam gt 10 ft high with significant storage) TID = Tidal conventional hydro)
mdash
B-3
Field Number Field Name Type Description
Table B-1 (continued) Units
13 ProjectStatus Text Status of Project (DJ = Disclaimer of FERC jurisdiction EA = Exemption applied for FA = Federally authorized FR = Federally recommended LE = License exemption LJ = Lack of FERC jurisdiction MA = FERC major license application MO = FERC license outstanding NA = FERC minor license application (lt15 kW) NO = FERC minor license outstanding (lt15 kW) PA = FERC preliminary permit application PO = FERC preliminary permit outstanding XX = No status YO = FERC minor part license outstanding ZZ = Missing)
mdash
14 BasinName Text River basin name mdash
15 CountyName Text County where the project is located mdash
16 DamStatus Text Status of Dam (W = With Power WO = Without Power U = Undeveloped)
mdash
17 WSProtection Text WildScenic Protection mdash
18 WSTributary Text WildScenic Tributary or UpstreamDownstream WildScenic Location (YNltblankgt)
mdash
19 Cultural Text Cultural Value (YNltblankgt) mdash
20 Fish Text Fish Value (YNltblankgt) mdash
21 Geological Text Geological Value (YNltblankgt) mdash
22 Historical Text Historical Value (YNltblankgt) mdash
23 Other Text Other criteria such as rare wetland communities and wilderness designation
mdash
24 Recreation Text Recreation Value (YNltblankgt) mdash
25 Scenic Text Scenic Value (YNltblankgt) mdash
26 Wildlife Text Wildlife Value (YNltblankgt) mdash
27 TEW Text ThreatenedEndangered Wildlife (YNltblankgt) mdash
28 TEF Text ThreatenedEndangered Fish (YNltblankgt) mdash
29 FLC103 Text Federal Land Code 103 (National Park Monument Lakeshore Parkway Battlefield or Recreation Area) (YNltblankgt)
mdash
30 FLC104 Text Federal Land Code 104 (National Forest or Grassland) (YNltblankgt)
mdash
31 FLC105 Text Federal Land Code 105 (National Wildlife Refuge Game Preserve or Fish Hatchery) (YNltblankgt)
mdash
32 FLC106 Text Federal Land Code 106 (National Scenic Waterway or Wilderness Area) (YNltblankgt)
mdash
33 FLC107 Text Federal Land Code 107(Indian Reservation) (YNltblankgt) mdash
34 FLC108 Text Federal Land Code 108 (Military Reservation) (YNltblankgt) mdash
35 FLC198 Text Federal Land Code 198 (Not On Federal Land) (YNltblankgt) mdash
36 SiteProb Number Project Environmental Suitability Factor (010 = Development prohibited or highly unlikely 025 = Major reduction in likelihood of development 050 = Likelihood of development reduced by half 075 = Minor reduction in likelihood of development 090 = Little effect on likelihood of development)
mdash
37 LicensingCost Number Total Licensing Cost $K
38 ConstructionCost Number Total Construction Cost $K
39 OvrNiteDevCost Number Overnight Development Cost ( LicensingCost + ConstructionCost ) $K
40 MitHist_Arch Number 30 year Archaeological and Historical mitigation cost (applicable if either Cultural or Historical fields are Y )
$K
41 MitFish_Wildlife Number 30 year fish and wildlife mitigation cost (applicable if any of the Fish Wildlife or TEW fields are Y )
$K
42 MitScenic_Rec Number 30 year scenic and recreation mitigation cost (applicable if either Recreation or Scenic fields are Y )
$K
B-4
Field Number Field Name Type Description
Table B-1 (continued) Units
43 MitWaterMonitor Number 30 year water quality monitoring cost $K
44 MitFishPassage Number 30 year fish passage cost (applicable if TEF field is Y ) $K
45 MitTotal Number Total Mitigation Cost ( Sum of MitHist_Arch MitFish_Wildlife MitScenic_Rec MitWaterMonitor and MitFishPassage )
$K
46 TotalDevCost Number Total Development Cost ( OvrNiteDevCost + MitTotal ) $K
47 UnitTotalDevCost Number Total Development Unit Cost $kW
48 FixedOM Number Average Annual Fixed OampM $K
49 UnitFixedOM Number Average Annual Fixed OampM Unit Cost $kW
50 VariableOM Number Average Annual Variable OampM $K
51 UnitVariableOM Number Average Annual Variable OampM Unit Cost MillskWh
52 FERCAnnChrg Number FERC Annual Charge (applicable if Capacity gt= 15 MW ) $K
53 PFAnnual Number Average Annual Plant Factor -
54 PFJan Number Average January Plant Factor -
55 PFFeb Number Average February Plant Factor -
56 PFMar Number Average March Plant Factor -
57 PFApr Number Average April Plant Factor -
58 PFMay Number Average May Plant Factor -
59 PFJun Number Average June Plant Factor -
60 PFJul Number Average July Plant Factor -
61 PFAug Number Average August Plant Factor -
62 PFSept Number Average September Plant Factor -
63 PFOct Number Average October Plant Factor -
64 PFNov Number Average November Plant Factor -
65 PFDec Number Average December Plant Factor -
66 GenAnnual Number Average Annual Generation MWh
67 GenJan Number Average January Generation MWh
68 GenFeb Number Average February Generation MWh
69 GenMar Number Average March Generation MWh
70 GenApr Number Average April Generation MWh
71 GenMay Number Average May Generation MWh
72 GenJun Number Average June Generation MWh
73 GenJul Number Average July Generation MWh
74 GenAug Number Average August Generation MWh
75 GenSept Number Average September Generation MWh
76 GenOct Number Average October Generation MWh
77 GenNov Number Average November Generation MWh
78 GenDec Number Average December Generation MWh
Special field values NA Value not available in source data
Value removed due to homeland security concerns
B-5
- ABSTRACT
- EXECUTIVE SUMMARY
- ACKNOWLEDGMENTS
- ACRONYMS
- NOMENCLATURE
- INTRODUCTION
- TECHNICAL APPROACH
-
- Cost Estimating Tools for Plant Development or Expansion
-
- Data Sources
- General Method
- Data Screening
- Accounting for Cost Variations by Type of Site
-
- Cost Estimating Tools for Plant Operation and Maintenance
- Cost Estimating Tools for Turbine and Generator Upgrade
- Estimating Plant Electric Generation
- FERC Annual Charge
- Application of Estimating Tools to Hydropower Resources
-
- RESULTS
-
- Cost Estimating Tools for Plant Development or Expansion
- Cost Estimating Tools for Plant Operation and Maintenance
- Cost Estimating Tools for Turbine and Generator Upgrade
- Estimating Plant Electric Generation
- Estimated Economic Parameters for Hydropower Resources
- Likelihood of Development
-
- CONCLUSIONS AND RECOMMENDATIONS
- REFERENCES
-
- B1IHRED Data Dictionary
- B2IHRED
-

1 to 1
0
10 to
20
20 to
30
30 to
40
40 to
50
gt 50
$36773
$27271669
1 MW 697 MW Capacity (MW)
Cos
t (20
02$)
Total No of Data Points = 74 42
11 7
2 3
9
0
5
10
15
20
25
30
35
40
45
No
of D
ata
Poin
ts
A-10
Capacity Range (MW)
Figure A-4B Number of fish and wildlife mitigation cost data points for various plant capacity ranges
A-11
1000000M
100000M
10000M
1000M
0100M
0010M
0001M
Y = 6E4(C) 097
R2 = 087
097
1 10 100 1000 10000 Capacity (MW)
FERC 2003 (1980 - 1997)
Undeveloped Sites Dams Without Power
FERC 2003 (1999 - 2001)
67 Lower Bound Dams With Power
98 Lower Bound
Y = 2E5(C) Y = 2E5(C) 097
Figure A-5A Recreation mitigation cost as a function of plant capacity for undeveloped sites and powerhouse installation at a dam without power and as a function of added capacity for a plant expansion
Rec
reat
ion
Miti
gatio
n C
ost (
2002
$)
1 to 1
0
10 to
20
20 to
30
30 to
40
40 to
50
gt50
$9 2 6 7
$ 27 7 34 6 7 4
1 M W 69 7 M WCapacity (MW)
Cos
t (20
02$)
Total No of Data Points = 101 63
13
5 4 3
13
0
10
20
30
40
50
60
70
No
of D
ata
Poin
ts
A-12
Capacity Range (MW)
Figure A-5B Number of recreation mitigation cost data points for various plant capacity ranges
A-13
10000M
072Y = 1E5(C) 0721000M Y = 8E4(C)
072Y = 6E4(C) R2 = 094
100M
FERC 2003 (1980 - 1997) FERC 2003 (1999 - 2001) 010M Undeveloped Sites Dams Without Power Dams With Power 67 Lower Bound 98 Lower Bound
001M 1 10 100 1000 10000
Capacity (MW)
Figure A-6A Historical and archeological mitigation cost as a function of plant capacity for undeveloped sites and powerhouse installation at a dam without power and as a function of added capacity for a plant expansion
His
toric
al amp
Arc
heol
ogic
al M
itiga
tion
Cos
t (20
02$)
1 to 1
0
10 to
20
20 to
30
30 to
40
40 to
50
gt 50
$10 3 93 9
$6 0 32 1 12
4 M W 69 7 M WCapacity (MW)
Cos
t (20
02$)
Total No of Data Points = 22 12
1
4
0
2 3
0
2
4
6
8
10
12
14
No
of D
ata
Poin
ts
A-14
Capacity Range (MW)
Figure A-6B Number of historical and archeological mitigation cost data points for various plant capacity ranges
10000M
Y = 7E4(C)044
R2 = 056
Y = 2E5(C)044
0010M
0100M
1000M
Wat
er Q
ualit
y M
onito
ring
Cos
t (20
02$)
FERC 2003 (1980 - 1997)
Undeveloped Sites Dams Without Power
FERC 2003 (1999 - 2001)
67 Lower Bound Dams With Power
98 Lower Bound
Y = 4E5(C)044
A-15
0001M 1 10 100 1000 10000
Capacity (MW)
Figure A-7A Water quality monitoring cost as a function of plant capacity for undeveloped sites and powerhouse installation at a dam without power and as a function of added capacity for a plant expansion
1 to 1
0
10 to
20
20 to
30
30 to
40
40 to
50
gt50
$7 6 73
$2 2 09 7 09
1 44 M W 69 7 M WCapacity (MW)
Cos
t (20
02$)
Total No of Data Points = 89 51
14
7 3 2
12
0
10
20
30
40
50
60
No
of D
ata
Poin
ts
A-16
Capacity Range (MW)
Figure A-7B Number of water quality monitoring cost data points for various plant capacity ranges
A-17
1000M
Y = 1E6(C)056
R2 = 099
100M
Fish
Pas
sage
Cos
t (20
02$)
Francfort 1994 FERC 2003 (1999 - 2001)
67 Upper Bound Fish Passage 67 Lower Bound
10M 1 10 100 1000 10000
Capacity (MW)
Figure A-8A Fish passage cost as a function of plant capacity for undeveloped sites and powerhouse installation at a dam without power and as a function of added capacity for a plant expansion
1 to 1
0
10 to
20
20 to
30
30 to
40
40 to
50
gt50
A-18
$1 0 12 3 7 4
$ 52 7 62 5 0 0
1 M W 84 0 M WCapacity (MW)
Cos
t (20
02$)
No
of D
ata
Poin
ts
7
6
5
4
3
2
1
0
1
6 Total No of Data Points = 10
0 0 0
3
Capacity Range (MW)
Figure A-8B Number of fish passage cost data points for various plant capacity ranges
A-19
Y = 2E4(C)075
R2 = 060
001M
010M
100M
1000M
10000M
Fixe
d O
ampM
Cos
t (20
02$)
EIA 2003b (1990 - 2000) 67 Upper Bound All Sites 67 Lower Bound
1 10 100 1000 10000
Capacity (MW)
Figure A-9A Fixed operating and maintenance costs as a function of plant capacity for undeveloped sites and powerhouse installation at a dam without power and as a function of added capacity for a plant expansion
1 to 1
0
10 to
20
20 to
30
30 to
40
40 to
50
50 to
60
60 to
70
70 to
80
80 to
90
90 to
100
100 t
o 150
15
0 to 2
00
200 t
o 250
gt 250
$ 17 1 5 7
$ 11 4 92 7 7 4
1 M W 1 28 0 M WCapacity (MW)
Cos
t (20
02$)
Total No of Data Points = 474
24
105
55 47
33 27
14 19
14 12
51
25
11
37
0
20
40
60
80
10 0
12 0
No
of D
ata
Poin
ts
A-20
Capacity Range (MW)
Figure A-9B Number of fixed operation and maintenance cost data points for various plant capacity ranges
Y = 2E4(C)080
R2 = 067
001M
010M
100M
1000M
10000M Va
riabl
e O
ampM
Cos
t (20
02$)
EIA 2003b (1990 - 2000) 67 Upper Bound All Sites 67 Lower Bound
A-21
1 10 100 1000 10000
Capacity (MW)
Figure A-10A Variable operating and maintenance costs as a function of plant capacity for undeveloped and powerhouse installation at a dam without power and as a function of added capacity for a plant expansion
1 to 1
0
10 to
20
20 to
30
30 to
40
40 to
50
50 to
60
60 to
70
70 to
80
80 to
90
90 to
1 00
100 t
o 150
15
0 to 2
00
200 t
o 250
gt 250
$15 104
$12 929 143
1 MW 1 280 MWCapacity (MW)
Cos
t (20
02$)
Total No of Data Points = 501
39
116
58 51
37 25
14 24
14 14
53
25
10 21
0
20
40
60
80
10 0
12 0
14 0
No
of D
ata
Poin
ts
A-22
Capacity Range (MW)
Figure A-10B Number of variable operation and maintenance cost data points for various plant capacity ranges
A-23
Fran
cis
Turb
ine
Upg
rade
Cos
t (20
02$)
1000M
100M
10M
01M
071 -042Y = [3E6 sdot (C) ] sdot (H)
(C = 200 MW) Y = 13E8(H)-042
(C = 100 MW) Y = 77E7(H)-042
(C = 75 MW) Y = 63E7(H)-042
(C = 50 MW) Y = 47E7(H)-042
(C = 20 MW) Y = 25E7(H)-042
(C = 10 MW) Y = 15E7(H)-042
(C = 5 MW) Y = 92E6(H)-042
100 1000 Head (ft)
Figure A-11 Francis turbine upgrade cost as a function hydraulic head for various plant capacities
10000
A-24
1000M
100M
10M
(C = 5 MW) Y = 13E7(H)-038
(C = 10 MW) Y = 22E7(H)-038
(C = 20 MW) Y = 37E7(H)-038
(C = 50 MW) Y = 71E7(H)-038
(C = 75 MW) Y = 95E7(H)-038 (C = 100 MW) Y = 12E8(H)-038
(C = 200 MW) Y = 19E8(H)-038
10 100
Head (ft)
-038072 )H(](C)[4E6Y sdotsdot=
Figure A-12 Kaplan turbine upgrade cost as a function hydraulic head for various plant capacities
Kap
lan
Turb
ine
Upg
rade
Cos
t (20
02$)
1000
1000M B
ulb
Turb
ine
Upg
rade
Cos
t (20
02$)
100M
(C = 5 MW) Y = 25E7(H)-063
(C = 10 MW) Y = 45E7(H)-063
(C = 20 MW) Y = 82E7(H)-063
(C = 50 MW) Y = 18E8(H)-063
-063086 )H(](C)[6E6Y sdotsdot=
10M 1 10 100 1000
Head (ft)
Figure A-13 Bulb turbine upgrade cost as a function hydraulic head for various plant capacities
A-25
A-26
10M
01M
(C = 5 MW) Y = 84E6(S)-038
(C = 10 MW) Y = 13E7(S)-038
(C = 20 MW) Y = 21E7(S)-038
(C = 50 MW) Y = 37E7(S)-038 (C = 75 MW) Y = 49E7(S)-038 (C = 100 MW) Y = 59E7(S)-038
(C = 200 MW) Y = 92E7(S)-038
100 1000 Speed (RPM)
-038065 )S(](C)[3E6Y sdotsdot=
Figure A-14 Generator upgrade cost as a function of RPM for various plant capacities
1000M
100M
Gen
erat
or U
pgra
de C
ost (
2002
$)
10000
Appendix B
INEEL Hydropower Resource Economics Database (see document back cover for IHRED compact disk)
B-1
B-2
Field Number Field Name Type Description
Appendix B
INEEL Hydropower Resource Economics Database B1 IHRED Data Dictionary B2 IHRED
The data dictionary for the INEEL The IHRED in Excel format is provided on the Hydropower Resource Economics Database compact disk which is in a pocket on the back (IHRED) is given in Table B-1 This table lists the cover of this document The database contains field number parameter name field type (number resource characteristic data estimated or text) field description and units for the development and OampM costs and estimated 78 fields in the database annual and monthly generation for 2155 US
hydropower resources
Table B-1 INEEL Hydropower Resource Economics Database Data Dictionary Units
1 ProjectNumber Text Project Number (FERC number or pseudo FERC number) mdash
2 PlantName Text Name of the project mdash
3 StreamName Text Name of the stream where the project is located mdash
4 StateAbbr Text Two letter abbreviation for the state where the project is located mdash
5 NERCSubregion Text NERC Subregion (1 = East Central Area Reliability Coordination Agreement (ECAR) 2 = Electric Reliability Council of Texas (ERCOT) 3 = Mid-Atlantic Area Council (MAAC) 4 = Mid-America Interconnected Network (MAIN) 5 = Mid-Continent Area Power Pool (MAPP) 6 = Northeast Power Coordinating CouncilNew York (NY) 7 = Northeast Power Coordinating CouncilNew England (NE) 8 = Southeastern Electric Reliability CouncilFlorida (FL) 9 = Southeastern Electric Reliability CouncilExcl Florida (STV) 10 = Southwest Power Pool (SPP) 11 = Western Systems Coordinating CouncilNWP (NWP) 12 = Western Systems Coordinating CouncilRA (RA) 13 = Western Systems Coordinating CouncilCNV (CNV))
mdash
6 Latitude Number Latitude (first digits refer to degrees north last 2 digits refer to minutes)
ddmm
7 Longitude Number Longitude (First digits refer to degrees west last 2 digits refer to minutes)
ddmm
8 ClassCode Text Owner class code (C = Cooperative F = Federal I = Industrial M = Municipal and other non-federal P = Private utility R = Private nonutility)
mdash
9 OwnerName Text Name of project owner mdash
10 Capacity Number Potential capacity at undeveloped sites or sites without power or potential additional capacity at sites with power
MW
11 UnitType Text Type of unit (C = Conventional R = Reversible Z = Missing) mdash
12 PlantType Text Type of Plant (CMB = Combined conventional and reversible units DIV = Gravity diversion (powerhouse on different stream) PDV = Pumped diversion (one-way pumped storage) PMP = Pure (recycled) pump storage RES = Reservoir only ROR = Run-of-river (dam lt= 10 ft high and minimal storage) RRG = Reregulating STG = Storage conventional hydro (dam gt 10 ft high with significant storage) TID = Tidal conventional hydro)
mdash
B-3
Field Number Field Name Type Description
Table B-1 (continued) Units
13 ProjectStatus Text Status of Project (DJ = Disclaimer of FERC jurisdiction EA = Exemption applied for FA = Federally authorized FR = Federally recommended LE = License exemption LJ = Lack of FERC jurisdiction MA = FERC major license application MO = FERC license outstanding NA = FERC minor license application (lt15 kW) NO = FERC minor license outstanding (lt15 kW) PA = FERC preliminary permit application PO = FERC preliminary permit outstanding XX = No status YO = FERC minor part license outstanding ZZ = Missing)
mdash
14 BasinName Text River basin name mdash
15 CountyName Text County where the project is located mdash
16 DamStatus Text Status of Dam (W = With Power WO = Without Power U = Undeveloped)
mdash
17 WSProtection Text WildScenic Protection mdash
18 WSTributary Text WildScenic Tributary or UpstreamDownstream WildScenic Location (YNltblankgt)
mdash
19 Cultural Text Cultural Value (YNltblankgt) mdash
20 Fish Text Fish Value (YNltblankgt) mdash
21 Geological Text Geological Value (YNltblankgt) mdash
22 Historical Text Historical Value (YNltblankgt) mdash
23 Other Text Other criteria such as rare wetland communities and wilderness designation
mdash
24 Recreation Text Recreation Value (YNltblankgt) mdash
25 Scenic Text Scenic Value (YNltblankgt) mdash
26 Wildlife Text Wildlife Value (YNltblankgt) mdash
27 TEW Text ThreatenedEndangered Wildlife (YNltblankgt) mdash
28 TEF Text ThreatenedEndangered Fish (YNltblankgt) mdash
29 FLC103 Text Federal Land Code 103 (National Park Monument Lakeshore Parkway Battlefield or Recreation Area) (YNltblankgt)
mdash
30 FLC104 Text Federal Land Code 104 (National Forest or Grassland) (YNltblankgt)
mdash
31 FLC105 Text Federal Land Code 105 (National Wildlife Refuge Game Preserve or Fish Hatchery) (YNltblankgt)
mdash
32 FLC106 Text Federal Land Code 106 (National Scenic Waterway or Wilderness Area) (YNltblankgt)
mdash
33 FLC107 Text Federal Land Code 107(Indian Reservation) (YNltblankgt) mdash
34 FLC108 Text Federal Land Code 108 (Military Reservation) (YNltblankgt) mdash
35 FLC198 Text Federal Land Code 198 (Not On Federal Land) (YNltblankgt) mdash
36 SiteProb Number Project Environmental Suitability Factor (010 = Development prohibited or highly unlikely 025 = Major reduction in likelihood of development 050 = Likelihood of development reduced by half 075 = Minor reduction in likelihood of development 090 = Little effect on likelihood of development)
mdash
37 LicensingCost Number Total Licensing Cost $K
38 ConstructionCost Number Total Construction Cost $K
39 OvrNiteDevCost Number Overnight Development Cost ( LicensingCost + ConstructionCost ) $K
40 MitHist_Arch Number 30 year Archaeological and Historical mitigation cost (applicable if either Cultural or Historical fields are Y )
$K
41 MitFish_Wildlife Number 30 year fish and wildlife mitigation cost (applicable if any of the Fish Wildlife or TEW fields are Y )
$K
42 MitScenic_Rec Number 30 year scenic and recreation mitigation cost (applicable if either Recreation or Scenic fields are Y )
$K
B-4
Field Number Field Name Type Description
Table B-1 (continued) Units
43 MitWaterMonitor Number 30 year water quality monitoring cost $K
44 MitFishPassage Number 30 year fish passage cost (applicable if TEF field is Y ) $K
45 MitTotal Number Total Mitigation Cost ( Sum of MitHist_Arch MitFish_Wildlife MitScenic_Rec MitWaterMonitor and MitFishPassage )
$K
46 TotalDevCost Number Total Development Cost ( OvrNiteDevCost + MitTotal ) $K
47 UnitTotalDevCost Number Total Development Unit Cost $kW
48 FixedOM Number Average Annual Fixed OampM $K
49 UnitFixedOM Number Average Annual Fixed OampM Unit Cost $kW
50 VariableOM Number Average Annual Variable OampM $K
51 UnitVariableOM Number Average Annual Variable OampM Unit Cost MillskWh
52 FERCAnnChrg Number FERC Annual Charge (applicable if Capacity gt= 15 MW ) $K
53 PFAnnual Number Average Annual Plant Factor -
54 PFJan Number Average January Plant Factor -
55 PFFeb Number Average February Plant Factor -
56 PFMar Number Average March Plant Factor -
57 PFApr Number Average April Plant Factor -
58 PFMay Number Average May Plant Factor -
59 PFJun Number Average June Plant Factor -
60 PFJul Number Average July Plant Factor -
61 PFAug Number Average August Plant Factor -
62 PFSept Number Average September Plant Factor -
63 PFOct Number Average October Plant Factor -
64 PFNov Number Average November Plant Factor -
65 PFDec Number Average December Plant Factor -
66 GenAnnual Number Average Annual Generation MWh
67 GenJan Number Average January Generation MWh
68 GenFeb Number Average February Generation MWh
69 GenMar Number Average March Generation MWh
70 GenApr Number Average April Generation MWh
71 GenMay Number Average May Generation MWh
72 GenJun Number Average June Generation MWh
73 GenJul Number Average July Generation MWh
74 GenAug Number Average August Generation MWh
75 GenSept Number Average September Generation MWh
76 GenOct Number Average October Generation MWh
77 GenNov Number Average November Generation MWh
78 GenDec Number Average December Generation MWh
Special field values NA Value not available in source data
Value removed due to homeland security concerns
B-5
- ABSTRACT
- EXECUTIVE SUMMARY
- ACKNOWLEDGMENTS
- ACRONYMS
- NOMENCLATURE
- INTRODUCTION
- TECHNICAL APPROACH
-
- Cost Estimating Tools for Plant Development or Expansion
-
- Data Sources
- General Method
- Data Screening
- Accounting for Cost Variations by Type of Site
-
- Cost Estimating Tools for Plant Operation and Maintenance
- Cost Estimating Tools for Turbine and Generator Upgrade
- Estimating Plant Electric Generation
- FERC Annual Charge
- Application of Estimating Tools to Hydropower Resources
-
- RESULTS
-
- Cost Estimating Tools for Plant Development or Expansion
- Cost Estimating Tools for Plant Operation and Maintenance
- Cost Estimating Tools for Turbine and Generator Upgrade
- Estimating Plant Electric Generation
- Estimated Economic Parameters for Hydropower Resources
- Likelihood of Development
-
- CONCLUSIONS AND RECOMMENDATIONS
- REFERENCES
-
- B1IHRED Data Dictionary
- B2IHRED
-
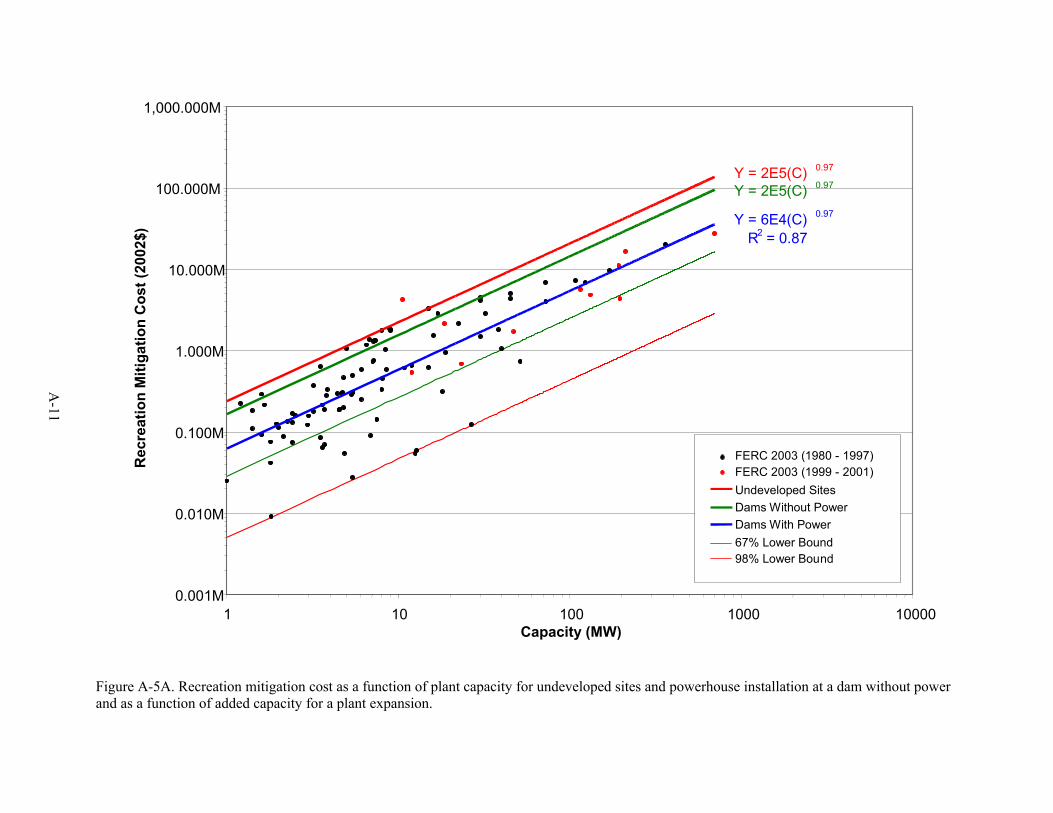

1 to 1
0
10 to
20
20 to
30
30 to
40
40 to
50
gt50
$9 2 6 7
$ 27 7 34 6 7 4
1 M W 69 7 M WCapacity (MW)
Cos
t (20
02$)
Total No of Data Points = 101 63
13
5 4 3
13
0
10
20
30
40
50
60
70
No
of D
ata
Poin
ts
A-12
Capacity Range (MW)
Figure A-5B Number of recreation mitigation cost data points for various plant capacity ranges
A-13
10000M
072Y = 1E5(C) 0721000M Y = 8E4(C)
072Y = 6E4(C) R2 = 094
100M
FERC 2003 (1980 - 1997) FERC 2003 (1999 - 2001) 010M Undeveloped Sites Dams Without Power Dams With Power 67 Lower Bound 98 Lower Bound
001M 1 10 100 1000 10000
Capacity (MW)
Figure A-6A Historical and archeological mitigation cost as a function of plant capacity for undeveloped sites and powerhouse installation at a dam without power and as a function of added capacity for a plant expansion
His
toric
al amp
Arc
heol
ogic
al M
itiga
tion
Cos
t (20
02$)
1 to 1
0
10 to
20
20 to
30
30 to
40
40 to
50
gt 50
$10 3 93 9
$6 0 32 1 12
4 M W 69 7 M WCapacity (MW)
Cos
t (20
02$)
Total No of Data Points = 22 12
1
4
0
2 3
0
2
4
6
8
10
12
14
No
of D
ata
Poin
ts
A-14
Capacity Range (MW)
Figure A-6B Number of historical and archeological mitigation cost data points for various plant capacity ranges
10000M
Y = 7E4(C)044
R2 = 056
Y = 2E5(C)044
0010M
0100M
1000M
Wat
er Q
ualit
y M
onito
ring
Cos
t (20
02$)
FERC 2003 (1980 - 1997)
Undeveloped Sites Dams Without Power
FERC 2003 (1999 - 2001)
67 Lower Bound Dams With Power
98 Lower Bound
Y = 4E5(C)044
A-15
0001M 1 10 100 1000 10000
Capacity (MW)
Figure A-7A Water quality monitoring cost as a function of plant capacity for undeveloped sites and powerhouse installation at a dam without power and as a function of added capacity for a plant expansion
1 to 1
0
10 to
20
20 to
30
30 to
40
40 to
50
gt50
$7 6 73
$2 2 09 7 09
1 44 M W 69 7 M WCapacity (MW)
Cos
t (20
02$)
Total No of Data Points = 89 51
14
7 3 2
12
0
10
20
30
40
50
60
No
of D
ata
Poin
ts
A-16
Capacity Range (MW)
Figure A-7B Number of water quality monitoring cost data points for various plant capacity ranges
A-17
1000M
Y = 1E6(C)056
R2 = 099
100M
Fish
Pas
sage
Cos
t (20
02$)
Francfort 1994 FERC 2003 (1999 - 2001)
67 Upper Bound Fish Passage 67 Lower Bound
10M 1 10 100 1000 10000
Capacity (MW)
Figure A-8A Fish passage cost as a function of plant capacity for undeveloped sites and powerhouse installation at a dam without power and as a function of added capacity for a plant expansion
1 to 1
0
10 to
20
20 to
30
30 to
40
40 to
50
gt50
A-18
$1 0 12 3 7 4
$ 52 7 62 5 0 0
1 M W 84 0 M WCapacity (MW)
Cos
t (20
02$)
No
of D
ata
Poin
ts
7
6
5
4
3
2
1
0
1
6 Total No of Data Points = 10
0 0 0
3
Capacity Range (MW)
Figure A-8B Number of fish passage cost data points for various plant capacity ranges
A-19
Y = 2E4(C)075
R2 = 060
001M
010M
100M
1000M
10000M
Fixe
d O
ampM
Cos
t (20
02$)
EIA 2003b (1990 - 2000) 67 Upper Bound All Sites 67 Lower Bound
1 10 100 1000 10000
Capacity (MW)
Figure A-9A Fixed operating and maintenance costs as a function of plant capacity for undeveloped sites and powerhouse installation at a dam without power and as a function of added capacity for a plant expansion
1 to 1
0
10 to
20
20 to
30
30 to
40
40 to
50
50 to
60
60 to
70
70 to
80
80 to
90
90 to
100
100 t
o 150
15
0 to 2
00
200 t
o 250
gt 250
$ 17 1 5 7
$ 11 4 92 7 7 4
1 M W 1 28 0 M WCapacity (MW)
Cos
t (20
02$)
Total No of Data Points = 474
24
105
55 47
33 27
14 19
14 12
51
25
11
37
0
20
40
60
80
10 0
12 0
No
of D
ata
Poin
ts
A-20
Capacity Range (MW)
Figure A-9B Number of fixed operation and maintenance cost data points for various plant capacity ranges
Y = 2E4(C)080
R2 = 067
001M
010M
100M
1000M
10000M Va
riabl
e O
ampM
Cos
t (20
02$)
EIA 2003b (1990 - 2000) 67 Upper Bound All Sites 67 Lower Bound
A-21
1 10 100 1000 10000
Capacity (MW)
Figure A-10A Variable operating and maintenance costs as a function of plant capacity for undeveloped and powerhouse installation at a dam without power and as a function of added capacity for a plant expansion
1 to 1
0
10 to
20
20 to
30
30 to
40
40 to
50
50 to
60
60 to
70
70 to
80
80 to
90
90 to
1 00
100 t
o 150
15
0 to 2
00
200 t
o 250
gt 250
$15 104
$12 929 143
1 MW 1 280 MWCapacity (MW)
Cos
t (20
02$)
Total No of Data Points = 501
39
116
58 51
37 25
14 24
14 14
53
25
10 21
0
20
40
60
80
10 0
12 0
14 0
No
of D
ata
Poin
ts
A-22
Capacity Range (MW)
Figure A-10B Number of variable operation and maintenance cost data points for various plant capacity ranges
A-23
Fran
cis
Turb
ine
Upg
rade
Cos
t (20
02$)
1000M
100M
10M
01M
071 -042Y = [3E6 sdot (C) ] sdot (H)
(C = 200 MW) Y = 13E8(H)-042
(C = 100 MW) Y = 77E7(H)-042
(C = 75 MW) Y = 63E7(H)-042
(C = 50 MW) Y = 47E7(H)-042
(C = 20 MW) Y = 25E7(H)-042
(C = 10 MW) Y = 15E7(H)-042
(C = 5 MW) Y = 92E6(H)-042
100 1000 Head (ft)
Figure A-11 Francis turbine upgrade cost as a function hydraulic head for various plant capacities
10000
A-24
1000M
100M
10M
(C = 5 MW) Y = 13E7(H)-038
(C = 10 MW) Y = 22E7(H)-038
(C = 20 MW) Y = 37E7(H)-038
(C = 50 MW) Y = 71E7(H)-038
(C = 75 MW) Y = 95E7(H)-038 (C = 100 MW) Y = 12E8(H)-038
(C = 200 MW) Y = 19E8(H)-038
10 100
Head (ft)
-038072 )H(](C)[4E6Y sdotsdot=
Figure A-12 Kaplan turbine upgrade cost as a function hydraulic head for various plant capacities
Kap
lan
Turb
ine
Upg
rade
Cos
t (20
02$)
1000
1000M B
ulb
Turb
ine
Upg
rade
Cos
t (20
02$)
100M
(C = 5 MW) Y = 25E7(H)-063
(C = 10 MW) Y = 45E7(H)-063
(C = 20 MW) Y = 82E7(H)-063
(C = 50 MW) Y = 18E8(H)-063
-063086 )H(](C)[6E6Y sdotsdot=
10M 1 10 100 1000
Head (ft)
Figure A-13 Bulb turbine upgrade cost as a function hydraulic head for various plant capacities
A-25
A-26
10M
01M
(C = 5 MW) Y = 84E6(S)-038
(C = 10 MW) Y = 13E7(S)-038
(C = 20 MW) Y = 21E7(S)-038
(C = 50 MW) Y = 37E7(S)-038 (C = 75 MW) Y = 49E7(S)-038 (C = 100 MW) Y = 59E7(S)-038
(C = 200 MW) Y = 92E7(S)-038
100 1000 Speed (RPM)
-038065 )S(](C)[3E6Y sdotsdot=
Figure A-14 Generator upgrade cost as a function of RPM for various plant capacities
1000M
100M
Gen
erat
or U
pgra
de C
ost (
2002
$)
10000
Appendix B
INEEL Hydropower Resource Economics Database (see document back cover for IHRED compact disk)
B-1
B-2
Field Number Field Name Type Description
Appendix B
INEEL Hydropower Resource Economics Database B1 IHRED Data Dictionary B2 IHRED
The data dictionary for the INEEL The IHRED in Excel format is provided on the Hydropower Resource Economics Database compact disk which is in a pocket on the back (IHRED) is given in Table B-1 This table lists the cover of this document The database contains field number parameter name field type (number resource characteristic data estimated or text) field description and units for the development and OampM costs and estimated 78 fields in the database annual and monthly generation for 2155 US
hydropower resources
Table B-1 INEEL Hydropower Resource Economics Database Data Dictionary Units
1 ProjectNumber Text Project Number (FERC number or pseudo FERC number) mdash
2 PlantName Text Name of the project mdash
3 StreamName Text Name of the stream where the project is located mdash
4 StateAbbr Text Two letter abbreviation for the state where the project is located mdash
5 NERCSubregion Text NERC Subregion (1 = East Central Area Reliability Coordination Agreement (ECAR) 2 = Electric Reliability Council of Texas (ERCOT) 3 = Mid-Atlantic Area Council (MAAC) 4 = Mid-America Interconnected Network (MAIN) 5 = Mid-Continent Area Power Pool (MAPP) 6 = Northeast Power Coordinating CouncilNew York (NY) 7 = Northeast Power Coordinating CouncilNew England (NE) 8 = Southeastern Electric Reliability CouncilFlorida (FL) 9 = Southeastern Electric Reliability CouncilExcl Florida (STV) 10 = Southwest Power Pool (SPP) 11 = Western Systems Coordinating CouncilNWP (NWP) 12 = Western Systems Coordinating CouncilRA (RA) 13 = Western Systems Coordinating CouncilCNV (CNV))
mdash
6 Latitude Number Latitude (first digits refer to degrees north last 2 digits refer to minutes)
ddmm
7 Longitude Number Longitude (First digits refer to degrees west last 2 digits refer to minutes)
ddmm
8 ClassCode Text Owner class code (C = Cooperative F = Federal I = Industrial M = Municipal and other non-federal P = Private utility R = Private nonutility)
mdash
9 OwnerName Text Name of project owner mdash
10 Capacity Number Potential capacity at undeveloped sites or sites without power or potential additional capacity at sites with power
MW
11 UnitType Text Type of unit (C = Conventional R = Reversible Z = Missing) mdash
12 PlantType Text Type of Plant (CMB = Combined conventional and reversible units DIV = Gravity diversion (powerhouse on different stream) PDV = Pumped diversion (one-way pumped storage) PMP = Pure (recycled) pump storage RES = Reservoir only ROR = Run-of-river (dam lt= 10 ft high and minimal storage) RRG = Reregulating STG = Storage conventional hydro (dam gt 10 ft high with significant storage) TID = Tidal conventional hydro)
mdash
B-3
Field Number Field Name Type Description
Table B-1 (continued) Units
13 ProjectStatus Text Status of Project (DJ = Disclaimer of FERC jurisdiction EA = Exemption applied for FA = Federally authorized FR = Federally recommended LE = License exemption LJ = Lack of FERC jurisdiction MA = FERC major license application MO = FERC license outstanding NA = FERC minor license application (lt15 kW) NO = FERC minor license outstanding (lt15 kW) PA = FERC preliminary permit application PO = FERC preliminary permit outstanding XX = No status YO = FERC minor part license outstanding ZZ = Missing)
mdash
14 BasinName Text River basin name mdash
15 CountyName Text County where the project is located mdash
16 DamStatus Text Status of Dam (W = With Power WO = Without Power U = Undeveloped)
mdash
17 WSProtection Text WildScenic Protection mdash
18 WSTributary Text WildScenic Tributary or UpstreamDownstream WildScenic Location (YNltblankgt)
mdash
19 Cultural Text Cultural Value (YNltblankgt) mdash
20 Fish Text Fish Value (YNltblankgt) mdash
21 Geological Text Geological Value (YNltblankgt) mdash
22 Historical Text Historical Value (YNltblankgt) mdash
23 Other Text Other criteria such as rare wetland communities and wilderness designation
mdash
24 Recreation Text Recreation Value (YNltblankgt) mdash
25 Scenic Text Scenic Value (YNltblankgt) mdash
26 Wildlife Text Wildlife Value (YNltblankgt) mdash
27 TEW Text ThreatenedEndangered Wildlife (YNltblankgt) mdash
28 TEF Text ThreatenedEndangered Fish (YNltblankgt) mdash
29 FLC103 Text Federal Land Code 103 (National Park Monument Lakeshore Parkway Battlefield or Recreation Area) (YNltblankgt)
mdash
30 FLC104 Text Federal Land Code 104 (National Forest or Grassland) (YNltblankgt)
mdash
31 FLC105 Text Federal Land Code 105 (National Wildlife Refuge Game Preserve or Fish Hatchery) (YNltblankgt)
mdash
32 FLC106 Text Federal Land Code 106 (National Scenic Waterway or Wilderness Area) (YNltblankgt)
mdash
33 FLC107 Text Federal Land Code 107(Indian Reservation) (YNltblankgt) mdash
34 FLC108 Text Federal Land Code 108 (Military Reservation) (YNltblankgt) mdash
35 FLC198 Text Federal Land Code 198 (Not On Federal Land) (YNltblankgt) mdash
36 SiteProb Number Project Environmental Suitability Factor (010 = Development prohibited or highly unlikely 025 = Major reduction in likelihood of development 050 = Likelihood of development reduced by half 075 = Minor reduction in likelihood of development 090 = Little effect on likelihood of development)
mdash
37 LicensingCost Number Total Licensing Cost $K
38 ConstructionCost Number Total Construction Cost $K
39 OvrNiteDevCost Number Overnight Development Cost ( LicensingCost + ConstructionCost ) $K
40 MitHist_Arch Number 30 year Archaeological and Historical mitigation cost (applicable if either Cultural or Historical fields are Y )
$K
41 MitFish_Wildlife Number 30 year fish and wildlife mitigation cost (applicable if any of the Fish Wildlife or TEW fields are Y )
$K
42 MitScenic_Rec Number 30 year scenic and recreation mitigation cost (applicable if either Recreation or Scenic fields are Y )
$K
B-4
Field Number Field Name Type Description
Table B-1 (continued) Units
43 MitWaterMonitor Number 30 year water quality monitoring cost $K
44 MitFishPassage Number 30 year fish passage cost (applicable if TEF field is Y ) $K
45 MitTotal Number Total Mitigation Cost ( Sum of MitHist_Arch MitFish_Wildlife MitScenic_Rec MitWaterMonitor and MitFishPassage )
$K
46 TotalDevCost Number Total Development Cost ( OvrNiteDevCost + MitTotal ) $K
47 UnitTotalDevCost Number Total Development Unit Cost $kW
48 FixedOM Number Average Annual Fixed OampM $K
49 UnitFixedOM Number Average Annual Fixed OampM Unit Cost $kW
50 VariableOM Number Average Annual Variable OampM $K
51 UnitVariableOM Number Average Annual Variable OampM Unit Cost MillskWh
52 FERCAnnChrg Number FERC Annual Charge (applicable if Capacity gt= 15 MW ) $K
53 PFAnnual Number Average Annual Plant Factor -
54 PFJan Number Average January Plant Factor -
55 PFFeb Number Average February Plant Factor -
56 PFMar Number Average March Plant Factor -
57 PFApr Number Average April Plant Factor -
58 PFMay Number Average May Plant Factor -
59 PFJun Number Average June Plant Factor -
60 PFJul Number Average July Plant Factor -
61 PFAug Number Average August Plant Factor -
62 PFSept Number Average September Plant Factor -
63 PFOct Number Average October Plant Factor -
64 PFNov Number Average November Plant Factor -
65 PFDec Number Average December Plant Factor -
66 GenAnnual Number Average Annual Generation MWh
67 GenJan Number Average January Generation MWh
68 GenFeb Number Average February Generation MWh
69 GenMar Number Average March Generation MWh
70 GenApr Number Average April Generation MWh
71 GenMay Number Average May Generation MWh
72 GenJun Number Average June Generation MWh
73 GenJul Number Average July Generation MWh
74 GenAug Number Average August Generation MWh
75 GenSept Number Average September Generation MWh
76 GenOct Number Average October Generation MWh
77 GenNov Number Average November Generation MWh
78 GenDec Number Average December Generation MWh
Special field values NA Value not available in source data
Value removed due to homeland security concerns
B-5
- ABSTRACT
- EXECUTIVE SUMMARY
- ACKNOWLEDGMENTS
- ACRONYMS
- NOMENCLATURE
- INTRODUCTION
- TECHNICAL APPROACH
-
- Cost Estimating Tools for Plant Development or Expansion
-
- Data Sources
- General Method
- Data Screening
- Accounting for Cost Variations by Type of Site
-
- Cost Estimating Tools for Plant Operation and Maintenance
- Cost Estimating Tools for Turbine and Generator Upgrade
- Estimating Plant Electric Generation
- FERC Annual Charge
- Application of Estimating Tools to Hydropower Resources
-
- RESULTS
-
- Cost Estimating Tools for Plant Development or Expansion
- Cost Estimating Tools for Plant Operation and Maintenance
- Cost Estimating Tools for Turbine and Generator Upgrade
- Estimating Plant Electric Generation
- Estimated Economic Parameters for Hydropower Resources
- Likelihood of Development
-
- CONCLUSIONS AND RECOMMENDATIONS
- REFERENCES
-
- B1IHRED Data Dictionary
- B2IHRED
-

1 to 1
0
10 to
20
20 to
30
30 to
40
40 to
50
gt 50
$10 3 93 9
$6 0 32 1 12
4 M W 69 7 M WCapacity (MW)
Cos
t (20
02$)
Total No of Data Points = 22 12
1
4
0
2 3
0
2
4
6
8
10
12
14
No
of D
ata
Poin
ts
A-14
Capacity Range (MW)
Figure A-6B Number of historical and archeological mitigation cost data points for various plant capacity ranges
10000M
Y = 7E4(C)044
R2 = 056
Y = 2E5(C)044
0010M
0100M
1000M
Wat
er Q
ualit
y M
onito
ring
Cos
t (20
02$)
FERC 2003 (1980 - 1997)
Undeveloped Sites Dams Without Power
FERC 2003 (1999 - 2001)
67 Lower Bound Dams With Power
98 Lower Bound
Y = 4E5(C)044
A-15
0001M 1 10 100 1000 10000
Capacity (MW)
Figure A-7A Water quality monitoring cost as a function of plant capacity for undeveloped sites and powerhouse installation at a dam without power and as a function of added capacity for a plant expansion
1 to 1
0
10 to
20
20 to
30
30 to
40
40 to
50
gt50
$7 6 73
$2 2 09 7 09
1 44 M W 69 7 M WCapacity (MW)
Cos
t (20
02$)
Total No of Data Points = 89 51
14
7 3 2
12
0
10
20
30
40
50
60
No
of D
ata
Poin
ts
A-16
Capacity Range (MW)
Figure A-7B Number of water quality monitoring cost data points for various plant capacity ranges
A-17
1000M
Y = 1E6(C)056
R2 = 099
100M
Fish
Pas
sage
Cos
t (20
02$)
Francfort 1994 FERC 2003 (1999 - 2001)
67 Upper Bound Fish Passage 67 Lower Bound
10M 1 10 100 1000 10000
Capacity (MW)
Figure A-8A Fish passage cost as a function of plant capacity for undeveloped sites and powerhouse installation at a dam without power and as a function of added capacity for a plant expansion
1 to 1
0
10 to
20
20 to
30
30 to
40
40 to
50
gt50
A-18
$1 0 12 3 7 4
$ 52 7 62 5 0 0
1 M W 84 0 M WCapacity (MW)
Cos
t (20
02$)
No
of D
ata
Poin
ts
7
6
5
4
3
2
1
0
1
6 Total No of Data Points = 10
0 0 0
3
Capacity Range (MW)
Figure A-8B Number of fish passage cost data points for various plant capacity ranges
A-19
Y = 2E4(C)075
R2 = 060
001M
010M
100M
1000M
10000M
Fixe
d O
ampM
Cos
t (20
02$)
EIA 2003b (1990 - 2000) 67 Upper Bound All Sites 67 Lower Bound
1 10 100 1000 10000
Capacity (MW)
Figure A-9A Fixed operating and maintenance costs as a function of plant capacity for undeveloped sites and powerhouse installation at a dam without power and as a function of added capacity for a plant expansion
1 to 1
0
10 to
20
20 to
30
30 to
40
40 to
50
50 to
60
60 to
70
70 to
80
80 to
90
90 to
100
100 t
o 150
15
0 to 2
00
200 t
o 250
gt 250
$ 17 1 5 7
$ 11 4 92 7 7 4
1 M W 1 28 0 M WCapacity (MW)
Cos
t (20
02$)
Total No of Data Points = 474
24
105
55 47
33 27
14 19
14 12
51
25
11
37
0
20
40
60
80
10 0
12 0
No
of D
ata
Poin
ts
A-20
Capacity Range (MW)
Figure A-9B Number of fixed operation and maintenance cost data points for various plant capacity ranges
Y = 2E4(C)080
R2 = 067
001M
010M
100M
1000M
10000M Va
riabl
e O
ampM
Cos
t (20
02$)
EIA 2003b (1990 - 2000) 67 Upper Bound All Sites 67 Lower Bound
A-21
1 10 100 1000 10000
Capacity (MW)
Figure A-10A Variable operating and maintenance costs as a function of plant capacity for undeveloped and powerhouse installation at a dam without power and as a function of added capacity for a plant expansion
1 to 1
0
10 to
20
20 to
30
30 to
40
40 to
50
50 to
60
60 to
70
70 to
80
80 to
90
90 to
1 00
100 t
o 150
15
0 to 2
00
200 t
o 250
gt 250
$15 104
$12 929 143
1 MW 1 280 MWCapacity (MW)
Cos
t (20
02$)
Total No of Data Points = 501
39
116
58 51
37 25
14 24
14 14
53
25
10 21
0
20
40
60
80
10 0
12 0
14 0
No
of D
ata
Poin
ts
A-22
Capacity Range (MW)
Figure A-10B Number of variable operation and maintenance cost data points for various plant capacity ranges
A-23
Fran
cis
Turb
ine
Upg
rade
Cos
t (20
02$)
1000M
100M
10M
01M
071 -042Y = [3E6 sdot (C) ] sdot (H)
(C = 200 MW) Y = 13E8(H)-042
(C = 100 MW) Y = 77E7(H)-042
(C = 75 MW) Y = 63E7(H)-042
(C = 50 MW) Y = 47E7(H)-042
(C = 20 MW) Y = 25E7(H)-042
(C = 10 MW) Y = 15E7(H)-042
(C = 5 MW) Y = 92E6(H)-042
100 1000 Head (ft)
Figure A-11 Francis turbine upgrade cost as a function hydraulic head for various plant capacities
10000
A-24
1000M
100M
10M
(C = 5 MW) Y = 13E7(H)-038
(C = 10 MW) Y = 22E7(H)-038
(C = 20 MW) Y = 37E7(H)-038
(C = 50 MW) Y = 71E7(H)-038
(C = 75 MW) Y = 95E7(H)-038 (C = 100 MW) Y = 12E8(H)-038
(C = 200 MW) Y = 19E8(H)-038
10 100
Head (ft)
-038072 )H(](C)[4E6Y sdotsdot=
Figure A-12 Kaplan turbine upgrade cost as a function hydraulic head for various plant capacities
Kap
lan
Turb
ine
Upg
rade
Cos
t (20
02$)
1000
1000M B
ulb
Turb
ine
Upg
rade
Cos
t (20
02$)
100M
(C = 5 MW) Y = 25E7(H)-063
(C = 10 MW) Y = 45E7(H)-063
(C = 20 MW) Y = 82E7(H)-063
(C = 50 MW) Y = 18E8(H)-063
-063086 )H(](C)[6E6Y sdotsdot=
10M 1 10 100 1000
Head (ft)
Figure A-13 Bulb turbine upgrade cost as a function hydraulic head for various plant capacities
A-25
A-26
10M
01M
(C = 5 MW) Y = 84E6(S)-038
(C = 10 MW) Y = 13E7(S)-038
(C = 20 MW) Y = 21E7(S)-038
(C = 50 MW) Y = 37E7(S)-038 (C = 75 MW) Y = 49E7(S)-038 (C = 100 MW) Y = 59E7(S)-038
(C = 200 MW) Y = 92E7(S)-038
100 1000 Speed (RPM)
-038065 )S(](C)[3E6Y sdotsdot=
Figure A-14 Generator upgrade cost as a function of RPM for various plant capacities
1000M
100M
Gen
erat
or U
pgra
de C
ost (
2002
$)
10000
Appendix B
INEEL Hydropower Resource Economics Database (see document back cover for IHRED compact disk)
B-1
B-2
Field Number Field Name Type Description
Appendix B
INEEL Hydropower Resource Economics Database B1 IHRED Data Dictionary B2 IHRED
The data dictionary for the INEEL The IHRED in Excel format is provided on the Hydropower Resource Economics Database compact disk which is in a pocket on the back (IHRED) is given in Table B-1 This table lists the cover of this document The database contains field number parameter name field type (number resource characteristic data estimated or text) field description and units for the development and OampM costs and estimated 78 fields in the database annual and monthly generation for 2155 US
hydropower resources
Table B-1 INEEL Hydropower Resource Economics Database Data Dictionary Units
1 ProjectNumber Text Project Number (FERC number or pseudo FERC number) mdash
2 PlantName Text Name of the project mdash
3 StreamName Text Name of the stream where the project is located mdash
4 StateAbbr Text Two letter abbreviation for the state where the project is located mdash
5 NERCSubregion Text NERC Subregion (1 = East Central Area Reliability Coordination Agreement (ECAR) 2 = Electric Reliability Council of Texas (ERCOT) 3 = Mid-Atlantic Area Council (MAAC) 4 = Mid-America Interconnected Network (MAIN) 5 = Mid-Continent Area Power Pool (MAPP) 6 = Northeast Power Coordinating CouncilNew York (NY) 7 = Northeast Power Coordinating CouncilNew England (NE) 8 = Southeastern Electric Reliability CouncilFlorida (FL) 9 = Southeastern Electric Reliability CouncilExcl Florida (STV) 10 = Southwest Power Pool (SPP) 11 = Western Systems Coordinating CouncilNWP (NWP) 12 = Western Systems Coordinating CouncilRA (RA) 13 = Western Systems Coordinating CouncilCNV (CNV))
mdash
6 Latitude Number Latitude (first digits refer to degrees north last 2 digits refer to minutes)
ddmm
7 Longitude Number Longitude (First digits refer to degrees west last 2 digits refer to minutes)
ddmm
8 ClassCode Text Owner class code (C = Cooperative F = Federal I = Industrial M = Municipal and other non-federal P = Private utility R = Private nonutility)
mdash
9 OwnerName Text Name of project owner mdash
10 Capacity Number Potential capacity at undeveloped sites or sites without power or potential additional capacity at sites with power
MW
11 UnitType Text Type of unit (C = Conventional R = Reversible Z = Missing) mdash
12 PlantType Text Type of Plant (CMB = Combined conventional and reversible units DIV = Gravity diversion (powerhouse on different stream) PDV = Pumped diversion (one-way pumped storage) PMP = Pure (recycled) pump storage RES = Reservoir only ROR = Run-of-river (dam lt= 10 ft high and minimal storage) RRG = Reregulating STG = Storage conventional hydro (dam gt 10 ft high with significant storage) TID = Tidal conventional hydro)
mdash
B-3
Field Number Field Name Type Description
Table B-1 (continued) Units
13 ProjectStatus Text Status of Project (DJ = Disclaimer of FERC jurisdiction EA = Exemption applied for FA = Federally authorized FR = Federally recommended LE = License exemption LJ = Lack of FERC jurisdiction MA = FERC major license application MO = FERC license outstanding NA = FERC minor license application (lt15 kW) NO = FERC minor license outstanding (lt15 kW) PA = FERC preliminary permit application PO = FERC preliminary permit outstanding XX = No status YO = FERC minor part license outstanding ZZ = Missing)
mdash
14 BasinName Text River basin name mdash
15 CountyName Text County where the project is located mdash
16 DamStatus Text Status of Dam (W = With Power WO = Without Power U = Undeveloped)
mdash
17 WSProtection Text WildScenic Protection mdash
18 WSTributary Text WildScenic Tributary or UpstreamDownstream WildScenic Location (YNltblankgt)
mdash
19 Cultural Text Cultural Value (YNltblankgt) mdash
20 Fish Text Fish Value (YNltblankgt) mdash
21 Geological Text Geological Value (YNltblankgt) mdash
22 Historical Text Historical Value (YNltblankgt) mdash
23 Other Text Other criteria such as rare wetland communities and wilderness designation
mdash
24 Recreation Text Recreation Value (YNltblankgt) mdash
25 Scenic Text Scenic Value (YNltblankgt) mdash
26 Wildlife Text Wildlife Value (YNltblankgt) mdash
27 TEW Text ThreatenedEndangered Wildlife (YNltblankgt) mdash
28 TEF Text ThreatenedEndangered Fish (YNltblankgt) mdash
29 FLC103 Text Federal Land Code 103 (National Park Monument Lakeshore Parkway Battlefield or Recreation Area) (YNltblankgt)
mdash
30 FLC104 Text Federal Land Code 104 (National Forest or Grassland) (YNltblankgt)
mdash
31 FLC105 Text Federal Land Code 105 (National Wildlife Refuge Game Preserve or Fish Hatchery) (YNltblankgt)
mdash
32 FLC106 Text Federal Land Code 106 (National Scenic Waterway or Wilderness Area) (YNltblankgt)
mdash
33 FLC107 Text Federal Land Code 107(Indian Reservation) (YNltblankgt) mdash
34 FLC108 Text Federal Land Code 108 (Military Reservation) (YNltblankgt) mdash
35 FLC198 Text Federal Land Code 198 (Not On Federal Land) (YNltblankgt) mdash
36 SiteProb Number Project Environmental Suitability Factor (010 = Development prohibited or highly unlikely 025 = Major reduction in likelihood of development 050 = Likelihood of development reduced by half 075 = Minor reduction in likelihood of development 090 = Little effect on likelihood of development)
mdash
37 LicensingCost Number Total Licensing Cost $K
38 ConstructionCost Number Total Construction Cost $K
39 OvrNiteDevCost Number Overnight Development Cost ( LicensingCost + ConstructionCost ) $K
40 MitHist_Arch Number 30 year Archaeological and Historical mitigation cost (applicable if either Cultural or Historical fields are Y )
$K
41 MitFish_Wildlife Number 30 year fish and wildlife mitigation cost (applicable if any of the Fish Wildlife or TEW fields are Y )
$K
42 MitScenic_Rec Number 30 year scenic and recreation mitigation cost (applicable if either Recreation or Scenic fields are Y )
$K
B-4
Field Number Field Name Type Description
Table B-1 (continued) Units
43 MitWaterMonitor Number 30 year water quality monitoring cost $K
44 MitFishPassage Number 30 year fish passage cost (applicable if TEF field is Y ) $K
45 MitTotal Number Total Mitigation Cost ( Sum of MitHist_Arch MitFish_Wildlife MitScenic_Rec MitWaterMonitor and MitFishPassage )
$K
46 TotalDevCost Number Total Development Cost ( OvrNiteDevCost + MitTotal ) $K
47 UnitTotalDevCost Number Total Development Unit Cost $kW
48 FixedOM Number Average Annual Fixed OampM $K
49 UnitFixedOM Number Average Annual Fixed OampM Unit Cost $kW
50 VariableOM Number Average Annual Variable OampM $K
51 UnitVariableOM Number Average Annual Variable OampM Unit Cost MillskWh
52 FERCAnnChrg Number FERC Annual Charge (applicable if Capacity gt= 15 MW ) $K
53 PFAnnual Number Average Annual Plant Factor -
54 PFJan Number Average January Plant Factor -
55 PFFeb Number Average February Plant Factor -
56 PFMar Number Average March Plant Factor -
57 PFApr Number Average April Plant Factor -
58 PFMay Number Average May Plant Factor -
59 PFJun Number Average June Plant Factor -
60 PFJul Number Average July Plant Factor -
61 PFAug Number Average August Plant Factor -
62 PFSept Number Average September Plant Factor -
63 PFOct Number Average October Plant Factor -
64 PFNov Number Average November Plant Factor -
65 PFDec Number Average December Plant Factor -
66 GenAnnual Number Average Annual Generation MWh
67 GenJan Number Average January Generation MWh
68 GenFeb Number Average February Generation MWh
69 GenMar Number Average March Generation MWh
70 GenApr Number Average April Generation MWh
71 GenMay Number Average May Generation MWh
72 GenJun Number Average June Generation MWh
73 GenJul Number Average July Generation MWh
74 GenAug Number Average August Generation MWh
75 GenSept Number Average September Generation MWh
76 GenOct Number Average October Generation MWh
77 GenNov Number Average November Generation MWh
78 GenDec Number Average December Generation MWh
Special field values NA Value not available in source data
Value removed due to homeland security concerns
B-5
- ABSTRACT
- EXECUTIVE SUMMARY
- ACKNOWLEDGMENTS
- ACRONYMS
- NOMENCLATURE
- INTRODUCTION
- TECHNICAL APPROACH
-
- Cost Estimating Tools for Plant Development or Expansion
-
- Data Sources
- General Method
- Data Screening
- Accounting for Cost Variations by Type of Site
-
- Cost Estimating Tools for Plant Operation and Maintenance
- Cost Estimating Tools for Turbine and Generator Upgrade
- Estimating Plant Electric Generation
- FERC Annual Charge
- Application of Estimating Tools to Hydropower Resources
-
- RESULTS
-
- Cost Estimating Tools for Plant Development or Expansion
- Cost Estimating Tools for Plant Operation and Maintenance
- Cost Estimating Tools for Turbine and Generator Upgrade
- Estimating Plant Electric Generation
- Estimated Economic Parameters for Hydropower Resources
- Likelihood of Development
-
- CONCLUSIONS AND RECOMMENDATIONS
- REFERENCES
-
- B1IHRED Data Dictionary
- B2IHRED
-

10000M
Y = 7E4(C)044
R2 = 056
Y = 2E5(C)044
0010M
0100M
1000M
Wat
er Q
ualit
y M
onito
ring
Cos
t (20
02$)
FERC 2003 (1980 - 1997)
Undeveloped Sites Dams Without Power
FERC 2003 (1999 - 2001)
67 Lower Bound Dams With Power
98 Lower Bound
Y = 4E5(C)044
A-15
0001M 1 10 100 1000 10000
Capacity (MW)
Figure A-7A Water quality monitoring cost as a function of plant capacity for undeveloped sites and powerhouse installation at a dam without power and as a function of added capacity for a plant expansion
1 to 1
0
10 to
20
20 to
30
30 to
40
40 to
50
gt50
$7 6 73
$2 2 09 7 09
1 44 M W 69 7 M WCapacity (MW)
Cos
t (20
02$)
Total No of Data Points = 89 51
14
7 3 2
12
0
10
20
30
40
50
60
No
of D
ata
Poin
ts
A-16
Capacity Range (MW)
Figure A-7B Number of water quality monitoring cost data points for various plant capacity ranges
A-17
1000M
Y = 1E6(C)056
R2 = 099
100M
Fish
Pas
sage
Cos
t (20
02$)
Francfort 1994 FERC 2003 (1999 - 2001)
67 Upper Bound Fish Passage 67 Lower Bound
10M 1 10 100 1000 10000
Capacity (MW)
Figure A-8A Fish passage cost as a function of plant capacity for undeveloped sites and powerhouse installation at a dam without power and as a function of added capacity for a plant expansion
1 to 1
0
10 to
20
20 to
30
30 to
40
40 to
50
gt50
A-18
$1 0 12 3 7 4
$ 52 7 62 5 0 0
1 M W 84 0 M WCapacity (MW)
Cos
t (20
02$)
No
of D
ata
Poin
ts
7
6
5
4
3
2
1
0
1
6 Total No of Data Points = 10
0 0 0
3
Capacity Range (MW)
Figure A-8B Number of fish passage cost data points for various plant capacity ranges
A-19
Y = 2E4(C)075
R2 = 060
001M
010M
100M
1000M
10000M
Fixe
d O
ampM
Cos
t (20
02$)
EIA 2003b (1990 - 2000) 67 Upper Bound All Sites 67 Lower Bound
1 10 100 1000 10000
Capacity (MW)
Figure A-9A Fixed operating and maintenance costs as a function of plant capacity for undeveloped sites and powerhouse installation at a dam without power and as a function of added capacity for a plant expansion
1 to 1
0
10 to
20
20 to
30
30 to
40
40 to
50
50 to
60
60 to
70
70 to
80
80 to
90
90 to
100
100 t
o 150
15
0 to 2
00
200 t
o 250
gt 250
$ 17 1 5 7
$ 11 4 92 7 7 4
1 M W 1 28 0 M WCapacity (MW)
Cos
t (20
02$)
Total No of Data Points = 474
24
105
55 47
33 27
14 19
14 12
51
25
11
37
0
20
40
60
80
10 0
12 0
No
of D
ata
Poin
ts
A-20
Capacity Range (MW)
Figure A-9B Number of fixed operation and maintenance cost data points for various plant capacity ranges
Y = 2E4(C)080
R2 = 067
001M
010M
100M
1000M
10000M Va
riabl
e O
ampM
Cos
t (20
02$)
EIA 2003b (1990 - 2000) 67 Upper Bound All Sites 67 Lower Bound
A-21
1 10 100 1000 10000
Capacity (MW)
Figure A-10A Variable operating and maintenance costs as a function of plant capacity for undeveloped and powerhouse installation at a dam without power and as a function of added capacity for a plant expansion
1 to 1
0
10 to
20
20 to
30
30 to
40
40 to
50
50 to
60
60 to
70
70 to
80
80 to
90
90 to
1 00
100 t
o 150
15
0 to 2
00
200 t
o 250
gt 250
$15 104
$12 929 143
1 MW 1 280 MWCapacity (MW)
Cos
t (20
02$)
Total No of Data Points = 501
39
116
58 51
37 25
14 24
14 14
53
25
10 21
0
20
40
60
80
10 0
12 0
14 0
No
of D
ata
Poin
ts
A-22
Capacity Range (MW)
Figure A-10B Number of variable operation and maintenance cost data points for various plant capacity ranges
A-23
Fran
cis
Turb
ine
Upg
rade
Cos
t (20
02$)
1000M
100M
10M
01M
071 -042Y = [3E6 sdot (C) ] sdot (H)
(C = 200 MW) Y = 13E8(H)-042
(C = 100 MW) Y = 77E7(H)-042
(C = 75 MW) Y = 63E7(H)-042
(C = 50 MW) Y = 47E7(H)-042
(C = 20 MW) Y = 25E7(H)-042
(C = 10 MW) Y = 15E7(H)-042
(C = 5 MW) Y = 92E6(H)-042
100 1000 Head (ft)
Figure A-11 Francis turbine upgrade cost as a function hydraulic head for various plant capacities
10000
A-24
1000M
100M
10M
(C = 5 MW) Y = 13E7(H)-038
(C = 10 MW) Y = 22E7(H)-038
(C = 20 MW) Y = 37E7(H)-038
(C = 50 MW) Y = 71E7(H)-038
(C = 75 MW) Y = 95E7(H)-038 (C = 100 MW) Y = 12E8(H)-038
(C = 200 MW) Y = 19E8(H)-038
10 100
Head (ft)
-038072 )H(](C)[4E6Y sdotsdot=
Figure A-12 Kaplan turbine upgrade cost as a function hydraulic head for various plant capacities
Kap
lan
Turb
ine
Upg
rade
Cos
t (20
02$)
1000
1000M B
ulb
Turb
ine
Upg
rade
Cos
t (20
02$)
100M
(C = 5 MW) Y = 25E7(H)-063
(C = 10 MW) Y = 45E7(H)-063
(C = 20 MW) Y = 82E7(H)-063
(C = 50 MW) Y = 18E8(H)-063
-063086 )H(](C)[6E6Y sdotsdot=
10M 1 10 100 1000
Head (ft)
Figure A-13 Bulb turbine upgrade cost as a function hydraulic head for various plant capacities
A-25
A-26
10M
01M
(C = 5 MW) Y = 84E6(S)-038
(C = 10 MW) Y = 13E7(S)-038
(C = 20 MW) Y = 21E7(S)-038
(C = 50 MW) Y = 37E7(S)-038 (C = 75 MW) Y = 49E7(S)-038 (C = 100 MW) Y = 59E7(S)-038
(C = 200 MW) Y = 92E7(S)-038
100 1000 Speed (RPM)
-038065 )S(](C)[3E6Y sdotsdot=
Figure A-14 Generator upgrade cost as a function of RPM for various plant capacities
1000M
100M
Gen
erat
or U
pgra
de C
ost (
2002
$)
10000
Appendix B
INEEL Hydropower Resource Economics Database (see document back cover for IHRED compact disk)
B-1
B-2
Field Number Field Name Type Description
Appendix B
INEEL Hydropower Resource Economics Database B1 IHRED Data Dictionary B2 IHRED
The data dictionary for the INEEL The IHRED in Excel format is provided on the Hydropower Resource Economics Database compact disk which is in a pocket on the back (IHRED) is given in Table B-1 This table lists the cover of this document The database contains field number parameter name field type (number resource characteristic data estimated or text) field description and units for the development and OampM costs and estimated 78 fields in the database annual and monthly generation for 2155 US
hydropower resources
Table B-1 INEEL Hydropower Resource Economics Database Data Dictionary Units
1 ProjectNumber Text Project Number (FERC number or pseudo FERC number) mdash
2 PlantName Text Name of the project mdash
3 StreamName Text Name of the stream where the project is located mdash
4 StateAbbr Text Two letter abbreviation for the state where the project is located mdash
5 NERCSubregion Text NERC Subregion (1 = East Central Area Reliability Coordination Agreement (ECAR) 2 = Electric Reliability Council of Texas (ERCOT) 3 = Mid-Atlantic Area Council (MAAC) 4 = Mid-America Interconnected Network (MAIN) 5 = Mid-Continent Area Power Pool (MAPP) 6 = Northeast Power Coordinating CouncilNew York (NY) 7 = Northeast Power Coordinating CouncilNew England (NE) 8 = Southeastern Electric Reliability CouncilFlorida (FL) 9 = Southeastern Electric Reliability CouncilExcl Florida (STV) 10 = Southwest Power Pool (SPP) 11 = Western Systems Coordinating CouncilNWP (NWP) 12 = Western Systems Coordinating CouncilRA (RA) 13 = Western Systems Coordinating CouncilCNV (CNV))
mdash
6 Latitude Number Latitude (first digits refer to degrees north last 2 digits refer to minutes)
ddmm
7 Longitude Number Longitude (First digits refer to degrees west last 2 digits refer to minutes)
ddmm
8 ClassCode Text Owner class code (C = Cooperative F = Federal I = Industrial M = Municipal and other non-federal P = Private utility R = Private nonutility)
mdash
9 OwnerName Text Name of project owner mdash
10 Capacity Number Potential capacity at undeveloped sites or sites without power or potential additional capacity at sites with power
MW
11 UnitType Text Type of unit (C = Conventional R = Reversible Z = Missing) mdash
12 PlantType Text Type of Plant (CMB = Combined conventional and reversible units DIV = Gravity diversion (powerhouse on different stream) PDV = Pumped diversion (one-way pumped storage) PMP = Pure (recycled) pump storage RES = Reservoir only ROR = Run-of-river (dam lt= 10 ft high and minimal storage) RRG = Reregulating STG = Storage conventional hydro (dam gt 10 ft high with significant storage) TID = Tidal conventional hydro)
mdash
B-3
Field Number Field Name Type Description
Table B-1 (continued) Units
13 ProjectStatus Text Status of Project (DJ = Disclaimer of FERC jurisdiction EA = Exemption applied for FA = Federally authorized FR = Federally recommended LE = License exemption LJ = Lack of FERC jurisdiction MA = FERC major license application MO = FERC license outstanding NA = FERC minor license application (lt15 kW) NO = FERC minor license outstanding (lt15 kW) PA = FERC preliminary permit application PO = FERC preliminary permit outstanding XX = No status YO = FERC minor part license outstanding ZZ = Missing)
mdash
14 BasinName Text River basin name mdash
15 CountyName Text County where the project is located mdash
16 DamStatus Text Status of Dam (W = With Power WO = Without Power U = Undeveloped)
mdash
17 WSProtection Text WildScenic Protection mdash
18 WSTributary Text WildScenic Tributary or UpstreamDownstream WildScenic Location (YNltblankgt)
mdash
19 Cultural Text Cultural Value (YNltblankgt) mdash
20 Fish Text Fish Value (YNltblankgt) mdash
21 Geological Text Geological Value (YNltblankgt) mdash
22 Historical Text Historical Value (YNltblankgt) mdash
23 Other Text Other criteria such as rare wetland communities and wilderness designation
mdash
24 Recreation Text Recreation Value (YNltblankgt) mdash
25 Scenic Text Scenic Value (YNltblankgt) mdash
26 Wildlife Text Wildlife Value (YNltblankgt) mdash
27 TEW Text ThreatenedEndangered Wildlife (YNltblankgt) mdash
28 TEF Text ThreatenedEndangered Fish (YNltblankgt) mdash
29 FLC103 Text Federal Land Code 103 (National Park Monument Lakeshore Parkway Battlefield or Recreation Area) (YNltblankgt)
mdash
30 FLC104 Text Federal Land Code 104 (National Forest or Grassland) (YNltblankgt)
mdash
31 FLC105 Text Federal Land Code 105 (National Wildlife Refuge Game Preserve or Fish Hatchery) (YNltblankgt)
mdash
32 FLC106 Text Federal Land Code 106 (National Scenic Waterway or Wilderness Area) (YNltblankgt)
mdash
33 FLC107 Text Federal Land Code 107(Indian Reservation) (YNltblankgt) mdash
34 FLC108 Text Federal Land Code 108 (Military Reservation) (YNltblankgt) mdash
35 FLC198 Text Federal Land Code 198 (Not On Federal Land) (YNltblankgt) mdash
36 SiteProb Number Project Environmental Suitability Factor (010 = Development prohibited or highly unlikely 025 = Major reduction in likelihood of development 050 = Likelihood of development reduced by half 075 = Minor reduction in likelihood of development 090 = Little effect on likelihood of development)
mdash
37 LicensingCost Number Total Licensing Cost $K
38 ConstructionCost Number Total Construction Cost $K
39 OvrNiteDevCost Number Overnight Development Cost ( LicensingCost + ConstructionCost ) $K
40 MitHist_Arch Number 30 year Archaeological and Historical mitigation cost (applicable if either Cultural or Historical fields are Y )
$K
41 MitFish_Wildlife Number 30 year fish and wildlife mitigation cost (applicable if any of the Fish Wildlife or TEW fields are Y )
$K
42 MitScenic_Rec Number 30 year scenic and recreation mitigation cost (applicable if either Recreation or Scenic fields are Y )
$K
B-4
Field Number Field Name Type Description
Table B-1 (continued) Units
43 MitWaterMonitor Number 30 year water quality monitoring cost $K
44 MitFishPassage Number 30 year fish passage cost (applicable if TEF field is Y ) $K
45 MitTotal Number Total Mitigation Cost ( Sum of MitHist_Arch MitFish_Wildlife MitScenic_Rec MitWaterMonitor and MitFishPassage )
$K
46 TotalDevCost Number Total Development Cost ( OvrNiteDevCost + MitTotal ) $K
47 UnitTotalDevCost Number Total Development Unit Cost $kW
48 FixedOM Number Average Annual Fixed OampM $K
49 UnitFixedOM Number Average Annual Fixed OampM Unit Cost $kW
50 VariableOM Number Average Annual Variable OampM $K
51 UnitVariableOM Number Average Annual Variable OampM Unit Cost MillskWh
52 FERCAnnChrg Number FERC Annual Charge (applicable if Capacity gt= 15 MW ) $K
53 PFAnnual Number Average Annual Plant Factor -
54 PFJan Number Average January Plant Factor -
55 PFFeb Number Average February Plant Factor -
56 PFMar Number Average March Plant Factor -
57 PFApr Number Average April Plant Factor -
58 PFMay Number Average May Plant Factor -
59 PFJun Number Average June Plant Factor -
60 PFJul Number Average July Plant Factor -
61 PFAug Number Average August Plant Factor -
62 PFSept Number Average September Plant Factor -
63 PFOct Number Average October Plant Factor -
64 PFNov Number Average November Plant Factor -
65 PFDec Number Average December Plant Factor -
66 GenAnnual Number Average Annual Generation MWh
67 GenJan Number Average January Generation MWh
68 GenFeb Number Average February Generation MWh
69 GenMar Number Average March Generation MWh
70 GenApr Number Average April Generation MWh
71 GenMay Number Average May Generation MWh
72 GenJun Number Average June Generation MWh
73 GenJul Number Average July Generation MWh
74 GenAug Number Average August Generation MWh
75 GenSept Number Average September Generation MWh
76 GenOct Number Average October Generation MWh
77 GenNov Number Average November Generation MWh
78 GenDec Number Average December Generation MWh
Special field values NA Value not available in source data
Value removed due to homeland security concerns
B-5
- ABSTRACT
- EXECUTIVE SUMMARY
- ACKNOWLEDGMENTS
- ACRONYMS
- NOMENCLATURE
- INTRODUCTION
- TECHNICAL APPROACH
-
- Cost Estimating Tools for Plant Development or Expansion
-
- Data Sources
- General Method
- Data Screening
- Accounting for Cost Variations by Type of Site
-
- Cost Estimating Tools for Plant Operation and Maintenance
- Cost Estimating Tools for Turbine and Generator Upgrade
- Estimating Plant Electric Generation
- FERC Annual Charge
- Application of Estimating Tools to Hydropower Resources
-
- RESULTS
-
- Cost Estimating Tools for Plant Development or Expansion
- Cost Estimating Tools for Plant Operation and Maintenance
- Cost Estimating Tools for Turbine and Generator Upgrade
- Estimating Plant Electric Generation
- Estimated Economic Parameters for Hydropower Resources
- Likelihood of Development
-
- CONCLUSIONS AND RECOMMENDATIONS
- REFERENCES
-
- B1IHRED Data Dictionary
- B2IHRED
-

1 to 1
0
10 to
20
20 to
30
30 to
40
40 to
50
gt50
$7 6 73
$2 2 09 7 09
1 44 M W 69 7 M WCapacity (MW)
Cos
t (20
02$)
Total No of Data Points = 89 51
14
7 3 2
12
0
10
20
30
40
50
60
No
of D
ata
Poin
ts
A-16
Capacity Range (MW)
Figure A-7B Number of water quality monitoring cost data points for various plant capacity ranges
A-17
1000M
Y = 1E6(C)056
R2 = 099
100M
Fish
Pas
sage
Cos
t (20
02$)
Francfort 1994 FERC 2003 (1999 - 2001)
67 Upper Bound Fish Passage 67 Lower Bound
10M 1 10 100 1000 10000
Capacity (MW)
Figure A-8A Fish passage cost as a function of plant capacity for undeveloped sites and powerhouse installation at a dam without power and as a function of added capacity for a plant expansion
1 to 1
0
10 to
20
20 to
30
30 to
40
40 to
50
gt50
A-18
$1 0 12 3 7 4
$ 52 7 62 5 0 0
1 M W 84 0 M WCapacity (MW)
Cos
t (20
02$)
No
of D
ata
Poin
ts
7
6
5
4
3
2
1
0
1
6 Total No of Data Points = 10
0 0 0
3
Capacity Range (MW)
Figure A-8B Number of fish passage cost data points for various plant capacity ranges
A-19
Y = 2E4(C)075
R2 = 060
001M
010M
100M
1000M
10000M
Fixe
d O
ampM
Cos
t (20
02$)
EIA 2003b (1990 - 2000) 67 Upper Bound All Sites 67 Lower Bound
1 10 100 1000 10000
Capacity (MW)
Figure A-9A Fixed operating and maintenance costs as a function of plant capacity for undeveloped sites and powerhouse installation at a dam without power and as a function of added capacity for a plant expansion
1 to 1
0
10 to
20
20 to
30
30 to
40
40 to
50
50 to
60
60 to
70
70 to
80
80 to
90
90 to
100
100 t
o 150
15
0 to 2
00
200 t
o 250
gt 250
$ 17 1 5 7
$ 11 4 92 7 7 4
1 M W 1 28 0 M WCapacity (MW)
Cos
t (20
02$)
Total No of Data Points = 474
24
105
55 47
33 27
14 19
14 12
51
25
11
37
0
20
40
60
80
10 0
12 0
No
of D
ata
Poin
ts
A-20
Capacity Range (MW)
Figure A-9B Number of fixed operation and maintenance cost data points for various plant capacity ranges
Y = 2E4(C)080
R2 = 067
001M
010M
100M
1000M
10000M Va
riabl
e O
ampM
Cos
t (20
02$)
EIA 2003b (1990 - 2000) 67 Upper Bound All Sites 67 Lower Bound
A-21
1 10 100 1000 10000
Capacity (MW)
Figure A-10A Variable operating and maintenance costs as a function of plant capacity for undeveloped and powerhouse installation at a dam without power and as a function of added capacity for a plant expansion
1 to 1
0
10 to
20
20 to
30
30 to
40
40 to
50
50 to
60
60 to
70
70 to
80
80 to
90
90 to
1 00
100 t
o 150
15
0 to 2
00
200 t
o 250
gt 250
$15 104
$12 929 143
1 MW 1 280 MWCapacity (MW)
Cos
t (20
02$)
Total No of Data Points = 501
39
116
58 51
37 25
14 24
14 14
53
25
10 21
0
20
40
60
80
10 0
12 0
14 0
No
of D
ata
Poin
ts
A-22
Capacity Range (MW)
Figure A-10B Number of variable operation and maintenance cost data points for various plant capacity ranges
A-23
Fran
cis
Turb
ine
Upg
rade
Cos
t (20
02$)
1000M
100M
10M
01M
071 -042Y = [3E6 sdot (C) ] sdot (H)
(C = 200 MW) Y = 13E8(H)-042
(C = 100 MW) Y = 77E7(H)-042
(C = 75 MW) Y = 63E7(H)-042
(C = 50 MW) Y = 47E7(H)-042
(C = 20 MW) Y = 25E7(H)-042
(C = 10 MW) Y = 15E7(H)-042
(C = 5 MW) Y = 92E6(H)-042
100 1000 Head (ft)
Figure A-11 Francis turbine upgrade cost as a function hydraulic head for various plant capacities
10000
A-24
1000M
100M
10M
(C = 5 MW) Y = 13E7(H)-038
(C = 10 MW) Y = 22E7(H)-038
(C = 20 MW) Y = 37E7(H)-038
(C = 50 MW) Y = 71E7(H)-038
(C = 75 MW) Y = 95E7(H)-038 (C = 100 MW) Y = 12E8(H)-038
(C = 200 MW) Y = 19E8(H)-038
10 100
Head (ft)
-038072 )H(](C)[4E6Y sdotsdot=
Figure A-12 Kaplan turbine upgrade cost as a function hydraulic head for various plant capacities
Kap
lan
Turb
ine
Upg
rade
Cos
t (20
02$)
1000
1000M B
ulb
Turb
ine
Upg
rade
Cos
t (20
02$)
100M
(C = 5 MW) Y = 25E7(H)-063
(C = 10 MW) Y = 45E7(H)-063
(C = 20 MW) Y = 82E7(H)-063
(C = 50 MW) Y = 18E8(H)-063
-063086 )H(](C)[6E6Y sdotsdot=
10M 1 10 100 1000
Head (ft)
Figure A-13 Bulb turbine upgrade cost as a function hydraulic head for various plant capacities
A-25
A-26
10M
01M
(C = 5 MW) Y = 84E6(S)-038
(C = 10 MW) Y = 13E7(S)-038
(C = 20 MW) Y = 21E7(S)-038
(C = 50 MW) Y = 37E7(S)-038 (C = 75 MW) Y = 49E7(S)-038 (C = 100 MW) Y = 59E7(S)-038
(C = 200 MW) Y = 92E7(S)-038
100 1000 Speed (RPM)
-038065 )S(](C)[3E6Y sdotsdot=
Figure A-14 Generator upgrade cost as a function of RPM for various plant capacities
1000M
100M
Gen
erat
or U
pgra
de C
ost (
2002
$)
10000
Appendix B
INEEL Hydropower Resource Economics Database (see document back cover for IHRED compact disk)
B-1
B-2
Field Number Field Name Type Description
Appendix B
INEEL Hydropower Resource Economics Database B1 IHRED Data Dictionary B2 IHRED
The data dictionary for the INEEL The IHRED in Excel format is provided on the Hydropower Resource Economics Database compact disk which is in a pocket on the back (IHRED) is given in Table B-1 This table lists the cover of this document The database contains field number parameter name field type (number resource characteristic data estimated or text) field description and units for the development and OampM costs and estimated 78 fields in the database annual and monthly generation for 2155 US
hydropower resources
Table B-1 INEEL Hydropower Resource Economics Database Data Dictionary Units
1 ProjectNumber Text Project Number (FERC number or pseudo FERC number) mdash
2 PlantName Text Name of the project mdash
3 StreamName Text Name of the stream where the project is located mdash
4 StateAbbr Text Two letter abbreviation for the state where the project is located mdash
5 NERCSubregion Text NERC Subregion (1 = East Central Area Reliability Coordination Agreement (ECAR) 2 = Electric Reliability Council of Texas (ERCOT) 3 = Mid-Atlantic Area Council (MAAC) 4 = Mid-America Interconnected Network (MAIN) 5 = Mid-Continent Area Power Pool (MAPP) 6 = Northeast Power Coordinating CouncilNew York (NY) 7 = Northeast Power Coordinating CouncilNew England (NE) 8 = Southeastern Electric Reliability CouncilFlorida (FL) 9 = Southeastern Electric Reliability CouncilExcl Florida (STV) 10 = Southwest Power Pool (SPP) 11 = Western Systems Coordinating CouncilNWP (NWP) 12 = Western Systems Coordinating CouncilRA (RA) 13 = Western Systems Coordinating CouncilCNV (CNV))
mdash
6 Latitude Number Latitude (first digits refer to degrees north last 2 digits refer to minutes)
ddmm
7 Longitude Number Longitude (First digits refer to degrees west last 2 digits refer to minutes)
ddmm
8 ClassCode Text Owner class code (C = Cooperative F = Federal I = Industrial M = Municipal and other non-federal P = Private utility R = Private nonutility)
mdash
9 OwnerName Text Name of project owner mdash
10 Capacity Number Potential capacity at undeveloped sites or sites without power or potential additional capacity at sites with power
MW
11 UnitType Text Type of unit (C = Conventional R = Reversible Z = Missing) mdash
12 PlantType Text Type of Plant (CMB = Combined conventional and reversible units DIV = Gravity diversion (powerhouse on different stream) PDV = Pumped diversion (one-way pumped storage) PMP = Pure (recycled) pump storage RES = Reservoir only ROR = Run-of-river (dam lt= 10 ft high and minimal storage) RRG = Reregulating STG = Storage conventional hydro (dam gt 10 ft high with significant storage) TID = Tidal conventional hydro)
mdash
B-3
Field Number Field Name Type Description
Table B-1 (continued) Units
13 ProjectStatus Text Status of Project (DJ = Disclaimer of FERC jurisdiction EA = Exemption applied for FA = Federally authorized FR = Federally recommended LE = License exemption LJ = Lack of FERC jurisdiction MA = FERC major license application MO = FERC license outstanding NA = FERC minor license application (lt15 kW) NO = FERC minor license outstanding (lt15 kW) PA = FERC preliminary permit application PO = FERC preliminary permit outstanding XX = No status YO = FERC minor part license outstanding ZZ = Missing)
mdash
14 BasinName Text River basin name mdash
15 CountyName Text County where the project is located mdash
16 DamStatus Text Status of Dam (W = With Power WO = Without Power U = Undeveloped)
mdash
17 WSProtection Text WildScenic Protection mdash
18 WSTributary Text WildScenic Tributary or UpstreamDownstream WildScenic Location (YNltblankgt)
mdash
19 Cultural Text Cultural Value (YNltblankgt) mdash
20 Fish Text Fish Value (YNltblankgt) mdash
21 Geological Text Geological Value (YNltblankgt) mdash
22 Historical Text Historical Value (YNltblankgt) mdash
23 Other Text Other criteria such as rare wetland communities and wilderness designation
mdash
24 Recreation Text Recreation Value (YNltblankgt) mdash
25 Scenic Text Scenic Value (YNltblankgt) mdash
26 Wildlife Text Wildlife Value (YNltblankgt) mdash
27 TEW Text ThreatenedEndangered Wildlife (YNltblankgt) mdash
28 TEF Text ThreatenedEndangered Fish (YNltblankgt) mdash
29 FLC103 Text Federal Land Code 103 (National Park Monument Lakeshore Parkway Battlefield or Recreation Area) (YNltblankgt)
mdash
30 FLC104 Text Federal Land Code 104 (National Forest or Grassland) (YNltblankgt)
mdash
31 FLC105 Text Federal Land Code 105 (National Wildlife Refuge Game Preserve or Fish Hatchery) (YNltblankgt)
mdash
32 FLC106 Text Federal Land Code 106 (National Scenic Waterway or Wilderness Area) (YNltblankgt)
mdash
33 FLC107 Text Federal Land Code 107(Indian Reservation) (YNltblankgt) mdash
34 FLC108 Text Federal Land Code 108 (Military Reservation) (YNltblankgt) mdash
35 FLC198 Text Federal Land Code 198 (Not On Federal Land) (YNltblankgt) mdash
36 SiteProb Number Project Environmental Suitability Factor (010 = Development prohibited or highly unlikely 025 = Major reduction in likelihood of development 050 = Likelihood of development reduced by half 075 = Minor reduction in likelihood of development 090 = Little effect on likelihood of development)
mdash
37 LicensingCost Number Total Licensing Cost $K
38 ConstructionCost Number Total Construction Cost $K
39 OvrNiteDevCost Number Overnight Development Cost ( LicensingCost + ConstructionCost ) $K
40 MitHist_Arch Number 30 year Archaeological and Historical mitigation cost (applicable if either Cultural or Historical fields are Y )
$K
41 MitFish_Wildlife Number 30 year fish and wildlife mitigation cost (applicable if any of the Fish Wildlife or TEW fields are Y )
$K
42 MitScenic_Rec Number 30 year scenic and recreation mitigation cost (applicable if either Recreation or Scenic fields are Y )
$K
B-4
Field Number Field Name Type Description
Table B-1 (continued) Units
43 MitWaterMonitor Number 30 year water quality monitoring cost $K
44 MitFishPassage Number 30 year fish passage cost (applicable if TEF field is Y ) $K
45 MitTotal Number Total Mitigation Cost ( Sum of MitHist_Arch MitFish_Wildlife MitScenic_Rec MitWaterMonitor and MitFishPassage )
$K
46 TotalDevCost Number Total Development Cost ( OvrNiteDevCost + MitTotal ) $K
47 UnitTotalDevCost Number Total Development Unit Cost $kW
48 FixedOM Number Average Annual Fixed OampM $K
49 UnitFixedOM Number Average Annual Fixed OampM Unit Cost $kW
50 VariableOM Number Average Annual Variable OampM $K
51 UnitVariableOM Number Average Annual Variable OampM Unit Cost MillskWh
52 FERCAnnChrg Number FERC Annual Charge (applicable if Capacity gt= 15 MW ) $K
53 PFAnnual Number Average Annual Plant Factor -
54 PFJan Number Average January Plant Factor -
55 PFFeb Number Average February Plant Factor -
56 PFMar Number Average March Plant Factor -
57 PFApr Number Average April Plant Factor -
58 PFMay Number Average May Plant Factor -
59 PFJun Number Average June Plant Factor -
60 PFJul Number Average July Plant Factor -
61 PFAug Number Average August Plant Factor -
62 PFSept Number Average September Plant Factor -
63 PFOct Number Average October Plant Factor -
64 PFNov Number Average November Plant Factor -
65 PFDec Number Average December Plant Factor -
66 GenAnnual Number Average Annual Generation MWh
67 GenJan Number Average January Generation MWh
68 GenFeb Number Average February Generation MWh
69 GenMar Number Average March Generation MWh
70 GenApr Number Average April Generation MWh
71 GenMay Number Average May Generation MWh
72 GenJun Number Average June Generation MWh
73 GenJul Number Average July Generation MWh
74 GenAug Number Average August Generation MWh
75 GenSept Number Average September Generation MWh
76 GenOct Number Average October Generation MWh
77 GenNov Number Average November Generation MWh
78 GenDec Number Average December Generation MWh
Special field values NA Value not available in source data
Value removed due to homeland security concerns
B-5
- ABSTRACT
- EXECUTIVE SUMMARY
- ACKNOWLEDGMENTS
- ACRONYMS
- NOMENCLATURE
- INTRODUCTION
- TECHNICAL APPROACH
-
- Cost Estimating Tools for Plant Development or Expansion
-
- Data Sources
- General Method
- Data Screening
- Accounting for Cost Variations by Type of Site
-
- Cost Estimating Tools for Plant Operation and Maintenance
- Cost Estimating Tools for Turbine and Generator Upgrade
- Estimating Plant Electric Generation
- FERC Annual Charge
- Application of Estimating Tools to Hydropower Resources
-
- RESULTS
-
- Cost Estimating Tools for Plant Development or Expansion
- Cost Estimating Tools for Plant Operation and Maintenance
- Cost Estimating Tools for Turbine and Generator Upgrade
- Estimating Plant Electric Generation
- Estimated Economic Parameters for Hydropower Resources
- Likelihood of Development
-
- CONCLUSIONS AND RECOMMENDATIONS
- REFERENCES
-
- B1IHRED Data Dictionary
- B2IHRED
-

1 to 1
0
10 to
20
20 to
30
30 to
40
40 to
50
gt50
A-18
$1 0 12 3 7 4
$ 52 7 62 5 0 0
1 M W 84 0 M WCapacity (MW)
Cos
t (20
02$)
No
of D
ata
Poin
ts
7
6
5
4
3
2
1
0
1
6 Total No of Data Points = 10
0 0 0
3
Capacity Range (MW)
Figure A-8B Number of fish passage cost data points for various plant capacity ranges
A-19
Y = 2E4(C)075
R2 = 060
001M
010M
100M
1000M
10000M
Fixe
d O
ampM
Cos
t (20
02$)
EIA 2003b (1990 - 2000) 67 Upper Bound All Sites 67 Lower Bound
1 10 100 1000 10000
Capacity (MW)
Figure A-9A Fixed operating and maintenance costs as a function of plant capacity for undeveloped sites and powerhouse installation at a dam without power and as a function of added capacity for a plant expansion
1 to 1
0
10 to
20
20 to
30
30 to
40
40 to
50
50 to
60
60 to
70
70 to
80
80 to
90
90 to
100
100 t
o 150
15
0 to 2
00
200 t
o 250
gt 250
$ 17 1 5 7
$ 11 4 92 7 7 4
1 M W 1 28 0 M WCapacity (MW)
Cos
t (20
02$)
Total No of Data Points = 474
24
105
55 47
33 27
14 19
14 12
51
25
11
37
0
20
40
60
80
10 0
12 0
No
of D
ata
Poin
ts
A-20
Capacity Range (MW)
Figure A-9B Number of fixed operation and maintenance cost data points for various plant capacity ranges
Y = 2E4(C)080
R2 = 067
001M
010M
100M
1000M
10000M Va
riabl
e O
ampM
Cos
t (20
02$)
EIA 2003b (1990 - 2000) 67 Upper Bound All Sites 67 Lower Bound
A-21
1 10 100 1000 10000
Capacity (MW)
Figure A-10A Variable operating and maintenance costs as a function of plant capacity for undeveloped and powerhouse installation at a dam without power and as a function of added capacity for a plant expansion
1 to 1
0
10 to
20
20 to
30
30 to
40
40 to
50
50 to
60
60 to
70
70 to
80
80 to
90
90 to
1 00
100 t
o 150
15
0 to 2
00
200 t
o 250
gt 250
$15 104
$12 929 143
1 MW 1 280 MWCapacity (MW)
Cos
t (20
02$)
Total No of Data Points = 501
39
116
58 51
37 25
14 24
14 14
53
25
10 21
0
20
40
60
80
10 0
12 0
14 0
No
of D
ata
Poin
ts
A-22
Capacity Range (MW)
Figure A-10B Number of variable operation and maintenance cost data points for various plant capacity ranges
A-23
Fran
cis
Turb
ine
Upg
rade
Cos
t (20
02$)
1000M
100M
10M
01M
071 -042Y = [3E6 sdot (C) ] sdot (H)
(C = 200 MW) Y = 13E8(H)-042
(C = 100 MW) Y = 77E7(H)-042
(C = 75 MW) Y = 63E7(H)-042
(C = 50 MW) Y = 47E7(H)-042
(C = 20 MW) Y = 25E7(H)-042
(C = 10 MW) Y = 15E7(H)-042
(C = 5 MW) Y = 92E6(H)-042
100 1000 Head (ft)
Figure A-11 Francis turbine upgrade cost as a function hydraulic head for various plant capacities
10000
A-24
1000M
100M
10M
(C = 5 MW) Y = 13E7(H)-038
(C = 10 MW) Y = 22E7(H)-038
(C = 20 MW) Y = 37E7(H)-038
(C = 50 MW) Y = 71E7(H)-038
(C = 75 MW) Y = 95E7(H)-038 (C = 100 MW) Y = 12E8(H)-038
(C = 200 MW) Y = 19E8(H)-038
10 100
Head (ft)
-038072 )H(](C)[4E6Y sdotsdot=
Figure A-12 Kaplan turbine upgrade cost as a function hydraulic head for various plant capacities
Kap
lan
Turb
ine
Upg
rade
Cos
t (20
02$)
1000
1000M B
ulb
Turb
ine
Upg
rade
Cos
t (20
02$)
100M
(C = 5 MW) Y = 25E7(H)-063
(C = 10 MW) Y = 45E7(H)-063
(C = 20 MW) Y = 82E7(H)-063
(C = 50 MW) Y = 18E8(H)-063
-063086 )H(](C)[6E6Y sdotsdot=
10M 1 10 100 1000
Head (ft)
Figure A-13 Bulb turbine upgrade cost as a function hydraulic head for various plant capacities
A-25
A-26
10M
01M
(C = 5 MW) Y = 84E6(S)-038
(C = 10 MW) Y = 13E7(S)-038
(C = 20 MW) Y = 21E7(S)-038
(C = 50 MW) Y = 37E7(S)-038 (C = 75 MW) Y = 49E7(S)-038 (C = 100 MW) Y = 59E7(S)-038
(C = 200 MW) Y = 92E7(S)-038
100 1000 Speed (RPM)
-038065 )S(](C)[3E6Y sdotsdot=
Figure A-14 Generator upgrade cost as a function of RPM for various plant capacities
1000M
100M
Gen
erat
or U
pgra
de C
ost (
2002
$)
10000
Appendix B
INEEL Hydropower Resource Economics Database (see document back cover for IHRED compact disk)
B-1
B-2
Field Number Field Name Type Description
Appendix B
INEEL Hydropower Resource Economics Database B1 IHRED Data Dictionary B2 IHRED
The data dictionary for the INEEL The IHRED in Excel format is provided on the Hydropower Resource Economics Database compact disk which is in a pocket on the back (IHRED) is given in Table B-1 This table lists the cover of this document The database contains field number parameter name field type (number resource characteristic data estimated or text) field description and units for the development and OampM costs and estimated 78 fields in the database annual and monthly generation for 2155 US
hydropower resources
Table B-1 INEEL Hydropower Resource Economics Database Data Dictionary Units
1 ProjectNumber Text Project Number (FERC number or pseudo FERC number) mdash
2 PlantName Text Name of the project mdash
3 StreamName Text Name of the stream where the project is located mdash
4 StateAbbr Text Two letter abbreviation for the state where the project is located mdash
5 NERCSubregion Text NERC Subregion (1 = East Central Area Reliability Coordination Agreement (ECAR) 2 = Electric Reliability Council of Texas (ERCOT) 3 = Mid-Atlantic Area Council (MAAC) 4 = Mid-America Interconnected Network (MAIN) 5 = Mid-Continent Area Power Pool (MAPP) 6 = Northeast Power Coordinating CouncilNew York (NY) 7 = Northeast Power Coordinating CouncilNew England (NE) 8 = Southeastern Electric Reliability CouncilFlorida (FL) 9 = Southeastern Electric Reliability CouncilExcl Florida (STV) 10 = Southwest Power Pool (SPP) 11 = Western Systems Coordinating CouncilNWP (NWP) 12 = Western Systems Coordinating CouncilRA (RA) 13 = Western Systems Coordinating CouncilCNV (CNV))
mdash
6 Latitude Number Latitude (first digits refer to degrees north last 2 digits refer to minutes)
ddmm
7 Longitude Number Longitude (First digits refer to degrees west last 2 digits refer to minutes)
ddmm
8 ClassCode Text Owner class code (C = Cooperative F = Federal I = Industrial M = Municipal and other non-federal P = Private utility R = Private nonutility)
mdash
9 OwnerName Text Name of project owner mdash
10 Capacity Number Potential capacity at undeveloped sites or sites without power or potential additional capacity at sites with power
MW
11 UnitType Text Type of unit (C = Conventional R = Reversible Z = Missing) mdash
12 PlantType Text Type of Plant (CMB = Combined conventional and reversible units DIV = Gravity diversion (powerhouse on different stream) PDV = Pumped diversion (one-way pumped storage) PMP = Pure (recycled) pump storage RES = Reservoir only ROR = Run-of-river (dam lt= 10 ft high and minimal storage) RRG = Reregulating STG = Storage conventional hydro (dam gt 10 ft high with significant storage) TID = Tidal conventional hydro)
mdash
B-3
Field Number Field Name Type Description
Table B-1 (continued) Units
13 ProjectStatus Text Status of Project (DJ = Disclaimer of FERC jurisdiction EA = Exemption applied for FA = Federally authorized FR = Federally recommended LE = License exemption LJ = Lack of FERC jurisdiction MA = FERC major license application MO = FERC license outstanding NA = FERC minor license application (lt15 kW) NO = FERC minor license outstanding (lt15 kW) PA = FERC preliminary permit application PO = FERC preliminary permit outstanding XX = No status YO = FERC minor part license outstanding ZZ = Missing)
mdash
14 BasinName Text River basin name mdash
15 CountyName Text County where the project is located mdash
16 DamStatus Text Status of Dam (W = With Power WO = Without Power U = Undeveloped)
mdash
17 WSProtection Text WildScenic Protection mdash
18 WSTributary Text WildScenic Tributary or UpstreamDownstream WildScenic Location (YNltblankgt)
mdash
19 Cultural Text Cultural Value (YNltblankgt) mdash
20 Fish Text Fish Value (YNltblankgt) mdash
21 Geological Text Geological Value (YNltblankgt) mdash
22 Historical Text Historical Value (YNltblankgt) mdash
23 Other Text Other criteria such as rare wetland communities and wilderness designation
mdash
24 Recreation Text Recreation Value (YNltblankgt) mdash
25 Scenic Text Scenic Value (YNltblankgt) mdash
26 Wildlife Text Wildlife Value (YNltblankgt) mdash
27 TEW Text ThreatenedEndangered Wildlife (YNltblankgt) mdash
28 TEF Text ThreatenedEndangered Fish (YNltblankgt) mdash
29 FLC103 Text Federal Land Code 103 (National Park Monument Lakeshore Parkway Battlefield or Recreation Area) (YNltblankgt)
mdash
30 FLC104 Text Federal Land Code 104 (National Forest or Grassland) (YNltblankgt)
mdash
31 FLC105 Text Federal Land Code 105 (National Wildlife Refuge Game Preserve or Fish Hatchery) (YNltblankgt)
mdash
32 FLC106 Text Federal Land Code 106 (National Scenic Waterway or Wilderness Area) (YNltblankgt)
mdash
33 FLC107 Text Federal Land Code 107(Indian Reservation) (YNltblankgt) mdash
34 FLC108 Text Federal Land Code 108 (Military Reservation) (YNltblankgt) mdash
35 FLC198 Text Federal Land Code 198 (Not On Federal Land) (YNltblankgt) mdash
36 SiteProb Number Project Environmental Suitability Factor (010 = Development prohibited or highly unlikely 025 = Major reduction in likelihood of development 050 = Likelihood of development reduced by half 075 = Minor reduction in likelihood of development 090 = Little effect on likelihood of development)
mdash
37 LicensingCost Number Total Licensing Cost $K
38 ConstructionCost Number Total Construction Cost $K
39 OvrNiteDevCost Number Overnight Development Cost ( LicensingCost + ConstructionCost ) $K
40 MitHist_Arch Number 30 year Archaeological and Historical mitigation cost (applicable if either Cultural or Historical fields are Y )
$K
41 MitFish_Wildlife Number 30 year fish and wildlife mitigation cost (applicable if any of the Fish Wildlife or TEW fields are Y )
$K
42 MitScenic_Rec Number 30 year scenic and recreation mitigation cost (applicable if either Recreation or Scenic fields are Y )
$K
B-4
Field Number Field Name Type Description
Table B-1 (continued) Units
43 MitWaterMonitor Number 30 year water quality monitoring cost $K
44 MitFishPassage Number 30 year fish passage cost (applicable if TEF field is Y ) $K
45 MitTotal Number Total Mitigation Cost ( Sum of MitHist_Arch MitFish_Wildlife MitScenic_Rec MitWaterMonitor and MitFishPassage )
$K
46 TotalDevCost Number Total Development Cost ( OvrNiteDevCost + MitTotal ) $K
47 UnitTotalDevCost Number Total Development Unit Cost $kW
48 FixedOM Number Average Annual Fixed OampM $K
49 UnitFixedOM Number Average Annual Fixed OampM Unit Cost $kW
50 VariableOM Number Average Annual Variable OampM $K
51 UnitVariableOM Number Average Annual Variable OampM Unit Cost MillskWh
52 FERCAnnChrg Number FERC Annual Charge (applicable if Capacity gt= 15 MW ) $K
53 PFAnnual Number Average Annual Plant Factor -
54 PFJan Number Average January Plant Factor -
55 PFFeb Number Average February Plant Factor -
56 PFMar Number Average March Plant Factor -
57 PFApr Number Average April Plant Factor -
58 PFMay Number Average May Plant Factor -
59 PFJun Number Average June Plant Factor -
60 PFJul Number Average July Plant Factor -
61 PFAug Number Average August Plant Factor -
62 PFSept Number Average September Plant Factor -
63 PFOct Number Average October Plant Factor -
64 PFNov Number Average November Plant Factor -
65 PFDec Number Average December Plant Factor -
66 GenAnnual Number Average Annual Generation MWh
67 GenJan Number Average January Generation MWh
68 GenFeb Number Average February Generation MWh
69 GenMar Number Average March Generation MWh
70 GenApr Number Average April Generation MWh
71 GenMay Number Average May Generation MWh
72 GenJun Number Average June Generation MWh
73 GenJul Number Average July Generation MWh
74 GenAug Number Average August Generation MWh
75 GenSept Number Average September Generation MWh
76 GenOct Number Average October Generation MWh
77 GenNov Number Average November Generation MWh
78 GenDec Number Average December Generation MWh
Special field values NA Value not available in source data
Value removed due to homeland security concerns
B-5
- ABSTRACT
- EXECUTIVE SUMMARY
- ACKNOWLEDGMENTS
- ACRONYMS
- NOMENCLATURE
- INTRODUCTION
- TECHNICAL APPROACH
-
- Cost Estimating Tools for Plant Development or Expansion
-
- Data Sources
- General Method
- Data Screening
- Accounting for Cost Variations by Type of Site
-
- Cost Estimating Tools for Plant Operation and Maintenance
- Cost Estimating Tools for Turbine and Generator Upgrade
- Estimating Plant Electric Generation
- FERC Annual Charge
- Application of Estimating Tools to Hydropower Resources
-
- RESULTS
-
- Cost Estimating Tools for Plant Development or Expansion
- Cost Estimating Tools for Plant Operation and Maintenance
- Cost Estimating Tools for Turbine and Generator Upgrade
- Estimating Plant Electric Generation
- Estimated Economic Parameters for Hydropower Resources
- Likelihood of Development
-
- CONCLUSIONS AND RECOMMENDATIONS
- REFERENCES
-
- B1IHRED Data Dictionary
- B2IHRED
-

1 to 1
0
10 to
20
20 to
30
30 to
40
40 to
50
50 to
60
60 to
70
70 to
80
80 to
90
90 to
100
100 t
o 150
15
0 to 2
00
200 t
o 250
gt 250
$ 17 1 5 7
$ 11 4 92 7 7 4
1 M W 1 28 0 M WCapacity (MW)
Cos
t (20
02$)
Total No of Data Points = 474
24
105
55 47
33 27
14 19
14 12
51
25
11
37
0
20
40
60
80
10 0
12 0
No
of D
ata
Poin
ts
A-20
Capacity Range (MW)
Figure A-9B Number of fixed operation and maintenance cost data points for various plant capacity ranges
Y = 2E4(C)080
R2 = 067
001M
010M
100M
1000M
10000M Va
riabl
e O
ampM
Cos
t (20
02$)
EIA 2003b (1990 - 2000) 67 Upper Bound All Sites 67 Lower Bound
A-21
1 10 100 1000 10000
Capacity (MW)
Figure A-10A Variable operating and maintenance costs as a function of plant capacity for undeveloped and powerhouse installation at a dam without power and as a function of added capacity for a plant expansion
1 to 1
0
10 to
20
20 to
30
30 to
40
40 to
50
50 to
60
60 to
70
70 to
80
80 to
90
90 to
1 00
100 t
o 150
15
0 to 2
00
200 t
o 250
gt 250
$15 104
$12 929 143
1 MW 1 280 MWCapacity (MW)
Cos
t (20
02$)
Total No of Data Points = 501
39
116
58 51
37 25
14 24
14 14
53
25
10 21
0
20
40
60
80
10 0
12 0
14 0
No
of D
ata
Poin
ts
A-22
Capacity Range (MW)
Figure A-10B Number of variable operation and maintenance cost data points for various plant capacity ranges
A-23
Fran
cis
Turb
ine
Upg
rade
Cos
t (20
02$)
1000M
100M
10M
01M
071 -042Y = [3E6 sdot (C) ] sdot (H)
(C = 200 MW) Y = 13E8(H)-042
(C = 100 MW) Y = 77E7(H)-042
(C = 75 MW) Y = 63E7(H)-042
(C = 50 MW) Y = 47E7(H)-042
(C = 20 MW) Y = 25E7(H)-042
(C = 10 MW) Y = 15E7(H)-042
(C = 5 MW) Y = 92E6(H)-042
100 1000 Head (ft)
Figure A-11 Francis turbine upgrade cost as a function hydraulic head for various plant capacities
10000
A-24
1000M
100M
10M
(C = 5 MW) Y = 13E7(H)-038
(C = 10 MW) Y = 22E7(H)-038
(C = 20 MW) Y = 37E7(H)-038
(C = 50 MW) Y = 71E7(H)-038
(C = 75 MW) Y = 95E7(H)-038 (C = 100 MW) Y = 12E8(H)-038
(C = 200 MW) Y = 19E8(H)-038
10 100
Head (ft)
-038072 )H(](C)[4E6Y sdotsdot=
Figure A-12 Kaplan turbine upgrade cost as a function hydraulic head for various plant capacities
Kap
lan
Turb
ine
Upg
rade
Cos
t (20
02$)
1000
1000M B
ulb
Turb
ine
Upg
rade
Cos
t (20
02$)
100M
(C = 5 MW) Y = 25E7(H)-063
(C = 10 MW) Y = 45E7(H)-063
(C = 20 MW) Y = 82E7(H)-063
(C = 50 MW) Y = 18E8(H)-063
-063086 )H(](C)[6E6Y sdotsdot=
10M 1 10 100 1000
Head (ft)
Figure A-13 Bulb turbine upgrade cost as a function hydraulic head for various plant capacities
A-25
A-26
10M
01M
(C = 5 MW) Y = 84E6(S)-038
(C = 10 MW) Y = 13E7(S)-038
(C = 20 MW) Y = 21E7(S)-038
(C = 50 MW) Y = 37E7(S)-038 (C = 75 MW) Y = 49E7(S)-038 (C = 100 MW) Y = 59E7(S)-038
(C = 200 MW) Y = 92E7(S)-038
100 1000 Speed (RPM)
-038065 )S(](C)[3E6Y sdotsdot=
Figure A-14 Generator upgrade cost as a function of RPM for various plant capacities
1000M
100M
Gen
erat
or U
pgra
de C
ost (
2002
$)
10000
Appendix B
INEEL Hydropower Resource Economics Database (see document back cover for IHRED compact disk)
B-1
B-2
Field Number Field Name Type Description
Appendix B
INEEL Hydropower Resource Economics Database B1 IHRED Data Dictionary B2 IHRED
The data dictionary for the INEEL The IHRED in Excel format is provided on the Hydropower Resource Economics Database compact disk which is in a pocket on the back (IHRED) is given in Table B-1 This table lists the cover of this document The database contains field number parameter name field type (number resource characteristic data estimated or text) field description and units for the development and OampM costs and estimated 78 fields in the database annual and monthly generation for 2155 US
hydropower resources
Table B-1 INEEL Hydropower Resource Economics Database Data Dictionary Units
1 ProjectNumber Text Project Number (FERC number or pseudo FERC number) mdash
2 PlantName Text Name of the project mdash
3 StreamName Text Name of the stream where the project is located mdash
4 StateAbbr Text Two letter abbreviation for the state where the project is located mdash
5 NERCSubregion Text NERC Subregion (1 = East Central Area Reliability Coordination Agreement (ECAR) 2 = Electric Reliability Council of Texas (ERCOT) 3 = Mid-Atlantic Area Council (MAAC) 4 = Mid-America Interconnected Network (MAIN) 5 = Mid-Continent Area Power Pool (MAPP) 6 = Northeast Power Coordinating CouncilNew York (NY) 7 = Northeast Power Coordinating CouncilNew England (NE) 8 = Southeastern Electric Reliability CouncilFlorida (FL) 9 = Southeastern Electric Reliability CouncilExcl Florida (STV) 10 = Southwest Power Pool (SPP) 11 = Western Systems Coordinating CouncilNWP (NWP) 12 = Western Systems Coordinating CouncilRA (RA) 13 = Western Systems Coordinating CouncilCNV (CNV))
mdash
6 Latitude Number Latitude (first digits refer to degrees north last 2 digits refer to minutes)
ddmm
7 Longitude Number Longitude (First digits refer to degrees west last 2 digits refer to minutes)
ddmm
8 ClassCode Text Owner class code (C = Cooperative F = Federal I = Industrial M = Municipal and other non-federal P = Private utility R = Private nonutility)
mdash
9 OwnerName Text Name of project owner mdash
10 Capacity Number Potential capacity at undeveloped sites or sites without power or potential additional capacity at sites with power
MW
11 UnitType Text Type of unit (C = Conventional R = Reversible Z = Missing) mdash
12 PlantType Text Type of Plant (CMB = Combined conventional and reversible units DIV = Gravity diversion (powerhouse on different stream) PDV = Pumped diversion (one-way pumped storage) PMP = Pure (recycled) pump storage RES = Reservoir only ROR = Run-of-river (dam lt= 10 ft high and minimal storage) RRG = Reregulating STG = Storage conventional hydro (dam gt 10 ft high with significant storage) TID = Tidal conventional hydro)
mdash
B-3
Field Number Field Name Type Description
Table B-1 (continued) Units
13 ProjectStatus Text Status of Project (DJ = Disclaimer of FERC jurisdiction EA = Exemption applied for FA = Federally authorized FR = Federally recommended LE = License exemption LJ = Lack of FERC jurisdiction MA = FERC major license application MO = FERC license outstanding NA = FERC minor license application (lt15 kW) NO = FERC minor license outstanding (lt15 kW) PA = FERC preliminary permit application PO = FERC preliminary permit outstanding XX = No status YO = FERC minor part license outstanding ZZ = Missing)
mdash
14 BasinName Text River basin name mdash
15 CountyName Text County where the project is located mdash
16 DamStatus Text Status of Dam (W = With Power WO = Without Power U = Undeveloped)
mdash
17 WSProtection Text WildScenic Protection mdash
18 WSTributary Text WildScenic Tributary or UpstreamDownstream WildScenic Location (YNltblankgt)
mdash
19 Cultural Text Cultural Value (YNltblankgt) mdash
20 Fish Text Fish Value (YNltblankgt) mdash
21 Geological Text Geological Value (YNltblankgt) mdash
22 Historical Text Historical Value (YNltblankgt) mdash
23 Other Text Other criteria such as rare wetland communities and wilderness designation
mdash
24 Recreation Text Recreation Value (YNltblankgt) mdash
25 Scenic Text Scenic Value (YNltblankgt) mdash
26 Wildlife Text Wildlife Value (YNltblankgt) mdash
27 TEW Text ThreatenedEndangered Wildlife (YNltblankgt) mdash
28 TEF Text ThreatenedEndangered Fish (YNltblankgt) mdash
29 FLC103 Text Federal Land Code 103 (National Park Monument Lakeshore Parkway Battlefield or Recreation Area) (YNltblankgt)
mdash
30 FLC104 Text Federal Land Code 104 (National Forest or Grassland) (YNltblankgt)
mdash
31 FLC105 Text Federal Land Code 105 (National Wildlife Refuge Game Preserve or Fish Hatchery) (YNltblankgt)
mdash
32 FLC106 Text Federal Land Code 106 (National Scenic Waterway or Wilderness Area) (YNltblankgt)
mdash
33 FLC107 Text Federal Land Code 107(Indian Reservation) (YNltblankgt) mdash
34 FLC108 Text Federal Land Code 108 (Military Reservation) (YNltblankgt) mdash
35 FLC198 Text Federal Land Code 198 (Not On Federal Land) (YNltblankgt) mdash
36 SiteProb Number Project Environmental Suitability Factor (010 = Development prohibited or highly unlikely 025 = Major reduction in likelihood of development 050 = Likelihood of development reduced by half 075 = Minor reduction in likelihood of development 090 = Little effect on likelihood of development)
mdash
37 LicensingCost Number Total Licensing Cost $K
38 ConstructionCost Number Total Construction Cost $K
39 OvrNiteDevCost Number Overnight Development Cost ( LicensingCost + ConstructionCost ) $K
40 MitHist_Arch Number 30 year Archaeological and Historical mitigation cost (applicable if either Cultural or Historical fields are Y )
$K
41 MitFish_Wildlife Number 30 year fish and wildlife mitigation cost (applicable if any of the Fish Wildlife or TEW fields are Y )
$K
42 MitScenic_Rec Number 30 year scenic and recreation mitigation cost (applicable if either Recreation or Scenic fields are Y )
$K
B-4
Field Number Field Name Type Description
Table B-1 (continued) Units
43 MitWaterMonitor Number 30 year water quality monitoring cost $K
44 MitFishPassage Number 30 year fish passage cost (applicable if TEF field is Y ) $K
45 MitTotal Number Total Mitigation Cost ( Sum of MitHist_Arch MitFish_Wildlife MitScenic_Rec MitWaterMonitor and MitFishPassage )
$K
46 TotalDevCost Number Total Development Cost ( OvrNiteDevCost + MitTotal ) $K
47 UnitTotalDevCost Number Total Development Unit Cost $kW
48 FixedOM Number Average Annual Fixed OampM $K
49 UnitFixedOM Number Average Annual Fixed OampM Unit Cost $kW
50 VariableOM Number Average Annual Variable OampM $K
51 UnitVariableOM Number Average Annual Variable OampM Unit Cost MillskWh
52 FERCAnnChrg Number FERC Annual Charge (applicable if Capacity gt= 15 MW ) $K
53 PFAnnual Number Average Annual Plant Factor -
54 PFJan Number Average January Plant Factor -
55 PFFeb Number Average February Plant Factor -
56 PFMar Number Average March Plant Factor -
57 PFApr Number Average April Plant Factor -
58 PFMay Number Average May Plant Factor -
59 PFJun Number Average June Plant Factor -
60 PFJul Number Average July Plant Factor -
61 PFAug Number Average August Plant Factor -
62 PFSept Number Average September Plant Factor -
63 PFOct Number Average October Plant Factor -
64 PFNov Number Average November Plant Factor -
65 PFDec Number Average December Plant Factor -
66 GenAnnual Number Average Annual Generation MWh
67 GenJan Number Average January Generation MWh
68 GenFeb Number Average February Generation MWh
69 GenMar Number Average March Generation MWh
70 GenApr Number Average April Generation MWh
71 GenMay Number Average May Generation MWh
72 GenJun Number Average June Generation MWh
73 GenJul Number Average July Generation MWh
74 GenAug Number Average August Generation MWh
75 GenSept Number Average September Generation MWh
76 GenOct Number Average October Generation MWh
77 GenNov Number Average November Generation MWh
78 GenDec Number Average December Generation MWh
Special field values NA Value not available in source data
Value removed due to homeland security concerns
B-5
- ABSTRACT
- EXECUTIVE SUMMARY
- ACKNOWLEDGMENTS
- ACRONYMS
- NOMENCLATURE
- INTRODUCTION
- TECHNICAL APPROACH
-
- Cost Estimating Tools for Plant Development or Expansion
-
- Data Sources
- General Method
- Data Screening
- Accounting for Cost Variations by Type of Site
-
- Cost Estimating Tools for Plant Operation and Maintenance
- Cost Estimating Tools for Turbine and Generator Upgrade
- Estimating Plant Electric Generation
- FERC Annual Charge
- Application of Estimating Tools to Hydropower Resources
-
- RESULTS
-
- Cost Estimating Tools for Plant Development or Expansion
- Cost Estimating Tools for Plant Operation and Maintenance
- Cost Estimating Tools for Turbine and Generator Upgrade
- Estimating Plant Electric Generation
- Estimated Economic Parameters for Hydropower Resources
- Likelihood of Development
-
- CONCLUSIONS AND RECOMMENDATIONS
- REFERENCES
-
- B1IHRED Data Dictionary
- B2IHRED
-

Appendix B
INEEL Hydropower Resource Economics Database (see document back cover for IHRED compact disk)
B-1
B-2
Field Number Field Name Type Description
Appendix B
INEEL Hydropower Resource Economics Database B1 IHRED Data Dictionary B2 IHRED
The data dictionary for the INEEL The IHRED in Excel format is provided on the Hydropower Resource Economics Database compact disk which is in a pocket on the back (IHRED) is given in Table B-1 This table lists the cover of this document The database contains field number parameter name field type (number resource characteristic data estimated or text) field description and units for the development and OampM costs and estimated 78 fields in the database annual and monthly generation for 2155 US
hydropower resources
Table B-1 INEEL Hydropower Resource Economics Database Data Dictionary Units
1 ProjectNumber Text Project Number (FERC number or pseudo FERC number) mdash
2 PlantName Text Name of the project mdash
3 StreamName Text Name of the stream where the project is located mdash
4 StateAbbr Text Two letter abbreviation for the state where the project is located mdash
5 NERCSubregion Text NERC Subregion (1 = East Central Area Reliability Coordination Agreement (ECAR) 2 = Electric Reliability Council of Texas (ERCOT) 3 = Mid-Atlantic Area Council (MAAC) 4 = Mid-America Interconnected Network (MAIN) 5 = Mid-Continent Area Power Pool (MAPP) 6 = Northeast Power Coordinating CouncilNew York (NY) 7 = Northeast Power Coordinating CouncilNew England (NE) 8 = Southeastern Electric Reliability CouncilFlorida (FL) 9 = Southeastern Electric Reliability CouncilExcl Florida (STV) 10 = Southwest Power Pool (SPP) 11 = Western Systems Coordinating CouncilNWP (NWP) 12 = Western Systems Coordinating CouncilRA (RA) 13 = Western Systems Coordinating CouncilCNV (CNV))
mdash
6 Latitude Number Latitude (first digits refer to degrees north last 2 digits refer to minutes)
ddmm
7 Longitude Number Longitude (First digits refer to degrees west last 2 digits refer to minutes)
ddmm
8 ClassCode Text Owner class code (C = Cooperative F = Federal I = Industrial M = Municipal and other non-federal P = Private utility R = Private nonutility)
mdash
9 OwnerName Text Name of project owner mdash
10 Capacity Number Potential capacity at undeveloped sites or sites without power or potential additional capacity at sites with power
MW
11 UnitType Text Type of unit (C = Conventional R = Reversible Z = Missing) mdash
12 PlantType Text Type of Plant (CMB = Combined conventional and reversible units DIV = Gravity diversion (powerhouse on different stream) PDV = Pumped diversion (one-way pumped storage) PMP = Pure (recycled) pump storage RES = Reservoir only ROR = Run-of-river (dam lt= 10 ft high and minimal storage) RRG = Reregulating STG = Storage conventional hydro (dam gt 10 ft high with significant storage) TID = Tidal conventional hydro)
mdash
B-3
Field Number Field Name Type Description
Table B-1 (continued) Units
13 ProjectStatus Text Status of Project (DJ = Disclaimer of FERC jurisdiction EA = Exemption applied for FA = Federally authorized FR = Federally recommended LE = License exemption LJ = Lack of FERC jurisdiction MA = FERC major license application MO = FERC license outstanding NA = FERC minor license application (lt15 kW) NO = FERC minor license outstanding (lt15 kW) PA = FERC preliminary permit application PO = FERC preliminary permit outstanding XX = No status YO = FERC minor part license outstanding ZZ = Missing)
mdash
14 BasinName Text River basin name mdash
15 CountyName Text County where the project is located mdash
16 DamStatus Text Status of Dam (W = With Power WO = Without Power U = Undeveloped)
mdash
17 WSProtection Text WildScenic Protection mdash
18 WSTributary Text WildScenic Tributary or UpstreamDownstream WildScenic Location (YNltblankgt)
mdash
19 Cultural Text Cultural Value (YNltblankgt) mdash
20 Fish Text Fish Value (YNltblankgt) mdash
21 Geological Text Geological Value (YNltblankgt) mdash
22 Historical Text Historical Value (YNltblankgt) mdash
23 Other Text Other criteria such as rare wetland communities and wilderness designation
mdash
24 Recreation Text Recreation Value (YNltblankgt) mdash
25 Scenic Text Scenic Value (YNltblankgt) mdash
26 Wildlife Text Wildlife Value (YNltblankgt) mdash
27 TEW Text ThreatenedEndangered Wildlife (YNltblankgt) mdash
28 TEF Text ThreatenedEndangered Fish (YNltblankgt) mdash
29 FLC103 Text Federal Land Code 103 (National Park Monument Lakeshore Parkway Battlefield or Recreation Area) (YNltblankgt)
mdash
30 FLC104 Text Federal Land Code 104 (National Forest or Grassland) (YNltblankgt)
mdash
31 FLC105 Text Federal Land Code 105 (National Wildlife Refuge Game Preserve or Fish Hatchery) (YNltblankgt)
mdash
32 FLC106 Text Federal Land Code 106 (National Scenic Waterway or Wilderness Area) (YNltblankgt)
mdash
33 FLC107 Text Federal Land Code 107(Indian Reservation) (YNltblankgt) mdash
34 FLC108 Text Federal Land Code 108 (Military Reservation) (YNltblankgt) mdash
35 FLC198 Text Federal Land Code 198 (Not On Federal Land) (YNltblankgt) mdash
36 SiteProb Number Project Environmental Suitability Factor (010 = Development prohibited or highly unlikely 025 = Major reduction in likelihood of development 050 = Likelihood of development reduced by half 075 = Minor reduction in likelihood of development 090 = Little effect on likelihood of development)
mdash
37 LicensingCost Number Total Licensing Cost $K
38 ConstructionCost Number Total Construction Cost $K
39 OvrNiteDevCost Number Overnight Development Cost ( LicensingCost + ConstructionCost ) $K
40 MitHist_Arch Number 30 year Archaeological and Historical mitigation cost (applicable if either Cultural or Historical fields are Y )
$K
41 MitFish_Wildlife Number 30 year fish and wildlife mitigation cost (applicable if any of the Fish Wildlife or TEW fields are Y )
$K
42 MitScenic_Rec Number 30 year scenic and recreation mitigation cost (applicable if either Recreation or Scenic fields are Y )
$K
B-4
Field Number Field Name Type Description
Table B-1 (continued) Units
43 MitWaterMonitor Number 30 year water quality monitoring cost $K
44 MitFishPassage Number 30 year fish passage cost (applicable if TEF field is Y ) $K
45 MitTotal Number Total Mitigation Cost ( Sum of MitHist_Arch MitFish_Wildlife MitScenic_Rec MitWaterMonitor and MitFishPassage )
$K
46 TotalDevCost Number Total Development Cost ( OvrNiteDevCost + MitTotal ) $K
47 UnitTotalDevCost Number Total Development Unit Cost $kW
48 FixedOM Number Average Annual Fixed OampM $K
49 UnitFixedOM Number Average Annual Fixed OampM Unit Cost $kW
50 VariableOM Number Average Annual Variable OampM $K
51 UnitVariableOM Number Average Annual Variable OampM Unit Cost MillskWh
52 FERCAnnChrg Number FERC Annual Charge (applicable if Capacity gt= 15 MW ) $K
53 PFAnnual Number Average Annual Plant Factor -
54 PFJan Number Average January Plant Factor -
55 PFFeb Number Average February Plant Factor -
56 PFMar Number Average March Plant Factor -
57 PFApr Number Average April Plant Factor -
58 PFMay Number Average May Plant Factor -
59 PFJun Number Average June Plant Factor -
60 PFJul Number Average July Plant Factor -
61 PFAug Number Average August Plant Factor -
62 PFSept Number Average September Plant Factor -
63 PFOct Number Average October Plant Factor -
64 PFNov Number Average November Plant Factor -
65 PFDec Number Average December Plant Factor -
66 GenAnnual Number Average Annual Generation MWh
67 GenJan Number Average January Generation MWh
68 GenFeb Number Average February Generation MWh
69 GenMar Number Average March Generation MWh
70 GenApr Number Average April Generation MWh
71 GenMay Number Average May Generation MWh
72 GenJun Number Average June Generation MWh
73 GenJul Number Average July Generation MWh
74 GenAug Number Average August Generation MWh
75 GenSept Number Average September Generation MWh
76 GenOct Number Average October Generation MWh
77 GenNov Number Average November Generation MWh
78 GenDec Number Average December Generation MWh
Special field values NA Value not available in source data
Value removed due to homeland security concerns
B-5
- ABSTRACT
- EXECUTIVE SUMMARY
- ACKNOWLEDGMENTS
- ACRONYMS
- NOMENCLATURE
- INTRODUCTION
- TECHNICAL APPROACH
-
- Cost Estimating Tools for Plant Development or Expansion
-
- Data Sources
- General Method
- Data Screening
- Accounting for Cost Variations by Type of Site
-
- Cost Estimating Tools for Plant Operation and Maintenance
- Cost Estimating Tools for Turbine and Generator Upgrade
- Estimating Plant Electric Generation
- FERC Annual Charge
- Application of Estimating Tools to Hydropower Resources
-
- RESULTS
-
- Cost Estimating Tools for Plant Development or Expansion
- Cost Estimating Tools for Plant Operation and Maintenance
- Cost Estimating Tools for Turbine and Generator Upgrade
- Estimating Plant Electric Generation
- Estimated Economic Parameters for Hydropower Resources
- Likelihood of Development
-
- CONCLUSIONS AND RECOMMENDATIONS
- REFERENCES
-
- B1IHRED Data Dictionary
- B2IHRED
-

Field Number Field Name Type Description
Appendix B
INEEL Hydropower Resource Economics Database B1 IHRED Data Dictionary B2 IHRED
The data dictionary for the INEEL The IHRED in Excel format is provided on the Hydropower Resource Economics Database compact disk which is in a pocket on the back (IHRED) is given in Table B-1 This table lists the cover of this document The database contains field number parameter name field type (number resource characteristic data estimated or text) field description and units for the development and OampM costs and estimated 78 fields in the database annual and monthly generation for 2155 US
hydropower resources
Table B-1 INEEL Hydropower Resource Economics Database Data Dictionary Units
1 ProjectNumber Text Project Number (FERC number or pseudo FERC number) mdash
2 PlantName Text Name of the project mdash
3 StreamName Text Name of the stream where the project is located mdash
4 StateAbbr Text Two letter abbreviation for the state where the project is located mdash
5 NERCSubregion Text NERC Subregion (1 = East Central Area Reliability Coordination Agreement (ECAR) 2 = Electric Reliability Council of Texas (ERCOT) 3 = Mid-Atlantic Area Council (MAAC) 4 = Mid-America Interconnected Network (MAIN) 5 = Mid-Continent Area Power Pool (MAPP) 6 = Northeast Power Coordinating CouncilNew York (NY) 7 = Northeast Power Coordinating CouncilNew England (NE) 8 = Southeastern Electric Reliability CouncilFlorida (FL) 9 = Southeastern Electric Reliability CouncilExcl Florida (STV) 10 = Southwest Power Pool (SPP) 11 = Western Systems Coordinating CouncilNWP (NWP) 12 = Western Systems Coordinating CouncilRA (RA) 13 = Western Systems Coordinating CouncilCNV (CNV))
mdash
6 Latitude Number Latitude (first digits refer to degrees north last 2 digits refer to minutes)
ddmm
7 Longitude Number Longitude (First digits refer to degrees west last 2 digits refer to minutes)
ddmm
8 ClassCode Text Owner class code (C = Cooperative F = Federal I = Industrial M = Municipal and other non-federal P = Private utility R = Private nonutility)
mdash
9 OwnerName Text Name of project owner mdash
10 Capacity Number Potential capacity at undeveloped sites or sites without power or potential additional capacity at sites with power
MW
11 UnitType Text Type of unit (C = Conventional R = Reversible Z = Missing) mdash
12 PlantType Text Type of Plant (CMB = Combined conventional and reversible units DIV = Gravity diversion (powerhouse on different stream) PDV = Pumped diversion (one-way pumped storage) PMP = Pure (recycled) pump storage RES = Reservoir only ROR = Run-of-river (dam lt= 10 ft high and minimal storage) RRG = Reregulating STG = Storage conventional hydro (dam gt 10 ft high with significant storage) TID = Tidal conventional hydro)
mdash
B-3
Field Number Field Name Type Description
Table B-1 (continued) Units
13 ProjectStatus Text Status of Project (DJ = Disclaimer of FERC jurisdiction EA = Exemption applied for FA = Federally authorized FR = Federally recommended LE = License exemption LJ = Lack of FERC jurisdiction MA = FERC major license application MO = FERC license outstanding NA = FERC minor license application (lt15 kW) NO = FERC minor license outstanding (lt15 kW) PA = FERC preliminary permit application PO = FERC preliminary permit outstanding XX = No status YO = FERC minor part license outstanding ZZ = Missing)
mdash
14 BasinName Text River basin name mdash
15 CountyName Text County where the project is located mdash
16 DamStatus Text Status of Dam (W = With Power WO = Without Power U = Undeveloped)
mdash
17 WSProtection Text WildScenic Protection mdash
18 WSTributary Text WildScenic Tributary or UpstreamDownstream WildScenic Location (YNltblankgt)
mdash
19 Cultural Text Cultural Value (YNltblankgt) mdash
20 Fish Text Fish Value (YNltblankgt) mdash
21 Geological Text Geological Value (YNltblankgt) mdash
22 Historical Text Historical Value (YNltblankgt) mdash
23 Other Text Other criteria such as rare wetland communities and wilderness designation
mdash
24 Recreation Text Recreation Value (YNltblankgt) mdash
25 Scenic Text Scenic Value (YNltblankgt) mdash
26 Wildlife Text Wildlife Value (YNltblankgt) mdash
27 TEW Text ThreatenedEndangered Wildlife (YNltblankgt) mdash
28 TEF Text ThreatenedEndangered Fish (YNltblankgt) mdash
29 FLC103 Text Federal Land Code 103 (National Park Monument Lakeshore Parkway Battlefield or Recreation Area) (YNltblankgt)
mdash
30 FLC104 Text Federal Land Code 104 (National Forest or Grassland) (YNltblankgt)
mdash
31 FLC105 Text Federal Land Code 105 (National Wildlife Refuge Game Preserve or Fish Hatchery) (YNltblankgt)
mdash
32 FLC106 Text Federal Land Code 106 (National Scenic Waterway or Wilderness Area) (YNltblankgt)
mdash
33 FLC107 Text Federal Land Code 107(Indian Reservation) (YNltblankgt) mdash
34 FLC108 Text Federal Land Code 108 (Military Reservation) (YNltblankgt) mdash
35 FLC198 Text Federal Land Code 198 (Not On Federal Land) (YNltblankgt) mdash
36 SiteProb Number Project Environmental Suitability Factor (010 = Development prohibited or highly unlikely 025 = Major reduction in likelihood of development 050 = Likelihood of development reduced by half 075 = Minor reduction in likelihood of development 090 = Little effect on likelihood of development)
mdash
37 LicensingCost Number Total Licensing Cost $K
38 ConstructionCost Number Total Construction Cost $K
39 OvrNiteDevCost Number Overnight Development Cost ( LicensingCost + ConstructionCost ) $K
40 MitHist_Arch Number 30 year Archaeological and Historical mitigation cost (applicable if either Cultural or Historical fields are Y )
$K
41 MitFish_Wildlife Number 30 year fish and wildlife mitigation cost (applicable if any of the Fish Wildlife or TEW fields are Y )
$K
42 MitScenic_Rec Number 30 year scenic and recreation mitigation cost (applicable if either Recreation or Scenic fields are Y )
$K
B-4
Field Number Field Name Type Description
Table B-1 (continued) Units
43 MitWaterMonitor Number 30 year water quality monitoring cost $K
44 MitFishPassage Number 30 year fish passage cost (applicable if TEF field is Y ) $K
45 MitTotal Number Total Mitigation Cost ( Sum of MitHist_Arch MitFish_Wildlife MitScenic_Rec MitWaterMonitor and MitFishPassage )
$K
46 TotalDevCost Number Total Development Cost ( OvrNiteDevCost + MitTotal ) $K
47 UnitTotalDevCost Number Total Development Unit Cost $kW
48 FixedOM Number Average Annual Fixed OampM $K
49 UnitFixedOM Number Average Annual Fixed OampM Unit Cost $kW
50 VariableOM Number Average Annual Variable OampM $K
51 UnitVariableOM Number Average Annual Variable OampM Unit Cost MillskWh
52 FERCAnnChrg Number FERC Annual Charge (applicable if Capacity gt= 15 MW ) $K
53 PFAnnual Number Average Annual Plant Factor -
54 PFJan Number Average January Plant Factor -
55 PFFeb Number Average February Plant Factor -
56 PFMar Number Average March Plant Factor -
57 PFApr Number Average April Plant Factor -
58 PFMay Number Average May Plant Factor -
59 PFJun Number Average June Plant Factor -
60 PFJul Number Average July Plant Factor -
61 PFAug Number Average August Plant Factor -
62 PFSept Number Average September Plant Factor -
63 PFOct Number Average October Plant Factor -
64 PFNov Number Average November Plant Factor -
65 PFDec Number Average December Plant Factor -
66 GenAnnual Number Average Annual Generation MWh
67 GenJan Number Average January Generation MWh
68 GenFeb Number Average February Generation MWh
69 GenMar Number Average March Generation MWh
70 GenApr Number Average April Generation MWh
71 GenMay Number Average May Generation MWh
72 GenJun Number Average June Generation MWh
73 GenJul Number Average July Generation MWh
74 GenAug Number Average August Generation MWh
75 GenSept Number Average September Generation MWh
76 GenOct Number Average October Generation MWh
77 GenNov Number Average November Generation MWh
78 GenDec Number Average December Generation MWh
Special field values NA Value not available in source data
Value removed due to homeland security concerns
B-5
- ABSTRACT
- EXECUTIVE SUMMARY
- ACKNOWLEDGMENTS
- ACRONYMS
- NOMENCLATURE
- INTRODUCTION
- TECHNICAL APPROACH
-
- Cost Estimating Tools for Plant Development or Expansion
-
- Data Sources
- General Method
- Data Screening
- Accounting for Cost Variations by Type of Site
-
- Cost Estimating Tools for Plant Operation and Maintenance
- Cost Estimating Tools for Turbine and Generator Upgrade
- Estimating Plant Electric Generation
- FERC Annual Charge
- Application of Estimating Tools to Hydropower Resources
-
- RESULTS
-
- Cost Estimating Tools for Plant Development or Expansion
- Cost Estimating Tools for Plant Operation and Maintenance
- Cost Estimating Tools for Turbine and Generator Upgrade
- Estimating Plant Electric Generation
- Estimated Economic Parameters for Hydropower Resources
- Likelihood of Development
-
- CONCLUSIONS AND RECOMMENDATIONS
- REFERENCES
-
- B1IHRED Data Dictionary
- B2IHRED
-
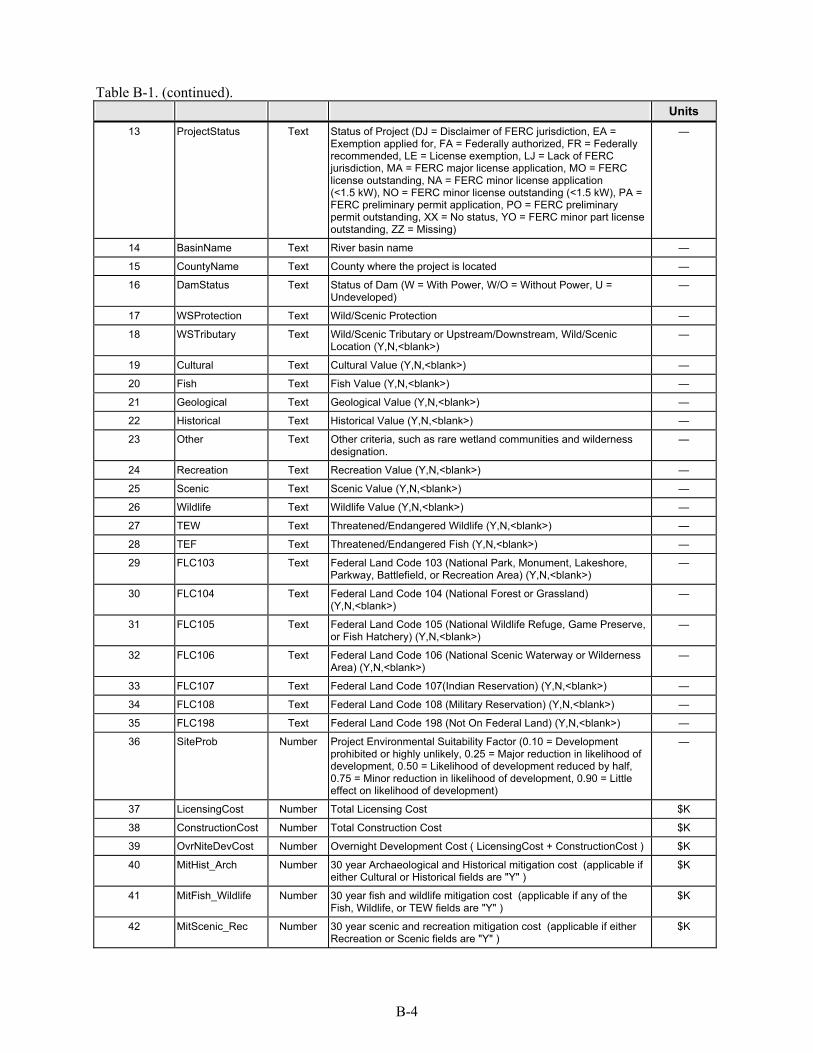
Field Number Field Name Type Description
Table B-1 (continued) Units
43 MitWaterMonitor Number 30 year water quality monitoring cost $K
44 MitFishPassage Number 30 year fish passage cost (applicable if TEF field is Y ) $K
45 MitTotal Number Total Mitigation Cost ( Sum of MitHist_Arch MitFish_Wildlife MitScenic_Rec MitWaterMonitor and MitFishPassage )
$K
46 TotalDevCost Number Total Development Cost ( OvrNiteDevCost + MitTotal ) $K
47 UnitTotalDevCost Number Total Development Unit Cost $kW
48 FixedOM Number Average Annual Fixed OampM $K
49 UnitFixedOM Number Average Annual Fixed OampM Unit Cost $kW
50 VariableOM Number Average Annual Variable OampM $K
51 UnitVariableOM Number Average Annual Variable OampM Unit Cost MillskWh
52 FERCAnnChrg Number FERC Annual Charge (applicable if Capacity gt= 15 MW ) $K
53 PFAnnual Number Average Annual Plant Factor -
54 PFJan Number Average January Plant Factor -
55 PFFeb Number Average February Plant Factor -
56 PFMar Number Average March Plant Factor -
57 PFApr Number Average April Plant Factor -
58 PFMay Number Average May Plant Factor -
59 PFJun Number Average June Plant Factor -
60 PFJul Number Average July Plant Factor -
61 PFAug Number Average August Plant Factor -
62 PFSept Number Average September Plant Factor -
63 PFOct Number Average October Plant Factor -
64 PFNov Number Average November Plant Factor -
65 PFDec Number Average December Plant Factor -
66 GenAnnual Number Average Annual Generation MWh
67 GenJan Number Average January Generation MWh
68 GenFeb Number Average February Generation MWh
69 GenMar Number Average March Generation MWh
70 GenApr Number Average April Generation MWh
71 GenMay Number Average May Generation MWh
72 GenJun Number Average June Generation MWh
73 GenJul Number Average July Generation MWh
74 GenAug Number Average August Generation MWh
75 GenSept Number Average September Generation MWh
76 GenOct Number Average October Generation MWh
77 GenNov Number Average November Generation MWh
78 GenDec Number Average December Generation MWh
Special field values NA Value not available in source data
Value removed due to homeland security concerns
B-5
- ABSTRACT
- EXECUTIVE SUMMARY
- ACKNOWLEDGMENTS
- ACRONYMS
- NOMENCLATURE
- INTRODUCTION
- TECHNICAL APPROACH
-
- Cost Estimating Tools for Plant Development or Expansion
-
- Data Sources
- General Method
- Data Screening
- Accounting for Cost Variations by Type of Site
-
- Cost Estimating Tools for Plant Operation and Maintenance
- Cost Estimating Tools for Turbine and Generator Upgrade
- Estimating Plant Electric Generation
- FERC Annual Charge
- Application of Estimating Tools to Hydropower Resources
-
- RESULTS
-
- Cost Estimating Tools for Plant Development or Expansion
- Cost Estimating Tools for Plant Operation and Maintenance
- Cost Estimating Tools for Turbine and Generator Upgrade
- Estimating Plant Electric Generation
- Estimated Economic Parameters for Hydropower Resources
- Likelihood of Development
-
- CONCLUSIONS AND RECOMMENDATIONS
- REFERENCES
-
- B1IHRED Data Dictionary
- B2IHRED
-