estimating the exposures of major financial … the exposures of major financial institutions to the...
TRANSCRIPT

90 ESTIMATING THE EXPOSURES OF MAJOR FINANCIAL INSTITUTIONS TO THE GLOBAL CREDIT RISK TRANSFER MARKET WINTER 2007
Rapid financial innovation haschanged the landscape of risk byenabling market participants totrade credit risk across the finan-
cial and other sectors. Credit risk transfer(CRT) instruments, especially credit deriva-tives, offer important diversification benefitsfor financial institutions with large credit expo-sures, act as a stabilization mechanism for thefinancial system, and enhance efficiency inpricing and intermediation.1 In particular, theintroduction and rapid acceptance of bench-mark credit derivatives indices have helped todevelop a two-way market for credit deriva-tive instruments, enabling investors to cus-tomize their exposures to credit risk.Participants in the CRT market have becomemore and more diverse, thus increasing thedispersion of risk across both financial andnonfinancial sectors.
That said, the exponential growth ofCRT instruments may have also created somerisks for financial stability. A key concern isthat the pace of innovation may have exceededthe development of market infrastructure andthe risk management systems of financial insti-tutions participating in this market. Further,the interlinkages across different financial insti-tutions—for example, between banking andother segments such as insurance and hedgefunds—have increased over time.2 Conse-quently, any shock to the financial system maybe magnified by these interrelationships and
the broader exposure of investors to theseinstruments, as evidenced by the recent sub-prime crisis in the U.S. and its repercussionsfor financial institutions worldwide.
Thus, the determination of risk con-centration among financial institutions to creditderivative instruments has become an extremelyimportant issue for supervisors, credit ratingagencies, and private sector analysts. However,it is generally acknowledged that transactionsin the CRT market are very difficult to trackbecause of the paucity of data available to quan-titatively assess the extent of risk transfers andthe concentration of exposures.3 As a result,surveillance of the opaque credit risk transfermarket has proven to be quite difficult.
This article proposes a method for mea-suring the exposures of major global financialinstitutions to the CRT market by usingreadily available and timely financial marketsdata—stock prices and single-tranche CDOquotes—as a proxy. Our results reveal severalimportant trends in the credit derivative expo-sures of major global financial institutions.There is evidence of a “home bias” as finan-cial institutions appear more exposed to creditderivatives referencing issuers in their respec-tive regions of domicile. In general, financialinstitutions also appear to have greater expo-sures to the senior and super-senior debttranches referencing the European CDS indexand to the mezzanine tranches referencing theNorth American CDS index. Certain financial
Estimating the Exposures of MajorFinancial Institutions to the GlobalCredit Risk Transfer Market: Are TheySlicing the Risks or Dicing with Danger?JORGE A. CHAN-LAU AND LI LIAN ONG
JORGE A. CHAN-LAU
is a senior financial officerin the Structured and Secu-ritized Products Depart-ment at the InternationalFinance Corporation in Washington, [email protected]
LI LIAN ONG
is a senior economist at aninternational financial institution in Washington,D.C.
IT IS
ILLEGAL T
O REPRODUCE T
HIS A
RTICLE IN
ANY F
ORMAT
Copyright © 2007

institutions are perceived to have their biggest exposuresto the riskiest credits—results which appear to be broadlysupported by out-of-sample evidence from the recent tur-bulence in international credit markets.
EMPIRICAL MODEL AND DATA
We estimate the implied exposure of a firm to CDSindex tranches, also known as standardized single-tranchecollateralized debt obligations (STCDOs). These are syn-thetic CDOs based on a CDS index, with each tranchereferencing a different segment of the loss distribution ofthat CDS index.4 Specifically, we test for the variabilityof financial institutions’ stock price returns to pricechanges in STCDOs referencing major CDS indices—theiTRAXX Europe Investment Grade (iTRAXX) and theNorth American CDX.NA.IG (CDX) indices—as aproxy for the perceived longer-term riskiness of theirexposures to CRT instruments in general. The assump-tion that such a relationship exists is reasonable given thatall available information about a firm’s transactions and per-formance, and hence investors’ risk perceptions, is quicklyreflected in its share price in an efficient market.
Model
The empirical framework chosen is the vectorautoregression (VAR) method first suggested byHasbrouck [1991a, b]. The variables included in the VARare the firm’s daily stock price return, the return of aglobal stock index, and the percentage change in thespreads of STCDOs referencing European and NorthAmerican CDS indices. The inclusion of a global stockindex attempts to correct for systematic risk. The modeland data are discussed in detail next.
Given the vector of n endogenous variables, Yt =(y1t,y2t, …, ynt)´, the corresponding unrestricted VAR systemof order p is given by
(1)
where c is a n-vector of constant terms, Φi (i = 1, …, p)are n-by-n coefficient matrices, and et is a vector of uncor-related independent and identically distributed error terms.The error terms are also serially uncorrelated. Under cer-tain technical conditions, described in Hamilton [1994],the vector autoregression system in Equation (1) could
Y c Y Yt t p t p t= + + +− −Φ Φ1 1 … ε
be represented by the following vector moving averagerepresentation (VMA):
(2)
where are lag operators.
The coefficient ψ kij measures the effect k periods
ahead of a unit shock or innovation to variable yj onvariable yi. Therefore, the long-term cumulative impactof variable yj on variable yi can be measured by addingthe coefficients associated with the lag operator ψij(L) asfollows:
(3)
Equation (3) suggests that variance decompositioncould be used to quantify the overall importance ofinnovations to variable yj for explaining subsequentrealizations of variable yi vis-à-vis the other endogenousvariables. Specifically, the overall importance of variableyj is captured by the relative share of the variance of vari-able yi it explains:
(4)
where σ 2εj
is the variance of the innovation to variable yj.Note that our VAR framework does not choose a par-ticular ordering of the variables entering Equation (1)and, hence, is a statistical description of the dynamic inter-relations between the variables analyzed. While a struc-tural VAR may offer some advantages for interpreting thedata, it requires specifying a priori a causal ordering of thevariables. We do not deem this appropriate for our studygiven that there is, to our knowledge, little justificationfor imposing a particular ordering.
Σ
Σ Σ
k ijk
mn
k imk
j
m
=∞
− =∞
( )( )
0
22
1 0
2 2
ψ σ
ψ σ
ε
ε
ψ ijk
k=
∞
∑ =0
information� of� � on�y yj i
ψ ψij k ijk kL i j n= ==
∞Σ 1 1, , , , ,…
y
y
y
L Lt
it
nt
i1 11 1
M
M
… …
=
ψ ψ ψ( ) ( ) 11
1
1
n
i ii in
n ni
L
L L L
L
( )
( ) ( ) ( )
( ) (
M M M… …
M M M…
ψ ψ ψ
ψ ψ LL Lnn
t
it
nt) ( )…
M
Mψ
ε
ε
ε
1
WINTER 2007 THE JOURNAL OF FIXED INCOME 91
Copyright © 2007

Data
The VAR methodology was implemented using his-torical daily data for the period from November 14, 2003,to February 9, 2007, for a sample of the world’s biggestbanks, broker/dealers, insurers, and reinsurers that areactive in the CRT market (Exhibit 1):
1. The stock price returns for each institution are con-structed using data obtained from Bloomberg, L.P.The daily returns on the Morgan Stanley CapitalInternational (MSCI) All-Country World Index,which are included in the model to account forcommon global influences on financial prices, arealso obtained from the same source.
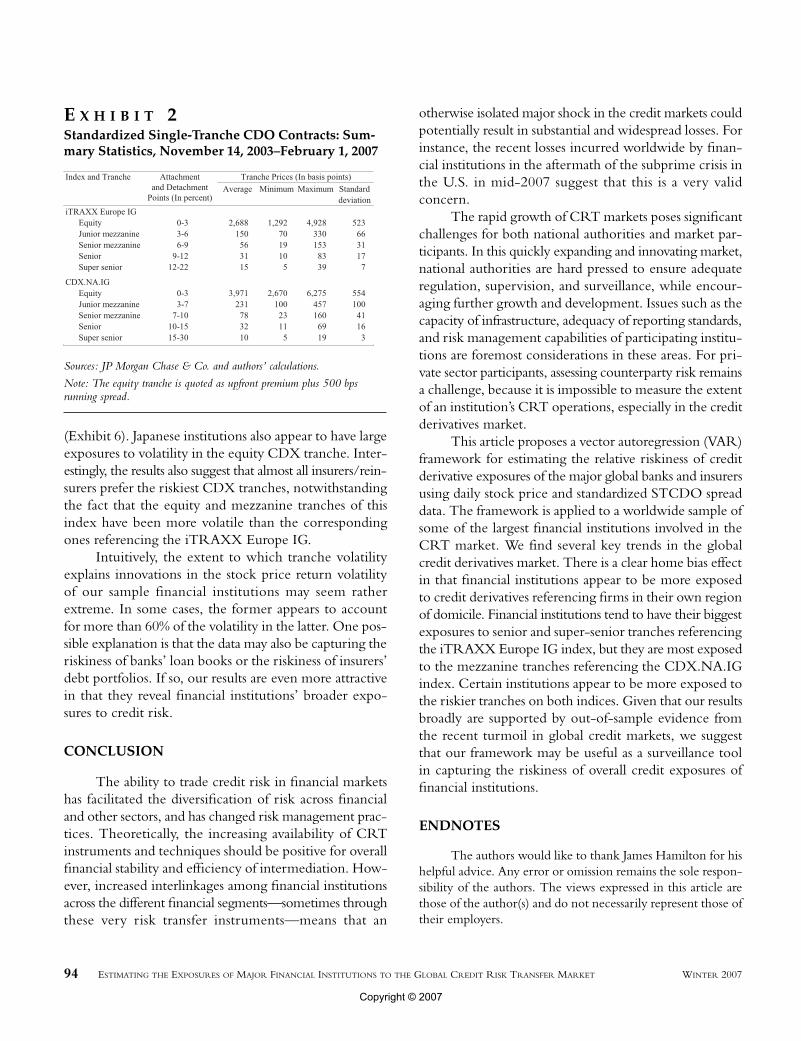
2. Daily percentage changes of STCDO spreads ref-erencing the iTRAXX and CDX are constructedusing price quotes obtained from JPMorgan Chase& Co. (Exhibit 2). The spreads quotes for STCDOsreferencing CDS indices must be denominated in acommon currency. For instance, if we assume thata European-domiciled institution invests in the U.S.credit derivatives market, then we would have toconvert the spread of STCDOs referencing theCDX.NA.IG index from U.S. dollars to euros inorder to test the relationship. For a given date, theconversion is accomplished by first computing thepresent value in U.S. dollars of the 5-year periodicpayments of the single-tranche contract usingLIBOR rates as discount factors. Subsequently, thepresent value of the single-tranche contract is con-verted to euros at the current exchange rate and theequivalent running spread is computed usingEURIBOR rates as discount factors. A corre-sponding procedure was used to convert iTRAXXEurope IG spreads from euros to U.S. dollars whentesting for the investment in European credit deriv-atives by U.S.-domiciled institutions.
RESULTS
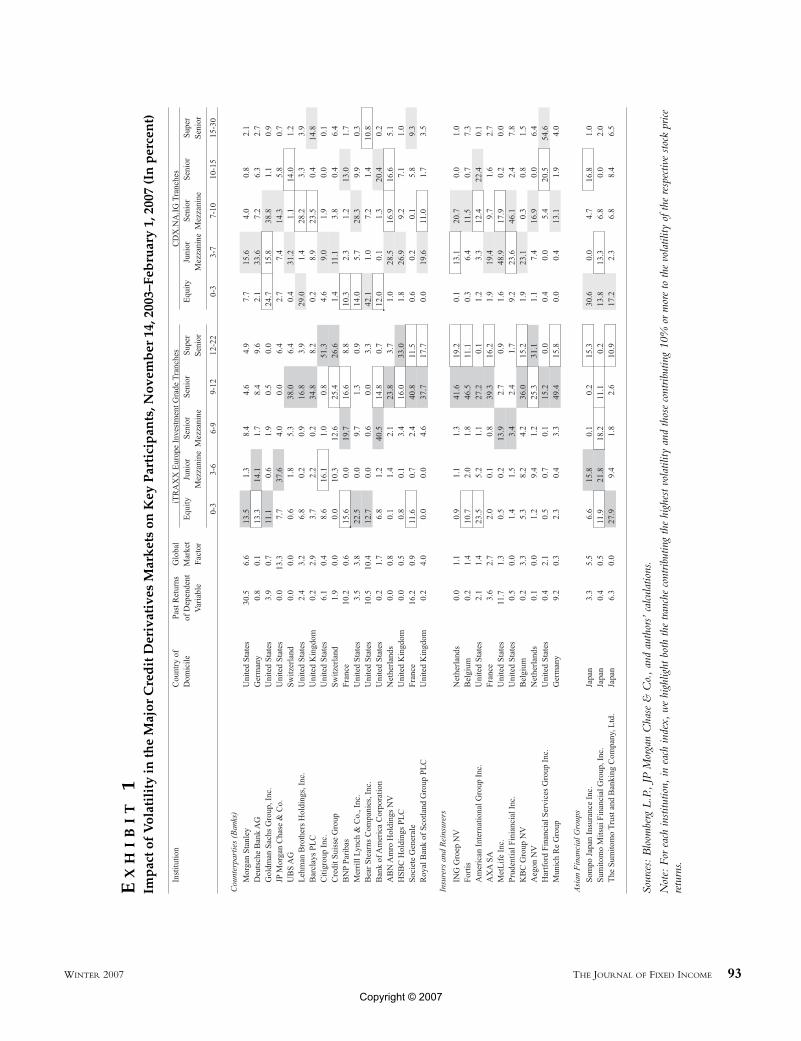
Our model yields several interesting results. First,long-term stock return volatility appears to be influencedby the exposure to credit derivatives regardless of whetherthey reference European or U.S. issuers (Exhibit 1). Inter-estingly, for most institutions analyzed, the institution’spast price return volatility and global stock market return
volatility are not key factors in explaining the volatility inits current stock price returns.
Second, there appears to be a home bias effect asfinancial institutions appear to be more impacted by thevolatility in credit derivatives of their own region. Theprice return volatility of financial institutions domiciledin Europe are more affected by iTRAXX tranches(Exhibit 3), while a number of U.S. banks are moreaffected by CDX tranches. The iTRAXX tranches arealso important in explaining the volatility in stock pricereturns of several U.S.-domiciled financial institutions.
Third, the relationship between the domicile of aparticular financial institution and the STCDOs on theregional index is especially obvious within the insurancesector. European insurance entities are more affected byvolatility in the iTRAXX tranches. The U.S. insurers aremore affected by CDX tranche volatility, with the excep-tion of AIG which is influenced more by iTRAXXvolatility. In the case of Japanese institutions, banks appearmore exposed to volatility in the iTRAXX tranches whilethe sole insurance company in the sample appears to bemore exposed to volatility in the CDX tranches.
In terms of risk appetite, financial institutions, espe-cially European ones, appear more exposed to senior andsuper-senior iTRAXX tranches (Exhibit 4). The volatilityof the senior iTRAXX tranche is the major explanatoryfactor for stock return volatility in two-thirds of the com-panies in the sample, and explains at least 40% of the stockreturn volatility for half the sample. Only the stock pricesof a few institutions, mostly domiciled in the U.S., suchas Bear Stearns, Goldman Sachs, Merrill Lynch andMorgan Stanley, have their biggest exposures to volatilityin the equity and junior mezzanine iTRAXX tranches.This finding suggests that some U.S. institutions may haveriskier exposures to the European credit derivatives marketrelative to others. Similarly, Japanese companies also appearto be exposed to the riskier iTRAXX tranches.
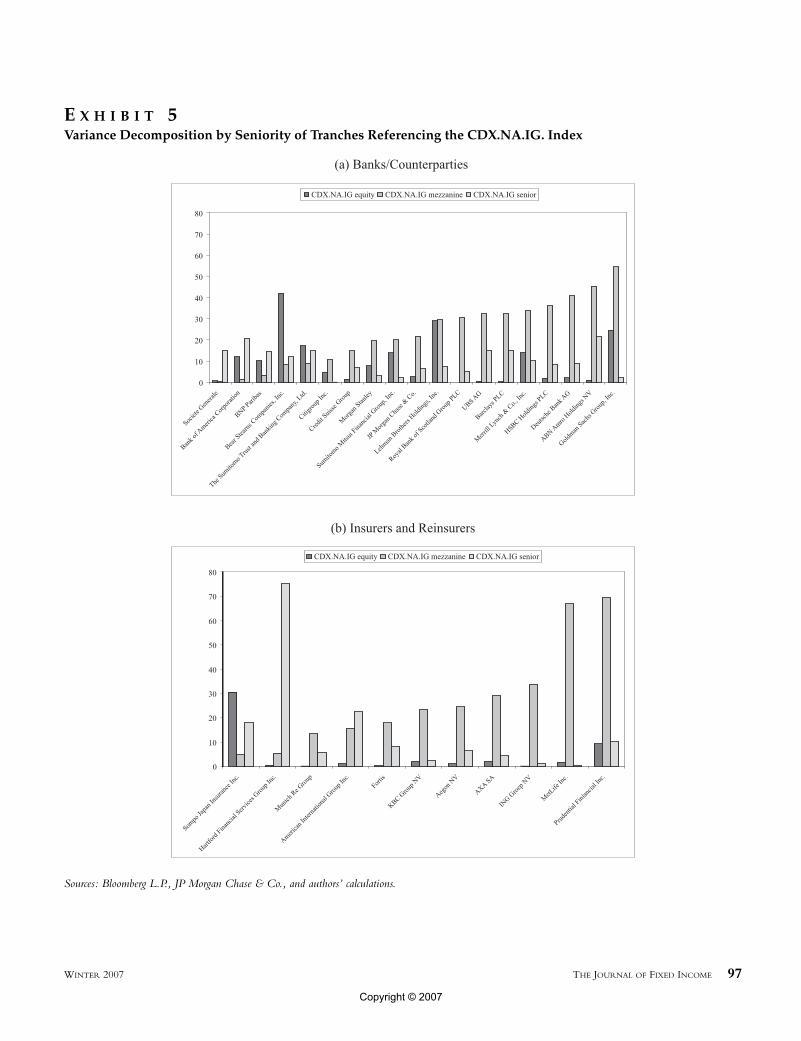
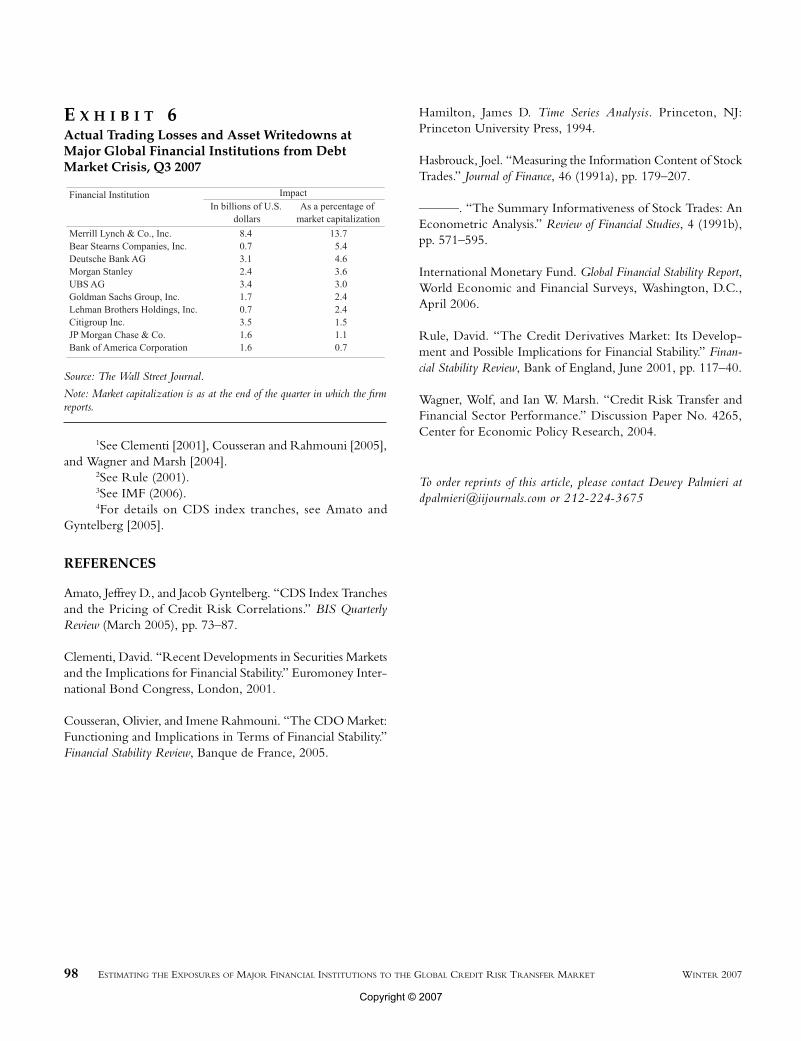
Financial institutions seem to be more exposed tomezzanine CDX tranches. Specifically, stock price returnvolatility for two-thirds of our sample institutions isexplained by the CDX mezzanine tranche (Exhibit 5).However, the volatility analysis suggests that three U.S.institutions—Bear Stearns, Lehman Brothers, and MerrillLynch—may be most exposed to the equity CDX tranche.The market’s overall perceptions of the riskiness of theseindividual institutions’ exposures to credit derivativesappear to have been broadly accurate based on reportedevidence from the recent turmoil in global credit markets
92 ESTIMATING THE EXPOSURES OF MAJOR FINANCIAL INSTITUTIONS TO THE GLOBAL CREDIT RISK TRANSFER MARKET WINTER 2007
Copyright © 2007
WINTER 2007 THE JOURNAL OF FIXED INCOME 93
Sour
ces:
Blo
ombe
rgL
.P.,
JPM
orga
nC
hase
&C
o.,
and
auth
ors’
calcu
latio
ns.
Not
e:Fo
reac
hin
stitu
tion,
inea
chin
dex,
we
high
light
both
the
tranc
heco
ntrib
utin
gth
ehi
ghes
tvol
atili
tyan
dth
ose
cont
ribut
ing
10%
orm
ore
toth
evo
latil
ityof
the
resp
ectiv
esto
ckpr
icere
turn
s.
EX
HI
BI
T1
Imp
acto
fV
olat
ilit
yin
the
Maj
orC
red
itD
eriv
ativ
esM
ark
ets
onK
eyP
arti
cip
ants
,Nov
emb
er14
,200
3–Fe
bru
ary
1,20
07(I
np
erce
nt)
Copyright © 2007
(Exhibit 6). Japanese institutions also appear to have largeexposures to volatility in the equity CDX tranche. Inter-estingly, the results also suggest that almost all insurers/rein-surers prefer the riskiest CDX tranches, notwithstandingthe fact that the equity and mezzanine tranches of thisindex have been more volatile than the correspondingones referencing the iTRAXX Europe IG.
Intuitively, the extent to which tranche volatilityexplains innovations in the stock price return volatilityof our sample financial institutions may seem ratherextreme. In some cases, the former appears to accountfor more than 60% of the volatility in the latter. One pos-sible explanation is that the data may also be capturing theriskiness of banks’ loan books or the riskiness of insurers’debt portfolios. If so, our results are even more attractivein that they reveal financial institutions’ broader expo-sures to credit risk.
CONCLUSION
The ability to trade credit risk in financial marketshas facilitated the diversification of risk across financialand other sectors, and has changed risk management prac-tices. Theoretically, the increasing availability of CRTinstruments and techniques should be positive for overallfinancial stability and efficiency of intermediation. How-ever, increased interlinkages among financial institutionsacross the different financial segments—sometimes throughthese very risk transfer instruments—means that an
otherwise isolated major shock in the credit markets couldpotentially result in substantial and widespread losses. Forinstance, the recent losses incurred worldwide by finan-cial institutions in the aftermath of the subprime crisis inthe U.S. in mid-2007 suggest that this is a very validconcern.
The rapid growth of CRT markets poses significantchallenges for both national authorities and market par-ticipants. In this quickly expanding and innovating market,national authorities are hard pressed to ensure adequateregulation, supervision, and surveillance, while encour-aging further growth and development. Issues such as thecapacity of infrastructure, adequacy of reporting standards,and risk management capabilities of participating institu-tions are foremost considerations in these areas. For pri-vate sector participants, assessing counterparty risk remainsa challenge, because it is impossible to measure the extentof an institution’s CRT operations, especially in the creditderivatives market.
This article proposes a vector autoregression (VAR)framework for estimating the relative riskiness of creditderivative exposures of the major global banks and insurersusing daily stock price and standardized STCDO spreaddata. The framework is applied to a worldwide sample ofsome of the largest financial institutions involved in theCRT market. We find several key trends in the globalcredit derivatives market. There is a clear home bias effectin that financial institutions appear to be more exposedto credit derivatives referencing firms in their own regionof domicile. Financial institutions tend to have their biggestexposures to senior and super-senior tranches referencingthe iTRAXX Europe IG index, but they are most exposedto the mezzanine tranches referencing the CDX.NA.IGindex. Certain institutions appear to be more exposed tothe riskier tranches on both indices. Given that our resultsbroadly are supported by out-of-sample evidence fromthe recent turmoil in global credit markets, we suggestthat our framework may be useful as a surveillance toolin capturing the riskiness of overall credit exposures offinancial institutions.
ENDNOTES
The authors would like to thank James Hamilton for hishelpful advice. Any error or omission remains the sole respon-sibility of the authors. The views expressed in this article arethose of the author(s) and do not necessarily represent those oftheir employers.
94 ESTIMATING THE EXPOSURES OF MAJOR FINANCIAL INSTITUTIONS TO THE GLOBAL CREDIT RISK TRANSFER MARKET WINTER 2007
E X H I B I T 2Standardized Single-Tranche CDO Contracts: Sum-mary Statistics, November 14, 2003–February 1, 2007
Sources: JP Morgan Chase & Co. and authors’ calculations.
Note: The equity tranche is quoted as upfront premium plus 500 bpsrunning spread.
Copyright © 2007

WINTER 2007 THE JOURNAL OF FIXED INCOME 95
E X H I B I T 3Variance Decomposition by Market
Sources: Bloomberg L.P., JP Morgan Chase & Co., and authors’ calculations.
Copyright © 2007

96 ESTIMATING THE EXPOSURES OF MAJOR FINANCIAL INSTITUTIONS TO THE GLOBAL CREDIT RISK TRANSFER MARKET WINTER 2007
E X H I B I T 4Variance Decomposition Seniority of Tranches Referencing the iTRAXX Europe IG Index
Sources: Bloomberg L.P., JP Morgan Chase & Co., and authors’ calculations.
Copyright © 2007
WINTER 2007 THE JOURNAL OF FIXED INCOME 97
E X H I B I T 5Variance Decomposition by Seniority of Tranches Referencing the CDX.NA.IG. Index
Sources: Bloomberg L.P., JP Morgan Chase & Co., and authors’ calculations.
Copyright © 2007
1See Clementi [2001], Cousseran and Rahmouni [2005],and Wagner and Marsh [2004].
2See Rule (2001).3See IMF (2006).4For details on CDS index tranches, see Amato and
Gyntelberg [2005].
REFERENCES
Amato, Jeffrey D., and Jacob Gyntelberg. “CDS Index Tranchesand the Pricing of Credit Risk Correlations.” BIS QuarterlyReview (March 2005), pp. 73–87.
Clementi, David. “Recent Developments in Securities Marketsand the Implications for Financial Stability.” Euromoney Inter-national Bond Congress, London, 2001.
Cousseran, Olivier, and Imene Rahmouni. “The CDO Market:Functioning and Implications in Terms of Financial Stability.”Financial Stability Review, Banque de France, 2005.
Hamilton, James D. Time Series Analysis. Princeton, NJ:Princeton University Press, 1994.
Hasbrouck, Joel. “Measuring the Information Content of StockTrades.” Journal of Finance, 46 (1991a), pp. 179–207.
———. “The Summary Informativeness of Stock Trades: AnEconometric Analysis.” Review of Financial Studies, 4 (1991b),pp. 571–595.
International Monetary Fund. Global Financial Stability Report,World Economic and Financial Surveys, Washington, D.C.,April 2006.
Rule, David. “The Credit Derivatives Market: Its Develop-ment and Possible Implications for Financial Stability.” Finan-cial Stability Review, Bank of England, June 2001, pp. 117–40.
Wagner, Wolf, and Ian W. Marsh. “Credit Risk Transfer andFinancial Sector Performance.” Discussion Paper No. 4265,Center for Economic Policy Research, 2004.
To order reprints of this article, please contact Dewey Palmieri [email protected] or 212-224-3675
98 ESTIMATING THE EXPOSURES OF MAJOR FINANCIAL INSTITUTIONS TO THE GLOBAL CREDIT RISK TRANSFER MARKET WINTER 2007
E X H I B I T 6Actual Trading Losses and Asset Writedowns atMajor Global Financial Institutions from DebtMarket Crisis, Q3 2007
Source: The Wall Street Journal.
Note: Market capitalization is as at the end of the quarter in which the firmreports.
Copyright © 2007