estimating revenue-capture potential associated with...
TRANSCRIPT

Journal of Agricultural and Resource Economics, 19(1): 89-101Copyright 1994 Western Agricultural Economics Association
Estimating Revenue-Capture Potential Associatedwith Public Area Recreation
R. Jeff Teasley, John C. Bergstrom, and H. Ken Cordell
A traditional contingent valuation approach and the "trip response method"were examined as potential techniques for measuring public area recreationrevenue-capture potential. Empirical results suggest that both methods areuseful for assessing revenue-capture potential. Additional research on alter-native methods for assessing recreation revenue-capture potential is encour-aged.
Key words: nonmarket valuation, public land management, resource econom-ics.
Introduction
As a result of increased recreational demand and reduced management budgets, publicresource management agencies are taking longer looks at the revenue-capture potentialof recreational areas and facilities. This article focuses on developing techniques formeasuring revenue-capture potential via alternative user fee mechanisms. The articleopens with a conceptual background of willingness to pay, consumer surplus, and revenuecapture. An empirical case study is then presented including model specifications, datacollection procedures, and estimation results. General implications of this research arediscussed last.
Conceptual Background
Revenue Capture
Revenue capture by a resource management agency implies acquiring funds from con-sumers/users. The focus of this article is on potential revenue capture from recreationalconsumers/users of public lands (e.g., national forests). In most cases, additional fundsare gained by raising the price of using a recreational site or instituting a different feestructure. The general objective of changing prices or fee structures is to obtain or "capture"more of the recreational users' consumer surplus.
Referring to figure 1, at trip quantity level Q1 and price level P1, consumer surplus isequal to the area Plac. Revenues accruing to the managing agency are equal to the areaPcfT. This area is the rectangle with edges bounding T (out-of-pocket travel expenditures)and P1 (total trip expenditures). The current site use fee equals P1 - T.
Raising the site use fee to (P2 - T) reduces consumer's surplus to the triangle P2ab. Alarge portion of the lost consumer's surplus (P2bcP,) is captured by the managing agencyin the form of additional revenues equal to area P2beP,. However, the agency also losesrevenues equal to area ecfg because of the trip decrease from Q1 to Q2.
R. Jeff Teasley and John C. Bergstrom are research coordinator and associate professor, respectively, in theDepartment of Agricultural and Applied Economics, University of Georgia. H. Ken Cordell is a research socialscientist at the Southeastern Experiment Station, U.S. Forest Service, University of Georgia campus.
89

Journal of Agricultural and Resource Economics
$Price
P2
P1T
-~ ....... , , · " '
Figure 1. Increasing existing fee amounts
The total revenue received by the agency at the higher site use fee is equal to the areaP2bgT. Note that the small triangle bee is not captured with the increase in fees. This areais termed deadweight loss and is, as the name implies, lost to both the managing agencyand consumer when price is raised to P2. While this deadweight loss is important in socialwelfare considerations, as long as the gain in revenues (P2bePl) is greater than the loss(ecfg), increasing the site use fee will increase revenues at a site. When increasing site usefees decrease total revenues, the site or area has moved into a different elasticity portionof the demand curve. Revenue can be collected by any number of methods. Daily ad-mission passes, vehicle admission fees, hotel taxes, local guide services, and the estab-lishment of special funds for maintenance of recreational areas are a few possible strategiesfor revenue capture (Price; Walsh; Loomis and Thomas).
In order to assess revenue-capture potential under different payment strategies, somegeneral tools must be available for estimating consumer surplus, or willingness to pay(WTP), associated with recreation trips. One such tool is a bid probability function,estimated using the contingent valuation method. Another such tool is a site demandfunction, estimated by using what is termed in this article as the trip response method.A few other studies were found in the search of literature that have used methods somewhatsimilar to the one presented here (see Loomis; Ward). In the case of Loomis' article, therewas no estimation of demand or valuation included. Ward's study was very similar butperformed no revenue-capture simulations.
Bid Probability Estimation Using the ContingentValuation Method (CVM)
The specific form of the contingent valuation method used in this study was the dichot-omous choice approach (DCA). This technique was first used by Bishop and Heberleinin 1979 in the valuation of "extra" market goods (e.g., environmental amenities). The
90 July 1994
3s)

Revenue-Capture Potential of Public Area Recreation 91
technique subsequently has been developed and expanded upon to value a variety ofnonmarketed goods (Cameron; Sellar, Chavas, and Stoll; McConnell; Bowker and Stoll;Hanemann). The application of this technique involves the construction of a hypotheticalmarket or referendum (like any other CVM application) where respondents are asked toanswer "yes" or "no" to a single dollar amount or posted price. The strength of the DCAis its simplistic nature and ease of implementation in a survey format. The closed-endedformat is also argued to be more "market like" in that respondents can either "take it orleave it." Respondents likely are more accustomed to seeing market decisions in thisformat (McConnell).
As many authors have argued, valuation measures attained through contingent valuationstudies have both theoretical validity and consistency with market demand-based values(Cummings, Brookshire, and Schulze; Bergstrom; Walsh). The ability of the CVM tech-nique to provide estimates of willingness to pay makes it a very useful tool to employ forthe valuation of recreation. Managers of recreation resources can use these values as abase for funding plans as well as implementing charging schemes.
Let a consumer's underlying utility function be specified as:
(1) Ui= Ui(Gj , Qj I S),where Gj = market commodity j (j 1,..., n); Vj = recreation trip j (j = 1, ... , m);Qj = quality ofjth recreational trip; and S = vector of socioeconomic characteristics.
The consumer's budget constraint is given by:
(2) Mi - PjGj + CjVj,
where Mi = consumer's annual monetary income, Pj = price or cost of market commodities,and Cj = price or cost of recreational trips. We assume that the budget constraint accountsfor the opportunity cost of time involved in obtaining Gj or Vj. For regular marketcommodities, the opportunity cost of time involved in obtaining the commodity (e.g.,travel costs to the local hardware store) are relatively low and usually ignored. In the caseof recreational trips, however, the opportunity cost of time (e.g., travel costs to a nationalforest recreation site) are relatively high and therefore cannot be ignored.
The solution to the consumer's problem of maximizing (1) with respect to (2) is anindirect utility function of the form:
(3) Vi = i(Pj, j, Qj, Mi I S).
Equation (3) can be used to model the probability that a consumer is willing to pay a newuser fee (Fj) associated with recreation trips. The consumer will pay the given fee (Fj) if:
(4) VJ(Pj, Cj, + Fj, Qj, Mi) > Vi(Pj, C;, Qj, Mi),where Cj is the "choke" price for recreation trips (implying no access).
Following Hanemann, the probability that a consumer is willing to pay Fj can be specifiedgenerally by:
(5) PROB = f(A ),where PROB is the probability that a consumer is willing to pay a given fee, Fj, and A U= Vi(Pj, Cj + Fj, Qj, M S) - Vi(Pj, C;, Qj, M, S). Mean willingness to pay can beestimated from equation (5) using procedures established by Hanemann or Cameron.
Site Demand Function Estimation Using the Trip Response Method
In addition to the bid probability function, another useful tool for the resource managerwould be a site demand function which shows the relationship between user fees and tripsdemanded. Such a demand function would allow managers to estimate changes in visi-tation, revenue-capture potential, revenues collected as a result of different fee structures,and demand elasticities (Mitchell and Carson; Sellar, Chavas, and Stoll; McConnell;Cameron). In traditional travel cost method (TCM) studies, this site demand function is
Teasley, Bergstrom, and Cordell

Journal of Agricultural and Resource Economics
estimated indirectly from a "first-stage" demand function for trips, and is termed the"second-stage" demand function (Walsh).
In this study, the trip response method (TRM) was used to directly estimate the "second-stage" site demand function. In the TRM, survey respondents are given a hypotheticaluser fee amount and asked to state how many trips they would make to the site at thatfee amount. Fee amounts are varied across the sample to obtain the data necessary foreconometrically estimating a site demand function.
The theoretical basis for the TRM parallels the traditional travel cost method. In thisstudy, the underlying utility function and budget constraint for individual i for the TRMare also given by (1) and (2), with the same solution for the indirect utility function givenby (3). Using Roy's Identity, the consumer's Marshallian demand function for recreationtrips can be derived from (3) and expressed in general form as:
(6) Vi = f(Cq, M,, S),
where all variables are as defined previously. Equation (6) gives the consumer's "first-stage" demand function as defined in traditional travel cost literature (e.g., see Ward andLoomis). The total number of trips a consumer would take if the cost of trips increasedby a given user fee (Fj) is given by:
(7) Vi = f(Cj + F, Mi, S).
The data generated by substituting various values for Fj into (7) and solving for totaltrips can be used to drive the consumer's "second-stage" demand function:
(8) Vi = f(Fj, Mi, S).
The "second-stage" demand functions show the number of trips a consumer is expectedto take to a site given "added costs" for a trip, such as increased user fees (Ward andLoomis). Mean WTP estimates, both the consumers' surplus approximation and the moreexact compensating variation measure, can be calculated from (8) following proceduresfound in LaFrance, or LaFrance and Hanemann.
Empirical Case Study
Study Area, Design, and Procedures
The general study area for our empirical case study was in two national forests in thesoutheast, the Cherokee (CK) and the George Washington (GW), in the Ocoee and WarmSprings districts, respectively. CK and GW forest managers are interested in informationconcerning revenue-capture potential associated with recreation fees. The issue has cometo the forefront as a result of increased opposition to below-cost timber sales and thedesire to explore alternative revenue sources.
A questionnaire was designed to collect the data necessary for estimating a CVM-basedbid probability function, and a TRM-based site demand function. The CVM valuationquestion used the dichotomous-choice approach with an annual vehicle pass as the bidvehicle. The annual vehicle pass would allow everyone in a vehicle to use sites in thedistrict throughout the year. Respondents were asked to reply "yes" or "no" to a specificfee (annual pass) amount, with the assumption that a "no" response would preclude themfrom recreating in the district in question. The TRM valuation question asked for thenumber of trips the respondent would take to a specific site in a district, given a daily,per person admission fee.
Both questions were asked on-site in face-to-face interviews and were included as partof a larger survey obtaining use, satisfaction, and demographic information. Interviewerswere instructed to be completely neutral in delivery and to give a minimum of extraneousinformation concerning the question. In order to gain more complete knowledge of their
92 July 1994

Revenue-Capture Potential of Public Area Recreation 93
Table 1. Definitions of Variables Used in the Bid ProbabilityFunction Modeling and TRM Modeling
Variable Variable Definition
Quality/Perceptions:SFA VOR Rating of the site as a favorite place to recreateLSFA VOR Natural log of SFA VOR
Information:AGEEXP A ratio of SITEEXP/AAGEINT (ratio takes years
of experience with the specific forest district anddivides by the age of the respondent)
LAGEEXP Natural log of AGEEXPNUMBER Number in householdLNUMBER Natural log of NUMBER
Preferences:INCOME Annual household incomeLINCOME Natural log of INCOME
Substitutes:DUMMY A 0, 1 dummy variable designed to represent
whether the respondent had listed a substitute site
National Forests:FOREST A 0, 1 dummy variable designed to designate one
forest from the other
stay, interviews were conducted only with those recreationists who were leaving the area.The CVM and TRM valuation questions are reproduced in the appendix.
Model Specification
In order to estimate a bid probability function from the dichotomous-choice CVM data,a logit function was specified (9) following procedures established by Hanemann, andSellar, Chavas, and Stoll:
(9) y= 11 + e(-AU) '
where Y = 1 if a respondent (representing the group in the vehicle) answered "yes" to thevaluation question, and Y = 0 if he or she answered "no." In (9), AU was approximated by:
(10) AU= a + f 1LBID + f 2LAGEEXP + J3LNUMBER + f 4LINCOME+ sLSFAVOR + f 6FOREST,
where LBID is the natural log of the price of the annual vehicle pass. Other independentvariables are defined in table 1. Expected values of PROB were attained using the nor-malization procedure suggested by Boyle, Welsh, and Bishop.
The TRM model was specified as:
(11) logQ = a + -yBID + y2AGEEXP + y3NUMBER + y4INCOME+ y 5SFAVOR + 76FOREST + yy7DUMMY,
where logQ is the natural log of the number of trips a respondent reported he or she wouldtake at the daily admission fee denoted by BID. Previous studies suggest that a theoreticallyappropriate and empirically strong functional form for TCM demand equations is a log-dependent form (Ziemer, Musser, and Hill). This functional form was therefore selectedfor (11). Other independent variables are defined in table 1.
Teasley, Bergstrom, and Cordell
Journal of Agricultural and Resource Economics
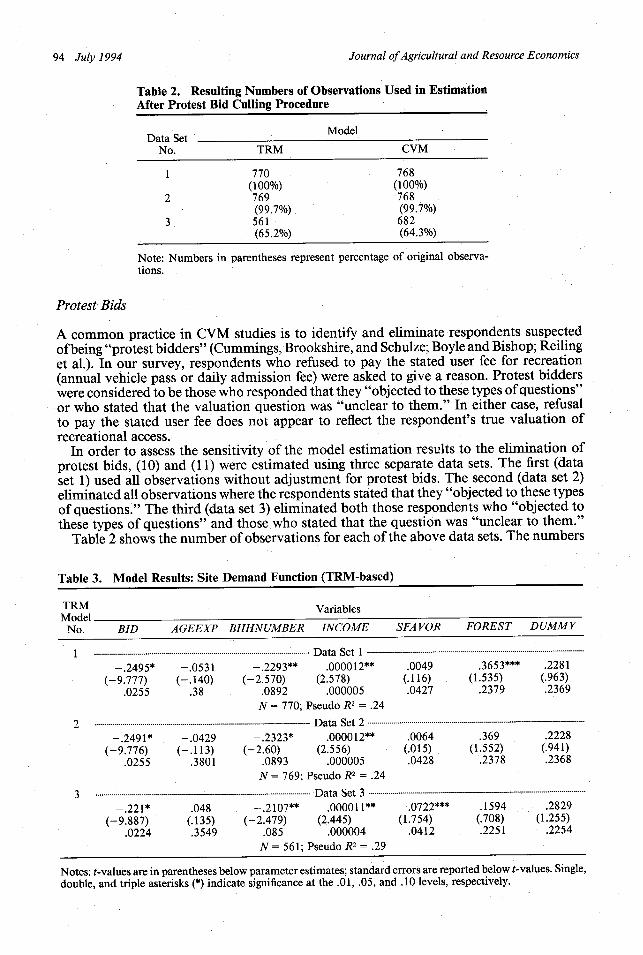
Table 2. Resulting Numbers of Observations Used in EstimationAfter Protest Bid Culling Procedure
ModelData Set Mo
No. TRM CVM
1 770 768(100%) (100%)
2 769 768(99.7%) (99.7%)
3 561 682(65.2%) (64.3%)
Note: Numbers in parentheses represent percentage of original observa-tions.
Protest Bids
A common practice in CVM studies is to identify and eliminate respondents suspectedof being "protest bidders" (Cummings, Brookshire, and Schulze; Boyle and Bishop; Reilinget al.). In our survey, respondents who refused to pay the stated user fee for recreation(annual vehicle pass or daily admission fee) were asked to give a reason. Protest bidderswere considered to be those who responded that they "objected to these types of questions"or who stated that the valuation question was "unclear to them." In either case, refusalto pay the stated user fee does not appear to reflect the respondent's true valuation ofrecreational access.
In order to assess the sensitivity of the model estimation results to the elimination ofprotest bids, (10) and (11) were estimated using three separate data sets. The first (dataset 1) used all observations without adjustment for protest bids. The second (data set 2)eliminated all observations where the respondents stated that they "objected to these typesof questions." The third (data set 3) eliminated both those respondents who "objected tothese types of questions" and those who stated that the question was "unclear to them."
Table 2 shows the number of observations for each of the above data sets. The numbers
Table 3. Model Results: Site Demand Function (TRM-based)
Variables
BID AGEEXP BHHNUMBER INCOME
-. 2495* -. 0531 -. 2293**(-9.777) (-.140) (-2.570)
.0255 .38 .0892N= 770; P
............................................................................................................
-. 2491* -. 0429 -. 2323*(-9.776) (-.113) (-2.60)
.0255 .3801 .0893N= 769; P
............................................................................................................
-. 221*(-9.887)
.0224
.048(.135).3549
Data Set 1.000012*
(2.578).000005
'seudo R2 =
Data Set 2.000012'
(2.556).000005
Pseudo R2 =
Data Set 3
-. 2107** .000011**(-2.479) (2.445)
.085 .000004N = 561; Pseudo R2 = .29
SFA VOR FOREST DUMMY
I* .0049 .3653*** .2281(.116) (1.535) (.963).0427 .2379 .2369
.24.............................................................................................................
c* .0064 .369 .2228(.015) (1.552) (.941).0428 .2378 .2368
.24.............................................................................................................
.0722***(1.754)
.0412
.1594(.708).2251
.2829(1.255)
.2254
Notes: t-values are in parentheses below parameter estimates; standard errors are reported below t-values. Single,
double, and triple asterisks (*) indicate significance at the .01, .05, and .10 levels, respectively.
TRMModel
No.
1
2
3
94 July 1994

Revenue-Capture Potential of Public Area Recreation 95
Table 4. Model Results: Bid Probability Function (CVM-based)
CVM -VariablesModelNo. LBID LAGEEXP LNUMBER LINCOME LSFA VOR FOREST
1 . ---------------------------------------------------------------------------------------------------------- D ata Set 1 -----------------------------------------. 9318* -. 0147 -. 1089 -. 0295 1.5256* .1696
(-13.325) (-.184) (-.584) (-.347) (3.769) (.955).0699 .0798 .1865 .0849 .4048 .1777
N 768; McFadden R2 = .26
2 ..---------------------------------------------------------------- Data Set 2.-----------------Data Set 2..--------------------------------- ------------. 9318* -. 0147 -. 1089 -. 0295 1.5256* .1696
(-13.325) (-.184) (-.584) (-.347) (3.769) (.955).0699 .0798 .1865 .0849 .4048 .1777
N = 768; McFadden R2 = .26
3 ------------....----- ------------------- Data-Set 3. .......................................-. 9903* .0622 -. 0778 .029 1.5501* -. 0005
(-12.618) (.723) (-.383) (.311) (3.485) (-.002).0785 .0859 .2031 .0931 .4447 .1942
N = 682; McFadden R2 = .27
Notes: t-values are in parentheses below parameter estimates; standard errors are reported below t-values. Anasterisk (*) represents significance at the .01 level.
in parentheses below the total for each data set represent the percentage of observationsleft after protest bid elimination. As shown, the number of observations in data sets 1and 2 were very close. The largest drop in observations for both methods occurred withdata set 3, which included the elimination of respondents who said the valuation questionwas "unclear to them."
Estimation Results
The model estimation results achieved with each of the three different data sets describedabove are presented in tables 3 and 4. The TRM-based site demand function in (11) wasestimated using TOBIT analysis.1 The demand function results fit well with coefficientestimates having expected signs and fairly high levels of statistical significance. The logitfunction in (10) was estimated using logistic regression. All the estimated coefficients hadexpected signs. Only LBID and LSFA VOR, however, were statistically significant. Thepercent of values correctly predicted by this model was 77.3. Results of the third data setestimation procedure for both models were deemed to be "tighter" than the previous two.Therefore, for the purpose of the following applications, the third data set estimationresults for each model were used.
All models displayed low R2 values. This result seems to be in keeping with many CVMstudies (Stevens et al.; Boyle and Bishop; Bergstrom et al.; Cordell and Bergstrom). Pre-dictive power of the models was fairly high, however, as noted above.
Table 5. WTP Values for Each Forest by Data Set
CVM
Data Set GeorgeNo. Washington Cherokee
1 $45.39 $50.042 45.39 50.043 55.14 55.12
Teasley, Bergstrom, and Cordell

Journal of Agricultural and Resource Economics
Table 6. Consumer's Surplus and Compensating Variation Valuesfor Each Forest by Data Set for TRM Estimation
TRMData George Washington Cherokee
SetNo. CS CV CS CV
1 $3.56 $3.67 $5.12 $5.332 3.30 3.29 4.78 4.763 7.69 7.72 9.02 9.06
WTP values for the logit model were calculated using the trapezoidal rule of integrationunder the estimated logit function. The results of this procedure for each forest are pre-sented in table 5. WTP values for the TOBIT estimation (TRM) followed proceduressuggested in LaFrance and Hanemann, and LaFrance. In addition to consumer's surplusestimates, compensating variation estimates were calculated for comparison purposes.These results for each forest are presented in table 6. Because compensating variation isan exact welfare measure and consumer's surplus is an approximation, one would expectthe two values to be somewhat divergent. As the results in table 6 attest, the two valuesare very similar. The two measures are conceptually the same only if the income effectsof the price change are zero (LaFrance and Hanemann). The TRM produced estimatesof annual WTP for a site, and the CVM produced estimates of annual WTP for a district.
Elimination of protest bids did little to change valuation results. In all cases, WTP roseslightly (due, in part, to the omission of zero responses). Estimation results over both logitand TOBIT procedures "tightened" (i.e., significance levels rose and standard errorsdecreased for the TOBIT results) and explanatory power rose.
Revenue-Capture Potential
The overall purpose of this research was to provide the U.S. Forest Service with infor-mation about techniques for assessing total revenue-capture potential, and to suggestspecific fee collection strategies which might be used to capture some of this revenue. Aswith most state and federal agencies, budgets are being cut and spending for specific areasis being examined scrutinously. Many of the recreation opportunities provided by theForest Service (e.g., camping areas, hiking trails, lake beach areas, picnic areas, etc.) areprovided at little or no cost to the user. As a result, these opportunities are financed bygeneral tax revenues and not by those who use the resources directly. As budgets havetightened and opposing uses have been questioned (i.e., timber production vs. recreation),Forest Service managers have become more interested in the potential of recreation to atleast be self-supporting.
The estimated site demand function was applied to assess revenue-capture potentialusing a daily admission fee. The estimated bid probability function was applied to assessrevenue-capture potential using an annual vehicle pass. The use of these techniques toassess revenue-capture potential is demonstrated below through an application to hypo-thetical visitor use data for the Warm Springs district of the GW National Forest.
Annual District Vehicle Pass. The CVM results were first used to estimate the levels ofparticipation in table 7. Specifically, for the GW National Forest, means were calculatedfor all of the variables in (10) except LBID. Multiplying these variable means by theircorresponding model coefficient and then summing produces a constant term which canbe inserted into equation (12), which was specified as:
(12) Z=^( ~12 2 ~) ~Z =
-1 + e- -(a+ 11n(F))
where Z is the probability that a typical group is willing to pay the annual vehicle pass,
96 July 1994

Revenue-Capture Potential of Public Area Recreation 97
Table 7. Example of Probability of Typical Groups Being Willingto Pay Fee Price for the District
Annual VehicleFee Price
($)
1257.5
101525456585
110150
Groups Willingto Pay Fee
(%)
96.192.583.172.570.460.546.128.618.411.7
5.90
a is the composite constant term, f3 is the coefficient on the fee variable, and ln(F) is thelogged fee amount. Equation (12) is a reduced version of (9). Plugging in values for F andsolving produced estimates of Z at various fee amounts. Table 7 shows the differingprobabilities of a typical group being willing to pay for an annual vehicle pass as estimatedby (12) for the GW National Forest.
The total revenue-capture potential for the district then can be estimated by the equation:
(13) REVENUE = FEE x Z x G,
where REVENUE = revenue for district, FEE = proposed annual fee, Z = probabilitythat typical group is willing to pay fee (see table 7), and G = estimate of annual numberof groups currently visiting the district.
In equation (13) above, G can be estimated by dividing an estimate of annual groupvisits (e.g., vehicle counts) by an estimate of annual visits per group (for example, 7). Asan exercise, consider the following example. With an annual vehicle count of 200,000(V), G is 28,571 (200,000/7 = 28,571). Therefore, using equation (13) in conjunction withthe percentages found in table 7, we can estimate possible revenue-capture amounts at
Table 8. Example of Estimated Revenue-Capture Potential forAnnual Vehicle Pass
Percent of No. of GroupsAnnual Groups Currently Annual
Fee Willing to Visiting Revenue($) Pay Fee the District ($)
FEE x P x G = RE VENUE
1 96.1 28,571 27,4572 92.5 28,571 52,8565 83.1 28,571 118,7127.5 72.5 28,571 115,355
10 70.4 28,571 201,14015 60.5 28,571 259,28225 46.1 28,571 329,28145 28.6 28,571 367,70965 18.4 28,571 341,70985 11.7 28,571 284,139
110 5.9 28,571 185,425150 0 28,571 0
-
Teasley, Bergstrom, and Cordell

Journal of Agricultural and Resource Economics
Table 9. Example of Percentage Reduction in Annual Trips perDaily Fee Levels for the Site
Daily Fee Price Levels($)
Reduction in Trips to Site(%)
1 96.11.5 92.52 83.13 72.55 70.47.5 60.5
10 46.112.5 28.615 18.420 11.725 5.935 0
varying fee rates. The results in table 8 suggest that district revenue would be maximizedby setting the annual vehicle fee at about $45 per year.
Daily Site Admission Fee. Unlike the annual vehicle pass, the daily site admission feeis a charge per person per trip. Thus, the fee explicitly increases the price per trip paid byeach visitor. Demand theory suggests that as the price per trip increases, trips demandedshould decrease. Results of the TRM were used to estimate the percentage reduction inperson visits. Equation (11) was evaluated using the means of each variable multipliedby their corresponding coefficient. This resulted in the constant term R which representsthe percentage reduction in visits for a typical visitor. Table 9 shows the percentagereduction in person visits to sites which would be caused by various daily admission fees.
Total revenue-capture potential for a particular site then can be estimated by:
(14) REVENUE = FEE x (1 - R) x V,
where REVENUE = revenue for a site, FEE = proposed daily admission fee, R =percentage reduction in person visits at each fee level (see table 9), and V = estimate ofcurrent annual person visits to site (or number of group visits x persons per group).
Again, as an exercise, consider the example below. With annual visitation of 100,000
Table 10. Example of Estimated Revenue-Capture Potential forthe Daily Admission Fee
Percent of EstimatedOriginal Current Annual
Daily Fee Trips to Visitation Revenue($) Site to the Site ($)
FEE x (1 - R) x V = REVENUE
1 .802 100,000 80,2001.5 .718 100,000 107,7002 .645 100,000 129,8003 .515 100,000 154,5005 .333 100,000 166,5007.5 .192 100,000 144,000
10 .109 100,000 109,00012.5 .062 100,000 77,50015 .036 100,000 54,80020 .01 100,000 20,00025 .005 100,000 12,50035 .0004 100,000 1,400
98 July 1994
Revenue-Capture Potential of Public Area Recreation 99
to a site (V) and reductions in number of trips by fee charged (R), as listed in table 9, weobtain the results shown in table 10. Note in table 10 that revenue would be maximizedat a daily site admission fee of about $5 per person.
Implications
Clearly, the two revenue-capture strategies can produce differing amounts of revenuepotential. Using pure revenue-capture maximization as the decision rule in our GWNational Forest example, the annual vehicle pass would be set at $45 and the dailyadmission pass at $5. However, managers may be constrained legally by the amountsthey can charge or by equity considerations. Setting a daily admission pass of $5 wouldprice an estimated 67% of trips by current users out of the market. This result may notbe desirable from an equity (or public relations) standpoint, especially considering that anational forest is publicly owned. On the other hand, the annual vehicle pass would reducegroups using the forest district by 71%. Visitation objectives and guidelines under whichmanagers operate will affect the revenue-capture strategy at a particular recreation site orarea.
The large estimated reduction of use seen from instituting fees might be explained inseveral ways. One could be that there are currently no entry fees in place, outside ofdeveloped camping sites, at either of the areas. Thus, instituting a fee where previouslythere was none creates resistance to that institution, possibly in the form of lower numbersof trips.2 Also, because there are no current fees, the reaction of users to the initiation ofa fee could be causing the high elasticity responses we see. Demand response might notbe as elastic if there were some type of fee structure already in place.
The fact that expected visitation appears sensitive to the type of fee payment schemeused is not a surprising result. For example, respondents may take as many trips after alump sum payment, such as an annual vehicle pass, as they would have taken withoutone. Arguments against this hypothesis consider that respondents may amortize the lumpsum payment over a year's trips and adjust trips accordingly. A daily pass results in anexplicit increase in the price per trip, which in turn causes recreationists to adjust tripsdownward.
The differences between the two models also may be due to payment vehicle problems.Previous studies demonstrate that the type of payment vehicle used can influence valuationbehavior and results (Bergstrom and Stoll; Rowe and Chestnut; Schulze, d'Arge, andBrookshire). Different payment vehicles (e.g., entrance fees vs. increased taxes) may inducevarying levels of protest bidding which can affect values derived from contingent valuationstudies. Payment vehicle effects also may occur in the valuation estimation without beingmanifested in protest bidding. For example, if taxes are used, a respondent may quote a"low" WTP; this may be because the respondent thinks taxes are already too high, notnecessarily that the resource in question has low value (Peterson et al.).
It was conjectured that a TRM approach may provide a more neutral means of askingrevenue-capture questions in a survey format. One reason is that the framing of thequestion is more "market-like" in that respondents are given a price and asked for thequantity of trips they would consume. Also, TRM respondents are not asked to placedollar values on resources directly. Rather, they express it indirectly through the numberof trips they indicate they would take at a given price. The method still may be subjectto certain potential contingent valuation type biases (e.g., hypothetical bias and/or strategicbehavior), but may reduce the effect of other biases such as payment vehicle and startingpoint bias. More research is needed, however, before any firm conclusions can be drawnregarding the relative merits of traditional CVM questions where a consumer is given afixed quantity of a commodity and asked to value the commodity, in contrast to TRMquestions where a consumer is given a fixed price and asked to state the quantity he orshe would "purchase" at that price. An interesting aspect of the trip response model isthat the results (the second-stage demand curve) can be directly compared to estimation
Teasley, Bergstrom, and Cordell

Journal ofAgricultural and Resource Economics
results of more traditional travel cost studies. This may lend itself to a kind of check forboth methods in comparing their respective resulting values. The estimated demand curvealso can produce estimates of elasticity which can be of help to recreation managers inthe pricing of a recreation area. Analyzing data with both methods (TRM and traditionalCVM) could make for interesting and useful future research.
[Received November 1992; final revision received August 1993.]
Notes
TOBIT analysis was used to handle the large proportion of legitimate "zero" observations reported for thedependent variable.
2 Here we are not talking about protest bidders as traditionally defined; rather, we speak of those who reporta lower number of trips purposely because they are resisting the institution of fees.
References
Bergstrom, J. C. "Welfare Measurement Concepts for Non-marketed Resources." Spec. Pub. No. 53, The GeorgiaAgr. Exp. Sta., University of Georgia, 1989.
Bergstrom, J. C., and J. R. Stoll. "Application of Experimental Economics Concepts and Precepts to CVM FieldSurvey Procedures." West. J. Agr. Econ. 14,1(1989):98-109.
Bergstrom, J. C., J. R. Stoll, J. P. Titre, and V. L. Wright. "Economic Value of Wetlands-Based Recreation."Ecological Econ. 2(1990): 129-47.
Bishop, R. G., and T. A. Heberlein. "Measuring Values of Extra-Market Goods: Are Indirect Measures Biased?"Amer. J. Environ. Econ. 61(1979):926-30.
Bowker, J. M., and J. R. Stoll. "Use of Dichotomous Choice Non-market Methods to Value the WhoopingCrane Resource." Amer. J. Agr. Econ. 70,1(1988):372-81.
Boyle, K. J., and R. C. Bishop. "Welfare Measurements Using Contingent Valuation: A Comparison of Tech-niques." Amer. J. Agr. Econ. 70,1(1988):20-28.
Boyle, K. J., M. P. Welsh, and R. C. Bishop. "Validation of Empirical Measures of Welfare Change: Comment."Land Econ. 64,1(1988):94-98.
Cameron, T. A. "A New Paradigm for Valuing Non-market Goods Using Referendum Data: Maximum Like-lihood Estimation by Censored Logistic Regression." J. Environ. Econ. Manage. 15(1988):355-79.
Cordell, H. K., and J. C. Bergstrom. "Comparison of Recreation Use Values Among Alternative ReservoirWater Level Management Scenarios." Water Resour. Res. 29,2(1993):247-58.
Cummings, R. G., D. S. Brookshire, and W. D. Schulze. Valuing Environmental Goods: An Assessment of theContingent Valuation Method. Totowa NJ: Rowan and Allanheld, 1986.
Hanemann, W. M. "Welfare Evaluations in Contingent Valuation Experiments with Discrete Responses." Amer.J. Agr. Econ. 66,3(1984):332-42.
LaFrance, J. T. "Incomplete Demand Systems and Semilogarithmic Demand Models." Aust. J. Agr. Econ.34,2(1990): 118-31.
LaFrance, J. T., and W. M. Hanemann. "The Dual Structure of Incomplete Demand Systems." Amer. J. Agr.Econ. 71,2(1989):262-74.
Loomis, J. B. "An Investigation into the Reliability of Intended Visitation Behavior." Environ. and Resour.Econ. 3(1993):25-33.
Loomis, J. B., and M. Thomas. "Pricing and Revenue Capture: Converting WTP into State and Private Revenue."Paper presented at Alaska Dept. of Fish and Game/Rocky Mountain Station Workshop, Juneau AK,September 1989.
McConnell, K. E. "Models for Referendum Data: The Structure of Discrete Choice Models for ContingentValuation." J. Environ. Econ. and Manage. 18(1990): 19-34.
Mitchell, R. C., and R. T. Carson. Using Surveys to Value Public Goods: The Contingent Valuation Method.Baltimore: Johns Hopkins University Press (for Resources for the Future), 1989.
Peterson, G. L., C. S. Swanson, D. W. McCollum, and M. H. Thomas. "Measuring Net Economic Value andRegional Economic Impact." In Valuing Wildlife Resources in Alaska, Ch. 6. Oxford: Westview Press, Inc.,1992.
Price, C. "Charging Versus Exclusion: Choice Between Recreation Management Tools." Environ. Manage.5,2(1990): 161-75.
Reiling, S. D., K. J. Boyle, H.-T. Cheng, and M. L. Phillips. "Contingent Valuation of a Public Program toControl Black Flies." Northeast. J. Agr. and Resour. Econ. 18,2(1989): 126-34.
Rowe, R. D., and L. G. Chestnut. "Valuing Environment Commodities: Revisited." Land Econ. 59,4(1983):404-10.
Schulze, W. D., R. C. d'Arge, and D. S. Brookshire. "Valuing Environmental Commodities: Some RecentExperiments." Land Econ. 57,2(1981): 151-72.
100 July 1994

Revenue-Capture Potential of Public Area Recreation 101
Sellar, C., J. P. Chavas, and J. R. Stoll. "Specification of the Logit Model: The Case of Valuation of Non-marketGoods." J. Environ. Econ. and Manage. 13(1986):382-90.
Stevens, T. H., R. Glass, T. More, and J. Echeverria. "Wildlife Recovery: Is Benefit-Cost Analysis Appropriate?"J. Environ. Manage. 33(1991):327-34.
Walsh, R. G. Recreation Economic Decisions Comparing Benefits and Costs. State College PA: Venture Pub-lishing, Inc., 1986.
Ward, F. A. "Economics of Water Allocation to Instream Uses in a Fully Appropriated River Basin: Evidencefrom a New Mexico Wild River." Water Resour. Res. 23,2(1987):381-92.
Ward, F. A., and J. B. Loomis. "The Travel Cost Demand Model as an Environmental Policy Assessment Tool:A Review of Literature." West. J. Agr. Econ. 11(1986):164-78.
Ziemer, R. F., W. N. Musser, and R. C. Hill. "Recreation Demand Equations: Functional Form and ConsumerSurplus." Amer. J. Agr. Econ. 62,1(1980):136-41.
Appendix
CVM Question
Suppose a type of pass was offered allowing you (and anyone in your vehicle) to visit any area operated by thisagency in (location) for one year. This pass would not cover camping fees. The money from the fee would beused to maintain these areas in their present condition, but there would be no improvements. If the price ofthis year's annual was $ , would you have bought one?
[ ] Yes If that fee were charged, about how many days would you use the site over the next 12 months?days
[ ] No If"No," then go to reasons below
[ ] We do not visit (location) enough to justify buying a pass
[ There are many other areas to visit besides (location)
[ We cannot afford to buy the pass
[ Question was not clear to me
[ I do not believe fees should be charged
[ Some other reason (specify)
TRM Question
Suppose the agency managing this site started charging a daily admission fee of $ /person. The moneyfrom the fee would be used to maintain the site in its present condition, but there would be no improvements.This fee would not cover camping fees. Would you continue to use the site?
[ ] Yes If that fee were charged, about how many days would you use the site over the next 12 months?days
[ ] No If"No," then go to reasons below
[ ] I do not visit this site enough to justify buying a pass
[ ] There are many other sites to visit besides this one
[ ] I cannot afford to buy the pass
[ ] Question was not clear to me
[ ] I do not believe fees should be charged
[ ] Some other reason (specify)
Teasley, Bergstrom, and Cordell