estimating primary production rates from photosynthetic ... · barranguet & kromkamp:...
TRANSCRIPT

MARINE ECOLOGY PROGRESS SERIESMar Ecol Prog Ser
Vol. 204: 39–52, 2000 Published October 5
INTRODUCTION
From estuarine ecosystem models (de Jong & deJonge 1995) it appears that microphytobenthos is animportant compartment, and is one of the principal
agents responsible for carbon input into the entiresystem (Sullivan & Montcreiff 1988). Its importance iswell documented and widely recognized (MacIntyre etal. 1996); but the appropriate methodology for measur-ing primary production of benthic microalgae is stillunder discussion (Revsbech et al. 1981, Underwood &Kromkamp 1999). The fast changes in productionrates, the marked rhythms in photosynthesis and verti-
© Inter-Research 2000
*Corresponding author. *E-mail: [email protected]. knaw.nl
Estimating primary production rates fromphotosynthetic electron transport in
estuarine microphytobenthos
Christiane Barranguet1, 2, Jacco Kromkamp1,*
1Netherlands Institute of Ecology, Centre for Coastal and Estuarine Ecology (NIOO-CEMO), PO Box 140,4400 AC Yerseke, The Netherlands
2University of Amsterdam, Department of Aquatic Ecology and Ecotoxicology, Kruislaan 320, 1098 SM Amsterdam,The Netherlands
ABSTRACT: Microphytobenthos primary production was measured using C fixation and comparedwith production estimates based on measurements on intact cores using variable chlorophyll fluores-cence with a PAM (pulse-amplitude-modulated) fluorometer at a number of different sites on inter-tidal flats in the Westerschelde and Oosterschelde estuaries (The Netherlands). We observed a linearrelationship between the minimal fluorescence, F0, and the chlorophyll a content of the sediments,but the relationship was quite noisy, which was partly due to a vertical scale mismatch between thedepth of sampling (1 mm) and the measuring depth the of PAM fluorometer (100 to 200 µm). On mostsites, C fixation was a linear function of photosystem II electron transport (ETR, obtained from PAMmeasurements), although for Stn B, a relatively silty site on the Molenplaat, an intertidal flat in theWesterschelde, the agreement between C fixation and ETR was often non-linear at irradiances satu-rating C fixation. This was sometimes observed for some of the other stations as well. The differencesat high irradiance might be related to vertical migration of epipelic diatoms, optical properties of thesediment or alternative electron acceptors. A conversion factor was calculated, allowing estimation ofC fixation from ETR measurements. This conversion factor was not different for the different stationsand no clear seasonal influence was observed, although the conversion factor could vary withinhours. The seasonally averaged conversion factor for all stations and each site was used to calculateareal rates of production and compared with primary production estimates obtained from the C fixa-tion measurements. It appeared that the PAM-based estimates gave a good prediction of the (poten-tial) C fixation, with the exception of a number of dates for Molenplaat Stn B. This demonstrates thatthe variable fluorescence technique can become, after further calibration with 14C for other shallowsediments, a very useful tool in production studies, and can be instrumental in obtaining a good spa-tial coverage of primary production, which remains very difficult due to the patchiness in microphy-tobenthos biomass and production.
KEY WORDS: Chlorophyll fluorescence · Photosynthetic electron transport · C fixation · Micro-phytobenthos · Primary production · Tidal flats
Resale or republication not permitted without written consent of the publisher

Mar Ecol Prog Ser 204: 39–52, 2000
cal migration and the steep vertical gradients in thesediments all make it difficult to get a good picture ofthe actual production with appropriate scaling. In com-bination with the marked spatial heterogeneity in bio-mass, it means that estimates of primary production bymicrophytobenthos cannot be very precise. The dis-cussion about which method to use for a better estima-tion of microphytobenthos production rates is quiteextensive in the literature (Underwood & Kromkamp1999, and references therein), but there is a generalconsensus that all techniques have their own advan-tages and limitations and they should be regardedmore as complementary than as antagonistic.
Variable fluorescence emerges as a new, promisingand non-intrusive tool to estimate photosynthesis inphytoplankton (Kolber & Falkowski 1993). The princi-ple of variable fluorescence is also used by the PAM(pulse-amplitude-modulated) fluorometers (Schreiberet al. 1986, 1995) and this technique has been used tomeasure algal photosynthesis, although mainly on cul-tures (Kroon et al. 1993, Hofstraat et al. 1994, Kroon1994, Geel et al. 1997, Flameling & Kromkamp 1998).Although the pump and probe technique (see Fal-kowski et al. 1986, Kolber & Falkowski 1993; later mod-ified to the fast repetition rate fluorometer; Kolber et al.1998) and the PAM technique use a similar physiologi-cal principle, some important differences exist, the mostimportant being the fact that the pump and probe tech-nique uses a saturating single turnover pump flash tomeasure the maximum fluorescence, Fm, whereas thePAM technique uses a saturating multiple turnoverflash (varying between 50 and 2000 ms) to reach Fm. Asa result, the quantum efficiency of photosystem II (PSII)is lower when measured with a pump and probe com-pared to a PAM fluorometer (Schreiber et al. 1995), butin ecological applications the differences betweenthese 2 techniques are probably not so large.
For microphytobenthos, however, only 3 papers up tonow report the use of the PAM technique. Two of themmeasured quantum efficiency of PSII, and calculatedphotosynthetic electron transport rates (ETR) fromthese (Hartig et al. 1998, Kromkamp et al. 1998). Serô-dio et al. (1997) used the minimal fluorescence to followvertical migration of microalgae. Kromkamp et al.(1998) investigated whether the PAM technique couldbe used to estimate microphytobenthic production insitu, but it does not contain comparison with other tech-niques. Hartig et al. (1998) report the comparison be-tween production measurements of the motile fractionof microphytobenthos by 14C uptake and PAM in vitroin June. Although 14C-uptake experiments with sedi-ment slurries can be useful to measure photosyntheticparameters, it is difficult to calculate in situ productionfrom these estimates as the chemical microgradientsexisting in the sediments are destroyed. 14C-slurry
techniques therefore give a potential estimate of themaximum primary production rates, and only underconditions when light is the main limiting factor willsuch estimates give an accurate prediction of in siturates, in agreement with oxygen microelectrodes (Bar-ranguet et al. 1998). On the other hand, there is no evi-dence that nutrients may become limiting for micro-phytobenthos in cohesive sediments so 14C remains auseful standard technique (Admiraal et al. 1982, Bar-ranguet et al. 1998, Underwood et al. 1998, Underwood& Kromkamp 1999). There is obviously a need for morevalidation of the PAM technique as a measure of actualproduction rates of microphytobenthos, compared toother available and more standard techniques.
We report here the result of monthly measurementsof photosynthesis irradiance (P-E) curves on 2 tidal flatswith the PAM fluorometer on intact cores (thus bothmotile and non-motile fraction included) and com-pared these with 14C fixation measurement of dilutedslurries.
Previous studies showed that the non-motile fractioncan constitute an important part of microphytobenticbiomass on sandy sediments in the Westerschelde(Barranguet et al. 1997, Sabbe 1997) and that migra-tion of algae can account for variations of productionduring ebb tide (Barranguet et al. 1998, Kromkamp etal. 1998).
Our aim was to use the minimal (i.e. dark-adapted) flu-orescence (F0) as an indicator of microphytobenthic bio-mass (as measured by chlorophyll a [chl a] concentra-tions) and to compare rates of photosynthesis and arealprimary production obtained with both PAM and 14C fix-ation.
MATERIAL AND METHODS
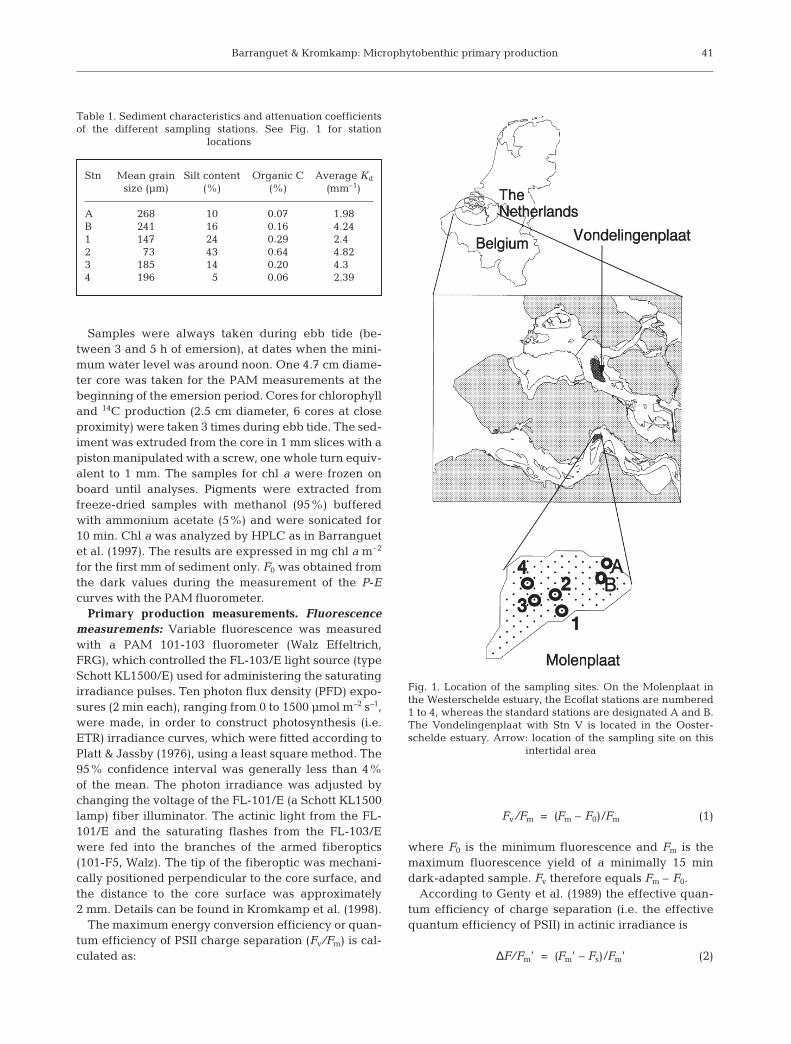
Sampling sites, physical and chemical measurements.The Molenplaat is a tidal flat located in the Wester-schelde (SW Netherlands). The sampled stations(Molenplaat Stns A and B, Ecoflat Stns 1, 2, 3 and 4) havedifferent sedimentary features, which are described inTable 1. An additional muddy-sand station located in atidal flat in the Oosterschelde (Vondelingenplaat Stn V)was sampled for comparison with other nutrient con-centrations in the overlying water, as the Oosterscheldewaters are much poorer in nutrients than those of theWesterschelde. The location of the sampling sites can befound in Fig. 1.
PAR (photosynthetic available radiation) was mea-sured during low tide with a cosine sensor LI 192SBconnected to a Li-Cor Data Logger LI-1000. Data wereintegrated every 10 min. Temperature was recorded inthe field with a RD-Temp Omega temperature datalogger at 5 min intervals.
40
Barranguet & Kromkamp: Microphytobenthic primary production
Samples were always taken during ebb tide (be-tween 3 and 5 h of emersion), at dates when the mini-mum water level was around noon. One 4.7 cm diame-ter core was taken for the PAM measurements at thebeginning of the emersion period. Cores for chlorophylland 14C production (2.5 cm diameter, 6 cores at closeproximity) were taken 3 times during ebb tide. The sed-iment was extruded from the core in 1 mm slices with apiston manipulated with a screw, one whole turn equiv-alent to 1 mm. The samples for chl a were frozen onboard until analyses. Pigments were extracted fromfreeze-dried samples with methanol (95%) bufferedwith ammonium acetate (5%) and were sonicated for10 min. Chl a was analyzed by HPLC as in Barranguetet al. (1997). The results are expressed in mg chl a m–2
for the first mm of sediment only. F0 was obtained fromthe dark values during the measurement of the P-Ecurves with the PAM fluorometer.
Primary production measurements. Fluorescencemeasurements: Variable fluorescence was measuredwith a PAM 101-103 fluorometer (Walz Effeltrich,FRG), which controlled the FL-103/E light source (typeSchott KL1500/E) used for administering the saturatingirradiance pulses. Ten photon flux density (PFD) expo-sures (2 min each), ranging from 0 to 1500 µmol m–2 s–1,were made, in order to construct photosynthesis (i.e.ETR) irradiance curves, which were fitted according toPlatt & Jassby (1976), using a least square method. The95% confidence interval was generally less than 4%of the mean. The photon irradiance was adjusted bychanging the voltage of the FL-101/E (a Schott KL1500lamp) fiber illuminator. The actinic light from the FL-101/E and the saturating flashes from the FL-103/Ewere fed into the branches of the armed fiberoptics(101-F5, Walz). The tip of the fiberoptic was mechani-cally positioned perpendicular to the core surface, andthe distance to the core surface was approximately2 mm. Details can be found in Kromkamp et al. (1998).
The maximum energy conversion efficiency or quan-tum efficiency of PSII charge separation (Fv/Fm) is cal-culated as:
Fv/Fm = (Fm – F0)/Fm (1)
where F0 is the minimum fluorescence and Fm is themaximum fluorescence yield of a minimally 15 mindark-adapted sample. Fv therefore equals Fm – F0.
According to Genty et al. (1989) the effective quan-tum efficiency of charge separation (i.e. the effectivequantum efficiency of PSII) in actinic irradiance is
∆F/Fm’ = (Fm’ – Fs)/Fm’ (2)
41
Stn Mean grain Silt content Organic C Average Kd
size (µm) (%) (%) (mm–1)
A 268 10 0.07 1.98B 241 16 0.16 4.241 147 24 0.29 2.402 73 43 0.64 4.823 185 14 0.20 4.304 196 5 0.06 2.39
Table 1. Sediment characteristics and attenuation coefficientsof the different sampling stations. See Fig. 1 for station
locations
Fig. 1. Location of the sampling sites. On the Molenplaat inthe Westerschelde estuary, the Ecoflat stations are numbered1 to 4, whereas the standard stations are designated A and B.The Vondelingenplaat with Stn V is located in the Ooster-schelde estuary. Arrow: location of the sampling site on this
intertidal area

Mar Ecol Prog Ser 204: 39–52, 2000
where Fs is the steady-state fluorescence and Fm’ themaximum fluorescence after a saturating pulse whenmeasured in the light.
∆F/Fm’ can be used to calculate the linear rate ofphotosynthetic electron transport (ETR) as of a singleactive PSII unit (Genty 1989, Hofstraat et al. 1994):
ETR = ∆F/Fm’ · PFD · a*PSII (3)
where a*PSII is the optical cross section of PSII. Theproduct of PFD and a*PSII equals the amount ofabsorbed irradiance by a PSII unit. ETR is called Je byHofstraat et al. (1994). As we could not measure a*PSII,relative ETR was calculated as ∆F/Fm’ · PFD. The ETRlight response curves were fitted to the Platt & Jassby(1976) hyperbolic tangent model and from the fit ofthe maximum rate of ETR (ETRmax), the initial slope(αETR) and the light saturation parameter (EkPAM =ETRmax/αETR) were calculated. We did not measure theminimum fluorescence in the light-adapted state (F0’)in between the light steps. Non-photochemical pro-cesses like heat dissipation of absorbed light by thexanthophyll cycle (Ruban & Horton 1995) will decreasethe PSII cross section, and will thus lower both the Fm
as well as the F0. In order to check this we used the F0
immediately upon transfer to the dark (without far redlight) at the end of the P-E curve as a measure of F0’.
Carbon uptake: The procedure to obtain the P-Ecurves and photosynthetic parameters was describedin detail in Barranguet et al. (1998). Microphytobenthicpotential production, calculated as 14C bicarbonateuptake, was measured in a photosynthetron (Lewis &Smith 1983) with 7 light intensities from 0 to 1536 µmolm–2 s–1.
The incubation procedure followed that of MacIn-tyre & Cullen (1995) with small modifications. Thesuperficial mm of 2 sediment cores was diluted in 50 mlof filtered seawater, and aliquots of 2.5 ml were takenwhile the sample was agitated, producing an homoge-neous slurry. The aliquots were placed in glass scintil-lation vials and 50 µl of NaH14CO3 (Amersham) wasadded to each sample to a final activity of 18.5 kBqml–1. The samples were incubated at in situ tempera-tures. Carbon incorporation was stopped after 30 minwith 100 µl of concentrated HCl, which removes all thenon-incorporated inorganic carbon, as proved by darkand control incubations. The samples were countedusing a Beckman LS 5000TD scintillation counter in-cluding quenching correction, after addition of 17.5 mlof Dynagel (Baker Analyzer Reagent).
The values of production for each light intensity (2replicates), expressed per unit area (mg C m–2 h–1),were normalized for chlorophyll units and fittedaccording to Platt & Jassby (1976) to calculate thephotosynthetic parameters α B, PB
max and Ek. α B is theinitial slope of the P-E curve (photosynthesis rate at
sub-saturating light, in mg C mg chl a–1 (µmol m–2
s–1)–1 h–1). PBmax is the maximum photosynthetic capac-
ity at saturating irradiances (mg C mg chl a–1 h–1). Ek
(µmol m–2 s–1), the light saturation parameter, is calcu-lated as PB
max/αB and is often used as a photoacclima-tion index.
To calculate production for the whole photic zone,irradiance attenuation between 400 and 700 nm in thefirst mm of sediment was measured with reconstitutedsediment as in MacIntyre & Cullen (1995), assuming anexponential decrease of light intensity in the sedi-ments, according to the formula:
Ez = E0 · e–k ·z (4)
where k is the attenuation coefficient (mm–1) and z thedepth (mm).
Incident light intensity was averaged for the 1.5 hperiod between each measurement, and with 3 P-Ecurves 3 estimates of carbon fixation were obtainedper sampling day.
Production was calculated at each depth (Pz) with aresolution of 0.1 mm as:
(5)
The production at each layer was added up for thewhole photic zone, assuming a constant chl a contentwith depth in the photic zone. Two-way ANOVAs wereperformed to test the significance of the short-term(hours) and monthly variations of chl a contents,primary production, and photosynthetic parameters(PB
max, αB and Ek) at Molenplaat Stns A and B in theWesterschelde estuary.
RESULTS
F0 versus chlorophyll
The PAM settings were changed at each samplingdate, according to the different sediments and algalconcentrations; subsequently, all F0 values were re-scaled to the same settings, using pure chl a for the cal-ibration. There was good agreement between theactual chl a concentrations measured (r2 = 0.54, p <0.01; Fig. 2A) from the 14C production cores and the F0
values. However, the 14C cores were taken 3 times dur-ing emersion, while the core for PAM measurementswas the same during the whole emersion at 1 day.Between measuring periods, the core was exposed to aconstant irradiance of 460 µmol m–2 s–1. During coldperiods, the sediment temperature was controlled bypumping seawater through a coil surrounding thecore. If the behaviour in the field would be differentthan in the PAM core (e.g. with respect to verticalmigration) a better relationship might be obtained
P a PzB E PB
zB= −⋅ ⋅chl e(
max/ )( )max1 α
42
Barranguet & Kromkamp: Microphytobenthic primary production
when only the first sampling points are compared.Indeed, the regression improved when only the corestaken at the beginning of emersion for 14C were com-pared to the first F0 measured, because they weretaken simultaneously (r2 = 0.73; Fig. 2B).
Photosynthetic parameters
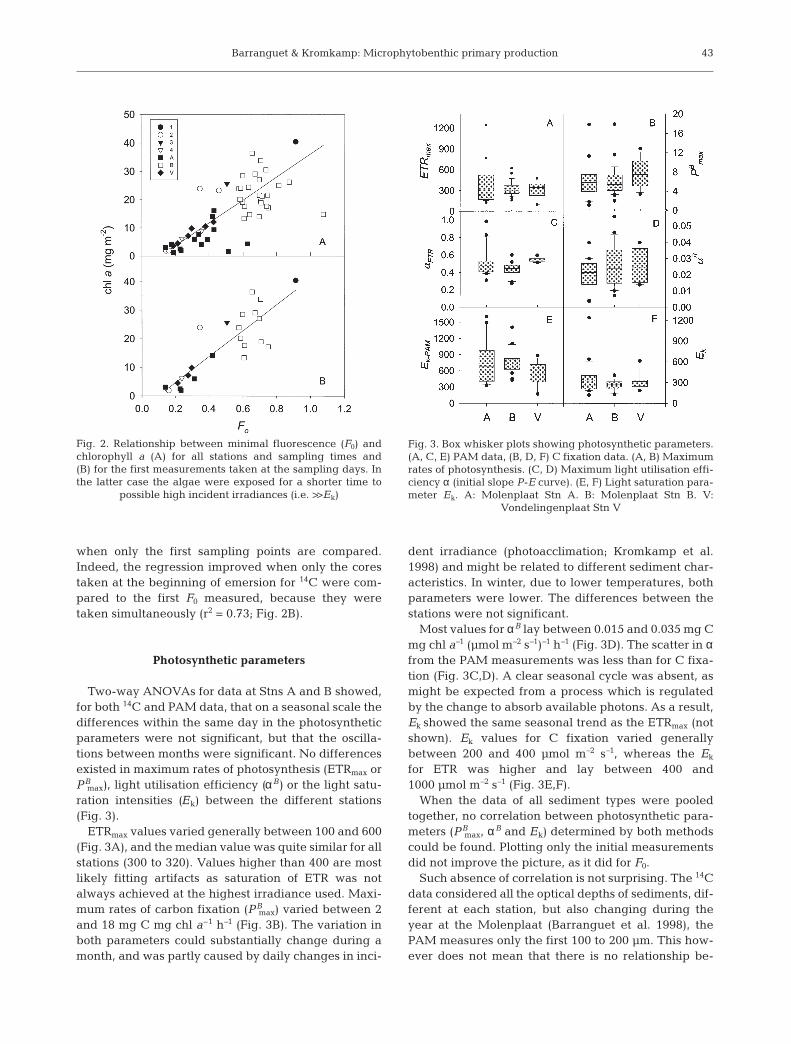
Two-way ANOVAs for data at Stns A and B showed,for both 14C and PAM data, that on a seasonal scale thedifferences within the same day in the photosyntheticparameters were not significant, but that the oscilla-tions between months were significant. No differencesexisted in maximum rates of photosynthesis (ETRmax orPB
max), light utilisation efficiency (αB) or the light satu-ration intensities (Ek) between the different stations(Fig. 3).
ETRmax values varied generally between 100 and 600(Fig. 3A), and the median value was quite similar for allstations (300 to 320). Values higher than 400 are mostlikely fitting artifacts as saturation of ETR was notalways achieved at the highest irradiance used. Maxi-mum rates of carbon fixation (PB
max) varied between 2and 18 mg C mg chl a–1 h–1 (Fig. 3B). The variation inboth parameters could substantially change during amonth, and was partly caused by daily changes in inci-
dent irradiance (photoacclimation; Kromkamp et al.1998) and might be related to different sediment char-acteristics. In winter, due to lower temperatures, bothparameters were lower. The differences between thestations were not significant.
Most values for αB lay between 0.015 and 0.035 mg Cmg chl a–1 (µmol m–2 s–1)–1 h–1 (Fig. 3D). The scatter in αfrom the PAM measurements was less than for C fixa-tion (Fig. 3C,D). A clear seasonal cycle was absent, asmight be expected from a process which is regulatedby the change to absorb available photons. As a result,Ek showed the same seasonal trend as the ETRmax (notshown). Ek values for C fixation varied generallybetween 200 and 400 µmol m–2 s–1, whereas the Ek
for ETR was higher and lay between 400 and1000 µmol m–2 s–1 (Fig. 3E,F).
When the data of all sediment types were pooledtogether, no correlation between photosynthetic para-meters (PB
max, αB and Ek) determined by both methodscould be found. Plotting only the initial measurementsdid not improve the picture, as it did for F0.
Such absence of correlation is not surprising. The 14Cdata considered all the optical depths of sediments, dif-ferent at each station, but also changing during theyear at the Molenplaat (Barranguet et al. 1998), thePAM measures only the first 100 to 200 µm. This how-ever does not mean that there is no relationship be-
43
Fig. 2. Relationship between minimal fluorescence (F0) andchlorophyll a (A) for all stations and sampling times and(B) for the first measurements taken at the sampling days. Inthe latter case the algae were exposed for a shorter time to
possible high incident irradiances (i.e. >>Ek)
Fig. 3. Box whisker plots showing photosynthetic parameters.(A, C, E) PAM data, (B, D, F) C fixation data. (A, B) Maximumrates of photosynthesis. (C, D) Maximum light utilisation effi-ciency α (initial slope P-E curve). (E, F) Light saturation para-meter Ek. A: Molenplaat Stn A. B: Molenplaat Stn B. V:
Vondelingenplaat Stn V

Mar Ecol Prog Ser 204: 39–52, 2000
tween linear ETR and C fixation. This relationship wasinvestigated for each sampling site individually and ispresented below.
Comparison between ETR and C fixation
When the rate of chlorophyll-specific C fixation wasplotted as a function of relative ETR, it appeared thatat higher rates of photosynthesis the linear relation-ship disappeared for sediments at Molenplaat Stn B(Fig. 4A). In spring (February, March and April) thisoccurred at irradiances above 200 µmol m–2 s–1,whereas later in the year this occurred at irradiancesexceeding 350 to 400 µmol m–2 s–1. However, the rela-tionship was always linear at irradiancesbelow the Ek for carbon fixation. The regres-sion coefficient (a) of the linear part of thecurve gives an indication of the efficiency ofthe photosynthetic apparatus, and can beused to calculate C fixation at irradiances upto Ek:
PB = a · ETR (6)
This can be rewritten as:
PB = ETR · a*PSII · nPSII · Φe–1 (7)
where a*PSII is the optical cross section ofPSII, nPSII the number of PSIIs mg chl a–1,and Φe the electron requirement for C fixa-tion (i.e. the amount of electrons producedby PSII necessary to fix 1 CO2). Thus theregression coefficient equals a*PSII · nPSII ·Φe
–1. We call a the ETR efficiency for C fixa-tion (EE).
As during a P-E curve the number of PSIImg chl–1 will not change (assuming that nostructural photoinhibition occurred, whichwas not apparent in both the ETR as well asin the C fixation rates at high irradiances), achange in the slope of the curves will mostlikely be due to a change in the electrontransport efficiency, and/or due to a change(decrease) in a*PSII. As can be seen inFig. 5A, EE varies between 0.04 and 0.06most of the time, and the seasonal averagefor Stn B was 0.057 ± 0.013.
The sandy Molenplaat Stn A (Fig. 4B), andthe Ecoflat Stns 1, 2, 3 and 4 (Fig. 4C)showed a better relationship between spe-cific carbon uptake (PB) and ETR. Especiallyat the Ecoflat stations, the relationship wasgenerally linear up to the highest irradiancesinvestigated (1000 µmol m–2 s–1). Notice thatEcoflat Stn 1 and especially 2 are more cohe-
sive (contain more silt) than Stn B. Hence, whether thenon-linear relationships between ETR and C fixation atsaturating irradiances (for C fixation) are related tosediment characteristics is unclear at present. The dataset is too small to detect seasonal changes for theEcoflat stations, where all the measurements weretaken in summer. Non-linear relationships (above Ek
for C fixation) were observed at Stn A in winter, but insummer complete linear relationships were observed.For Stn A, we could not find a significant negative cor-relation between EkPAM and Ek14C and temperature, butthe data set does not contain enough values with lowtemperatures, although there is a negative trend (r =–0.41). The difference between Ek from both methodsis greater at Stn A than the differences found at Stn B.
44
Fig. 4. C fixation rates as a function of ETR at the 4 different sampling sites (Ato D). Closed symbols are the first measurements taken (late morning), opensymbols the second measurement (early afternoon), and grey symbols are the
third sample taken (mid afternoon) during the same low tide

Barranguet & Kromkamp: Microphytobenthic primary production
Both complete linear relationships, as well as devia-tions from linearity between ETR and C fixation at highirradiances, were found at Vandelingenplaat Stn V inthe Oosterschelde estuary. The degree of non-linearitywas, however, not as pronounced as at Stn B in theMolenplaat. Similar slopes were found for the otherstations: EE varied between 0.015 and 0.04 (Fig. 5D).
The average regression coefficient (EE) for Molen-plaat Stn B was 0.057 ± 0.026, for the Ecoflat stations0.042 ± 0.016, for Stn A 0.034 ± 0.012 and for theVondelingenplaat Stn V 0.042 ± 0.015 (Fig. 6). The dif-ference in regression coefficients between Stns A andB was significant (t-test, p < 0.003). The differencebetween the Ecoflat stations and Stn B (p = 0.103) andbetween the Ecoflat stations and A and Vondelingen-plaat was not significant (p = 0.092 and 0.088 respec-tively). EE from the Vondelingenplaat Stn V samplesdid not differ significantly from any of the other sites.
Thus, despite the fact that EE of Stn A was lower thanEE at Stn B (and that photosynthesis is thus less effi-cient at Stn A) the fact that the differences in EE fromboth Stns A and B compared with the other stations arenot significant seems to indicate that observed differ-ences in EE between Stns A and B are probably notsignificant either.
Integrated primary production
In order to compare rates of areal primary produc-tion, we calculated rates of photosynthesis with depth.From the measured attenuation coefficient we calcu-lated the irradiance with depth, and we assumed forthe sake of calculation a homogeneous distribution ofchl a with depth. From the measured incident irradi-ance and the C fixation parameters PB
max and αB, thetotal C fixation with depth was calculated. ETR rateswere converted to C fixation rates as follows:
C fixation = chl a · EE · ETR (8)
ETR was calculated from the maximum rate of ETR andthe initial slope of an ETR versus light curve. For eachstation we used the same average value of all EE values(0.043); hence we assumed that the conversion fromPAM obtained rates of electron transport to chloro-phyll-specific rates of C fixation did not vary through-out the season. An example of a depth profile is given inFig. 7. In this example, we see that production ratesbased on ETR measurements are lower than primaryproduction based on C fixation, whereas in the after-noon both methods gave the same production rates.Summation of photosynthetic C fixation at each depthgives the total primary production in the sediment.
As could be expected based on the non-linear rela-tionships between C fixation and ETR in high light at
45
Fig. 5. Regression coefficient EE (slope of linear part of theETR vs C fixation curve) at several sampling days (d/mo).Error bars give indication of variability (standard error ordeviation from the mean) from 2 to 3 measurements during 1tidal cycle. The Ecoflat Stns 1 to 4 were visited in June only,apart from Stn 2, which was visited in August as well(Fig. 5C). Asterisks denote significant higher value of EE
(p < 0.05)
Fig. 6. Average values for the electron requirement EE(i.e. the conversion factor needed to convert ETR into PB ).B: Molenplaat Stn B; A: Molenplaat Stn A; E: Ecoflat sampling
stations on the Molenplaat; V: Vondelingenplaat Stn V

Mar Ecol Prog Ser 204: 39–52, 2000
Stn B, the primary productivity estimates differed con-siderably, although ETR was seldom higher than 200%or lower than 50% of the C fixation rate (Fig. 8).
For Molenplaat Stn A the agreement was fairly good(Fig. 9). Only on 2 occasions was there a large mis-match: in December ETR overestimated the C fixation
by a factor of 2. Production rates were very low at thatdate though, so measuring errors could be important.The second core taken that day gave identical esti-mates of primary production. ETR underestimated theC fixation of the first core taken in March. In AugustETR also overestimated C fixation for the first mea-surements, but later that day the estimates were simi-lar, with a slightly higher estimate for C fixation.
At Ecoflat Stns 1 to 4, a very good agreement wasobtained for 5 out of 6 measurements (Fig. 10). At Stn 2the ETR-based estimate in the morning underesti-mated the production relative to the C fixation byabout 35%.
As Molenplaat Stn A and the Ecoflat stations showedgenerally linear relationships between ETR and C fix-ation, the occasional discrepancy between the esti-mates was most likely due to some diurnal variation inphotosynthesis or patchiness.
Comparisons for Vondelingenplaat Stn V in theOosterschelde (Fig. 11) were much better than forStn B, but not as good as for Stn A and the Ecoflat sta-tions. On average, the ratio of C:ETR was 0.91 for theEcoflat stations, 0.88 for Molenplaat Stn A, 0.65 forMolenplaat Stn B and 0.76 for Vondelingenplaat Stn V.Recalculation of the data for the latter 2 stations,assuming that above Ek increases in ETR will not leadto higher rates of C fixation, causes the ratio to changeto 0.76 and 0.95 respectively. Hence, apart from Stn B,the overall agreement between both methods wasquite good, despite the fact that the PAM-derived pri-mary production estimate was based on a surface mea-
46
Fig. 7. Example of 2 depth profiles of irradiance (s) and C fix-ation based on PAM measurements (d) or 14C fixation (j)taken at the same day but at different times during low tide
Fig. 8. Comparison of primary production based on ETR (openbars) and C fixation (hatched bars) measurements for Molen-plaat Stn B. The site was visited twice during one tidal cyclein October and twice on 2 dates in November 1995, and 3
times during a tidal cycle in the other months
Fig. 9. Comparison of primary production based on ETR andC fixation measurements for Molenplaat Stn A. At each datethe first measurement was taken in late morning (am) about1 h before low tide. The second measurement was performed
near the end of the same emersion period

Barranguet & Kromkamp: Microphytobenthic primary production
surement. It is clear from Fig. 12, where the productionestimates of both methods are plotted against eachother, that there is no significant difference betweenthe stations.
DISCUSSION
Richardson (1991) demonstrated that when differentlaboratories were given the same samples, very signif-icant differences in C fixation based production esti-
mates occurred when they used their own or standardmethods. It is therefore interesting to note that thevariation in estimates of the maximum αB is muchsmaller when estimated by the PAM technique thanwhen estimated from C fixation measurements(Fig. 3C,D). This suggests that the PAM method ismore robust and potentially better suited for intercom-parison purposes. On the other hand, the smaller vari-ance of αETR might be a statistical artifact as α ETR isonly dependent on variance in ∆F/Fm’ only, whereas αB
is dependent on variance in both irradiance and photo-synthesis.
Estimation of chl a from F0 values
In dark-adapted plants, most of the F0 originatesfrom the chl a associated with PSII (Krause & Weis1991, Büchel & Wilhelm 1993). Therefore, a good cor-relation between F0 and chl a can be expected. Thisprinciple is often succesfully used in oceanographywith a fluorometer attached to a CTD, despite the factthat the irradiance of these fluorometers is oftenactinic. Geel (1997) has indeed found a good relation-ship between F0 and chl a for marine phytoplankton inmesocosms simulating the coastal North Sea. The rela-tionship between chl a and F0 for the microphytoben-thos shown in Fig. 2 was obtained from different sam-pling stations. Despite the diversity of sedimentsconsidered, with different algae (mainly diatoms at allstations) and optical depths, F0 appeared to be a goodindicator of chlorophyll differences in concentrationsbetween stations. Stn B, with muddy sands, showedthe poorest correlation between F0 and chl a. At thisstation a high fraction of vertically migrating epipelic
47
Fig. 10. Comparison of primary production based on ETR andC fixation measurements for Ecoflat Stns 1 to 4. Stns 1 and 2
were sampled twice during the same tidal cycle
Fig. 11. Comparison of primary production based on ETR andC fixation measurements for Stn V. In order to reduce the pos-sible overestimation of C fixation by ETR when non-linearitybetween ETR and C fixation occurred, we also calculated theETR-based C fixation rates under the assumption that aboveEk for C fixation ETR would not increase. This improved the
agreement between the 2 methods in July
Fig. 12. Plot of hourly production rates based on C fixation asa function of ETR. As can be seen, all estimates lie along thesame line (slope = 0.94, r2 = 0.79), indicating that no signifi-cant difference exists in conversion factor (EE) between the
different sampling sites

Mar Ecol Prog Ser 204: 39–52, 2000
diatoms was present. Ecoflat Stns 1 and 2 were alsovery silty, but these were only measured in summeronce and twice respectively. Furthermore, it is verydifficult to accurately slice off 1 mm of sediment, espe-cially at the silty sites. This too might have contributedto the scatter at Stn B, where the silt content changesthroughout the year (P. Herman pers. comm.). Addingto this is a possible scale problem: we sampled a depthof 1 mm, but the ‘measuring depth’ of the PAM isapproximately 150 µm (Kromkamp et al. 1998). Thuswe implicitly assume that, within our slice, chlorophyllconcentration is either evenly distributed or that italways shows the same relationship with depth. Verti-cal microprofiles of chlorophyll with depth show thatthis is not always the case (Wiltshire et al. 1998, deBrouwer pers. comm.). Furthermore, the PAM methoduses a red LED (light emitting diode) (λmax = 650 nm) asmodulated measuring light. The absorption cross sec-tion of PSII for this wavelength is dependent on thepigment composition of the algae: cyanobacteria willabsorb this better than diatoms. Thus at a similar mea-suring light intensity, the fluorescence yield of cyano-bacteria will be higher than that of an equal chloro-phyll biomass of diatoms. Thus, a change in speciescomposition with different pigment types might alsocontribute to the scatter in the relationship between F0
and chl a.Another reason for the fact that the relationship be-
tween F0 and chlorophyll was better for the first sam-ples taken might be the fact that the dark adaptationperiod was not sufficient to get relaxation of all non-photochemical quenching processes, especially duringvery sunny days. The cells at the surface might havebeen exposed to high irradiances for a prolongedperiod and this might induce some chronic photoinhi-bition, which did not disappear during the dark adap-tation period used, although we showed before that atsome dates the microphytobenthos at the Molenplaathardly showed any photoinhibition after prolongedexposure to high irradiances, possibly because ofvertical ‘micro-migration’, where cells leaving the sur-face are replaced by new ones coming from below(Kromkamp et al. 1998). The capacity to do this is ofcourse dependent on species composition, because notall species show active vertical migration.
Photosynthetic parameters and primary production rates
For the Molenplaat, we described earlier that maxi-mum rates of photosynthesis varied throughout theseasons and showed signs of photoacclimation,whereas αB did not show any seasonal variation (espe-cially when measured with the PAM fluorometer) (Bar-
ranguet et al. 1998, Kromkamp et al. 1998). Similarresults were obtained by us from Stn V at the Von-delingenplaat, an intertidal flat in the Oosterschelde,which is generally low in nutrients (Wetsteyn &Kromkamp 1994). The fact that similar photosyntheticparameters were obtained indicates that nutrient limi-tation of the microphytobenthos was probably notimportant. This is corroborated by the fact that Fv/Fm
values were generally high. Low Fv/Fm values indicatenutrient limitation (Kolber et al. 1988, 1990, 1994,Flameling 1998, Kromkamp & Peene 1999) althoughthis might also be caused by chronic photoinhibition, asituation to which microphytobenthos might easily beinduced in benthic algae exposed to the surface. How-ever, effective quantum efficiencies were generallyhigh, even at high irradiances as determined in the P-Ecurves, demonstrating that the microphytobenthos arewell adapted to high irradiance conditions.
In general, we found no significant correlation forPB
max, αB or Ek between the PAM and C fixation meth-ods. Hartig et al. (1998) also compared estimates ofphotosynthesis based on C fixation and PAM fluores-cence. They found a relationship only for PB
max; theyperformed their measurements on the motile fractionof the microphytobenthos only, and carried the PAMand C fixation measurements out on the same sample(a slurry). For most stations, they observed a linearrelationship between ETR and C fixation, although atsome stations their fluorescence-based rate of photo-synthesis overestimated the C fixation rate at high irra-diances, just like in our measurements. We observedthis more frequently then they did, but this might bedue to the fact that we have a much larger data set,spanning all seasons. In order to quantify ETR, Hartiget al. (1998) multiplied ETR with the chlorophyll-spe-cific optical cross section. However, in order to obtainquantitative estimates of C fixation, relative rates ofETR should be multiplied by the optical cross section ofPSII (a*PSII), the number of PSII per mg chl a and Φe
–1
(Eq. 7). Our conversion factor EE is the product ofthese 3 parameters, and varies between 0.03 and 0.05(Fig. 6), which is 3 to 8 times as high as the optical crosssection measured by Hartig et al. (1998). Our PB
max val-ues were also 3 to 10 times as high, but in the samerange as found by others (Blanchard & Cariou-Le Gall1992, Blanchard & Montagna 1992, MacIntyre &Cullen 1995, 1996). These results suggest that theproduct of a*PSII, nPSII and Φe
–1 co-varies with thechlorophyll-specific optical cross section. Our conver-sion factors for microphytobenthos were in the samerange as those found for Oosterschelde phytoplankton,where median values for different stations rangedbetween 0.04 and 0.16 with median values of respec-tively 0.06 and 0.11 (Kromkamp & Peene 1997). Recal-culation of data published for a nutrient-replete culture
48

Barranguet & Kromkamp: Microphytobenthic primary production
of the green alga Chlorella pyrenoidosa (Kroon 1994),assuming a PQ-ratio of 1, gave EE values between0.056 and 0.071, i.e. in the same range as found by usfor phytoplankton and microphytobenthos. Recalcula-tion of data published by Geel et al. (1997) gave EEvalues varying between 0.007 and 0.02 for differentmarine phytoplankton species. Hartig & Colijn (1996)reported EE values between 0.013 and 0.07 for differ-ent marine unicellular algae. Hence, there seems to bea species difference, as most of the above data wereobtained with nutrient-replete cultures. The valuesmay also vary with tidal exposure, as can be seen fromthe standard deviations in Fig. 5, which is a reflectionof the change in EE during 1 tidal cycle. However, thedifferences during the day were not significantthroughout the year (ANOVA, p > 0.4). This, and thehigh Fv/Fm values, indicate that nutrient limitation(CO2 especially) is probably not so important. Therealso seemed to be an absence in seasonality in the con-version factor of ETR to PB. Only on 2 occasions was asignificantly higher value of EE observed (Fig. 5A).
Changing sediment optics may have caused part ofthe absence of linearity above Ek. ETR was calculatedusing the incident irradiance on the core surface. Theoptical depth for the PAM measurements was esti-mated to be approximately 150 µm for Stn B (Krom-kamp et al. 1998), but depends of course on the sedi-ment type and the amount of algae. Hence, theaverage irradiance in the top layer of the sediment maybe less than the incident irradiance. Another factor isthat at Stn B the proportion of epipelic diatoms show-ing vertical migration is larger than at the more sandysites. During the ETR measurements, upward verticalmigration took place which may also decrease theaverage light intensity. Hence, if we could correct forthis migration, the discrepancy between ETR and spe-cific carbon fixation (PB ) would probably be less.
Alternatively, we suggested in an earlier paper(Kromkamp et al. 1998) that microphytobenthos at theuppermost layer of the sediment showed a micro-migration pattern: cells moving to the surface mightreplace cells at the surface. In this way the cells at thesurface might escape high light stress by moving toslightly deeper layers (which may also be more CO2-rich), whilst being replaced by others. When thisoccurs, a feedback on the PSII quantum efficiencymight not be so pronounced as during a 30 min expo-sure in the slurry incubations, resulting in higher ratesof ETR compared to C fixation.
Changes in a*PSII and ETR (Eq. 7) might also beresponsible for the absence of linearity above Ek. Geel(1997) demonstrated that F0 is a measure of the productof the number of PSII and a*PSII. Hence, an indicationof a change in a*PSII can also be obtained by comparingF0’ with F0, i.e. with the fluoresence in the dark directly
after completion of the P-E curve with the initial F0
value. F0’ lay between 0.9 and 1.7 of F0. Non-photo-chemical quenching, often induced by the xanthophyllcycle, will decrease the photosynthetic efficiency.Together with state 1-state 2 transitions or spill-over(re-direction of absorbed light to PSI, Bennet 1983) thismight decrease a*PSII. However, most values of F0’were larger than F0, indicating that a*PSII did notchange, but that it was influenced by upward verticalmigration of diatoms during the measurement. It can-not be excluded though, that the increase in F0’ due tovertical migration may have partly masked a decreasein a*PSII.
Any process which will affect Φe will influence therelationship between C fixation and ETR. Φe is theratio of the effective quantum efficiencies of PSII to Cfixation (Flameling & Kromkamp 1998). A change in Φe
can be caused by an increased rate of dark respirationand alternative electron sinks, like the Mehler reactionor photorespiration (see Flameling & Kromkamp 1998for a discussion on these topics). Recently it has beenpostulated that temperate diatoms could take upnitrate in excess of growth demands, especially atlower temperatures and when light is in excess. Thephotosynthetic reduction of nitrate by nitrate reduc-tase could in this way also serve as an alternative elec-tron source to Rubisco, which has its maximum activityaround 30°C (Lomas & Glibert 1999). As the Wester-schelde is rich in nitrate (average: 161 µM, in winter:200 to 300 µM) a high rate of nitrate reduction mightbe an important alternative electron source, but thisneeds further investigation. All these alternative elec-tron sinks allow PSII activity to continue, and provideprotection to chronic photoinhibition, and thus serve asa buffer for the imbalance between energy generationand energy requirement for growth. To explore if in-creased nitrate reductase activity was a possible alter-native electron sink for microphytobenthic diatoms, wecalculated the ratio between EkPAM and Ek. Thus, weassumed that the ratio would increase if alternativeelectron sources would become more important. Theratio varied from month to month. For Stn B, indeed,there was a significant negative correlation (r = –0.656,p < 0.05) between the overestimation on EkPAM andtemperature, the largest differences between bothmethods were found when temperatures were around4 to 6°C, in accordance with Lomas & Glibert’s (1999)results for planktonic diatoms.
Sometimes primary production of microphytoben-thos is estimated from chlorophyll only (de Jong & deJonge 1995). We also investigated this, but could notfind any relationship between chlorophyll content andprimary production (not shown). Similar results havebeen found for microphytobenthos in the GermanWadden Sea area near the island of Sylt (D. Murphy
49

Mar Ecol Prog Ser 204: 39–52, 2000
pers. comm.). Cole & Cloern (1987) estimated primaryproduction in light-limited estuaries from a compositeparameter (biomass × daily insolation × photic depth),and we oberved a good relationship between this para-meter and phytoplankton production in some stationsin the Westerschelde and Oosterschelde estuaries(Heip et al. 1995, Kromkamp et al. 1995). This relation-ship, however, does not hold for our microphytoben-thos data (not shown).
It is not easy to explain the difference in photosyn-thesis between the more sandy sites and the silty StnB, but at the sandy sites it was speculated that themicrophytobenthos was more adapted to high light,whereas at the silty site, the microphytobenthos werelow light adapted (Barranguet et al. 1998). We did,however, find a good correlation for the Ecoflat sta-tions. These stations were sampled in summer only,and the discrepancies between ETR and PB at Stn Bwere largest outside the main growing season. Butpart of the explanation might also be in the differentoptics of sand, and the lower proportion of epipelic(i.e. vertically migrating) diatoms or a different spe-cies composition (Sabbe 1997). It is clear that futureresearch should investigate the light climate in moredetail using optical microfibers (Kühl & Jørgensen1994, Kühl et al. 1994) and that vertical microprofilesof PAM measurements should be made in conjunc-tion.
Conclusions
We investigated the possibility to estimate total pri-mary production from surface-based PAM estimates.In the calculations, we assumed that the conversionfactor EE did not vary either seasonally or during atidal cycle. For the first assumption there is some proof,as Molenplaat Stn A hardly showed any seasonal vari-ation in EE. For Molenplaat Stn B, 2 dates showedhigher values but the other EE values were compara-ble to those found for the other stations. For the Molen-plaat Ecoflat stations and Stn V in the Oosterschelde,the data set is too small to draw any conclusion withregard to a possible seasonal influence on EE. Never-theless, for most stations our ETR-based prediction wasclose to the C fixation based prediction. Only at Stn Bwere the differences sometimes large. These differ-ences at Stn B and other sites were due to the observednon-linearity between ETR and PB at higher irradi-ances (Stn B especially), and to the fact that we used aseasonal averaged value of EE, which in the case of StnB might not be valid all the time. Also, by doing this weignored daily changes in EE, which were observed, butdid not show any consistent pattern throughout theyear.
A further validation of the PAM technique for othercoastal shallow sediments is obviously needed, princi-pally in environments where nutrients could becomelimiting. A standard comparison between the linearpart of the 14C P-E curves, and those produced for thePAM data could be achieved, and when a suitableagreement is found PAM measurements could replacethe radiocarbon measurements on wider geographicscale studies.
Acknowledgements. Our special thanks are due to Jan Peenefor the C fixation measurements and assistance in the fieldand Jan Sinke for chlorophyll analyses. We thank Rod Forster,Kirsten Wolfstein, Peter Herman and 3 unknown referees foruseful suggestions. This is publication 2673 of the NIOO. Thiswork is a contribution to the ELOISE Programme (publicationnumber 163) in the framework of the EU-ECOFLAT projectcarried out under contract ENV4-ct96-0216.
LITERATURE CITED
Admiraal W, Peletier H, Zomer H (1982) Observations andexperiments on the population dynamics of epipelicdiatoms from an estuarine mudflat. Estuar Coast Shelf Sci14:471–487
Barranguet C, Herman PMJ, Sinke JJ (1997) Microphytoben-thos biomass and community composition studied by pig-ment biomarkers: importance and fate in the carbon cycleof a tidal flat. J Sea Res 38:59–70
Barranguet C, Kromkamp J, Peene J (1998) Factors control-ling primary production and photosynthetic characteris-tics of intertidal microphytobenthos. Mar Ecol Prog Ser173:117–126
Bennet J (1983) Regulation of photosynthesis by reversiblephosphorylation of the light-harvesting chlorophyll a/bprotein. Biochem J 212:1–13
Blanchard GF, Cariou-Le Gall PA (1992) Photosynthetic char-acteristics of microphytobenthos in Marennes-Oléron Bay,France: preliminary results. J Exp Mar Biol Ecol 182:1–14
Blanchard GF, Montagna PA (1992) Photosynthetic responseof natural assemblages of marine benthic microalgae toshort- and long-term variations of incident irradiance inBaffin Bay, Texas. J Phycol 28:7–14
Büchel C, Wilhelm C (1993) In vivo analysis of slow chloro-phyll fluorescence induction kinetics in algae: progress,problems and perspectives. Photochem Photobiol 58:137–148
Cole BE, Cloern JE (1987) An emperical model for estimatingphytoplankton productivity in estuaries. Mar Ecol ProgSer 36:299–305
de Jong DJ, de Jonge VN (1995) Dynamics and distribution ofmicrophytobenthic chlorophyll a in the Western Scheldtestuary (SW Netherlands). Hydrobiologia 311:21–30
Falkowski PG, Wyman K, Ley AC, Mauzerall DC (1986) Rela-tionship of steady-state photosynthesis to fluorescence ineucaryotic algae. Biochim Biophys Acta 849:183–192
Flameling IA (1998) Growth and photosynthesis of eukaryoticmicroalgae in fluctuating light conditions, induced by ver-tical mixing. Catholic University Nijmegen, p 1–135
Flameling IA, Kromkamp J (1998) Light dependence of quan-tum yields for PSII charge separation and oxygen evolu-tion in eucaryotic algae. Limnol Oceanogr 43:284–297
Geel C (1997) Photosystem II electron flow as a measure for
50

Barranguet & Kromkamp: Microphytobenthic primary production
phytoplankton gross primary production. PhD thesis,Agricultural University Wageningen, p 67–82
Geel C, Versluis W, Snel JFH (1997) Estimation of oxygenevolution by marine phytoplankton form measurement ofthe efficiency of Photosystem II electron flow. PhotosynthRes 51:61–70
Genty B, Briantais JM, Baker NR (1989) The relationshipbetween quantum yield of photosynthetic electron trans-port and quenching of chlorophyll fluorescence. BiochimBiophys Acta 990:87–92
Hartig P, Colijn F (1996) Pulse-amplitude-modulation-fluores-cence (PAM) a tool for fast assesment of primary produc-tivity in the sea? In: Baeyens J, Dehairs F, Goeyens L (eds)Integrated marine system analysis. Minutes of the firstnetwork meeting. Free University Brussels, Brussels,p 103–113
Hartig P, Wolfstein K, Lippemeier S, Colijn F (1998) Photosyn-thetic activity of natural microphytobenthos populationsmeasured by fluorescence (PAM) and 14C-tracer methods:a comparison. Mar Ecol Prog Ser 166:53–62
Heip CHR, Goosen NK, Herman PMJ, Kromkamp J, Middel-burg JJ, Soetaert KS (1995) Production and consumptionof biological particles in temperate tidal estuaries.Oceanogr Mar Biol Annu Rev 33:1–149
Hofstraat JW, Peeters JCH, Snel JFH, Geel C (1994) Simpledetermination of photosynthetic efficiency and photoin-hibition of Dunaliella tertiolecta by saturating pulse fluo-rescence measurements. Mar Ecol Prog Ser 103:187–196
Kolber Z, Falkowski PG (1993) Use of active fluorescence toestimate phytoplankton photosynthesis in situ. LimnolOceanogr 38:1646–1665
Kolber Z, Zehr J, Falkowski PG (1988) Effects of growth irra-diance and nitrogen limitation on photosynthetic energyconversion in photosystem II. Plant Physiol 88:923–929
Kolber Z, Wyman KD, Falkowski PG (1990) Natural variabil-ity in photosynthetic energy conversion efficiency: a fieldstudy in the Gulf of Maine. Limnol Oceanogr 35:72–79
Kolber ZS, Barber RT, Coale KH, Fitzwater SE, Greene RM,Johnson KS, Lindley S, Falkowski PG (1994) Iron limita-tion of phytoplankton photosynthesis in the equatorialPacific Ocean. Nature 371:145–149
Kolber ZS, Prásil O, Falkowski PG (1998) Measurements ofvariable chlorophyll fluorescence using fast repetition ratetechniques: defining methodology and experimental pro-tocols. Biochim Biophys Acta 1367:88–106
Krause GH, Weis E (1991) Chlorophyll fluorescence andphotosynthesis: the basics. Annu Rev Plant Physiol PlantMol Biol 42:313–349
Kromkamp J, Peene J (1997) Photosynthesis and nutrientlimitation of phytoplankton in the Oosterschelde estuaryestimated using PSII quantum efficiency and electronflow. In: Dehairs F, Elskens M, Goeyens L (eds) Integratedmarine system analysis: Proc 2nd network meeting. FreeUniversity Brussels, p 3–27
Kromkamp J, Peene J (1999) Estimation of phytoplanktonphotosynthesis and nutrient limitation in the EasternScheldt estuary using variable fluorescence. Aquat Ecol33:101–104
Kromkamp J, Peene J, van Rijswijk P, Sandee A, Goosen N(1995) Nutrients, light and primary production by phyto-plankton and microphytobenthos in the eutrophic, turbidWesterschelde estuary (The Netherlands). Hydrobiologia311:9–19
Kromkamp J, Barranguet C, Peene J (1998) Determination ofmicrophytobenthos PSII quantum efficiency and photo-synthetic activity by means of variable chlorophyll fluores-cence. Mar Ecol Prog Ser 162:45–55
Kroon BMA (1994) Variability of photosystem II quantumyield and related processes in Chlorella pyrenoidosa(Chlorophyta) acclimated to an oscillating light regimesimulating a mixed photic zone. J Phycol 30:841–852
Kroon BMA, Prézelin BB, Schofield O (1993) Chromatic regu-lation of quantum yields for photosystem II charge separa-tion, oxygen evolution, and carbon fixation in Heterocapsapygemaea (Pyrrophyta). J Phycol 29:453–462
Kühl M, Jørgensen BB (1994) The light field of microben-thic communities: radiance distribution and microscaleoptics of sandy coastal sediments. Limnol Oceanogr 39:1368–1398
Kühl M, Lassen C, Jørgensen BB (1994) Light penetration andlight intensity in sandy marine sediments measured withirradiance and scalar irradiance fiber-optic microprobes.Mar Ecol Prog Ser 105:139–148
Lewis MR, Smith JC (1983) A small volume, short-incubationtime method for measurement of photosynthesis as afunction of incident irradiance. Mar Ecol Prog Ser 13:99–102
Lomas MW, Glibert PM (1999) Temperature regulation ofnitrate uptake: a novel hypothesis about nitrate uptakeand reduction in cool-water diatoms. Limnol Oceanogr 44:556–572
MacIntyre HL, Cullen JJ (1995) Fine-scale vertical resolutionof chlorophyll and photosynthetic parameters in shallow-water benthos. Mar Ecol Prog Ser 122:227–237
MacIntyre HL, Cullen JJ (1996) Primary production by sus-pended and benthic microalgae in a turbid estuary: timescales of variability in San Antonio Bay, Texas. Mar EcolProg Ser 145:245–268
MacIntyre HL, Geider RJ, Miller DC (1996) Microphyto-benthos: the ecological role of the ‘secret garden’ ofunvegetated, shallow-water marine habitats. I. Distribu-tion, abundance and primary production. Estuaries 19:186–201
Platt T, Jassby AD (1976) The relationship between photosyn-thesis and light for natural assemblages of coastal marinephytoplankton. J Phycol 12:421–430
Revsbech NP, Jørgensen BB, Brix O (1981) Primary produc-tion of microalgae in sediments measured by oxygenmicroprofile, H14CO3
– and oxygen exchange methods.Limnol Oceanogr 26:717–730
Richardson K (1991) Comparison of 14C primary productiondeterminations made by different laboratories. Mar EcolProg Ser 72:189–201
Ruban AV, Horton H (1995) Regulation of non-photochemicalquenching of chlorophyll fluorescence in plants. Aust JPlant Physiol 22:221–230
Sabbe K (1997) Systematics and ecology of intertidal benthicdiatoms of the Westerschelde estuary (The Netherlands).PhD thesis, University of Ghent
Schreiber U, Schliwa U, Bilger W (1986) Continuous record-ing of photochemical and non-photochemical chlorophyllfluorescence quenching with a new type of modulationfluorometer. Photosynth Res 10:51–62
Schreiber U, Hormann H, Neubauer C, Klughammer C (1995)Assessment of photosystem II photochemical quantumyield by chlorophyll fluorescence quenching analysis.Aust J Plant Physiol 22:209–220
Serôdio J, da Silva JM, Catarino F (1997) Nondestructive tra-cing of migratory rhythms of intertidal benthic microalgaeusing in vivo chlorophyll fluorescence. J Phycol 33:542–553
Smith DJ, Underwood GJC (1998) Exopolymer productionby intertidal epipelic diatoms. Limnol Oceanogr 43:1578–1591
51

Mar Ecol Prog Ser 204: 39–52, 2000
Sullivan MJ, Montcreiff CA (1988) Primary production ofedaphic algal communities in a Mississippi salt marsh.J Phycol 24:49–58
Underwood GJC, Kromkamp J (1999) Primary production byphytoplankton and microphytobenthos in estuaries. AdvEcol Res 29:93–153
Underwood GJC, Phillips J, Saunders K (1998) Distribution ofestuarine benthic diatom species along salinity and nutri-ent gradients. Eur J Phycol 33:173–183
Wetsteyn LPMJ, Kromkamp JC (1994) Turbidity, nutrients
and phytoplankton primary production in the Ooster-schelde (The Netherlands) before, during and after alarge-scale coastal engineering project (1980–1990).Hydrobiologia 282/283:61–78
Wiltshire KH, Tolhurst T, Paterson DM, Davison I, Gust G(1998) Pigment fingerprints as markers of erosion andchanges in cohesive sediment surface properties in simu-lated and natural erosion events. In: Black KS, PatersonDM, Cramp A (eds) Sedimentary processes in the inter-tidal zone. Geol Soc Lond 139:99–114
52
Editorial responsibility: Otto Kinne (Editor),Oldendorf/Luhe, Germany
Submitted: August 27, 1999; Accepted: February 22, 2000Proofs received from author(s): August 30, 2000