estimating likelihood of filing a petition for...
TRANSCRIPT
15
LTA 1 /12 • p . 15–40
Erkki k. LaitinEn, Professor of Accounting and Business Finance
Department of Accounting and Business Finance, University of Vaasa • e-mail: [email protected]
Erkki k. LaitinEn
Estimating likelihood of filing
a petition for reorganization
and bankruptcy: evidence
from Finland
aBStraCt
The objective of Finnish Company Reorganization Act (FCRA) is to recover a temporally financially
distressed but viable firm, that is able to pay its obligations in the future. In Finnish Bankruptcy Act
(FBA) bankruptcy means that the assets of an unviable firm are liquidated and divided by the creditors
of the firm. It is argued that firms filing for FCRA include unviable firms (hypothesis 1). Similarly, it is
argued that firms filing for FBA include viable firms (hypothesis 2). The first purpose of this study is to
test these hypotheses to analyse the potential filtering failures of FCRA and FBA. Logistic regression
analysis is applied to estimate likelihood of filing for reorganization and bankruptcy, to test the hy-
potheses. The hypotheses are tested by contrasting reorganizing and bankrupt firms with viable firms.
The second purpose is to test two hypotheses set for the estimated probabilities: 1) pre-filing bankruptcy
increases the probability to file a reorganization petition (hypothesis 3) and 2) reorganization increases
the probability of bankruptcy (hypothesis 4). The probabilities are estimated using data from 47143
non-default (viable) firms, and from 81 and 244 firms filing reorganization or bankruptcy petition,
respectively. The results are validated in hold-out samples. Both financial and non-financial variables
are used as predictors. Evidence implied that both FCRA and FBA suffer from a filtering failure as ar-
gued by hypotheses 1 and 2. In addition, pre-filing bankruptcy remarkably affected the likelihood to
16
LTA 1 /12 • E . K . L A i T i n E n
reorganize (hypothesis 3). Finally, reorganization had a significant effect on the likelihood to bankrupt
(hypothesis 4).
Key words: reorganization, bankruptcy, Finnish Company Reorganization Act, logistic regression anal-
ysis, Finnish firms
JEL classifications: M Business Administration and Business Economics Marketing; Accounting, M4
Accounting, M41 Accounting
Acknowledgements: This study is a part of the projects of Academy of Finland Grant No 126630 and
“Solvency and strategic management of the firm” financed by Tekes (The Finnish Funding Agency for
Technology and Innovation) and a group of partners (Project Nr. 40101/08).
1. introduCtion
Conflicts of interest and asymmetry of information between equity and debt holders can force a
financially distressed but viable (efficient) firm to liquidate and may enable a distressed unviable
(inefficient) firm to continue (Mooradian, 1994). If there is no cost for an unviable firm to get ac-
cess to reorganization instead of liquidation, the efficiency of the reorganization system will be
ruined. That may lead to lengthy and expensive reorganization proceedings, which are not ben-
eficial for any stakeholder of the firm. Because of the controversial nature of reorganization, it
has been the object of keen discussion and research. For example, Thorburn (2000) has analysed
Swedish, Spear (1989) French, Sundgren (1998) and Laitinen (2011) Finnish, Takagi (2003) Japa-
nese, and Eger (2001), Franks, Nyborg & Torous (1996), and Schwehr (2003) German reorganiza-
tion procedure while Kaiser (1996), Couwenberg (2004), Philippe & Partners and Deloitte &
Touche (2002), Davydenko & Franks (2008), and Blazy, Chopard & Fimayer (2008) have compared
procedures in different countries. In fact, all countries seek to improve the efficiency of their
procedures by encouraging the reorganization of viable firms and the liquidation of unviable
ones. Nearly 90 countries around the world have reformed their bankruptcy codes since World
War II and more than half of them have done so during the last decade (Gine & Love, 2006: 2).
Most of the reorganization legislation is more or less based on the reorganization system of
the United States. The U.S. system offers businesses two main procedures to resolve financial
distress: Chapter 7 (liquidation of the firm) and Chapter 11 (reorganization of the firm). The U.S.
reorganization procedure has been analysed and compared with foreign procedures by a number
of researchers (see Altman, 1993; Franks et al., 1996; Kaiser, 1996; LoPucki & Doherty, 2002;
LoPucki, 2004). Firms that file for bankruptcy have a choice between liquidating under Chapter
7 and reorganizing under Chapter 11. In reorganization, the existing managers usually remain in
control and the firm continues to operate. The coalition behaviour theory based on the behaviour
17
E s T i m AT i n g L i K E L i h o o d f o r r E o r g A n i z AT i o n A n d b A n K r u p T c y
of three claimants (bondholders, bank lenders and equity) suggests that not all firms observed in
bankruptcy liquidation should shut down (White, 1989). However, managers may tend to choose
reorganization if it is best for them and for equity regardless of whether it is more valuable if the
firm shuts down or continues to operate. This suggests that under the U.S. system firms in bank-
ruptcy might not always be economically inefficient (unviable) and that inefficient firms might
not always end up in bankruptcy (White, 1989: 129).
In Finland, the Finnish Company Reorganization Act (FCRA) originally came into force on
8 February 1993. FCRA allows a distressed firm itself or its creditors to file a petition for reor-
ganization directly or after a petition for bankruptcy is filed and active. In the Finnish Bankruptcy
Act (FBA) bankruptcy means that the assets of the firm are given to the bankrupt estate and divided
by the creditors of the firm (liquidation). FCRA can be used to avoid bankruptcy if the firm is fi-
nancially distressed but viable and only temporarily unable to pay its financial obligations. When
the reorganization petition is submitted to the court, the firm can be protected against the de-
mands of creditors (automatic stay). Thus, it can be used as a way to avoid bankruptcy liquidation
at least temporarily even if the firm is unviable. When the firm is not selected by the court for
reorganization, it may become bankrupt. It may go bankrupt when it fails to carry out reorganiza-
tion program too. If unviable firms file for reorganization, it can make reorganization proceedings
inefficient due to the increased bureaucracy and cost for stakeholders. In the same way, large
economic values are lost when a distressed but viable firm files for bankruptcy. Thus, the efficiency
of reorganization and bankruptcy procedures is also important for government and corporate
policy.
The history of FCRA originates in the rapid increase of bankrupted firms during the depres-
sion 1989–1992. Sundgren (1998) showed that the payback rate for the creditors in Finnish
bankruptcies was on an average 22% whereas the median was only 18%. However, in 96.8 % of
all liquidations, general creditors received nothing (Bergström & Sundgren, 1998). Thus, bankrupt-
cies caused large economic losses to the Finnish economy, in addition to other negative conse-
quences. It was argued that FBA obviously had led to a situation where a large number of viable
firms went bankrupt, reducing the competitiveness of the economy. Ravid & Sundgren (1998)
showed that the survival rate in Finnish bankruptcies was only 29%. Because of the obvious
pitfalls in FBA, FCRA was enacted in 1993. In terms of payoff, FCRA has shown itself to be effi-
cient. The evidence presented by Sundgren (1998) indicates that creditors have received a better
payoff in reorganization than in bankruptcy liquidation.
FCRA however demonstrates obvious inefficiencies in picking up and rejecting reorganiza-
tion petitions filed by unviable firms. In all, 4 842 reorganization petitions were filed 1993–2007
(Statistics Finland). Finnish reorganization statistics show that on average 45% of the petitions
will lead to a confirmed reorganization plan. In addition, up to 40–50% of reorganizing firms are
18
LTA 1 /12 • E . K . L A i T i n E n
not able to complete their reorganization plan and will go bankrupt during the programme. The
failure rate of reorganizing firms is thus exceptionally high and comparable with the consumma-
tion rate of Chapter 11 (Jensen-Conklin, 1992). In the same period, 39 778 firms and 12 055
entrepreneurs have filed for bankruptcy under FBA. On average, more than 30% of the bankruptcy
petitions are withdrawn. Thus, FCRA and FBA may suffer from a filtering failure that impairs their
efficiency. If a system allows an unviable firm to reorganize or a viable firm to go bankrupt, two
kinds of filtering failure may occur. Under the null hypothesis that a bankrupt firm is not viable,
a Type I error occurs when an unviable firm is allowed to reorganize and a Type II error occurs
when a viable firm is bankrupted (White, 1994; Fisher & Martel, 2004; Laitinen, 2011).
It is therefore important to investigate the degree to which reorganizing and bankrupting
firms share characteristics with viable firms. This investigation will be done by testing four hy-
potheses. Firstly, it is argued that firms filing for FCRA include unviable firms (hypothesis 1) and
that firms filing for FBA include viable firms (hypothesis 2). In this context, viability is defined as
the ability of the firm to continue its business reflecting the message of FCRA. Empirically, the
viability of a firm is measured by its similarity with the characteristics of firms continuing in busi-
ness. This similarity is assessed by the (binary) logistic regression analysis (LRA) applied to dis-
criminate between reorganizing or bankrupt firms and ongoing firms. LRA estimates the likelihood
of filing a petition for reorganization or bankruptcy. It is also argued that pre-filing a bankruptcy
petition increases the likelihood of filing a reorganization petition (hypothesis 3) and that reor-
ganization increases the likelihood of filing a bankruptcy petition (hypothesis 4). The four research
hypotheses are tested for data from 47 143 viable (non-default) firms, and 81 and 244 firms filing
reorganization or bankruptcy petitions respectively in 2004. In their proceedings, FCRA and FBA
are comparable with systems in other countries (see Philippe et al., 2002). Therefore, the results
reported here would be of relevance for several countries.
The paper is organized as follows. First, the background and objectives of the study are
discussed in the introduction. The second section deals with relevant prior studies concentrating
on the characteristics of reorganizing and bankruptcy firms. These characteristics are used as a
basis for variable selection in estimating reorganization and bankruptcy probabilities. In addition,
the section briefly discusses FBA and FCRA to justify the four hypotheses drawn for these proceed-
ings. In the third section, the data and statistical methods for the empirical analysis are presented.
LRA is introduced as a method to estimate the probabilities using a pre-justified set of financial
and non-financial variables as predictors. Empirical results are presented and discussed in the
fourth section. It will be shown that empirical evidence gives support to the research hypotheses.
The last section summarizes the findings of the study and discusses the limitations of the approach.
Several suggestions for further research are presented.

19
E s T i m AT i n g L i K E L i h o o d f o r r E o r g A n i z AT i o n A n d b A n K r u p T c y
2. rEorganization and BankruptCy dECiSionS
2.1. predictors of reorganization and bankruptcy likelihood
The efficiency of bankruptcy and reorganization procedures is not only an academic issue but
also a matter of importance for government and corporate policy (Ravid & Sundgren, 1998). Ef-
ficient procedures should ensure that only economically inefficient (unviable) firms declared
bankrupt and that, efficient (viable) firms are reorganized and can continue to operate. In this
context, the crucial question is how to measure viability ex ante in order to make the proceedings
efficient. By its definition, viability means ability to survive so that the question is about predic-
tion. Thus, an ex-ante measure should be constructed using predicted outcomes from an econo-
metric model of the outcome of process (Fisher & Martel, 2004). This predicted outcome (based
on relevant predictors or characteristics) measures the ex-ante viability of the firm that is important
for the stakeholders when making the decision whether to reorganize or to liquidate and also to
assess the efficiency of procedures. In this study, an econometric model will be developed to get
an ex-ante measure of viability to test the four research hypotheses. Therefore, it is important to
justify the predictors of the model using relevant prior studies.
Many studies on reorganization or bankruptcy decisions are based on the coalition behaviour
theory first proposed by Bulow & Shoven (1978). They considered three claimants to the cash
flows and assets of the firm: bondholders, bank lenders and equity. Bulow and Shoven used coali-
tion behaviour theory to show the conditions under which bankruptcy would occur. This theory
is adopted to determine whether a firm under the U.S. bankruptcy system would continue (Chap-
ter 11) or liquidate (Chapter 7). They used their theory to explain the tendency for inefficient firms
to survive Chapter 11 proceedings. White (1980, 1984, and 1989) applied coalition theory to
investigate decision making under the U.S. Chapter 11 reorganization procedure. White showed
that the choice between reorganization and liquidation is directly related to the financial position
of the firm. She postulated the following financial characteristics that affect the reorganization
decision: equity commitment, leverage position, payoff in reorganization compared to liquidation,
future profitability, and the amount of secured debt.
The coalition behaviour theory is interesting, since it can be applied to describe the behav-
iour of financially distressed firms in different situations (Routledge & Gadenne, 2000: 236). In
addition, the theory has been used in development of reorganization prediction models. Examples
of important studies in this line are Frost-Drury, Greinke & Shailer (1998), Campbell (1996), Fisher
& Martel (1995), Hotchkiss (1995), Jensen-Conklin (1992), Franks & Torous (1989), Casey, McGee
& Stickney (1986), Hong (1983), LoPucki (1983a and 1983b), Comerford (1976), Barniv et al.
(2002), and Fisher & Martel (2004). These studies show that size, capital structure, liquidity, and
profitability are important determinants of reorganization decisions. Routledge & Gadenne (2000)

20
LTA 1 /12 • E . K . L A i T i n E n
applied this theory to the Australian voluntary administration (VA) insolvency decision but the
leverage effect contradicted the theory. They suggested that this contradictory result needs to be
considered in the context of financial restructuring that will likely take place in reorganization.
The capital structure and leverage may be altered significantly because of reorganization due to
the rate of debt remission. In Finland, Sundgren (1998) and Laitinen (2011) have analysed the
reorganization decision. Most studies are concentrated on financial variables, because financial
statements are usually publicly available and presented in a standardized form (Poston, Harmon
& Gramlich, 1994).
The likelihood of bankruptcy largely depends on the same predictors as the likelihood of
reorganization because bankruptcy and reorganization are different aspects of the same decision
for a distressed firm. For example, Beaver (1966), Altman (1968), Scott (1981), Jones (1987),
Karels & Prakash (1987), Laitinen & Kankaanpää (1999), Lensberg et al. (2006) and Balcaen &
Ooghe (2006) discuss financial determinants of distress on theoretical and empirical grounds.
Leverage, profitability, liquidity, cash flow, and size are supported as predictors by bankruptcy
theory and related empirical evidence (Scott, 1981, Jones, 1987, and Laitinen, 1991). Bankruptcy
theory hints at how the predictors should be selected to be theoretically justified (Scott, 1981).
Wilcox (1971; 1973; 1976) and Santomero & Vinso (1977) developed a bankruptcy theory based
on the gambler’s ruin model. Scott (1981) developed the theory further and showed that the prob-
ability of failure is an explicit function of the expected value and the standard deviation of the
change in retained earnings (net income minus dividends), and the current market value of equity,
all divided by total assets. Thus, this kind of approach suggests that the profitability together with
its volatility and the equity ratio are important predictors of bankruptcy. Scott showed that in this
form the probability has obvious similarities with the ZETA model by Altman et al. (1977). Both
models contain stock variables that reflect financial position at a point of time and flow variables
that involve estimates of future cash flow distribution. Scott also expanded the basic model and
showed theoretically that the size (total assets in ZETA) and the liquidity of the firm (current ratio
in ZETA) can also affect the probability of bankruptcy.
Most studies concentrate on financial predictors alone. However, reorganization decisions
and bankruptcy are also dependent on some non-financial characteristics of the firm (Poston,
Harmon & Gramlich, 1994). Keasey & Watson (1987) discussed non-financial predictors of bank-
ruptcy such as managerial structure, inadequacy of accounting information systems and audit
lags, submission lags, audit qualifications, and changes in auditors. In their analysis, the number
of directors and submission lags were important predictors of distress. Laitinen (1999) used several
non-financial variables to explain risk assessments made by financial analysts. He showed that
the prior payment history and characteristics of directors are most significant dimensions. Back
(2005) classified non-financial determinants in his study into the following classes: characteristics

21
E s T i m AT i n g L i K E L i h o o d f o r r E o r g A n i z AT i o n A n d b A n K r u p T c y
of management, prior payment behaviour, group membership, and age. His analysis also showed
that prior payment behaviour is the most important dimension in explaining financial distress. In
addition to the dimensions above, industry and age of firm have proven to be significant predic-
tors of financial distress (El Hennawy & Morris, 1983; Shumway, 2001). In addition, industry is
shown to be an important determinant of successful reorganization (Campbell, 1996, Hotchkiss,
1995, LoPucki, 1983, and Routledge & Gadenne, 2000). Kennedy & Shaw (1991) argued that
going concern audit opinion also has an incremental predictive value in discriminating between
reorganized and liquidated firms. However, evidence on this value is mixed (Casterella, Lewis &
Walker, 2000). In Finland, Laitinen (2011) has used a large set of financial and non-financial
variables to develop a statistical measure of viability. He showed that non-financial variables (such
as those above) contribute important incremental information over financial variables when
measuring the viability of firms.
2.2. Finnish bankruptcy and reorganization acts
In Finland, bankruptcy proceedings are governed by the Finnish Bankruptcy Act (FBA), which
includes liquidation proceedings (Philippe et al., 2002; Koskelo, 2003). The purpose of proceed-
ings is to liquidate the assets of the debtor (a distressed firm) for the benefit of the creditors.
Bankruptcy proceedings may be initiated either by the debtor or by a creditor. The petitions for
bankruptcy proceedings are handled by the district courts. When the firm itself files for bank-
ruptcy, the proceedings are opened forthwith, without any examination as to the insolvency.
However, when a petition is filed by its creditor the court shall provide the firm with an oppor-
tunity to be heard. A prerequisite for the opening of bankruptcy proceedings on the basis of a
petition from a creditor is that the firm is insolvent. When opening the proceedings, the court
appoints a provisional receiver to administer the estate of the debtor. The receiver submits an
inventory of the estate to the court after a hearing of creditors. If the court judges that there are
sufficient assets in the estate to merit full bankruptcy proceedings, the court appoints one or more
administrators. If there are not sufficient assets, bankruptcy will be dropped due to lack of means.
In the period 1993–2007, 39 778 firms and 12 055 entrepreneurs filed for bankruptcy under FBA.
More than 30% of the bankruptcy petitions are withdrawn. FBA may thus be used as a method
to force a viable debtor firm to repay its debt. In addition, FBA is criticized for liquidating viable
firms although they would be able to continue business. These criticisms have led to the research
hypothesis below (H2).
The Finnish Company Reorganization Act (FCRA) in its original form came into force 8 Feb-
ruary 1993 (Act 1993/47). It establishes a legal framework for the reorganization of enterprises
that are economically viable but currently suffering financial difficulties. The aim of the reor-
ganization proceedings is to provide the administrator, debtor, and creditors with an opportunity

22
LTA 1 /12 • E . K . L A i T i n E n
to produce a reorganization plan aimed at recovering the firm and a debt adjustment program
necessary to this end. Proceedings for reorganization may be used as an alternative to bankruptcy
proceedings in cases where financial crisis may be averted or resolved by a reorganization plan.
A petition for reorganization proceedings may be filed by the debtor or by a creditor. The time
allowed for filing is typically less than 30 days when the bankruptcy petition is active. Proceedings
may be opened if the debtor is insolvent or insolvency is impending. It is important that a petition
for reorganization proceedings supersedes a petition for bankruptcy until the court decides
whether or not to open reorganization proceedings. Once bankruptcy proceedings concerning
the debtor have been opened, reorganization proceedings are no longer possible. Therefore, a
firm in liquidation cannot apply for reorganization proceedings.
Every year, a large number of Finnish firms apply for FCRA. Statistics Finland shows that
4 842 firms have filed a reorganization petition in the period 1993–2007. However, only a frac-
tion of these petitions will lead to a legal reorganization programme. First, up to 60% of the re-
organization petitions are approved by the court. Second, only 75% of those petitions will result
in a reorganization plan confirmed in court. Finally, as many as 40–50% of reorganizing firms
fail in carrying out the confirmed plan and will go bankrupt during the program. This means that
only 18–22% of the firms applying for reorganization will finally carry out the programme suc-
cessfully. Thus, the failure rate of reorganizing firms is high when compared for example with
reorganization in Canada (Fisher & Martel, 1995). It is however comparable with the consumma-
tion rate of Chapter 11 in the United States (Jensen-Conklin, 1992). This implies that FCRA is not
very efficient when trying to pick out viable firms for reorganization leading to the research hy-
pothesis below (H1).
The inefficiency of the reorganization procedure is caused primarily by the difficulty the
court has in picking out and rejecting unviable firms in different stages of proceedings, since these
firms are pooled with their viable counterparts. Because a prerequisite for opening proceedings
is that the firm is insolvent or that insolvency is impeding, it is difficult to discriminate between
viable and unviable firms that fulfil this condition. In addition, FCRA may motivate unviable firms
to postpone bankruptcy, since a superseding reorganization petition can be filed when the cred-
itor has filed a petition for bankruptcy and it is active. This means that pre-filing a bankruptcy
petition may increase the likelihood of submitting a reorganization petition, as argued in the
hypothesis below (H3). In the same way, these inefficiencies may cause reorganizing firms to show
an exceptionally high risk of going bankrupt, leading to the fourth research hypothesis (H4).
The characteristics of the bankruptcy act (FBA) and the reorganization act (FCRA) may thus
allow a viable firm to liquidate under FBA and an unviable firm to continue under FCRA. FCRA
also makes it possible for a distressed firm to file for reorganization when the bankruptcy petition
is active. Thus pre-filing for bankruptcy may increase the likelihood of reorganizing. In addition,
23
E s T i m AT i n g L i K E L i h o o d f o r r E o r g A n i z AT i o n A n d b A n K r u p T c y
firms reorganizing under FCRA tend to show an exceptionally high risk of bankruptcy. Hence, it
can be expected that reorganization will increase the likelihood of bankruptcy. These inefficien-
cies reflect a filtering failure in the first stages of the legal bankruptcy and reorganization proce-
dures. Therefore, the following four research hypotheses are drawn:
H1: Firms filing for reorganization under FCRA include unviable firms.
H2: Firms filing for bankruptcy under FBA include viable firms.
H3: Pre-filing a bankruptcy petition increases the likelihood of filing a reorganization petition.
H4: Reorganization increases the likelihood of filing a petition for bankruptcy.
3. EmpiriCaL data and StatiStiCaL mEthodS
3.1. Empirical data
The data available for the study include financial statements and non-financial background infor-
mation from 65 164 firms. The empirical data have been obtained in a disguised form from the
largest Finnish credit information company Finska (Suomen Asiakastieto Oy) for research purposes
(see http: www.asiakastieto.fi). The data have been gathered from the data base of Finska as at
13.12.2003 and include a large set of financial and non-financial variables. The reorganization
and bankruptcy filings to be predicted have emerged after the beginning of 2004 but before 31
December 2004. The selection of viable firms was made in two stages. First, the firms that do not
have any payment defaults during the event period are selected. It is however possible that a
non-default firm can fail immediately after the event period. In the second stage, the firms having
payment defaults after this period until the end of April 2005 were therefore dropped from the
sample. This process ensured that the sample of viable firms only includes firms demonstrating
an ability to survive. The number of such firms is 63 177. In the event period, 109 firms filed for
reorganization and 330 firms filed for bankruptcy. In this period (1 September 2004), FBA was
revised. However, this revision was minor and does not affect the present analysis or the gener-
alization of the results. From the data, a sample of 75% was randomly selected for estimation
(estimation data). In addition, 25% of the data were used in validation of the classification results
(test data).
These data include a majority of Finnish firms which publish annual financial statements
according to the Accounting Law. Therefore, the estimation data form a statistically representative
sample of firms publishing annual statements. However, the population does not correspond to
the size distribution of all Finnish firms, because some non-corporations and very small (micro)
firms are missing, as at the time such firms were not obliged to publish their financial statements
(the legislation has since changed). Reorganization and bankruptcy firms are typically small and

24
LTA 1 /12 • E . K . L A i T i n E n
many of them are non-corporations. Therefore, the present sample includes only a fraction of
them. In the event period (2004), 315 firms filed a petition for reorganization and 2 417 firms
filed for bankruptcy (Statistics Finland). Thus, the sample includes 34.6% of reorganizing firms
and only 13.7% of bankruptcy petitioning firms. Very small firms and many non-corporations are
not represented by the data. These data are similar to those applied by Laitinen (2011).
Appendix 1 shows descriptive statistics of the present sample. Panel 1 of the appendix
presents the industrial distribution of the sample firms separately for viable, reorganizing, and
bankrupt firms. The chi-square statistics show that the distributions of reorganizing and bankrupt
firms differ from that of viable firms in a statistically significant manner (p-values are 0.0018 and
0.000, respectively). In reorganizing firms, the proportion of manufacturing firms is exceptionally
high (32.1%) in comparison with viable firms (14.8%). Among bankrupt firms, construction firms
are exceptionally frequent (23.9%) when compared with viable firms (11.8%). Panel 2 shows that
on average reorganizing and bankruptcy firms are younger than viable firms. The p-values of F
test are 0.047 and 0.000 respectively for reorganizing and bankruptcy firms in comparison with
viable firms. The size distributions measured by net sales and total assets show that the average
size of viable firms remarkably exceeds that of reorganizing and bankruptcy firms. However, the
median values for all groups are small, but larger for reorganizing and bankruptcy firms than for
viable firms. All size distributions are strongly skewed and there are no statistically significant
differences in the distribution between the groups.
3.2. Statistical methods and variables
In the present study, binary LRA will be applied to estimate the conditional probabilities to reor-
ganize and to go bankrupt to test the four research hypotheses. LRA can be used to predict a
dependent variable on the basis of continuous or categorical independent variables and also to
determine the percentage of variance in the dependent variable explained by the independent
variables. This analysis does not require that independent variables are multivariate normal or
that groups have equal covariance matrices that are basic assumptions in linear discriminant
analysis (Hosmer & Lemeshow, 1989). LRA creates a score (logit) L for every firm. It is assumed
that the independent variables be linearly related to L. This score is used to determine the condi-
tional probability to reorganize or go bankrupt as follows:
(4)
11
variables. This analysis does not require that independent variables are multivariate normal or that groups have equal covariance matrices that are basic assumptions in linear discriminant analysis (Hosmer & Lemeshow, 1989). LRA creates a score (logit) L for every firm. It is assumed that the independent variables be linearly related to L. This score is used to determine the conditional probability to reorganize or go bankrupt as follows:
)(Xpi = )..( 11011
11
nnxbxbbL ee (4)
where i refers either to reorganization (i = R) or bankruptcy (i = B), bj (j=0,…, n) are coefficients and n is the number of independent variables xj (j=1,…, n). The LR (logistic regression) models are estimated by the maximum likelihood method in SPSS. The significance of the coefficients is tested by the Wald test statistic. This test is used to test hypotheses H3 and H4 on the effects of pre-filing bankruptcy and reorganization on reorganizing and bankruptcy probabilities, respectively. The strength of association is assessed by the standard tests for LRA such as the Nagelkerke R Square, Cox & Snell R Square and -2 log likelihood. The goodness of fit of the model is tested by the Hosmer-Lemeshow chi-square test. This test is performed by dividing the predicted probabilities into deciles and then computing a chi-square to compare the predicted and observed frequencies. Higher p-values indicate a good fit to the data. In fact, this tests the linearity of the logit. The classification accuracy of the LR model in the sample is measured by the frequencies of Type I and Type II classification errors. The proportion of event firms is used as the cut-off value in the classification. The classification results are validated in the hold-out validation data (25% of the data). The strength of association, the goodness of fit, and especially the accuracy of classification are used to test hypotheses H1 and H2. The higher (lower) the degree to which reorganization (bankruptcy) firms differ from viable firms, the more likely it is that the firms include unviable (viable) firms as assumed by H1 (H2). This degree is assessed here by the statistical tests above but also graphically by the ROC (Receiver Operating Characteristic) curve. When estimating the probability of filing a reorganization petition (pR(X)), the dependent variable (Z) in LRA is a binary variable that is 0 for a viable firm and 1 for a firm filing a reorganization petition in the event period. When estimating the probability of going bankrupt (pB(X)), Z is 0 for a viable firm and 1 for a firm filing a bankruptcy petition in that period. The set of independent variables X is the same for each probability as supposed by previous research. In order to test hypotheses H3 and H4, it is important that the set X is as comprehensive as possible and drawn from prior research on the predictors, since the variables in the set act as control variables for the effects of pre-filing bankruptcy and reorganization. Therefore, 13 non-financial and five financial variables are selected to represent the predictors of reorganizing and bankruptcy probabilities (n=18). Each of these variables has been found to be statistically significant in prior reorganization and/or bankruptcy studies (see above). However, they are not all applied in the same earlier study.
where i refers either to reorganization (i = R) or bankruptcy (i = B), bj (j = 0,…, n) are coefficients
and n is the number of independent variables xj (j = 1,…, n).
25
E s T i m AT i n g L i K E L i h o o d f o r r E o r g A n i z AT i o n A n d b A n K r u p T c y
The LR (logistic regression) models are estimated by the maximum likelihood method in
SPSS. The significance of the coefficients is tested by the Wald test statistic. This test is used to test
hypotheses H3 and H4 on the effects of pre-filing bankruptcy and reorganization on reorganizing
and bankruptcy probabilities, respectively. The strength of association is assessed by the standard
tests for LRA such as the Nagelkerke R Square, Cox & Snell R Square and -2 log likelihood. The
goodness of fit of the model is tested by the Hosmer-Lemeshow chi-square test. This test is per-
formed by dividing the predicted probabilities into deciles and then computing a chi-square to
compare the predicted and observed frequencies. Higher p-values indicate a good fit to the data.
In fact, this tests the linearity of the logit. The classification accuracy of the LR model in the
sample is measured by the frequencies of Type I and Type II classification errors. The proportion
of event firms is used as the cut-off value in the classification. The classification results are vali-
dated in the hold-out validation data (25% of the data). The strength of association, the goodness
of fit, and especially the accuracy of classification are used to test hypotheses H1 and H2. The
higher (lower) the degree to which reorganization (bankruptcy) firms differ from viable firms, the
more likely it is that the firms include unviable (viable) firms as assumed by H1 (H2). This degree
is assessed here by the statistical tests above but also graphically by the ROC (Receiver Operating
Characteristic) curve.
When estimating the probability of filing a reorganization petition (pR(X)), the dependent
variable (Z) in LRA is a binary variable that is 0 for a viable firm and 1 for a firm filing a reorga-
nization petition in the event period. When estimating the probability of going bankrupt (pB(X)),
Z is 0 for a viable firm and 1 for a firm filing a bankruptcy petition in that period. The set of inde-
pendent variables X is the same for each probability as supposed by previous research. In order
to test hypotheses H3 and H4, it is important that the set X is as comprehensive as possible and
drawn from prior research on the predictors, since the variables in the set act as control variables
for the effects of pre-filing bankruptcy and reorganization. Therefore, 13 non-financial and five
financial variables are selected to represent the predictors of reorganizing and bankruptcy prob-
abilities (n=18). Each of these variables has been found to be statistically significant in prior re-
organization and/or bankruptcy studies (see above). However, they are not all applied in the same
earlier study.
First, the non-financial independent variables applied in LRA are: industry propensity for
bankruptcy (industry effect); logarithmic age in months (age); logarithmic number of board mem-
bers; percentage of board members resigned during the last year; logarithmic number of board
member personal defaults; logarithmic number of board member links to bankrupt firms (charac-
teristics of managers); corporation dummy (0 = limited company, 1 otherwise); modified audit
report dummy (0 = non-modified report, 1 otherwise); length of last accounting period in months
26
LTA 1 /12 • E . K . L A i T i n E n
(submission lag); months to the date of last financial statements (age of financial data); logarithmic
number of payment defaults during the last 12 months; logarithmic number of active delays in
payment; and logarithmic number of active positive payment signals (prior payment behaviour).
Second, the five financial independent variables are as follows: logarithmic net sales (size); equity
ratio (leverage); traditional cash flow to sales (cash flow); quick ratio (liquidity); and return on
investment ratio (profitability). In addition, two dummy variables are used in LRA as covariates
to test hypotheses H3 and H4, respectively. The first (second) dummy variable is 1 when a credi-
tor (the firm) has filed a bankruptcy (reorganization) petition before the event period and 0 oth-
erwise. If the coefficient of the first (second) dummy variable is positive and statistically signifi-
cant, pre-filing a bankruptcy (reorganization) petition has an effect on the likelihood of filing a
reorganization (bankruptcy) petition that is consistent with H3 (H4).
The correlations between the independent variables in the estimation sample (not reported
here) are in general very low. Most correlation coefficients of the 153 correlations ((18∙17)/2) are
below 0.10. Only 24 correlation coefficients exceed 0.10 and nine of them exceed 0.20. The
highest Pearson correlations are found between the following variables: logarithmic number of
payment defaults during last 12 months and logarithmic number of active delays in payment
(0.445); traditional cash flow to sales and return on investment ratio (0.442); logarithmic number
of positive payment signals and logarithmic net sales (0.424); and equity ratio and quick ratio
(0.370). Thus, there are no severe multicollinearity problems with the independent variables in
LRA.
4. EmpiriCaL rESuLtS
4.1. Estimating probability of filing a reorganization petition
Appendix 2 shows descriptive statistics of the eighteen independent variables for viable and re-
organizing firms in the estimation sample. The appendix also shows the statistics for the pre-filing
bankruptcy dummy variable. The mean of this variable shows that only about 5% of the firms
filing for reorganization in the event period, have a pre-filing bankruptcy petition. It is clear that
the percentage is small because the time for submitting the reorganization petition when the
bankruptcy petition is filed by the creditor, is usually only than 30 days or less and the event
period is as long as one year (on an average 40–50% of reorganization firms may have a pre-filing
bankruptcy). Thus, predictive information that is older than 30 days cannot take account of this
petition that is filed later in the event period. This kind of bankruptcy petition is however naturally
very rare for viable (non-default control) firms. Therefore, the difference is statistically very sig-
nificant that at the univariate level gives support to H3. Besides this variable, the most significant
differences between reorganizing and viable firms are found in the logarithmic number of delays
27
E s T i m AT i n g L i K E L i h o o d f o r r E o r g A n i z AT i o n A n d b A n K r u p T c y
in payment; the logarithmic number of payment defaults (prior payment behaviour); the equity
ratio (leverage); the logarithmic number of board member links to bankrupt firms (characteristics
of managers); the modified audit report dummy (audit report modification); and the return on
investment ratio (profitability).
Table 1 presents the estimation results for LRA. Panel 1 shows the model summary tests. The
Nagelkerke R Square of the estimated probability model is 0.36 %, which indicates a moderately
high strength of fit. Furthermore, the Hosmer & Lemeshow test statistic is not statistically signifi-
cant referring to a high goodness of fit with the data (linearity of the logit). Panel 3 shows the
classification accuracy of the estimated LR model. In the estimation and test data, the model
classifies correctly about 90% of the viable firms and about 77% of the reorganizing firms. Thus,
10% of viable firms may have similar characteristics to the reorganizing firms while 23% of reor-
ganizing firms share characteristics with viable firms. The classification accuracies are almost
identical in the estimation data and in the test data indicating a valid classification model. Hence,
a large majority of reorganizing firms clearly differ from typical viable firms. However, a small
fraction of viable firms does not differ from typical reorganizing firms.
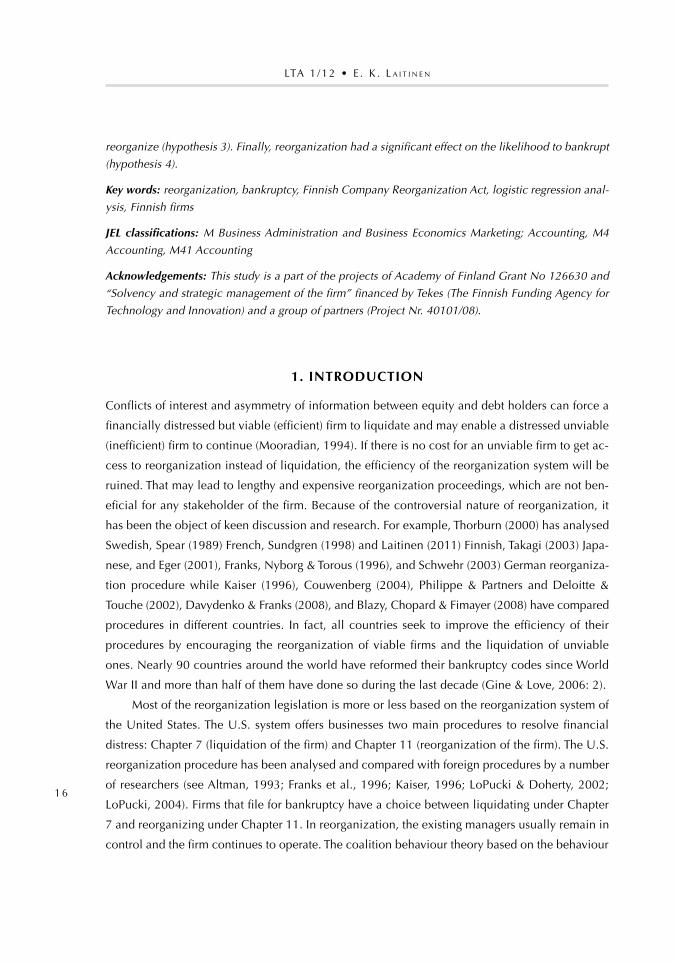
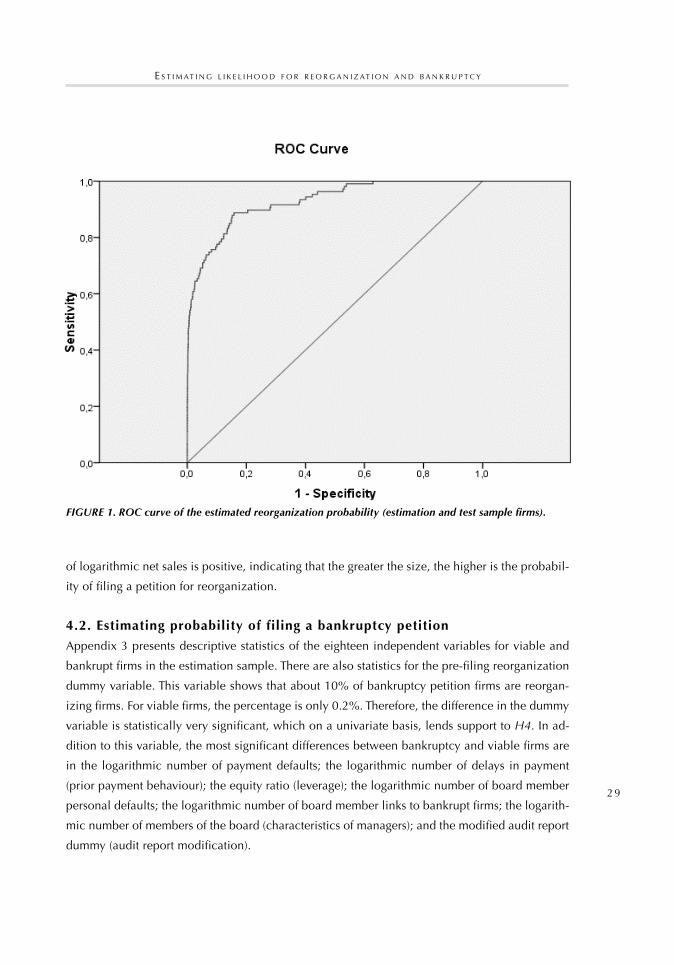
Figure 1 shows the ROC curve for the total sample including all firms (estimation and test
samples). The x-axis shows the percentage of viable firms that are incorrectly classified as reorgan-
izing firms when the cut-off value is changed. The y-axis presents the percentage of reorganizing
firms that are classified correctly. The area under the ROC curve (AUC) is 0.927 that suggests a
high degree of accuracy in classification. The curve shows that about 50% of reorganizing firms
are correctly classified when at the same time (for the same cut-off value) approximately 0% of
viable firms are incorrectly classified as reorganizing firms. Thus, it can be supposed that ap-
proximately at least 50% of reorganizing firms are not viable and do not share the characteristics
of viable firms at all. In conclusion, these classification results give support to H1. A large percent-
age of the firms filing a reorganization petition in the event period cannot be considered viable
on the basis of the ex ante prediction model. This result conforms to the message from the reor-
ganization ex post statistics.
Panel 2 of the table shows the parameters of the estimated LR model. The prior bankruptcy
dummy is statistically significant at a p-level of 2.3% that at least partly supports H3. The coef-
ficient of the variable is large showing that prior bankruptcy strongly increases probability of
filing a reorganization petition. The last column of the panel (Exp(B)) shows that when a creditor
of the firm has filed a petition for bankruptcy, the probability of filing a reorganization petition
for the firm is more than 50 times higher than for a firm without such a petition. The most sig-
nificant coefficients of the LR model are obtained for the logarithmic number of delays in pay-
ment; the logarithmic number of payment defaults (prior payment behaviour); the equity ratio
(leverage); the logarithmic age in months (age); and the logarithmic net sales (size).The coefficient

28
LTA 1 /12 • E . K . L A i T i n E n
TABLE 1. Logistic regression model for the reorganization probability.
panEL 1. model summary tests.
model summary hosmer and Lemeshow test
–2 Log likelihood
Cox & Snell r Square
nagelkerke r Square
Chi-square p-value
761.4105 0.0095 0.3596 6.2002 0.6248
panEL 2. parameters of the binary logistic regression model.
Variables in the equation Coefficient Standard deviation
Wald p-value Exp(B)
prior bankruptcy dummy 3.9329 1.7267 5.1880 0.0227 51.0563
industry prospensity for bankruptcy (%) 0.2270 0.1974 1.3219 0.2503 1.2548
Log. age in months –0.5816 0.1758 10.9489 0.0009 0.5590
Log. number of members on board –0.3725 0.4760 0.6123 0.4339 0.6890
number of resigned board members (%) 0.0110 0.0137 0.6358 0.4252 1.0110
Log. number of board member personal defaults –0.0239 0.3740 0.0041 0.9490 0.9764
Log. number of board member links to bankrupt firms
0.5991 0.4375 1.8751 0.1709 1.8205
Corporation dummy 1.0255 0.7969 1.6561 0.1981 2.7886
modified audit report dummy 0.0215 0.2979 0.0052 0.9424 1.0218
Length of last accounting period (months) –0.0489 0.0988 0.2447 0.6209 0.9523
months to the date of last financial statements –0.0025 0.0251 0.0098 0.9211 0.9975
Log. number of payment defaults 1.2999 0.2601 24.9853 0.0000 3.6690
Log. number of delays in payment 2.6789 0.2013 177.1194 0.0000 14.5684
Log. number of positive payment signals –0.1683 0.1300 1.6768 0.1954 0.8451
Log. net sales 0.2702 0.0874 9.5565 0.0020 1.3102
Equity ratio (%) –0.0140 0.0037 14.1675 0.0002 0.9861
traditional cash flow to sales (%) –0.0010 0.0070 0.0221 0.8818 0.9990
Quick ratio –0.0370 0.0732 0.2561 0.6128 0.9636
return on investment ratio (%) –0.0064 0.0038 2.8832 0.0895 0.9936
Constant –6.2757 1.7340 13.0986 0.0003 0.0019
panEL 3. Classification accuracy of the model.
Estimation data: test data:predicted: predicted:
observed: Viable reorgani-zation
Correct, % Viable reorgani-zation
Correct, %
Viable firms 39754 4502 89.8 13438 1509 89.9
reorganization firms 00018 0063 77.8 00vv6 0020 76.9
overall accuracy 89.8 89.9
29
E s T i m AT i n g L i K E L i h o o d f o r r E o r g A n i z AT i o n A n d b A n K r u p T c y
of logarithmic net sales is positive, indicating that the greater the size, the higher is the probabil-
ity of filing a petition for reorganization.
4.2. Estimating probability of filing a bankruptcy petition
Appendix 3 presents descriptive statistics of the eighteen independent variables for viable and
bankrupt firms in the estimation sample. There are also statistics for the pre-filing reorganization
dummy variable. This variable shows that about 10% of bankruptcy petition firms are reorgan-
izing firms. For viable firms, the percentage is only 0.2%. Therefore, the difference in the dummy
variable is statistically very significant, which on a univariate basis, lends support to H4. In ad-
dition to this variable, the most significant differences between bankruptcy and viable firms are
in the logarithmic number of payment defaults; the logarithmic number of delays in payment
(prior payment behaviour); the equity ratio (leverage); the logarithmic number of board member
personal defaults; the logarithmic number of board member links to bankrupt firms; the logarith-
mic number of members of the board (characteristics of managers); and the modified audit report
dummy (audit report modification).
23
FIGURES FIGURE 1. ROC curve of the estimated reorganization probability (estimation and test sample firms).
FIGURE 1. ROC curve of the estimated reorganization probability (estimation and test sample firms).
30
LTA 1 /12 • E . K . L A i T i n E n
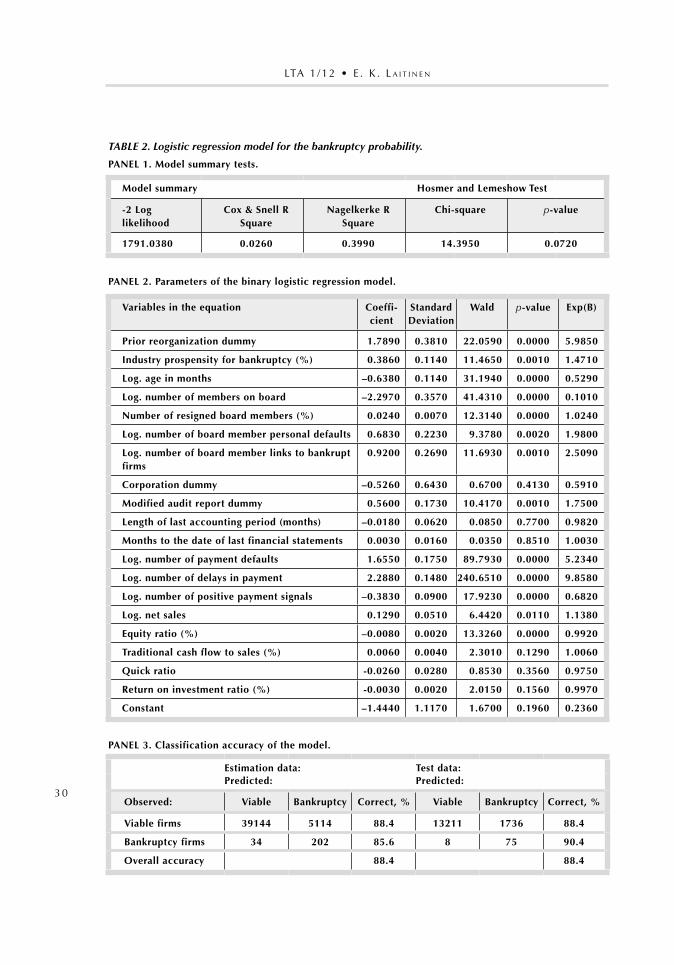
TABLE 2. Logistic regression model for the bankruptcy probability.
panEL 1. model summary tests.
model summary hosmer and Lemeshow test
-2 Log likelihood
Cox & Snell r Square
nagelkerke r Square
Chi-square p-value
1791.0380 0.0260 0.3990 14.3950 0.0720
panEL 2. parameters of the binary logistic regression model.
Variables in the equation Coeffi-cient
Standard deviation
Wald p-value Exp(B)
prior reorganization dummy 1.7890 0.3810 22.0590 0.0000 5.9850
industry prospensity for bankruptcy (%) 0.3860 0.1140 11.4650 0.0010 1.4710
Log. age in months –0.6380 0.1140 31.1940 0.0000 0.5290
Log. number of members on board –2.2970 0.3570 41.4310 0.0000 0.1010
number of resigned board members (%) 0.0240 0.0070 12.3140 0.0000 1.0240
Log. number of board member personal defaults 0.6830 0.2230 9.3780 0.0020 1.9800
Log. number of board member links to bankrupt firms
0.9200 0.2690 11.6930 0.0010 2.5090
Corporation dummy –0.5260 0.6430 0.6700 0.4130 0.5910
modified audit report dummy 0.5600 0.1730 10.4170 0.0010 1.7500
Length of last accounting period (months) –0.0180 0.0620 0.0850 0.7700 0.9820
months to the date of last financial statements 0.0030 0.0160 0.0350 0.8510 1.0030
Log. number of payment defaults 1.6550 0.1750 89.7930 0.0000 5.2340
Log. number of delays in payment 2.2880 0.1480 240.6510 0.0000 9.8580
Log. number of positive payment signals –0.3830 0.0900 17.9230 0.0000 0.6820
Log. net sales 0.1290 0.0510 6.4420 0.0110 1.1380
Equity ratio (%) –0.0080 0.0020 13.3260 0.0000 0.9920
traditional cash flow to sales (%) 0.0060 0.0040 2.3010 0.1290 1.0060
Quick ratio -0.0260 0.0280 0.8530 0.3560 0.9750
return on investment ratio (%) -0.0030 0.0020 2.0150 0.1560 0.9970
Constant –1.4440 1.1170 1.6700 0.1960 0.2360
panEL 3. Classification accuracy of the model.
Estimation data: test data:predicted: predicted:
observed: Viable Bankruptcy Correct, % Viable Bankruptcy Correct, %
Viable firms 39144 5114 88.4 13211 1736 88.4
Bankruptcy firms 34 202 85.6 8 75 90.4
overall accuracy 88.4 88.4
31
E s T i m AT i n g L i K E L i h o o d f o r r E o r g A n i z AT i o n A n d b A n K r u p T c y
Table 2 reports the estimated LR model of probability of bankruptcy. The Nagelkerke R
Square is 0.399% indicating that the strength of dependence is stronger than for the reorganiza-
tion model (Panel 1). However, the p-value for the Hosmer & Lemeshow test statistic is 7.2%
showing that the linearity of the logit is not high. Panel 3 reports a classification accuracy that is
higher than for the reorganization model. The classification accuracy for the viable firms is over
88% and for the bankruptcy firms about 90% (in the test data). Thus, about 12% of viable firms
have common characteristics with bankruptcy firms while approximately 10% of the bankruptcy
firms in the test sample (14% in the estimation sample) share characteristics with viable firms.
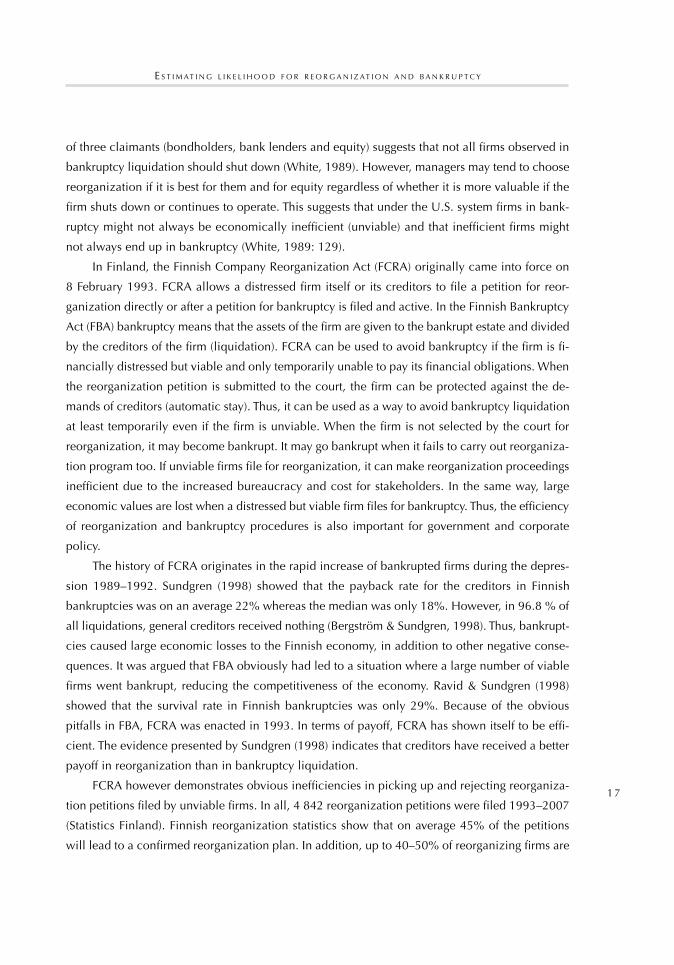
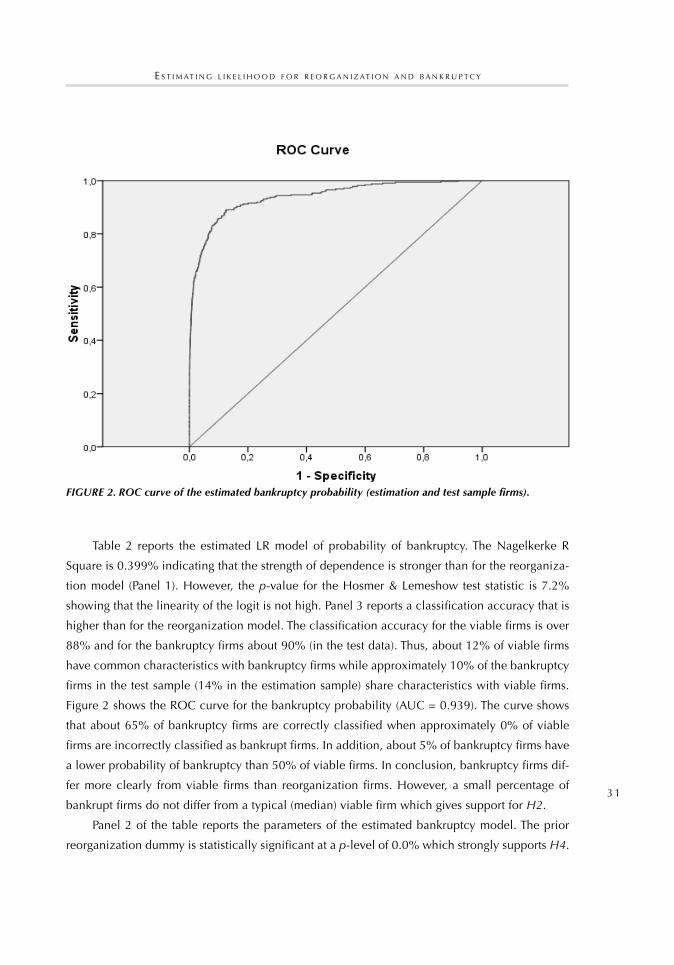
Figure 2 shows the ROC curve for the bankruptcy probability (AUC = 0.939). The curve shows
that about 65% of bankruptcy firms are correctly classified when approximately 0% of viable
firms are incorrectly classified as bankrupt firms. In addition, about 5% of bankruptcy firms have
a lower probability of bankruptcy than 50% of viable firms. In conclusion, bankruptcy firms dif-
fer more clearly from viable firms than reorganization firms. However, a small percentage of
bankrupt firms do not differ from a typical (median) viable firm which gives support for H2.
Panel 2 of the table reports the parameters of the estimated bankruptcy model. The prior
reorganization dummy is statistically significant at a p-level of 0.0% which strongly supports H4.
24
FIGURE 2. ROC curve of the estimated bankruptcy probability (estimation and test sample firms).
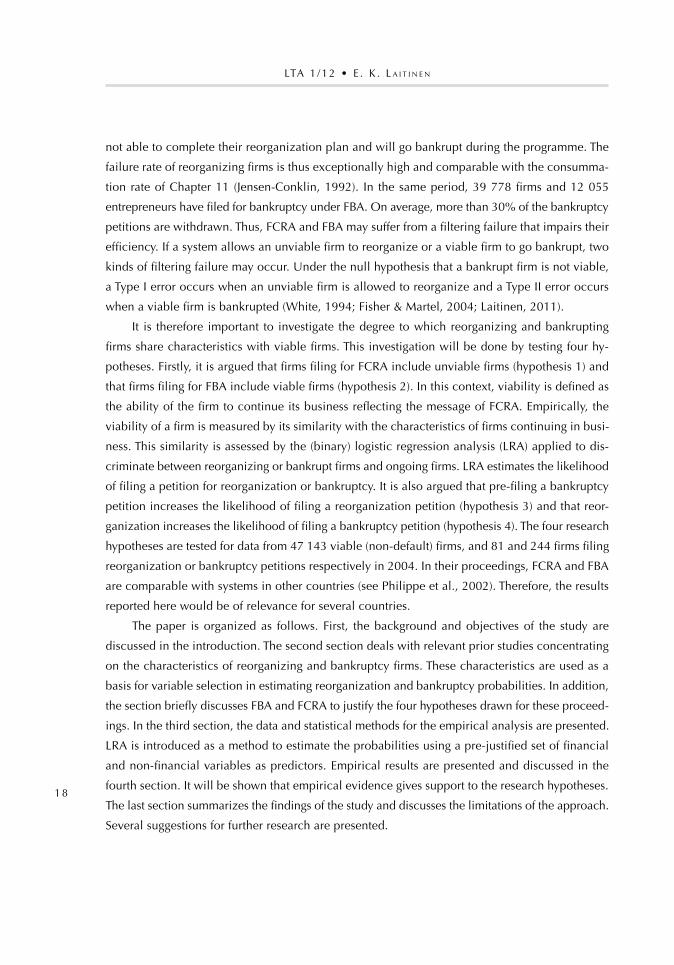
FIGURE 3. Classification of reorganizing and bankruptcy firms. Equity ratio: Return on investment: Low Not low Low Unviable firm (bankruptcy)
Viable firm if successful business restructuring (reorganization)
Not low Viable firm if successful debt restructuring (reorganization)
Viable firm
FIGURE 2. ROC curve of the estimated bankruptcy probability (estimation and test sample firms).
32
LTA 1 /12 • E . K . L A i T i n E n
The coefficient of the variable is not as high as that of the bankruptcy dummy variable in the
previous model. However, the last column of the panel (Exp(B)) shows that when a firm is reor-
ganizing, the probability of filing a bankruptcy petition for the firm is about six times higher than
for a firm not reorganizing. The most significant coefficients of the LR model are obtained for the
logarithmic number of delays in payment; the logarithmic number of payment defaults; the loga-
rithmic number of positive payment signals (prior payment behaviour); the logarithmic number
of members of the board (characteristics of managers); the logarithmic age in months (age); and
the equity ratio (leverage). There are twelve variables in all that are statistically significant in the
model at a p-level of 1%. However, the equity ratio is the only statistically significant financial
variable at this level. For the logarithmic net sales (size) p-value is 1.1%.
5. ConCLuSion
The Finnish Company Reorganization Act (FCRA) came into force in 1993. FCRA can be used as
a way to avoid bankruptcy liquidation at least temporarily even if the firm is unviable. When the
firm is not approved by the court for reorganization, it may go bankrupt, an eventuality that may
also result from a failure to carry out a reorganization programme. If unviable firms are filing for
reorganization, it can make reorganization proceedings inefficient due to increased bureaucracy
and costs for stakeholders. FCRA has shown obvious inefficiencies in picking up and rejecting
reorganization petitions filed by unviable firms. In addition, a large proportion of bankruptcy
petitions of firms bankrupting under the Finnish Bankruptcy Act (FBA) will be withdrawn. It is also
questionable whether the system forces viable firms to be liquidated. Thus, FCRA and FBA may
suffer from filtering failures that impair their efficiency. This study analyzed these inefficiencies
of FCRA and FBA testing four research hypotheses. The first and second hypotheses assumed that
firms filing for reorganization or bankruptcy include unviable or viable firms respectively. The
third and fourth hypotheses proposed that pre-filing a bankruptcy or reorganization petition in-
creases the likelihood of filing a bankruptcy or reorganization petition respectively.
The testing of the filtering hypotheses (hypotheses 1 and 2) requires that viability must be
measured. In this study, viability is assessed by an ex ante measure based on a prediction model.
This kind of econometric model does not measure viability directly but through the characteristics
(predictors) of viable firms. The econometric model can be constructed on the basis of a data base
including reorganizing, bankrupt, and viable firms. In this study, an event period of one year was
used for reorganization and bankruptcy petitions. However, a firm was considered viable if it
survived over a fourteen month period without any payment defaults. The characteristics of these
kinds of firms were used as a benchmark to assess the viability of firms filing a petition for reor-
ganization or bankruptcy during the event period. The larger the difference in the characteristics

33
E s T i m AT i n g L i K E L i h o o d f o r r E o r g A n i z AT i o n A n d b A n K r u p T c y
between a firm and viable firms, the higher is the likelihood that the firm is not viable. In the
study, the characteristics were summarized in a form of an LR model. Hypotheses 3 and 4 were
tested by dummy variables included in the models.
The empirical results obtained in this study largely supported the research hypotheses. The
estimated LR model for filing a reorganization petition showed a high degree of accuracy and
discriminated efficiently between viable and reorganizing firms. The ROC curve showed that ap-
proximately at least 50% of the firms filing a petition for reorganization do not share the charac-
teristics of viable firms at all and can therefore be considered unviable. Thus, the ex ante predic-
tion model shows that many unviable Finnish firms are filing for reorganization under FCRA to
avoid bankruptcy that supports the first hypothesis. The third hypothesis was tested in the LR
model by using the pre-filing bankruptcy dummy variable. It was statistically significant at a p-
level of 2.3% that (at least partly) supports the entry hypothesis. The probability of filing a reor-
ganization petition is more than 50 times higher for a firm that has pre-filed a bankruptcy petition
than for a similar firm without such a petition. However, it is not known how many firms filing
for reorganization have filed a bankruptcy petition during the event period. The data available for
prediction only include information about petitions prior to the event period.
The second research hypothesis was tested by the LRA discriminating between viable and
bankruptcy firms. This statistical model efficiently classified firms as viable and bankrupt firms.
However, at least 5% of bankrupt firms shared characteristics of typical (median) viable firms,
indicating an inefficiency in FBA. The fourth hypothesis was tested by the pre-filing reorganization
dummy variable in the LR model. It was statistically significant at a p-level of 0.0% which strongly
supports the hypothesis. The probability of filing a bankruptcy petition is about six times higher
for a reorganizing firm than for a similar firm not reorganizing. In summary, the study indicates
inefficiencies in FCRA and FBA which have led to a filtering failure. These kinds of inefficiencies
can be removed firstly by improving reorganization and bankruptcy legislation and secondly by
developing efficient statistical methods to discriminate between viable and unviable firms. These
statistical methods can help stakeholders (consultants, courts, lawyers, entrepreneurs, managers)
ex ante measure the viability of a firm considering filing a petition for either reorganization or
bankruptcy. This study shows that it is possible to develop such efficient methods.
There are a number of characteristics both financial and non-financial that, in a univariate
analysis, discriminate between viable and reorganizing firms. However, the multivariate results
showed that a reliable prediction model may include only a couple of statistically significant
predictors. This kind of model can be built on a combination of characteristics such as the number
of payment defaults and delays, size, age, equity ratio and return on investment ratio: the more
a firm has payment defaults and delays, the larger and younger it is, the lower its equity ratio and
return on investment ratio are; the higher is the likelihood that a reorganizing firm is unviable. If

34
LTA 1 /12 • E . K . L A i T i n E n
the firm has pre-filed for bankruptcy in addition, the likelihood will increase remarkably. When
modelling bankruptcy, the combination of significant characteristics in a multivariate model is
similar with a few exceptions. First, the equity ratio is the only statistically significant financial
ratio. Second, the characteristics of board members are important for viability. Third, industry
affects the likelihood of remaining viable. Fourth, a modified audit report is a significant signal
of risk. If the firm is reorganizing, the likelihood will significantly increase. The number of sig-
nificant non-financial predictors is thus larger in assessing bankruptcy firms while the number of
financial predictors is smaller.
Thus, the present study shows that it is possible to develop efficient econometric or statisti-
cal models to assess the viability of firms applying for reorganization or bankruptcy. These mod-
els can be based on publicly available information on pre-filing history, age, size, industry, and
payment history but also on financial characteristics. Financial characteristics can be extracted
from pre-filing financial statements submitted to the court. These characteristics can be used for
rough screening purposes when assessing viability. First, it is important to pay attention to the
equity ratio of the firm. The higher this ratio is prior to reorganization, the higher is the likelihood
of successful debt restructuring. Second, profitability, in terms of return on investment ratio, plays
an important role. The higher the pre-filing profitability, the higher is the likelihood of successful
business restructuring. This kind of financial analysis of viability is summarized in Figure 3. If both
equity ratio and return on investment ratios are low, there is a high likelihood that the firm is
unviable and the firm should go bankrupt. In these cases, non-financial information should be
used to support viability analysis.
24
FIGURE 2. ROC curve of the estimated bankruptcy probability (estimation and test sample firms).
FIGURE 3. Classification of reorganizing and bankruptcy firms. Equity ratio: Return on investment: Low Not low Low Unviable firm (bankruptcy)
Viable firm if successful business restructuring (reorganization)
Not low Viable firm if successful debt restructuring (reorganization)
Viable firm
FIGURE 3. Classification of reorganizing and bankruptcy firms.
The present study has many limitations, however, they can be taken into account in future
studies. First, the sample of the study on reorganization and bankruptcy firms is selective and
small. The sample included 34.6% of reorganizing firms and only 13.7% of bankruptcy petition
firms reorganizing under FCRA or going bankrupt under FBA in Finland during one year. Very

35
E s T i m AT i n g L i K E L i h o o d f o r r E o r g A n i z AT i o n A n d b A n K r u p T c y
small (micro) firms and most non-corporations are not represented by the data. Such kinds of firms
were not obliged to publish financial statements. Without financial statements, any measurement
of viability is inefficient. These kinds of out-of-sample firms may have special characteristics that
impair the generalization of the results for all Finnish reorganization and bankruptcy firms. In
further studies, these kinds of firms should be included in the data. It is now possible, since the
legislation has changed and even very small firms are obliged to publish financial statements.
Secondly, it is difficult to draw a cut-off point when classifying firms as viable and unviable. In
this study, a simple procedure based on the ROC curve was applied. However, in further studies
more accurate methods should be developed to assess the number of viable firms. Third, the ex
ante data do not make it possible to take account of potential pre-filing reorganization or bank-
ruptcy petitions which are filed during the event period. However, this is a situation faced by
decision makers planning reorganization or bankruptcy on a horizon of one year.
rEFErEnCESaLtman, E.i. (1968). Financial ratios, discriminant analysis, and the prediction of corporate bankruptcy, The
Journal of Finance. 23. 4. 589–609.
aLtman, E.i. (1993). Corporate financial distress and bankruptcy: a complete guide to predicting and avoiding distress and profiting from bankruptcy. 2nd ed. John Wiley. New York, NY. USA.
BaCk, p. (2005). Explaining financial difficulties based on previous payment behavior, management background variables and financial ratios. European Accounting Review. 14. 4. 839–868.
BaLCaEn, S. & h. ooghE (2006). 35 years of studies on business failure: an overview of the classic statistical methodologies and their related problems. The British Accounting Review. 38. 63–93.
BarniV, r., a. agarWaL and r. LEaCh (2002). Predicting bankruptcy resolution. Journal of Business Finance & Accounting. 29. 3&4. 497–520.
BEaVEr, W.h. (1966). Financial ratios as predictors of failure. Empirical Research in Accounting: Selected Studies. 4. 71–111.
BErgStröm, C. and S. SundgrEn (1998). Förmansrättens Teori och Empiri. Swedish School of Economics and Business Administration. Working Paper.
BLazy, r., B. Chopard & a. FimayEr (2008). Bankruptcy law: a mechanism of governance for financially distressed firms. European Journal of Law and Economics. 25. 253–267.
BuLoW, J. & J. ShoVEn (1978). The bankruptcy decision. Bell Journal of Economics. 9. 2. 437–456.
CampBELL, S.V. (1996). Predicting bankruptcy reorganization for closely held firms. Accounting Horizons. 10. 12–25.
CaSEy, C.J., V.E. mCgEE & C.p. StiCknEy (1986). Discriminanting between reorganized and liquidated firms in bankruptcy. The Accounting Review. 61. 249–262.
CaStErELLa, J.r., B.L. LEWiS & p.L. WaLkEr (2000). Modeling the Audit Opinions Issued to Bankrupt Companies: A Two-stage Empirical Analysis. Decision Sciences. 31. 2. 507–530.
ComErFord, r.a. (1976). Bankruptcy as a business strategy: a multivariate analysis of the financial characteristics of firms which have succeeded in Chapter XI compared to those which have failed. Unpublished Doctoral Dissertation. University of Massachusetts. USA.
CouWEnBErg, o. (2001). Survival rates in bankruptcy systems: overlooking the evidence. European Journal of Law and Economics. 12. 3. 253–273.
daVydEnko, S. & J.r. FrankS (2008). Do bankruptcy codes matter? A study of defaults in France, Germany, and the U.K. The Journal of Finance. 63. 2. 565–608.
36
LTA 1 /12 • E . K . L A i T i n E n
EgEr, t. (2001). Bankruptcy regulations and the new German insolvency law from an economic point of view. European Journal of Law and Economics. 2001. 11. 1. 29–46.
EL hEnnaWy, r.h.a. & r.C. morriS (1983). The Significance of base year in developing failure prediction models. Journal of Business Finance & Accounting. 10. 2. 209–223.
FiShEr, t.C. & J. martEL (1995). The creditors’ financial reorganization decision: new evidence from Canadian data. Journal of Law, Economics and Organization. 11. 112–126.
FiShEr, t.C. & J. martEL (2004). Empirical estimates of filtering failure in court-supervised reorganization. Journal of Empirical Legal Studies. 1. 1. 143–164.
FrankS, J.r. & W.n. torouS (1989). An empirical investigation of U.S. firms in reorganization. The Journal of Finance. 44. 747–769.
FrankS, J.r., k.g. nyBorg & W.n. torouS (1996). A comparison of U.S., UK and German insolvency codes. Financial Management. 25. 86–101.
FroSt-drury, a., a. grEinkE & g. ShaiLEr (1998). Distinguishing distressed companies Choosing voluntary administration. Paper presented at AAANZ Annual Conference, Adelaine.
gErtnEr, r. & d. SCharFStEin (1991). A theory of workouts and the effects of reorganization law. The Journal of Finance. 46. 1189–1222.
ginE, X. & i. LoVE (2006). Do reorganization costs matter for efficiency? Evidence from a bankruptcy reform in Colombia. World Bank Policy Research Working Paper 3970. July 2006.
hong, S.C. (1983). A bankruptcy outcome: model and empirical test. Working Paper. University of California at Berkeley. USA.
hoSmEr, d. & LEmEShoW, S. (1989). Applied logistic regression. John Wiley & Sons. New York. USA.
hotChkiSS, E.S. (1995). Postbankruptcy performance and management turnover. The Journal of Finance. 50. 3–21.
JEnSEn-ConkLin, S. (1992). Do confirmed Chapter 11 Plans consummate? The results of a study and analysis of the law. Commercial Law Journal. 97. 297–331.
JonES, F. (1987). Current techniques in bankruptcy predicting. Journal of Accounting Literature. 6. 131–164.
kaiSEr, k.m. (1996). European bankruptcy laws: implications for corporations facing financial distress. Financial Management. Autumn. 67–85.
karELS, g. & a.J. prakaSh (1987). Multivariate normality and forecasting of business bankruptcy. Journal of Business Finance & Accounting. 14. 4. 573–593.
kEaSEy, k. & r. WatSon (1987). Non-financial symptoms and the prediction of small company failure: a test of Argenti’s hypotheses. Journal of Business Finance & Accounting. 14. 3. 335–354.
kEnnEdy, d.B., & ShaW, W.h. (1991). Evaluating financial distress resolution using prior audit opinions. Contemporary Accounting Research. 8. l. 97–114.
koSkELo, p. (2003). Commercial enforcement and insolvency systems. Country: Finland. The World Bank Global Judges Forum. 12–23. May 2003. Pepperdine University School of Law. Malibu. California.
LaitinEn, E.k. (1991). Financial ratios and different failure processes. Journal of Business Finance and Accounting. September. 18. 3. 649–674.
LaitinEn, E.k. (1999). Predicting a corporate credit analyst’s risk estimate by logistic and linear models. International Review of Financial Analysis. 8. 2. 97–121.
LaitinEn, E.k. (2011). Assessing viability of Finnish reorganization and bankruptcy firms. European Journal of Law and Economics. 31. 2. 167–198.
LaitinEn, t. & m. kankaanpää (1999). Comparative analysis of failure prediction methods: the Finnish case. The European Accounting Review. 8. 1. 67–92.
LEnSBErg, t., EiLiFSEn, a. & mCkEE, t.E. (2006). Bankruptcy theory development and classification via genetic programming. European Journal of Operational Research. 169. 2. 677–697.
LopuCki. L.m. & J.W. dohErty (2002). Why are Delaware and New York bankruptcy reorganizations failing? Vanderbilt Law Review. 55. 6. 1933–1985.
LopuCki, L.m. (1983a). The debtor in full control – systems failure under Chapter 11 of the bankruptcy code I. American Bankruptcy Law Journal. 57. 99–126.
LopuCki, L.m. (1983b). The debtor in full control – systems failure under Chapter 11 of the bankruptcy code II. American Bankruptcy Law Journal. 57. 247–273.

37
E s T i m AT i n g L i K E L i h o o d f o r r E o r g A n i z AT i o n A n d b A n K r u p T c y
LopuCki, L.m. (2004). A team production theory of bankruptcy reorganization. Vanderbilt Law Review. 57. 3. 740–779.
mooradian, r.m. (1994). The effect of bankruptcy protection on investment: Chapter 11 as a screening device. The Journal of Finance. 49. 4. 1403–1430.
phiLippE & partnErS and dELoittE & touChE, CorporatE FinanCE (2002). Bankruptcy and a fresh start: stigma on failure and legal consequences of bankruptcy. International Insolvency Institute. Brussels. Belgium.
poSton, k.m., W.k. harmon & J.d. gramLiCh (1994). A test of financial ratios as predictors of turnaround versus failure among financially distressed firms. Journal of Applied Business Research. 10. Winter. 41–56.
raVid, S.a. & S. SundgrEn (1998). The comparative efficiency of small-firm bankruptcies: a study of the US and Finnish bankruptcy codes. Financial Management. 27. 4. 28–40.
routLEdgE, J. & d. gadEnnE (2000). Financial distress, reorganization and corporate performance. Accounting & Finance. 40. 233–260.
SantomEro, a. & J. VinSo (1977). Estimating the Probability of Failure for Firms in the Banking System. Journal of Banking and Finance. 1. September. 185–205.
SChWEhr, B. (2003). Corporate rehabilitation proceedings in the United States and Germany. International Insolvency Review. 12. 1. 11–35.
SCott, J. (1981). The probability of bankruptcy. Journal of Banking and Finance. 5. 317–344.
ShumWay, t. (2001). Forecasting bankruptcy more accurately: a simple hazard model. The Journal of Business. 74. 1. 101–124.
SpEar, d. (1989). The new French bankruptcy statute. Commercial Law Journal. 94. 1. 69–80.
SundgrEn, S. (1998). Does a reorganization law improve the efficiency of the insolvency law? The Finnish experience. European Journal of Law and Economics. 6. 177–198.
takagi, S. (2003). Restructuring in Japan. International Insolvency Review. 12. 1. 1–10.
thorBurn, k.S. (2000). Bankruptcy auctions: costs, debt recovery, and firm survival. Journal of Financial Economics. 58. 3. 337–368.
WhitE, m. (1980). Public policy toward bankruptcy: me-first and other priority rules. Bell Journal of Economics. 11. 550–564.
WhitE, m. (1984). Bankruptcy, liquidation and reorganization. In Logue, D. (Ed.). Handbook of modern finance. Warren, Gorham and Lamont. New York.
WhitE, m. (1989). The corporate bankruptcy decision. Journal of Economic Perspectives. 3. Spring. 129–152.
WiLCoX, J. (1971). A simple theory of financial ratios as predictors of failure. Journal of Accounting Research. 9. 2. 389–395.
WiLCoX, J. (1973). A prediction of business failure using accounting data. Empirical Research in Accounting: Selected Studies. 163–190.
WiLCoX, J. (1976). The gambler’s ruin approach to business risk. Sloan Management Review. Fall. 33–46.

38
LTA 1 /12 • E . K . L A i T i n E n
APPENDICES
APPENDIX 1. Descriptive statistics of the sample.
panEL 1. industrial classification of the firms.
percentage:
Viable firms reorganizing firms
Bankruptcy firms
agriculture, hunting and forestry 1.93 2.75 1.21
Fishing 0.16 0.00 0.00
mining and quarrying 0.38 0.00 0.00
manufacturing 14.80 32.11 16.36
Electricity, gas and water supply 0.98 0.00 0.00
Construction 11.84 10.09 23.94
Wholesale and retail trade 22.73 19.27 17.58
hotels and restaurants 3.54 3.67 7.58
transport, storage and communication 6.39 9.17 7.27
Financial intermediation 2.35 0.00 0.91
real estate, renting and business activities 27.99 22.02 20.91
Education 0.88 0.00 0.91
health and social work 2.84 0.00 0.61
total 100.00 100.00 100.00
number of firms 63177 109 330
panEL 2. descriptive variables.
Viable firms: reorganizing firms: Bankruptcy firms:
Variable: mean median mean median mean median
age in years 14.14 11.25 10.73 8.13 11.32 8.50
net sales in Euro 3800738.30 269419.00 996654.23 461257.00 1435342.22 464538.00
total assets in Euro 4712690.08 175418.50 749487.39 264282.50 849014.35 277460.00

39
E s T i m AT i n g L i K E L i h o o d f o r r E o r g A n i z AT i o n A n d b A n K r u p T c y
APPENDIX 2. Descriptive statistics of independent variables for the estimation sample (reorganization probability).
Viable firms (n = 47143): reorganizing firms (n = 81): Comparison:
Variable mean median Standard deviation
mean median Standard deviation
F-statistic p-value
prior bankruptcy dummy 0.0000 0.0000 0.0046 0.0488 0.0000 0.2167 0.0000
industry prospensity for bankruptcy (%) 0.5321 0.4000 0.4848 0.6890 0.5500 0.4957 8.5804 0.0034
Log. age in months 4.8830 4.9273 0.7397 4.6025 4.6199 0.7440 11.7694 0.0006
Log. number of members on board 1.3630 1.3863 0.3168 1.3183 1.3863 0.2671 1.6257 0.2023
number of resigned board members (%) 1.4158 0.0000 6.5559 3.1025 0.0000 11.0802 5.4011 0.0201
Log. number of board member personal defaults
0.0423 0.0000 0.1907 0.1394 0.0000 0.3715 21.1413 0.0000
Log. number of board member links to bankrupt firms
0.0279 0.0000 0.1524 0.1373 0.0000 0.3507 41.9402 0.0000
Corporation dummy 0.0083 0.0000 0.0909 0.0244 0.0000 0.1552 2.5436 0.1107
modified audit report dummy 0.1431 0.0000 0.3502 0.3415 0.0000 0.4771 26.2383 0.0000
Length of last accounting period (months)
12.0127 12.0000 0.9580 12.0854 12.0000 1.2492 0.4706 0.4927
months to the date of last financial statements
13.7870 11.0000 4.7332 14.8415 12.0000 5.2387 4.0613 0.0439
Log. number of payment defaults 0.0058 0.0000 0.0768 0.3599 0.0000 0.6163 1568.6983 0.0000
Log. number of delays in payment 0.0300 0.0000 0.1641 0.8496 0.8959 0.7440 1975.8203 0.0000
Log. number of positive payment signals 1.1264 0.6931 1.2480 0.8930 0.6931 1.0698 2.8647 0.0905
Log. net sales 11.9391 12.4174 3.3256 13.2276 13.6236 2.6504 12.2952 0.0005
Equity ratio (%) 47.0035 49.3000 36.1924 3.6878 7.3500 35.4866 117.2580 0.0000
traditional cash flow to sales (%) 9.7417 8.1000 25.4754 –0.9099 1.8000 19.3397 14.1456 0.0002
Quick ratio 3.5802 1.3000 7.9789 0.8878 0.5000 1.5793 9.3358 0.0022
return on investment ratio (%) 19.3185 14.5000 37.5865 –1.4622 3.4500 38.0407 25.0206 0.0000

40
LTA 1 /12 • E . K . L A i T i n E n
APPENDIX 3. Descriptive statistics of independent variables for the estimation sample (bankruptcy probability).
Viable firms (n=47143): Bankruptcy firms (n=244):
Comparison:
Variable mean median Standard deviation
mean median Standard deviation
F-statistic p-value
prior reorganization dummy 0.0021 0.0000 0.0458 0.1025 0.0000 0.3039 955.6288 0.0000
industry prospensity for bankruptcy (%) 0.5321 0.4000 0.4848 0.7270 0.6000 0.4363 39.3066 0.0000
Log. age in months 4.8830 4.9273 0.7397 4.5061 4.5433 0.6570 63.1014 0.0000
Log. number of members on board 1.3630 1.3863 0.3168 1.1676 1.0986 0.2232 92.5125 0.0000
number of resigned board members (%) 1.4158 0.0000 6.5559 5.3483 0.0000 15.3738 85.3726 0.0000
Log. number of board member personal defaults
0.0423 0.0000 0.1907 0.2248 0.0000 0.4591 217.0877 0.0000
Log. number of board member links to bankrupt firms
0.0279 0.0000 0.1524 0.1393 0.0000 0.3565 126.8089 0.0000
Corporation dummy 0.0083 0.0000 0.0909 0.0123 0.0000 0.1104 0.4590 0.4981
modified audit report dummy 0.1431 0.0000 0.3502 0.4262 0.0000 0.4955 157.9245 0.0000
Length of last accounting period (months) 12.0127 12.0000 0.9580 12.1148 12.0000 1.3128 2.7434 0.0977
months to the date of last financial statements
13.7870 11.0000 4.7332 15.2336 13.0000 5.2859 22.6464 0.0000
Log. number of payment defaults 0.0058 0.0000 0.0768 0.5318 0.0000 0.7535 7646.2567 0.0000
Log. number of delays in payment 0.0300 0.0000 0.1641 0.6863 0.6931 0.6238 3632.3756 0.0000
Log. number of positive payment signals 1.1264 0.6931 1.2480 0.5284 0.0000 0.8568 55.8822 0.0000
Log. net sales 11.9391 12.4174 3.3256 12.2573 12.5258 2.3236 2.2281 0.1355
Equity ratio (%) 47.0035 49.3000 36.1924 7.4590 10.1000 39.8680 289.4732 0.0000
traditional cash flow to sales (%) 9.7417 8.1000 25.4754 2.5220 3.4000 18.1738 18.9039 0.0000
Quick ratio 3.5802 1.3000 7.9789 1.1160 0.6000 3.4668 23.2490 0.0000
return on investment ratio (%) 19.3185 14.5000 37.5865 6.9561 7.2000 43.5787 26.2133 0.0000