estimating global inventory-based net carbon exchange from agricultural lands for use in the nasa...
TRANSCRIPT

Estimating Global Inventory-Based Net Carbon Exchange from Agricultural Lands for Use in the NASA Flux Pilot Study
Julie Wolf, Yannick Le Page and Tris WestJoint Global Change Research Institute
CMS 2014 Science Team Meeting
Objectives:
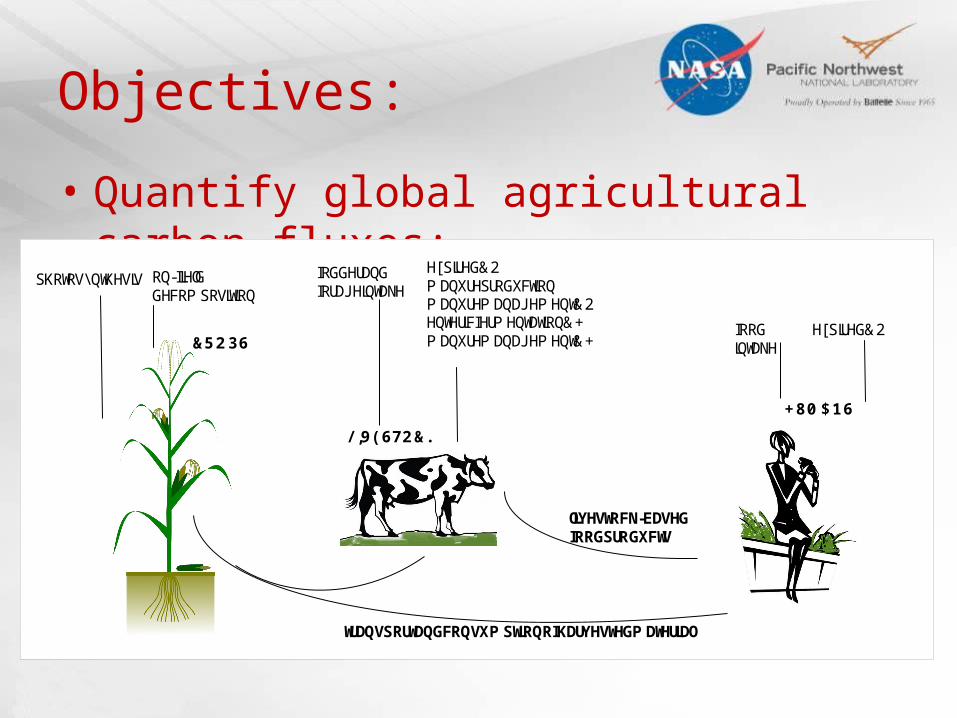
• Quantify global agricultural carbon fluxes:
H[ SLUHG&2
&5 2 36
/ ,9( 672 &.
+ 80 $ 16
IRGGHUDQG IRUDJHLQWDNH
H[ SLUHG&2 P DQXUHSURGXFWLRQ P DQXUHP DQDJHP HQW&2
HQWHULFIHUP HQWDWLRQ&+ P DQXUHP DQDJHP HQW&+
IRRG LQWDNH
SKRWRV\ QWKHVLV
RQ-ILHOG GHFRP SRVLWLRQ
WUDQVSRUWDQGFRQVXP SWLRQRIKDUYHVWHGP DWHULDO
OLYHVWRFN-EDVHG IRRGSURGXFWV

Objectives:
• Quantify global agricultural carbon fluxes:
Above- and belowground crop biomass Harvested and removed crop biomass Crop residues left on field Crop net primary productivity (NPP) Livestock intake of crop harvests and crop
residues Livestock forage/grazing of non-crop carbon Human intake of crop- and livestock-based
food

Objectives:
• Quantify global agricultural carbon fluxes
• Quantify agricultural net carbon exchange (NCE) and construct carbon budget
• Distribute carbon fluxes at 0.05 degree scale for 2005 - 2011
• Estimate uncertainty for all carbon fluxes

Methods:
Combine Inventory data for crops, livestock,
and human populations (1961 – 2011)
Carbon coefficients Satellite-based land cover (2005
base year)to create spatially resolved estimates of NCE

Methods:
NCE = -NPP + belowground biomass + residue + food intake + fodder intake(ignoring changes in soil carbon, eq. simplifies to)
NCE = -harvest + food intake + fodder
intake

Methods: Spatial distribution:
• Crops – MODIS 500m landcover product (2005), cropland area reconciled to match reported harvested areas.
• Livestock – estimated area requirements for housed and free-ranging populations placed on grassland and shrubland; also on croplands in dense areas
• Humans – SEDAC 2005 Gridded Human Population of the World.

Methods: Uncertainty:
• Develop probability density functions for all coefficients, based on range in published values.
• Monte Carlo Analysis of complete mathematical model for each flux quantity.

Results: Crop harvest, NPP, and area

Results: Crop NPP spatial distribution

Results: Regional NCE and spatial distribution
(NCE = -harvest + food intake + fodder intake)

Results: Global agricultural budget

Results: Global agricultural budget• agricultural losses• post-harvest losses• food supply chain losses/waste

Results: Global agricultural budget
Detailed livestock intake:• crop residues• primary harvest• hay and fodder crops• forage/grazing

Conclusions:
• Objectives completed
• Manuscript completed: “Biogenic carbon fluxes from global agricultural production and consumption”
• Data available include spatial distributions, coefficients developed, crop residue, livestock feed sources, and livestock manure production.

Thank you.